enabling digital payments in the u.s. healthcare market · changing enrollment trends ......
TRANSCRIPT

© 2017 Aite Group. All rights reserved. Reproduction of this white paper by any means is strictly prohibited.
Enabling Digital Payments in the U.S. Healthcare Market: Your Transformational Opportunity
MAY 2017
Prepared for:
This white paper was commissioned by ACI Worldwide and written by Aite Group. All views and
opinions expressed and all information presented are that of Aite Group. ACI Worldwide
provides this white paper for informational purposes only.
Enabling Digital Payments in the U.S. Healthcare Market: Your Transformational Opportunity MAY 2017
© 2017 Aite Group. All rights reserved. Reproduction of this report by any means is strictly prohibited. 2
TABLE OF CONTENTS EXECUTIVE SUMMARY .................................................................................................................................... 3
INTRODUCTION .............................................................................................................................................. 4
METHODOLOGY ........................................................................................................................................ 4
CHANGING ENROLLMENT TRENDS ................................................................................................................. 5
MEDICAL BILLING AND PAYMENT TRENDS ..................................................................................................... 9
REVENUE CYCLE WORKFLOWS – THE NEW NORMAL ............................................................................. 12
PREMIUM BILLING AND PAYMENT TRENDS ................................................................................................. 14
CENTRALIZING PREMIUM AND MEDICAL BILL PRESENTMENT AND PAYMENTS .................................... 16
CONCLUSION ................................................................................................................................................ 21
ABOUT AITE GROUP...................................................................................................................................... 22
ABOUT ACI WORLDWIDE ........................................................................................................................ 22
AUTHOR INFORMATION ......................................................................................................................... 22
CONTACT ................................................................................................................................................. 22
LIST OF FIGURES FIGURE 1: HEALTH PLAN ENROLLMENT FOR COVERED WORKERS BY PLAN TYPE ......................................... 6
FIGURE 2: U.S. HEALTH INSURANCE CONSUMER OUT-OF-POCKET PAYMENTS ............................................. 7
FIGURE 3: AVERAGE DEDUCTIBLE FOR FAMILY COVERAGE IN THE GROUP MARKET BY PLAN TYPE ............. 7
FIGURE 4: AVERAGE DEDUCTIBLE FOR SINGLE COVERAGE IN THE GROUP MARKET BY PLAN TYPE .............. 8
FIGURE 5: PERCENTAGE OF MEDICAL BILL PAYMENTS VOLUME BY CHANNEL .............................................. 9
FIGURE 6: PERCENTAGE OF MEDICAL BILLS BY DELIVERY MEDIUM ............................................................. 10
FIGURE 7: PERCENTAGE OF ELECTRONIC MEDICAL BILL LOOK-UPS BY CHANNEL ....................................... 11
FIGURE 8: PERCENTAGE OF MEDICAL BILL PAYMENTS BY CHANNEL BY TYPE OF BILL DELIVERY MEDIUM . 12
FIGURE 9: FUTURE REVENUE CYCLE PATIENT INTERACTIONS ...................................................................... 13
FIGURE 10: PERCENTAGE OF PREMIUM PAYMENTS BY CHANNEL ............................................................... 14
FIGURE 11: PERCENTAGE OF HEALTH INSURANCE PREMIUM BILLS BY DELIVERY MEDIUM ....................... 15
FIGURE 12: PERCENTAGE OF ELECTRONIC PREMIUM BILL LOOK-UPS BY CHANNEL .................................... 15
FIGURE 13: PERCENTAGE OF PREMIUM PAYMENTS BY CHANNEL BY TYPE OF BILL DELIVERY MEDIUM .... 16
FIGURE 14: CENTRALIZED BILL PRESENTMENT AND PAYMENT PLATFORM ................................................. 17
FIGURE 15: PERCENTAGE OF RECURRING PAYMENTS BY BILL TYPE ............................................................ 18
FIGURE 16: PERCENTAGE OF HEALTH INSURANCE AND MEDICAL BILL PAYMENTS BY CHANNEL ............... 19
FIGURE 17: PERCENTAGE OF HEALTH INSURANCE AND MEDICAL BILL PAYMENTS BY METHOD ................ 19
Enabling Digital Payments in the U.S. Healthcare Market: Your Transformational Opportunity MAY 2017
© 2017 Aite Group. All rights reserved. Reproduction of this report by any means is strictly prohibited. 3
EXECUTIVE SUMMARY
Enabling Digital Payments in the U.S. Healthcare Market: Your Transformational Opportunity,
commissioned by ACI Worldwide and produced by Aite Group, examines the cases for healthcare
providers (“providers”) and health payers (“payers”) to create a “retail-like” billing and payment
experience prior to rendering services, at the point of service, post-service, and, when
applicable, for monthly insurance premiums.
Key takeaways from the study include the following:
High-deductible health plans (HDHPs) are the strongest insurance growth product.
Providers will increasingly treat more patients with post-service payment
responsibilities than those with point-of-service ones, requiring a change to current
revenue-cycle strategies that seek to increase collection rates and accelerate patient
cash flows.
HDHPs are changing consumer engagement dynamics. These plans are creating
new point-of-payment interactions and redefining the experience at existing ones.
Payers can now allow members to pay their providers from their website.
Analytics underpin an end-to-end approach. Providers must adopt a holistic
approach guided by analytics. Financial engagement begins when a patient makes
an appointment and continues to the point of care and after the patient has left the
office.
Electronic bills decrease confusion and shrink costs. Providers and payers need to
consider the impact electronic bills make on their operations, including sending all
electronic bills and receiving all electronic payments via a single platform. Providers
and payers can decrease confusion about how much consumers owe to whom. Key
to this will be consolidating charges for an entire episode of care for providers across
all primary and secondary payers.
Providers stand amid a digital revolution in medical bill payments. Payments made
to providers’ websites are expected to increase at a compounded annual growth
rate (CAGR) of 27% through 2019 as mail payments are set to decline 6% over that
span, demonstrating that digital enablement and not paper enablement is the
foundation for any billing and payments strategy.
Bills and payments are central to provider and payer business strategies. Online bill
delivery, bill look-ups, and payment transactions drive website traffic. This recurring
online interaction highlights the importance bills and payments can play in building a
direct relationship with the patient or member for engagement, retention, or
marketing initiatives.
Enabling Digital Payments in the U.S. Healthcare Market: Your Transformational Opportunity MAY 2017
© 2017 Aite Group. All rights reserved. Reproduction of this report by any means is strictly prohibited. 4
INTRODUCTION
The role of the U.S. consumer in the healthcare system is quickly evolving, as consumers no
longer take a passive role in healthcare and need self-directed options. This evolution is spurred
by legislation driving more consumers to purchase HDHPs and by employers shifting toward
these designs as a cost-containment strategy. As the high deductibles become higher, providers
and payers are challenged to respond to the changes in consumer billing and payment
expectations that are driven through these plan designs. This response is complex, as it requires
more than developing “the mobile channel” and enabling Apple Pay. Rather, it necessitates a
comprehensive approach, meeting consumers at new points of payment and redefining
experiences at existing ones. This approach to digital enablement increases the chances of
collecting; however, something more transformational is within reach. Digital enablement
provides a platform for consumers to more actively engage in their health and financial
management, which is exactly what healthcare consumerism demands.
METHODOLOGY
This paper is based primarily on the results of a Q3 2016 Aite Group survey of 2,429 U.S.
consumers. The survey was conducted online among U.S. consumers who participated in a
research panel. The sample is in proportion to the U.S. population for age, gender, income,
geographic region, and race. This paper focuses just on consumers who indicate that they are
involved in paying most or all the health insurance premium and medical bills in their
households.
This paper also leverages Aite Group research on changes to healthcare providers’ revenue
cycles and the analyst’s extensive knowledge of the provider and payer market.
Enabling Digital Payments in the U.S. Healthcare Market: Your Transformational Opportunity MAY 2017
© 2017 Aite Group. All rights reserved. Reproduction of this report by any means is strictly prohibited. 5
CHANGING ENROLLMENT TRENDS
The changing dynamics of consumer enrollments in health plan designs are the catalysts of
consumerism. The number of U.S. consumers enrolled in HDHPs is growing more strongly than is
that of consumers enrolled in other designs, and this is pressuring medical revenue cycles to
increase patient collections in a system designed to accelerate cash flow paid by payers to
providers.
Even as more consumers enroll in HDHPs, other major plan designs are requiring plan holders to
share in more of the expense. In the case of traditional copayment plans, such as a health
maintenance organization (HMO), this means deductibles and coinsurance are becoming more
prevalent as cost-sharing mechanisms. As a result, providers will treat more patients who have
post-service payment responsibilities than those with point-of-service ones. Providers must now
respond to changing consumer enrollment trends and focus on increasing collections and
accelerating cash flow from patient payments.
Employer or group-based insurance is the dominant health insurance distribution channel, and
changes in group enrollment trends inflict the greatest impact on the future of the revenue
cycle. Each plan type’s enrollment trends are summarized as follows:
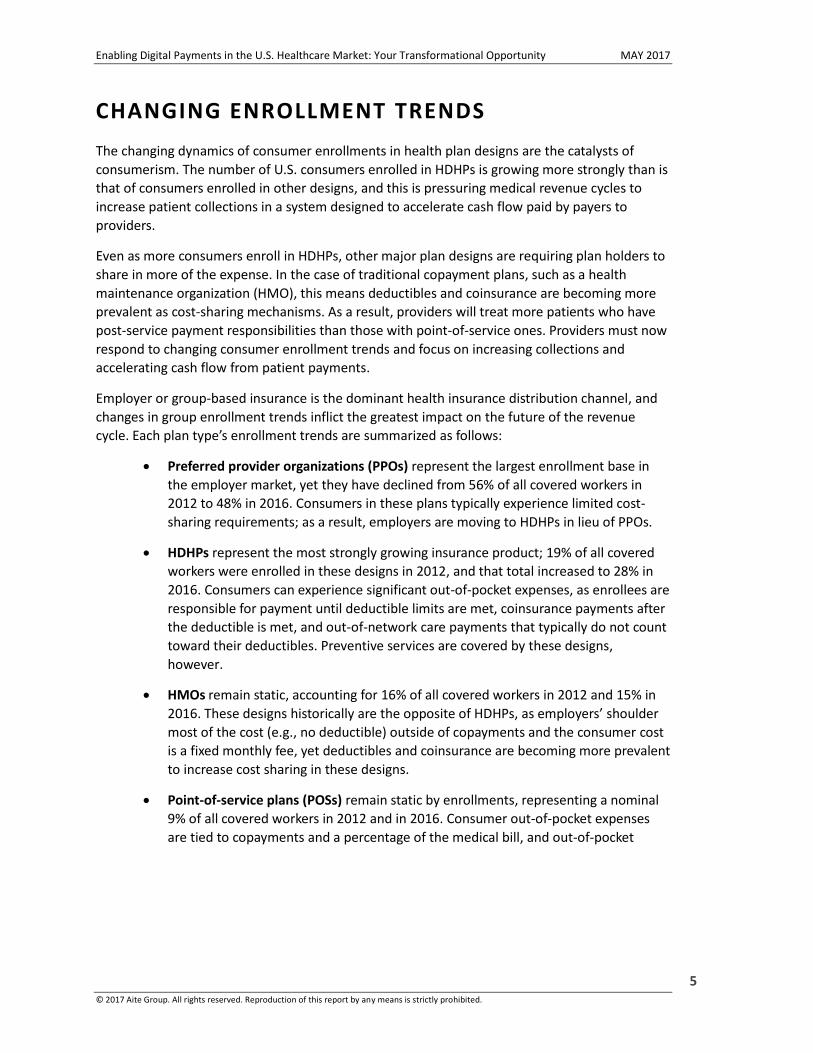
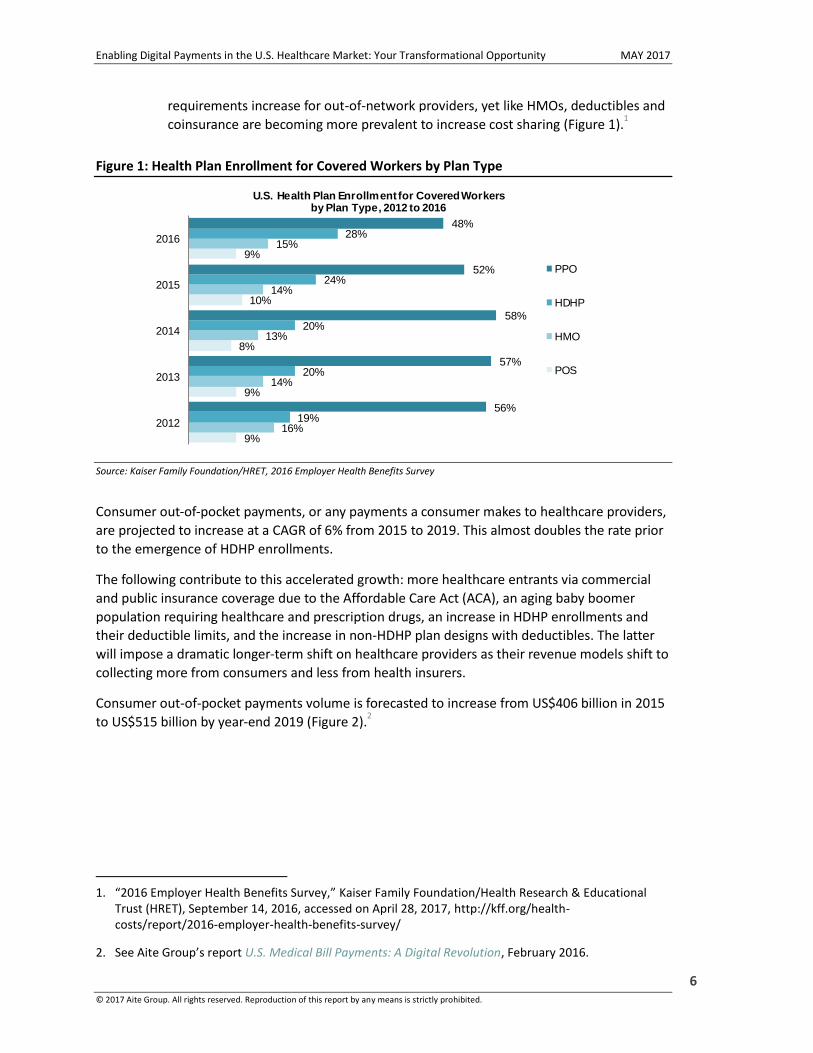
Preferred provider organizations (PPOs) represent the largest enrollment base in
the employer market, yet they have declined from 56% of all covered workers in
2012 to 48% in 2016. Consumers in these plans typically experience limited cost-
sharing requirements; as a result, employers are moving to HDHPs in lieu of PPOs.
HDHPs represent the most strongly growing insurance product; 19% of all covered
workers were enrolled in these designs in 2012, and that total increased to 28% in
2016. Consumers can experience significant out-of-pocket expenses, as enrollees are
responsible for payment until deductible limits are met, coinsurance payments after
the deductible is met, and out-of-network care payments that typically do not count
toward their deductibles. Preventive services are covered by these designs,
however.
HMOs remain static, accounting for 16% of all covered workers in 2012 and 15% in
2016. These designs historically are the opposite of HDHPs, as employers’ shoulder
most of the cost (e.g., no deductible) outside of copayments and the consumer cost
is a fixed monthly fee, yet deductibles and coinsurance are becoming more prevalent
to increase cost sharing in these designs.
Point-of-service plans (POSs) remain static by enrollments, representing a nominal
9% of all covered workers in 2012 and in 2016. Consumer out-of-pocket expenses
are tied to copayments and a percentage of the medical bill, and out-of-pocket
Enabling Digital Payments in the U.S. Healthcare Market: Your Transformational Opportunity MAY 2017
© 2017 Aite Group. All rights reserved. Reproduction of this report by any means is strictly prohibited. 6
requirements increase for out-of-network providers, yet like HMOs, deductibles and
coinsurance are becoming more prevalent to increase cost sharing (Figure 1).1
Figure 1: Health Plan Enrollment for Covered Workers by Plan Type
Source: Kaiser Family Foundation/HRET, 2016 Employer Health Benefits Survey
Consumer out-of-pocket payments, or any payments a consumer makes to healthcare providers,
are projected to increase at a CAGR of 6% from 2015 to 2019. This almost doubles the rate prior
to the emergence of HDHP enrollments.
The following contribute to this accelerated growth: more healthcare entrants via commercial
and public insurance coverage due to the Affordable Care Act (ACA), an aging baby boomer
population requiring healthcare and prescription drugs, an increase in HDHP enrollments and
their deductible limits, and the increase in non-HDHP plan designs with deductibles. The latter
will impose a dramatic longer-term shift on healthcare providers as their revenue models shift to
collecting more from consumers and less from health insurers.
Consumer out-of-pocket payments volume is forecasted to increase from US$406 billion in 2015
to US$515 billion by year-end 2019 (Figure 2).2
1. “2016 Employer Health Benefits Survey,” Kaiser Family Foundation/Health Research & Educational
Trust (HRET), September 14, 2016, accessed on April 28, 2017, http://kff.org/health-costs/report/2016-employer-health-benefits-survey/
2. See Aite Group’s report U.S. Medical Bill Payments: A Digital Revolution, February 2016.
9%
9%
8%
10%
9%
16%
14%
13%
14%
15%
19%
20%
20%
24%
28%
56%
57%
58%
52%
48%
2012
2013
2014
2015
2016
U.S. Health Plan Enrollment for Covered Workers by Plan Type, 2012 to 2016
PPO
HDHP
HMO
POS

Enabling Digital Payments in the U.S. Healthcare Market: Your Transformational Opportunity MAY 2017
© 2017 Aite Group. All rights reserved. Reproduction of this report by any means is strictly prohibited. 7
Figure 2: U.S. Health Insurance Consumer Out-of-Pocket Payments
Source: Aite Group
As increased cost sharing across the major plan designs becomes the new normal, the
deductibles, and therefore out-of-pocket requirements, are on the rise. The average deductible
for a PPO family plan increased at a CAGR of 5% from 2012 to 2016, an HDHP average family
deductible increased at a CAGR of 3%, HMOs increased at 14%, and the average deductible for a
POS family plan increased at a CAGR 15% (Figure 3).
Figure 3: Average Deductible for Family Coverage in the Group Market by Plan Type
Source: Kaiser Family Foundation/HRET, 2016 Employer Health Benefits Survey
$406 $424
$446 $477
$515
2015 2016 e2017 e2018 e2019
U.S. Health Insurance Consumer Out-of-Pocket Payments, 2015 to e2019 (In US$ billions)
$2,163
$2,821
$2,470
$2,467
$3,769
$1,329
$1,743
$2,328
$2,758
$2,245
$3,924
$4,079
$4,522
$4,332
$4,343
$1,770
$1,854
$1,947
$2,012
$2,147
2012
2013
2014
2015
2016
Average Deductible for Family Coverage in the Group Market by Plan Type, 2012 to 2016 (In US$)
PPO (CAGR=5%)
HDHP (CAGR=3%)
HMO (CAGR=14%)
POS (CAGR=15%)
Enabling Digital Payments in the U.S. Healthcare Market: Your Transformational Opportunity MAY 2017
© 2017 Aite Group. All rights reserved. Reproduction of this report by any means is strictly prohibited. 8
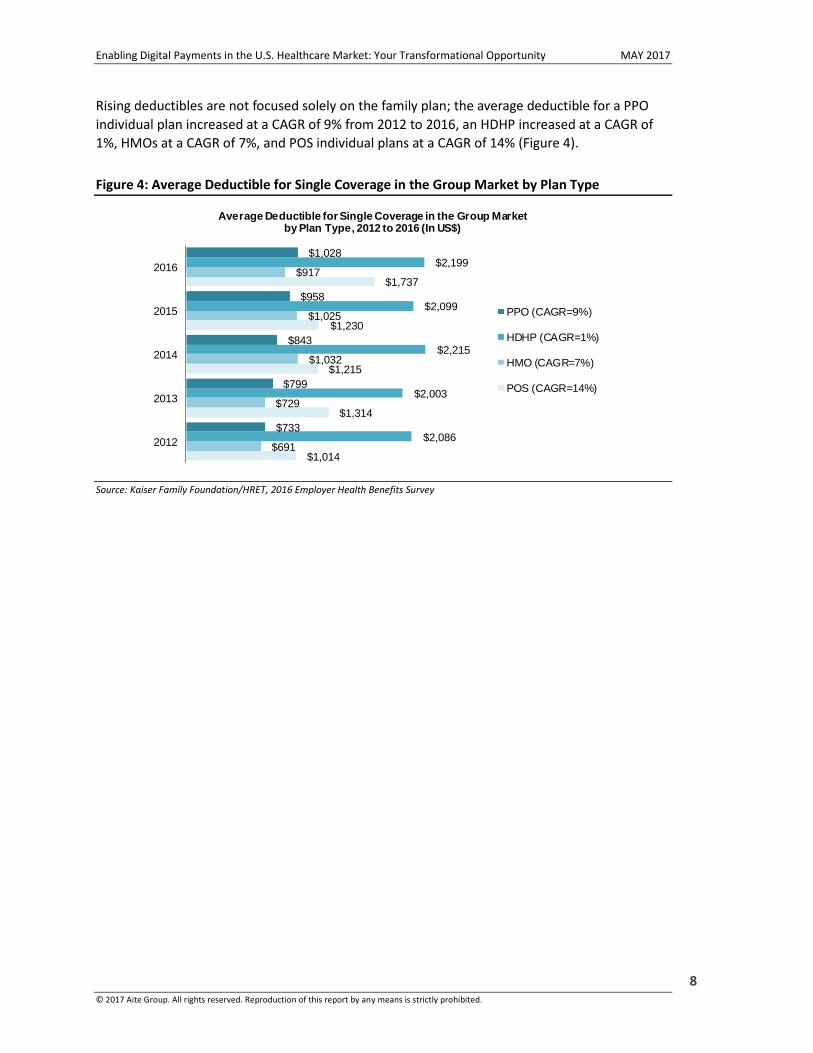
Rising deductibles are not focused solely on the family plan; the average deductible for a PPO
individual plan increased at a CAGR of 9% from 2012 to 2016, an HDHP increased at a CAGR of
1%, HMOs at a CAGR of 7%, and POS individual plans at a CAGR of 14% (Figure 4).
Figure 4: Average Deductible for Single Coverage in the Group Market by Plan Type
Source: Kaiser Family Foundation/HRET, 2016 Employer Health Benefits Survey
$1,014
$1,314
$1,215
$1,230
$1,737
$691
$729
$1,032
$1,025
$917
$2,086
$2,003
$2,215
$2,099
$2,199
$733
$799
$843
$958
$1,028
2012
2013
2014
2015
2016
Average Deductible for Single Coverage in the Group Market by Plan Type, 2012 to 2016 (In US$)
PPO (CAGR=9%)
HDHP (CAGR=1%)
HMO (CAGR=7%)
POS (CAGR=14%)

Enabling Digital Payments in the U.S. Healthcare Market: Your Transformational Opportunity MAY 2017
© 2017 Aite Group. All rights reserved. Reproduction of this report by any means is strictly prohibited. 9
MEDICAL BILLING AND PAYMENT TRENDS
U.S. consumers are busting the myth that they will not pay their medical bills using an online bill
payment channel. Healthcare providers should take note that this digital narrative is set to
explode against the backdrop of more consumers paying a portion of their medical bills and the
increasing amount of the medical bill. As these dynamics play out, providers will face similar
business challenges as payers go above and beyond collecting the payment. These challenges
include increasing meaningful use of electronic health records and impacts to patient
satisfaction tied to the Medicare/Medicaid reimbursement rate. Vendors across both these areas
can leverage billing and payments to improve those aims.
Patient portal vendors, such as electronic health record vendors, that integrate
payment application programming interfaces (APIs) make it easier for consumers to
view bills and pay from a variety of devices.
Medicare Access and CHIP Reauthorization Act (MACRA) vendors taking a holistic
view of the patient experience and incorporating digital billing and payments into
the patient engagement dimension of the quality component to boost the overall
composite score and improve bonus in the Merit-Based Incentive Payment System
(MIPS).
Aite Group projects 31% of the medical bills paid in 2016 occurred through the mail, a channel
that is expected to decline at a CAGR of 6% through 2019. Conversely, providers’ websites
processed 29% of the 2016 payment volume, a figure expected to increase at a CAGR of 27% as
consumers increasingly elect to pay online. Only 14% of payments were paid in person, a
channel that is expected to decrease at a CAGR of 10% (Figure 5).
Figure 5: Percentage of Medical Bill Payments Volume by Channel
Source: Aite Group survey of 2,429 U.S. consumers, Q3 2016
Mail31%
Provider's w ebsite29%
In person14%
Bank's w ebsite10%
Phone7%
Direct debit6%
Do not know2%
Percentage of U.S. Medical Bill 2016 Payments Volume by Channel (n=7,883 bills)

Enabling Digital Payments in the U.S. Healthcare Market: Your Transformational Opportunity MAY 2017
© 2017 Aite Group. All rights reserved. Reproduction of this report by any means is strictly prohibited. 10
Healthcare providers have not yet embraced electronic billing. While 41% of premiums are paid
at the payers’ websites (Figure 10), only 29% of medical bills are paid at a provider’s website. It
behooves providers to leverage payers’ best practices and increase adoption of electronic bills.
For example, paper bills could be suppressed through a campaign to enroll patients in electronic
billing. This effort can be accomplished at the checkout or via the provider’s website.
This survey shows that 64% of consumers who paid a medical bill in 2016 received a paper bill,
15% made the payment but do not receive a bill, only 11% received an electronic bill, and 10%
received both a paper and an electronic bill (Figure 6).
Figure 6: Percentage of Medical Bills by Delivery Medium
Source: Aite Group survey of 2,429 U.S. consumers, Q3 2016
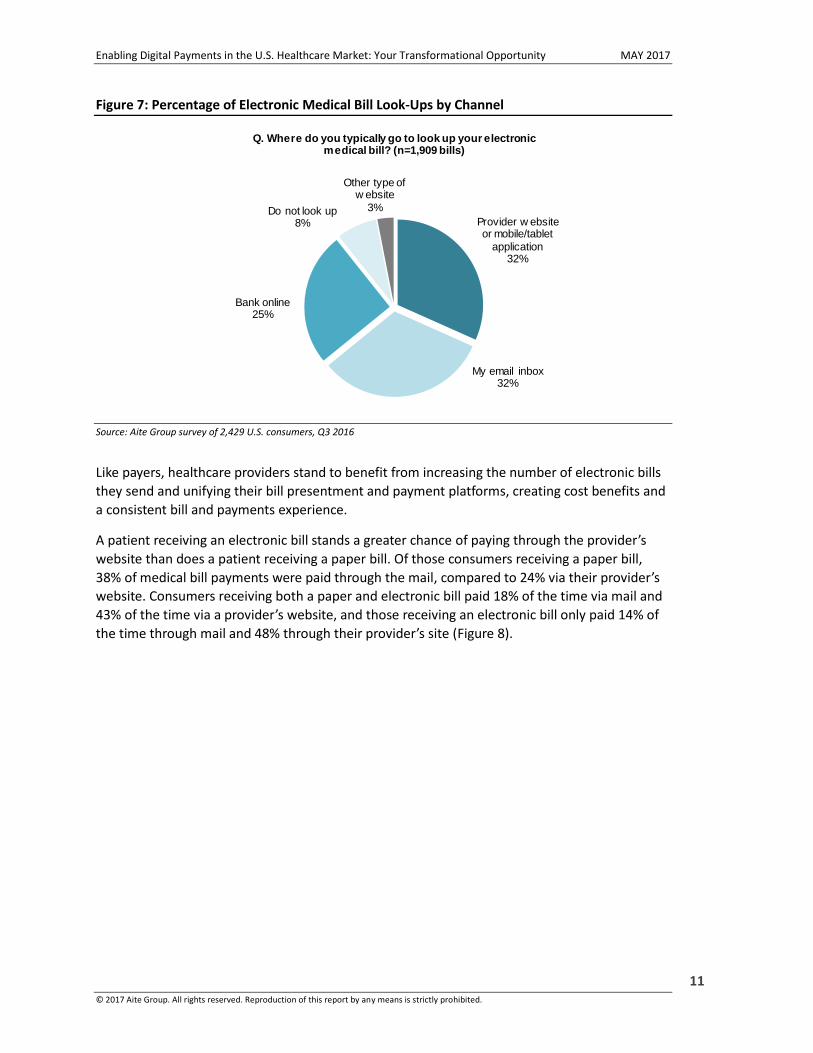
The low volume of electronic bills sent by providers to patients represents a missed opportunity
to draw patients to the website and work to keep them there. Of those patients who received an
electronic bill, 32% visited that provider’s website or mobile/tablet application to look up the bill
(Figure 7).
I get a paper bill in the mail
64%
I make this payment, but I
don't get a bill15%
I get an electronic bill
11%
I get both a paper and an electronic
bill10%
Q. How do you currently get your health insurance bill? (n=11,624 bills)
Enabling Digital Payments in the U.S. Healthcare Market: Your Transformational Opportunity MAY 2017
© 2017 Aite Group. All rights reserved. Reproduction of this report by any means is strictly prohibited. 11
Figure 7: Percentage of Electronic Medical Bill Look-Ups by Channel
Source: Aite Group survey of 2,429 U.S. consumers, Q3 2016
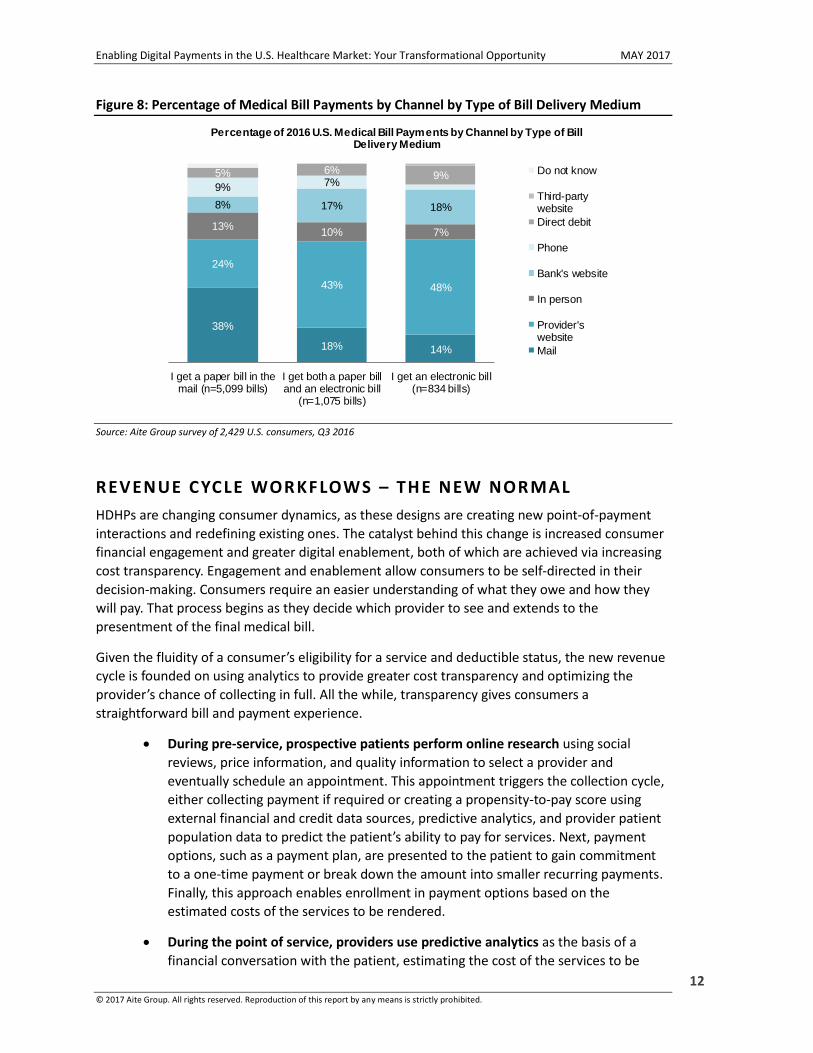
Like payers, healthcare providers stand to benefit from increasing the number of electronic bills
they send and unifying their bill presentment and payment platforms, creating cost benefits and
a consistent bill and payments experience.
A patient receiving an electronic bill stands a greater chance of paying through the provider’s
website than does a patient receiving a paper bill. Of those consumers receiving a paper bill,
38% of medical bill payments were paid through the mail, compared to 24% via their provider’s
website. Consumers receiving both a paper and electronic bill paid 18% of the time via mail and
43% of the time via a provider’s website, and those receiving an electronic bill only paid 14% of
the time through mail and 48% through their provider’s site (Figure 8).
Provider w ebsite or mobile/tablet
application32%
My email inbox32%
Bank online25%
Do not look up8%
Other type of w ebsite
3%
Q. Where do you typically go to look up your electronic medical bill? (n=1,909 bills)
Enabling Digital Payments in the U.S. Healthcare Market: Your Transformational Opportunity MAY 2017
© 2017 Aite Group. All rights reserved. Reproduction of this report by any means is strictly prohibited. 12
Figure 8: Percentage of Medical Bill Payments by Channel by Type of Bill Delivery Medium
Source: Aite Group survey of 2,429 U.S. consumers, Q3 2016
REVENUE CYCLE WORKFLOWS – THE NEW NORMAL
HDHPs are changing consumer dynamics, as these designs are creating new point-of-payment
interactions and redefining existing ones. The catalyst behind this change is increased consumer
financial engagement and greater digital enablement, both of which are achieved via increasing
cost transparency. Engagement and enablement allow consumers to be self-directed in their
decision-making. Consumers require an easier understanding of what they owe and how they
will pay. That process begins as they decide which provider to see and extends to the
presentment of the final medical bill.
Given the fluidity of a consumer’s eligibility for a service and deductible status, the new revenue
cycle is founded on using analytics to provide greater cost transparency and optimizing the
provider’s chance of collecting in full. All the while, transparency gives consumers a
straightforward bill and payment experience.
During pre-service, prospective patients perform online research using social
reviews, price information, and quality information to select a provider and
eventually schedule an appointment. This appointment triggers the collection cycle,
either collecting payment if required or creating a propensity-to-pay score using
external financial and credit data sources, predictive analytics, and provider patient
population data to predict the patient’s ability to pay for services. Next, payment
options, such as a payment plan, are presented to the patient to gain commitment
to a one-time payment or break down the amount into smaller recurring payments.
Finally, this approach enables enrollment in payment options based on the
estimated costs of the services to be rendered.
During the point of service, providers use predictive analytics as the basis of a
financial conversation with the patient, estimating the cost of the services to be
38%
18% 14%
24%
43% 48%
13%10% 7%
8% 17% 18%
9% 7%5% 6%
9%
I get a paper bill in themail (n=5,099 bills)
I get both a paper billand an electronic bill
(n=1,075 bills)
I get an electronic bill(n=834 bills)
Percentage of 2016 U.S. Medical Bill Payments by Channel by Type of Bill Delivery Medium
Do not know
Third-partywebsite
Direct debit
Phone
Bank's website
In person
Provider'swebsite
Enabling Digital Payments in the U.S. Healthcare Market: Your Transformational Opportunity MAY 2017
© 2017 Aite Group. All rights reserved. Reproduction of this report by any means is strictly prohibited. 13
billed and developing a propensity-to-pay score to optimize and present payment
options. The goal is to enroll the patient in a recurring or one-time payment that
offers the lowest risk to collect, while offering electronic bill enrollment and
initiating the patient-portal login to facilitate a digital experience.
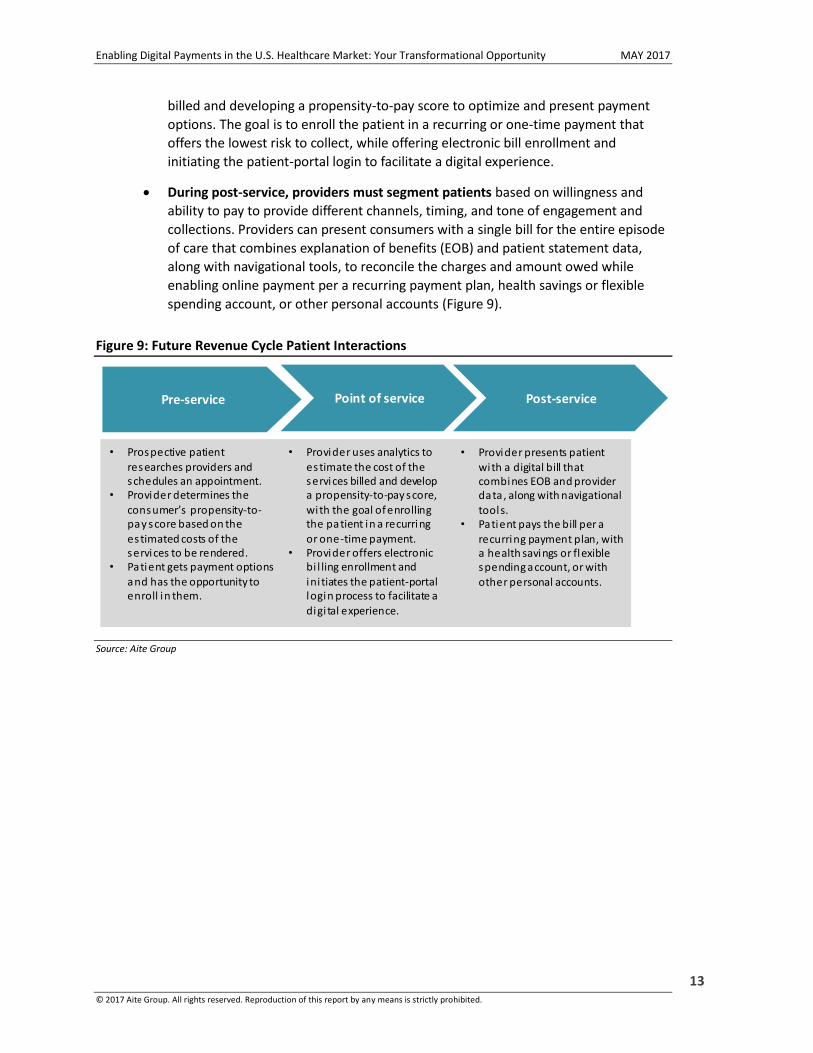
During post-service, providers must segment patients based on willingness and
ability to pay to provide different channels, timing, and tone of engagement and
collections. Providers can present consumers with a single bill for the entire episode
of care that combines explanation of benefits (EOB) and patient statement data,
along with navigational tools, to reconcile the charges and amount owed while
enabling online payment per a recurring payment plan, health savings or flexible
spending account, or other personal accounts (Figure 9).
Figure 9: Future Revenue Cycle Patient Interactions
Source: Aite Group
• Prospective patient researches providers and schedules an appointment.
• Provider determines the consumer’s propensity-to-pay score based on the estimated costs of the services to be rendered.
• Patient gets payment options and has the opportunity to enroll in them.
• Provider uses analytics to estimate the cost of the services billed and develop a propensity-to-pay score, with the goal of enrolling the patient in a recurring or one-time payment.
• Provider offers electronic bi l ling enrollment and ini tiates the patient-portal login process to facilitate a
digi tal experience.
• Provider presents patient with a digital bill that combines EOB and provider data, along with navigational tools.
• Patient pays the bill per a
recurring payment plan, with a health savings or flexible spending account, or with
other personal accounts.
Pre-service Point of service Post-service
Enabling Digital Payments in the U.S. Healthcare Market: Your Transformational Opportunity MAY 2017
© 2017 Aite Group. All rights reserved. Reproduction of this report by any means is strictly prohibited. 14
PREMIUM BILLING AND PAYMENT TRENDS
Payers cannot overlook the role bills and payments play in creating a stronger member
relationship, increasing member engagement, and retaining members. Digital enablement of
bills and payments drive members to payer websites, triggering opportunities to keep members
on the site to gain education, manage accounts, and even learn about new products and
services. These activities are key to retaining that member longer term. Payers lacking a
multichannel payments strategy founded on a digital experience miss an opportunity to
repeatedly engage with their members.
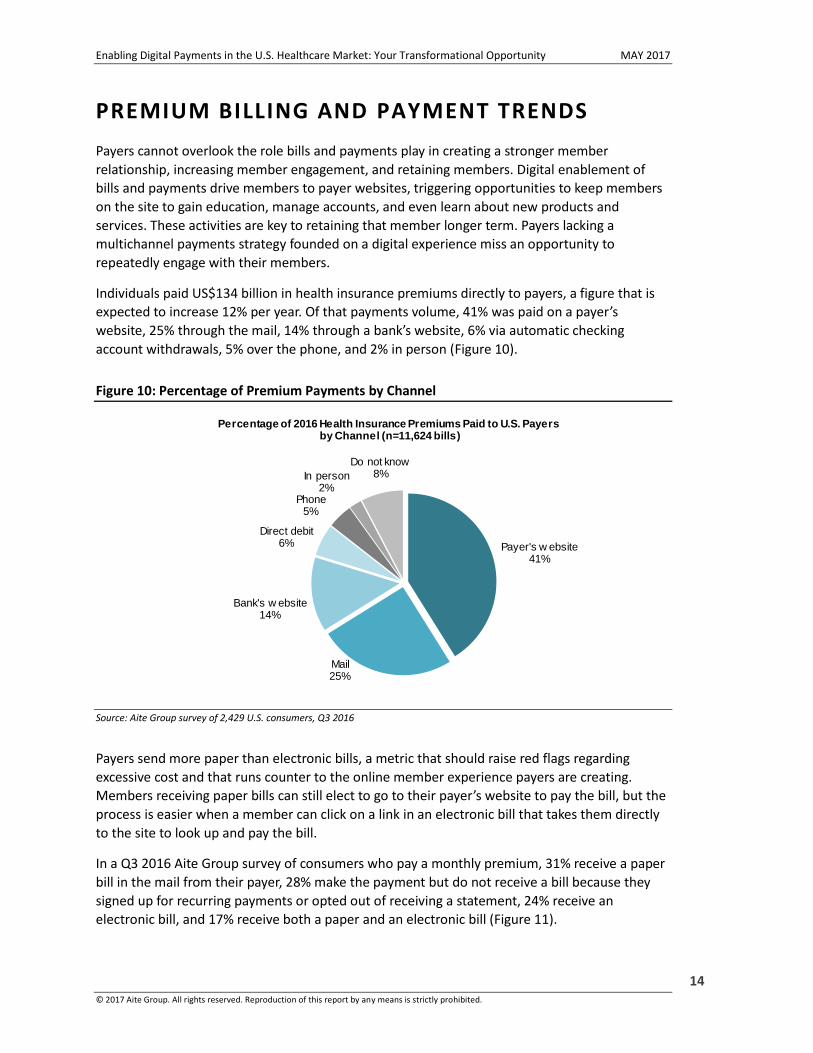
Individuals paid US$134 billion in health insurance premiums directly to payers, a figure that is
expected to increase 12% per year. Of that payments volume, 41% was paid on a payer’s
website, 25% through the mail, 14% through a bank’s website, 6% via automatic checking
account withdrawals, 5% over the phone, and 2% in person (Figure 10).
Figure 10: Percentage of Premium Payments by Channel
Source: Aite Group survey of 2,429 U.S. consumers, Q3 2016
Payers send more paper than electronic bills, a metric that should raise red flags regarding
excessive cost and that runs counter to the online member experience payers are creating.
Members receiving paper bills can still elect to go to their payer’s website to pay the bill, but the
process is easier when a member can click on a link in an electronic bill that takes them directly
to the site to look up and pay the bill.
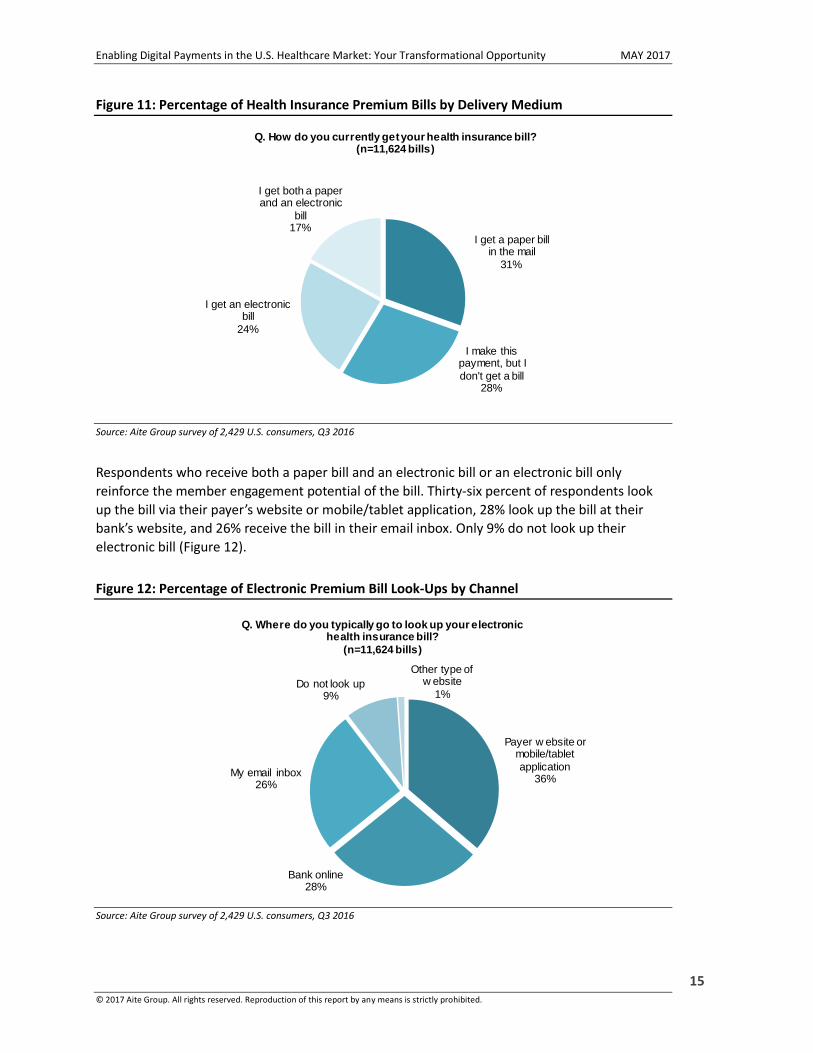
In a Q3 2016 Aite Group survey of consumers who pay a monthly premium, 31% receive a paper
bill in the mail from their payer, 28% make the payment but do not receive a bill because they
signed up for recurring payments or opted out of receiving a statement, 24% receive an
electronic bill, and 17% receive both a paper and an electronic bill (Figure 11).
Payer's w ebsite41%
Mail25%
Bank's w ebsite14%
Direct debit6%
Phone5%
In person2%
Do not know8%
Percentage of 2016 Health Insurance Premiums Paid to U.S. Payers by Channel (n=11,624 bills)
Enabling Digital Payments in the U.S. Healthcare Market: Your Transformational Opportunity MAY 2017
© 2017 Aite Group. All rights reserved. Reproduction of this report by any means is strictly prohibited. 15
Figure 11: Percentage of Health Insurance Premium Bills by Delivery Medium
Source: Aite Group survey of 2,429 U.S. consumers, Q3 2016
Respondents who receive both a paper bill and an electronic bill or an electronic bill only
reinforce the member engagement potential of the bill. Thirty-six percent of respondents look
up the bill via their payer’s website or mobile/tablet application, 28% look up the bill at their
bank’s website, and 26% receive the bill in their email inbox. Only 9% do not look up their
electronic bill (Figure 12).
Figure 12: Percentage of Electronic Premium Bill Look-Ups by Channel
Source: Aite Group survey of 2,429 U.S. consumers, Q3 2016
I get a paper bill in the mail
31%
I make this payment, but I
don't get a bill28%
I get an electronic bill
24%
I get both a paper and an electronic
bill17%
Q. How do you currently get your health insurance bill? (n=11,624 bills)
Payer w ebsite or mobile/tablet
application36%
Bank online28%
My email inbox26%
Do not look up9%
Other type of w ebsite
1%
Q. Where do you typically go to look up your electronic health insurance bill?
(n=11,624 bills)

Enabling Digital Payments in the U.S. Healthcare Market: Your Transformational Opportunity MAY 2017
© 2017 Aite Group. All rights reserved. Reproduction of this report by any means is strictly prohibited. 16
Electronic bills influence payment behaviors and accelerate more online payments, whereas
paper bills lead to more mail payments. Payers have compelling reasons to unify their premium
bill presentment and payment platforms to deliver member bills, remittance advices, or EOB,
and to collect payments. The first reason is to gain efficiency tied to increasing electronic
transactions and reducing paper-based transactions in response to member preferences. The
second reason is to leverage the bill as a tool to drive product sales, enrollment, and
engagement.
These reasons are highlighted when analyzing the payment channels that members use based
on the type of bill each receives. Members receiving a paper bill chose to pay through the mail
channel 41% of the time and chose to pay via their payer’s website 28% of the time. This
behavior changes dramatically when payers deliver an electronic bill; members receiving both a
paper and electronic bill paid via mail 13% of the time and via the payer’s website 52% of the
time, and members receiving an electronic bill paid 9% via mail and 60% via the payer’s site
(Figure 13).
Figure 13: Percentage of Premium Payments by Channel by Type of Bill Delivery Medium
Source: Aite Group survey of 2,429 U.S. consumers, Q3 2016
CENTRALIZ ING PREMIUM AND MEDICAL B ILL PRESENTMENT AND PAYMEN TS
Payers can expand their capabilities from collecting premium payments to collecting post-service
bill payments. Payers are well-positioned to inform and enable their members both pre-service
and post-service. Payers have claims data, predictive analytics, and member portal capabilities,
such as estimation of the prospective cost for the visit and provider look-up, to act as a single
platform for sending bills and receiving payments to and from their members.
41%
13% 9%
28%
52% 60%
14% 18%15%
7% 9%
5% 6%
I get a paper bill in themail (n=3,467 bills)
I get both a paper billand electronic bill
(n=1,510 bills)
I get an electronic billonly (n=2,690 bills)
Percentage of 2016 U.S. Health Insurance Premium Payments by Channel By Type of Bill Delivery Medium
I don't know
Direct debit
In person
Called payer onphone
Bank's website
Payer's website
Enabling Digital Payments in the U.S. Healthcare Market: Your Transformational Opportunity MAY 2017
© 2017 Aite Group. All rights reserved. Reproduction of this report by any means is strictly prohibited. 17
Payers working toward a single centralized platform create an additional pathway to leverage
analytics: cross-selling members on new products. Payers can make use of evident trends in
member premium payment behaviors as fuel for taking on this expanded role.
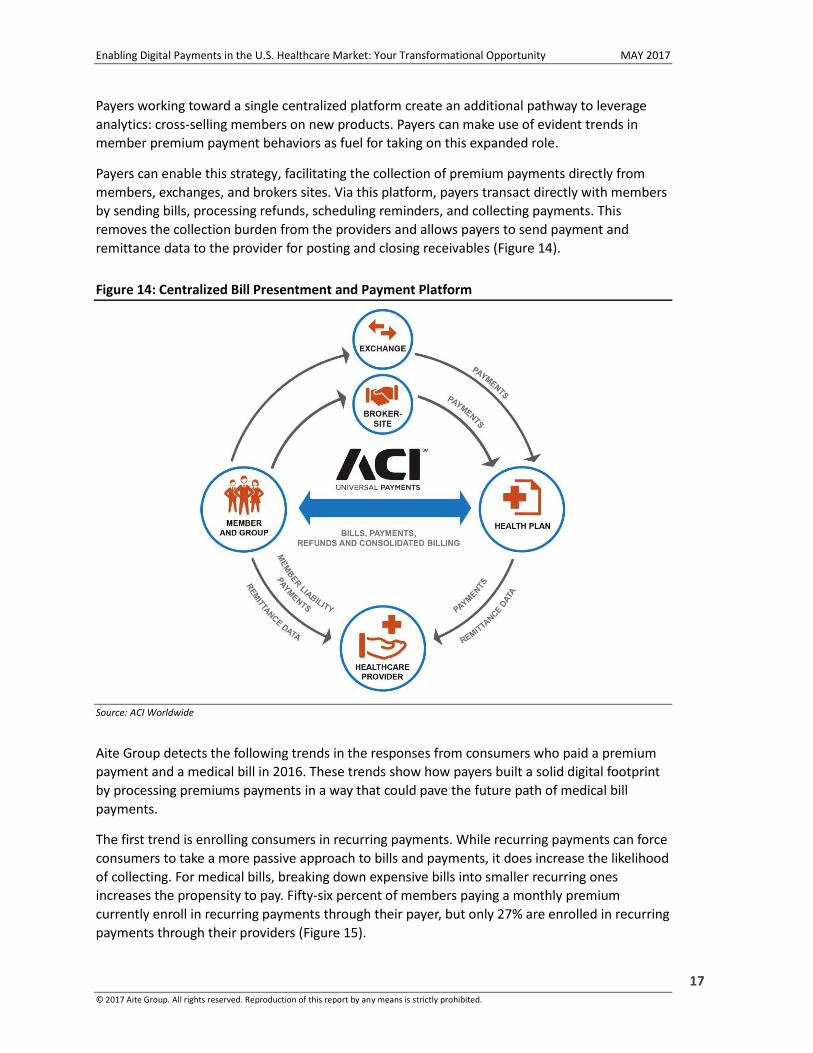
Payers can enable this strategy, facilitating the collection of premium payments directly from
members, exchanges, and brokers sites. Via this platform, payers transact directly with members
by sending bills, processing refunds, scheduling reminders, and collecting payments. This
removes the collection burden from the providers and allows payers to send payment and
remittance data to the provider for posting and closing receivables (Figure 14).
Figure 14: Centralized Bill Presentment and Payment Platform
Source: ACI Worldwide
Aite Group detects the following trends in the responses from consumers who paid a premium
payment and a medical bill in 2016. These trends show how payers built a solid digital footprint
by processing premiums payments in a way that could pave the future path of medical bill
payments.
The first trend is enrolling consumers in recurring payments. While recurring payments can force
consumers to take a more passive approach to bills and payments, it does increase the likelihood
of collecting. For medical bills, breaking down expensive bills into smaller recurring ones
increases the propensity to pay. Fifty-six percent of members paying a monthly premium
currently enroll in recurring payments through their payer, but only 27% are enrolled in recurring
payments through their providers (Figure 15).

Enabling Digital Payments in the U.S. Healthcare Market: Your Transformational Opportunity MAY 2017
© 2017 Aite Group. All rights reserved. Reproduction of this report by any means is strictly prohibited. 18
Figure 15: Percentage of Recurring Payments by Bill Type
Source: Aite Group survey of 2,429 U.S. consumers, Q3 2016
Secondly, payers send more electronic bills than do providers, and that is reflected in the
channels through which members pay their premiums. Payers have created a more consistent
experience than have providers by meeting members’ expectation to transact online. This digital
payment experience resonates strongly with members who have a recurring relationship with
their payer compared to patients who interact with the provider for a single payment
experience.
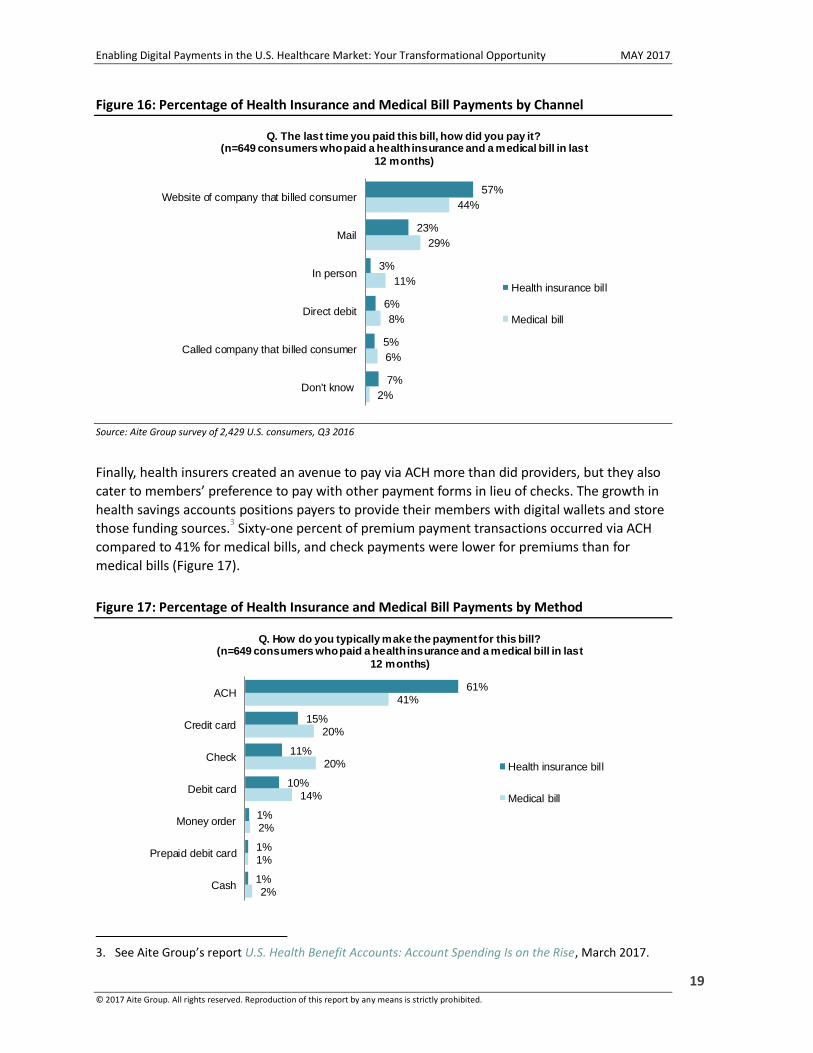
Fifty-seven percent of consumers who paid both a premium and medical bill in 2016 paid their
premium at the payer’s site, compared to 44% of the medical payments that were paid through
the provider’s site. That online activity contrasts with the mail channel; 23% of premium
transaction occurred via mail, and 29% of medical bills were paid this way (Figure 16).
56%
44%
27%
73%
Recurring payment One-time payment
Q. How do you typically make the payment for this bill?(n=649 consumers who paid a health insurance and a medical bill in last
12 months)
Health insurance bill Medical bill
Enabling Digital Payments in the U.S. Healthcare Market: Your Transformational Opportunity MAY 2017
© 2017 Aite Group. All rights reserved. Reproduction of this report by any means is strictly prohibited. 19
Figure 16: Percentage of Health Insurance and Medical Bill Payments by Channel
Source: Aite Group survey of 2,429 U.S. consumers, Q3 2016
Finally, health insurers created an avenue to pay via ACH more than did providers, but they also
cater to members’ preference to pay with other payment forms in lieu of checks. The growth in
health savings accounts positions payers to provide their members with digital wallets and store
those funding sources.3 Sixty-one percent of premium payment transactions occurred via ACH
compared to 41% for medical bills, and check payments were lower for premiums than for
medical bills (Figure 17).
Figure 17: Percentage of Health Insurance and Medical Bill Payments by Method
3. See Aite Group’s report U.S. Health Benefit Accounts: Account Spending Is on the Rise, March 2017.
2%
6%
8%
11%
29%
44%
7%
5%
6%
3%
23%
57%
Don't know
Called company that billed consumer
Direct debit
In person
Website of company that billed consumer
Q. The last time you paid this bill, how did you pay it?(n=649 consumers who paid a health insurance and a medical bill in last
12 months)
Health insurance bill
Medical bill
2%
1%
2%
14%
20%
20%
41%
1%
1%
1%
10%
11%
15%
61%
Cash
Prepaid debit card
Money order
Debit card
Check
Credit card
ACH
Q. How do you typically make the payment for this bill?(n=649 consumers who paid a health insurance and a medical bill in last
12 months)
Health insurance bill
Medical bill
Enabling Digital Payments in the U.S. Healthcare Market: Your Transformational Opportunity MAY 2017
© 2017 Aite Group. All rights reserved. Reproduction of this report by any means is strictly prohibited. 20
Source: Aite Group survey of 2,429 U.S. consumers, Q3 2016

Enabling Digital Payments in the U.S. Healthcare Market: Your Transformational Opportunity MAY 2017
© 2017 Aite Group. All rights reserved. Reproduction of this report by any means is strictly prohibited. 21
CONCLUSION
Digital engagement in healthcare requires providers and payers to take a holistic approach to
meeting a member or patient in new and old places where a payment can be made. Consumer
expectations at each of these places are evolving at a rapid pace due to the uptake of
enrollments in HDHPs, individuals purchasing direct from payers, and increasing plan
deductibles.
Providers must recognize that financial management begins before the
appointment that push patient engagement and create transparency to maximize
collection opportunities before, while, and after services are rendered.
Providers must recognize their vendors need to mimic this approach to decrease
consumer confusion about the amount owed. Vendors deploying digital billing and
payments technology drive better collections, deliver a user experience that mirrors
one used in the online retail world, and leverage consumer bill and payment
behaviors to drive key business imperatives, such as meaningful use and
MACRA/MIPS patient experience scores.
Payers must recognize the speed of change will only grow more rapid as increased
cost sharing infiltrates both HDHPs and non-high-deductible plans. This change fuels
payers’ business cases, working toward a single centralized platform to power all
bills, payments, and remittance advices, creating one source of information for
premium and member liabilities and claims transactions.
Payers must recognize a centralized platform opens a cross-sell channel—
marketing products on the bill itself—and drives consumer self-servicing. This
combination creates a pathway to stronger loyalty between the member and the
payer.
All healthcare industry participants must recognize that a digital enablement
strategy satisfies the demand consumerism is placing on them. This demand is to
create stronger, more direct consumer relationships. Digital enablement creates
triggers that enable providers and payers to increase engagement and satisfaction
with their patient or member.
Enabling Digital Payments in the U.S. Healthcare Market: Your Transformational Opportunity MAY 2017
© 2017 Aite Group. All rights reserved. Reproduction of this report by any means is strictly prohibited. 22
ABOUT AITE GROUP
Aite Group is a global research and advisory firm delivering comprehensive, actionable advice on
business, technology, and regulatory issues and their impact on the financial services industry.
With expertise in banking, payments, insurance, wealth management, and the capital markets,
we guide financial institutions, technology providers, and consulting firms worldwide. We
partner with our clients, revealing their blind spots and delivering insights to make their
businesses smarter and stronger. Visit us on the web and connect with us on Twitter and
LinkedIn.
ABOUT ACI WORLDWIDE
Insurers and providers turn to ACI Worldwide to improve their efficiency and collect more with
electronic bill presentment and payment proven to raise consumer satisfaction 25%, reduce staff
time spent on payments by 19% and collect 27% more. ACI does more than power electronic
payments—it empowers your business success.
See success stories at www.aciworldwide.com/healthcare.
AUTHOR INFORMATION
Mike Trilli +1.617.398.5058
CONTACT
For more information on research and consulting services, please contact:
Aite Group Sales +1.617.338.6050
For all press and conference inquiries, please contact:
Aite Group PR
+1.617.398.5048
For all other inquiries, please contact: