enabling web based mapping for public health in resource
TRANSCRIPT

Enabling web based mapping for public healthin resource constrained environments:Bootstrapping implementations by leveragingplatform generativity
Sushil ChitrakarMaster’s Thesis Autumn 2015


Enabling web based mapping forpublic health in resource constrained
environments: Bootstrappingimplementations by leveraging
platform generativity
Sushil Chitrakar
3rd August 2015

ii

Abstract
Due to digitization of data and its access through Internet, the webbased mapping applications are also increasing rapidly. Moreover, thethematic mapping adds more value to the mapping applications, whichhelps to express natural and socio-economic phenomena in the map. Thiscould be further useful to provide support in planning, analysis, anddecision-making of any organization. Some of the examples of mappingapplications include ArcGIS, and Google Map. Web based mapping is alsoimportant in public health sector and some of the related applications arenamely accessing health facility placement, early warning of emergencydiseases, and respond to health emergency. Although, web mapping isa useful tool, it is time consuming to add and access data through Webin resource constrained environments. Moreover, resource constrainedenvironments may lack experts and the people over there may not beable to use the system if it is technical. Taking a case of DHIS2, a healthinformation management system, there are series of technical steps that hasto be followed in order to configure the system for its mapping features.These processes can be very difficult to be followed in resource constrainedenvironments. Considering the easiness for users to import mapping datainto the system in resource constrained environments, an app (alpha andbeta versions) has been developed by following the ADR (Action DesignResearch) methodology, and the concept of bootstrappig and platformgenerativity to make the platform more generative. The alpha version ofthe app integrates all the required tools into one solution and beta versionimproves the user interface, and functionality to provide more featuresto the users while importing coordinates into the system. In this thesis,the potential to integrate all the required steps to configure web thematicmapping has been identified by analyzing the DHIS2 platform. Moreover,a method to leverage platform itself to make it more generative has beenidentified by developing an app for the import functionality of a mappingapplication.
iii

iv

Preface
I express my sincere gratitude to my supervisor, Dr. Knut Staring for thecontinuous support and guidance throughout my master thesis with hisvaluable suggestions. With his deep knowledge about the subject matterhelped me to move easily and complete my thesis. Without his guidancecompleting this thesis alone for me would have been very difficult.
My sincere thanks also goes to Bob Jolliffe, Mark Polak, Lars HelgeØverland and entire DHIS2 team who helped me to understand differentaspect of developing an app using DHIS2 Web API platform and gave theirvaluable suggestions and helped me to test the app to make it better.
Thanks to my friend Adrian Manuel Arevalo Soria who helped me tounderstand the ADR concept and its use.
My final thought goes to my lovely and supportive wife AmbikaShrestha Chitrakar and my family.
Thanks all for your continues Support.
Sushil Chitrakar, 2015/08/03
v

vi

Table of Contents
Frontpage 1
Abstract iii
Preface v
Contents ix
List of Figures xii
List of Tables xiii
1 Introduction 11.1 Topic . . . . . . . . . . . . . . . . . . . . . . . . . . . . . . . . 11.2 Keywords . . . . . . . . . . . . . . . . . . . . . . . . . . . . . 31.3 Problem description . . . . . . . . . . . . . . . . . . . . . . . 31.4 Motivation . . . . . . . . . . . . . . . . . . . . . . . . . . . . . 51.5 Research questions . . . . . . . . . . . . . . . . . . . . . . . . 61.6 Contributions . . . . . . . . . . . . . . . . . . . . . . . . . . . 61.7 Thesis outline . . . . . . . . . . . . . . . . . . . . . . . . . . . 6
2 Background and Related work 92.1 GIS and public health . . . . . . . . . . . . . . . . . . . . . . . 9
2.1.1 Geographic information system (GIS) . . . . . . . . . 92.1.2 GIS in developing countries . . . . . . . . . . . . . . . 92.1.3 GIS and health care . . . . . . . . . . . . . . . . . . . . 112.1.4 Thematic maps . . . . . . . . . . . . . . . . . . . . . . 12
2.2 Bootstrapping and platform generativity . . . . . . . . . . . 132.2.1 Bootstrapping . . . . . . . . . . . . . . . . . . . . . . . 132.2.2 Generativity . . . . . . . . . . . . . . . . . . . . . . . . 142.2.3 Platform . . . . . . . . . . . . . . . . . . . . . . . . . . 15
2.3 DHIS and thematic mapping . . . . . . . . . . . . . . . . . . 172.3.1 Evolution of thematic mapping in DHIS . . . . . . . . 172.3.2 DHIS as generic platform . . . . . . . . . . . . . . . . 192.3.3 Existing import process in DHIS2 . . . . . . . . . . . 21
Simplification . . . . . . . . . . . . . . . . . . . . . . . 22Projection transformation . . . . . . . . . . . . . . . . 22GML file generation . . . . . . . . . . . . . . . . . . . 23
vii

Import . . . . . . . . . . . . . . . . . . . . . . . . . . . 24
3 Methodology 273.1 Action design research (ADR) . . . . . . . . . . . . . . . . . . 27
3.1.1 Why ADR methodology? . . . . . . . . . . . . . . . . 273.1.2 Stages and principles of ADR . . . . . . . . . . . . . . 28
Problem formulation . . . . . . . . . . . . . . . . . . . 28Building, intervention, and evaluation (BIE) . . . . . 28Reflection and learning . . . . . . . . . . . . . . . . . 29Formalization of learning . . . . . . . . . . . . . . . . 30
3.1.3 ADR for the project . . . . . . . . . . . . . . . . . . . . 30Problem formulation . . . . . . . . . . . . . . . . . . . 30Building, intervention, and evaluation (BIE) . . . . . 30Reflection and learning . . . . . . . . . . . . . . . . . 31Formalization of learning . . . . . . . . . . . . . . . . 31
3.2 Data collection . . . . . . . . . . . . . . . . . . . . . . . . . . . 323.2.1 Observations . . . . . . . . . . . . . . . . . . . . . . . 323.2.2 Document studies . . . . . . . . . . . . . . . . . . . . 323.2.3 Key informants . . . . . . . . . . . . . . . . . . . . . . 323.2.4 Case study . . . . . . . . . . . . . . . . . . . . . . . . . 333.2.5 Tests . . . . . . . . . . . . . . . . . . . . . . . . . . . . 33
4 Design and Implementation 354.1 Choice of tools . . . . . . . . . . . . . . . . . . . . . . . . . . . 35
4.1.1 Shapefiles . . . . . . . . . . . . . . . . . . . . . . . . . 354.1.2 GADM shapefile . . . . . . . . . . . . . . . . . . . . . 364.1.3 Converter . . . . . . . . . . . . . . . . . . . . . . . . . 374.1.4 Mapshaper . . . . . . . . . . . . . . . . . . . . . . . . 38
Simplification of coordinates . . . . . . . . . . . . . . 384.1.5 Geography Markup Languagee (GML) file format . . 39
4.2 App Design: Alpha version . . . . . . . . . . . . . . . . . . . 394.2.1 Identifying the main processes . . . . . . . . . . . . . 394.2.2 Identifying the tools and api . . . . . . . . . . . . . . 41
Proj4js for transforming the projection . . . . . . . . . 41Mapshaper to simplify the coordinates . . . . . . . . 43DHIS2 Web API to import data into DHIS2 . . . . . . 44
4.2.3 Implementation of Alpha version of the app . . . . . 46Simplify the coordinates . . . . . . . . . . . . . . . . . 47Import shapefiles data into fresh DHIS2 . . . . . . . . 48
4.3 App Design: Beta version . . . . . . . . . . . . . . . . . . . . 484.3.1 Possible matching conditions . . . . . . . . . . . . . . 494.3.2 New import functionality . . . . . . . . . . . . . . . . 494.3.3 Implementation of Beta version . . . . . . . . . . . . . 51
4.4 Tools used in the experiment . . . . . . . . . . . . . . . . . . 53
5 Discussion 55
6 Conclusion 63
viii

7 Future work 65
Bibliography 74
8 Appendix 758.1 Implementation and User Manual for the app . . . . . . . . . 75
8.1.1 Upload files for organizational units and their co-ordinates . . . . . . . . . . . . . . . . . . . . . . . . . . 75
8.1.2 Adding menus in Mapshaper toolbar . . . . . . . . . 75How to add menus in Mapshaper toolbar . . . . . . . 76
8.1.3 Functionalities of Org List menu . . . . . . . . . . . . 77List the organizational units . . . . . . . . . . . . . . . 77Associate imported data with DHIS2 database . . . . 78Display all Organisation Unit . . . . . . . . . . . . . . 80Compare the organization units . . . . . . . . . . . . 80Import Data into the system . . . . . . . . . . . . . . . 81
8.1.4 Functionalities of Show Map menu . . . . . . . . . . . 818.2 Setting the app in DHIS2 . . . . . . . . . . . . . . . . . . . . . 82
ix

x

List of Figures
1.1 Standard hierarchy of Census Geographic Entities [70] . . . 4
2.1 The main five constituents of GIS [80] . . . . . . . . . . . . . 102.2 Elements of software-centric platform ecosystem from
Tiwana et al. [72] . . . . . . . . . . . . . . . . . . . . . . . . . 152.3 DHIS2 framework [25] . . . . . . . . . . . . . . . . . . . . . . 162.4 GIS interface example from [42] . . . . . . . . . . . . . . . . . 182.5 GIS interface example from [75] . . . . . . . . . . . . . . . . . 192.6 Evolutionary global toolbox design [69] . . . . . . . . . . . . 202.7 Current processes to import data and coordinates in DHIS2 . 212.8 GML file example generated after running the ogr2ogr
command . . . . . . . . . . . . . . . . . . . . . . . . . . . . . . 25
3.1 ADR method: stages and principles [66] . . . . . . . . . . . . 29
4.1 General system architecture of MapShaper tool [45] . . . . . 384.2 General system architecture of MapShaper tool [45] . . . . . 384.3 Example of using MapShaper tool . . . . . . . . . . . . . . . 394.4 Chain of design versions for Alpha version of the app . . . . 404.5 Code snippet to store uploaded data in a file object . . . . . . 444.6 Code snippet to convert file object variable to JSON object
variable . . . . . . . . . . . . . . . . . . . . . . . . . . . . . . . 444.7 Code snippet to access the properties of a organization unit . 454.8 Code snippet to access coordinates of a organization unit . . 454.9 GML file format for DHIS2 Web API . . . . . . . . . . . . . . 454.10 AJAX script to link DHIS2 Web API and import the data into
DHIS2 . . . . . . . . . . . . . . . . . . . . . . . . . . . . . . . 464.11 Implementation design for Alpha version of the app . . . . . 474.12 Import organization units into DHIS2 . . . . . . . . . . . . . 484.13 Implementation Design of Beta version of the app . . . . . . 52
8.1 Select and Drag upload . . . . . . . . . . . . . . . . . . . . . . 768.2 Select upload button upload . . . . . . . . . . . . . . . . . . . 768.3 Mapshaper tool Original . . . . . . . . . . . . . . . . . . . . . 768.4 Modified Mapshaper tool . . . . . . . . . . . . . . . . . . . . 778.5 Functionalities of Org List Menu . . . . . . . . . . . . . . . . 778.6 Columns Organisation Unit table . . . . . . . . . . . . . . . . 788.7 Matching ID in dbf files . . . . . . . . . . . . . . . . . . . . . 798.8 User Interface when compare button pressed . . . . . . . . . 81
xi

8.9 Show Map button to display the map . . . . . . . . . . . . . 828.10 Open App Management Page . . . . . . . . . . . . . . . . . . 828.11 Setting path for App installation folder and App base URL . 838.12 Select the zip file of app for installing app in DHIS2 . . . . . 838.13 Confirmation after app is installed . . . . . . . . . . . . . . . 848.14 Installed app is displayed in the list . . . . . . . . . . . . . . 848.15 Run the MapshaperLoader . . . . . . . . . . . . . . . . . . . . 858.16 Front page of MapshaperLoader . . . . . . . . . . . . . . . . 85
xii

List of Tables
4.1 Tools and api to convert the coordinates projections andsimplify them . . . . . . . . . . . . . . . . . . . . . . . . . . . 42
4.2 Selected tools and api to convert the coordinates projections,simplify them, and import data into DHIS2 . . . . . . . . . . 42
4.3 Tools and scripts used for the implementation and debug-ging of the app . . . . . . . . . . . . . . . . . . . . . . . . . . 53
xiii

xiv

Abbreviations
ADR - Action Design ResearchANC - African National CongressAPI - Application Programming Interfaceapp/App - ApplicationBCG - Bacille Calmette GuerinBIE - Building, Intervention, and evaluationCRS - Coordinate reference systemDHIS2 - District Health Information System 2EPSG - European Petroleum Survey GroupESRI - Environmental Systems Research InstituteGADM - GADM database of Global Administrative AreasGIS - Geographic Information SystemGIS - Geographic Information SystemGML - Geography Markup languageGUI - Graphical User InterfaceHIMS - Health Information Management SoftwareHIS - Health Information SystemHISP - Health Information System Programkbps/mbps - Kilobits Per Second / Megabits Per SecondOGC - Open Geospatial ConsortiumOU - Organization UnitsPROM - Programmable Read-Only MemoryQGIS - Quantum Geographic Information System (software)REST - Representational State TransferUTM - Universal Transverse Mercator Coordinate SystemWHO - World Health Organization
xv

xvi

Chapter 1
Introduction
1.1 Topic
Due to digitization of data and its access through Internet providestremendous opportunities to share knowledge among people all aroundthe world. This is also valid for map related information. Many GIS(Geographic Information System) technology based applications such asArcGIS [17] are already available in market to serve geography relatedsolutions. Such applications help to visualize geographical locations intothe map. Moreover, with the emergence of Web1.0 and Web2.0 technologies[28], it is possible to access map related applications through Internet andshare open api between applications. Google Map is one of the examplesof Web based GIS applications. Many mapping applications use thematicmaps, which adds more value to the applications. It helps to expressnatural and socio-economic phenomena in the map [21], which can be veryuseful to provide support in planning, analysis, and decision-making levelof any organization.
Public health sector is one of the application area where maps can beused to visualize the health related information based on geographicalinformation. Winslow [76] defines public health as “the science and theart of preventing disease, prolonging life, and promoting physical healthand efficiency through organized community efforts for the sanitation ofthe environment, the control of community infections, the education of theindividual in principles of personal hygiene, the organization of medicaland nursing service for the early diagnosis and preventive treatment ofdisease, and the development of the social machinery which will ensureto every individual in the community a standard of living adequate forthe maintenance of health ”. Some of the mapping applications withinthe public health includes accessing health facility placement [52], earlywarning system of communicable diseases [64] etc.
GIS is a useful tool for public health sector but it is difficult to bedeployed in resource constrained environments. Mostly, least developedand developing countries suffer from resource constrained situations suchas poor economy, lack of proper manpower, lack of data, poor Internetfacility, no Internet in all the places of the country etc. Please refer to
1

the section 2.1.2 for more detail about resource constraints in developingcountries to use GIS tools. There are different open source tools that canbe used for mapping functionality that removes the cost of purchasing GIStools, but the geographical data, which is the main element for mapping,are huge in volume. Importing all the data and accessing map through Webis a time consuming process and the time required to load the mappingsolution largely depends on the amount of geographical data availableto visualize the map. One way to speed-up the mapping feature in anyapplication could be by reducing the number of geographical data. If weremove some data from the original data, we also remove certain level ofinformation. The data should be minimized in a way that when map isdrawn it should preserve at least the boundary of the geographical location.
One can think of adding a feature to import the simplified map into thehealth information management systems in case of resource constrainedenvironment. We can either add this feature within the stand-alonesoftware or develop an app for generative software platforms. Thetrend of stand-alone software is moving towards software platforms withgenerativity at its core. It is because, the stand-alone software cannotevolve highly even when it has modular structure [78]. Su et al. [29]defines modularity design as a special structure where all the parametersand the functionality within one module are interdependent and those onesare independent with other modules. According to Huynh and Cai [49],modularity in design is very important in software systems and it helpsto determine the software quality in terms of evolveability, changeability,maintainability etc.. Modular software design is evolveable but addingor changing modules require good knowledge about the system, whichfurther restricts external users to add modules. Platform generativityon other hand, allow platforms to provide functionality to users thatthe designers of the platform did not have in mind and helps them toevolve[51]. Kretzer and Maedche [51] explains that the generativity refersto the ability of the platform to be extended, and the ability of the platformto be integrated into another system in order to create new output. Google,Facebook, and Apple are some of the powerful examples of companiesthat have deliberately created platform to produce products and servicesthat were not imagined by them at the beginning. Map services from theGoogle’s Web API is one of such examples [78].
We can also see DHIS2 [13], a health information management systemas an emerging platform [25]. DHIS2 selected the Java-based technologyfor its development, which was first deployed in a clinic of kerala, India in2006 [73]. DHIS2 is basically an open source tool for collection, validation,analysis, and presentation of aggregate statistical data especially for healthinformation management activities. As of October 2012, DHIS2 softwarewas used in more than 47 countries in Africa, Asia, and Latin America.Some of the countries that have adopted DHIS2 as health informationsystem (HIS) in their nation-wide level include Kenya, Tanzania, Uganda,Rwanda, Ghana, Liberia, and Bangladesh [13]. DHIS2 works as a softwareplatform and provides Web API to interact with external applications [25].This feature helps DHIS2 to add more features even from the external users.
2

During implementation, it is important to follow some strategy that canguide to get started and reach the critical mass. Bootstrapping is one ofsuch strategies for the implementation of any problem. It suggests to startthe implementation with a simple solution, add more complexities to thestarted task and iterate the process until the desired output is achieved [68].
This master thesis aims to explore a good solution to enable the webbased mapping functionality in resource constrained environment. Theimplementation will use the bootstrapping strategy by leveraging theplatform generativity.
1.2 Keywords
Thematic Mapping, GIS, Generativity, Bootstrapping, ADR, DHIS2, Plat-form, Web API
1.3 Problem description
We know that any web-based application helps people to connect quicklyirrespective of their physical locations. In case of health sector, it ispossible to access the health related content and update the system fromany location, if the Internet facility is available. Despite various advantagesof using web based mapping application, it can be challenging to use it inresource constrained environments.
Since in resource constrained environment, there can be lack of high-speed Internet facility, skilled staff, good economy etc., these constraintsfurther restrict the web based applications to be bit selective towards thechoice of tools and functionality. Below are some of the challenges thatcan come across while implementing web based mapping functionality forpublic health in resource constrained environments:
• Data sources:Geographic coordinates are the key elements to display different re-gions in the map. Different country have different organizationalhierarchy and they can be displayed in the map if we have theirgeographical coordinates. Organization hierarchy with their coordin-ates are data for any mapping tool. Figure 1.1 shows an exampleof organizational hierarchy, which is a standard hierarchy of censusgeographic entities. The hierarchy can be followed with the help ofstraight lines (Nation - Regions - Divisions - States - Counties - CensusTracts - Block Groups - Census Blocks). The organizational hierarchyof all the countries may not be the same. For example, some coun-tries do not have states and some countries have village developmentcommittees (has similar level to the municipality in a country) in thehierarchy.
Finding a proper data source for maps is a challenging task. GADM[38] and government are some examples of data sources for the maps.GADM [38] is one of the spatial databases that provide spatial data of
3

Figure 1.1: Standard hierarchy of Census Geographic Entities [70]
the location of the world’s administrative boundaries that can be usedin GIS or GIS like softwares. GADM refers to organization hierarchyof a country such as provinces, departments, and bibhag. It providesspatial data for organization hierarchy of a country in shapefile, ESRI[32] geodatabase, RData etc. Some of the government websites thatprovide data for maps are http://earthexplorer.usgs.gov/ for UnitedStates, and http://drm.moha.gov.np/ for Nepal. They also providedata in different file formats such as shapefile, GeoJSON, Excel, etc.
• Automatize the manual processes:There can be several processes involved while storing proper geo-graphical data into the system. Some of the steps may include con-version of the coordinate projection, simplification of the coordinates,storing data into the system, and displaying the map based on thesedata. Coordinates for organizational hierarchy of countries that weget from the public data sources may not have the projection thatone require. In such case, the projection of coordinates should bechanged. Simplification of coordinates to reduce the size of data canbe another step. After simplifying the coordinates of the organiz-ation hierarchy, one might need to store them properly in a healthmanagement system. Another step could be the display of map itselfbased on these simplified coordinates. Subsection 2.3.3 in chapter 2provides a quick picture of how complex the enabling thematic map-
4

ping process could be.
People may not have expensive commercial GIS system to perform allthese tasks in resource constrained environment. They might do mostof the tasks manually and doing manual work for large data mightinclude human errors. Moreover, these processes are not easy to bedone by an unskilled staff; it requires series of steps to be performedto get the final simplified data that has to be stored properly intothe system. It would be better if these manual processes could beautomatized so that less human interaction would be required. Thiscould avoid the chances of human error and at the same time couldsave the time of staffs.
• Selection of open-source tools:It is better to automatize the manual processes but it is necessary tofind out the open-source tools that are available for these purposes.In addition, it is also necessary to test if these identified open-sourcetools can be integrated together in a common platform or not.
1.4 Motivation
Thematic mapping is useful, but hard to set up in resource constrainedenvironment. The emergence of generic web platforms is a powerful trendWithin the field of public health. DHIS2 is one of the emerging platformsin 47 countries [7]. There is a lot of literature on thematic mapping, alsofor health. There is also a growing literature on platforms, and quite a lotof research around DHIS2, even on bootstrapping [44]. However, thereis little literature on leveraging platforms for thematic mapping in publichealth (but some on Google Maps etc.), and very little on bootstrappingplatforms for public health.
DHIS2 is an open source generative software platform for managingthe health related information. It provides web based mapping featuresand allow external apps to interact with it through Web API [13], whichcan be exploited to store the data related to the organization hierarchy andtheir coordinates into the system. This further helps in enabling the webbased thematic mapping feature in DHIS2. Therefore, we want to exploreleveraging the DHIS2 platform itself to get started with thematic mappingon the DHIS2 web platform, in other words, bootstrapping it.
It is important to empower the users with less technical knowledge forenabling the web based mapping in resource constrained environment.Therefore, we decided to achieve this goal by developing an app thatcan help to simplify the coordinates and can use the Web API providedby the DHIS2 to import the simplified data into the system. The appshould be designed in a way that it can be easily adopted to any otherweb based system for simplifying the coordinates and then importing theminto the system with only few specific changes. This way, we can explorebootstrapping of platform for thematic mapping.
5

1.5 Research questions
The main research objective of this master thesis is to explore thebootstrapping of a generic platform for thematic mapping, with a specificfocus on the field of public health and resource constrained settings. Thisleads to the following research questions:
1. What can be the potential for integrating all necessary stages forconfiguring web thematic mapping?This research question ask to identify all the necessary stages forconfiguring web thematic mapping and then explore the potential tointegrate them. We plan to solve this problem by considering DHIS2platform.
2. How can we leverage platform itself to make it more generative?In order to answer this research question, we plan to develop an appto integrate all the necessary stages for configuring the web thematicmapping. This will be achieved by bootstrapping the DHIS2 platformto make it more generative.
1.6 Contributions
There is little literature regarding how to use bootstrapping concept toleverage the generic platform for thematic mapping. This project aims tocontribute some work to the literature related to this area.
1.7 Thesis outline
This section provides an overview of contents presented in each chapterof this thesis. These chapters start with the background and relatedwork, which is followed by the methodology, design and implementation,discussion, conclusion and future work chapters serially. Brief descriptionabout each chapters are provided below:
• Chapter 2 presents background and related work about GIS, theconcept of bootstrapping and generativity, and DHIS2. First, it de-scribes GIS and its importance in public health. It also provides briefinformation about the importance of GIS in developing countries.Secondly, it provides literature reviews about the concept of boot-strapping, generativity, and platform. Lastly, it provides backgroundabout the DHIS2 as a case for this thesis, evolution of thematic map-ping in DHIS2, explains DHIS2 as a platform and explains all thestages that are required for its import functionality to configure theDHIS2 for mapping.
• Chapter 3 provides overall methodology of the thesis. First, itprovides background information about ADR (Action Design Re-search) and explains why ADR has been chosen for the methodology
6

of this thesis. This chapter ends by providing information about howdifferent data collection methods are used to collect data and require-ments of this master project.
• Chapter 4 provides detail information about the design and imple-mentation of alpha and beta version of the app that are developed asa solution to the research questions of this master thesis. The first sec-tion briefly explains different tools that were chosen to be used in theapp, the second section explains the design implementation of alphaversion, and the third section explains the design implementation ofbeta version. The last section provides detail about the used scripts,tools during the experiment.
• Chapter 5 provides analysis and discussion of research questions onthe basis of feedbacks received from the users of DHIS2
• Chapter 6 concludes this master thesis by providing summary of thefindings of this research work.
• Chapter 7 provides the list of works that can be performed in futurein order to improve this thesis work.
7

8

Chapter 2
Background and Related work
2.1 GIS and public health
This section provides detail about geographic information system, thematicmaps and explains their importance in public health sector. It also presentsthe difficulties in deploying maps in resource constrained environmentsand ends by providing information about DHIS2 regarding thematicmapping process as a case for this master thesis.
2.1.1 Geographic information system (GIS)
Some view Geographic Information System (GIS) as a tool for spatialresearch and policy analysis, while others believe it as a part of a largeremerging new science including geography, cartography, geodesy, andremote sensing [63]. GIS in a formal way can be defined as a computerbased system that provides following four sets of capabilities to handlegeo-referenced data: i) data capture and preparation, ii) data management,including storage and maintenance, iii) data manipulation and analysis, iv)data presentation [48]. It implies that the users of GIS tool can enter geo-referenced data, store and maintain these data, modify them as per theirrequirement for analysis, and get various options to visualize them.
GIS is widely used all over the world for different purposes in both gov-ernment and private sectors. Some of them include identifying the high-risk areas of annual monsoon-related flooding by investigating rainfall pat-terns and terrain characteristics, health planning and monitoring the healthsituation in a country, identifying the health affected by spatial factors suchas demographic, life style, environment etc.
There are lot of open source and commercial GIS engines in market.Some of them are ArcGIS [1], GeoTools[2], and SharpMap [3].
2.1.2 GIS in developing countries
GIS is considered to be one of the critical tool in developed countriesfor resource management, regional planning, and economic development[56]. The use of GIS is not only valid for developed countries but also forthe developing countries. There are many potential GIS applications in
9

developing countries such as public health studies, irrigation and drainage,disaster avoidance, management of conservation areas and parks, etc. [80]provides five main constituents of GIS as people, hardware, software,methods, and data as in figure 2.1.
Figure 2.1: The main five constituents of GIS [80]
The requirements for GIS in both developing and developed countriesare the same but developing countries suffer from some constraints becauseof which it is very difficult to use applications based on GIS. Some of theseconstraints summarized from [56, 67] are provided below:
• Cost constraints: GIS application require purchasing of proper soft-ware and hardware infrastructures. Moreover, it is necessary to hiresome professionals to operate and manage the GIS application. De-veloping countries have limited financial resources, because of whichit becomes expensive for them to have all the latest functionality ofGIS in their applications.
• Infrastructure constraints: Infrastructures such as electricity and goodInternet bandwidth that are required to use GIS applications maynot be available in all parts of developing countries. Many placesin a country may have limited access to such infrastructure. Loadshedding and availability of few kbps/mbps Internet bandwidth toindividuals are some of the existing problems. Moreover, due togeographical structure and opportunities, people prefer to live inbig cities and facilities from government are more focused on maincities of the developing countries. This results in problem to providecommercial support services in remote places.
• Educational constraints: Developing countries also suffer from poorliteracy rate. Computer education is becoming popular but peoplewho have mastered computer skills are still few in numbers. Mostof the organizations that use GIS applications select local staff andsend them abroad to study GIS courses. Importing skilled workersfrom abroad is very expensive for developing countries but there
10

are lot of seminars or trainings related to GIS, which are availablethrough Internet. Attending online training instead of importingskilled workers or sending local staff abroad to learn about GIS couldbe beneficial for the developing countries in terms of cost.
• Data constraints: Valid data is the core of GIS systems to make maps.The GIS applications cannot provide proper result if the data are notcomplete or faked. Moreover, making maps and updating them is anexpensive and time-consuming operation. Therefore, it is better toinserted all the valid data at one time. It is useful more in developingcountries. However, all data may not be available at once or maybe made hidden, it might also be difficult to collect data which arerelated to socioeconomic phenomena such as population density,growth etc.
• Political stability: Political instability is one of the problem in most ofthe developing countries and it can affect GIS related projects fromnot accomplishing its full installment.
2.1.3 GIS and health care
Health care is one of the applied field of GIS and there is tremendouspotential for GIS in health care organizations, although it has been recentlyrealized. It is anticipated that GIS technologies have lot to offer inhelping improve health related services, management, and research [79].Some of the applications of GIS in health care could be analyzing thespatial distribution and trends in space and time of disease, the potentialdistribution of high-risk groups, risk factors stratified analysis, resourceallocation assessment, disease surveillance planning, disease surveillancealarm, and et. [63]. [80] presents some of the application areas of healthcare using the functionality of GIS. They are provided below:
• Disease surveillance and epidemiological studies: GIS when used indisease surveillance, can display the real-time and dynamic changesof disease development [80]. We can take an example of anoutbreak of dengue fever in a village in southern India, reported on2001. Researchers used GIS for spatial analysis and demonstrateda centrifugal spread of cases from the most affected street untilit involved the entire village. Spatial analysis revealed that casesoccurred in clusters and that these could not have occurred by chance.The researchers were able to prevent the outbreak from spreading toan adjacent village by controlling the dult mosquitoes and larvae [74].
• Environmental health research: GIS can also help in environmentalhealth research by doing space analysis. It can model estimates onsituation of environmental pollution, and help to visualize it in theform of map. GIS can also connect the environmental factors to thehealth conditions, and help to understand the possible health effectsposed by the environmental hazards [80].
11

• Health services, utilization and decision research: Health resourcesshould be distributed according to the extent of health demand andpriority. GIS integrate locations, coverage of health service and itsutilization, population, and other information in order to help healthdecision-makers to conduct the management of health resources [80].
• Respond to health emergencies: GIS can also help in responding to thehealth emergencies. For example, if a patient is infected by a lifethreatening transferable disease, GIS can be used to prevent furtherspread of this epidermic. It can be done by performing statisticalanalysis on the suspected patient and his/her close contacts, and takedecision (such as segregation, disinfection, quarantine, etc.) based onthe specific cases [80].
One of the open-source health information system that uses GISis WHO (World Health Organization). It realized the advances intechnologies such as desktop GIS packages, proliferation of computers,connection to World Wide Web, and low cost mapping and remotesensing in 1990s. It also recognized the opportunities for public healthsuch as integration of data from multiple sources, easy visualizationof diseases and health information that supports decision-making andadvocacy, spatial analysis for disease clustering, risk, accessibility etc. Asa result, WHO developed The HealthMapper as an entry point to GIS.The healthmapper is an open-source GIS desktop package with ready-made database of core geographic data. It provides a data managementand mapping applications designed especially for public health users.The key-features of healthmapper for mapping interface include thematicmaps, easy to locate and select feature, measurement and proximityanalysis, interactive graphs, my favorite maps, and icon driven layeringof geographic data (vector and raster) [60].
2.1.4 Thematic maps
The thematic map is a prominent way of expressing natural and socio-economic phenomena and making specialized maps with the help of mapcontents [21]. It is different from general reference map; it does notjust show lakes, cities, coastlines, and political boundaries but uses thisinformation to understand the specific theme or physical phenomenonsuch as immunization coverage, population density, life expectancy etc[65].
According to [77], the traditional methods of making Thematic Mapsare based on Geographical Information System (GIS) and applied to onlyone layer: map. Please refer to the section 2.1.1 for more details about GIS.This paper also states that the Thematic Maps can also show the patternsand trends that are not found easily.
In the process of developing cartography, the thematic maps of itsinformation transmission, storage, conversion, and display has greatadvantages. It has become a part of research, analysis and evaluation,
12

forecasting, planning, and command and management of important toolsand means [21].
Thematic mapping as a service on Internet is widely used in practice.Number of map applications on Internet has been increased since Googlelaunched its Google Map on the Internet in 2005. Moreover, with theconcept of Web2.0, sharing of open api, the coupling between data andapplication services, has strengthen the geographic visualization by addingthe ability to present logical analysis. Some of the relevant analysis couldbe revenue analysis of people in a country, analysis of damage fromearthquake, and so forth [50].
Web based thematic mapping is also important in public health tovisualize and quickly understand the health related information. Someof the uses of thematic mapping in public health could be displaying thefacilities in hospitals, and visualizing the indicators such as child mortalityrate, BCG doses given to children under 1 year in a particular organizationunit. It also helps in analysis of health related problems and can support inplanning and decision making.
2.2 Bootstrapping and platform generativity
We want to bootstrap the DHIS2 platform for thematic mapping to make itmore generative. Detail about the concept of bootstrapping and platformgenerativity is provided in following subsections.
2.2.1 Bootstrapping
According to Hanset and Aanestad [43], bootstrapping is a process ofmaking tool by means of the tool itself. It can also be described as a process,which is capable of loading and starting itself. Starting a Windows systemis a good example of a bootstrapping process. When a computer is turnedon, hardware reads and executes a piece of program, which is stored inPROM. This software again loads and starts a piece of software at a certainaddress of the hard disk. This software then loads and runs MS-DOS,which in turn loads and starts a Windows system.
Bootstrapping can also be used as a concept for the implementationstrategy. Skorve and Aanestad [68] provides a brief review of some selectedliterature from the vast area of implementation studies and explains thatdifferent implementation strategies have different benefits like cost andrisks but do not provide any specific selection criteria for how to approachimplementation, where and how to start, which users to begin with etc.They introduce the concept of bootstrapping in order to fulfill these issues.Below is a short explanation of the concept or algorithm of bootstrappingbased on [16, 68]:
1. Start by designing the first, simplest, cheapest solution with fewlimited number of users
13

2. Use the technology and repeat it as long as possible by enrolling moreusers
3. If possible, explore, identify and adopt more beneficial ways of usingthe solution, go to 2
4. Use the solution in tasks that are more critical, go to 2
5. Use the solution in tasks that are more complex, go to 2
6. Improve the solution so that new tasks can be supported, go to 2
This algorithm suggests starting any implementation with a simpleand cheapest solution as possible with limited number of required users.After successfully completing this task, more complexities and cases canbe added to the started task. It is an iterative process of improving the taskuntil the requirements of implementation are achieved.
2.2.2 Generativity
Tilson et al. [71] defines generativity as “the ability of a self-containedsystem to create, generate, or produce new content, structure, or behaviorwithout additional help or input from the original creators”. By referringto this definition, we can say that any technology that includes generativitystrategy in its core will have capability to generate new contents withoutthe intervention of the original creator of the technology. We can takean example of a software system that provides Web API (applicationprogramming interface) to interact with external apps. Any individualdeveloper from outside of the system can develop such apps by followingthe standards provided by the Web API in order to interact with the system.The functionality of the app is not implemented within the system but withthe help of Web API, the system is capable of generating new contents andshare its content to external programs.
According to Zittrain [81], capacity for leverage, adaptability, ease ofmastery, and accessibility are four crieteria of generativity functionalityof any technology. These crieteria ensure that the generativity increaseswith the ability of users to generate new, valuable uses that are easy to useand are in turn sources of further innovation. The four properties of thegenerativity functionality by Zittrain [81] are shortly explained below:
• Capacity for leverage: It refers to the capacity of the technology to theextent it enables the valuable accomplishment across a range of tasks.
• Adaptability: It refers to both the use of technology without anychange and the readiness of the technology to get modified with anobjective to broaden its range of uses.
• Ease of mastery: This property of the generativity of technology reflectsthe easiness for a broad range of users to adopt the technologyregardless of whether the technology was designed by considering
14
the tasks that user want to perform or not. Here, easiness to adoptthe technology refers to the skill required by the users to make use ofthe technology.
• Accessibility: This property is directly related to the ease of mastery.More the technology is easier to be adopted, the more the accessibilityof the technology.
According to Elaluf-Calderwood et al. [31], generativity is one of theimportant strategies in business models of software platform. We will talkmore about platform in section 2.2.3.
2.2.3 Platform
According to Hanseth and Lyytinen [44], platform has heterogeneous andgrowing user base and their design context is not fixed due to constant gen-erification of included IT capabilities. Some of the examples of platformsincludes office software platforms (MS Office, officestar), operating systemplatforms (Unix, Linux), application development platforms (e.g. ServiceOriented Architecture). Many platforms initially have limited IT capabilit-ies and later obtain emergent features due to their open characteristics tothe user community.
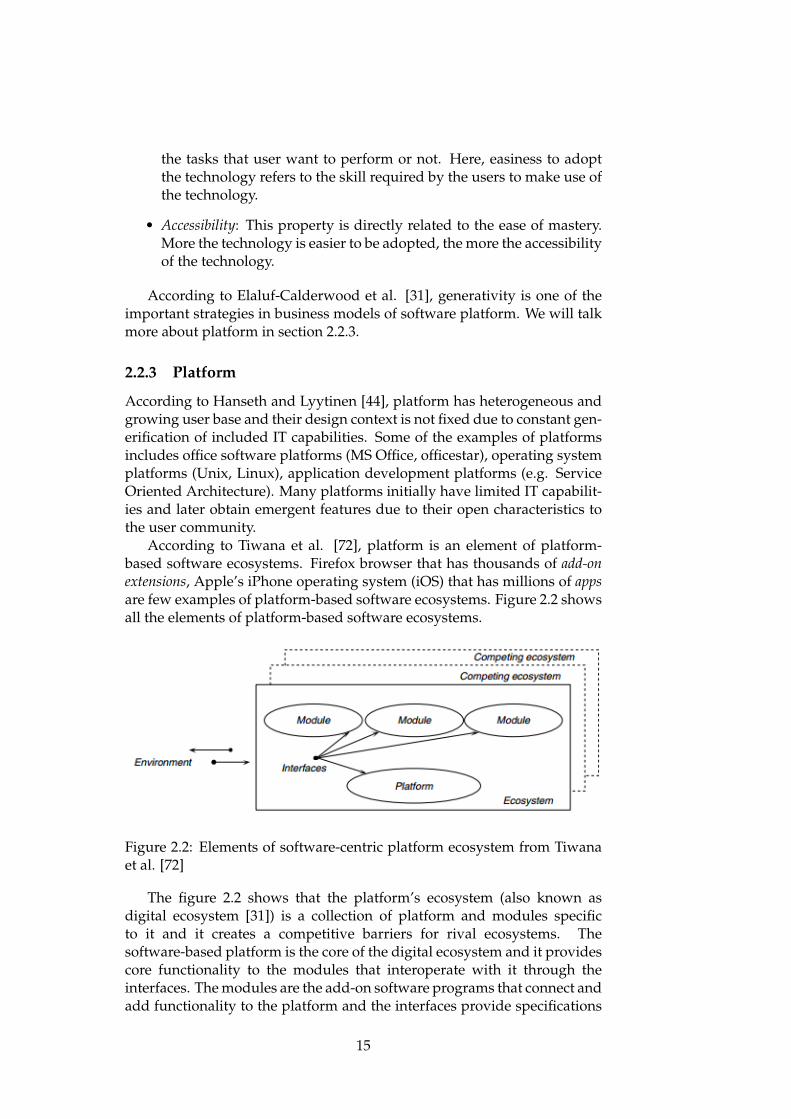
According to Tiwana et al. [72], platform is an element of platform-based software ecosystems. Firefox browser that has thousands of add-onextensions, Apple’s iPhone operating system (iOS) that has millions of appsare few examples of platform-based software ecosystems. Figure 2.2 showsall the elements of platform-based software ecosystems.
Figure 2.2: Elements of software-centric platform ecosystem from Tiwanaet al. [72]
The figure 2.2 shows that the platform’s ecosystem (also known asdigital ecosystem [31]) is a collection of platform and modules specificto it and it creates a competitive barriers for rival ecosystems. Thesoftware-based platform is the core of the digital ecosystem and it providescore functionality to the modules that interoperate with it through theinterfaces. The modules are the add-on software programs that connect andadd functionality to the platform and the interfaces provide specifications
15

and design rules to exchange information between the platform and themodules [72].
DHIS2 can be perceived as a generative platform. Similar to thecharacteristics of a platform, DHIS2 also has heterogeneous and growinguser base and its design context is generic. Its design evolve due to theiterative modification on local and global designs requirements. Moreover,DHIS2 can be seen as a software-based ecosystem, where DHIS2 performsas a platform and allow multiple modules or apps to connect and addfunctionality into the system through Web API. Here, Web API complieswith the rules of REST architectural style [25] and plays the role of interfacebetween different modules and DHIS2 platform.
Figure 2.3: DHIS2 framework [25]
Figure 2.3 shows a framework of DHIS2. It clearly shows that DHIS hascore functionality to store data and display charts, maps, and data tables.Other modules of the DHIS2 such as Web portal, clients, and informationsystems through Web API using URL can access these core functionalities.The DHIS2 functionality can be extended by allowing apps to interoperate
16

with DHIS, independent of the implementation of DHIS with the helpof Web API. It fulfills all four criteria of generivity functionality. It hascapacity to leverage in a range of different tasks. For example, DHIS2 canserve as a management system for domains such as logistics, labs, andfinance [25]. It is also easily adoptable since users does not need to dealwith the implementation part of DHIS2. Even with fewer skills, apps caneasily interoperate to DHIS2 with the help of Web API. Since DHIS2 is anopen source and easy to use, it is accessible to different user communities.These properties of DHIS2 ensure that the generativity of DHIS2 increaseswith the ability of users to generate new, valuable uses that are easy to useand are in turn sources of further innovation.
2.3 DHIS and thematic mapping
2.3.1 Evolution of thematic mapping in DHIS
“DHIS emphasises the use of information for action, improved health ser-vices, user participation, and ’live’ (in real contexts), agile and rapid proto-typing. The DHIS software development effort was organized within theHISP network, and has since its inception been embedded in a synergeticmixture of public health and participatory design perspectives.”[73]
[42] provides a short history about DHIS, which are provided below:
• In the year 1994, a Health Information System Program (HISP) wasstarted in South Africa. Initially HISP was based in two Cape Townuniversities and funded by Norwegian Agency for Development Cor-poration (NORAD). Taking part in the reconstruction and develop-ment program launched by the ANC to reconstruct the health servicein South Africa.
• In 1997, open source DHIS was developed. After the success of pilotphase, the strategies, process and software developed in the pilotareas were adopted by the Department of Health in 1999 as NationalStandard.
• In 2002, the design team of DHIS came up with the five designparameters for the development. One of the design parameters wasto make this system free (Open source). Earlier version of DHIS wasdeveloped based on commercial software making users to pay for thecommercial tools used by the DHIS.
In the year 2005, [42] developed a module for GIS interface in DHIS thatallowed the creation of health thematic map. The application was based onjava libraries. They build an interface to display maps, which looks like infigure 2.4.
Because of strong using of Microsoft windows operating system in theworld, the initial version of DHIS was developed for Microsoft windows,using the Access as database. With the growing users, new demandand countries, it became hard to to address those requirement with the
17

Figure 2.4: GIS interface example from [42]
current DHIS software. The implementation of DHIS 1.3 in Cuba in 2003showed the limitation of this DHIS at that time. Though, DHIS generallybeing regarded as the open source and free, the dependency of DHIS withcommercial Microsoft technologies required some expenditure to acquirethese commercial technologies. These expenditures were unacceptable forthe developing countries and resource constraint environments.
These issues prompted a requirement of developing DHIS, entirelyusing the free and open source framework. Therefore, in the spring of 2004,a decision was taken to start developing a new version of DHIS namedDHIS2, in university of Oslo. The system would be platform independentand would run in any operating system and on most database managementsystems [75].
With the development of new DHIS2, the importance of integrated GISmodule was becoming more prominent and DHIS tried to come up withseveral solutions for this purpose, but none of the module truly matchedthe requirement. The current module of GIS used in the DHIS2 is theresult of research and development done by [75] as his master thesis inwhich, he had the requirement of developing a web based, open sourceand integrated GIS module for DHIS2. One of the interfaces from his thesisis provided in figure 2.5.
In current DHIS2, thematic mapping has been implemented to visualizethe classified health information related data in four different vector layers[27]: i) Facility layer, ii) Boundary layer, iii) Thematic layer, and iv)
18

Figure 2.5: GIS interface example from [75]
Event layer. Facility layer displays icons indicating facilities based onthe facility type (hospital, clinics, etc.). Boundary layer displays theboundaries/coordinates in the system based on the selected organizationalunit. Thematic layer allows users to visualize data based on thecombination of indicators, period and the map along with the selection of aparticular organizational unit level for the boundaries. Event layer enablesusers to drill down from the aggregated data displayed in the thematiclayers to the underlying individual events or cases.
2.3.2 DHIS as generic platform
DHIS is a health information management system, which has beendeveloped by the researchers of the University of Oslo, Norway. Thissystem has been designed in such a way that it can be launched both locallyand globally as a solution to the health information management. Thissystem has been already installed either completely, partially, or in pilotstage in 47 countries including Bangladesh, India, Liberia, Sierra Leoneetc. [7], and it aims to launch in several countries also. Systems that aimas a global solution should follow method design such as "generification".Generification is a key design method to spread the local innovations acrossa heterogeneous network [57].
In case of DHIS2, two processes: i) in-country design of the HIS with an
19

emphasis on the system rather than on the software, and ii) across-countrydesign of a globally distributed toolbox of software and best practicesfor in-country HIS design, continuously feed into each other.As shown infigure 2.6, globally distributed solution grow out of local design and uses,and the global toolbox is utilized in the local design processes adapting theglobal standards [69].
Figure 2.6: Evolutionary global toolbox design [69]
Due to generic nature of the DHIS2 system, it is necessary that any Appwithin the DHIS2 system should also be generic. In DHIS2, importing theorganizational units and their coordinates in order to enable the thematicmapping is a manual work. The most commonly used files for importingthe organization units are shapefiles. These shapefiles may have differentstructures to store the organization units depending on the shapefilesproviders of different countries. The objective of this master thesis isto come up with a generic solution to import the organization units,considering the variability of the structure of the shapefiles. The appthat will be implemented as a solution for importing the organizationunits into the health information management system should follow thegenerification method design and should be suitable for both in-countryand across-country processes with minimum number of specific changesby the required party.
20

2.3.3 Existing import process in DHIS2
Existing processes to import data and coordinates into the DHIS2 systemcan be divided into four sub processes: i) simplification, ii) projectiontransformation, iii) GML file generation, and iv) Import. These processes arehandled separately, one after another. In this section, we will discuss indetail about these processes.
Figure 2.7: Current processes to import data and coordinates in DHIS2
Figure 2.7 shows a flow diagram for these processes. Here, the processof simplification of coordinates is optional. Simplification is required ifuser wants to reduce the number of coordinates for organization units.It is helpful especially in the case of constrained environment but at the
21

same time, this process also removes some detail information related to thecoordinates of the organization units. Therefore, this process is optional.Other three processes are mandatory and are done one after another.Dashed arrows resemble the linkage between different processes, whereone-way arrow represents the specific flow order and bidirectional arrowrepresents the possibility of any order to perform the processes. We cansee that, a bidirectional arrow connects the simplification and projectiontransformation processes. It means that if an end user choose both theprocesses, he/she can do any of them at first independently. The one-directional dashed arrows on other hand restrict the flow of processes inorder. For example, GML file generation process cannot be done beforeprojection transformation process.
This section is sub-divided into four sub-sections based on the four sub-processes of existing import functionality of DHIS and details about themcan be found in their specific sub-sections.
Simplification
Shapefiles 4.1.1 provide coordinates for organization units that can beimported into DHIS2 system to enable thematic mapping functionality.Since the targeted market of DHIS2 is mostly in developing countries,and thematic mapping is a heavy functionality in any application, itrequires lot of resources to handle such functionality. As mentioned earlier,this process is optional but it is very important in resource constrainedenvironments. Please refer to the section 2.1.2 for different possibleresource constraints in developing countries, while using GIS applications.Through simplification process, it is possible to reduce the size of datawhich can further speed-up to display map in the application.
DHIS2 has proposed Mapshaper 4.1.4 tool to simplify the coordinates[14] which are stored in *.shp file. This file along with *.dbf file that storescorresponding organization units can be uploaded to the Mapshaper forsimplification. End users can achieve the desired level of precision forthe map by using slider at the top of this tool. Once the desired outputis obtained, user can export output as shapefile, GeoJSON and TopoJSON.For DHIS2, how fast the map can be displayed without trading necessarydetails from the map is very important. These exported files are then usedin other remaining processes.
Projection transformation
Another important part of importing organization units into DHIS2 isconverting the coordinate reference system CRS[18] to the coordinatereference system that is supported by DHIS2. This is a mandatory process.This process can be done before simplification or after simplification. It issame, but if end users want to simplify the coordinates, then it is better tosimplify the coordinates first and then transform their projection if it is notaccording to the specification of DHIS2.
22

There are different coordinate systems that have different projectiontypes. DHIS2 supports only one coordinate projection system that isEPSG:4326 with geographic latitude and longitude [14]. Please check [58]for more detail about geographic coordinates. The projection coordinatesin a source file from where we are going to import the data (e.g: shapefiles)might be different than EPSG:4326. Therefore, to make it work with DHIS2,it needs to be converted to the projection system that is supported byDHIS2 which is EPSG:4326. There are many tools available to convert theprojection of shapefiles. Also, there are many software api that are possibleto be integrated with the app. DHIS2 has recommended “ogr2ogr”toolfor geographical format conversion [14]. This tool should be available formost Linux distributions sudo apt-get install gdal-bin and for Windows“FWTools”[4] can be used.
In case of shapefiles, coordinate information are stored in a shape filewith “.shp”file extension. It is necessary to check the current projection ofthe shapefiles before transforming them to EPSG:4326 format. Projectioninformation about coordinates are stored in a separate file called the pro-jection file, which has file extension as “.prj”. End users can check the pro-jection of the shapefiles by using fwtools shell using following command[14]:
ogrinfo -al -so filename.shp
After the projections of the shape files are known, the second part isto transform projection from source projection to EPSG:4326, if the cur-rent projection is different. This can be achieved by again using thefwtools shell command as below. In this command, “ogr2ogr”is a toolthat can transform the projection of coordinates. It is followed by sev-eral command options where “-s_srs”indicates the source projection type,“EPSG:proj_src”indicates the current projection type of the *.shp file, “-t_srs”indicates the transformation projection source, “EPSG:4326”indicatesthe required projection transformation format, “reproj_fname.shp”is thereprojected filename, and “src_fname.shp”is the filename of the currentsource file that has to be transformed. Note that the projection transforma-tion is always performed on *.shp file in case of shapefiles.
ogr2ogr -s_srs EPSG:proj_src -t_srs EPSG:4326 reproj_fname.shp src_fname.shp
For example, if the current coordinate projection is EPSG:27700, sourceshape file is srcfile.shp, required projection transformation is EPSG:4326,and reprojfile.shp is the reprojected filename, then projection transforma-tion command looks like below:
ogr2ogr -s_srs EPSG:27700 -t_srs EPSG:4326 reprojfile.shp srcfile.shp
GML file generation
The next process after coordinate projection transformation is the genera-tion of Geographical Markup Language (GML) [47] file. GML is a XML
23

based file format that is flexible, portable for graphs. GML is also easy toimplement. DHIS2 is one of the example applications where this format isused to store the organization units and their (simplified) coordinates foreach organization units before importing them into the system. Importingfrom GML format is one of many ways to import organization unit intoDHIS2. Following command helps to generate GML file from the shapefile [14]:
ogr2ogr -f GML filename.gml filename.shp
Here, “filename.gml”in above command is a new file in GML formatand “filename.shp”is the file that has to be converted to GML file. Whilegenerating a GML file, organization units from *.dbf file that are connectedwith the coordinates in given filename.shp file are also included as datainside the GML file. After successfully running the command, GML file issaved in the same folder where shapefile is located.
The generated GML file as in figure 2.8 is still not ready to beimported into the DHIS2. In the file, organization unit is represented as<gml:featureMember>. Inside feature members, there are lot of attributesdepending on the contents of *.shp and *.dbf files of a organizationhierarchy level. Coordinate information about an organization unit isstored within <ogr:geometryProperty> tag inside <gml:featureMember>.End users should identify the attributes where organization unit name andother related information are stored and rename them according to thespecifications of the importer of the DHIS2. The importer of DHIS2 looksfor “ogr:Name”to access the name of an organization unit from GML file.If there is already information about organization unit in database and wejust want to import coordinates for that organization unit then we need toidentify the correct attribute where the organization unit name is storedand rename it to “ogr:Name”. Moreover, the name should be exactly thename as in DHIS2 database. After doing all the required modification, theGML file will be ready for the import.
Import
In this process, user adds new levels as required. Some examples may beadding levels as country, province, district etc. After that, user preparesorganizational level hierarchy in .csv or .xml format and uses importfeature in DHIS2 to import organizational units. The user need to makesure that it has all the mandatory fields that are mentioned in DHIS2user guide chapter 20.1.2, table 20.2 [15]. This process can be doneindependently if coordinates are not required. To import organizationunits along with their coordinates, or to only import the coordinates of theorganization unit, GML file should be used. This process becomes the lastprocess for this purpose.
24

Figure 2.8: GML file example generated after running the ogr2ogrcommand
25

26

Chapter 3
Methodology
This chapter is divided into two main sections: choice of research methodand choice of data collection methods. The first section discusses about theADR approach or research methodology used in this master thesis projectand second section provides a number of data collection methods used toget information about existing systems and the requirements.
3.1 Action design research (ADR)
This section includes three subsections. The first section shows why ADRmethod is suitable for this project, the second subsection explains differentstages of ADR method, and the third section explains how the project hasadhered all the stages of ADR.
3.1.1 Why ADR methodology?
A design research (DR) approach seems to be suitable to address theresearch question of this project. However, according to Sein et al. [66],existing DR approach fails to recognize the artifacts that can emergefrom the interaction of the organization. It considers the organizationalintervention to be secondary. March and Smith [55] define DR as anapproach “build and then evaluate”cycle i.e. evaluation is followedin sequence after development of the artifacts. Another approach thatconsiders organizational intervention is action reserarch (AR). Davisonand Martinsons [22] define AR as an iterative process based on workinghypotheses refined over repeated cycles of inquiry. Sein et al. [66]believes that organizational intervention is necessary to recognize thenew emerging artifacts and argue that the evaluation cannot follow thedevelopment artifact in a strict sequence. Hence, he propose Action DesignResearch (ADR) approach as a combination of DR and AR methods. Sein etal. [66] also defines ADR as “method needed to conduct DR that recognizesthat the artifact emerges from interaction with the organizational contexteven when its initial design is guided by the researchers”.
In order to solve the research questions of this project, We decidedto develop an app that can help to import organization units and their
27

simplified coordinates into the HIMS so that thematic mapping can beenabled in the system even in resource constrained environments. The appshould be generalized enough to import the organization units and theircoordinates without interfering much into the core system. We considerthe case of DHIS2 while developing the app. DHIS2 has been deployed asa solution to the health information management in different organizationsof various countries. It is necessary to get regular feedback from the realusers of the app (in our case, organizations where DHIS2 is deployed andthe people working in core DHIS2 development team) and update the appaccordingly for its successful integration in DHIS2. Therefore, we considerADR approach from [66] as a more suitable methodology for this masterthesis project.
3.1.2 Stages and principles of ADR
ADR method contains four stages and principles that guide the researchprocesses. Figure 3.1 shows all the stages and principles of ADR and detailabout them are provided in following subsections [66]:
Problem formulation
Problem formulation is the first stage of ADR and it helps to determinethe initial scope, deciding the roles and scope for participants, andformulate the initial research questions on the basis of information frompractitioners, end-users, the researchers, existing technologies, and/orreview of prior research [66]. According to Hevner et al. [46], this stageidentifies and conceptualizes a research opportunity based on existingtheories and technologies. This stage is driven by two principles: practice-inspired research, and theory-ingrained artifact. The practice-inspired researchprinciple emphasizes research inspired by practical problems. The actiondesign researcher, instead of seeing problems as a software engineer orconsultant, should generate knowledge that can be applied to the classof problems needed to be solved. The theory-ingrained artifact principleon the other hand emphasizes that the artifacts are created and evaluatedthrough ADR and are informed by theories. According to Gregor [40],abstraction and generalization are the core of a theory and he says thatthe level of generality or scope of the theory includes specifying theboundaries. For example, the boundary could be only within specificproblem domain if the scope of the theory is limited, or the boundary couldbe for all systems for a very general theory.
Building, intervention, and evaluation (BIE)
This second stage of ADR is an iterative stage of building the IT artifactsbased on stage one, intervention in the organization, and evaluation of theartifacts. ADR tries to ensure relevance, novelty, and usefulness of aproposed artifact by considering three principles of BIE stage: reciprocalshaping, mutually influential roles, and authentic and concurrent evaluation [19].
28

Figure 3.1: ADR method: stages and principles [66]
The reciprocal shaping principle emphasizes on inseparable influencesbetween IT artifacts and the organization context domains, the mutuallyinfluential roles principle points out the importance of mutual learningamong different participants of the project (for example, researchersand practitioners), and the last principle i.e., authentic and concurrentevaluation principle emphasizes that evaluation is not a separate stage ofthe research process that follows building [66].
Reflection and learning
This reflection and learning is a continuous stage of ADR that worksin parallel with the first two stages i.e., problem formulation and BIE.This stage helps to reflect on design and redesign of the artifacts as aprocess of continuous learning. This stage is driven by guided emergenceprinciple. This principle emphasizes that the ensemble artifact will reflecton both initial design and ongoing shaping by organization, participants,
29

and concurrent evaluation. It consequently provides an opportunity for theparticipants to generate and evolve design principles through the process[66].
Formalization of learning
This is the fourth stage of ADR method and it asks to develop the project ina more general way so that it can be suitable for a class of field problems.This stage is derived by generalized outcomes principle. This principleemphasizes on moving from the specific-and-unique solution to generic-and-abstract solution [66]. This conceptual move can be done in threelevels: “i) generalization of the problem instance, ii) generalization of thesolution instance, and iii) derivation of design principles from the designresearch outcomes”[66].
3.1.3 ADR for the project
This master thesis project adheres all the stages of ADR except that thecommunication for organization intervention is done through emails ratherthan meeting them individually. This subsection shows how each stages ofADR has influenced the development of this project.
Problem formulation
In order to formulate research questions, I consulted to my supervisor ofthis master thesis. We had meeting for several time to discuss about theissues in DHIS2. Finally, we formulated research questions, which arerelated to enabling thematic mapping for HIMS in resource constrainedenvironment. Please refer to 1.5 for the research questions. We alsoformulated the ADR team with me as a researcher, my coordinator,implementers, GIS expert, and mailing list users. My coordinator himselfis a researcher in DHIS2, implementers are responsible for installing DHIS2in different countries, GIS expert is a person who is responsible to handleGIS related work in DHIS2, and the mailing list users are the users whoare involved to DHIS2 from all over the world. Both practice-inspiredprinciple and theory-ingrained artifacts drive our research. We considergeneralization as a theory to our research problem and our researchquestions should come up with a generic solution that can address massnumber similar applications with few domain specific changes.
Building, intervention, and evaluation (BIE)
This research work has also followed the iterative process between buildingthe artifacts, organizational intervention, and the evaluation of the artifacts.All the feedbacks from the end users and organization are collected viaemail. After analyzing the current problems for importing organizationhierarchy with their coordinates in DHIS2, an Alpha version of the app wasdeveloped that used to allow users to upload the shapefiles 4.1.1, simplify
30

the coordinates and then automatically insert the data into the DHIS2. Thisapp was sent to Srilanka through email for evaluation. They had someproblem with this app at first and after analysis, we found that the problemwas due to duplicate data in the shapefiles. We asked them to do somemodifications on their shapefiles manually and use the app for import. Thistime, they could successfully import the data through the app. Manualupdate was a quick solution to Srilanka, but we knew that we need toperform duplicate checking on organization units before importing themto the database. The same app was sent to Madagascar, Nepal, and EastTimor but we did not get any feedback from them.
We also sent this app to the mailing list users. This time, they gave usdifferent feedback; they wanted to import some of the selected organizationhierarchy only. I also observed some functionality that has to be added inthe app. For example, the DHIS2 system allows only 4 digits after decimalpoint for coordinates in order to store into its database because of which itwas necessary to convert coordinates to this format. It was also necessary toallow users to check the correct parent organization unit; otherwise, therewas possibility of importing wrong levels of organization units into thesystem. The idea of allowing end users to modify their parent recordswould also be useful, since end users are familiar with the data and theyknow what the parent should be for a particular record.
All these error checking and functionality were added in next versionof the app (Beta version) and it was sent for evaluation to a core developerof DHIS2, and mailing list users.
Reflection and learning
Through BIE stage, we got opportunity to learn and evolve our app toeffectively import the organization units with their coordinates. At thesame time, practitioners also got opportunity to import shapefiles in aeasier and quicker manner. The app was redesigned continuously to meetthe requirement of different practitioners (implementers, mailing list users,and core developer of DHIS2). BIE cycle was iterated for several time byupdating the app to reflect the requirements of the practioners.
Formalization of learning
The format for the shapefiles (especially *.dbf) can vary from one file toanother. The app developed is generic to handle any format of shapefiles.This app also allows users to map the columns from *.dbf file to columns(fields) of the database of a particular application in order to generate theformat necessary to import data into the system. The second part could bespecific to the application, since the data from shapefiles should be mappedwith the database fields of specific application. Therefore, we can say thatthe app is designed in a generic way to import shapefiles of any format butit can be fully used by making few changes for mapping the data specificto the applications.
31

3.2 Data collection
During the research process, data collection has been very crucial part. Inour case, observations, document studies, key informants, tests, and casestudy are the main data collection methods. More on how these methodsare used for data collection in this thesis is discussed below:
3.2.1 Observations
According to Frechtling [37], observational method helps to gather data ona wide range of behaviors, to capture a great variety of interactions, andto openly explore the evaluation topic. These approaches also allow theobserver to learn about issues the participants is not aware of or unableto discuss candidly in the interviews. During this research project, Ifollowed the observation method while understanding the context of webthematic mapping for public health in resource constrained environmentand while exploring the workflow of import functionality of DHIS2 system.I collected firsthand data, understood the process, and came to know aboutdifferent issues that the current users of DHIS2 are facing with the importfunctionality. These issues become more critical in resource constrainedenvironment and I found that there is a need of a better way to importorganization units even in resource constrained environment.
3.2.2 Document studies
Study of the documents related to DHIS2 helped me a lot to gain insightabout the DHIS2 processes. Lincoln and Guba [41] defined a document asany written or recorded material that are not prepared for the purposes ofthe evaluation or at the request of the inquirer. In our case, the documentsthat are provided for the DHIS2 [13] were studied to understand theworkflow of import functionality in DHIS2. It also helped me to getinformation about different available tools and how they can be used indifferent stages of import functionality. It further helped me to test thetools for our app.
3.2.3 Key informants
According to Frechtling [37], “key informant is a person who has uniqueskill and professional background related to the issue/intervention beingevaluated, is knowledgeable about the project participants, or has accessto other information of interest to the evaluator”. Frechtling [37] alsoadds that the members of such group may be specifically selected orinvited to participate because of their skills or professional backgrounds.In my thesis, DHIS2 user and developer mailing lists were consideredas key informants. I used to get emails for the issues related to theimport functionality of DHIS2 from these mailing lists. DHIS2 usermailing list contains users who have experience in using DHIS2 platformfor their applications and DHIS2 developer mailing list contains experts
32

who are involved in the development of DHIS2. Information from thesegroups were really helpful to understand the issues in DHIS2 for importfunctionality, which further helped me understand the issue in general. Ialso knew about their expectations from the new app that I was going toimplement.
3.2.4 Case study
According to Frechtling [37], case study provides very engaging, richexplorations of a project or application. Since my thesis is related to the webthematic mapping for public health in resource constrained environment,I found DHIS2 as a suitable case to be explored. During the case study, Icame to know about different stages of importing organization units andtheir coordinates in the system, how difficult and tedious some processesare, and at the same time, I also some possible solutions for them.
3.2.5 Tests
According to Frechtling [37], tests methods provide a way to assess sub-ject’s knowledge and capacity to apply this knowledge to new situations.They also provide information that is measured against a variety of stand-ards. Since I considered DHIS2 as a case for my research project, I had toinstall DHIS2 in my local computer and check all the processes and func-tionality related to the import feature. I also tested real data from differentusers to check the real issues. In addition, I also tested some tools suchas Mapshaper, and proj4js to check if they can be integrated into one webapp or not in order to import organization units and their coordinated intothe DHIS2 system. During this testing method, I came to know about dif-ferent functionalities, advantages, and disadvantages of these tools, whichfurther helped me to develop the app.
33

34

Chapter 4
Design and Implementation
This chapter gives an overall idea about the implementation of the appfor DHIS2 that can be used as a solution to solve the research problemsof this master thesis. The implementation of the app is based on thedata and feedback collected from different group of people (implementers,DHIS2 mailing list users, DHIS2 developers), and analysis of existingimport functionality of DHIS2 system. With the problem description andrequirement for the app from various sources in hand, we decided toimplement the app in two phases namely as Alpha and Beta versions.Alpha version is the first implementation and Beta version is the secondimplementation. First section of this chapter provides details about allthe tools that are used in different processes of import feature of the app.Details about Alpha version of the app is provided in the second sectionand Beta version in the third section. The last section of this chapterprovides information about the tools and programming languages that areused for the implementation.
4.1 Choice of tools
This section provides the methods, concepts and tools that will be used forthe implementation of an app to import organization unit hierarchy fromlayered shapefiles.
4.1.1 Shapefiles
A popular file format to store the vector data format for geographic inform-ation system (GIS) is Shapefiles[12][6]. Data contains the nontopologicalgeometry and attribute information for the spatial features. The geometryfor a feature is stored as a shape comprising a set of vector coordinates.
It supports the point, line and area feature. In this format area are rep-resented as closed loop, double-digitized polygons. Attributes are held in adBASE format file. Each attribute record has a one-to-one relationship withthe associated shape record. The shapefiles contains the group of files thatstores the geometry and attributes of geographically referenced featuresin three or more files with specific file extensions that should be stored in
35

the same project workspace. The individual file with different extensionshould have the same prefix. List of files are:
Mandatory files:
• filename.shp files: This is the main file that stores the featuregeometry
• filename.shx: The index file that stores the index of the featuregeometry
• filename.dbf: The dBASE table that stores the attribute informationof features. The attribute values can be name and other details of theshape.
There is a one-to-one relationship between geometry and attributes,which is based on record number. Attribute records in the dBASE file mustbe in the same order as records in the main file.
Optional files:
• filename.prj: The file that stores the projection information ofcoordinates
• filename.sbn and filename.sbx: The files that store the spatial indexof the features.
There are more optional files, which can be viewed in [11].
We can use shapefiles as a source of data for maps but the way of storinginformation into the files may differ with the providers of the shapefiles.For example, information about organization units such as name, parentorganization unit, and ID are stored in *.dbf file of the shapefiles andcolumn names that are used to refer these information may be differentand the number of columns may vary with *.dbf files. Another optionto shapefiles could be tools like PostGIS [61], which is a spatial databaseextender for PostgreSQL object-relational database. This has more complexstructure than shapefiles.
Shapefiles are used by the users for importing the organization unitsinto DHIS2 by converting the data from shapefiles into GML files manually.Please refer to [14] for checking the process of importing organization unitsusing GML files in DHIS2. Since the shapefiles are already well knownand used by the users, we decided to use the shapefiles to make an app forautomate this process of making GML files from shapefiles and importingorganization units and their coordinates into DHIS2 system. This is helpfulfor users for importing the data by reducing the time required for learningthe new tools and process.
4.1.2 GADM shapefile
GADM[38] is a spatial database of the location of the world’s administrat-ive areas (or administrative boundaries) for use in GIS and similar software.
36
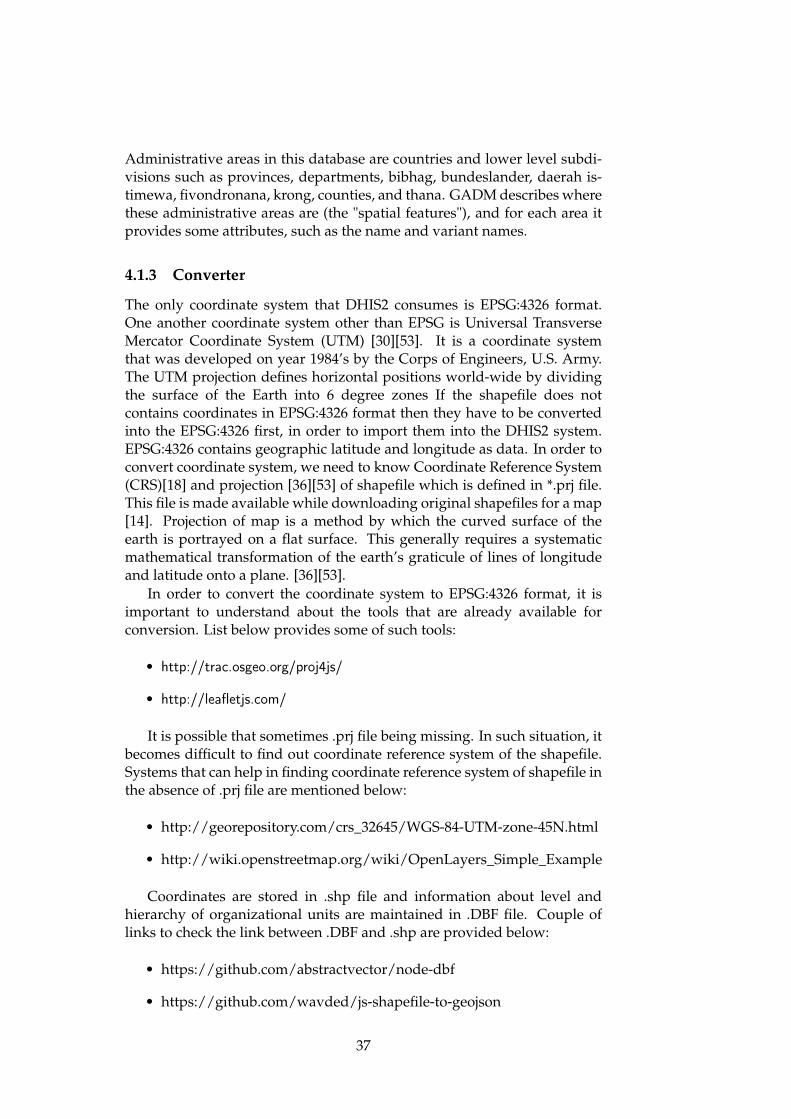
Administrative areas in this database are countries and lower level subdi-visions such as provinces, departments, bibhag, bundeslander, daerah is-timewa, fivondronana, krong, counties, and thana. GADM describes wherethese administrative areas are (the "spatial features"), and for each area itprovides some attributes, such as the name and variant names.
4.1.3 Converter
The only coordinate system that DHIS2 consumes is EPSG:4326 format.One another coordinate system other than EPSG is Universal TransverseMercator Coordinate System (UTM) [30][53]. It is a coordinate systemthat was developed on year 1984’s by the Corps of Engineers, U.S. Army.The UTM projection defines horizontal positions world-wide by dividingthe surface of the Earth into 6 degree zones If the shapefile does notcontains coordinates in EPSG:4326 format then they have to be convertedinto the EPSG:4326 first, in order to import them into the DHIS2 system.EPSG:4326 contains geographic latitude and longitude as data. In order toconvert coordinate system, we need to know Coordinate Reference System(CRS)[18] and projection [36][53] of shapefile which is defined in *.prj file.This file is made available while downloading original shapefiles for a map[14]. Projection of map is a method by which the curved surface of theearth is portrayed on a flat surface. This generally requires a systematicmathematical transformation of the earth’s graticule of lines of longitudeand latitude onto a plane. [36][53].
In order to convert the coordinate system to EPSG:4326 format, it isimportant to understand about the tools that are already available forconversion. List below provides some of such tools:
• http://trac.osgeo.org/proj4js/
• http://leafletjs.com/
It is possible that sometimes .prj file being missing. In such situation, itbecomes difficult to find out coordinate reference system of the shapefile.Systems that can help in finding coordinate reference system of shapefile inthe absence of .prj file are mentioned below:
• http://georepository.com/crs_32645/WGS-84-UTM-zone-45N.html
• http://wiki.openstreetmap.org/wiki/OpenLayers_Simple_Example
Coordinates are stored in .shp file and information about level andhierarchy of organizational units are maintained in .DBF file. Couple oflinks to check the link between .DBF and .shp are provided below:
• https://github.com/abstractvector/node-dbf
• https://github.com/wavded/js-shapefile-to-geojson
37

4.1.4 Mapshaper
Mapshaper is a tool that helps to simplify the complex and bulky mapinto simple and less bulky map that can be loaded fast when the user doesnot need very detail map and level of acceptance is high. Using the sliderprovided user can choose the level of detail that is required. For this thesis,using this app we are importing the coordinates and the organization levelsinto the dhis2 system.
Simplification of coordinates
One of the objectives of this thesis is to allow the users to simplify themap while importing data and the coordinates into DHIS2 system. Forthis purpose, we plan to integrate the Mapshaper tool as an app for DHIS2system. Mapshaper is an online tool that can be used to generalize thegeographical data that we find in the shapefiles. This tool can be accessedin [54]. Any original shapefiles contains geographical data in detail.In many cases, detail geographical data may not be necessary and it isespecially very hard to load the map where the internet connection is veryslow. Therefore, in order to reduce the size of the file with geographicalcoordinates, we will integrate the Mapshaper. It helps users to get thedesired level of detail data to generate the map. Figure 4.1 provides generalsystem architecture of Mapshaper tool.
Figure 4.1: General system architecture of MapShaper tool [45]
Figure 4.2: General system architecture of MapShaper tool [45]
According to the Figure 4.2, user can import original .shp file into thesystem and system performs pre-processing and first pass simplificationautomatically. Then it sends file to the browser. In client-side, user cancontrol local and global simplification and then export final simplifiedresult into .shp format.
Figure4.3 shows an example of using Mapshaper v0.1.13 tool. It showsa map generated after importing original shapefile. This tool provides aslider just above the map and it is named as ‘Simplify’. This slider ranges
38

Figure 4.3: Example of using MapShaper tool
from 0% to 100% and it is on full control of users. The more percentage ofsimplification, the more it removes geolocations and becomes more simple.Once desired level of simplification is obtained, user can export the newgenerated results in three different formats i.e., ShapeFile, GeoJSON andTopoJSON file format. With the updated version, users can now installMapshaper in the local system as well.
4.1.5 Geography Markup Languagee (GML) file format
Geography Markup Language (GML) [9] [8] is a XML grammar that iswritten in XML Schema, for expressing, storing and transporting thegeographic information. It serves as the language for modeling geographicsystems. GML is open interchange format for geographical transaction onthe internet.
In DHIS2, while importing the coordinates into DHIS2 system, thedata from shapefiles are converted to GML file that will contain all theorganisation units with their coordinates. Users are using this file formatto import the coordinates into DHIS2. With the view that it will be easy touse the same file format and making it possible to generate the data fromshapefiles in the GML format automatically, we can remove the process ofmanual work of converting the shapefiles to GML in Mapshaper.
4.2 App Design: Alpha version
In order to come up with our first alpha design for the app, we didsome requirement analysis and designs. This section is divided into threesubsections to explain different stages of design to reach the Alpha versionof the app.
4.2.1 Identifying the main processes
In order to define our objectives for the design and implementation of ourAlpha version of the app, we collected some specific requirements based
39

on the analysis of existing import functionality of DHIS2 system. They arelisted as below:
• Change the projection of shapefiles ( DHIS2 uses projectionEPSG:4326).
• Upload the shapefiles to Mapshaper to simplify the coordinates asper the user needs.
• Import the coordinates into the DHIS2 system with organizationhierarchy and coordinates. Allow users to specify the child parentrelation.
Based on these requirements, we identified three main processesto import the organization hierarchy from shapefiles into the DHIS2:projection check and transformation, coordinate simplification, and importingdata. These processes are depicted in version A design of figure 4.4.
Figure 4.4: Chain of design versions for Alpha version of the app
The first process needs to check the projection of the shapefiles andtransform them if they are not according to the specification of DHIS2.Another process is to simplify the coordinates we get from the shapefiles,and the last process is to import the data from shapefiles along with theirsimplified coordinates into the DHIS2 system.
Based on the requirements we gathered from the analysis of existingimport functionality of DHIS2, we defined our objectives in order to get
40

the final Alpha version for our app. The objectives for Alpha version arelisted below:
• Check different tools and api that we found from our own observa-tion and also from the web mailing list that are related to import theshapefiles into the HIMS (DHIS2 in our case).
• Check possibility of integrating the selected tools and api into theapp.
• Build an app that can change the projection of the coordinates, sim-plify them and import those coordinates along with organizationalhierarchy into the fresh installed DHIS2 with no organizational hier-archy.
4.2.2 Identifying the tools and api
There were many open source and commercial tools available for coordin-ate transformation and simplification of the coordinates. Some of them areprovided in table 4.1.
Since we were planning to give a solution to help users in resourceconstraint environment to enable the thematic mapping, our obviouschoice was to choose and test the open source solutions so that the usersdo not need to pay anything for using the services and tools that areprovided by different private companies. Moreover, we also planned toselect tools and api that provide javascript libraries, since it is easy tointegrate with DHIS2 Web API. We choose some tools and api on the basisof our observation and the practice that was followed by the DHIS2. Theseselected tools and api are listed in table 4.2. Selection of api and tools foreach main processes of the app are shown in version B of figure 4.4.
Detail about these tools while implementation of alpha version areprovided in following subsections:
Proj4js for transforming the projection
For Proj4js [62], I was able to get well-documented api and it worked wellto transform coordinates for already known projection of shapefiles. In caseof shapefiles, projection related information are stored in *.prj file. But uponcloser analysis and observation, I found that *.prj files are not common forall the shapefile providers. Without knowing the projection of shapefiles, itwas difficult to transform the coordinate projection into desired projectioncorrectly. ArcGIS on other hand can transform into the desired projectionof coordinates without knowing the current projection type of shapefilesin advance [35], but ArcGIS is a commercial tool which is out of our scopeof selecting tools and api. Therefore, for the projection transformation, wedecided to stick with the older manual process that was followed by theusers and proposed by DHIS2. Please refer to the section 2.3.3 to check howusers can do the coordinate transformation using the method proposed byDHIS2. After facing this issue, we decided to implement proj4js later, or
41

To convert the coordinates projectionSN# Tools/api Description
1 Proj4js [62] Provides an open source javascript library thatcan be used to transform the projection of thecoordinates.
2 Fwtools [4] Open Source GIS binaries for Windows (win32) andLinux (x86 32bit) systems. It contains lot of packagessuch as OpenEV, GDAL, MapServer, PROJ.4, OGDIetc.
3 OpenLayers [59] By default, OpenLayers helps to transform coordin-ates between geographic (EPSG:4326) and web orspherical mercator (EPSG:900913 et al.) coordinatereference systems. It uses proj4js library to allowtransforms between arbitrary coordinate referencesystems.
3 ArcGIS [33] A commercial GIS engine that can also be used toidentify the coordinate projection type and also totransform the coordinate projection.To simplify the coordinates
SN# Tools Description1 Mapshaper [39] An open source tool where shapefiles can be up-
loaded and coordinates can be simplified.2 HealthMapper A desktop based application which provides prein-
stalled coordinates for all the countries.3 ArcGIS [34] Commercial tool that also includes coordinate sim-
plification feature.
Table 4.1: Tools and api to convert the coordinates projections and simplifythem
SN# Tools/api Description1 Proj4js api [62] For coordinate projection transformation.2 Mapshaper tool [54] To upload the shapefiles and simplify the
coordinates.3 DHIS2 web api [26] [33] api provided by DHIS2 that has the function-
ality of accepting the GML file to import theorganizational hierarchy and coordinates intothe DHIS2 system.
Table 4.2: Selected tools and api to convert the coordinates projections,simplify them, and import data into DHIS2
42

find some other solutions that can help users with projection identificationand also transform coordinates, or find some other tools that can identifythe projection of the shapefiles with or without the *.prj files as well.
Mapshaper to simplify the coordinates
For Mapshaper, we did not find any documentation regarding its integra-tion into the app. It was a tool in itself. Therefore, we had to check thecoding of the tool and find out a way to integrate this tool for uploadingand simplifying the shapefiles. Since Mapshaper is an open source tool, Iwas able to get all the files and codes that the Mapshaper had used. Basedon my previous knowledge of software development, I used some debug-ging tools like firebug, notepad++, and checked the coding done for theMapshaper to answer the following questions:
• What are the mandatory files of shapefiles to display the map inMapshaper?I found that *.shp file is enough to display map on Mapshaper tool,but it is better to upload *.shp and *.dbf files together if someonewants to export the simplified coordinates and their correspondingorganization hierarchy at the same time. It is possible, since theMapshaper tool provides a feature to export the updated files at sametime.
• How does Mapshaper handle the uploaded files feature and how itreads the files?After user upload *.shp and *.dbf file for a level of organization unit,Mapshaper reads the values from these files. A map is displayedon the screen based on the coordinates from the *.shp. Files canbeuploaded by clicking the “select”button provided by the tool itself orwe can just drag the files into the page. (please refer to the section 8.1in Appendix for more detail)
• How does Mapshaper store data from the *.dbf and *.shp files?Mapshaper stores the data from uploaded *.dbf and *.shp files intoa file object with the help of MapShaper.exportContent(layers, arcData,opts). For example, in a code snippet of figure 4.5, a file object “file”iscreated to store the data. This operation can be found within the“callFunction”function of “mapshaper.js”.
• How the coordinates of an organization unit and details aboutorganization hierarchy are linked in Mapshaper?It is easy to work with JSON object than with simple file object.Therefore, the data stored in file object variable “file”can be convertedto JSON object “objJSON”variable as in figure 4.6, and this JSONobject variable can be used to perform tasks related to coordinatesand organization hierarchy.
Each organization units in the *.dbf file are linked with theircoordinates in *.shp file by common row order starting from 0.
43

Figure 4.5: Code snippet to store uploaded data in a file object
Figure 4.6: Code snippet to convert file object variable to JSON objectvariable
It means the coordinates at row number 5 of *.shp file are thecoordinates of organization unit at row number 5 of *.dbf file. Sincethese data can be stored in a JSON object “objJSON”, they can beaccessed using the code snippets given in figure 4.7 and figure 4.8. Inboth code snippets, “RowID”denotes the order of the row in *.dbf filethat also link the corresponding coordinates in the *.shp file. The codesnippet in figure 4.7 helps to get the data of a particular column (key)of a organization unit (RowID), and the code snippet in figure 4.8helps to get all the coordinates of the same organization unit (RowID).
• How can I use and display the data stored by Mapshaper from *.dbffile to the users?After identifying the relevant objects and the properties for storingthe data in the Mapshaper, a simple loop can be used for the codesnippets in figure 4.7 and 4.8, to display the data stored by theMapshaper tool.
DHIS2 Web API to import data into DHIS2
Since we had taken DHIS2 system as a case for our research, it wasnecessary to identify how we can store data related to organization unitsand their coordinates into the database of DHIS2. I found that DHIS2 hasdeveloped its Web API [26], allowing users to develop applications on topof the Web API and interact with the data stored. In order to take advantageof DHIS2 Web API, I had to study how I can integrate it in our app. For this,I studied the Web API documentation of DHIS2 [26] and found out the keymethods that are useful to connect our app and Web API and to understandthe format that the Web API accepts to store the data into the DHIS2. Thesemethods are provided below:
44

Figure 4.7: Code snippet to access the properties of a organization unit
Figure 4.8: Code snippet to access coordinates of a organization unit
• DHIS2 Web API can be enabled by including “dhis2.util.js”library inthe app [23].
• DHIS2 Web API accepts GML file format whose structure is similarto the structure shown in figure 4.9.
Figure 4.9: GML file format for DHIS2 Web API
The code snippet 4.9 provides a basic structure of the GML fileformat to import organization units and their coordinates into theDHIS2 system with the help of DHIS2 Web API. Variables suchas “shortName”, “code”, “name”, “featureType”, “coordinates”,“featuretypes”, and “coordinates”in 4.9, are the database field namesof DHIS2 to store the corresponding values from the shapefiles.
• It is possible to use AJAX script to use DHIS2 Web API toimport the data (organization units and their coordinates) intothe DHIS2 system. For that, We need to specify the URL as“<SERVER_LOCATION>/api/metadata”, use “xml”content types,and use “POST”method. “<SERVER_LOCATION>”is the server loc-ation where DHIS2 is hosted. A small code snippet for this purposeusing AJAX script to send the data to the Web API of DHIS2 which
45

is again responsible for importing the data into the DHIS2 system,could be as in figure 4.10.
Figure 4.10: AJAX script to link DHIS2 Web API and import the data intoDHIS2
4.2.3 Implementation of Alpha version of the app
Building a first level app (Alpha version) was one of our objective derivedfrom the requirement analysis of existing import functionality in DHIS2system. Since we decided to keep the projection transformation processof DHIS2 as it is, we wanted to implement coordinate simplificationand import of shapefiles data into DHIS2 in Alpha version (version c(Alpha version) in figure 4.4) of our app. This app should provideusers an interface from where they can simplify the coordinates oforganization hierarchy as well as can choose the parent and child relationbetween different level of shapefiles, while importing the organizationhierarchy with their coordinates into DHIS2. Figure 4.11 shows detailimplementation design for the Alpha version of the app.
Figure 4.11 shows three main processes: projection handling, simplify,
46

Figure 4.11: Implementation design for Alpha version of the app
and import. Here, projection-handling process works in a same way as inexisting import functionality of DHIS2. Simplfy and import functionalityhas been implemented in Alpha version. This section is sub-divided intotwo subsections based on implemented functionality in Alpha version ofthe app:
Simplify the coordinates
We selected Mapshaper tool to simplify the coordinates of the organizationhierarchy. By now, we know that Mapshaper is a standalone toolthat helps to import files like *.dbf and *.shp and shows a map inan interface. As shown in simplify process of figure 4.11, end usersafter obtaining proper projection for the shapefiles can upload *.dbfand *.shp files into the app where Mapshaper tool is integrated. Withthe help of Mapshaper tool from this app, users can simplify thecoordinates. Mapshaper provides functionality to export the simplifiedcoordinates along with their corresponding organization units into variousformats such as Shapefile, GeoJSON, and TopoJSON. Users can downloadupdated shapefiles in different format by using the property of Mapshaper.Importing these updated information into DHIS2 system automatically hasbeen implemented in the app. We will discuss about it in next subsection.Please refer to the section 4.1.4 for more details about the Mapshaper tooland section 8.1 for more information about how to upload shapefiles andsimplify the coordinates using the app.
47

Import shapefiles data into fresh DHIS2
We first wanted to import shapefiles content related to organization unitsand their coordinates into fresh DHIS2 system (DHIS2 system without anyorganization hierarchy). This app helps to display all the organization unitsfrom the uploaded *.dbf file and then allow users to map the columns ofthis file with the database fields of DHIS2. After correctly mapping thefile information with DHIS2 system, our app helps to prepare a GML fileformat that includes all the mapped organization units from *.dbf file andtheir corresponding simplified coordinates from *.shp file. The app thenimports the GML data into the DHIS2 with the help of it Web API. Figure4.12 shows detail about this “import OrgUnits”process.
Figure 4.12: Import organization units into DHIS2
When DHIS2 Web API into DHIS2 successfully imports GML data, asuccess message is displayed in the app and the process stops. Please referto the section 8.1 for more detail about displaying the organization units,mapping *.dbf file content with DHIS2 database fields, preparing GML fileformat, and sending GML file to DHIS2 Web API.
4.3 App Design: Beta version
From the implementation of Alpha version of the app, we came to knowthat it is possible to integrate Mapshaper tool to simplify the coordinateswithin the app, which again can be connected to DHIS2 system with thehelp of its Web API in order to import organization hierarchy relateddata in the form of GML data format. However, the Alpha version wasimplemented to import data for the DHIS2 database that did not have anyorganization units, which may not be the valid case for all. The Alphaversion was sent for evaluation to different implementers, and mailinglist users. With the help of their feedback and our own observation, weprepared a list of requirements/objectives/functionality to be added in thenew Beta version of the app.
This section is divided into three subsections. The first subsectionexplores different possible conditions that has to be checked whilemapping shapefiles and DHIS2 database. The second subsection explainsthe reasons for adding each functionality in the Beta version and the thirdsubsection provides a detailed implementation design of the Beta version.
48

4.3.1 Possible matching conditions
In existing DHIS2 system, GML data is imported into the system by match-ing on the name of the organization unit [15]. It means, different possibleconditions should be checked related to the name of the organization unitsbefore importing the shapefiles into the DHIS2 system, otherwise we mightprovide wrong data to the import procedure. From our observation, wefound three possible matching conditions: unique match, no match, and du-plicate match. They are explained below:
• Unique match: This is the condition that has to be checked wheninformation about an existing organization unit has to be changed, orit has to be inserted and linked with the proper parent organizationunit, while importing the shapefile contents. In first case, theorganization unit should be uniquely identified and in later case, theparent organization unit for that particular organization unit has to beidentified. In Beta version, these unique matching are performed byuniquely comparing the combination of organization unit name andcode. There can occur conflicts in both case if multiple occurrencesare found. Note that, organization unit at root level does not haveany parent and there is no need to find the unique parent.
• No match: No match condition can occur either for a new organizationunit that does not exist in the DHIS2 or for already existed record butwith different name. There is no problem to import new organizationunits but the other case should be handled properly. This caseis difficult to handle automatically and may result in wrong datainsertion if it is done automatically. Therefore, we allow users tocheck for the existing records before importing into the system. Thisreduces the risk of importing wrong information or multiple recordsfor the same organization unit.
• Duplicate match: Existence of multiple organization units with samename results in duplication of record. This condition should beavoided, since it can update all the duplicate records even whenthe update is meant for only one organization unit. There can beduplicate organization unit name in same hierarchy level or sameparent organization unit name in immediate parent level. Theseconditions should be checked both in DHIS2 database as well as in*.dbf file before the import process.
4.3.2 New import functionality
Based on the observation about possible matching conditions from sub-section 4.3.1, and with a vision of providing end users an interactive userinterface to address the possible issues during import process of the organ-ization units into the DHIS2, we formulate some functionalities for the Betaversion. Details about these objectives are provided below:
49

• Allow users to update the coordinatesAfter getting the feedback from the users, I found that lot of usershave already installed the DHIS2 and have their existing databasewith the organization units. End users of this category usually tryto update the current coordinates of the organization units into thedatabase. Earlier Alpha version was helpful for adding the neworganization units and their coordinates only in the freshly installeddatabase of the DHIS2. These requirements resulted in the decision toadd the feature that can allow users to update the existing coordinatesinto the database.
In order to add this feature in the Beta version, I had to check whatDHIS2 Web API has to offer. It was mandatory that we match thename of the organization unit exactly [15]. If there were more thanone organization units with the same name, it was possible that allorganization units would be updated with the same coordinates.
After fair analysis and testing of different GML file, it is necessaryto match the organization units name from *.dbf file with theorganization units name in the DHIS2 database, since coordinatesare linked with each organization units. While matching theorganization units name, Beta version provides two options to updatethe coordinates. The app displays the matched organization unit tothe end user if the organization unit’s names are matched with theorganization units in DHIS2 database. Otherwise, the app list all theorganization units of the same level of hierarchy from the databaseinto a select box and allow users to choose the proper matchingorganization unit. The code and id of the selected organization unitis then used to update the coordinates of that particular organizationunit in the process of importing the GML file format. If the user doesnot specify any organization unit in case of no match, the app insertsthat organization unit along with its coordinate as a new record intothe DHIS2 database.
• Allow users to choose particular organization units from the listAnother feedback was to be allowed to choose few organizationunits for import instead of importing all of them that are availablein the shapefiles. This case might occur when end users miss someorganization units into their DHIS2 system. In order to provide thisfunctionality to the users, HTML check boxes are added in the app foreach organization units from the *.dbf file. The app updates/insertsorganization units whose check boxes are checked for import. Again,before importing the selected organization units, duplicate recordscan be checked and the options to select the proper organization unitscan be provided.
• Error and success message handlingA proper message handling process is important for end users tounderstand the process or the effect of their action in any application.The Beta version of the app handles two types of messages: error
50

messages and success messages. Error messages are displayed whenthe app finds error such as duplicate records, parent not selectedfor hierarchy level more than 1, and parent not found in the DHIS2database etc., whereas success messages are displayed when the appsuccessfully performs some actions such as successfully importingthe data. In order to clearly distinguish these two types of messages,error messages are displayed with red color and success messages aredisplayed with green color.
• Ask users to provide the level of hierarchy before importing theshapefilesMapping correct parent and organization unit for each organizationunits in the shapefiles into the DHIS2 system can be very timeconsuming. The mapping process time increases with the increasingnumber of organization units available in the DHIS2 database.Therefore, it is important to narrow down the number of organizationunits to be mapped in order to import the data quickly into thesystem. By allowing users to provide the level of hierarchy, wecan limit the scope of mapping around organization units that havethe same level. If we have to find a particular organization unitfrom the database and the level of hierarchy is given, we can mapthe organization unit within that level only. This way, we can skipother organization units from mapping and the mapping processbecomes faster. The same is also valid for identifying the parent ofa particular organization unit. It is faster to search immediate parentof an organization unit, since the parent organization unit containsone level less than the child organization unit does.
• Allow users to specify the correct parentAllowing users to specify the correct parent before importing the datainto the system is also an important step. It is possible that the appwill not be able to find parents of all the organization units from thedatabase. Moreover, it is also possible that the app will find wrongparents for the organization units. This can happen due to spellingmistakes on name field of the organization units either in *.dbf file ordatabase itself, or by storing wrong code for the organization units.Therefore, before importing the data, it is better if we allow users tocheck for the correct parents and allow them to choose the correctone from the list of possible parents. The list of possible parents foran organization unit can be fetched from the database with the helpof level of hierarchy provided by the users.
4.3.3 Implementation of Beta version
Figure 4.13 shows an implementation design of beta version of theapp. There are three main processes as in alpha version but we addnew functionalities explained in subsection 4.3.2 in the import process.Projection transformation process is similar as in the existing DHIS2 system
51

and the process can be referred in section 2.3.3. The simplifying coordinatesprocess is similar as in alpha version and it can be referred in section 4.2.3.
Figure 4.13: Implementation Design of Beta version of the app
In import process, all the organization units that are uploaded fromshapefiles are displayed. These organization units are internally connectedwith their corresponding (simplified) coordinates. Before importingorganization units and their coordinates into the DHIS2 system, usersprovide hierarchy level of the uploaded shapefiles and map the correctdatabase field name with the column field of the *.dbf file. Based on theuser’s defined inputs, organization units and their parents are fetched fromthe database. Users are provided with a option to check and change parentorganization units before importing the data. If user choose this option,all the fetched parent organization units for different organization units arelisted. They can choose the correct one if the app fetches wrong parent.This process can be repeated for several time until the user gets the correctdata. After properly checking all the data, all the information should beconverted into GML file format. The app prepares GML file format thatincludes all the mapped organization units information along with their(simplified) coordinates. The app then connects to the Web API of theDHIS2 system and posts the GML data into it. The Web API on other handinserts or updates data into the DHIS2 system.
52

4.4 Tools used in the experiment
Some of the tools are used while developing and debugging the app (bothAlpha and Beta version) and they are provided in table 4.3.
SN# Tools Purpose1 Tomcat server from
XamppTo run DHIS2
2 Notepad++ As an editor3 Chrome/Firefox/ In-
ternet Explorer (versiongreater than 8) browsers
To test the app and its integration inDHIS2 system
4 JavaScript To develop the app5 Firefox firebug To debug the errors of the scripts
Table 4.3: Tools and scripts used for the implementation and debugging ofthe app
Tomcat server from Xampp was used to run the DHIS2 system on thiscomputer, Notepad++ was used as an text editor, JavaScript for developingthe app, firefox firebug to debug the errors of the JavaScript, and theapp was tested through browsers such as Chrome, Firefox, and InternetExplorer (version greater than 8).
53

54

Chapter 5
Discussion
This master thesis focuses on solving two research questions: identifyingthe potential for integrating all the necessary stages of configuring webthematic mapping for public health in resource constrained environment,and identifying the processes to leverage such platforms to make themmore generative. We decided to solve these research questions by exploringthe DHIS2 platform as DHIS2 can give us the idea about the existing issuesthat users are facing in importing the coordinates and different solutionsusers are using to solve them.
In order to solve our first research question, we identified all thenecessary steps to configure web thematic mapping for DHIS2. Thesesteps mainly include simplification of coordinates, coordinate projectiontransformations, GML file generation for organization hierarchy and theircoordinates and importing GML file into the DHIS2 platform. Please referto subsection 2.3.3 for more details about these different steps requiredfor the import functionality of the DHIS2 platform. The current importfunctionality of DHIS2 is very tedious since all these steps should befollowed separately and manually and if users do something wrong in anyone of the steps then they might not get proper data and this leads them torepeat the process from where mistake was occurred. These stages of theimport process become more difficult when the number of organizationunits and coordinates to be imported is very large. In addition, very oftenpeople need help from the expert level users. These issues are realizedmore in resource constraint environment where there are no or very lesstechnical people from whom they can get the help. In order to identify thepotential for integrating all these manual steps, it was necessary for us tounderstand different challenges that the DHIS2 users are facing and howthey want to resolve these challenges.
DHIS2 has several mailing lists such as user mailing list, developermailing list, and documenter mailing list [24]. Among these three mailinglists, we had communication between user and developer mailing listusers. From their email messages, we also found that the process ofimporting coordinates for organization units using the GML file has beenvery difficult and users consider it as a technical problem.
A GIS expert says,“HISP-SA would strongly support dropping the
55

GML step - or at least to short-cut it with an option to import shapefilesdirectly. GML adds nothing to the mix; it just makes the process morecumbersome and techie”. His comment shows how tedious this process is.Even the users with expert level of knowledge find it difficult to use thecurrent method for importing the coordinates into the DHIS2.
Another DHIS2 expert says, “As for the app, I did not try it and agreewith the <first expert> that it is much easier for people to import a shape filedirectly. However, we do not always (but usually do) have a shapefile toimport, so I would not be in favor of removing GML support at all”. Here,he supports the idea of using the shapefiles for importing the coordinatesinto the DHIS2, but does not support dropping the GML feature from theDHIS2. There are cases where the GML solution to import the coordinatesis useful. Like when the user wants to move the existing organizationhierarchy and the coordinates from some legacy system to DHIS2. Inthese cases, the app that only supports the shapefiles for importing theorganizational hierarchy and coordinates can help a very little. With thehelp of GML feature provided by DHIS2, the users can simply convertthe data from the legacy data to GML format and then import theminto the DHIS2. This expert also insists to use open source standards.He says, “From an open source point of view we should be using openstandards based approaches, like GML and other standards recommendedby OGC, instead of locking people into importing geometries with onlya single proprietary format.”According to him, it is better to followdifferent standard data format for spatial data that is recommendedby OGC standards (http://www.opengeospatial.org/standards/is). Thatway, users will be able to use multiple formats that they are comfortablewith for importing the data into the DHIS2, which I think is a good thingfrom the user’s point of view.
Similar views are shared by a DHIS2 developer. He says, “I’m not reallyseeing any reason to drop GML support altogether, but the prospect ofletting users directly import shapefiles is an interesting one for sure. I’dbe very interested to have a look”. His suggestion is to directly use theshapefile to import the organizational hierarchy into DHIS2. However, hedoes not suggest dropping GML support from the DHIS2.
Since the users are finding the import process very difficult, they arealso proposing many different alternatives that may be used to make theprocess easier in DHIS2. According to the DHIS2 developer “GML isfairly complex and I’m not really convinced moving the complexity fromestablished GIS suites like GDAL and QGIS and into DHIS2 itself is a clevermove”. Here, the DHIS2 developer is saying that it is not good to add allthe functionality that are provided by the software like QGIS in the coreDHIS2 system. These software has lots of complex features and addingall these functionality can make DHIS2 more complicated. It is better tochoose some necessary features and add them into the system. Apart fromthat, QGIS is a desktop application and it cannot be integrated with theweb application like DHIS2.
A DHIS2 user says “Usually the hardest part of this is to properly matchthe parents, so that the OU tree displays correctly, in your data file, do you
56

also have the parent OU name/code or something that can be matchedon?”According to him, the process of matching the individual organizationunits (OU) with its parent is the hardest part and wants something easierthat can help to do so.
After reviewing different comments to check how the things weredone, I did my own observations on DHIS2 especially for the importfunctionality. I came to know about different aspects of enabling thematicmapping for HIMS in resource constrained environments, with DHIS2 as acase. I understood the importance, issues, and tools that can help to resolveour research problems. Together with some of the tools and file formatsproposed by DHIS2 to import organization hierarchy and coordinates [14],I also came to know about different open source and commercial toolsthat can be used for simplifying the coordinates and convert the projectionof shapefiles. For example, Arcgis [17], which is a commercial tool fordifferent GIS related purposes and proj4js [60], which is an open source fortransforming the projections of the coordinates. In addition, I also observedsome issues in DHIS2 import functionality such as difficulty in convertingthe coordinate projection, converting shapefiles to GML file, matching theparent child relation for organization hierarchy, managing the duplicateorganization units etc.
After configuring fresh DHIS2, the first thing the user is required toenter is the organizational hierarchy. If user intends to use the GIS modulethat is integrated with the DHIS2, then user needs both organizationalhierarchy and coordinates of all the organization units and levels ofhierarchy. Since users are finding it difficult to use different tools and createGML file to import organizational hierarchy proposed by DHIS2 and toimport their coordinates for jump-starting the DHIS2, we saw a need for amethod that will help users to import the coordinates into DHIS2 withoutany help from any expert level users in resource constraint environment.After analyzing the comments and suggestions from the users about theimport functionality of DHIS2 and from the analysis about different toolsused in different steps of import process, we saw the potential to integrateall these steps into one solution but it was necessary to study in detail if wecan integrate different tools into one solution or not.
Our initial decision for the solution was to add all the basic functionsthat are required to import the organization units and their coordinatesinto the DHIS2 system. For this, we would be making the app that canchange the projections of coordinate system, simplify the coordinates, linkeach organization unit with the correct parent, prepare the GML format,and import the organization units and coordinates using the Web APIprovided by the DHIS2. Some features of the app like transformation ofcoordinates from one projection to another, finding the projection systemof the shapefiles were very complex to be implemented in a short period.Therefore, the next best solution was to use the already available opensource solutions, meaning that they are freely available. The next stepwas to test the tools for the coordinate projections transformation andsimplification of coordinates. The test included the tools that were alreadybeing used by the DHIS2 users for these purposes. For simplification of
57

coordinates, the DHIS2 system users were using the Mapshaper. We foundthat this tool can be integrated in the app and it can be used for uploadingand processing the shapefiles. Moreover, the Mapshaper can be used forother purposes like removing trimming the coordinates, checking differentirregularity in the data like removing the unsupported characters, makingthe GML format for importing the data etc. The FWtools software, whichis proposed by DHIS2 for coordinate transformation is a desktop-basedsoftware. Therefore, it cannot be integrated into the web app that we wereplanning to develop. Therefore, other alternatives were required for thispurpose. We found couple of tools that can be integrated with the web appfor the coordinate projection transformations such as ArcGIS, OpenLayers,and Pro4JS. We decided to go ahead with pro4JS, since OpenLayers usedthe Pro4JS for the transformation and ArcGIS was not an open source tool.Also, the Pro4JS provided the Web API that can be integrated with the toolthat we were planning to develop to convert the coordinate projection.
Our second research question ask to leverage the platform itself to makeit more generative. To solve this, we thought of using a generative platformwhich allows users to produce new content without doing any changein the core system. Since DHIS2 is a health information managementsystem and also a generative platform, this is where DHIS2 comes intoplace. DHIS2 platform has its own Web API which allows users to developnew apps and integrate them together without changing its core system.This enables users to be more creative and add more things that are morecustomized according to his/her needs. Therefore, using the Web APIprovided by DHIS2, we decided to develop an app and make its importfunctionality more simpler than the existing one. We used bootstrappingapproach for the development of the app, since this concept guides usto start development of the app with small requirements and then moveahead after getting the feedback and add more complex functionality. Wealso started by making a simple solution first and then by allowing usersto use the solution and getting feedback from them. Then we graduallykept on adding the complex features. It would have been very difficult forus if we had to do everything at once without getting feedbacks from theusers and without following the concept of bootstrapping. Actually, therewere two ways to develop this tool: either we could modify the core systemor we could use the Web API provided by the DHIS2 platform. Since thesecond option helps developer to add new features without modifying thecore system, we chose the second option i.e. to use the DHIS2 as a platform(please check subsection 2.2.3). This option was flexible enough and easierto develop the tool that we intend to.
We first started work for alpha version of the app to integrated allthe tools that were necessary to import the organization units and theircoordinates into the DHIS2 system. This is the first version of the app,developed to test and check how all the tools can be integrated. It alsohelps to perform all the steps necessary to be taken before user can importthe data into the DHIS2. We added necessary controls on top of userinterface provided by the Mapshaper itself to help the users to import theorganization units and coordinates into the DHIS2 system. A link between
58

shape file and dbf file was also identified, which is required to make theGML format while importing the organization units. After finding thislinkage, the alpha version could read data from Mapshaper and prepare theGML format. The next task was to send these data prepared to the DHIS2system for import and this has been done by using the Web API of DHIS2.Successful integration of DHIS2 Web API in our app helped to send datafrom our app to the DHIS2 system and now the data from the shapefilescan be directly imported into the freshly installed DHIS2 system.
Another tool to be integrated with the app was Pro4JS. There were twoways to integrate it. The first was to convert the coordinate projection ofall the coordinates in the shapefile to EPSG:4326. Another method was toallow user to simplify the coordinates and then convert them to EPSG:4326.The second option is better because there will be less coordinates aftersimplification and this would decrease the workload. While working withPro4JS api, we found that it is not able to find the coordinate projection ofthe source file. Therefore, users have to find the projection of the source andgive input to the api. This complicated our work and due to time constraint,after some exploration and testing, we decided to hold the integration ofPro4JS into the app for now. Instead, we decided to convert the coordinateprojection of shapefile to EPSG:4326 and then import them to the app tobe simplified and imported into the DHIS2. For this, users can follow thesame process that is described in the DHIS2 user guide using FWtools [14].
After some modification and testing with different shapefiles, the alphaversion was ready to be tested with some real data. We got some feedbackfrom the people who used the alpha version to import the organizationunits into DHIS2. According to a DHIS2 expert, the alpha version did notwork the way he wanted. He says, “nothing wrong at all with importingthe shape files however, but the last time I tried that client Knut, it did notwork for me (or at least the Work flow which I needed)”. According to him,what he needed was a process by which he can update the coordinates ofalready existing organization units. This feature was yet not available inthe alpha version.
A DHIS2 user in Srilanka says, “I already have some org units setupon server (upto district and few deeper). Will this app clash with existingorg units I installed a new instance of DHIS2 to just test the app. once Iupload the .shp file and .dbf the resulting table shows only upto 10 rowsis it normal. and selecting id and parent id from provinces .shp is a bitconfusing”. In this case, one thing that user is complaining is the userinterface not being clear. Another issue that he raised was, if the app thatI was developing would be able to import the new data into the DHIS2system that already has existing organization units. This feedback helpedme to know the necessity of having more user-friendly interface for the appand a need to allow users to update the existing organization units in theDHIS2 system.
These feedbacks and my observations became the basis for the devel-opment of beta version of this app. For the beta version, it was importantto handle different cases of importing data. These cases include allowingthe users to change or update the existing organization unit and coordin-
59

ates, allowing users to choose the organization that they wanted to import,change different information using the user interface and then import, al-low users to change the spelling as required in the user interface beforeimport. Alpha version was able to import the organization units for thefreshly installed DHIS2 only. Beta version needed to update the existing or-ganization units as well. Therefore, this version needed to map the existingorganization units with the new organization units from the shapefiles. Inthe alpha version, parent matching was done by using the code provided inthe organization units. However, there are some cases where it can be morecomplicated. For example, the code that is stored in the DHIS2 system maynot match the code that is available in the shapefiles. In this case, either userhas to change all the code in the DHIS2 database or in the shapefile. Theother solution is to allow user to choose the parent from the list of parentprovided by the app. Therefore, another important feature that beta ver-sion needed was to allow users to check the parent automatically linked bythe app. If there is no matching parent or wrong parent matching shownin the interface of the app, it should allow users to link the organizationunits with the correct parent organization unit from the list available. Thisfeature would help the users to link the organization units with the cor-rect parent organization unit. This way, it can help in creating the correctorganization hierarchy in the DHIS2.
After modifying the alpha to beta version, the app was tested bya core developer of DHIS2. He also gave some valuable suggestions.Some suggestions that he made are regarding the user interface and theunderstanding. One issue and the alternative suggestion he mentionedwas “What does compare actually do? Perhaps ’Map fields’ is a bettername?”. Another suggestion that he made was “Progress indicator akaspinner would be nice to show the user the ”. Sometimes it took little moretime to complete the task and there was no way to tell if the app was stillworking or not. These suggestions were quite good and these feedbackswere also updated in the beta version. His feedbacks helped me to makethe app more user friendly and responsive than before. One another issuethat he found was about not allowing users to add more than one rootelement in the DHIS2 from the app. The issue he mentioned was “Myimport of Norway was successful but it should have been created as a neworganization unit but I cannot find it back. I did not set a parent”. As soonas he added one root element, it created some conflict with the alreadyexisting root element if the root element is different. This problem is notsolved yet and it can be considered in the future work.
Both alpha and beta version of the app helped DHIS2 platform tobecome more generative. According to Zittrain [81], Ease of mastery is oneof the important criteria for any system to be generative. Ease of masteryfor a system is the easiness to use the system. Before these apps, users hadto do all the different tasks manually in order to import the organizationhierarchy and their coordinates. Based on my own observation and theexperience of the DHIS2 users, import functionality of DHIS2 is verytedious and technical. This process requires the knowledge of experts,which may not be available in resource constrained environments. The
60

alpha version of the app removed the difficulties of using different toolsfor simplification of coordinates and for the GML file generation. Itworked great for freshly installed DHIS2 system, though some users facedsome issues for already existing DHIS2 system. These issues have beenconsidered in the beta version and we have got good response from theusers too. One of the user of the beta version says “I did substract the un-needed characters and till now it works great ”. DHIS2 is a platform andit is generative in itself since it provides Web API through which differentprograms can be linked with DHIS2 without touching its core. But ourapp has made it more generative for the import functionality because thisprocess was not that easy before but now user feel easy to use it and it canbe used easily also in resource constrained environment where there maynot be any experts to handle the case.
61

62

Chapter 6
Conclusion
GIS is a very useful tool in various fields where public health is one of them.Some of its applications in public health includes disease surveillance,environmental health research, and respond to health emergencies. GISis a critical tool, which can help in quick analysis, decision making, andplanning but due to some constraints in developing countries such aslimitation of cost, infrastructure, education, and political instability, it couldbe very difficult to employ GIS. The concept of open source applicationsis very useful in such environments and the open source should be goodenough so that people in resource constrained environment can use themeasily without much support from the expert level. Therefore, this thesisfocuses on two research questions that can help to configure mappingapplication for public health even in resource constrained environment.The first research question ask to identify the potential for integrating allthe necessary stages to configure web mapping in resource constrainedenvironment and the second research question ask to use a platform itselfto make it more generative for the purpose of our first research question.
In order to achieve our goals, we studied a case of DHIS2, which is ahealth information management system and it has been employed in lotof developing countries as a solution for health information managementsystem. Organization hierarchy and their coordinates are required to jump-start the DHIS2 and there are some series of stages that has to be followedby the users in order to import these data into the system. Since these stagesof import functionality are manual, and users need to use different tools,the process is tedious and technical. There is also some level of possibilityfor human errors. Since there can be lack of experts in resource constrainedenvironment, the import process could be difficult for the users in suchenvironments. Therefore, the potential for the integration of these stagesinto one solution was identified by studying and testing different tools thatare necessary for different stages of import functionality. After knowingthat these tools can be integrated into one web solution, we decided todevelop an app that can perform all these stages with the help of minimumuser interactions.
We chose the bootstrapping concept and started developing the appwith a simple design, tested the results by limited number of users, got the
63

feedback from them and gradually added the more complex functionality.We first developed alpha version of the app where all the necessary toolswere integrated to support the import the organization units and theircoordinates. This app was developed to configure web mapping for thenewly installed DHIS2 system. The basic functions included loadingand simplification of coordinates using Mapshaper, mapping the parentorganization units using the code provided in the shapefiles, preparing theGML format of data for importing, and importing data into DHIS2 usingits Web API. We got some feedbacks for the alpha version and includedsome of the feedbacks as updates in the beta version of the app. Theupdated features in the beta version include allowing users to link theparents with the child organization units, and allowing users to update thecoordinates of the already existing organization units. The user interfacehas been also modified to make it easier to be followed by the users. Theusers were quite satisfied with the results of the apps though there is stillsome space for future work. The app has helped to make the platformmore generative than before. Although DHIS2 is a platform and supportsgenerativity, import functionality was not that easy for the general users.Our app integrated most of the stages in one solution and helped users toeasily configure the web mapping. It is useful more in resource constrainedenvironments. Therefore, we can say that our app used a generativeplatform and made it even more generative.
In conclusion, this thesis has solved both of its research questionsand the solution of this thesis could be very much useful to configureweb mapping in public health even in resource constrained environments.Moreover, this thesis also shows how the concept of bootstrapping can beused and how a generative platform can be leveraged itself to make it moregenerative.
64

Chapter 7
Future work
During this project, I faced different challenges while solving the researchproblems. Some of the challenges include project time duration, technicalissues, communication issues with the users, and limitation of real testcases. I was developing an app for the DHIS2 as a methodology to explorehow the technological advancement in software development and GIShelp the thematic mapping in public health in developing countries withresource constrained environment. Below are some of the tasks that I couldnot complete during my master thesis. These also include things that Irealized while developing the app. These remaining works and some ofmy experiences during my master thesis can be considered in future.
• Improving coding approach: While writing different functions forlinking Mapshaper, formatting the data, preparing the GML format,linking parents and user interface related functions, I have writtenall of them in JavaScript functions from the start of the coding. Inthe market there are many different JavaScript libraries like AngularJS, Knockout JS etc. which I could have used. If I had used theselibraries and followed the coding pattern, defined by these libraries,the coding pattern would have been better. However, at the laterstage of the coding due to time constrains, I could not convert all thesefunctions to follow any of these approaches. Therefore, convertingthe current codes to follow any one of these libraries is one thing thatcan be done in future.
I have changed and added codes of Mapshaper to get organizationunits data and use it for importing into DHIS2. Due to this, it is bithard for general users to use the latest version of Mapshaper easily. IfI had not mixed the codes done in Mapshaper with the coding donefor different user interface functions of the app, then it would havebeen very easy for the users to use the latest version of Mapshaperfor the same purpose. In future, it is better to separate these codes tomake them compatible even with new versions of Mapshaper.
• Need of more testing on the app: Like I have mentioned above, Iwas not able to check the issues the users face at firsthand, makingme not exposed to full extent of issues and problems that users face.
65

That means there might be some cases which are either solved bythe implementer by their own way like correcting the spelling oforganization units or issues that are not found yet. So in future, itis good to experience the issues faced by users at firsthand to knowthe issues that user face and try to handle that problem by using theapp. This way, we could immediately find out whether app couldhandle such issues or not, and modify the app if it could not handleit.
In addition, regarding the functions that I have created, more userswith different level of expertise should test it. Testing of this appby different level of expertise is important because the main goalof my thesis is to find a way so that users in resource constrainedenvironment also can import the organization and GIS data into thesystem easily. More testing with different level of users can help usto find different issues related with user interface and make it moreunderstandable and easy to use.
• Usability and ease of use: The UI design and procedure of the appseems to be little bit difficult to follow. One of the reasons might bebecause of less user guide to handle the situation. There are fewthings to understand and I believe it can be fixed with each newfeedback and suggestion from the user and our own observations.The main purpose of this thesis is to understand and give a solutionto users to import the organization units and their coordinates intothe health management system, mainly in the developing countrieswhere there is issue of resource constraints. The solution should beable to import into the system without or with very less guidanceand jump-start the system. In my study, I took the DHIS2 as my casestudy. So better user interface is the key to make user comfortableand to make them feel easy to import the data into DHIS2.
• Coordinate Transformation: There are many coordinate projectionsystems available. All the GIS enabled system might be usingdifferent coordinate projection. In my case i.e. DHIS2, it onlysupports EPSG:4326. The coordinate projection of shapefiles dependson the provider, which can vary and may not match what DHIS2requirement. So, such coordinates other than EPSG:4326 projectionneeds to be converted to EPSG:4326 before importing them intothe DHIS2. DHIS2 has suggested to use FWTools to convert thetransformation from any projection to EPSG:4326. My original planwas to integrate an open source transformation tool in the app thatwill help users to transform the coordinate projection to EPSG:4326.I decided to use an api provided by Proj4JS for this purpose. Butsince this api cannot identify the coordinate projection of shapefiles, Idecided to halt the idea of integrating this tool for now. In future,I can see two ways of integrating the coordinate transformationin the app. One way could be to find a new Web API that canidentify the projection in the shapefiles and transform it to EPSG:4326
66

and another could be to use the Proj4JS and ask users to identifythe projection and provide the source coordinate projection in theshapefiles. That way the api provided by Proj4js can transform it toEPSG:4326.
• Topojson format: TopoJSON is a format that stores coordinatesgeometries like in shapefiles and GeoJson. It is basically an extensionof GeoJSON [5]. For any web mapping applications, the file size andthe complexity of geometry is very important. Bigger the size andcomplexity, greater the lag will be while downloading and displayingthe maps in the web browser. Simplification of geometry is importantto ease the file transfer and to get the interactive maps. GeoJSONis simple and convenient but is not compact enough. GeoJSONalso lacks topological information needed for application such asgeometry simplification, colouring and cartograms. Therefore,TopoJSON format was proposed to solve the issue of both the size ofthe file and simplification [20].The TopoJSON format geometries arestitched together from a shared line segments called arcs, and doesnot represent geometries discretely. TopoJSON files are said to beapproximately 80% smaller or more than GeoJSON equivalents whenfixed-precision encoding for coordinates are combined [20].
In case of DHIS2, shapefiles are often used to import organizationunits and coordinates but shapefiles of countries can be very large.They contain coordinates for detail map, which is not required in webbased application and needs to be simplified to reduce the size of thefile before using it. In TopoJSON however the size of the files forthe same organization hierarchy is very small. After following thesteps listed in http://zevross.com/blog/2014/04/22/spatial-data-on-a-diet-tips-for-file-size-reduction-using-topojson/ URL to convertshapefile into TopoJSON, I found that the size of TopoJSON wasgreatly reduced even without doing any kind of simplification. Sinceit is necessary to simplify map in DHIS2 to be suitable for resourceconstrained environment, TopoJSON format is worth testing furtherin the future for DHIS2. The current version of DHIS2 does notsupport the TopoJSON format. Since this is entirely new formatthan the shapefiles, simple changes in app is not enough to supportTopoJSON currently. It requires modifying the core of DHIS2 modeland api first.
67

68

Bibliography
[1] http://www.esri.com/software/arcgis/arcgisengine. [Accessed:march, 2015].
[2] http://www.geotools.org/. [Accessed: march, 2015].
[3] http://sharpmap.codeplex.com/. [Accessed: march, 2015].
[4] http://fwtools.maptools.org/. [Accessed: march, 2015].
[5] https://github.com/mbostock/topojson/wiki/Introduction. [Ac-cessed: july, 2015].
[6] Arcgis shapefile desc. http://help.arcgis.com/en/arcgisdesktop/10.0/help/index.html#/What_is_a_shapefile/005600000002000000/.[Accessed: March 2015].
[7] Dhis deployments. https://www.dhis2.org/deployments. [Accessed:March 2015].
[8] Geography markup language (gml) - extended schemas and encodingrules. http://www.opengis.net/spec/GML/3.3. [Accessed: March 2015].
[9] Gml open geospatial. http://www.opengeospatial.org/standards/gml.[Accessed: March 2015].
[10] Install apps in dhis 2. https://www.dhis2.org/doc/snapshot/en/developer/html/ch02s03.html.[Accessed: March 2015].
[11] Shapefile extensions. http://help.arcgis.com/en/arcgisdesktop/10.0/help/index.html#/Shapefile_file_extensions/005600000003000000/.[Accessed: March 2015].
[12] Esri shapefile technical description. http://www.esri.com/library/whitepapers/pdfs/shapefile.pdf,July 1998. [Accessed: March 2015].
[13] DHIS 2. Chapter 1. what is dhis 2?http://www.dhis2.org/doc/snapshot/en/user/html/ch01.html,2013. [Accessed November, 2013].
[14] DHIS 2. Chapter 18.2. importing coordinates.http://www.dhis2.org/doc/snapshot/en/user/html/ch18s02.html,2013. [Accessed November, 2013].
[15] DHIS 2. Chapter 20. import and export. ht-tps://www.dhis2.org/doc/snapshot/en/user/html/ch20.html,2014. [Accessed January, 2014].
69

[16] Margunn Aanestad and Tina Blegind Jensen. Building nation-wide information infrastructures in healthcare through modularimplementation strategies. Journal of Strategic Information Systems,page 161?76, 2011.
[17] ArcGIS. http://www.esri.com/software/arcgis.
[18] Geoscience Australia. Coordinate reference systems in quantumgis. http://www.ga.gov.au/webtemp/image_cache/GA20953.pdf, 2014.[Accessed January, 2014].
[19] M. Beer, M.C. Meier, B. Mosig, and F. Probst. A prototype forinformation-dense it project risk reporting: An action design researchapproach. In System Sciences (HICSS), 2014 47th Hawaii InternationalConference on, pages 3657–3666, Jan 2014.
[20] Michael Bostock and Jason Davies. Code as cartography. CartographicJournal, The, pages 129–135, May 2013.
[21] Christina Yip Chung, Raymond Lieu, Jinhui Liu, Alpha Luk, Jianch-ang Mao, and Prabhakar Raghavan. Thematic mapping - from un-structured documents to taxonomies. In Proceedings of the Eleventh In-ternational Conference on Information and Knowledge Management, pages608–610, New York, NY, USA, 2002. ACM.
[22] Robert M. Davison, Maris G. Martinsons, and Ned Kock. Principles ofcanonical action research. Information Systems Journal, 14:65–86, 2004.
[23] DHIS2. https://www.dhis2.org/doc/snapshot/en/developer/dhis2_developer_manual.pdf.[Accessed: march, 2015].
[24] DHIS2. https://www.dhis2.org/contact.
[25] DHIS2. Chapter 18. dhis as a platform. ht-tps://www.dhis2.org/doc/snapshot/en/implementer/html/ch18.html.[Accessed: march, 2015].
[26] DHIS2. Chapter 30. web api. ht-tps://www.dhis2.org/doc/snapshot/en/user/html/ch30.html.[Accessed: march, 2015].
[27] DHIS2. Thematic mapping. ht-tps://www.dhis2.org/doc/snapshot/en/user/html/ch17s02.html.
[28] Li Dong and Jin Shangjie. Website construction based on web2.0technology. In Computer Science and Society (ISCCS), 2011 InternationalSymposium on, pages 3–6, July 2011.
[29] Molang Dong, Weiji Su, Lin Zhang, and Xiuming Shan. The conceptof modularity design in software radio. In Wireless Communications,Networking and Mobile Computing, 2008. WiCOM ’08. 4th InternationalConference on, pages 1–3, Oct 2008.
70

[30] Joseph F. Dracup. Noaa history, geodetic surveying.http://www.history.noaa.gov/stories_tales/geod1.html, 1940.[Accessed January, 2015].
[31] S.M. Elaluf-Calderwood, B.D. Eaton, C. Sorensen, and Y. Yoo. Controlas a strategy for the development of generativity in business modelsfor mobile platforms. In Intelligence in Next Generation Networks (ICIN),2011 15th International Conference on, pages 271–276, Oct 2011.
[32] ESRI. http://www.esri.com/. [Accessed: November, 2013].
[33] ESRI. http://support.esri.com/en/knowledgebase/techarticles/detail/29129.[Accessed: march, 2015].
[34] ESRI. http://webhelp.esri.com/arcgisdesktop/9.3/index.cfm?id=1658&pid=1651&topicname=Simplify_Polygon_(Data_Management).[Accessed: march, 2015].
[35] ESRI. http://support.esri.com/es/knowledgebase/techarticles/detail/24893.[Accessed: march, 2015].
[36] ESRI. Esri map projection. http://support.esri.com/en/knowledgebase/GISDictionary/term/projection, 1998. [Accessed January, 2015].
[37] Joy Frechtling. The 2002 User-Friendly Handbook for Project Evaluation.National Science Foundation, Directorate for Education and HumanResources, 2002.
[38] GADM. Global administrative areas. http://gadm.org/, 2013. [Ac-cessed November, 2013].
[39] GitHub. https://github.com/mbloch/mapshaper. [Accessed: march,2015].
[40] Shirley Gregor. The nature of theory in information systems. MIS Q.,30(3):611–642, September 2006.
[41] Egon G Guba and Yvonna S Lincoln. Effective evaluation. San Francisco: Jossey-Bass Publishers, 1st ed edition, 1981.
[42] Lars Gunnar and Trond Andresen. Application of open source gis indistrict health information system. Master’s thesis, University of Oslo:Department of Informatics, 2005.
[43] O. Hanseth and M. Aanestad. Design as bootstrapping. on theevolution of ict networks in health care. Methods of Information inMedicine, 42(4):385–391, May 2003.
[44] Ole Hanseth and Kalle Lyytinen. Design theory for dynamiccomplexity in information infrastructures: the case of buildinginternet. JIT, 25(1):1–19, 2010.
[45] M. Harrower and M. Bloch. Mapshaper.org: a map generalization webservice. Computer Graphics and Applications, IEEE, 26(4):22–27, 2006.
71

[46] Alan R. Hevner, Salvatore T. March, Jinsoo Park, and Sudha Ram.Design science in information systems research. MIS Q., 28(1):75–105,March 2004.
[47] Michael Himsolt. Gml: A portable graph file format. http://www.fim.uni-passau.de/index.php?id=17297&L=1. [Accessed January, 2014].
[48] Otto Huisman and Rolf A. de By, editors. Principles of GeographicInformation Systems: an Introductory Textbook. The InternationalInstitute for Geo-Information Science and Earth Observation (ITC),2009.
[49] S. Huynh and Yuanfang Cai. An evolutionary approach to softwaremodularity analysis. In Assessment of Contemporary ModularizationTechniques, 2007. ICSE Workshops ACoM ’07. First International Workshopon, pages 6–6, May 2007.
[50] Lili Jiang, Qingwen Qi, and An Zhang. The thematic mapping systemon internet. In Geoinformatics, 2010 18th International Conference on,pages 1–4, June 2010.
[51] Martin Kretzer and Alexander Maedche. Generativity of businessintelligence platforms : A research agenda guided by lessons fromshadow it. MKWI 2014 Proceedings, 2014.
[52] Naresh Kumar. Changing geographic access to and locationalefficiency of health services in two indian districts between 1981 and1996. Social Science & Medicine, 58(10):2045 – 2067, 2004.
[53] D. H. Maling. Coordinate systems and map projections for gis. http://www.spatial.maine.edu/~beard/Lectures510/Projections%2004.pdf, 2004.[Accessed January, 2015].
[54] mapshaper. mapshaper. http://mapshaper.org/, 2013. [AccessedNovember, 2013].
[55] Salvatore T. March and Gerald F. Smith. Design and natural scienceresearch on information technology. Decis. Support Syst., 15(4):251–266,December 1995.
[56] Brain E. Mennecke and Jr. Lawrence A. West. Geographic informationsystems in developing countries: Issues in data collection, implement-ation and management. Journal of Global Information Management, 9(4),2001.
[57] Luciana D’Adderio Neil Pollock, Robin Williams. Global software andits provenance: Generification work in the production of organiza-tional software packages. Social Studies of Science, 32(2):254–280, 2007.
[58] International Association of Oils & Gas Producers. Epsg geodeticparameter registry. http://www.epsg-registry.org/. [Accessed:march, 2015].
72

[59] OpenLayers. http://dev.openlayers.org/docs/files/OpenLayers/Projection-js.html. [Accessed: march, 2015].
[60] World Health Organization. Introduction to the healthmapper.http://www.who.int/hac/techguidance/training/predeployment/Health%20Mapper.pdf.[Accessed: march 2015].
[61] PostGIS. http://postgis.net/. [Accessed: March 2015].
[62] proj4js. http://proj4js.org/. [Accessed: march, 2015].
[63] Mullner RM, Chung K, Croke KG, and Mensah EK. Geographicinformation systems in public health and medicine. Journal of medicalsystems, 28(3):215–21, june 2004.
[64] David J. Rogers and Sarah E. Randolph. Studying the globaldistribution of infectious diseases using gis and rs. Nature ReviewsMicrobiology, 1(3):231–237, 2003.
[65] Bjørn Sandvik. Using kml for thematic mapping.http://thematicmapping.org/downloads/Using_KML_for_Thematic_Mapping.pdf,August 2008.
[66] Maung K. Sein, Ola Henfridsson, Sandeep Purao, Matti Rossi, andRikard Lindgren. Action design research. MIS Q., 35(1):37–56, March2011.
[67] Neil G Sipe and Pat Dale. Challenges in using geographic informationsystems (gis) to understand and control malaria in indonesia. Malaria,2(36), 2003.
[68] Espen Skorve and Margunn Aanestad. Bootstrapping revisited:Opening the black box of organizational implementation. FirstScandinavian Conference on Information Systems, SCIS 2010, LNBIP60:111?26, 2010.
[69] Knut Staring. Organizational open source in the Global South: Scaffoldingimplementation based distributed development. PhD thesis, University ofOslo, 2011.
[70] United states census bureau. 2013 tiger/line shapefiles.http://www.census.gov/geo/maps-data/data/pdfs/tiger/tgrshp2013/TGRSHP2013_TechDoc_Ch3.pdf, 2013. [Accessed December, 2013].
[71] David Tilson, Kalle Lyytinen, and Carsten Sørensen. Researchcommentary—digital infrastructures: The missing is research agenda.Info. Sys. Research, 21(4):748–759, December 2010.
[72] Amrit Tiwana, Benn Konsynski, and Ashley A. Bush. Platformevolution: Coevolution of platform architecture, governance, andenvironmental dynamics. Information Systems Research, 21(4):675 – 687,2010.
73

[73] UiO. The process of developing the dhis.https://www.mn.uio.no/ifi/english/research/networks/hisp/hisp-history.html. [Accessed: march, 2015].
[74] Nisha V, Gad SS, Selvapandian D, Suganya V, Rajagopal V, Suganti P,Balraj V, and Devasundaram J. Geographical information system (gis)in investigation of an outbreak. The journal of communicable diseases,37(1):39–43, Mar 2005.
[75] Jan Henrik Øverland. An open source approach to improving gisimplementations in developing countries. Master’s thesis, Universityof Oslo: Department of Informatics, 2010.
[76] Charles-Edward Amory Winslow. The untilled fields of public health.Science, 51(1306):23–33, 1920.
[77] Liutong Xu, Xiaoting Fu, Hao Lin, Yupeng Xiao, and Juan Yang.Thematic maps service for gis based urban pipe network visualizationsystem. In Information Technology and Applications, 2009. IFITA ’09.International Forum on, volume 1, pages 131–134, May 2009.
[78] Youngjin Yoo. The tables have turned: How can the informationsystems field contribute to technology and innovation managementresearch? J. AIS, 14(5), 2013.
[79] F.B. Zhan, Yongmei Lu, A. Giordano, and E.J. Hanford. Geographicinformation system (gis) as a tool for disease surveillance and envir-onmental health research. In Services Systems and Services Manage-ment, 2005. Proceedings of ICSSSM ’05. 2005 International Conference on,volume 2, pages 1465–1470 Vol. 2, June 2005.
[80] Zhang Zhen, Jin Jing-min, and Liu Fang. The application of geo-graphic information system (gis) in the field of public health. InGeoscience and Remote Sensing (IITA-GRS), 2010 Second IITA Interna-tional Conference on, volume 2, pages 442–445, Aug 2010.
[81] Jonathan Zittrain. The generative internet. Harvard Law Review (119),pages 1974 – 2040, 2006.
74

Chapter 8
Appendix
8.1 Implementation and User Manual for the app
This section explains the implementation of an app, specifically designedfor the DHIS2 system, in order to import the organizational units for aparticular level of a country with their simplified coordinates.The app usesMapshaper tool and adds two features into it so that it becomes usefulfor the DHIS2. The two features added in the Mapshaper are: i) listingthe organizational units for a particular level and associating them to thedatabase structure of DHIS2, and ii) importing the simplified coordinatesand organisation units of that level and storing them in the DHIS2. Withsimplified coordinates, maps can be loaded quickly even in the resourceconstraint environment.
This app provides these two features by implementing two graphicaluser interfaces (GUI) within "Org List" and "Show Map" menus in thetoolbar of the Mapshaper tool.This section is further divided into foursubsections: first subsection explains how the organizational units relatedfiles can be uploaded in the Mapshaper tool, second subsection explainshow the menus can be added in the Mapshaper toolbar, third subsectionprovides detail about the implementation and functionalities of the GUIfor "Org List" and the third subsection explains about the "Show Map"functionality.
8.1.1 Upload files for organizational units and their coordinates
This section describes how the *.dbf and *.shp files can be uploaded inthe Mapshaper. There are two ways to upload files in Mapshaper: oneby dragging and moving the file (figure 8.1) and another by clickingthe select button (figure 8.2).The Mapshaper tool already provides thesefunctionalities.
8.1.2 Adding menus in Mapshaper toolbar
This app adds two new menus "Org List" and "Show Map" which arehighlighted with yellow color at top right side of the Mapshaper toolbar in
75

Figure 8.1: Select and Drag upload
Figure 8.2: Select upload button upload
the figure 8.3. Figure 8.4 shows a Mapshaper toolbar before adding thesetwo menus.Mapshaper shows this toolbar only after uploading the files.
How to add menus in Mapshaper toolbar
Figure 8.3: Mapshaper tool Original
The "Org List" menu has been added with a purpose to allow users tolist the imported organizational units from the *.dbf file and associate themto the organizational unit database table in the DHIS2 so that the new datacan be stored in a structured way in DHIS2 system.
After user click "Org List" menu, the map displayed in the page is
76

Figure 8.4: Modified Mapshaper tool
hidden
8.1.3 Functionalities of Org List menu
This menu provides a simple GUI as shown in figure for listing theimported organizational units and associating them to the correspondingdatabase fields of the DHIS2 system. We divide this subsection into threesmaller parts based on the number of functionalities of this GUI.
Figure 8.5: Functionalities of Org List Menu
List the organizational units
One of the feature of this GUI is to list the number of organizational units ina similar way as it appears in the uploaded *.dbf file.The tabular structurein the figure8.5 shows the list of organizational units data for a particularlevel once the *.dbf file is uploaded. The column names are the same as in*.dbf file and maximum 10 rows from the file are listed at first (if there areorganizational units more than 10) in order to show the users what dataand columns are there in the file.
77

Associate imported data with DHIS2 database
This GUI also helps to link the column fields of *.dbf file with the databasefields of DHIS2 so that the selected organizational units can be importedinto the DHIS2 system in a proper way. This feature is provided by the"Choose Columns" box in figure 8.5. DHIS2 stores organizational unit datain "organisationunit" table and levels in . Figure 8.6 shows the structure ofthis table.
Figure 8.6: Columns Organisation Unit table
Labels such as ID, Parent ID, Name, Short Name, Level on left side ofeach list box within "Choose column" box of the GUI represents the code,code, name,shortname,.., fields of the database table "organisatoinunit".Each list box lists all the headings available in each column of the *.dbffile. If the file to be imported is for the first level, only two fields (ID andName) are mandatory otherwise Parent ID field is also mandatory. Userwho uses this app should be aware of the structure of the *.dbf file and howthe data can be linked to the database of the DHIS2 system.The user shouldselect the proper values from the list box based on his/her knowledge;otherwise, there could be mistakes while importing the data into the DHIS2system. Explanation of each label inside the "Choose Column" box andhow the values should be selected for these labels are provided below:1. ID: This label helps to link the unique values of the organization unitfrom the *.dbf file into the DHIS2. A care should be taken while selectinga particular column heading, since the selected column values should beunique even with the previous levels of the organization unit. For examplein figure 8.7, the first file "LBR_adm0.dbf" contains the organizational unitfor level 1, "LBR_adm1.dbf" file for level 2, "LBR_adm2.dbf" file level 3, and"LBR_adm3.dbf" file for level 4.
78

Figure 8.7: Matching ID in dbf files
If we want to import all the organizational units from level 1 to level4 into the DHIS2 system, we first start with uploading and populating"LBR_adm0.dbf" which can be viewed as in figurefig:MatchingIDindbffiles.Now, we need to select the column with unique values from the populatedcontent to map with the ID field. We can easily see that there is onlyone organization unit and all the fields are unique. Let’s say we selectedID_0 column as its ID. While importing the organization units for level 2from the "LBR_adm1.dbf" file, we again follow the same procedure andselect the appropriate column from the populated content whose valuesshould be unique to the values of the previously mapped column withID field of the previous levels (in our case ID_0 for level 1). Let’s say wewant to select ID_1 to link with ID field for level 2. The value of ID_0(127) is not available in ID_1 column. It means, if we map ID_1 with ID,the values are still unique. Therefore, mapping ID_1 with ID field forsecond level of organization units could be a valid choice. Now, if wewant to import organization units for level 3 into the DHIS2 system, weupload the "LBR_adm2.dbf" file, populate them and select the appropriateunique column to map the ID. If we decide to choose ID_2, the values arenot unique with the values of ID_1. ID_2 contains values like 1, 2, 3, 4which are already available in ID_1. Therefore, we might select NAME_2in this case, which is unique from the values of NAME_0 and NAME_1columns.Similarly, if we want to import the organizational units of level 4,we upload the "LBR_adm3.dbf" file and we again need to select the propercolumn from the file to link with the ID. In this case, ID_3 column valuesare not unique. It contains 127 value, which is already available in ID_0column of level 1. Therefore, we may choose NAME_3 column to mapthe ID in this case. The value mapped with ID field is stored in "code"field of "organisationunit" table of the DHIS2 database.This field has typeVARCHAR, which means we can store both number and strings into it.Now, after saving this value in the code field, app can use this value to linka particular organization unit in *.dbf file with its respective organizationunit in DHIS2. This "code" field can also be used to find out the parentorganization unit’s UID and name from the DHIS2 database.
• Parent ID:This label helps to associate the parent organization unit to
79

all the organizational units of a *.dbf file which will be further usedto find a particular parent UID in the DHIS2 database. The selectionof equivalent parent id from the populated content is quite straightforward; the column name, which was selected for ID in previouslevel, will be the Parent IDfor this level. For example, by considering the example explained formapping ID to the column of populated organization hierarchy, theuser should select the Parent ID for level 2 as ID_0, ID_1 for level 3,and NAME_2 for level 4. Mapping the Parent ID is optional, if theuploaded organization unit is of level 1.
• Name: This helps to link the name for the organization units from the*.dbf for the imported organization unit. This is a mandatory field butnot necessarily unique. There are cases where parent organizationunit might have the same name as of the child. However, it is ofcourse a good practice to make this unique while importing the datainto DHIS2. This helps to remove the confusion.
• Short Name:This helps to link the short name of the organization unit,if this field is available in the *.dbf file. This field is not mandatorysince all *.dbf file may not have this column field.
• Level: This is a field to be added by the user and it denotes the levelof the current organization unit in the organization hierarchy. Thisfield value is useful while comparing and importing the value intothe DHIS2 system.
Display all Organisation Unit
This is a feature provided by a checkbox outside the "Choose Column"box with the label "Display all Organization Units". This checkbox whenchecked helps to list all the values from *.dbf file in the GUI at once.
Compare the organization units
Importing organization unit’s hierarchy is a difficult part. One may not getthe desired output or hierarchy, if the organizational units are importedwithout properly linking with their parents. Once the link betweenDHIS2 database-table-fields and their corresponding column names fromthe *.dbf file are established, it is important to compare if there is stillany conflict between them or not before importing into the system. Thisfeature has been added with the objective to resolve the conflicts betweenorganization units that are already available in the DHIS2 system andthe new organization units that have to be imported. It allows usersto change the mapping in case of conflict. This feature compares boththe organization units (from DHIS2 system and that from the *.dbf file)and display a table to do modification, based on the mapping done from"Choose Columns" box. For example in figure 8.7, ID is mapped withNAME_2, Parent ID with NAME_1, Name with NAME_2, Short Name
80

with Name_2 and Level with 3 inside the "Choose Columns" box. Afterclicking the compare button outside the "Choose Columns" box, a tableis displayed with the organization units values mapped with the existingorganization units from the DHIS2. Note that the columns are displayedaccording to the selected column names in "Choose Columns" box.
Figure 8.8: User Interface when compare button pressed
There could be conflict on selected column name for mapping theParent Id from the previous level. If there is no conflict on mapping theParent Id, the app finds the corresponding parent organization unit fromthe DHIS2 system and display it (name with the combination of parentname and UID) in the Parent column of the table. This parent name alsohas a link so that it can be modified if it is not correct. In case of conflict,an error message is displayed stating "select parent" with link to modify it.There could also be conflict on duplicate names for the organization unitsin parent level or same levels. The names are displayed within the textbox.If user wants to remove the duplicate names, he/she can modify them.
Import Data into the system
This function will prepare the data from the table in the GML formatfor importing them into the DHIS2 system. If the user has chosen onlyfew organization units (possible from the compare functionality with thehelp of checkboxes in import column) to import, then only those selectedorganization units are imported into the database of the DHIS2 system.
8.1.4 Functionalities of Show Map menu
When Org List button is clicked, the map is made hidden. If user needsto review the map, user can use the show map button at the top. Thiswill show the map and hide the tables and other UI fields. Now user canwork with the map and check other details here. The coordinates related toorganization units can be simplified and updated from here.
81

Figure 8.9: Show Map button to display the map
8.2 Setting the app in DHIS2
Installing the app in the DHIS2 system can be explained stepwise as below.For more detail please refer to [10].
i. Open the "App Management" page by clicking the "Apps" link fromthe top right corner of the DHIS2 system. Figure 8.10 displays this option.
Figure 8.10: Open App Management Page
ii.The user needs to configure two options for the app before installingthe app into the DHIS2 system. These two options are setting the "Appinstallation folder" where the uploaded app will be stored, and another
82

is the "App base URL" which represents a location of where the app canbe found on the web.These two options can be changed by clicking the"Settings" link at right hand side of the "App Management" page. Figure8.11 shows this option.
Figure 8.11: Setting path for App installation folder and App base URL
iii. Now the app can be installed by opening the "Installed Apps" linkat left hand side of the "App Management" page and uploading the zip filefor the app (in our case, the app is provided in a zip file format).File canbe uploaded by clicking the "choose file" button on the page as shown infigure 8.12
Figure 8.12: Select the zip file of app for installing app in DHIS2
iv. After uploading the correct zip file, the app gets installed and anotification about the installation is provided as in figure 8.13.
v. After few seconds of displaying the successful installation message,
83

Figure 8.13: Confirmation after app is installed
the user should be able to see the uploaded app "MapshaperLoader" in ourcase in the same screen 8.14
Figure 8.14: Installed app is displayed in the list
vi. In order to open and use the app, click the "Installed Apps" at lefthand side of the "App Management" page and click on the installed app.In our case, "MapshaperLoader" has been installed and clicking that appname opens it as in figure 8.15 and user can start to upload the requiredfiles and import the organization units and their coordinates into the DHIS2system.
Figure 8.16is the main page of "MapshaperLoader" app that is runningin DHIS2.
84

Figure 8.15: Run the MapshaperLoader
Figure 8.16: Front page of MapshaperLoader
85