encinal wharf schematic structural design engineering criteria · 01/11/2017 · encinal wharf –...
TRANSCRIPT
Encinal Wharf – Schematic Structural Design – Engineering Criteria
Encinal Wharf Schematic Structural Design
Engineering Criteria
Rev No 0 1 2
Issue Purpose
ECRB Review
Date 10/2/2017
By MIP
Checked AB, ST
Approved BP
Prepared for: North Waterfront Cove, LLC
Prepared by:
2185 N. California Blvd., Suite 500 Walnut Creek, CA 94596

Encinal Wharf – Schematic Structural Design – Engineering Criteria
ES-1
Executive Summary
As part of redevelopment at the Encinal Terminals Project, this Engineering Criteria has been developed to define the methodologies and assumptions to be utilized for detailed design of any modifications to the Existing Wharf Structure. All analysis and design to be performed as part of this project shall be in material agreement with this document. This document will be revised as project development proceeds and as any changes are made to the criteria herein.

Encinal Wharf – Schematic Structural Design – Engineering Criteria
i
Table of Contents
1 INTRODUCTION .............................................................................................. 3
1.1 Background ........................................................................................ 3
1.2 Planned Development ........................................................................ 6
1.3 Reference Design Codes ................................................................... 7
1.4 Wharf Functional Requirements ....................................................... 7
1.5 Seismic Design Philosophy ............................................................... 7
1.5.1 Performance Based Design ...................................................... 7
1.6 Code Design Requirements ............................................................... 9
2 ENCINAL WHARF SITE ENVIRONMENTAL CONDITIONS ......................... 10
2.1 Datum ................................................................................................ 10
2.2 Tides .................................................................................................. 10
2.3 Sea Level Rise .................................................................................. 11
2.4 Wind ................................................................................................... 11
2.5 Wave and Current ............................................................................. 11
2.6 Geotechnical Information and Seismic Hazards............................ 11
2.6.1 Design Spectra ........................................................................ 11
2.6.2 Kinematic Loading ................................................................... 11
3 MATERIALS................................................................................................... 12
3.1 Existing Materials ............................................................................. 12
3.1.1 Material Testing Results .......................................................... 12
3.1.2 Assumed Existing Material Strengths ...................................... 12
3.2 New Materials ................................................................................... 13
3.3 Nonlinear Material Properties .......................................................... 14
4 LOADS AND LOAD COMBOS ...................................................................... 15
Encinal Wharf – Schematic Structural Design – Engineering Criteria
i
4.1 Dead Load ......................................................................................... 15
4.2 Live Load ........................................................................................... 15
Vehicle Live Loads .................................................................. 15
4.2.1 15
4.3 Wind Load ......................................................................................... 16
4.4 Wave and Current Load ................................................................... 16
4.5 Earthquake ........................................................................................ 16
4.5.1 Earthquake – Displacement Based (Pushover) Evaluation (Inertial Only) ...................................................................................... 16
4.5.2 Earthquake –Kinematic Displacement (Kinematic, Inertial + Kinematic) .......................................................................................... 20
4.6 Load Combinations .......................................................................... 21
5 SOIL PROPERTIES ....................................................................................... 22
5.1 Soil Springs ...................................................................................... 22
5.2 Pile Axial Capacity ............................................................................ 23
6 STRUCTURAL MODELING AND ANALYSIS ............................................... 24
6.1 Modeling of Kinematic Load ............................................................ 31
6.2 Shear Rupture of Timber Piles In Ground ...................................... 33
6.3 Modeling of Combined Kinematic and Inertial Loading ................ 35
7 STRUCTURAL STRENGTHENING (AS NECESSARY) ............................... 36
8 PROJECT REFERENCES ............................................................................. 37

Encinal Wharf – Schematic Structural Design – Engineering Criteria
3
1 Introduction
As part of redevelopment at the Encinal Terminals Project, this Engineering Criteria has been developed to define the methodologies and assumptions to be utilized for detailed design of any modifications to the existing wharf structure. All analysis and design to be performed as part of this project shall be in material agreement with this document. This document will be revised as project development proceeds and as any changes are made to the criteria herein.
1.1 Background
There are three structures at the Encinal Wharf Terminal: the 1924 C1 structure, the 1960 C2 structure, and timber wharf, as shown in Figure 1. The timber wharf was determined to be unsalvageable and is to be removed as part of the construction. Some portions of the timber wharf will be reconstructed, as identified in the Encinal Terminals Master Plan dated July 7, 2017.
The 1924 C1 structure is a 1,500-ft long marginal wharf consisting of 18” diameter timber piles with concrete pile jackets supporting an 8” concrete slab, as shown in Figure 2. Limited drawings are available for this structure.
The 1960 C2 structure is a 800-ft long marginal wharf consisting of 18” octagonal precast piles with cast-in-place pilecaps and 24” concrete deck. No drawings are available for the C2 structure and limited destructive investigation was performed.

Encinal Wharf – Schematic Structural Design – Engineering Criteria
4
Figure 1: Existing C1 and C2 Structures at the Encinal Terminals Wharf
Timber Structure
C1 Structure
C2 Structure
N

Encinal Wharf – Schematic Structural Design – Engineering Criteria
5
Figure 2: Existing C1 Structure Timber Pile with Concrete Pile Jacket
Encinal Wharf – Schematic Structural Design – Engineering Criteria
6
1.2 Planned Development
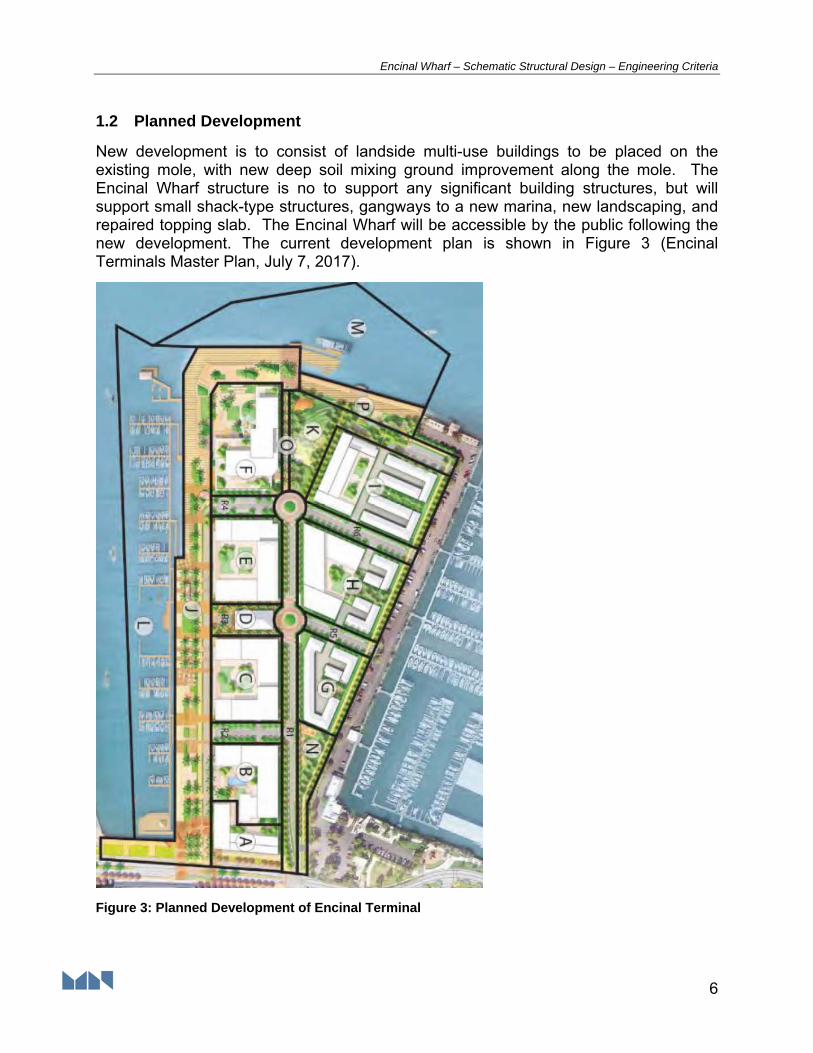
New development is to consist of landside multi-use buildings to be placed on the existing mole, with new deep soil mixing ground improvement along the mole. The Encinal Wharf structure is no to support any significant building structures, but will support small shack-type structures, gangways to a new marina, new landscaping, and repaired topping slab. The Encinal Wharf will be accessible by the public following the new development. The current development plan is shown in Figure 3 (Encinal Terminals Master Plan, July 7, 2017).
Figure 3: Planned Development of Encinal Terminal

Encinal Wharf – Schematic Structural Design – Engineering Criteria
7
1.3 Reference Design Codes
Design codes for this project include the following:
Building Code:
o 2016 California Building Code (CBC)
o 2016 California Existing Building Code (CEBC)
o ASCE Standard ASCE/SEI 7-16: “Minimum Design Loads for Buildings and Other Structures” (ASCE 7)
o ASCE/COPRI Seismic Design of Piers and Wharves 61-14 (ASCE 61-14)
o CBC Chapter 31F - Marine Oil Terminal Engineering and Maintenance Standards (MOTEMS)
Material Code
o AISC Steel Construction Manual, 14th Edition (AISC)
o ACI 318-14 Building Code Requirements for Structural Concrete and Commentary (ACI)
1.4 Wharf Functional Requirements
The following discusses the functional requirements of the wharf which shall be satisfied by the final design.
40 year design life
The wharf shall satisfy the seismic design criteria discussed in Section 1.5.
1.5 Seismic Design Philosophy
Seismic design for existing structures varies in approach and code compliance from that for new structures. For the Encinal Wharf Project, M&N has evaluated two design approaches:
1. Performance Based Design using a Rational Performance Objective.
2. Code Based Design per the California Existing Building Code
As shown below, these approaches are consistent and rational and will provide appropriate levels of safety for the public access.
1.5.1 Performance Based Design
Performance based design is evaluation / design of a structures expected damage level(s) for associated earthquake event(s) in order to ensure that for said event the level of damage (or less) is satisfied. The approach is typically based on displacement
Encinal Wharf – Schematic Structural Design – Engineering Criteria
8
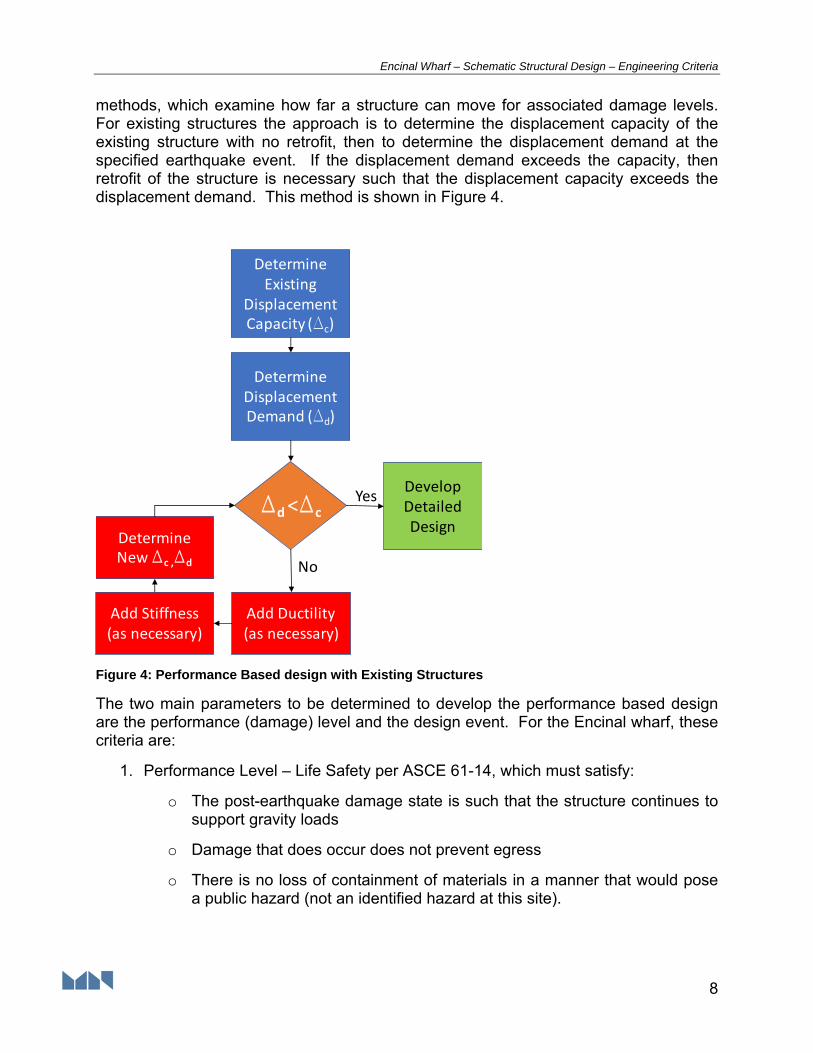
methods, which examine how far a structure can move for associated damage levels. For existing structures the approach is to determine the displacement capacity of the existing structure with no retrofit, then to determine the displacement demand at the specified earthquake event. If the displacement demand exceeds the capacity, then retrofit of the structure is necessary such that the displacement capacity exceeds the displacement demand. This method is shown in Figure 4.
Determine Existing
Displacement Capacity (Dc)
Determine Displacement Demand (Dd)
Dd<Dc
Add Ductility (as necessary)
Add Stiffness (as necessary)
Determine New Dc ,Dd
Develop Detailed Design
No
Yes
Figure 4: Performance Based design with Existing Structures
The two main parameters to be determined to develop the performance based design are the performance (damage) level and the design event. For the Encinal wharf, these criteria are:
1. Performance Level – Life Safety per ASCE 61-14, which must satisfy:
o The post-earthquake damage state is such that the structure continues to support gravity loads
o Damage that does occur does not prevent egress
o There is no loss of containment of materials in a manner that would pose a public hazard (not an identified hazard at this site).

Encinal Wharf – Schematic Structural Design – Engineering Criteria
9
2. Design Event – Design event per ASCE 7-16
o Defined as ASCE 7, Design Earthquake.
o Inertial Response: 475 year return event site specific spectra determined by the geotechnical engineer (Engeo, October 2, 2017).
o Kinematic Response: 475 year return event site specific analysis determined by the geotechnical engineer (Engeo, October 2, 2017). Of note, there are no liquefiable soils within the footprint of the structure; therefore the MCER is not evaluated.
As the proposed improvements are provided as public access, Type II Occupancy, it is not intended to achieve a more stringent performance level beyond life-safety.
Methods and assumptions are provided in Section 6, and are consistent with ASCE 61-14. As ASCE 61-14 is intended for new design; where existing structural performance does not meet prescriptive requirements of new design, evaluation using CBC Chapter 31F (MOTEMS) criteria may be utilized.
1.6 Code Design Requirements
Code evaluation is performed per the 2016 California Existing Building Code. The structure is considered to be in Risk Category II before and after the planned work; therefore the design is considered as a structural alteration.
CBC references ASCE 7 for evaluation of seismic loads; wherein Section 15.4.1.c states that “Where neither Table 15.4-1 nor Table 15.4-2 contains an appropriate entry, applicable strength and other design criteria shall be obtained from a reference document that is applicable to the specific type of nonbuilding structure. Design and detailing requirements shall comply with the reference document”. Therefore, use of ASCE 61 is considered the most appropriate design document per CBC as well.

Encinal Wharf – Schematic Structural Design – Engineering Criteria
10
2 Encinal Wharf Site Environmental Conditions
Environmental conditions are used to determine design loads on all structural elements unless otherwise specified in the design code. Design loads, which may include environmental load cases, are determined in Section 4.
2.1 Datum
Vertical Datum: Vertical data shall reference City of Alameda Datum (NAVD 88 +6ft)
Horizontal Datum: Horizontal data shall use NAD 27, California Coordinate System of 1927.
2.2 Tides
Tidal datums are shown in Table 1.
Table 1: Tidal Datums (1983-2001 Epoch)
Elevation (ft) based on stated datum
Datum Plane ACD NAVD MLLW NGVD
100‐yr Tide (BFE per new FIRM)* 3.79 9.90 10.13 7.20
100‐yr Tide (BFE per MIP & M&N) 3.59 9.70 9.93 7.00
10‐yr Tide 2.99 9.10 9.33 6.40
King Tide (exceeded 2 to 6 times/yr) 1.36 7.47 7.70 4.77
MHHW (exceeded about 150 days/yr) 0.26 6.37 6.60 3.67
Alameda Datum 0.00 6.11 6.34 3.41
NGVD ‐3.41 2.70 2.93 0.00
NAVD ‐6.11 0.00 0.23 ‐2.70
MLLW ‐6.34 ‐0.23 0.00 ‐2.93
* Recommended value for FEMA compliance purposes because it is regulatory in nature (rather than the estimated +3.59' elevation)

Encinal Wharf – Schematic Structural Design – Engineering Criteria
11
2.3 Sea Level Rise
Sea Level Rise (SLR) criteria for habitable structures is described in the Encinal Terminals Master Plan (July 7, 2017).
Elevations at the wharf are:
Existing Top of Deck: +13.1 to 13.4 ft. (NAVD88)
WSE: +10.0 ft. (NAVD88)
WSE+36-in: +13.0 ft. (NAVD88)
The wharf deck, provided as public access within the shoreline band, is at elevation 13.0 (NAVD88). The design life of the wharf structure is 40 years, and it is unlikely that 36-in of SLR will occur within this time-frame. Beyond the design life, public access will be provided as long as feasible, based on actual observed SLR in the future. Public access may still be permitted even after 36-in of SLR has occurred, with infrequent inundation preventing access to the structure during episodic extreme high tide events.
2.4 Wind
Site specific wind speeds have not been studied and are not considered to be significant to the design. Wind load on the Wharf is determined per CBC as described in Section 4.3.
2.5 Wave and Current
The Encinal Basin is a very well protected small body of water with short fetches, therefore waves and currents are benign and are not considered significant for the structural design.
2.6 Geotechnical Information and Seismic Hazards
Geotechnical information including seismic design parameters, inertial response as well as soil movement (kinematic response), are provided in the letter Slope Stability Analysis with Ground Improvement from Engeo, dated October 2, 2017.
2.6.1 Design Spectra
Seismic design spectra is included in the geotechnical letter (Engeo, October 2, 2017). As the soils vary across the site, three models of site specific spectral response at various damping levels were determined. The seismic analysis methods are described in Section 4.5.
2.6.2 Kinematic Loading
Kinematic loading is generically any form of soil movement, but at the Encinal Wharf site the soil movement is due to slope instability (not liquefiable soils). Kinematic

Encinal Wharf – Schematic Structural Design – Engineering Criteria
12
loading parameters are included in the geotechnical letter (Engeo, October 2, 2017). Kinematic soil movement varies based on location along the wharf.
Vertical settlement due to downdrag during the kinematic slope movement is expected to be negligible.
Discussion of the method for evaluation of kinematic loads and combination with inertial loads is provided in 4.5.2.
3 Materials
3.1 Existing Materials
3.1.1 Material Testing Results
Limited destructive material testing of concrete cores on the deck was performed by Power Engineering Contractors. Three samples were taken from the C1 structure and two samples were taken from the C2 structure, as provided in Table 2. All samples were taken from the cast-in-place deck, which should have concrete strengths similar or in exceedance of those of the piles. All samples were found to have concrete strengths in the range of 6 ksi or greater.
A more thorough sampling set would be required to use this higher concrete strength, but the sampling is considered sufficient to show that the assumed strength (See Section ) is conservative. Of note, if higher strengths are justified with further testing, then the as-tested strength should be used for the effective strength in place of the factors provided in ASCE 61-14 Section 6.5.1.
Table 2: Material testing Results
3.1.2 Assumed Existing Material Strengths
Assumptions used as part of this preliminary design include:

Encinal Wharf – Schematic Structural Design – Engineering Criteria
13
Material Strengths of Existing C1 Structure (assumed) o Cast‐in‐Place Concrete Strength (f’c) 4,000 psi
o Steel Reinforcement Yield Strength (fy) 40 ksi
o Timber Piles Pacific Coast Douglas Fir
Material Strengths of Existing C2 Structure (assumed) o Cast‐in‐Place Concrete Strength (f’c) 4,000 psi
o Precast Pile Concrete Strength (f’c) 5,000 psi
o Steel Reinforcement Yield Strength (fy) 60 ksi
o Steel Strand Ultimate Strength (fu) 270 ksi
3.2 New Materials
Where new materials are required, materials suitable to the marine environmental will be utilized including marine grades of stainless steel, fiberglass, bronze, monel, and aluminum alloy. High strength carbon steels will receive marine grade coatings when used.
Steel Framing: ASTM A36, ASTM A572, and ASTM A992
HSS Tube ASTM A500 Grade B
Structural Framing Pipe (not piles) ASTM A53 Grade B3
Steel Pipe Piles: API 5L, or 2B Grade X52
Concrete: Structural 5,000 psi
Precast Concrete: 6,500 psi
Concrete Reinforcement A615 or A706 Gr 60
Concrete Plug Dowel Bars A615 Gr 75 (as necessary)
Prestressing Steel A416 Grade 270 (as necessary)
Nonlinear material properties used for analysis are provided in Table 3.

Encinal Wharf – Schematic Structural Design – Engineering Criteria
14
3.3 Nonlinear Material Properties
For nonlinear pushover analysis, material properties are increased by the Material increase factors from ASCE 61-14 Section 6.5.1 to account for expected material properties, as shown in Figure 5. Assumed material nonlinear properties are provided in Table 3. Of note, if higher strengths are justified with further material testing, then the as-tested strength should be used for the effective strength in place of the factors provided in ASCE 61-14 Section 6.5.1.
Nonlinear properties are not considered for timber piles as it is not a ductile material. More discussion is included in Section 6.2.
Table 3: Nonlinear Material Properties
Material Design Yield Strength (ksi)
Yield Strain Design Ultimate Strength (ksi)
Ultimate Strain
API 5L X52 Pile 52 0.005 66 0.20
A706 Gr 60 Reinforcement
60 ASCE 61-14 6.5.2.2
90 ASCE 61-14 6.5.2.2
Threaded Bars A615 Gr 75
517.1 MPa [75 ksi]
0.003 689.5 MPa [100 ksi]
0.08
0.6ӯ A416 Prestressing
243 - 270 0.035
Figure 5: Material increases from ASCE 61-14 Section 6.5.1.

Encinal Wharf – Schematic Structural Design – Engineering Criteria
15
4 Loads and Load Combos
All design loads used for structural design of the developed system are based on requirements of the design codes (see Section 1.3) and / or developed from the environmental conditions at the site (see Section 2).
4.1 Dead Load
Dead loads include the following:
Self-weight of structural elements
Topping slab
Superstructure, including:
o Small low occupancy storage or commercial shacks
o Landscaping (knee walls, trees, soil, etc).
o Marina access gangway(s)
o Weight of large fixed equipment
Miscellaneous load of 20 psf to account for railings, curbs, and other permanent fixtures
4.2 Live Load
Live loads include the following:
Deck Uniform: 100 psf (recreational use per CBC Table 1607.1)
Roof Uniform: 20 psf (ordinary roof per CBC Table 1607.1, applies to commercial shacks as necessary)
Pedestrian Railing: 50 plf line or 200 lbf concentrated (per CBC 1607.8.1)
Note: 10% of live load is included in seismic mass as per ASCE 61-14 Section 3.7.3
4.2.1 Vehicle Live Loads
Vehicle loading is considered an HS-20 design truck and will be considered in gravity load combinations. As vehicles will only infrequently be present on the structure, such as for maintenance, vehicle live load is not considered in seismic mass.
Encinal Wharf – Schematic Structural Design – Engineering Criteria
16
4.3 Wind Load
Wind load on the Encinal Wharf is calculated using ASCE 7 Chapter 29 provisions based on:
Risk Category II
Ultimate Wind Speed (Vult) of 110 mph (per CBC Figure 1609A)
Surface Roughness D (per CBC 1609.4.2 for water surfaces)
Exposure D (per CBC 1609.4.3 for 5,000 ft of exposure)
Height above ground is taken as the top of deck above MLLW
Applied pressures on the commercial shack superstructure(s) are based on partially enclosed flexible buildings with monosloping roofs per ASCE 7-16 Section 27.4 for the main wind force resisting system (MWFRS) and ASCE 7-16 Section 30.4.2 for cladding.
4.4 Wave and Current Load
The Encinal Basin is a very well protected small body of water with short fetches, therefore waves and currents are benign and are not considered significant for the structural design.
4.5 Earthquake
Seismic design philosophy is discussed in Section 1.5. Seismic hazards are discussed in Section 2.6. Specifics of the analysis methodology for inertial and kinematic loading are discussed below.
4.5.1 Earthquake – Displacement Based (Pushover) Evaluation (Inertial Only)
For pushover analysis, the objective is to verify that inelastic displacement capacities of the analyzed structures are greater than the corresponding seismic demands. Demand-to-Capacity Ratio (DCR) is computed based on system displacement and a DCR less than or equal to 1.0 is considered compliant. Nonlinear pushover analyses involves the following two steps:
Determine Displacement Capacity: The displacement capacity of the structure is calculated using a nonlinear static analysis, which involves the development of a force-versus-displacement curve (pushover curve) based on progressive nonlinear behavior of the pile elements and nonlinear soil-structure interaction. Performance points are identified on all of the pushover curves, corresponding to pile strain limit states provided in the governing criteria.
Determine Demand Displacement: Demand displacement is intended to be a real-world system displacement which predicts displacements due to seismic
Encinal Wharf – Schematic Structural Design – Engineering Criteria
17
inertial loading and may result in damage to the actual structure. The substitute structure (equivalent linearization) method uses a single degree of freedom (SDOF) system to determine the demand displacement based on the structure’s seismic mass and an effective period and acceleration (spectra) based on the structure’s damaged state (energy absorption) for the demand event. The design spectra is reduced proportionally to the damage state via relating the damage to the system ductility and/or effective damping. By allowing the SDOF to have a longer period and / or reduced design spectra, the system loads are reduced while the system displacements may be increased. For this analysis, the ASCE 61-14 Substitute Structure Method (with alteration to reflect methods from FEMA 440 / ASCE 41-13) is used.
The ASCE 61-14 substitute structure methodology is based on the evaluation of a bilinear pushover curve fit to the actual pushover curve. The bilinear curve is defined through an effective yield and to the demand displacement (as shown below), which is consistent with methods presented in MOTEMS, FEMA 440, ASCE 41-13, and other documents. The initial stiffness (Ki) is defined through 0.6 times the effective yield base shear. The secondary stiffness is defined so that the area under the actual pushover curve is equal to the area under the bilinear curve and the bilinear curve passes through the actual curve at the demand displacement. An Excel spreadsheet is used to iteratively solve for the effective yield point and the demand displacement which satisfies these boundary conditions. As demand displacements vary for various sized events, the effective yield point is different for the corresponding bilinear curves. A flow chart of the ASCE 61-14 substitute structure methodology is shown in Figure 7.
Of note, the substitute structure method is not the only method that has been used for developing demand displacements. Previous methodologies have included the use of “tuned” soil springs as well as nonlinear time-history analysis. Both methods tend to require greater effort in determining appropriate system response and therefore are not considered practical for cost-effective design efforts. It should be noted that accuracy amongst these varied methods are typically compared with nonlinear time-history analysis, which is assumed to be the most accurate methodology. In general, all methods are approximations and have inaccuracies in the materials, loads, and soils which limit the overall accuracy of the model.

Encinal Wharf – Schematic Structural Design – Engineering Criteria
18
Actual Pushover L2 Demand
Number of Iterations till solution 76Actual Pushover L2 Demand 0.6*Vy 0 0.00
1791.11 0.61Actual Pushover L2 Demand 0 0
1.02 2985.196.795475 4553.06.795475 0
Actual Pushover L2 Demand Keff 0 06.80 4553.0
1.00
1001.00
2001.00
3001.00
4001.00
5001.00
6001.00
0.00 1.00 2.00 3.00 4.00 5.00 6.00 7.00 8.00 9.00
Ba
se S
hea
r (k
ip)
Displacement (in)
First Structural Yield
L1 Displacement Capacity
L2 Displacement Capacity
Pushover Curve from Model
Bilinear Curve For Event
Effective Stiffness of Substitute
Structure (Keff)
Effective Yield
(Vy, ∆y)
0.6*VyIntersect
Demand Displacement
(∆d)
Equal Areas Under Curves
Initial Stiffness (Ko)
Final Stiffness
(Kf = r * Ki)
Ductilityμ = ∆d / ∆y
Figure 6: Sample Fit of Bilinear Curve to Pushover Curve
The DCR value is determined from the ratio of the demand displacement divided by the displacement capacity. Therefore, in the example shown in Figure 6, if the demand determined is for an L1 event then the DCR is greater than the defined limit and is not acceptable; however if the demand is for an L2 event then the DCR is less than the defined limit and is acceptable.

Encinal Wharf – Schematic Structural Design – Engineering Criteria
19
Determine m, Develop Pushover
Guess Ddn, Dyn
Solve for Dy that gives equal areas to Dd
dn
yn
yn
dn
yn DISPLACEMENT dn
i
r Ki
Equal Areas Below Each Curve BASE SHEA
R
Vdn
Vyn
Dyn Ddn
Keffn
SUBSTITUTE
STRUCTURE
EFFECTIVE
STIFFNESS
DISPLACEMENT
BASE SHEA
R KV∆
Find Effective Stiffness (Keffn)
μ∆∆
Find Ductility
No or OptionalTeffn < T0
Find Effective Period
T 2m
K
ξ 0.051
11 r
r
Find Effective Damping
Find Acceleration (San) Find Acceleration at xeffn
Δ ST2
4 2
Find Displacement
Assume New Displacement (Ddn+1)
Dd = Ddn
And Adjust for Torsional Effects
Where: m = Seismic Mass
Dd = Displacement Demand
Dy = Effective System Yield Displacement
n = iteration 1,2,3… Ki = Initial stiffness of Pushover Curve
r = ratio initial to secondary stiffness V = Base Shear Keff = Effective Stiffness Teff = Effective Period T0 = Period at Peak of Design Response Spectrum
Start Iterations (n, n+1, …)
xeff = Effective Damping
m = Ductility
Sa = Acceleration from Design Response Spectrum
Yes
100ΔΔ 1
3%
Compare with Previous Iteration
Yes
No, Iterate
Figure 7: Flow chart of substitute structure methodology
Effective system damping is determined using ASCE 61-14 equation (6-16). This equation is based on a generic “r” value solution of the Takeda Degrading Stiffness Hysteretic Damping model [Displacement Based Design SSRP – 94/16 UC San Diego, 1994]. This equation may be used for concrete and steel piles connected to the deck

Encinal Wharf – Schematic Structural Design – Engineering Criteria
20
through dowels embedded in the concrete. The ductility is the demand displacement (iterative) divided by the yield displacement. In the above method the yield displacement is determined as part of the method and differs at differing performance levels. The “r” value is a measure of relative secondary stiffness to primary stiffness and is automatically determined in the above method. The “r” value is intended to vary between 0.05 and 0.20; however it may be significantly higher when solving stiff systems or at the L1 performance level (on the elastic side of the pushover curve). As the “r” value increases the solution goes to 5% damping.
4.5.2 Earthquake –Kinematic Displacement (Kinematic, Inertial + Kinematic)
Kinematic movement is determined by the Geotechnical Engineer (Engeo, October 2, 2017).
ASCE 7-10 Section 15.5.6 states “The design shall account for the effects of liquefaction and soil failure collapse mechanisms”; however, no specific performance requirements are stated. Similarly, ASCE 61-14 states “Simultaneous application of these loading conditions shall be considered, taking into account the phasing and locations of these loads on foundation elements. The foundation shall be designed such that the structural performance is acceptable when subjected to both inertial and kinematic loadings.” Evaluation of inertial plus kinematic is performed, based on the methods described in ASCE 61-14.
Figure 8 shows a conceptual understanding of combined kinematic and inertial load, with the high inertial accelerations may occur early in the time history while the full kinematic displacement occurs late in the time history.
Figure 8: Schematic relationship between inertial and kinematic loading
For the purposes of this analysis and based on discussion with the Geotechnical Engineer (Engeo), the kinematic load is considered to occur following the peak inertial
Encinal Wharf – Schematic Structural Design – Engineering Criteria
21
response, with the possibility of structural hinging due to kinematic loading occurring close to or at the same location as hinging due to inertial response. Therefore, the kinematic load may be evaluated for two cases:
Full inertial Response with partial kinematic response, which occurs early in the time history (Eq.-1)
Full kinematic response with partial inertial response, which occurs late in the time history (Eq.-2)
100%*HD + DdpkA (Eq-1)
B*HD + 100%*DdpkB (Eq-2)
Where: HD = Full kinematic displacement demand DdpkA = Demand displacement determined at post kinematic movement and design spectra reduced by A (note: A not applied to displacement) DdpkA = Demand displacement determined at post kinematic movement B*HD
A, B = multipliers taken as 25%
Selection of the A and B multipliers was made based on discussion with the Geotechnical Engineer (Engeo), with 25% used for both. Due to P-Y springs reaching high strength after small displacements, Eq-2 is likely to control in most conditions. While the above method has not been rigorously tested against time history response, it does provide a rational approach which is likely to be less conservative than a full combination of kinematic and inertial load. Structural Modeling of kinematic response is described in Section 6.1.
4.6 Load Combinations
Combinations are based on ASCE 7-16 for gravity loads. Inertial response and Kinematic (soil slope) movement loads are combined as discussed in Section 4.5.2.
Vacant Loads:
1.4D
1.2D + 1.6L + 0.5Lr
1.2D + 1.0L + 1.6Lr
1.2D + 1.0L + 1.0Lr + 1.0W
0.9D + 1.0W
1.17D + 1.0L + 1.0*EQ (for displacement based analysis)

Encinal Wharf – Schematic Structural Design – Engineering Criteria
22
0.83D + 1.0*EQ (for displacement based analysis)
1.0D + 1.0 K
1.0D + 1.0 K + 0.25*EQ (using displacement based analysis when inertial and kinematic peak moments or hinges are not independent)
1.0D + 0.25 K + 1.0*EQ (using displacement based analysis when inertial and kinematic peak moments or hinges are not independent)
The peak acceleration determined from the site specific spectra (see Section 2.6.1) is 0.86g and the Peak Ground Acceleration (PGA) is 0.33g. Therefore, the 0.2*SDS (0.2*0.86g = 0.17g) vertical acceleration from ASCE 7-16 used in earthquake combinations is consistent with the 0.5 of PGA (0.5*0.33g = 0.17g) from ASCE 61-14. Therefore earthquake and dead load combinations are examined for a range of dead load of 1.17D and (1-0.17 =) 0.83D.
Definitions
D = dead and superimposed dead loads per Section 4.1
L = uniform live load per Section 4.2
Lr = live load on roof per Section 4.2
W = Design wind load per Section 4.3
EQ = Earthquake inertial shaking load per Section 4.5
K = Earthquake induced soil load on structure due to soil kinematic movement per
Section 0
5 Soil Properties
Soil properties include soil springs as well as pile axial capacity vs. embedment depth curves. All information was provided by the geotechnical engineer (Egneo) in a
geotechnical letter (Engeo, October 2, 2017).
The soil profile at the site consists Young Bay Mud (YBM) and Old Bay Mud (OBM). Soil profiles for each structure are provided in the referenced the geotechnical engineer.
5.1 Soil Springs
Soil P-Y (Lateral) and T-Z (axial) springs are used as required in the model. P-Y springs for piles are developed from LPile provided by the geotechnical engineer

Encinal Wharf – Schematic Structural Design – Engineering Criteria
23
(Engeo, October 2, 2017). P-Y springs are simplified 3 point curves as needed for input into SAP2000 for nonlinear pushover analysis.
5.2 Pile Axial Capacity
Soil axial capacity at piles is determined by the geotechnical engineer (Engeo, October 2, 2017) as soil capacity versus embedment depth. Soil capacities are provided as ultimate strength values for use in pushover analysis. Pile reactions are to be determined from worst case tip reactions in seismic force based analysis and for static gravity loads.

Encinal Wharf – Schematic Structural Design – Engineering Criteria
24
6 Structural Modeling and Analysis
Structural modeling for all portions of the structure includes the following:
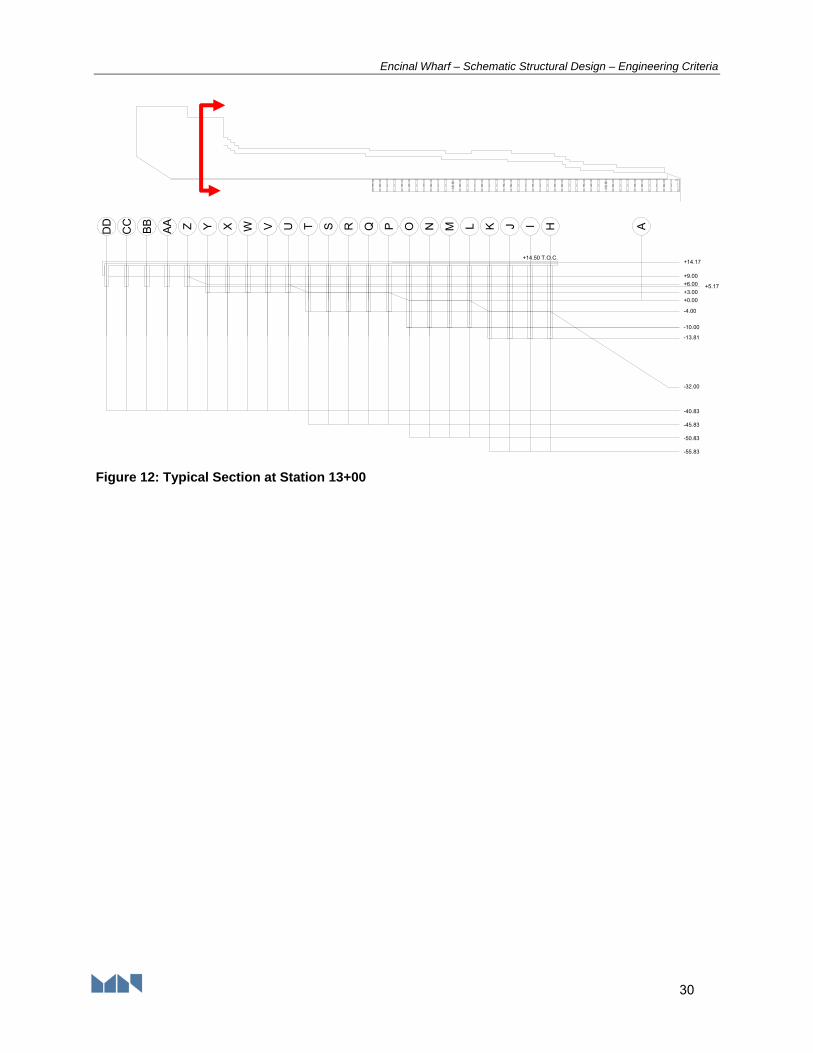
The structure is separated into 5 typical sections as shown in Figure 9 through Figure 13. Each section is evaluated for transverse direction pushover. Sections of C1 and C2 adjacent to one another are evaluated as independent structures.
All analysis is performed on 3D models which capture representative stiffness and mass. Concrete section stiffness is adjusted for cracked section response per ASCE 7-10 Section 12.7.3 and ASCE 61-14 Section 3.7.2.
All piles are considered to have been repaired to as-new condition (original construction). During detailed design piles will be repaired as necessary to satisfy this assumption or new analysis will be performed where piles have limited strengths consistent with their damage level.
Nodes for the deck are located at the centroid of the deck. The deck is expected to act as a horizontal diaphragm. Two deck modeling conditions may be used:
o Deck modeled as thick shell elements which capture the mass and horizontal stiffness of the deck, but do not capture column strip loads.
o Deck modeled as 1 way beam elements which capture column strip loads but require superimposed weight and mass be applied. Superimposed weight includes any self-weight of the actual element not modeled (middle strip) and is included in seismic mass.
Modal response is determined with sufficient modes to capture 90% of the mass participation
Seismic Inertial response is considered in the transverse and longitudinal directions based on a 100% to 30% primary to secondary direction load combination.
Pushover analysis is performed using a static acceleration to develop a force-displacement curve. Pushover is performed in 8 directions (2 primary plus or minus 2 secondary), 2 dead load conditions (1±K), and 2 soil conditions (upper or lower bound)…resulting in a total of 32 cases. Displacement is measured at a point near the center of gravity of the system
Seismic mass includes the full dead and superimposed dead load on the deck. The mass of the top 1/3rd of the pile above the mudline is also included. No live load is included in the seismic mass.
Plumb piles are modeled with rollers at the pile tip with demand loads determined from the pile tip reaction. Soil capacity is determined from force vs depth curves provided by the geotechnical engineer (Engeo, October 2, 2017).

Encinal Wharf – Schematic Structural Design – Engineering Criteria
25
Moment considered in circular piles (timber and steel pipe) is the resultant moment from both axes based on a square root of the sum of the squares (SRSS) combination. Moment capacity within the circular pile section is uniaxial.
Upper and lower bound soil properties are accounted for in separate models using different soil spring properties. P-Y soil springs are used to capture lateral response of plumb piles.
Batter pile plunging and pull-out is directly accounted for in the T-Z soil spring definitions, including upper and lower bound ranges.
Section strength capacity of timber piles are determined based on the NDS, with the inclusion of dynamic loading factors. Demand capacity of the timber pile is taken at the load which results in forces beyond this strength capacity. Piles have an 18” butt and are assumed to have an 8.3” tip (based on ASTM D25 Table X1.2). The nominal diameter at the pile peak moment is taken as 10.4” and is used for the timber stiffness.
The timber pile and concrete jacket are assumed to be non-composite, but the concrete jacket is considered to provide additional stiffness.
Concrete pile jacket on timber piles are conservatively considered to be pin connected at the top of the pile. It is assumed that the bond of the cap reinforcement from the pile top to the deck, or the flexural capacity of the deck, is insufficient to transfer moment across the connection; therefore the flexural stiffness at the connection is ignored. Cracking of the concrete pile top may occur during a large seismic event; however the cracking is unlikely to pose a collapse hazard as the connections will remain capable of transferring gravity loads.
The timber pile is assumed to be laterally braced at the mudline, therefore unbraced length is considered above the mudline, but is limited to the element length below the mudline.
Timber pile flexure and shear capacity vary by depth and are evaluated for each element at each recorded point of the pushover curve. Timber capacity is determined to be reached at the first timber occurrence of a section which has a DCR > 1.0 in flexure or shear.
Strains for reinforced concrete pile sections are determined from ASCE 61-14 Table 3.3 for “DE Life safety protection” strain limits for a solid concrete pile. These include:
o Concrete at the top of the pile & deep in ground εc < εcu
o Concrete shallow in ground εc < 0.005+1.1 ρs < 0.025 < εcu
o Reinforcing Steel at the top of the pile εs < 0.8*strain at maximum stress < 0.08
Encinal Wharf – Schematic Structural Design – Engineering Criteria
26
o Prestressing Steel
o Shallow In-Ground (< 10*pile diameter) εp < 0.035
o Deep In-Ground (> 10*pile diameter) εp < 0.050
The timber pile concrete jacket below the connection is allowed to hinge and is evaluated using ASCE 61-14 strain limits determined from Table 3.3 for “DE Life Safety Protection” strains for hollow concrete piles. These include:
o Concrete at the top of the pile εc < 0.008
o Reinforcing steel at the top of the pile εs < 0.6*strain at maximum stress < 0.06
Hinge length for reinforced concrete pile sections are determined from ASCE 61-14 Equation 6.12 for in ground hinges and Table 6.1 for doweled deck connections.
Strains for steel pile are determined from ASCE 61-14 Table 3.3 for “DE Life safety protection” strain limits for a hollow concrete pile. These include:
o Reinforcing Steel at the top of the pile εs < 0.8*strain at maximum stress < 0.08
o Shallow In-Ground (< 10*pile diameter) εs < 0.035
o Deep In-Ground (> 10*pile diameter) εs < 0.050
Hinge length for steel pipe pile sections are determined ASCE 61-14 Equation 6.12 for in ground hinges and Table 6.1 for embedded pile deck connections.
Precast batter piles are assumed to typically be battered at a rise of 2.5 to a run of 1.0 for existing structures.
As no drawings are available, Pilecap joint shear on the C2 structure is evaluated based on field measurements and detailing assumptions consistent with the 1960 era of construction. It is assumed that the prestressing strand is extended into the pilecap sufficient to develop the strand.

Encinal Wharf – Schematic Structural Design – Engineering Criteria
27
HIJKL
+0.00
+14.50 T.O.C.
A
+9.00
-4.00
-32.00
-40.83
+5.17
-82.5
-75.63
-10.00
-25.00
+14.17
A
Figure 9: Typical Section at Station 1+10

Encinal Wharf – Schematic Structural Design – Engineering Criteria
28
HIJKLMNOPQR A
+0.00
+9.00
-4.00
-32.00
-45.83
+5.17
-82.5
-75.63
-10.00
-25.00
+14.50 T.O.C.+14.17
+3.00
-13.81
Figure 10: Typical Section at Station 5+10

Encinal Wharf – Schematic Structural Design – Engineering Criteria
29
HIJKLMNOPQRS A
+0.00
+9.00
-4.00
-32.00
+5.17
+14.50 T.O.C.+14.17
+3.00
-10.00
-13.81
-18.81
-40.83
-45.83
-50.83
-55.83
-60.83
Figure 11: Typical Section at Station 10+00
Encinal Wharf – Schematic Structural Design – Engineering Criteria
30
HIJKLMNOPQRSTUVWXYZAA
BB
CC
DD A
+0.00
+9.00
-4.00
-32.00
+5.17
+14.50 T.O.C.+14.17
+3.00
-10.00
-13.81
-40.83
-45.83
-50.83
-55.83
+6.00
Figure 12: Typical Section at Station 13+00

Encinal Wharf – Schematic Structural Design – Engineering Criteria
31
HIJKLMNOPQRSTUVWXYZAA
BB
CC
DD
EE
FF
GG
HH A
+0.00
-4.00
-32.00
+14.50 T.O.C.+14.17
+3.00
-10.00
-50.83
-55.83
-13.81
Figure 13: Typical Section at Station 14+00
6.1 Modeling of Kinematic Load
Modeling of kinematic load is consistent with the discussion above, but includes additional assumptions:
Damage due to the inertial event may be modeled in the form of strength reduction or moment releases applied to framing elements which are damaged during inertial response. Elements that are elastic during inertial response are not altered for kinematic evaluations.
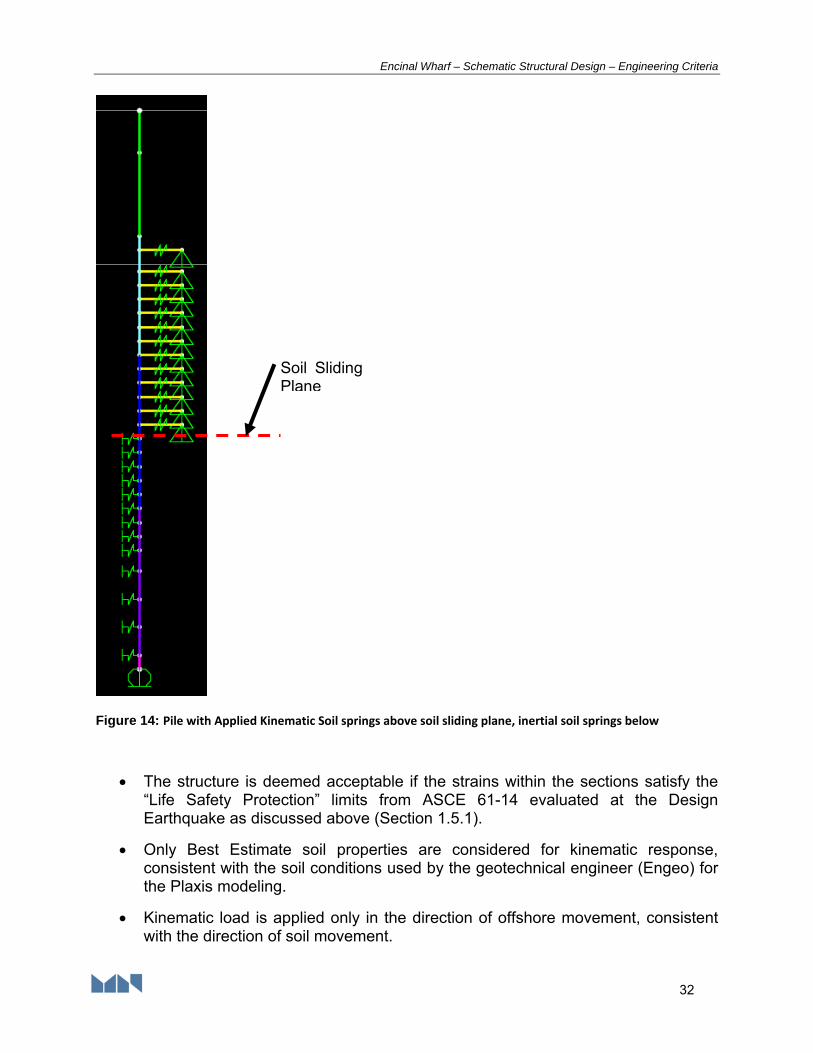
Kinematic only loading is modeled using two-point soil springs where one point is attached to the structure and the other is attached to a pin outside of the structure, as shown in Figure 14. The kinematic displacement is applied to the pinned node and the soil spring applies load to the structural element node. The full soil displaced shape is applied to all nodes in the model simultaneously and element forces and material hinge responses are determined at the full displaced shape. P-Delta effects are included where deck displacement and pile rotation are significant.
Kinematic only loading is used to determine if combined kinematic plus inertial response needs to be evaluated. If the kinematic loading is found to result in maximum moments and shears which are not co-located with maximum inertial moments and shears, then the two cases may be considered independently. Otherwise, the combined loading is evaluated.
Encinal Wharf – Schematic Structural Design – Engineering Criteria
32
Figure 14: Pile with Applied Kinematic Soil springs above soil sliding plane, inertial soil springs below
The structure is deemed acceptable if the strains within the sections satisfy the “Life Safety Protection” limits from ASCE 61-14 evaluated at the Design Earthquake as discussed above (Section 1.5.1).
Only Best Estimate soil properties are considered for kinematic response, consistent with the soil conditions used by the geotechnical engineer (Engeo) for the Plaxis modeling.
Kinematic load is applied only in the direction of offshore movement, consistent with the direction of soil movement.
Soil Sliding Plane

Encinal Wharf – Schematic Structural Design – Engineering Criteria
33
6.2 Shear Rupture of Timber Piles In Ground
As the goal of “Life Safety” performance is to maintain a gravity load path which allows for heavy damage but maintains a means of egress across the structure, rupture of timber piles deep in the soil (due to flexure or shear) may not necessarily result in unacceptable performance of the structure. During in-ground soil failures of timber piles, the lateral stiffness and vertical load carrying capacity is reduced, but does not drop to zero. Therefore, if necessary, evaluation may incorporate a reduced pile embedment consistent with the overload location of timber piles within the soil due to kinematic loading.
Nonlinear Hinges are not used to evaluate timber piles. Rather, three separate models are considered which capture the modes of response up to and including rupture of timber piles, as shown in Figure 15:
1. Continuous Pile Model: The pile is continuous (elastic) over its full height and moment is transferred from the kinematic loaded region to the soils below.
2. Moment Release Hinge Pile Model: A moment release is introduced at the peak moment location determined in the continuous pile. The release acts as a flexural hinge, providing for shear transfer, but no moment transfer to the pile below. This is considered to model the condition where the timber ruptures in flexure, but a core remains which may transfer shear force. Axial loads are assumed to also transfer to the pile section below.
3. Broken Pile Model: The pile section below the peak moment location from determined in the continuous pile is removed from the model. This is considered to model the worst case where the timber ruptures and no load transfer may occur. Axial loads are considered to be transfer to the soil layer at the elevation of the hinge, with no bearing on the pile section below.
If it is determined that the kinematic or kinematic plus inertial load cases result in rupture of the pile within the soil, then additional analysis of the system following the full kinematic displacement and under gravity load including P-Delta forces must also be considered to show stability in the post event condition.
Timber piles are considered to meet life-safety criteria as long as equilibrium, including P-Delta, is achieved and axial capacity of the pile or soil is not exceeded.

Encinal Wharf – Schematic Structural Design – Engineering Criteria
34
a) Continuous Pile b) Moment Release Hinged Pile c) Broken Pile
Figure 15: Three Models of a Timber Pile used to Evaluate Kinematic Loading
Soil Sliding Plane
Moment release at peak moment location determined from continuous pile
Pile removed below at peak moment location determined from continuous pile
Encinal Wharf – Schematic Structural Design – Engineering Criteria
35
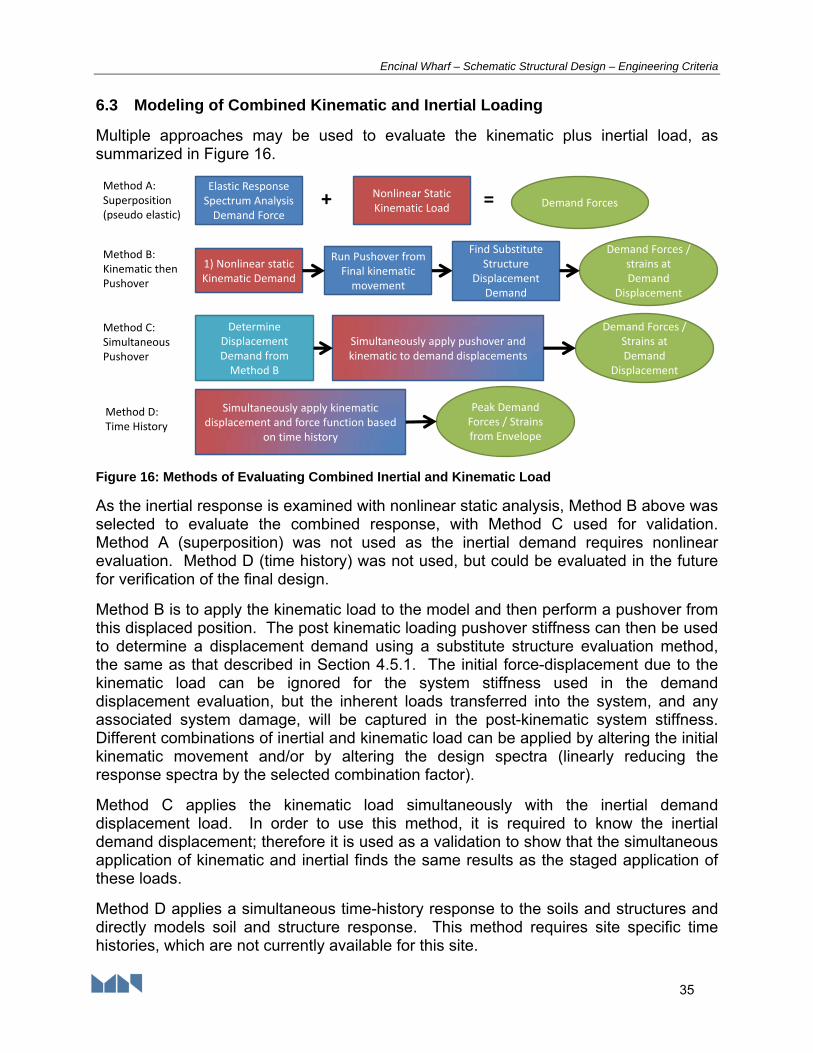
6.3 Modeling of Combined Kinematic and Inertial Loading
Multiple approaches may be used to evaluate the kinematic plus inertial load, as summarized in Figure 16.
Method A:Superposition(pseudo elastic)
Elastic Response Spectrum Analysis Demand Force
+ Nonlinear Static Kinematic Load
= Demand Forces
1) Nonlinear static Kinematic Demand
Run Pushover from Final kinematic movement
Method B:Kinematic thenPushover
Find Substitute Structure
Displacement Demand
Demand Forces / strains at Demand
Displacement
Method C:SimultaneousPushover
Determine Displacement Demand from Method B
Simultaneously apply pushover and kinematic to demand displacements
Demand Forces / Strains at Demand
Displacement
Method D:Time History
Simultaneously apply kinematic displacement and force function based
on time history
Peak Demand Forces / Strains from Envelope
Figure 16: Methods of Evaluating Combined Inertial and Kinematic Load
As the inertial response is examined with nonlinear static analysis, Method B above was selected to evaluate the combined response, with Method C used for validation. Method A (superposition) was not used as the inertial demand requires nonlinear evaluation. Method D (time history) was not used, but could be evaluated in the future for verification of the final design.
Method B is to apply the kinematic load to the model and then perform a pushover from this displaced position. The post kinematic loading pushover stiffness can then be used to determine a displacement demand using a substitute structure evaluation method, the same as that described in Section 4.5.1. The initial force-displacement due to the kinematic load can be ignored for the system stiffness used in the demand displacement evaluation, but the inherent loads transferred into the system, and any associated system damage, will be captured in the post-kinematic system stiffness. Different combinations of inertial and kinematic load can be applied by altering the initial kinematic movement and/or by altering the design spectra (linearly reducing the response spectra by the selected combination factor).
Method C applies the kinematic load simultaneously with the inertial demand displacement load. In order to use this method, it is required to know the inertial demand displacement; therefore it is used as a validation to show that the simultaneous application of kinematic and inertial finds the same results as the staged application of these loads.
Method D applies a simultaneous time-history response to the soils and structures and directly models soil and structure response. This method requires site specific time histories, which are not currently available for this site.

Encinal Wharf – Schematic Structural Design – Engineering Criteria
36
7 Structural Strengthening (as necessary)
The existing structure will be analyzed and evaluated based on the criteria described above. If it is determined that the existing structure cannot satisfy the demand displacements based on existing conditions or mitigation by increasing ductility (such as FRP wrapping pile to deck connections) then additional stiffness strengthening will be provided, as shown in Figure 17.
Figure 17: Structural Strengthening Methodology.
Encinal Wharf – Schematic Structural Design – Engineering Criteria
37
As discussed in Section 1.5, the intent of additional stiffness strengthen is to limit lateral movements to within the displacement capacity of the existing structure (with or without increased ductility). Additional strengthening typically takes the form of new stiffer structure added as continuous or discrete elements within the system. The new stiffness may be designed to completely take the lateral load (and thereby act as a new Lateral Force Resisting System (LFRS) or may be designed to work in parallel with the existing LFRS.
In cases such as this project, where significant kinematic load occurs, any added stiffness retrofit must balance resisting the inertial demand displacements with being sufficiently flexible to allow for kinematic movements deep in the soil. If the deck is overly restrained, then it is possible for the piles deep in the soil to move further than the deck and result in a large differential displacement that can lead to P-Delta caused failure.
8 Project References
1. Encinal Terminals Master Plan, North Waterfront Cove LLC, July 7, 2017.
2. Slope Stability Analysis with Ground Improvement, Engeo, October 2, 2017.
3. Applicable codes and published professional references are listed in Section 1.3.