enclosure 1 to dcp nrc 002728, 'in-plane behavior of ... · dcp nrc 002728 december 30, 2009...
TRANSCRIPT

DCP NRC 002728December 30, 2009
ENCLOSURE 1
"In-Plane Behavior of Concrete Filled Steel (CFS) Elements" Presentation
0381 Ijb.doc 12/30/2009 12:15 I'M
71o
0Ii
>
IN-PLANE BEHAVIOR OF
CONCRETE FILLED STEEL (CFS) F
ELEMENTS(by Amit H. Varma and Sanjeev R. Malushte !4
d, Purdue University and Bechtel Power
I r IIIj

COPYRIGHT
o This source material is copyrighted by Prof. Amit H.Varma, School of Civil Engineering, PurdueUniversity, West Lafayette, IN 47906
o It is excerpted from the report:
o Varma, A.H., and Malushte, S. (2009). "In PlaneBehavior, Analysis, and Design of Concrete FilledSteel Wall Panels." Bowen Laboratory ResearchReport No. 2009- 03, School of Civil Engineering,Purdue University, West Lafayette, IN 27906, under Kreview by sponsor.
© Amit H. Varma, School of Civil Engineering, Purdue University, West Lafayette, IN 47906iiid

RESULTS FROM LEVEL 2 ANALYSIS
" The level 2 analysis of the structure will result inforce and deformation demands on the components. o
" In the spirit of LRFD, the level 2 analysis will beelastic that accounts for the effects of: (a) concretecracking, (b) slip between the steel plates andconcrete infill, and (c) connection flexibility.
" The results from the analysis will include for thecylindrical shield building the following demands:o In plane Force demands (Sx, Sy, and Sxy)
o Moment (Mx, My, and Mxy)
o Out of Plane shear (Vxz and Vyz)
© Amit H. Varma, School of Civil Engineering, Purdue University, West Lafayette, IN 47906- - -iLE J

IN PLANE BEHAVIOR" The effects of these demands on the behavior of the
steel-concrete composite (SC) structure wasinvestigated
" To begin, lets focus on the behavior for in-plane forcesSx, Sy, and Sxy.
o These are forces per unit length typically in kips/ft
" Just to give a sense of quantityo The pure tension strength of the AP1000 design = 0.75 x 2 x
12 x 50 ksi = 900 kips/fto The pure compression strength (squash load) - 0.75 x 2 x 12
x 50 ksi + 34.5 x 12 x 6 ksi 3384 kips/ft
© Amit H. Varma, School of Civil Engineering, Purdue University, West Lafayette, IN 47906

IN PLANE BEHAVIOR
o Consider a concrete filled steel (CFS) element takenfrom the SC structure
o It is subjected to in-planeunit length (in.).
(a) isometric view
forces Sx, Sy, and Sxy per
(b) plan view
SvSysteel plate
-I ..Sx
Sxy
,Sxy
Sx
Sxy
SxSx
SxySy
Nssteel plate 05
--------- middle plane
(0C Amit H Varma, School of Civil Engineering, Purdue University, West Lafayette, IN 47906

IN PLANE BEHAVIOR
o These in-plane forces will cause some deformations inthe element. These deformations can be denoted by
t'z
the strain terms: EX, Eyý xy
(a) isometric view (b) x-y strains
Systeel plate•A
xv
Sx
Sxy
1SxY
Sx
y.fl
Sys l
steel plate
--------- middle plane
©c Amit H. Vnrma , School of Civil Engineering, Purdue lUnivprsityv, West Lafayette, IN 47906

ONE ASSUMPTION
o Let us assume that the strains E x, E y, Yxy are compatiblebetween the steel plate and the concrete infill.
o We will revisit this assumption later.
o The AP 1000 design will have to demonstrate that theshear stud spacing (8.5in.) is adequate to achieve this asan engineering approximation for the load cases. L
41!1JIt © Amit H. Varma, School of Civil Engineering, Purdue University, West Lafayette, IN 47906

I
Two FACTSo If 6 is the principal direction
o Stress Transformation relates the principal stresses towthe x-y stresses,
[T]a -211 + cos(20p)
1- cos(20p)
--sin(2Op)
1 - cos(20p)
1 + cos(20p)
sin(2Op)
2 sin(2Op)
-2 sin(2Op)
2cos(2Op)
o Strain Transformation relates the principal strains tothe x-y strains
[T]~12•
1 + cos(2&p)
1- cos(206)
C-'2 sin(260
1- cos(20p) sin(20-)
1 + cos(2Op) -in(20
2sin(26 2cos(2Op)0
© Amit H. Varma, School of Civil Engineering Purdue University, West Lafayette, IN 47906

PRINCIPAL IN-PLANE FORCES SPi AND SP2
o The difference between the two transformationsis due to the definition of engineering shearstrain r xy which is twice the shear strain E xy
0 F V
ii
II
Ii[1,
© Amit H. Varma, School of Civil Engineering, Purdue University, West Lafayette, IN 47906

PRINCIPAL IN-PLANE FORCES (SPI, SP2)
o The in-plane forces (Sx, Sy, and Sxy) can be used tocompute the principal direction (0 p) and principalCmembrane forces Spl and Sp2 per unit length usingEquations belowy:
Sp2
Sxy P
. I OP 2S,."sx Sx i tan(20,,)- . ,
Sp2 X - 1
Sy
S(1 + cos(20p) (I - cos(2O,) SY +sin(20 SSP -2 2 2
(A - cos(201 ,) (1 + cos(20,)S =. . . SX + ...g S. - sin(20 tSN4o6©c Amit H./Varma , School'f Civil Engine~erin'g, Purd~t. University, Y-West LafayettiW, _ 0 0

V
CONCRETE CRACKING
" Before concrete cracking, the principal forces areresisted by the composite section (steel and concrete)
" Concrete cracking occurs after the principal membrane§force (S 1 or S 2) exceeds S,
4 (f shEc) Tc + E 2t• kips/in.Sc -(1000 Ecs
" Set can be reduced to account for the effects of concreteshrinkage tensile strain (E sh)
" This point is variable because the tensile strength ofconcrete can be highly variable and shrinkage effectsare not easy to characterize.
" Cracking can occur due to one or both principal force,The cracks will be oriented in the plane perpendicular-t~~"n forcegr eet
© _, versity, ' est, IN 47906
POST-CRACKING BEHAVIOR
" Post-cracking the concrete will offer very littlestiffness and stress capacity in the principal directionperpendicular to the plane of cracking.
" However, it will have stiffness and strength in theprincipal direction parallel to the plane of cracking.This can be referred as cracked orthotropic behavior
" Japanese researchers recommend that the stiffness inthe direction parallel to the plane of cracking can beassumed to be 70% of the uncracked stiffness (Ec).
" Lets assume the stiffness and strength perpendicularto the direction of cracking are assumed to be zero,which is a conservative assumption.
© Amit H. Varma, School of Civil Engineering, Purdue University, West Lafayette, !N 47906ii

PRINCIPAL STRAINS
o Assume that the principal strains (E.pl and Fp2) are inthe same direction as the principal forces (Spz and Sp2).
o They are related to the x-y strain ( E, y-, and rx) bythe strain transformation rules. In these equations 0p isthe principal direction computed earlier.
11
I•
Ep2 LJ]E
0
yxYX 1
1 + cos(20p)
1- cos(2Op)
-2 sin(2OP )
1- cos(2Op)
1 + cos(2Op)
2 sin(2Op)
sin(2Op)
-sin(2Op)
2cos(2Op)
© Amit H. Varma, School of Civil Engineering, Purdue University, West Lafayette, IN 47906

CRACKED CONCRETE STRESS-STRAINRELATIONSHIP
o The concrete infill will have principal stresses (, c-p1 and c, p)
corresponding to the principal strains (,Fpl and 6p). Theprincipal stresses will be related to the strains via the reducedelastic modulus (Ec)
(a) principal strains (b) principal stresses
E2 , (T2 CU' 0~p or10"
E, UpI. ,,Cp2 = ,EL 0 Oorl 0 Ep2
ep Ip EP J{2) },lgi o o o0
e,,/ 0
© Amit H. Varma. School of Civil Engineering, Purdue University, West Lafayette, IN 47906

CRACKED CONCRETE STRESS-STRAINRELATIONSHIP
o The concrete principal stresses (, O-pl and c cp 2 ) can betransformed back to stresses in the x-y directions
.0y, and C-;as shownUC
) C
(Y' V
a.C 49pl
\C Up 2
1 + cos(20,) 1 - cos(26p)C ax" CrYP 1 [T]cos(20p) I + cos(20p)
20 - sin(20p) sin(20p)
© Amit H. Varma, School of Civil Engineering, Purdue 1Iniver.ity, West Lafayette, IN 47906
2 sin(2Op)
-2 sin(20p)
2 cos(2Op)

CRACKED CONCRETE STRESS-STRAINRELATIONSHIP.
o Collecting all the terms that we have developed so farwe get the stress-strain relationship for crackedconcrete: I r
L'w9
Cz
C a x x
C ('Y = [K]c EYCT YX),
[K] = '
0 or Ec
0
0
0 0
0 or E,
0
[T']E0
0
sin(20p) 1-sin(20p)
2 cos(20P )
L! iL
[K]. -
I + cos(20p)
1 - cos(20,,)
--sin(20p)
I - cos(2Op)
I + cos(20p)
sin(20p)
2 sin(2Op)
-2 sin(20p)
2cos(20,) I.[O or 1
0
0
0
0 or 1
0
0
0
0
I + cos(2Op)
1 - cos(2Op)
-2 sin(2Op)
1- cos(2Op)
1. + cos(2Op)
2 sin(20p)
I
© Amit H. Varma, School of Civil Engineering, Purdue University, West Lafavette, IN 47906

STEEL PLATE STRESS-STRAINRELATIONSHIP
o The steel plates will have plane stress behavior, and thecorresponding elastic isotropic behavior can be used torelate the steel plate membrane stresses (, ox, s uy, and
sz7) to the composite section strains ( E x E y, and Yxy)
S X
STEXy
I VV I
00
[ K]s -v
Eu
Eyx0 0 1-v2
© Amit H. Varma, School of Civil Engineering, Purdue University, West Lafayette, IN 47906

FORCE EQUILIBRIUM OF COMPOSITESECTIONo Static force equilibrium diagram for the CFS composite panel /
element subjected to membrane forces (Sx, Sy, and Sxy) per unitIp n xfth. (in -)
cyt~T 4 ý
Sx
Sxy
0F 00poit
~sxy
S x
,. o y'V V
c'17
A07 )r
C- V t,.
VT.
S T y '
rF- ý' ( QtS T t S IS, t
Wc'4 afiyte IN 47906© Amit H. Varnma, School of Civil Engineering, Purh{* University,

FORCE EQUILIBRIUM OF COMPOSITE SECTION
saox C 0So Say x2t + c xy T
StY S y XY
SS c co~b
Sy - 2ts [K]s •y+ [K]c cy
Yxy Sxry
o For the applied Sx, Sy, and.Sxy, solve the equation© AabOmaetmcgetf c& iIngpen•[•Mn duef*,rsity, West Lafayette, IN 47906 i. i.
d LL

FORCE EQUILIBRIUM OF COMPOSITESECTION
o After obtaining the strains, calculate the steel platesstresses and concrete stresses using the followingequations:
0•
scx
sGy -[K]sS•X yxy
Oorl 0 0
E 0Oorl 0
0 0 0
sap 2 -[T],.
0
S x~
s'VS
S
d
7
C UPI
c ap2
0
[T]eyX
E'y
© Amit H. Varma, School of Civil Engineering, Purdue University, West Lafayette, IN 47906

DESIGN CHECKS AND LOAD RATIOS
o Establish yielding of the steel plates. Calculate the VonMises stress caused by the loading
UVM SOUp 1 sOp2 s Tpl * s ap2
o The load ratio to cause yielding = Fy /OuvM
o Since the concrete was assumed to remain elastic, checkthat the minimum principal stress (compressive) is still inthe elastic range, i.e.,
cyp2,p 1 0.70fc:
o This entire process can be automated easily to determinethe behavior of CFS panels subjected to a variety ofin-plane membrane force combinations
I,9
0,
© Amit H. Varma, School of Civil Engineering, Purdue University, West Lafayette, IN 47906
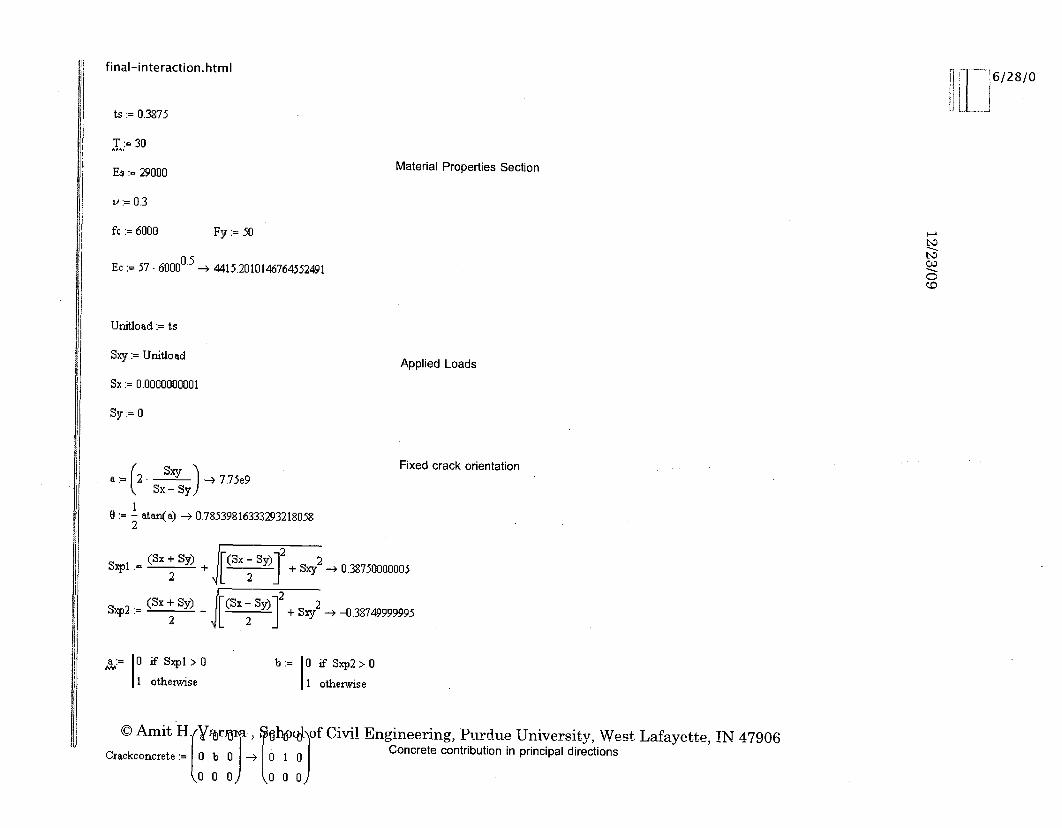
final-interaction.html IF -- '6/28/0
ts := 0.3875
T..:= 30
Es := 29000
v:= 0.3
fc := 6000
Material Properties Section
Fy:= 50
Ec := 57 . 60000.5 --- 4415.2010146764552491 CDcc
Unitload:= ts
Sxy:= Unitload
Sx:= 0.0000000001
Sy:= 0
Applied Loads
:=2 -Sxy - 7.75e9 Fixed crack orientationSx-ly)
0:= - atan() - 0.785398163332932180582
SXpl :-(Sx Sy) + ' + Sxy2 -- 0.387500000052 [2
Sxp2 (Sx: + Sy) -lY) 2 +S 2 -0.387499999952 J- 2 j
La:= 10 if Sxpl>0
1 otherwise
b:= 10 if Sxp2>0
1 otherwise
© Amit HfYTr a, 01-W of Civil Engineering, Purdue University, West Lafayette, IN 47906
Craciconcrete 0.[ b0 0I _3> f 1/ Concrete contribution in principal directions0ou 0) o oo)

final-interaction.html
U L -J
E
t s x1Strains := Totstiffess- I . Sy
Sxy
(0.00001341364243137941753194
0.00001341364242623966630965
0.00003983307197549749994407)
Strains from Force Equilibrium
0.555708043536580445407717718
Steelstress := - . Strains -- 0.555708043421924456602857018ts 0.444291956649779807062344912
(1.00000000012903225307151014Steeltxans Stresstrans Steelstress -+ 0.1114160363294726439391346661 1
K6.98147263681860780342587348e-21
C-0.0143557911130233281729035635Ccncretest~iffe ssK
Concretestress Strains -- -0.0143557911217330484621370571TT0.01435579111988063331736342772
-3.2717216691711313940852610208e-23
Concprinstress Stresstrans Concretestress --- j -0.023711582239761376635007908383
\-1.3311083432742040945524135676e-23
Steel Stresses
Steel Principal Stresses
Concrete Stresses
Concrete Principal Stresses
N.
Co
Steeleffstress j(Steeltans0 )2 + (Steeltrans1 )2 - Steeltranso0 Steeltrans -- 0.94920••5•90230090630320192014Calculating the von-mises stress
Load ratio to failure hy yieldingLoadrratio := - 52.6754460107144273242333455973
Steeleffstress
JLI© Amit H. Varma, School of Civil Engineering, Purdue University, West Lafayette, IN 47906


PURE SHEAR BEHAVIOR
o For pure in-plane shear loading, the appliedmembrane forces Sx and S will be equal to zero, and Q0
the in-plane shear loading will be equal to Sxy.a The principal direction ( 80) =tan-1 (inf.) = 450
0 The principal forces will be equal to Sxy inmagnitude; SP, will be in tensile and S will becompressive.
o Concrete cracking will occur when the applied in-plane shear (Sxy) exceeds the tensile crackingstrength (Set) of the composite CFS section
4 f'Sc, =(41 hE,) T, + E 2ts X 12 kipsift
0 Amit H. Varma, School of Civl IEngineering, Purdue University, West Lafayette, !N 47906

PURE SHEAR BEHAVIOR
" The in-plane shear stiffness before the concrete.Ncracking limit state can be calculated as:
Kcr = GsAs + GcAc = E t ECC kips/in2(1 + vs) 2(1 + vc)
" The concrete cracking planes will be perpendicular todirection of the principal stress Sf1, i.e., at 1350.
" The principal direction Op will be equal to 450.Substituting this value in the equation for [K],
© Amit H. Varma, School of Civil Engineering, Purdue University, West Lafayette, !N 47906

PURE SHEAR BEHAVIOR
F 7-
sin(% )
- sin(20p)E"4[I + cos(2Op)
- cos(2Op)- sin(2O0,)
1 - cos(20p)
I + cos(20p)
2 sin(20p)
-2sin(20p) 1-Oorl 0 0
0 Oorl 0
0 .0 0
1 + cos(20p)
1 - cos(20p)
-2 sin(20)
1 - cos(2Op)
1 + cos(2Op)
2sin(20,,)sin(20p) 2 cos(20p)
o Substituting 0 p=450 The concrete [K], becomes
2cos(20p)
F]
[K]cc'
4
11
11
-1-11
cory =[K]cLx
EY
Try-1 -1
© Amit H, Varma, School of Civil Engineering, Purdue University, West Lafayette, IN 47906

PURE SHEAR BEHAVIOR
o Force Equilibrium for Pure Shear 0.
00
S -9
2Est
1- v 2
I VV I
00
+ T 1-•-•_11
11 11j
Lx
Ey
Y-r0 0 1-v2
o Solve simultaneous equations to get the strainsand calculate stresses etc. for pure shear case
• Sxy Ka2ts Ka+ K0, Ox~ •,, -c• K, K7
1Ka = Gs2ts ,P 4 +2(1-v)
ivil Engineering, Purdue UniverquR W.est L,•2qtstte, 'N 47906ii [Sii© Amit H. Varma, School of
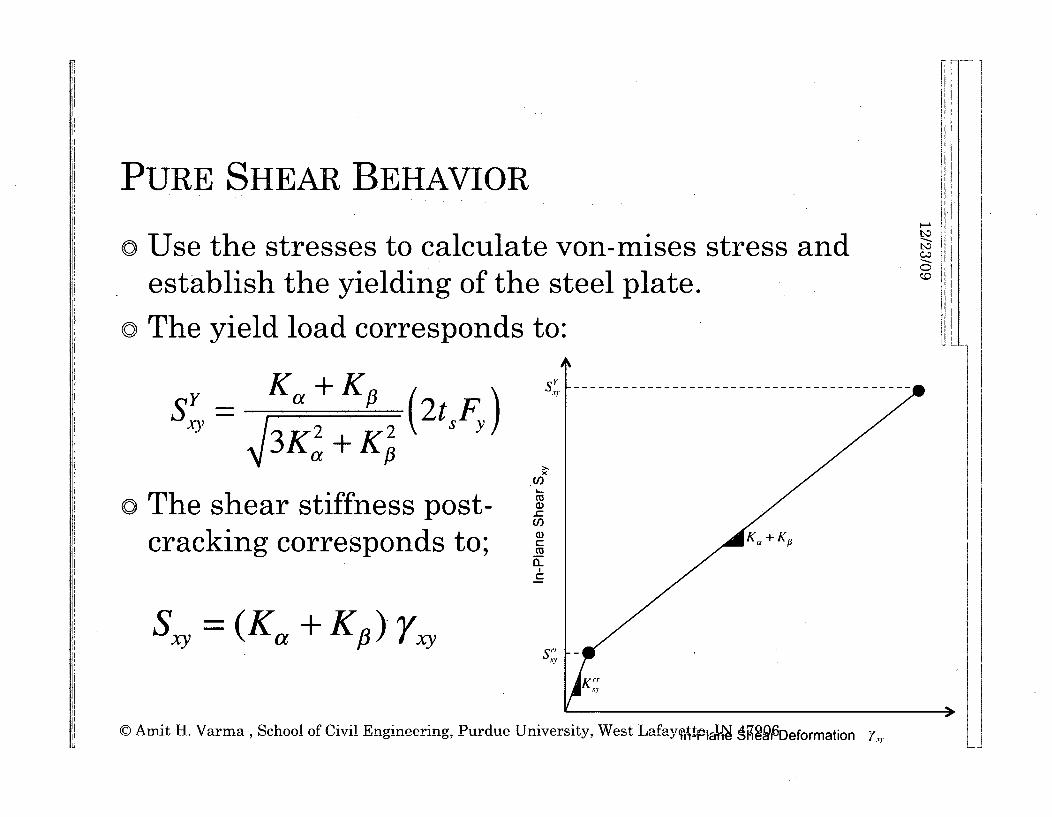
PURE SHEAR BEHAVIOR
" Use the stresses to calculate von-mises stress andestablish the yielding of the steel plate.
" The yield load corresponds to:
v Ka+K (2tF)
x
CU" The shear stiffness post-CCD
cracking corresponds to; K) +
SXY = (Ka + Kp) yx.y-
© Amit H. Varma, School of Civil Engineering, Purdue University, West LafaytaTAT AeQan6 Deformation Y.,*

PURE SHEAR BEHAVIOR - PARAMETRIC STUDY
Effect of Concrete Thickness on In-plane Shear Strength and Stresses
Assumed 0.5 in. steel plate thickness with Fy = 50 ksi
____ "9y __'._ -lay- __T C a ,Concrete Ka KP AsF,
Tr (in.) (kips-ft/ft) (kips-ft/ft) s y y Ff f
18 133846 99852 0.93 0.40 0.53 0.24 0.48
20 133846 106206 0.94 0.42 0.52 0.23 0.45
22 133846 112040 0.95 0.44 0.52 0.21 0.43
24 133846 117414 0.97 0.45 0.52 0.20 0.41
26 133846 122381 0.98 0.47 0.51 0.19 0.39
28 133846 126986 0.99 0.48 0.51 0.19 0.37
30 133846 131266 1.00 0.49 0.50 0.18 0.36
32 133846 135256 1.00 0.50 0.50 0.17 0.34
o0,
34 133846 138983 1.01 0.51 0.50 0.16 0.334 4 I 4 4 4 4
36 133846 142472 1.02 0.52 0.49 0.16 0.32
© Amit H. Varma, School of Civil Engineering, Purdue University, West Lafayette, IN 47906

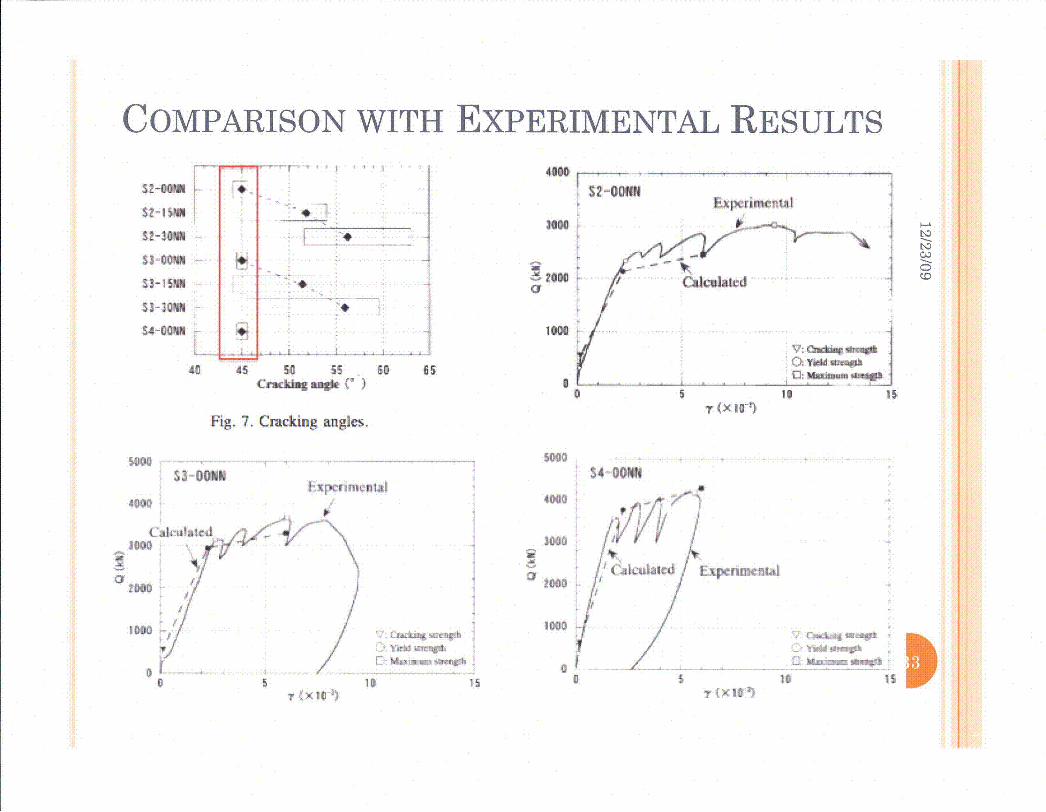
COMPARISON WITH EXPERIMENTALRESULTS
o Japanese Tests by Ozaki et al. (2004)Aval•oble onlonem o wwwscencedh'ecr,cor Nuclear
SC19eNCE CkltCTO
IR'° Engineenng7 . .. . .and DesignELSEVI ER Nuclear Ewtgimecting* ad Design 22A k0l(-) 225-244 Design
Study on steel plate reinforced concrete panelssubjected to cyclic in-plane shear
Masahiko Ozaki a, Shodo Akita b, Hiroshi Osuga *,
Tatsuo Nakayamad, Naoyuki AdachicOffiCe #fN Uin•rt erq derwd Arhiee.•re HeMd*ani;m Te, Katai Eteerfiter Cr. ieC.. O.Meaka, Japant
-,iture.a Facilhies Di••siont, Otxvas, CS fA • ,i ta-K, Taklo, J.h,.r.
Received 19 Febwarv 2002; received in revised form 8 June 2003- accepted 10 June 2003

COMPARISON WITH EXPERIMENTAL RESULTS
o Japanese tests of Ozaki et al. (2004)'Table 2Test specimen (research program 1)
-7
Specimens Surface steelplate (1) (mm)
Headed stud bolt Nodal force(MPa)
ND
Pitch in welding (il) (mm) Diameters (mmm) H11
S2-ONN' 763 430 -60.0 I~S2 KSN -- L47$2-30NN• 2.94
S3.3ONN 2.94 -
S3-00PS 01.0 Studs were weldedS3-00PN Without studs
. .. . . 3 . . . . . ..13. . . . . 7
Table 4-...."'.-- .- ... ..-.. ............................... ... -..-- .- ,- . ..-- - - - -.... ....... .............--.......- ' ......--- -- ................................ ............... .. .................. -. -
Experimental results
Specimen Steel Concrete Elastic shear ost-or,-c king Cracking Yield strength Mmximurt stnngthmWdulus sgemny modulus streng__ __
Yield stress, A.,. x A,, Compressive stringth. G, QG. y, ., (ys) y, (x10-3) Q. (kN) y", (Yio",)Yuung's (cm;) tangential stiffness (x I W MPa) (x 103 MPa) (kN) (x l10')modulus (MP;" (MI'
*FS2-OONN 340 (1.97xl06); 53.5 (17.1) 42.2 (2.72 x 10ý') 12.4 4.16 293 0.115 2290 (-2110) 2.50 (-1.99) 29&60 (-2780) 9.41 (-6.12)"S2-5NN... . .. .41-6 (277 k10-) 13.2. ....... 44--:--.-- -- 433.... 0133- .... 2330 (-2290 2.71'2.21)• 10 -- 2931) -1)0'(-6.2)S2-30NN 42.0 (2.79 x 101) 16.4 3.69 542 0.168 2491) (-25710) 3.01 (-2.41) 3110 (-3200)) 10.48 (-6.03)
S3ON S(L"9X 10') 75.4(16.9) 41.9 (2.71 x 10") 12.9 4A8 311 0.134 -351)0 (-3070) 3.01 (-2.W1) 3610 (.-34-30) 6.05(-.3SS3.1SNN~ .................................. . • E-4r6-2.67-×-0'• ..... 13:1 .......... 429 " ............. 384 .... 0.141 ....... 3E13(-(=3t20 .. 2L99 (•.3.01V[) 3760 ('=3330) ~"4•"¢9 f<.6.01IY
S3-30NN 40.1 (2.70x 10') 11.9 4.67 385 0.186 3171) (-3080) 2.80 (-2.96) 3730 (-3551)) 5.57 (-5.635S3-0OPS 75.4 (25.4) 41.9 (2.71 K 104) 13.1 5.81 350 0.141 2680 (-2640) 1.93 (-1.97) 3580 (-3220) 10.87 (f-5.98)S3-OOPN 39.9 (2.72 x 10⁴) 16.4 4.92 271 0.113 2350 (-2390) 2.01 (-2.03) 3510 (-30605) 17T0 (-6.02)
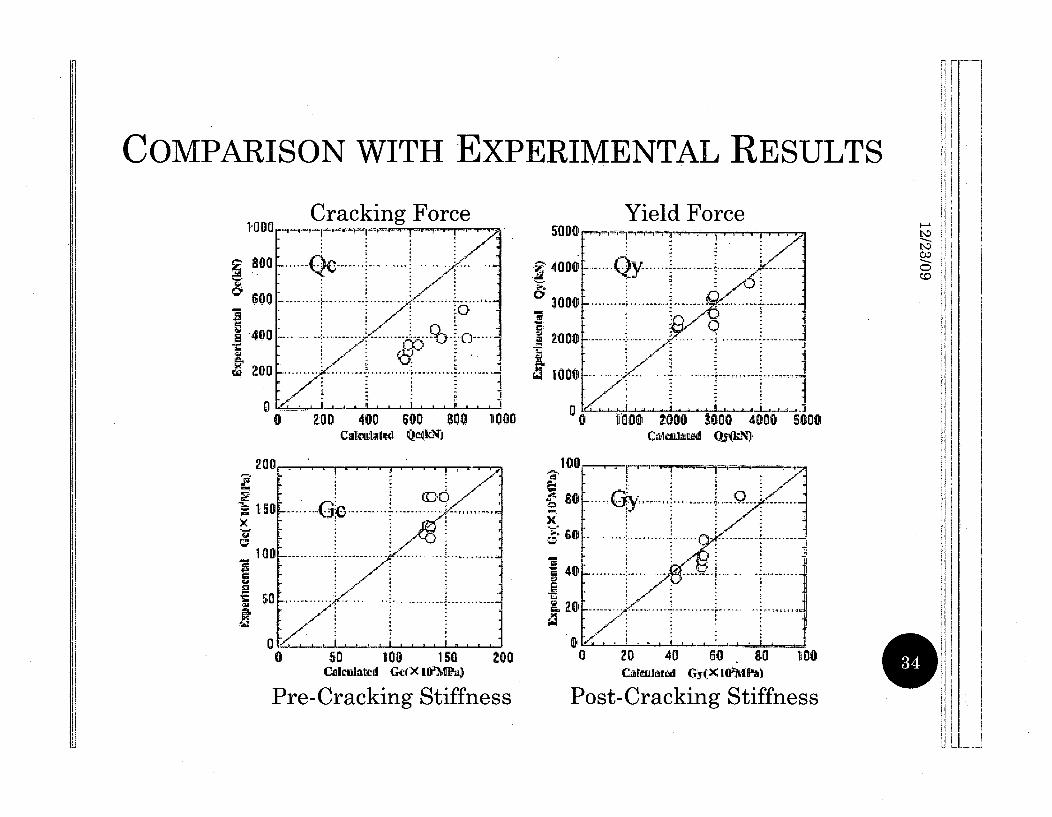
COMPARISON WITH EXPERIMENTAL RESULTS
SZ-OONp
SZ-I NN
SZ3m
S3-15NN
S3-3ONN
S4-OOdN
-4
4000
3,00
SZ-OOff#4
40 4St
5s 55 so 65Crackngmii( M&
V: -O wbor Sr-otO•Y" WIt j
o) Maamn0a Ii
Fig. 7. Cracking angles.
S00S3 OONN $4 000
I xrk r mijilat4000 a..
34o10 .1 ,I V
I0
//I100
LWxff7mA-7
to
I
'2Of 0'
0 IsD5 10 is
I
COMPARISON WITH EXPERIMENTAL RESULTS
Yield Force,_II111HII . ,. , . , ,, , ,.> , ,.
3000
0(
-77S.......... .. .........
0LO
II
0
7nn
0OD 400 600 800 1I000CacIM1i419 QcekN)
1'0Q00 2000 1000 40,00 R(Calculate~d "ýk]LN
00
tuo .......... .(3.'•............ I ........... •• ....... 7+b150..443
0 0
0 510 10t 150 200Crlaclkted G StX iffne
Pre-Cracking Stiffness
d
x
1001 . _ '- • '-- -• + "•
40 7
r i + ,,,
0 ,____ _____ i i0 20 40 60 go 100
Post-Cracking Stiffness
Ii

COMPARISON WITH EXPERIMENTAL RESULTS
o Tests conducted by Lee, Choi, Hong, and Lee in KoreaThe 5' International Symposium on Steel Structures
March 12-14, 2009, Seoul, Korea0
In-Plane Shear Behavior of Composite Steel Concrete Walls
Myung-Jae [email protected]
Department ofArchitecture, ChungAng University, Seoul, Korea
Byung-Jung Choi
Department of Architecture, Gyungi University, Seoul, Korea
Sung-Gul Hong and Eo-Jin Lee§glhon.•[email protected]
Department of Architecture, Seoul National University, Seoul, Korea
~~~~1
Designation Thickness Diameter of Spacing Amal Force Axial
(mm) Stud (amm) Ratio ForceI (,p-rm•) N% (kN)S30/400 F3.2
"lTAA'l 10 0
S30/400 F3.2 0 0NO0-2 3.2 6-57 100N8U14UU kJ.2N08
6
H~

COMPARISON WITH EXPERIMENTAL RESULTS
o Setup used by these researchers tries to simulate a large panel zonein beam-to-column cru
o The setup worked ok.
iciform
First specimen failed due to welding failurewCDQ0o
. .. . - - - --
-... -: ,,, --- --- ---I:J)
II)-c(I)
i* 'p S I 1
...... i .. .. .. . . . . . . . .. . . . . . .
* I I* I I I
* I I I
* I
-- M./40 FS .2 MOS
...... 3ffi1400 F-5.2 Nac0-2
3•J400 F- .2 NO0-1
Shear angle( -x 10- Rad )
Figure 3. Shear Behavior of SC walls without stiffenerFigure 1. Loading Set-up for Pure Shear

P•
COMPARISON WITH EXPERIMENTAL RESULTS
iotograph showing 45 deg. cracks in concrete for the pure shear specimen
bF
Figure 5. Diagonal Cracks in Con~te

COMPARISON WITH EXPERIMENTAL
RESULTS
Table 3. Strength of Non-Stiffened Steel Concrete panel
Max MaterialUltimate Shear Yield Stregth
Specimen Shear Angle Strength Specification s(Q kN) (rad (kN) (kN) steel conc.
x 10-3) ...... (MPa) (MPa)S30/400
F3.2NOO-1
2019 4.39 1601 2233 297 36
S30/400F3.2 257 6.46 1601 2233 297 36Noo-2
F3.2 N082900 13.6 1601 2262 297 36
SAs Fy- 1200 mm x 3.2 mm x 2 x 297 N/mm 2 2 N

IN-PLANE BEHAVIOR
" Used the Mathcad program to analyze the CFS NDelement for different combinations of membraneforce (tension or compression) and shear force.
" The limit state was always yielding of the steel plate,and the concrete stresses were limited to the elasticrange (less than 0.70 e)
" The last point on the compression + shear portion ofthe curve had concrete stress equal to 0.70 fc
© Amit H. Varma, School of Civil Engineering, Purdue University, West Lafayette, IN 47906di

Combined Membrane Forces (Sy and Sxy)
1.6Compression +'Shear
0E-
I-
'.
w
a_C,'U
Corea
ncrete stress 1.2
Lched 0.7f,
Tension.... ... ~ 0.6 ...
eel yielding governs iailurepoai~rnglfr~Liniits !
csthak 0 7f 0.2nerete stress- less ta0 f
0O
+ Shear
St
Cc
-2.5 -2 -1.5 -1 -0.5 0 0.5 1 1.5
Axial Force / As Fy (Positive Tension, Negative Compression)
© Amit H. Varma , School of Civil Enoxinpering, Pirdue University, West. Lafavptte, IN 47906

IN-PLANE BEHAVIOR WITH SY AND SxY
o Combined effects of axial force (Sy) and in-plane forceSxy.
o Results obtained using Mathcad sheet.o Assumptions - Concrete remains elastic (checked by
making sure that concrete principal stress is less than0.7fc).Concrete has no tension strength
o Note the change in shear strength with axial tensionand axial compression.
o Axial compression increases the in-plane shearstrength.
o Need more sophisticated analysis to investigate thebehavior of CFS panels elements to membrane forces".
© Amit H. Varmna , School of Civil Engineering, Purdue University, West Lafayette, IN 47906--
LIMITATIONS OF MATHCAD APPROACH
" The concrete material model was elastic with nocompression yielding possible. This limitationbecomes significant for cases with largercompression + shear.
" The mathcad program assumes zero tensionstiffness and strength. This is conservativeassumption but needs refinement
a Theory is not verified using independent finiteelement analyses
© Amit H. Varma, School of Civil Engineering, Purdue University, West Lafayette, IN 47906I

I

NONLINEAR FINITE ELEMENT ANALYSISOF CFS PANELS TO IN-PLANE FORCES
" Three different types of modelso (1) Shell Solid (SSo) Model
o (2) Shell Shell (SSh) Modelo (3) Layered Composite (LCS) Shell Model
" Three different concrete material modelsS(1) Smeared cracking - linear Drucker-Prager -
associated flow rule concrete modelo (2) Concrete damaged plasticity model - smeared
cracking - parabolic Drucker - Prager - non-associated flow rule - and damaged elasticity
o (3) Linear elastic orthotropic model for crackedconcrete
© Amit H. Varma, School of Civil Engineering, Purdue University, West Lafayette, IN 47906
Fr
C
p1!'IU

INPUT PARAMETERS
o Steel stress-strain curveN.
ND
C4-
.C
ho
C
w
100
90
80
70
60
50
40
30
20
10
0
U,
InU,a,1..4.
a,
1~I-
100
90
80
70
60
50
40
30
20
10
0
r-- - --
m,---
+ E) "eI r = •(1 + e) -
4
i
0 0.02 0.04 0.06 0.08 0.1 0.12 0.14 0.16
Engineering Strain (in./in.)
0.00 0.02 0.04 0.06 0.08 0.10 0.12 0.14 0.16
True Plastic Strain (in./in.)
0d© Amit H. Varma , School of Civil Engineering, Purdue University, West Lafayette, !N 47906

INPUT PARAMETERS
o Concrete compression and Tension behavior
U)
0
CL
E0a)
6.0
5.0
4.0
3.0
2.0
1.0
0.0
350
300
" 250
200I_
150
100a)
Tension stiffening stress-strainusing Chang and Mander (1987)
Tension stress-strai,,nfrom fracture energy0u
0 'U
0 0.001 0.002 0.003 0.004 0.005
Compressive Strain (in/in)
G
Tensile Strengtho
0.0000 0.0002 0.0004 0.0006 0.0008 0.0010
Tensile Strain (in./in.)
u
Frastuu.= 2G 1/cYio
IlL
n) Amit H. Vqrmrq School of Civil Engineerinpg Piirdiipe University ing displacementu,
R FF-
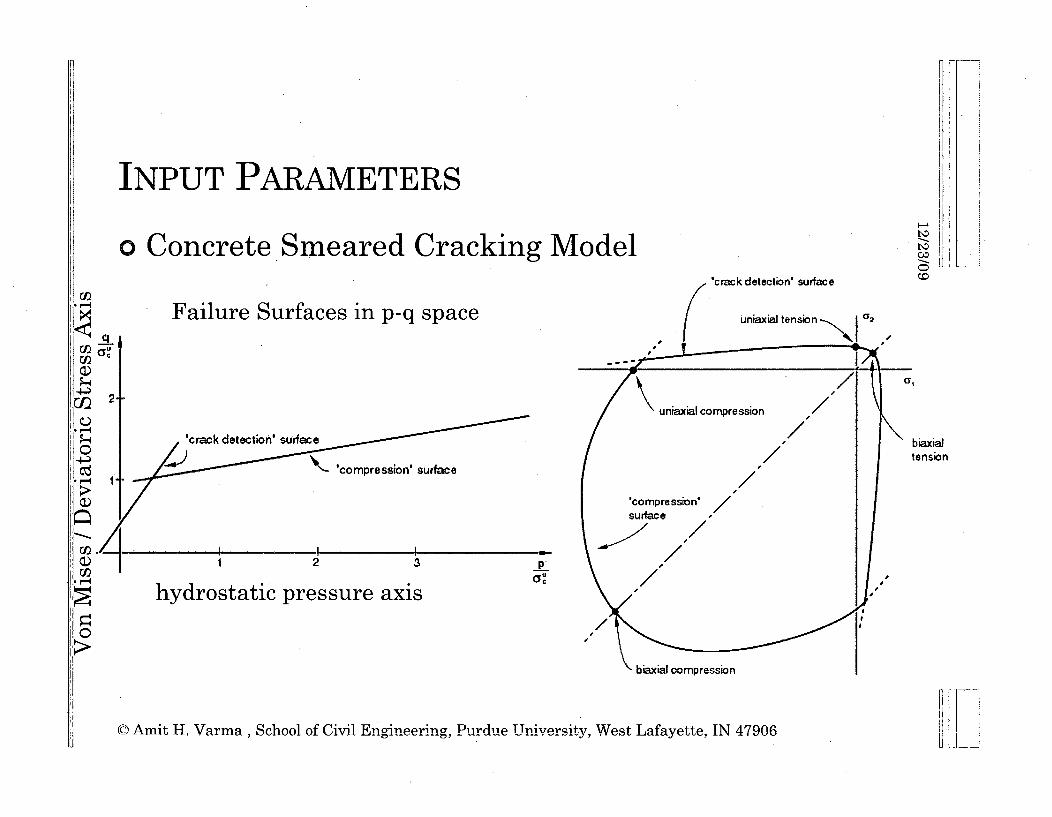
INPUT PARAMETERS
o Concrete Smeared Cracking Modelc e s
'crack detection' surface Q
0
4a)
CO)
Failure Surfaces in p-q space
'crack detection' surface biaxialtension
1*1-compression' surface
I p
hydrostatic pressure axis0
ii© Amrit H. Varma, School of Civil Engineering, Purdue University, West Lafayette, IN 47906

INPUT PARAMETERS
o Concrete Damaged Plasticity
-S 2 -S" I
,Kc= 1biaxialtension
OL(&- 3a • )= o
Figure 4.5.2-5 Yield surface in plane stress.
© Anit H. Varma, School of Civl! Engineering, Purdue University, West Lafayette, IN 47906Ii7 Jid I . .. I

NONLINEAR FINITE ELEMENT ANALYSIS(a) (b) (c) I--
SteP: Step-1 Step: Step-1 SteP: St p-iIncrement 100: 1AAc 10.00 !Increment 100. Arc M 000 I1ncremen.t 100. Arc =10,00
I
I
(d) (e) (f)
Figure 5-7. Details of SSo model:(a) Model with mesh and boundary conditions.(b) Steel plates with shell (S4R) elements, fully tied to concrete elements(c) Concrete infill modeled using solid (C3D8R) elements(d) Loading applied as uniformly distributed shear traction on the concrete element surfaces(f.•teel retprf tied toP Uioncd tU st.. .
I

NONLINEAR FINITE ELEMENT ANALYSIS(a) (b) (c)
V1VVJlJO0: 1 ODH: C: l(Itill -,;0 SSO StIlVdi f2d S44111.0(th Viewliml: 2 ODD: C: Teitip A) SSo smemed stiim.odli ViiAupoit: 3 ODH: C: I emp 3D SSo striedi ed sliain.o(lb
8, Mises
SNEG, (fraction 0 -10)(Avg: 75%)
+6 521e+01+6 520e+01+6.517e+01+6 516e+01S+6 515e+01
S, Min. Principal(Avgt 75%)
-2.346e+00-2.354e+00-2.362*+(00-2.371e+00-2.379e+00-2.388e+00
C.Q0
Step, Step-1Increment
SII,ý Arc 48- Ar, 48A A
CI
1.00
0.80
0.60
0.40
0.20
1.00
I 0.80
0.60
0.40
0.20
n nn
1.00 0
0.80
0.60
0,40
0.20
0,00. I*-
-3.0 -2.5 -2.0 -1.5 -1.0 -0.5 0. 0Concrete Stress (Min and Max Principa 0
smaxn-lpf-nsmeared- strain
smin-lpf-smeared-strai7
I . .
0.0 1.0 2.0 3.0 4.0 5.0 6.0 7.0 [x. E-3J
Shear Strain (e12)
1 e12-lpf-sr..e. red-strain
0. 10, 20. 30. 40, 50. 60, FyVon MWses Stress (Steel Plate)
mises-.pf- smeared-,st-a.
(d) (e)
Figure 5-8. Results from SSo model with smeared concrete cracking model (tension stiffening stress strain curve):(a) Model with boundary conditions,(b) Von Mises stresses in steel plate when shear force ratio (Sxy/AsFy)=1.0,(c) Minimum principal stress in the concrete when shear force ratio=1.0,(d) Shear force ratio (Sxy/AsFy) vs. shear strain response,(e) Shear force ratio (Sxy/AsFy) vs. Von Mises stress in steel plate, and
(f) Shear force ratio vs. minimum and maximum principal stress in concrete.© Amit H. Varma, School of Civil Engineering, Purdue University, West Lafayette, IN 47906
I

NONLINEAR ANALYSIS - SSH MODEL
djewpoll: I 0DR Temp-11) ssh Model (111m, sinealml sti'llmodh vivv4poll: / 00t]: C: lemj)'31) syl Model Colic Y'llvalod %h'timodh vlowport: R 01)[1: (!:ý Ivillp ýfl) ssh Model Conc sIrIPM (41 sl[AM
I
Lsz~L\Z~
0
Step; Step-i am I
I
I I
(d) (e) (f)Figure 5-11. Details of SSh model:(a) Model with mesh and boundary conditions.(b) Steel plates with shell (S4R) elements, fully tied to concrete elements(c) Concrete infill modeled using shell (S4R) elements, boundary conditions included(d) Loading applied as uniformly distributed shear traction on the concrete shell element edges(e) Steel plates tied to concrete(f) Concrete surfaces tied to steel plates
C Amit. H. Varm School of Civil Enginemring, Purdue University, West Lafayette, IN 47906
p

NONLINEAR ANALYSIS - SSH MODEL
-V"
0.8
0.6
0.4
0.2
0.0 L L L0.00 0.05 0.10 0.15 0,20 0.
a1.0
0.8>
0.6
0.4
0. 10. 20. 30., 40. 50. 60.
Stress Fy
1
0
0
0
0
0,
.20
.4
.2 0 - 20 -1 1 5 Q
IC'-4C12
a)25 Stress -V¸Displacement
I-umag-Ipf-shell- smeared -strainSsmn-Ipf- shell- smeared- strainsomn-lpf-shell-conc-smeared-sttrn
I I
U
Figure 5-13. Results from SSh model with concrete smeared cracking model (tension stiffening stress-strain curve):(a) Von Mises stresses in steel plate when shear force ratio (Sxy/AFy)=1.0,(b) Minimum principal stress in the concrete when shear force ratio=1.0,(c) Maximum principal stress in the concrete when shear force ratio=1.0(d) Shear force ratio (Sxy/AsFy) vs. shear strain response, 0(e) Shear force ratio (Sxy/A6 Fy) vs. Von Mises stress in steel plate, and(f) Shear force ratio vs. minimum and maximum principal stress in concrete.
© Amit H. Varms , School of Civil Engineering, Purdue University, West Lafayette, IN 47906

NONLINEAR ANALYSIS - LCS MODEL
Ede todel Vieot y•ew Matria ••tion Prof•e Composite Assign Special Featwe Tools Plug-ins Help IN?
-1 w~ + " ~ I :xh4 ý 11 .W A
1.1i , 2 3 4 Propertydefiaut• F'• fl •Name: CompositeLayup- !C.
Module Property " Model: Model-I v Part: CFS-composite v Element type: Conventional Shel Description:.
•" •Layup Or rntaton
:k*•Definition: Par t glba
•'4 Section wiegratr,: m During analysis :'2 Before analysis
teRot integratra rule: Co) Simpso r
Ply Nai Region Maer-ial Thickness CSYS Roating oInter
"I V Ply-I (Picked) steel 0.1875 <Layujp> 0 3
2 V Ply-2 (Posked) doneraede-Smeared-Siraahn 13.125 <tayted> hs9
+3 V" Ply-3 (Pick~ed) Steel 0.1875 <Layup> 0 3
Ft i he copspteifi upedvitwort wedpinealoiegV\ektp3S~-oltfThe model database "C \ýTemp\3D-concrete-smeared-092109.cae" has been opened
Th peci f ead viewports were pr inted to f ile "Y Desktop\3DSSo-de t if "
The model database "C \Teap\3D-SSh-xodel cae" has been openedThe specified vievports were printed to file "Y \Desktop\3DSSh-model tif"The model database "C \Teop\3D-Layered-Shell cae" has been opened
Figure 5-15. Layered Composite Shell (LCS) model with ply details, boundary conditions, and shell edge loading.
) Amit H. Varma , S'hool of Civil Engineering, Purdue University, West Lafayette, IN 47906

NONLINEAR ANALYSIS - LCS MODELSTENSION STIFFENING AND FRACTURE ENERGY
oL4 C,
I-
-3.0 -2.5 -2.0 -1.5 -1.0 -0.5 "0J
Concrete Stress (Min and Max. Princip
srax-lpf-LCS-smeared- strainsrnx -Ipf-LSM-smeared-frauctu
srnin-lpf-LCS-srnear-strain
srin-lpf-LSM-smeared-fractur.
Figure 5-16. Results from LCS model with concrete smeared cracking model (tension stiffening and fracture energy):(a) Model with boundary conditions(b) Deformed shape and Von Mises stresses in steel plate when shear force ratio (Sxy/AsFy)=1.0(c) Minimum principal stress in the concrete when shear force ratio=1.0(d) Shear force ratio (Sxy/AsFy) vs. shear strain response(e) Shear force ratio (Sxy/AsFy) vs. Von Mises stress in steel plate
(f) Shear force ratio vs. minimum and maximum principal stress in concrete.
© Amit H4 Varm, School of Civil Engineering, Purdue University, West Lafayette, IN 47906
I

NONLINEAR ANALYSIS - LCS MODEL WITH
ORTHOTROPIC ELASTIC MODEL
1.2
0.8
0.4
T I I I I
0.4
1. 2
0.4
C-o3ne0 -2.5 -2.0 -1.5 -1.0 -0.5 .0 CConcrete Stress (Mmn and Max. PrncipI .. .. ,-.. -... . .. . . . . "0.0 1.0 2,0 3.0 4.0 5.0 (x1.E-3J
Shear Strain (e12)
e2-1pf-LCS-smeared-strai.e12-1 pl _rtho
0.10. 20o 30. 40. 50, o60 y
Von Mises Stress (Steel Plate)- mises-Ipf-LCS-smeared-strain I
M rises-lpf-ortho I-ma ×-prC-L.-sme are - stra
$na .-Ipf-ortho
- -sm~n-Ipf-LCS-smear-strains-nin-lpf-ortho
I
Figure 5-18. Results from LCS model with orthotropic elastic concrete model:(a) Model with boundary conditions(b) Deformed shape and Von Mises stresses in steel plate when shear force ratio (Sxy/AsFy)=1.0(c) Minimum principal stress in the concrete when shear force ratio=1.0(d) Shear force ratio (Sxy/AsFy) vs. shear strain response(e) Shear force ratio (Sxy/A 0Fy) vs. Von Mises stress in steel plate
(f) Shear force ratio vs. minimum and maximum principal stress in concrete.
© Amit H. Varma, School of Civil Engineering, Purdue University, West Lafayette, IN 47906

NONLINEAR ANALYSIS USING ANALYTICAL
MODEL WITH ORTHOTROPIC CRACKED CONCRETt9
Combined Membrane Forces (Sy and Sxy)
1.60
or
0LL
4-
M
0-
a.
1.4
1.2
0
-0.5
1 -1
LL
'C- -2C.
-2.5
In-Plane Interaction in Spl - Sp2 SpaU!
0.5 1 1.5 2 0 2.5
0.8
0.6
0.4
0.2
-30
-2.5 -2 -1.5 -1 -0.5 0 0.5 1 1.5
Axial Force / As Fy (Positive Tension, Negative Compression)
Principle Force 1
28S3tan(2Op) = -
St-S'
(l + cos(261 ,)2
(1 -cos(20 )+ 2 SY. + sin(20p ) S,.V2-"
S•2 (1-cos(2OP)2 (l±cos(2Op),6'2= S+(I S. - sin(20p ) S-,,f Amit H. Varma ,School of Civil Enr.gneer.ng, Purdue University, West Lafayette, IN .7906
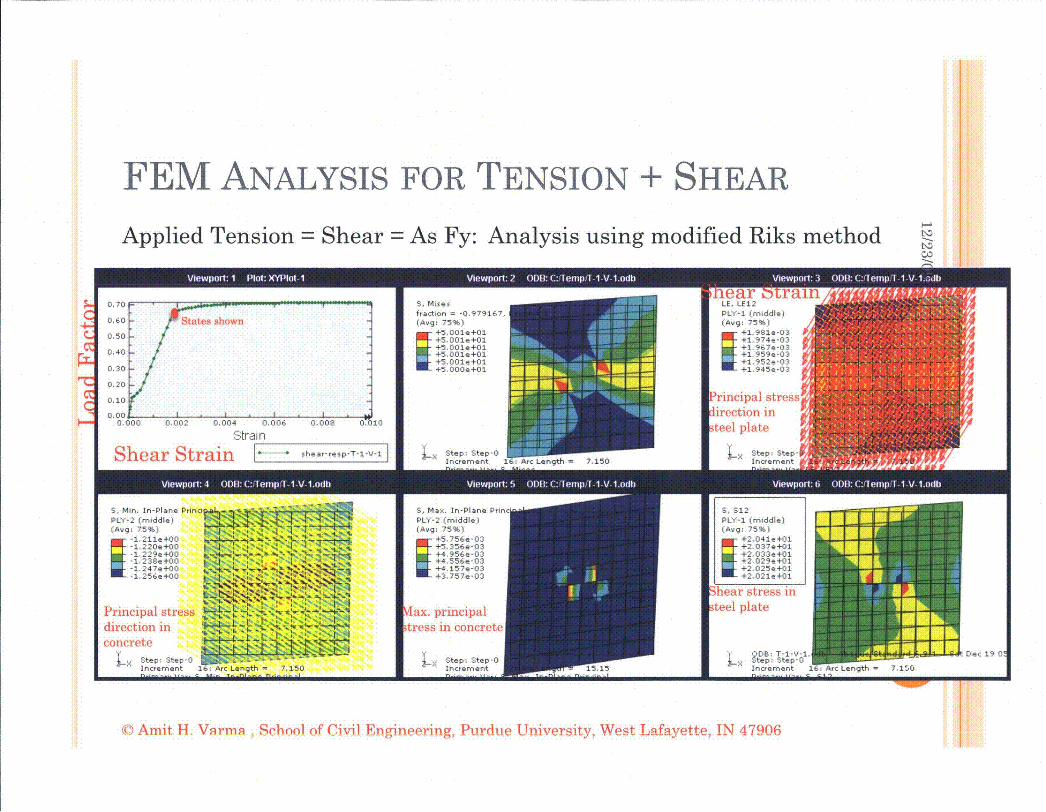
FEM ANALYSIS FOR TENSION + SHEAR
Applied Tension - Shear - As Fy: Analysis using modified RikE
= U R I M M U M M E e a r k~ r0.70 S, Mises LE, LE12fraction = -0.979167, PLY-i (middle)
0.60 States shown (Avg: 75%) (Avg: 75%)050 +5 001e+01 +1 ,981e-03
0.5 •+5 .001e+ 01
+1:974e-030. 40•
+ 5 00 1e + 0 1 + 1 9 6 7e -0
0.0•+5.0O01e+ Ol
+1 .959e-03+5.001e+01
+1.952e-03
0 .3 0 + -+5 .0 0 0 e + 0 1+.O l 9 4 5 e -0 3
0.10 Principal stref
• 0.20
0.00 d irection in0.0o00 0.002 0.004 0.006 0.008 1 "-1- o
method
MVr
Mosom
1100mr"RENk
IML
MAIft,IMMýjMMMIL
A Off ii FRO MR
© Amit H. Vqrmq , Schnnl of Civil Engineering, Purdue University, West Lafayette, IN 47906

FEM ANALYSIS FOR TENSION + SHEAR
CRACK ORIENTATION FOR CASES (PROPORTIONAL LOADINI3)TIV=1/8 TIV=0.75 T/V=0.5 T/V=0.75
I I Ifraction = -0.979167,
S, Ma., In-PMin. In AI
S, Out-of-PM
fraction = -0.97916,
• S Max. In-S, Min. I160
S, Out-o9
fraction = -0.979ý
S , Max. In;
S, Min. Ir
s, Out-o•I
fraction = -0.979:
SS MaxnnS Min. Ir
S, Out o~I
ýx Step: StepIncrement 100: Arc Length = 49.15S Stepr Stepent i P00rLt I • ntep Ste P
Increment 100: Arc Length 49.15 Inecrement 100: Arc Length = 49.15 I ýx Step: Step 0 IIncreent 100: Arc Length = 45.83
viwoi 0)1 :le p11VlmhVe pit W : e pIIV i~I iwpi:8 I : I IIIVl lod iwol:9 OD : iiil tdfraction = -0.9791
SS, Max. In-nS, Min. IrS, Out-off
L x Step: Step-OIncrement 100: Arc Length = 41.47
fraction = -0.9791
S Max, In
S: Min. Inj
S Outof- f
fraction = -0.979
L S, Max. In-1S, Min. In-IS, Out-of-l
ýX Step: Step-O
Increment 100: Arc Length
fraction = -0.979:
S,0 ut-of-P:
Lx Step: Step-C49.15 I Increment 100: Arc Length = 49.15Lx SteIp: Step-m Arc Lngth= 41• Increment 100: Arc Length = 49.15
T=V T=2V T=4VAs shown, the crack orientation changes slowly with increasing T.As T/V changes from 0 to 1, there is little change in crack orientation.C~Rto-F*i t,.AqbaWX9 ._gr TOeA, T.,tWAt, _ s from 1 to inf.

RESULTS FROM FINITE ELEMENT ANALYSIS
TENSION + SHEAR (PROPORTIONAL LOADING)
1.1 Points for T-V1.0 Interactio.
Lz0
.. ,
0.9
0.8
0.7
0.6
0.5
0.4
0.3
0.2
0.1
0.0
T= 0. 125 V
T=0.25 V
T=0.5 V
-.- T=0.75 V
-T=1.33 V
-"-T=2 V 00 0.0005 0.001 0.0015 0.002 0.0025 0.003 0.0035 0.004 0.0045 0.005 0.0055 0.006
OC Amit H. Varma School of Civil Engine rr!• • iirlilkt L[afayette, IN 47906

RESULTS FROM TENSION + SHEAR ANALYSIS
Von Mises stress in steel plates corresponding to the points of yieldingi.e,. turning points in the shear force-strain responses on previous slide
|
iii
T/V=0.77T/V=1/8 T/V=0.75 T/V=0.5viewpoll:~~~~I 1 c" :fli' ioV1.1 Vepr:3OD :Ttp n 1mjiEeplI40)3 :Iefl)1112V10hvepr:5 D:C fl) 10V10l
S, MSs$PLY-1 (middle)(Avg: 75%)i +5.001e+0l
+5,001e+01+5.001e+01+5,001e+01+5.001e+01
yi-x Step: Step-0Increment
I
S, MisesPLY-i (middle)(Avg: 75%)
+5.001e+(+5.001e+(+5.001e+C+5.001e+C+5.001e+(+5.001e+I
Lx Step: Step-0Increment
S, MisesPLY-1 (middle)(Avg: 75%)
+5.001e++5.001e++5.001e++5.001e++5,001e++5,001e+;
Lx Step; Step-10Increment 18: Arc Lengith 8.150 I
S, Misesfraction = -0.977(Avg: 75%)
+5.,000e+S+5,000e++5,000e++5.000e++5.000e++5.000e+
L x Step: Step-0Increment 16: Arc Length = 7.15018: Arc Length = 8.150 18: Arc Length = 8.150
Vie poil: O R C fenpi1 11)(1) Vew ort I DH:C:eru 1 V inmdbVie pot: OD C:I e p 1 li 1. 1)Vie por: 9 0D: CJeip II fit~mllS, Misesfraction = -0.9(Avg: 75%)
S+5.001e++5.001e++5.001e++5,001e++5.001e++5.000e+
Lx Ste P: Step-i
Inre en 111001171 ""41140m,
I lmmbb..
I-logE
I
S, Misesfraction = -0.9(Avg: 75%)
+5.000e++5.000e++5.000e++5.000e++5.000e++5.000e+
LxStep; Step-In crement
7
*1
I
S, Misesfraction = -0.9(Avg: 75%)
+5.000e+S+5,000e++5.000e++5.000e++5.000e++5,000e Fl
S, Misesfraction = -0.9(Avg: 75%')
+5 001e++5.001e++5.001e++5.001e++5.001e++5.001e+
rimilm
EMPOP"nP
0 0v V
LX Step: Step-0Increment 26: Are Length = 12.15 Lx Step: Step-0Increment 28: Arc Length = 13.1516: Arc Length = 7.150 22: Arc Length = 10.15
.. - h .. n l l .
T=V© Amit H. Vqrmq - School
T=2Vof Civil Enginpering, Pilirdiwt
T=4VUniversity, Wt-st Lafayette, IN 47906
T=8V
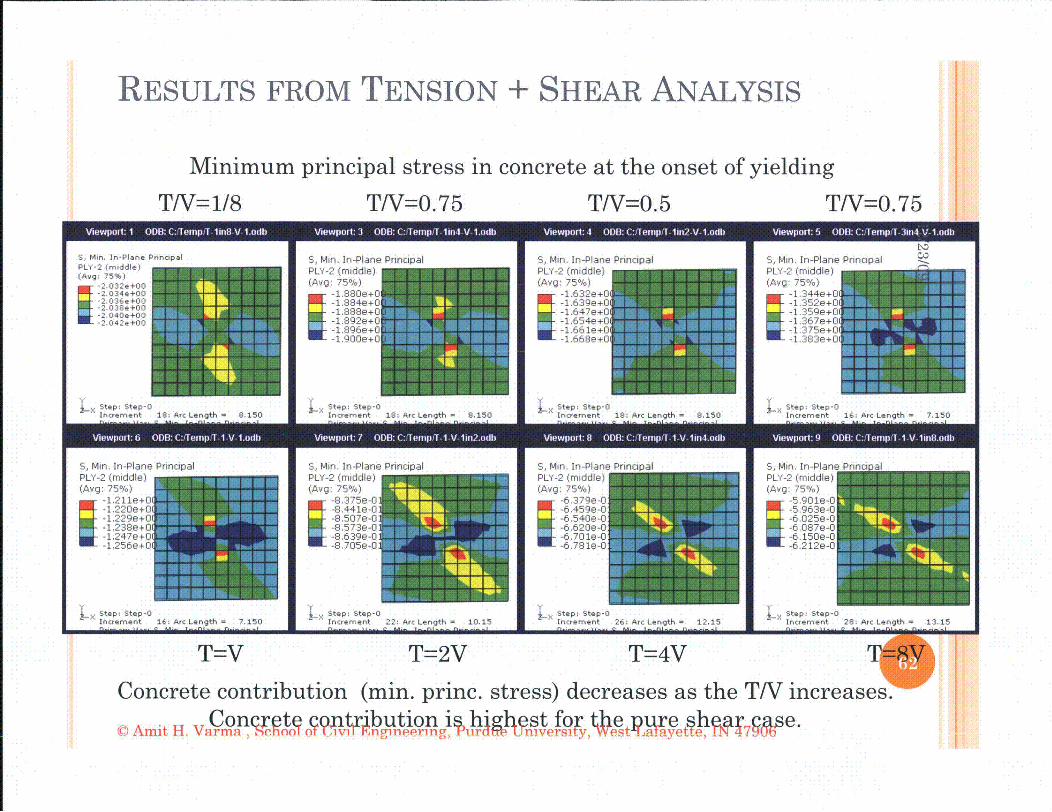
RESULTS FROM TENSION + SHEAR ANALYSIS
Minimum principal stress in concrete at the onset of yielding
TIV=1/8 TV=0.75 TIV=0.5 T/V=0.75
S, Min. In-Plane PrincipalPLY-2 (middle)(Avg: 75%)• -2,032e+00
.2, 034e+00-2.036e+00-2 038e+00-2 040e+00-2. 042e+00
L x Step: Step-0Increment 18: Arc Lenath = 8.150
S, Min. In-Plane PrincipalPLY 2 (middle)(Avg: 75%C-1 880e+0
1.884e+01 888e+0
-1.892e+0-1.896e+0-1.900e+0
S, Min. In-Plane PrincipalPLY-2 (middle)(Avg: 75%)
-1.632e+01.639e+0
-1.647e+O-1.654e+0-1.661e+0-1.668e+01
S, Min. In-Plane PrincipalPLY-2 (middle)(Avg: 75%)
-1.344e+011.352e+01
-1.359e+01-1.367e+01-1.375e+0
-1.383e+01
Step: Step-0Increment 18: Arc Lenoth = 8.150
Lx Step: Step-0Increment 18: Arc Lenath = 8.150
LX Step: Step-0Increment 16: Arc Lenath = 7.150
S, Min. In-Plane PrincipalPLY-2 (middle)(Avg: 75%)
-1.2lie+O!-1 ,211e+0-1.220e+01
-1.229e+0-1.238e+01-1.247e+0
-1.256e+01
S, Min. In-PlanePLY-2 (middle)(Avg: 75%)
-8.375e-0-8.441e-0-8.507e-0-8.573e-0-8.639e-0-8,705e-0
e Principal S, Min. In-Plane PPLY- 2(middle)f(Avg: 75%)
-6.379e-0-6.459e-0-6.540e-0-6.620e-0-6.701e-0-6.781e-01
S, Min. In-PlatPLY-2 (middle(Avg: 75%)
-5.901e--5.963e--6.025e--6.087e--6.150e--6.212e-
--X Step: Step-0Increment 16: Arc Length = 7.150
Lx Step: Step-0Increment
L x Step: Step-0Increment 26: Arc Length =
L Step: Step-0Increment 28: Arc22: Arc Length = 10.15 12.15
k"w111111111111111
T=V T=2V T=4V
Concrete contribution (min. princ. stress) decreases as the TN increases.. Concrte v- t-ribution ishl hish for te?,iih 7se.©c Amit H. Varmn W,." I'cha oF .wl•ntgneering, Yurdjt-e Uiv-rs.-yr, W.. .ay•e yh -T790W"
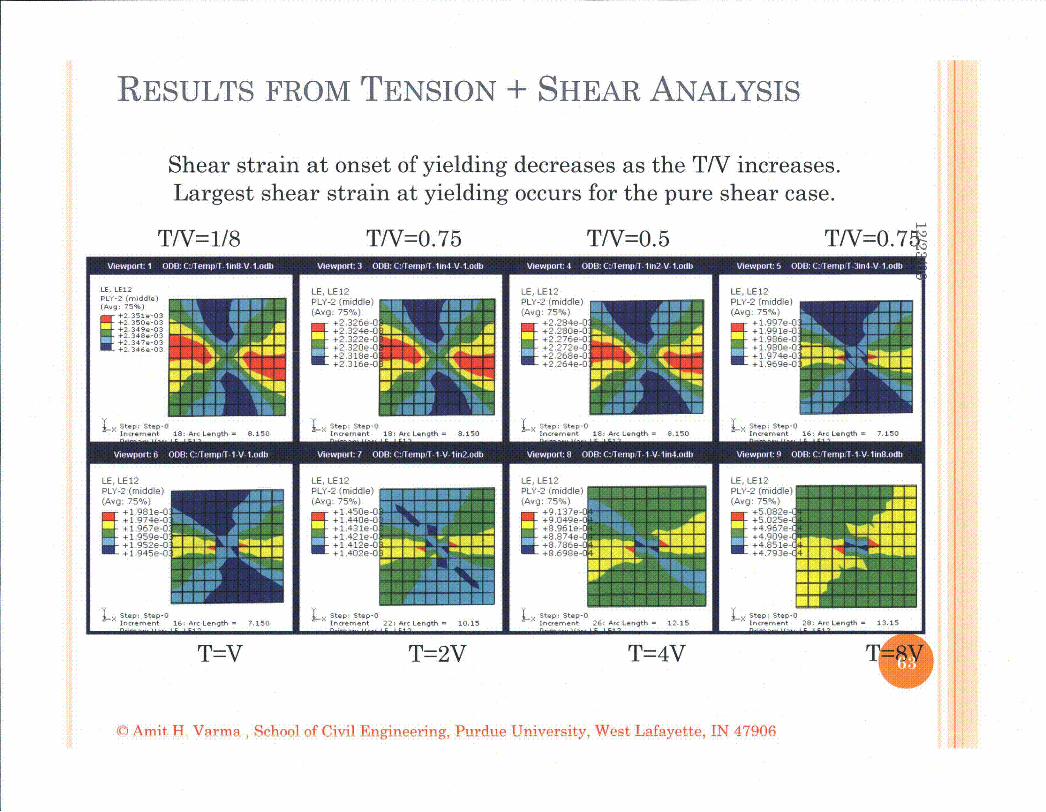
RESULTS FROM TENSION + SHEAR ANALYSIS
Shear strain at onset of yielding decreases as the T/V increases.Largest shear strain at yielding occurs for the pure shear case.
T/V=1/8 T/V=0.75 TIV=0.5 TIV=O. 7I iw ol DI :TmpIfnlVt di e pI 3IM :11111111 .11 i iI:I 0D :C erp1112VI~d iw ol , 0M : m 10V101) .LE. LE12PLY-2 (mnddle)(Ang: 75%)
+2,.351e-03+2 350e 03+2 349e- 03+2Y348e-03+2 347e-03+2 346e- 03
LE, LE12PLY-2 (middle)(Avg: 75%)
+2.326e-:+2.324e+2.322e-C+2.320e+2.318e-+2.316e(
LE, LE12PLY-2 (middle)(Avg: 75%)
+2.280e-02.284e+2.276e -0
+2.2-72e -0+2.268e-0O+2.264e-0
LE, LE12PLY-2 (middle)(Avg: 75%)
+1.997e-0:+1.991e-0+1.986e-0+ 1.980e-0+ 1.974e-0+1.969e-0
Step: Step-0Increment 18: Arc Length = 8.150
Step: Step-0Increment 18: Arc Length = 8.150- Ste p: Step-O
IncrementStep: Step-0Increment
18: Arc Length = 8.150 16: Arc Length = 7.150
LE, LE12 LE, LE12 LE, LE12 LE, LE12PLY-2 (middle) PLY-2 (middle) PLY-2 (middle) PLY-2 (middle)(Avg; 75%) (Avg: 75%) (Avg: 75%) (Avg: 75%)
+ 1.974e-0 +1.440e-0 +9.037e- +5.025e-+1.974e-0 +1.450e -0 +9.137e- +5 082e-
+ 1.967e-0 +1.43le-0 +8.961e- +4.967e-+ 1.959e-0 +1.42le-0 +8.874e- +4.909e-+ 1.952e-0 +1.412e-0 +8.786e-I +4.85le-+ 1.945e-0 +1.402e-0 +8.698e- +4.793e- 4
Step: Step-0 L Step: St.p-oS L P step: Step-o L5 Step: Step-0Increment 16; Arc Length = 7,150 Increment 22: Arc Length = 10.15 increment 26: Arc Length 12.15 Increment 28: Arc Length = 13.15
T=V T=2V T=4V ToIAmit H Varma, School of Civil Engineering, Puirdue University, West Lafayette, IN 47906

SUMMARY FROM FEM ANALYSIS RESULTS
" The steel plates govern the behavior even more fortension + shear loading cases.
" The cracking direction does not change until there issignificant tension (T/V greater than or equal to 1)
" The concrete contribution to the shear behaviordecreases with increasing tension. It is maximum forthe pure shear case (as compared to tension + shear).
o Compression + shear results in significant increase inthe in-plane shear strength of the composite design.
0 Amit H. Varma , School of Civil Engineering, Purdue University, West Lafayette, IN 47906

ANALYSIS FOR IN-PLANE FORCE
Combined Membrane Forces (Sy and Sxy)
LL
0EL,..
M
M
-*-Compression + Sheart
1.4 a-*Tension + Shear
-+-Results from FEM1.2
I FEM
0.8
Theory0.6
0.4
0.2
0
-2.5 -2 -1.5 -1 -0.5 0 0.5 1 1.5
am~t H v•m• •x ,l5e,,4 As FyýPostv Tpni pegtv omrsin...... -n•,in-lF~n moor ,n , lr!eT _•i~vj ers!i~y n esv N t~offo•I qq

RESULTS IN PRINCIPAL FORCE SPACE
o Take the LCS model with smeared cracking concretemodel and fracture energy.
o Analyze for combinations of axial and shear forceo Take the results for Sy and Sxy, and convert into or
calculate Spl and Sp2.
SPl 2p2 + L::j' )j+(Sxy
o The principal forces were plotted from the results.
© Amit H. Varma, School of Civil Engineering, Purdue University, West Lafayette, IN 47906

FAILURE SURFACE IN SP1-SP2 SPACEFailure Surface for In-Plane Forces in
Principal ForcesI.a
['3['
0Principal Force 1 (Spl kips/ft)
© Amit H. Varma, School of Civil Engineering, Purdue University, West Lafayette, IN 47906
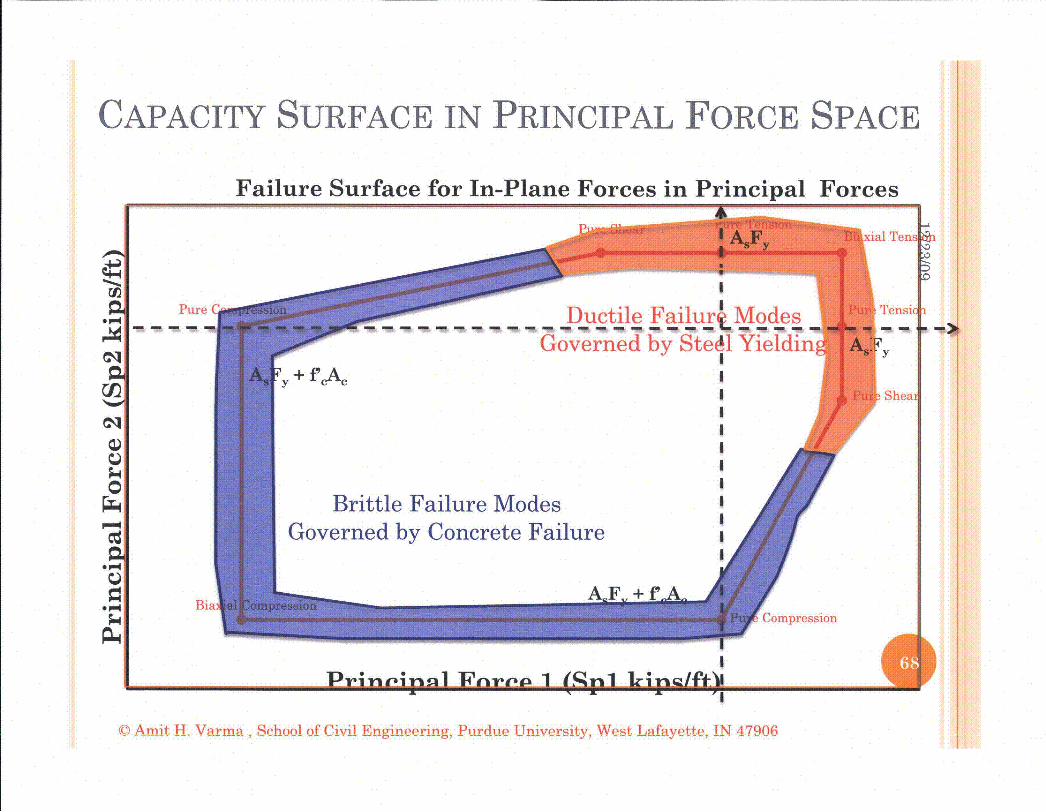
CAPACITY SURFACE IN PRINCIPAL FORCE SPACE
Failure Surface for In-Plane Forces in Principal Forces
xial Tens
.)4
.. 44
Pure C
Bia:
Tensit-_ -P "E
Y
Sheai
I a I,,B.. % J Ja 'I
CD Amit H Varma, Schono of Civil Envineering, Plirtim- LTnivir-itv Wpqt Lfnyetti, TN 47q06
DESIGN CAPACITIES
o The phi-factors should be representative of thefailure mode (brittle and ductile)
o Creep and shrinkage effects can be included byusing FR (residual stress).
o The compression capacity can be reduced toinclude the effects of creep, shrinkage, localbuckling (if any), and locked in stresses
o For example, As (Fy-Fr) + /3 fc Ac
© Amit H. Varma, School of Civil Engineering, Purdue University, West Lafayette, IN 47906