encyclopedia of physical science and technology || aircraft performance and design
TRANSCRIPT
P1: FYK/FPW Revised Pages P2: FYK Qu: 00, 00, 00, 00
Encyclopedia of Physical Science and Technology EN001-912 May 26, 2001 14:12
Aircraft Performance and DesignFrancis Joseph HaleNorth Carolina State University
I. Aircraft Flight BehaviorII. Performance Analysis and Preliminary DesignIII. Aircraft Forces and SubsystemsIV. Turbojet and Turbofan AircraftV. Piston–Propeller Aircraft
VI. Turboprop and Turbofan AircraftVII. Conventional Subsonic Aircraft
VIII. Vertical and Short Takeoff and Landing AircraftIX. Military AircraftX. Advanced Supersonic Commercial AircraftXI. Hypersonic Aircraft and the National Aerospace
Plane
GLOSSARY
Air breathers Engines that obtain oxygen from theatmosphere.
Aspect ratio Wing span divided by average chordlength.
Ceiling Maximum altitude for specified rate of climb.CTOL Conventional (horizontal) takeoff and landing
aircraft.Drag polar Drag coefficient–lift coefficient relationship.Flight envelope Region of possible flight operation.HST Hypersonic transport.Lift-to-drag ratio Aerodynamic efficiency of an aircraft.Mass ratio Aircraft weight at start of cruise divided by
aircraft weight at end of cruise.
Operational empty weight Weight of aircraft less theuseful load.
Span loading Aircraft weight divided by wing span.Specific fuel consumption Fuel flow rate per pound of
thrust (turbojet) or per horsepower (piston–prop).Specific impulse Rocket engine thrust divided by fuel
flow rate.SST Supersonic transport.STOL Aircraft capable of short takeoffs and landings.Useful load Sum of fuel and payload weights.V/STOL Aircraft capable of both vertical and short take-
offs and landings.Weight fraction Component weight divided by aircraft
weight.Wing loading Aircraft weight divided by wing area.
365

P1: FYK/FPW Revised Pages P2: FYK
Encyclopedia of Physical Science and Technology EN001-912 April 20, 2001 18:42
366 Aircraft Performance and Design
FIGURE 1 The Boeing 777. A long-range (8200 mi), wide-body, Mach 0.85 transport with 300 passengers, two high-bypass-ratio turbofans of the 90,000-lb thrust class, a maximum gross weight of 630,000 lb, a wing area of 4600 ft2
(W/S = 137 lb/ft2), and an aspect ratio (AR) of 8.7. [Courtesy of Boeing.]
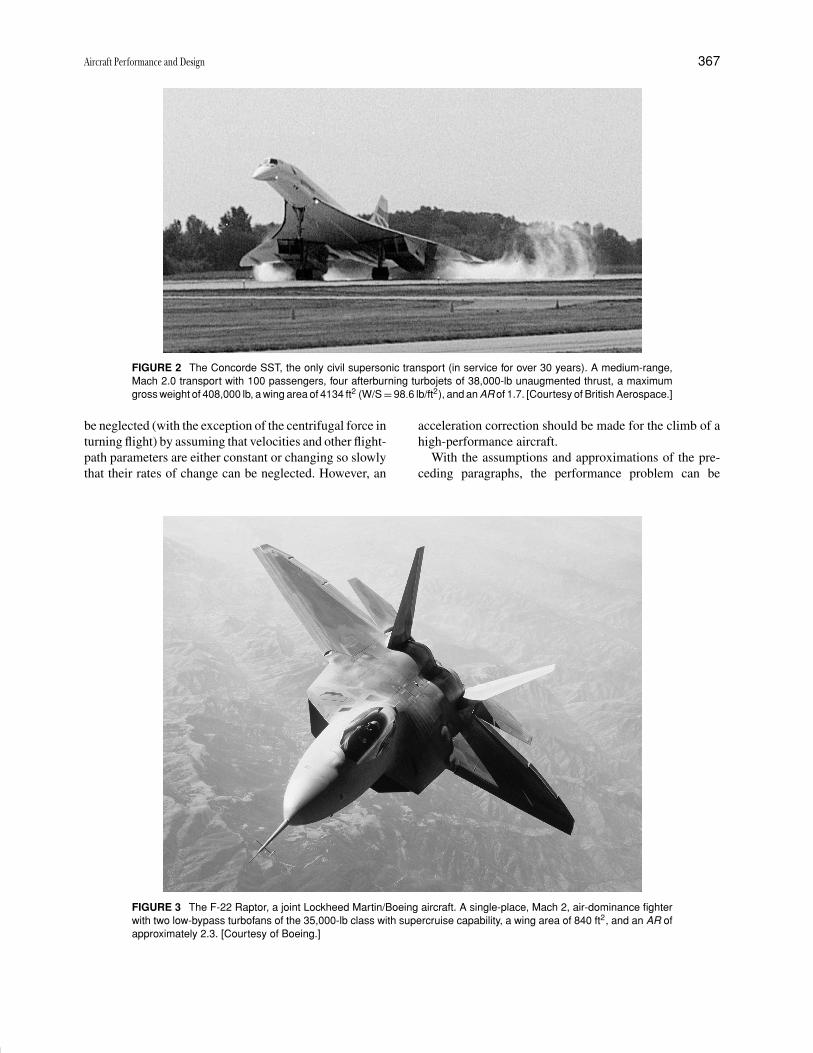
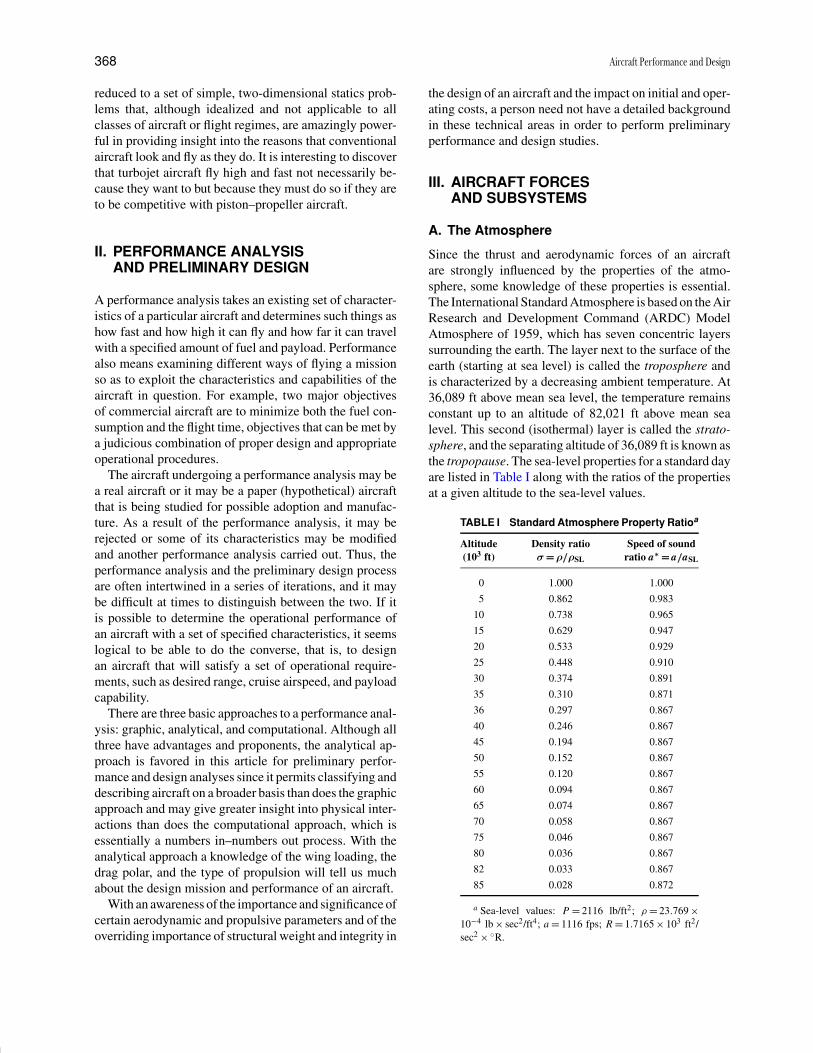
AN AIRCRAFT performance analysis starts with thephysical characteristics of the aircraft, either actual orhypothetical, and ends with knowledge as to how the air-craft might fly (e.g., its range, payload, airspeeds, ceiling,rate of climb, and turning rate). It does not necessarily con-cern itself with determining whether the aircraft is flyableand controllable. The converse of the performance analy-sis is the design of an aircraft to meet a set of operationalrequirements and constraints. Design, however, is an iter-ative process, and the first tries, which should yield majoraircraft characteristics, are often referred to as conceptualor feasibility design. Many assumptions and approxima-tions are used in early performance and design iterationsto give qualitative answers with a minimum expenditure oftime and effort. (Figures 1–3 show a Mach 0.85 transport,an SST, and a supersonic fighter, respectively.)
In spite of the push for metric (SI) units, the units usedfor aircraft calculations, cockpit instruments, and opera-tions are, in general, the customary English units, withknots (nmi per hour) being the operational measure of air-speed. This article uses such units but with miles per hour(mph) or feet per second (fps) as the measure of airspeed.
I. AIRCRAFT FLIGHT BEHAVIOR
The flight path and behavior of an aircraft are determinedby the interaction between the characteristics of the air-
craft and the environment in which it is flying. The aircraftcharacteristics can be categorized as the physical charac-teristics, such as the shape, mass, volume, and surface area;the characteristics of the subsystems, such as the propul-sion, guidance, and control systems; and the structuralcharacteristics, such as loading and temperature limita-tions and the stiffness (rigidity) of the structure.
The environment affects the flight of an aircraft throughthe field forces and the surface forces. The only fieldforce that need be considered is gravity, which appearsas the weight and is a function of the mass. The sur-face forces are the aerodynamic forces (the lift, the drag,and the side force) which are strongly dependent on theshape and surface area of the aircraft, especially of thewings; the properties of the atmosphere; and the airspeed.In addition, consideration must be given to the inertialforces, which are a consequence of nonequilibrium pro-cesses and maneuvers and which play an important rolein the dynamic and stress analyses of aircraft but not inperformance analyses; inertial forces are ignored in thisarticle.
Although most modern aircraft have various amountsof elasticity arising from the desire to reduce the structuralweight to a minimum, aeroelastic effects need not be con-sidered in initial performance analyses and preliminaryconfiguration designs. Furthermore, the three rotationalmodes of a rigid aircraft can be ignored by consideringthe aircraft to be a point mass, and the inertia forces can
P1: FYK/FPW Revised Pages P2: FYK
Encyclopedia of Physical Science and Technology EN001-912 April 20, 2001 18:42
Aircraft Performance and Design 367
FIGURE 2 The Concorde SST, the only civil supersonic transport (in service for over 30 years). A medium-range,Mach 2.0 transport with 100 passengers, four afterburning turbojets of 38,000-lb unaugmented thrust, a maximumgross weight of 408,000 lb, a wing area of 4134 ft2 (W/S = 98.6 lb/ft2), and an AR of 1.7. [Courtesy of British Aerospace.]
be neglected (with the exception of the centrifugal force inturning flight) by assuming that velocities and other flight-path parameters are either constant or changing so slowlythat their rates of change can be neglected. However, an
FIGURE 3 The F-22 Raptor, a joint Lockheed Martin/Boeing aircraft. A single-place, Mach 2, air-dominance fighterwith two low-bypass turbofans of the 35,000-lb class with supercruise capability, a wing area of 840 ft2, and an AR ofapproximately 2.3. [Courtesy of Boeing.]
acceleration correction should be made for the climb of ahigh-performance aircraft.
With the assumptions and approximations of the pre-ceding paragraphs, the performance problem can be
P1: FYK/FPW Revised Pages P2: FYK
Encyclopedia of Physical Science and Technology EN001-912 April 20, 2001 18:42
368 Aircraft Performance and Design
reduced to a set of simple, two-dimensional statics prob-lems that, although idealized and not applicable to allclasses of aircraft or flight regimes, are amazingly power-ful in providing insight into the reasons that conventionalaircraft look and fly as they do. It is interesting to discoverthat turbojet aircraft fly high and fast not necessarily be-cause they want to but because they must do so if they areto be competitive with piston–propeller aircraft.
II. PERFORMANCE ANALYSISAND PRELIMINARY DESIGN
A performance analysis takes an existing set of character-istics of a particular aircraft and determines such things ashow fast and how high it can fly and how far it can travelwith a specified amount of fuel and payload. Performancealso means examining different ways of flying a missionso as to exploit the characteristics and capabilities of theaircraft in question. For example, two major objectivesof commercial aircraft are to minimize both the fuel con-sumption and the flight time, objectives that can be met bya judicious combination of proper design and appropriateoperational procedures.
The aircraft undergoing a performance analysis may bea real aircraft or it may be a paper (hypothetical) aircraftthat is being studied for possible adoption and manufac-ture. As a result of the performance analysis, it may berejected or some of its characteristics may be modifiedand another performance analysis carried out. Thus, theperformance analysis and the preliminary design processare often intertwined in a series of iterations, and it maybe difficult at times to distinguish between the two. If itis possible to determine the operational performance ofan aircraft with a set of specified characteristics, it seemslogical to be able to do the converse, that is, to designan aircraft that will satisfy a set of operational require-ments, such as desired range, cruise airspeed, and payloadcapability.
There are three basic approaches to a performance anal-ysis: graphic, analytical, and computational. Although allthree have advantages and proponents, the analytical ap-proach is favored in this article for preliminary perfor-mance and design analyses since it permits classifying anddescribing aircraft on a broader basis than does the graphicapproach and may give greater insight into physical inter-actions than does the computational approach, which isessentially a numbers in–numbers out process. With theanalytical approach a knowledge of the wing loading, thedrag polar, and the type of propulsion will tell us muchabout the design mission and performance of an aircraft.
With an awareness of the importance and significance ofcertain aerodynamic and propulsive parameters and of theoverriding importance of structural weight and integrity in
the design of an aircraft and the impact on initial and oper-ating costs, a person need not have a detailed backgroundin these technical areas in order to perform preliminaryperformance and design studies.
III. AIRCRAFT FORCESAND SUBSYSTEMS
A. The Atmosphere
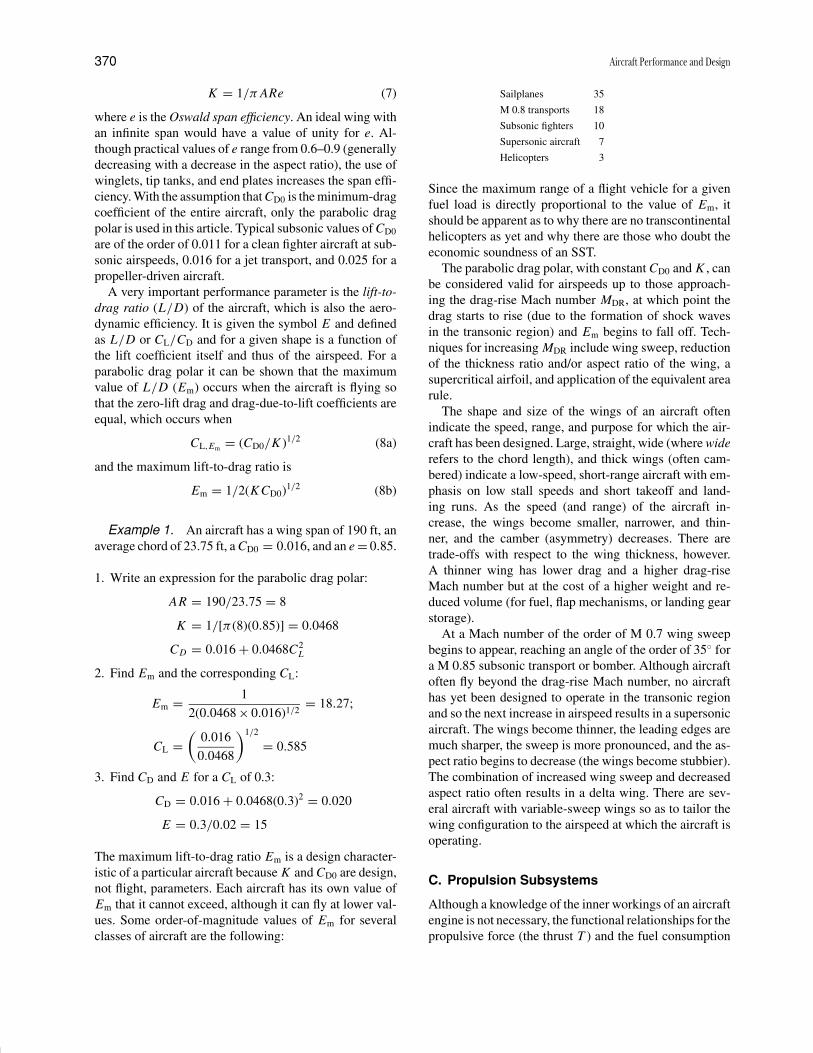
Since the thrust and aerodynamic forces of an aircraftare strongly influenced by the properties of the atmo-sphere, some knowledge of these properties is essential.The International Standard Atmosphere is based on the AirResearch and Development Command (ARDC) ModelAtmosphere of 1959, which has seven concentric layerssurrounding the earth. The layer next to the surface of theearth (starting at sea level) is called the troposphere andis characterized by a decreasing ambient temperature. At36,089 ft above mean sea level, the temperature remainsconstant up to an altitude of 82,021 ft above mean sealevel. This second (isothermal) layer is called the strato-sphere, and the separating altitude of 36,089 ft is known asthe tropopause. The sea-level properties for a standard dayare listed in Table I along with the ratios of the propertiesat a given altitude to the sea-level values.
TABLE I Standard Atmosphere Property Ratioa
Altitude Density ratio Speed of sound(103 ft) σ == ρ//ρSL ratio a∗ == a//aSL
0 1.000 1.000
5 0.862 0.983
10 0.738 0.965
15 0.629 0.947
20 0.533 0.929
25 0.448 0.910
30 0.374 0.891
35 0.310 0.871
36 0.297 0.867
40 0.246 0.867
45 0.194 0.867
50 0.152 0.867
55 0.120 0.867
60 0.094 0.867
65 0.074 0.867
70 0.058 0.867
75 0.046 0.867
80 0.036 0.867
82 0.033 0.867
85 0.028 0.872
a Sea-level values: P = 2116 lb/ft2; ρ = 23.769 ×10⁻⁴ lb × sec2/ft4; a = 1116 fps; R = 1.7165 × 103 ft2/sec2 × ◦R.

P1: FYK/FPW Revised Pages P2: FYK
Encyclopedia of Physical Science and Technology EN001-912 April 20, 2001 18:42
Aircraft Performance and Design 369
Although the values from the tables are more accurateand normally should be used, there are times when it isdesirable to have a mathematical expression for the den-sity ratio σ in terms of the altitude. A commonly usedexpression is
σ = ρ1/ρSL = exp(−h1/β) (1)
where ρ1 is the atmospheric density at altitude h1 on astandard day, the subscript SL denotes sea-level values,and β is a factor that can have one of two values. A valueof 30,500 ft gives good results in the troposphere but intro-duces large errors at higher altitudes. For altitudes abovethe tropopause and up to ∼250,000 ft, a value of 23,800 ftgives better results.
Returning to the sea-level properties for a standard day,the atmosphere can be assumed to satisfy the equation ofstate for an ideal gas, namely,
P = ρRT or ρ = P
RT(2)
where P is the pressure, R the gas constant for air, andT the air temperature expressed as an absolute tempera-ture (Rankine or Kelvin). Consequently, an increase in theambient temperature over the standard will decrease thedensity, as will a decrease in the pressure. In other words,on a hot day and/or with a below-standard barometric pres-sure, the sea-level density will be lower than standard andthe performance of the aircraft will be affected. With areduced atmospheric density, the aircraft and propulsionsystem think and perform as though they were at a higheraltitude than they actually are. Although a standard dayis normally assumed, one should be aware of the possibleeffects of any deviations.
B. Aerodynamic Forces and Considerations
The resultant aerodynamic force produced by the motionof the aircraft through the atmosphere can be resolved intothree components along the wind axes with the x axis al-ways along the velocity vector. The component along thex axis is the drag, has the symbol D, and is in the op-posite direction to the airspeed and resists the motion ofthe aircraft. The component perpendicular to the aircraftvelocity is the lift, has the symbol L , and functions mainlyto counteract the weight of the aircraft (keep the aircraftin the air). The third component, the side force, which ap-pears when there is a sideslip angle (uncoordinated flight),is an undesirable condition and will be neglected. Only thelift and drag forces are considered in this article.
With a well-designed aircraft, the wing is the majorsource of lift and drag; the design objective is to maximizethe lift while minimizing the drag. Wing parameters ofimportance with respect to performance are the wing span
b, the distance from wing tip to wing tip; the average chordc, the average distance from the front (leading edge) of thewing to the back (trailing edge); and the wing area S, thearea of one side of the wing to include the area occupiedby the fuselage. The ratio of the wing span to the averagechord is the aspect ratio AR, which is a measure of thenarrowness of the wing. The following relationships areuseful:
S = bc; AR = b/c = b2/S (3)
The thickness ratio t/c is of importance in determiningwing drag. The cross section of a wing is called an airfoiland can be symmetrical or asymmetrical. Many currentairfoils for conventional aircraft are symmetrical or nearlyso.
The lift and drag forces can be obtained from the fol-lowing expressions:
L = q SCL = 12ρV 2SCL (4a)
D = q SCD = 12ρV 2SCD (4b)
In these equations, q is the dynamic pressure, has dimen-sions of pounds per square foot, and is equal to 1
2ρV 2,where ρ, the atmospheric density (lb · sec2/ft4), can be ex-pressed as ρSLσ , V is the true airspeed (fps), and S is thewing area. CL and CD are the dimensionless lift and dragcoefficients, respectively, and are functions of the angle ofattack, the Mach number, the Reynolds number, and theshape of the wing; CL increases with increasing angle ofattack until a maximum value CLmax occurs at the stall andthen decreases, usually sharply. Conventional aircraft donot fly beyond the stall point. T is the thrust of the enginein pounds and is assumed to be collinear with the airspeed.
The drag polar is an expression of the drag coefficientas a function of CL rather than of the angle of attack and isvery important for performance analyses. One generalizedform of the drag polar is
CD = CD0 + KCxL (5)
where CD0 is the zero-lift drag coefficient (the drag coef-ficient when the lift coefficient is equal to zero) and thesecond term on the right-hand side represents the drag-due-to-lift coefficient; CD0, K, and the exponent x are allfunctions not only of the wing shape but also of the Machand Reynolds numbers. Fortunately, there are many effi-cient subsonic and thin-winged supersonic configurationsand flight regimes where these parameters can be assumedconstant and x can be set equal to 2. Consequently, Eq. (5)can be written as the parabolic drag polar,
CD = CD0 + KC2L (6)
The value of K is strongly dependent on the aspect ratio,as can be seen from the expression:
P1: FYK/FPW Revised Pages P2: FYK
Encyclopedia of Physical Science and Technology EN001-912 April 20, 2001 18:42
370 Aircraft Performance and Design
K = 1/π ARe (7)
where e is the Oswald span efficiency. An ideal wing withan infinite span would have a value of unity for e. Al-though practical values of e range from 0.6–0.9 (generallydecreasing with a decrease in the aspect ratio), the use ofwinglets, tip tanks, and end plates increases the span effi-ciency. With the assumption that CD0 is the minimum-dragcoefficient of the entire aircraft, only the parabolic dragpolar is used in this article. Typical subsonic values of CD0
are of the order of 0.011 for a clean fighter aircraft at sub-sonic airspeeds, 0.016 for a jet transport, and 0.025 for apropeller-driven aircraft.
A very important performance parameter is the lift-to-drag ratio (L/D) of the aircraft, which is also the aero-dynamic efficiency. It is given the symbol E and definedas L/D or CL/CD and for a given shape is a function ofthe lift coefficient itself and thus of the airspeed. For aparabolic drag polar it can be shown that the maximumvalue of L/D (Em) occurs when the aircraft is flying sothat the zero-lift drag and drag-due-to-lift coefficients areequal, which occurs when
CL,Em = (CD0/K )1/2 (8a)
and the maximum lift-to-drag ratio is
Em = 1/2(K CD0)1/2 (8b)
Example 1. An aircraft has a wing span of 190 ft, anaverage chord of 23.75 ft, a CD0 = 0.016, and an e = 0.85.
1. Write an expression for the parabolic drag polar:
AR = 190/23.75 = 8
K = 1/[π (8)(0.85)] = 0.0468
CD = 0.016 + 0.0468C2L
2. Find Em and the corresponding CL:
Em = 1
2(0.0468 × 0.016)1/2= 18.27;
CL =(
0.016
0.0468
)1/2
= 0.585
3. Find CD and E for a CL of 0.3:
CD = 0.016 + 0.0468(0.3)2 = 0.020
E = 0.3/0.02 = 15
The maximum lift-to-drag ratio Em is a design character-istic of a particular aircraft because K and CD0 are design,not flight, parameters. Each aircraft has its own value ofEm that it cannot exceed, although it can fly at lower val-ues. Some order-of-magnitude values of Em for severalclasses of aircraft are the following:
Sailplanes 35
M 0.8 transports 18
Subsonic fighters 10
Supersonic aircraft 7
Helicopters 3
Since the maximum range of a flight vehicle for a givenfuel load is directly proportional to the value of Em, itshould be apparent as to why there are no transcontinentalhelicopters as yet and why there are those who doubt theeconomic soundness of an SST.
The parabolic drag polar, with constant CD0 and K , canbe considered valid for airspeeds up to those approach-ing the drag-rise Mach number MDR, at which point thedrag starts to rise (due to the formation of shock wavesin the transonic region) and Em begins to fall off. Tech-niques for increasing MDR include wing sweep, reductionof the thickness ratio and/or aspect ratio of the wing, asupercritical airfoil, and application of the equivalent arearule.
The shape and size of the wings of an aircraft oftenindicate the speed, range, and purpose for which the air-craft has been designed. Large, straight, wide (where widerefers to the chord length), and thick wings (often cam-bered) indicate a low-speed, short-range aircraft with em-phasis on low stall speeds and short takeoff and land-ing runs. As the speed (and range) of the aircraft in-crease, the wings become smaller, narrower, and thin-ner, and the camber (asymmetry) decreases. There aretrade-offs with respect to the wing thickness, however.A thinner wing has lower drag and a higher drag-riseMach number but at the cost of a higher weight and re-duced volume (for fuel, flap mechanisms, or landing gearstorage).
At a Mach number of the order of M 0.7 wing sweepbegins to appear, reaching an angle of the order of 35◦ fora M 0.85 subsonic transport or bomber. Although aircraftoften fly beyond the drag-rise Mach number, no aircrafthas yet been designed to operate in the transonic regionand so the next increase in airspeed results in a supersonicaircraft. The wings become thinner, the leading edges aremuch sharper, the sweep is more pronounced, and the as-pect ratio begins to decrease (the wings become stubbier).The combination of increased wing sweep and decreasedaspect ratio often results in a delta wing. There are sev-eral aircraft with variable-sweep wings so as to tailor thewing configuration to the airspeed at which the aircraft isoperating.
C. Propulsion Subsystems
Although a knowledge of the inner workings of an aircraftengine is not necessary, the functional relationships for thepropulsive force (the thrust T ) and the fuel consumption

P1: FYK/FPW Revised Pages P2: FYK
Encyclopedia of Physical Science and Technology EN001-912 April 20, 2001 18:42
Aircraft Performance and Design 371
rate, along with a feel for the weight of the engine perpound of thrust or horsepower, are required for perfor-mance analyses and preliminary design studies. The fourtypes of aircraft engines in current use are all classified asair breathers in that they use oxygen from the atmosphereto burn with a petroleum product fuel, either gasoline ora form of kerosene (commonly referred to as jet fuel).These four types can be further divided into those with-out propellers, namely, the pure turbojet and the turbofan,and those with propellers, namely, the piston–prop (thereciprocating engine and propeller combination) and theturboprop. As will be shown, the flight characteristics ofan aircraft are strongly affected by the presence or absenceof a propeller. In the following sections, it is assumed thatthe engines have been properly sized for the aircraft andflight regimes of interest.
The turbojet engine produces thrust by expanding hotcombustion gases through a nozzle. This thrust, to a firstapproximation, can be considered to be independent of theairspeed and, for a given throttle (percent rpm) setting, tobe directly proportional to the atmospheric density, so that:
T1/TSL = ρ/ρSL = σ1 (9)
Equation (9) shows that the thrust will be at a maximumat sea level and decrease with increasing altitude.
The fuel consumption rate is described in terms of thethrust specific fuel consumption (tsfc), with the symbolc, and defined as the fuel weight flow rate per hour perpound of thrust with the units of pounds per hour perpound, usually expressed as inverse hours (hr−1):
tsfc = c = dWf/dt
T(10)
The specific fuel consumption is an engine characteristicand is assumed to be constant for all flight conditions eventhough it is a function of the airspeed, throttle setting, andaltitude. The tsfc is less affected by the altitude than is thethrust. Within the troposphere it decreases as the 0.2 powerof the density ratio, reaching a minimum at the tropopauseand then increasing very slowly within the stratosphere.
The thrust produced by turbojet engines ranges from50 lb up to the order of 50,000 lb. The uninstalled thrust-to-engine-weight is constantly increasing and currently ison the order of 4 to 6 lb of thrust for every pound of engineweight. Turbojet engines (actually very low-bypass turbo-fans) are primarily used in supersonic aircraft and usuallyhave an afterburner that burns added fuel with the excess(unburned) oxygen in the gaseous mixture, leaving theturbine to produce additional thrust. Although the thrustis approximately doubled with an afterburner, this thrustaugmentation is accompanied by a large increase in thetfsc (on the order of two to three times). Consequently, anafterburner is installed only when the operational require-
ments demand one and then is used sparingly, such as fortakeoff and climb, for attaining supersonic airspeed, andfor periods of supersonic flight. When supersonic flightcan be achieved and maintained without using an after-burner, it is called supercruise.
The piston–prop is an internal combustion engine thatburns air and gasoline (there are no diesel aviation en-gines yet) and produces shaft power rather than thrust.The power output is commonly measured in units of horse-power (hp), is essentially independent of the airspeed, andis a function of the altitude and throttle setting. The fuelconsumption rate is proportional to the horsepower (HP),so that:
dWf/dt = cHP (11)
where c is the horsepower specific fuel consumption(hpsfc) with units of pounds per hour per horsepower.
The propeller converts the engine shaft power into thethrust power P , which is equal to the product of the thrustand the airspeed, where the thrust is in pounds and theairspeed is expressed in feet per second, miles per hour, orknots, whichever is more convenient at the time. The en-gine horsepower and the propeller thrust power are relatedby the expression:
P = T V = kηPHP (12)
where ηp is the propeller efficiency (of the order of 80–85% for a constant-speed propeller) and k is a conversionfactor with a value of 375 when V is in miles per hourand 550 when V is expressed in feet per second. Noticethat, for a given horsepower, the thrust power is indepen-dent of the airspeed but the available thrust is inverselyproportional to the airspeed, decreasing as the airspeedincreases, whereas the thrust of a turbojet is constant andthe thrust power increases as the airpeed increases. It isthese differences that are primarily responsible for the factthat propeller aircraft and jet aircraft fly quite differentlyfor best performance.
The hpsfc has the same variations with altitude as thetsfc and will be assumed to be constant. The variation ofthe power with altitude depends on whether the engine issupercharged. If not supercharged, the engine is referredto as aspirated, and the power to a first approximationis directly proportional to the atmospheric density, as isthe thrust of the turbojet. The superchargers of today usea turbine driven by the engine exhaust gases to increasethe density of the air entering the cylinders and are calledturbochargers. With a constant throttle setting, the outputpower remains constant up to the critical altitude, whichhas a maximum value of the order of 20,000 ft. Abovethe critical altitude, the power of a turbocharged enginedecreases with altitude in the same manner as an aspiratedengine.
P1: FYK/FPW Revised Pages P2: FYK
Encyclopedia of Physical Science and Technology EN001-912 April 20, 2001 18:42
372 Aircraft Performance and Design
Current piston–prop engines are relatively small (rang-ing in size from ∼50 hp to the order of 600 hp) be-cause they are the heaviest of all the engines. The unin-stalled horsepower-to-engine-weight ratio is of the orderof 0.8 hp/lb of engine weight.
Turboprop engines and turbofan engines are basicallyturbojet engines in which the combustion gases are morefully expanded in the turbine section so as to develop morepower than is needed to drive the compressor and acces-sories. This excess power is then used to drive either apropeller, in the case of a turboprop, or a multibladedducted fan, in the case of a turbofan. Any energy remain-ing in the gaseous mixture leaving the drive turbines isthen expanded in a nozzle to produce what is known as jetthrust. This jet thrust is obviously considerably less thanthat produced by a comparable turbojet, and in the case ofa turboshaft engine is zero.
In the turboprop engine, the residual jet thrust is con-verted to an equivalent horsepower at some design air-speed and the engine is then described in the terminologyof the piston–prop, using an equivalent shaft horsepower(eshp) and an equivalent shaft horsepower specific fuelconsumption. Since the jet thrust power is of the orderof 20% or less of the total power, it is reasonable totreat the turboprop as though it were an aspirated piston–prop. Derated turboprops, which are operated at less thanthe maximum eshp, have the characteristics of a tur-bocharged piston–prop and are becoming popular. Theturboprop has a slightly higher specific fuel consumptionthan does the piston–prop, but the weight of the engineis considerably less, even with the weight of the pro-peller gearbox. Horsepower-to-engine-weight ratios areof the order of 2 hp per pound of engine weight, and thelargest engine in current operational use is of the order of6000 eshp.
Although a turbofan engine is described as though itwere a turbojet, its characteristics are determined by thebypass ratio, which is the ratio of the mass of the “coldair” passing through the fan to the mass of the “hot air”passing through the burners and turbine section. If the by-pass ratio is zero, the turbofan is obviously a pure turbojet.As the bypass ratio increases, the percentage of jet thrustdecreases and the turbofan begins to take on the charac-teristics of a turboprop. For example, with a bypass ratioof 10, the theoretical jet thrust would be of the order of17%. Current maximum bypass ratios are of the order of5–6 and tsfc’s, for a specified airspeed, are of the orderof 0.6 1b/(hr · lb). Although the frontal area of a turbofanincreases rapidly with an increase in the bypass ratio, thelength decreases; consequently, there is a smaller increasein the engine drag and weight than might be expected.Thrust-to-engine-weight ratios are of the order of 5–6 andincreasing, as is the maximum thrust of an individual en-gine, currently of the order of 98,000 lb.
The specific fuel consumption is an extremely importantperformance parameter. Some typical values, all expressedas an equivalent tsfc (lb/hr · lb), are
Rocket engines 10
Ramjets 3
Turbojets (afterburner) 2.5
Turbojets 0.9–1
High-bypass turbofans 0.6–0.8
Turboprops 0.5–0.6
Piston–props 0.4–0.5
It is interesting that, for various reasons, this list also indi-cates the relative airspeed regime of the flight vehicles inwhich these engines are used. For example, piston–propengines are used in aircraft with airspeeds of the orderof 250 mph or less; turboprop engines, at the higher air-speeds up to approximately M 0.7; turbofan engines, forairspeeds up to M 0.85; and turbojet engines and very lowbypass engines, in supersonic aircraft. The ramjet is suit-able for flight vehicles at M 3.0 and higher, and rocketengines are used in ballistic missiles and space boosters.Furthermore, the piston–prop engine is the least expensiveand the heaviest of the engines, the weight decreasing andthe cost increasing as the list is ascended.
D. Weight Fractions
Weight (along with the propulsion system) may well bethe most important consideration in the design and perfor-mance of an aircraft. Design experience has shown thatoften the lowest weight design is also the lowest cost andmost efficient design. Every extra pound of weight is ac-companied by an increase in the wing area, thrust, fuel,and so on, all leading to a further increase in the aircraftweight and adversely affecting the performance and costs(both initial and operational) of the aircraft. Weight frac-tions are very useful in performance and design analysesand are obtained by expressing the gross (total) weight ofan aircraft as the sum of the individual components andsubsystems and then dividing by the gross weight.
Although the “bookkeeping” process can be, and in finaldesign is, very detailed, the weight of the aircraft can beconsidered to be made up of the structural weight Ws, theengine weight We, the payload weight WPL, and the fuelweight Wf. The structural weight, with this breakdown,includes not only the weight of the structure itself butalso the weight of everything not included in the othercategories. It includes the weight of all the equipment andlanding gear, for example, and even the weight of the flightand cabin crews. Aircraft manufacturers often lump thestructural and empty weights together and call the sumthe empty weight or the operational empty weight andcombine the fuel and payload weights into the useful load.
P1: FYK/FPW Revised Pages P2: FYK
Encyclopedia of Physical Science and Technology EN001-912 April 20, 2001 18:42
Aircraft Performance and Design 373
With these divisions, the gross weight of the aircraft W0
can be written:
W0 = Ws + We + WPL + Wf (13)
Dividing through by the gross weight yields:
1 = Ws
W0+ We
W0+ WPL
W0+ Wf
W0(14)
Equation (14) defines the weight fractions: the structuralweight fraction, the engine weight fraction, the payloadweight fraction, and the fuel weight fraction. The sum ofthese individual weight fractions must always be unity.The engine weight fraction for turbojets and turbofans isequal to the ratio of maximum engine thrust to the grossweight of the aircraft divided by the ratio of the maximumengine thrust to the engine weight. A similar relationship,using horsepower rather than thrust, is used for propelleraircraft.
The analysis and design of aircraft structures and thedetermination of component and subsystem weights arecomplex and beyond the scope of this article. Order-of-magnitude values for the structural weight fraction willbe used instead in order to give a feel for its size and sig-nificance. As the gross weight of an aircraft increases, itsstructural weight fraction decreases. There are minimumvolume requirements for cabin and cargo space, and thefixed weights of equipment (such as avionics and naviga-tion systems) have a larger impact on the structural weightfractions of the lower gross weight aircraft. Large subsonictransports, such as the C-5 and 747, have structural weightfractions of the order of 0.4–0.45, whereas smaller aircraft,such as general aviation and fighter aircraft, can have val-ues in excess of 0.5. Remember that this structural weightfraction does not include the weight of the engines.
One should never forget nor underestimate the impor-tance and significance of the weight fractions. For exam-ple, a payload weight fraction of 0.1 means that 10 lbof aircraft weight is required for each pound of payload(or excess weight). Therefore, a payload of 2000 lb callsfor a 20,000-lb aircraft. The weight fractions can be usedto demonstrate dramatically the range and payload limita-tions associated with the increased engine weight requiredfor a true vertical takeoff and landing (VTOL) aircraftas compared with a comparable conventional takeoff andlanding (CTOL) aircraft.
Example 2. An aircraft is to have a payload capabilityof 10,000 lb using engines with a Tm/We of 5 and anestimated Ws/W0 of 0.45. A performance analysis callsfor a Wf/W0 of 0.3.
1. For a CTOL aircraft with a Tm/W0 of 0.25, what isthe estimated gross weight?
We/W0 = 0.25/5 = 0.05
0.45 + 0.05 + WPL/W0 + 0.3 = 1
WPL/W0 = 0.2
W0 = 10,000/0.2 = 50,000 lb
2. For a VTOL aircraft with a Tm/W0 of 1.1, what is theestimated gross weight?
We/W0 = 1.1/5 = 0.22
WPL/W0 = 1 − (0.45 + 0.22 + 0.3) = 0.03
W0 = 10,000/0.03 = 333,333 lb
3. If the gross weight of the VTOL of question 2 is heldat 50,000 lb, what is the fuel weight fraction?
WPL/W0 = 10,000/50,000 = 0.2
Wf/W0 = 1 − (0.45 + 0.22 + 0.2) = 0.13
IV. TURBOJET ANDTURBOFAN AIRCRAFT
A. Cruise Flight
For any aircraft in unaccelerated level flight, the lift mustbe equal to the weight if the aircraft is to remain at its alti-tude. The lift is developed by moving the wing through theair. This movement is resisted by the drag, which must inturn be balanced by the thrust if the airspeed is to remainconstant. The weight, however, is not constant, decreasingas fuel is used, and the rate at which the aircraft weightis decreasing is the negative of the fuel consumption rate,which is determined by the type of propulsion used. Con-sequently, the propulsion system must be specified beforea performance analysis can be executed.
Since the turbojet engine is a thrust producer and sincethe thrust appears explicitly in the equations of motion, theperformance analysis of a turbojet is relatively straightfor-ward. Furthermore, the results can be applied directly tothe turbofan, which can also be treated as a thrust pro-ducer, and can be useful in evaluating the performance ofpropeller aircraft, namely, the piston–prop and turboprop.The relevant equations for a turbojet/turbofan are
T = D; L = W (15a)
d X/dt = V ; dW/dt = −cT (15b)
In these equations, with the assumptions made earlier, thethrust is a function of the altitude and throttle setting, andthe drag (since the lift is equal to the weight) is a functionof the altitude, the true airspeed, and the weight. Althoughthe V in the first expression of Eq. (15b) is actually theground speed, it is customary to assume that there is no

P1: FYK/FPW Revised Pages P2: FYK
Encyclopedia of Physical Science and Technology EN001-912 April 20, 2001 18:42
374 Aircraft Performance and Design
wind (the still-air assumption) so that the airspeed andground speed are identical.
With the introduction of the parabolic drag polar, thedrag can be expressed as:
D = q SCD = q SCD0 + q SK C2L (16)
where q is the dynamic pressure and is equal to 12 ρSLσ V 2.
Whether q or its equivalent expression is used is a matterof convenience. With L = W , Eq. (4a) can be solved forCL to obtain:
CL = W/S
q= 2(W/S)
ρSLσ V 2(17)
where W/S is called the wing loading of the aircraft, hasthe units of pounds per square foot, and is an importantperformance and design parameter. Substituting Eq. (17)into Eq. (16) yields two drag expressions that are veryuseful. One expression is for the drag as a function ofthe weight, and the other (which is even more useful) isfor the drag-to-weight ratio (which is also the level-flightthrust-to-weight ratio) in terms of the wing loading. Theseexpressions are
D = q SCD0 + K W 2
q S= 1
2ρSLσ V 2SCD0 + 2K W 2
ρSLσ V 2
(18a)
D
W= qCD0
(W/S)+ K (W/S)
q= ρSLσ V 2CD0
2(W/S)+ 2K (W/S)
ρSLσ V 2
(18b)
Since the thrust must be equal to the drag in level flight,either of these expressions can be solved for the level-flightairspeed, which is found to be
V ={
T/S
ρSLσCD0
[1 ±
(1 − 4K CD0
(T/W )2
)1/2]}1/2
(19)
The ± sign in Eq. (19) indicates that mathematically thereare two possible values for the level-flight airspeed fora given aircraft with a specified throttle setting, altitude,and weight, values that may not necessarily be physicallyrealizable.
In Eq. (19) the radicand 1 − [4K CD0/(T/W )2] must beequal to or greater than zero if there are to be any realsolutions. With the introduction of the Em relationship ofEq. (18b), the necessary condition for steady-state levelflight is
T/W ≥ 1/Em (20)
where T is the actual, instantaneous thrust, which is afunction of the altitude and the throttle setting, and W
is the actual, instantaneous gross weight of the aircraft.Remember that Em (the maximum lift-to-drag ratio) is adesign characteristic of the aircraft.
Figure 4 is a graph of typical level-flight equilibriumconditions for a given altitude and wing loading. For agiven throttle setting the available thrust-to-weight ratio(T1/W ) is, to a first approximation, independent of theairspeed. The drag-to-weight ratio, however, is stronglydependent on the airspeed, being very large at low air-speeds (where the drag due to lift is dominant, since thelift coefficient is large), decreasing with increasing air-speed to reach a minimum value at Em, and then becom-ing very large again at high speeds (where the zero-liftdrag is dominant). For the throttle setting for T1/W , thereare two points of intersection of the two curves, pointswhere the thrust is equal to the drag. Point 1 (V1), isthe high-speed solution and point 2 (V2) is the low-speedsolution.
It is important to remember that V1 and V2 may notbe physically realizable—V1 if it exceeds the drag-riseMach number, and V2 if it is less than the stall speed.Furthermore, it can be shown that V2 is a statically unstablecondition in that, if the airspeed decreases for some reasonto V5, the thrust will be less than the drag and the aircraftwill decelerate rapidly. In fact, the region to the left ofpoint 6 is referred to as the backside of the power curveand is a region to be avoided, particularly on takeoff orlanding. If the airspeed is allowed to drop below V6, it isnot always possible to increase the thrust (by increasing thethrottle setting) sufficiently or rapidly enough to preventstalling, and increasing the thrust by losing altitude is notan acceptable alternative.
FIGURE 4 Level-flight equilibrium conditions for a turbojet for agiven altitude and wing loading.
P1: FYK/FPW Revised Pages P2: FYK
Encyclopedia of Physical Science and Technology EN001-912 April 20, 2001 18:42
Aircraft Performance and Design 375
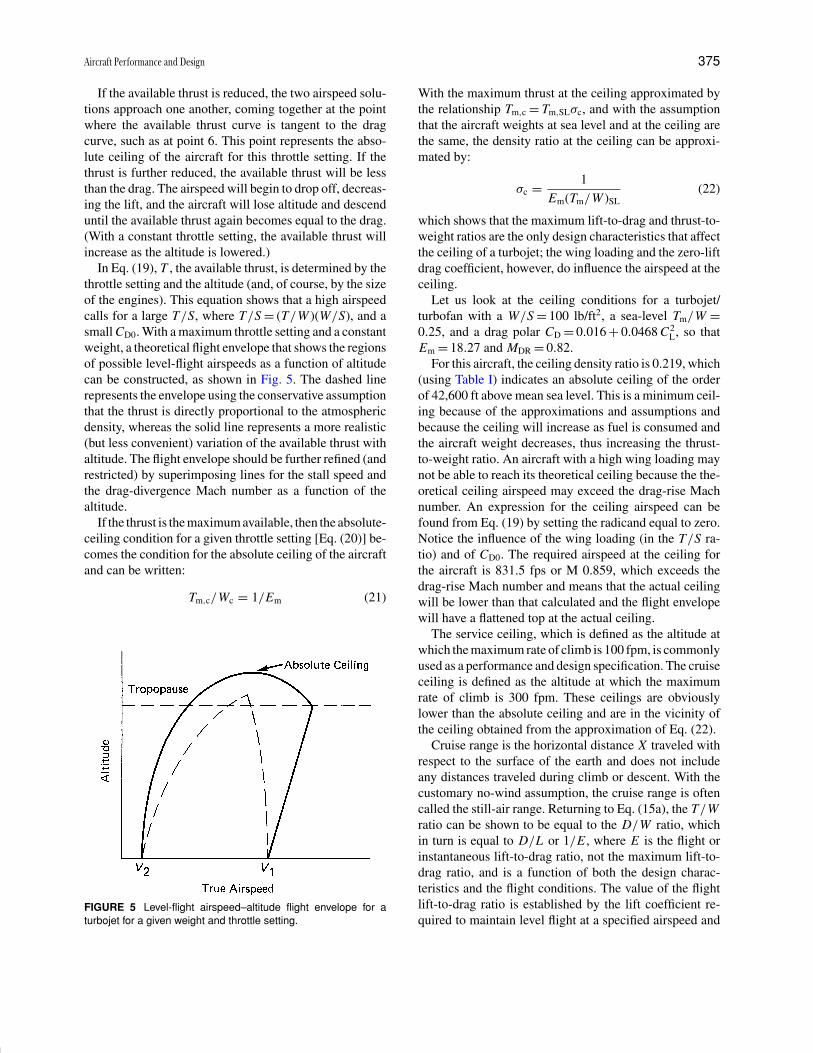
If the available thrust is reduced, the two airspeed solu-tions approach one another, coming together at the pointwhere the available thrust curve is tangent to the dragcurve, such as at point 6. This point represents the abso-lute ceiling of the aircraft for this throttle setting. If thethrust is further reduced, the available thrust will be lessthan the drag. The airspeed will begin to drop off, decreas-ing the lift, and the aircraft will lose altitude and descenduntil the available thrust again becomes equal to the drag.(With a constant throttle setting, the available thrust willincrease as the altitude is lowered.)
In Eq. (19), T , the available thrust, is determined by thethrottle setting and the altitude (and, of course, by the sizeof the engines). This equation shows that a high airspeedcalls for a large T/S, where T/S = (T/W )(W/S), and asmall CD0. With a maximum throttle setting and a constantweight, a theoretical flight envelope that shows the regionsof possible level-flight airspeeds as a function of altitudecan be constructed, as shown in Fig. 5. The dashed linerepresents the envelope using the conservative assumptionthat the thrust is directly proportional to the atmosphericdensity, whereas the solid line represents a more realistic(but less convenient) variation of the available thrust withaltitude. The flight envelope should be further refined (andrestricted) by superimposing lines for the stall speed andthe drag-divergence Mach number as a function of thealtitude.
If the thrust is the maximum available, then the absolute-ceiling condition for a given throttle setting [Eq. (20)] be-comes the condition for the absolute ceiling of the aircraftand can be written:
Tm,c/Wc = 1/Em (21)
FIGURE 5 Level-flight airspeed–altitude flight envelope for aturbojet for a given weight and throttle setting.
With the maximum thrust at the ceiling approximated bythe relationship Tm,c = Tm,SLσc, and with the assumptionthat the aircraft weights at sea level and at the ceiling arethe same, the density ratio at the ceiling can be approxi-mated by:
σc = 1
Em(Tm/W )SL(22)
which shows that the maximum lift-to-drag and thrust-to-weight ratios are the only design characteristics that affectthe ceiling of a turbojet; the wing loading and the zero-liftdrag coefficient, however, do influence the airspeed at theceiling.
Let us look at the ceiling conditions for a turbojet/turbofan with a W/S = 100 lb/ft2, a sea-level Tm/W =0.25, and a drag polar CD = 0.016 + 0.0468 C2
L, so thatEm = 18.27 and MDR = 0.82.
For this aircraft, the ceiling density ratio is 0.219, which(using Table I) indicates an absolute ceiling of the orderof 42,600 ft above mean sea level. This is a minimum ceil-ing because of the approximations and assumptions andbecause the ceiling will increase as fuel is consumed andthe aircraft weight decreases, thus increasing the thrust-to-weight ratio. An aircraft with a high wing loading maynot be able to reach its theoretical ceiling because the the-oretical ceiling airspeed may exceed the drag-rise Machnumber. An expression for the ceiling airspeed can befound from Eq. (19) by setting the radicand equal to zero.Notice the influence of the wing loading (in the T/S ra-tio) and of CD0. The required airspeed at the ceiling forthe aircraft is 831.5 fps or M 0.859, which exceeds thedrag-rise Mach number and means that the actual ceilingwill be lower than that calculated and the flight envelopewill have a flattened top at the actual ceiling.
The service ceiling, which is defined as the altitude atwhich the maximum rate of climb is 100 fpm, is commonlyused as a performance and design specification. The cruiseceiling is defined as the altitude at which the maximumrate of climb is 300 fpm. These ceilings are obviouslylower than the absolute ceiling and are in the vicinity ofthe ceiling obtained from the approximation of Eq. (22).
Cruise range is the horizontal distance X traveled withrespect to the surface of the earth and does not includeany distances traveled during climb or descent. With thecustomary no-wind assumption, the cruise range is oftencalled the still-air range. Returning to Eq. (15a), the T/Wratio can be shown to be equal to the D/W ratio, whichin turn is equal to D/L or 1/E , where E is the flight orinstantaneous lift-to-drag ratio, not the maximum lift-to-drag ratio, and is a function of both the design charac-teristics and the flight conditions. The value of the flightlift-to-drag ratio is established by the lift coefficient re-quired to maintain level flight at a specified airspeed and

P1: FYK/FPW Revised Pages P2: FYK
Encyclopedia of Physical Science and Technology EN001-912 April 20, 2001 18:42
376 Aircraft Performance and Design
altitude. Obviously, the minimum thrust required from theengines occurs when the aircraft is flying at the maximumvalue of the lift-to-drag ratio, and, just as obviously, thelarger the maximum lift-to-drag ratio (the aerodynamicefficiency), the lower is the minimum required thrust.
In Eq. (15b), dividing d X/dt by dW/dt and makinguse of the various relationships yields the expressions:
d X
−dW= V
cT= V
cD= V E
cW(23)
where d X/−dW is often referred to as the instantaneousrange or the specific range and is the exchange ratio be-tween range and fuel. It has units of miles per pound offuel and is analogous to the mileage of an automobile, es-pecially when it is expressed in miles per gallon (mpg). Agallon of jet fuel weighs ∼6.75 lb.
Although the mileage of an aircraft at a particular pointor instant of time is of interest, the range for a given amountof fuel or, conversely, the amount of fuel required to fly aspecified range is of greater interest in performance anal-yses. The range can be found by integrating the instan-taneous performance over the interval between specifiedend points, usually the start and end of cruise, which aredenoted by the subscripts 1 and 2, respectively. Before in-tegrating Eq. (23), it is necessary to define the mass ratioMR and the cruise-fuel weight fraction ζ , both importantperformance and design parameters. The mass ratio is theratio of the total weight of the aircraft at the start of cruise(W1) to its total weight at the end of cruise (W2) and isalways greater than unity. The cruise-fuel weight fractionζ is the ratio of the weight of fuel consumed during cruise(�Wf) to the total weight of the aircraft at the start ofcruise; that is, ζ = �Wf/W1. The relationships among themass ratio, the cruise-fuel weight fraction, and the aircraftweights are
MR = W1
W2= W1
W1 − Wf= 1
1 − ζ(24a)
W2 = W1(1 − ζ ) (24b)
ζ = (MR − 1)/MR (24c)
With the assumption of a constant tsfc, Eq. (23) can bepartially integrated to obtain the integral range equation:
X = −1
c
∫ 2
1
VE
WdW (25)
Before this equation can be further integrated, it is neces-sary to define the flight program to be considered with twoparameters held constant. Of the many flight programs thatcould be defined, one of particular interest is the constantairspeed–constant lift coefficient flight program. Since CL
is held constant, the lift-to-drag ratio E will also be con-stant, so that Eq. (25) can be written:
X = − VE
c
∫ 2
1
dW
W(26)
The resulting range equation is
X = VE
cln MR = VE
cln
(1
1 − ζ
)(27)
This is the general form of what is known as the Breguetrange equation. The airspeed and lift coefficient are re-lated by the expression obtained from the lift equation,namely.
V =[
2(W/S)
ρSLσCL
]1/2
(28)
In order to keep both V and CL constant while theweight of the aircraft decreases along the flight path asfuel is used, Eq. (28) shows that the atmospheric den-sity ratio must decrease in a similar manner so as to keepW/σ constant. The only way that this can be done is toincrease the altitude (decrease σ in an appropriate man-ner. Consequently, the aircraft must maintain a continuousclimb, and this flight program is commonly referred to ascruise–climb flight. Although this climb appears to vio-late the level-flight assumption, it will be shown that theflight-path angle is sufficiently small to justify the use ofthe level-flight equations and solutions for cruise–climb.The required thrust (the drag) will decrease along the flightpath in such a manner that in the stratosphere the avail-able thrust will decrease in an identical manner. Therefore,cruise–climb in the stratosphere requires no computationsor effort on the part of the pilot. After establishing the de-sired cruise airspeed, the pilot simply engages the Mach-hold (or constant-airspeed) mode on the flight control sys-tem, and the aircraft will slowly climb at the flight-pathangle required to keep the airspeed and lift coefficientconstant.
Example 3. A turbofan with the drag polar of Ex-ample 1 is to cruise-climb at 455 mph (667 fps, M 0.67),starting at 30,000 ft with an initial wing loading of 130lb/ft2, a sfc = 0.65 hr−1, and a cruise fuel fraction of 0.3(a relatively long-range flight).
1. Find the range in miles:
q1 = 1
2ρSL × 0.374 (667)2 = 197.7 lb/ft2
CL1 = (W/S)/q = 130/197.7 = 0.658
CD1 = 0.016 + 0.0468 (0.658)2 = 0.036
E1 = CL/CD = 18.1
X = 18.1×455
0.65ln
(1
1−0.3
)= 4519 mi = 3924 nmi

P1: FYK/FPW Revised Pages P2: FYK
Encyclopedia of Physical Science and Technology EN001-912 April 20, 2001 18:42
Aircraft Performance and Design 377
2. Find the altitude at the end of cruise and the averageflight-path angle in degrees:
σ2 = σ2 (1–ζ ) = 0.374 × 0.7 = 0.262
From Table 1,
h2∼= 38,750 ft; γ = tan−1 8750
4519×5280= 0.021◦,
a very small climb angle
3. Find the flight time (hours):
t = 4519/455 = 9.93 hr
It is important to watch the units. Since c is expressedin pounds per hour per pound and since the range is instatute miles, V in the range equation must be in miles perhour. If the range were to be in nautical miles (nmi), Vwould be expressed in knots, where 1 knot is 1 nmi/hr and1 nmi = 1.1515 mi.
The range obtained in Example 3 is not necessarily thebest range, that is, the maximum range possible for thatstarting altitude and fuel-flow weight fraction. The best-range conditions can be found by maximizing the instan-taneous range (the mileage) of Eq. (23) by setting its firstderivative with respect to the airspeed equal to zero andsolving for the best-range airspeed. With a parabolic dragpolar, the best-range airspeed is
Vbr =[
2(W/S)
ρSLσ
]1/2[ 3K
CD0
]1/4
(29a)
and other best-range conditions are
CL,br =(
CD0
3K
)1/2
; Ebr = 0.866Em
Tbr
W= 1.155
Em(29b)
Example 4. As in Example 3, the turbofan flies acruise-climb program starting at 30,000 ft with W/S =130 lb/ft2 and ζ = 0.3 but at “best-range” conditions.
1. Using the best-range expressions above, Vbr =930.8 fps =634.6 mph= M 0.93> MDR (0.83), anddrag polar is not valid. Since Mbr > MDR, cruise atMDR = 0.83; therefore, V = 825 fps = 562.7 mph;q = 302.8 lb/ft2; CL = 130/302.8 = 0.429; CD =0.0246; and E = 17.4.
2. Find the range and flight time:
X = 562.7 × 17.4
0.65ln
(1
1 − 0.3
)= 5372 mi
= 4666 nmi (a 19% increase in range)
t = 5372/562.7 = 9.54 hr
(a 4% decrease in flight time)
3. As a matter of interest, find the cruise-fuel weightfraction for a range of 2000 mi.
2000 = 562.7 × 17.4
0.65ln MR; MR = 1.142;
ζ = MR − 1
MR= 0.124
First, notice that it is not possible to fly at the best-rangeconditions because the large wing loading of this aircraftrequires a best-range airspeed that exceeds the drag-riseMach number and violates the parabolic drag polar as-sumption; however, this example shows that the benefitsof flying at the higher airspeed with the same fuel loadare an increase in range of 19% and a 4% reduction inflight time. Also notice the coupling of the airspeed andthe lift-to-drag ratio in the range equation; one cannot bechanged without affecting the other, and the range for agiven fuel load is maximized when the product of V andE is maximized.
Although V and E are coupled for a given σ and W/S,if E is specified, such as Ebr, Eq. (29a) shows that Vbr
can be increased without changing E by decreasing σ (byincreasing the altitude) and/or increasing W/S. The influ-ence of the altitude on the airspeed and range of a turbo-jet/turbofan is quite strong, as evidenced by the fact thatthe best-range airspeed (and best range) for a particularaircraft is 60% higher at 30,000 ft than at sea level. Al-though the effects of increasing the wing loading are notas dramatic, a larger W/S increases both the airspeed andrange; for example, a doubling of the wing loading resultsin a 14% increase in both the airspeed and the range.
Typical values of the wing loading are of the order of100–130 lb/ft2 for long-range subsonic transports, of theorder of 50 to 60 lb/ft2 for short- and medium-range trans-ports and fighter aircraft, and of the order of 15–20 lb/ft2
for light aircraft. The lower values for the last two classesof aircraft arise from operational requirements more press-ing than range, generally a short takeoff run for the smalleraircraft and maneuverability for the fighters.
Two cautionary comments are in order with respectto increasing the best-range airspeed. First, no attemptshould be made to increase the wing loading by increas-ing the weight; instead, the wing area should be reduced.Although Vbr is directly proportional to the square root ofthe gross weight, the instantaneous range is inversely pro-portional to the weight itself. Second, no attempt shouldbe made to increase Vbr by increasing K (by decreasing theaspect ratio), because the range penalty associated with thedecrease in Em will be predominant. On the other hand,reducing the zero-lift coefficient will increase not only Vbr
but also Em, both salutary. Furthermore, a reduction in CD0
improves all other aspects of performance and is a goal tobe pursued vigorously, as is a reduction in weight.
P1: FYK/FPW Revised Pages P2: FYK
Encyclopedia of Physical Science and Technology EN001-912 April 20, 2001 18:42
378 Aircraft Performance and Design
Equation (29b) shows that the best-range T/W isgreater than 1/Em, as is required for level flight, but notmuch more, and it can be shown that the cruise–climb al-titude is ∼3500 ft lower than the absolute ceiling for thebest-range throttle setting. Equation (29b) also shows thatthe thrust required is independent of the altitude itself sothat the sea-level thrust (as is the drag) is identical to thatrequired at high altitudes. As the altitude increases, how-ever, the available thrust decreases, and it is necessary tobe sure that there is sufficient available thrust at the cruisealtitude and that the best-range airspeed does not exceedthe drag-rise Mach number. It can be easily shown that thebest-range fuel consumption is also independent of the al-titude. This means that, for a given fuel load, a turbojetaircraft can stay in the air just as long at sea level as ataltitude. It is the increased airspeed required at the higheraltitudes that results in the greater ranges. In actuality, thetsfc does decrease slowly with altitude, reaching a min-imum value at the tropopause and increasing even moreslowly in the stratosphere. Consequently, there is a slightadvantage to flying in the vicinity of the tropopause, allother things being equal.
Although the cruise–climb flight program is superiorto any other cruise flight program, air traffic control willpermit its use only under certain limited conditions be-cause the continuous climb poses a threat to other traf-fic. For short-range flights, flying at a constant altitudewith a constant airspeed, which is favored by air trafficcontrol, does not significantly penalize the range perfor-mance. On long-range flights, cruise–climb can be ap-proximated by the use of stepped-altitude flight, whichis a series of constant altitude–constant airspeed segmentsconducted at increasing altitudes with each altitude changeplacing the aircraft momentarily on the cruise–climb flightpath. Stepped-altitude flight, with 4000-ft steps (the small-est allowed by air traffic control), is consistently used ontransoceanic and some transcontinental flights to reducethe total fuel consumption, an important consideration intimes of fuel scarcity and/or increasing prices.
Endurance is the length of time an aircraft can remainairborne for a given expenditure of fuel and for a spec-ified set of conditions. The instantaneous endurance, orexchange ratio for time and fuel, is simply the inverseof the negative fuel consumption rate and, for level orcruise–climb flight, is simply dt/−dW , which is equal toE/cW . Maximum endurance is a primary design and op-erational criterion for aircraft with such special missionsas patrol, antisubmarine warfare, and command and con-trol and is of interest for all aircraft during the loiter phaseof any flight. Loiter is defined as flight where enduranceis paramount and range is either secondary or of no im-portance at all. An intercontinental bomber, such as theB-52, loiters while on airborne alert. A fighter on com-
bat air patrol (CAP) loiters while awaiting the assignmentof targets or the sighting of intruders. All aircraft shouldloiter, if so permitted, in holding patterns while awaitingfurther clearance.
Inspection of the instantaneous endurance shows thatit is at maximum when the weight is at a minimum andthe aircraft is flying at Em, that is, when the drag is ata minimum and the T/W is equal to 1/Em. The flightaltitude will be the absolute ceiling for the throttle settingand the airspeed will be 24% lower than that for best-rangecruise at the same altitude. The maximum endurance isindependent of the altitude, but the associated range will behigher at altitude because the minimum-drag airspeed willbe higher at altitude. It is interesting that the maximum-endurance flight time is always 15.5% longer than the best-range flight time, regardless of the magnitude of the range.
B. Other Flight in the Vertical Plane
Takeoff and landing ground runs, though not flight condi-tions per se, are important for performance and operationalreasons and often are the determining factors in the selec-tion of certain design and subsystem characteristics, suchas the thrust-to-weight ratio and the wing loading.
The equation of motion governing the takeoff groundrun of a conventional aircraft can be written
T − D − µ(W − L) = W
g
dV
dt(30)
where µ is the coefficient of rolling friction and g the ac-celeration due to gravity. Although numerical solutionsor iterative procedures are required for the solution ofthis equation, a reasonable closed-form solution that givessome insight to the takeoff problem can be obtained by as-suming that the thrust is constant throughout the run andby neglecting the drag and friction forces, which accountfor 10–20% of the energy expended. With these assump-tions. Eq. (30) can be simplified and wirtten
T = W
g
dV
dx
dx
dt= W V
g
dV
dx(31)
Separating the variables and integrating from the start ofthe run to liftoff (LO) yields the expression:
d = V 2LO
2g(T/W )(32)
The liftoff airspeed VLO is generally set equal to 1.2 Vs,where Vs is the takeoff stall speed. Expressions for the twoairspeeds are
Vs =[
2(W/S)
ρSLσCLmax,TO
]1/2
(33a)

P1: FYK/FPW Revised Pages P2: FYK
Encyclopedia of Physical Science and Technology EN001-912 April 20, 2001 18:42
Aircraft Performance and Design 379
VLO = 1.2Vs =[
2.88W/S
ρscσCLmax,TO
]1/2
(33b)
Examination of Eqs. (32) and (33b) shows that the take-off run can be decreased by decreasing the wing loadingor by increasing the thrust-to-weight ratio, the maximum-lift coefficient, or the atmospheric density. Decreasing thewing loading, however, decreases the best-range airspeedand thus the cruise range for a given cruise-fuel weightfraction. Increasing the thrust-to-weight ratio beyond thatrequired for cruise or for special mission requirements(such as ceilings) increases the engine weight with accom-panying increases in the gross weight of the aircraft andfuel required. Increasing the maximum-lift coefficient bymeans of flaps (Fowler-type flaps also decrease the wingloading by increasing the wing area) adds weight and com-plexity and increases the drag during the ground run. Theatmospheric density cannot be controlled, but its effect ontakeoff performance cannot be neglected. Obviously, anairfield located 5000 ft above mean sea level will require alonger ground run than one at sea level. In addition, a hotday and/or low barometric pressure will also decrease theair density, thus increasing the ground run by increasingthe liftoff airspeed and decreasing the available thrust.
The thrust-to-weight ratio, although appearing to be di-mensionless, is actually an acceleration expressed in g’s.In other words, a T/W of 0.25 represents an accelera-tion of 0.25 g, or 8.05 ft/sec2. Therefore, it is possibleto develop an approximate, and somewhat optimistic, ex-pression for the time to liftoff, that is,
t = VLO
gσ (T/W )SL(34)
A long-range, high-subsonic transport with a wing load-ing of 100 lb/ft2, a T/W of 0.25, and a maximum-takeoff-lift coefficient of 1.8 would require (according to the pre-ceding equations) a sea-level ground run of 4200 ft with aliftoff airspeed of 177 mph and an elapsed time of 32 sec.Given that these are optimistic figures and that provisionsmust be made for nonstandard day conditions, clearanceof a 50-ft obstacle, factors of safety, aborts, and so on, sucha ground-run value implies the need for runway lengths ofthe order of 8000–10,000 ft for such aircraft.
Short-range transports used for travel between and fromsmaller cities cannot count on finding 10,000-ft runways.Consequently, their design characteristics must be modi-fied so as to reduce the ground run, generally by reducingthe wing loading and increasing the lift coefficient. TheT/W is left unchanged, if possible, for weight and operat-ing economy reasons. Reducing W/S from 100–50 lb/ft2
and increasing the lift coefficient from 1.8–2.0, but leav-ing the T/W at 0.25, results in a ground run of ∼1900 ftwith a liftoff airspeed of 119 mph and an elapsed time of
22 sec. This ground-run value implies a need for runwaylengths of the order of 4000 to 5000 ft.
A STOL (short takeoff and landing) aircraft is designedfor exceptionally short ground runs as well as steep climbsand descents. It is characterized by a low wing loading, ahigh lift coefficient, and a large thrust-to-weight ratio. Forexample, if W/S is 40 lb/ft2, CL is 2.6, and T/W is 0.6,then the ground run becomes of the order of 500 ft with aliftoff airspeed of 93 mph and an elapsed time of 7 sec.
Air-to-air fighter aircraft, particularly those equippedwith guns, are characterized by a lower wing loading thantransports (for reasons of maneuverability), higher T/Wvalues, as might be expected, and lower values of themaximum-lift coefficient (to keep the wing thin and cleanso as to minimize CD0 and the wave drag). An advancedfighter with a T/W of 1.3 (without afterburner), a W /S of66 ft/1b2, and a maximum CL of 1.2 would have a groundrun of the order of 800 ft and an elapsed time of 6 sec.The sea-level stall and liftoff airspeeds would be 215 fps(147 mph) and 258 fps (176 mph), respectively.
The landing-run requirements must also be considered.They have increased in importance as wing loadings (andthus approach and touch–down airspeeds) have increasedand as the drag has decreased. The landing maneuver com-prises the final approach, the landing flare, the touch–down(to include getting all the wheels on the ground), and theground run. A simple but crude expression for the landing-run distance, in feet, is
d ∼= 12 fdV 2
s (35)
where fd, the deceleration factor, is of the order of 0.4for a conventional jet transport and Vs is the stall speed attouchdown. This expression is crude because of the varietyand complexity of modern retardation devices (such asthrust reversers and spoilers) and the difference betweenwet and dry runways. If the illustrative turbojet has beenon a long-range mission with a cruise-fuel weight fractionof 0.3 and has a landing lift coefficient of 2.0, then thelanding wing loading will be equal to 100(1 − 0.3), or70 1b/ft2; Vs will be 171.6 fps (117 mph) with a final-approach air-speed of 140 mph. With an fd of 0.4, thelanding run will be of the order of 5890 ft, which is longerthan the takeoff run. Stopping a clean, high-speed aircraftis not a trivial task. In fact, the landing run often establishesthe minimum final-approach airspeed, which in turn fixesthe maximum value of the wing loading.
The climbing flight steady-state equations are
T − D − W sin γ = 0 (36)
L − W cos γ = 0 (37)
d X/dt = V cos (38)
dh/dt = V sin (39)

P1: FYK/FPW Revised Pages P2: FYK
Encyclopedia of Physical Science and Technology EN001-912 April 20, 2001 18:42
380 Aircraft Performance and Design
where γ , the climb (flight-path) angle is the angle betweenthe horizon and the velocity vector. From Eq. (36):
sin γ = (T − D)/W (40)
which shows that the climb angle is determined by theexcess thrust per unit weight, where excess thrust refers tothat thrust not required to counteract the drag. SubstitutingEq. (40) into Eq.(39) gives an expression for dh/dt , therate of climb R/C . This expression.
R/C = V sin γ = (T V − DV )/W (41)
shows that the rate of climb is determined by the excessthrust power per unit weight.
Rewriting Eq. (40) and incorporating Eq. (37) yields:
sin γ = T
W− D
W= T
W− cos γ
E(42)
which shows that the largest value that the sine of theclimb angle can assume is equal to the maximum thrust-to-weight ratio. If the maximum T/W is 0.25, a typical valuefor a subsonic jet transprot, then the maximum climb anglewill be less than 15◦ at sea level; if the maximum T/Wis 0.6, the maximum climb angle will be less than 37◦. Asthe altitude increases during the climb, the availble T/Wwill decrease (with W changing slowly) and the maximumclimb angle will therefore decrease, going to zero at theabsolute ceiling of the aircraft, as might be expected.
With respect to the climb drag, it can be shown that,for climb angles up to the order of 30◦, using the level-flight drag is a reasonable approximation. The fuel burnedduring a climb is a small percentage of the gross weight ofa well-designed aircraft climbing in an efficient manner,and the aircraft weight will be assumed constant.
Steepest climb is of interest in clearing obstacles and inestablishing the upper limit of the climb angles and occurswhen the excess thrust is at a maximum. With the level-flight drag approximation, steepest climb conditions areessentially the minimum drag (Em) conditions as can beseen in Fig. 6. For the illustrative turbojet at sea level, themaximum climb angle is 11.3◦ at an airspeed of 259 mphwith an R/C of 4460 fps. At 30,000 ft, the maximum climbangle has dropped to 2.2◦, the airspeed has increased to423 mph, and the R/C is 1443 fpm.
Fastest climb is of greater importance as it requires theminimum time to climb to a specified altitude, which isof interest to air traffic controllers, who must keep the airspace free of other traffic, and to a first approximationrequires the smallest amount of fuel, thus increasing theamount available for cruise. The R/C can be maximizedby setting its first derivative with respect to the true air-speed equal to zero, yielding the following relationships:
VFC =[
(T/S)SL�
3ρSLCD0
]1/2
(43)
FIGURE 6 Graphic representation of steepest climb condition fora turbojet for a given wing loading, altitude, and throttle setting.
� = 1 +{
1 + 3
[Em(T/W )]2
}1/2
(44)
sin γFC = T
W
(1 − �
6
)− 3
2�E2m(T/W )
(45)
(R/C)max = VFC sin γFC (46)
A close examination of these expressions shows that ahigh rate of climb calls for a large T/W , a high W/S, anda low CD0 and that the magnitude of the thrust is the mostimportant parameter for fast climb. Fastest climb of theillustrative turbojet at sea level is 6266 fpm at 459 mph(M 0.6) with a climb angle of 8.9◦. This airspeed is fasterthan that allowed by air traffic control at the lower altitudesand would have to be reduced appropriately.
It should be emphasized that these climbing perfor-mance values are theoretical and represent the maximumperformance possible without any practical limitations onthe climbing airspeed, as mentioned in the previous sen-tence, or on the maximum allowable load factor, to bediscussed in the next section on turning flight.
The time to climb and the amount of fuel used duringclimb are of more interest than the R/C and can be foundfrom approximate closed-form expressions or by dividingthe climb into segments and then using average values tocreate a tabular solution.
Unpowered flight occurs when a single-engine aircrafthas engine failure, when an aircraft runs out of fuel, orwhen an aircraft has no engine (a glider or a sailplane).The relevant equations of motion are obtained by settingthe thrust equal to zero and assuming a small glide (flight-path) angle. Maximum range occurs when the aircraft isflown at its maximum lift-to-drag ratio (which is often

P1: FYK/FPW Revised Pages P2: FYK
Encyclopedia of Physical Science and Technology EN001-912 April 20, 2001 18:42
Aircraft Performance and Design 381
referred to as the glide ratio). Since the glide angle isconstant and has its smallest value, this glide programis sometimes called flattest glide. The airspeed will bethe minimum drag airspeed and is higher than one mightexpect. Maximum-endurance (minimum rate of descent)glide calls for a 15% larger glide angle, a slower airspeed,and an E equal to 0.866Em.
C. Turning Flight
Even though an aircraft may spend most of a mission instraight flight, there are times when it must turn. For allaircraft there are turns associated with changes in flightheadings, collision avoidance, and instrument approachesand landings. Combat aircraft must have a greater degreeof manueverability than transports in order to survive andcarry out their operational missions. The manuevering ca-pability of an aircraft, along with the associated designand flight parameters, can be determined to a first approx-imation by limiting turning flight to the horizontal planeand by assuming the weight to be constant and the sideslipangle to be zero. The maneuvering parameters of interestare the (maximum) turning rate and the (minimum) turn-ing radius.
The relevant steady-state equations of motion are
T = D (47)
L sin φ = W
gV χ (48)
L cos φ = W (49)
where χ is the turning rate (rad/sec) and φ the bank angle(degrees). These equations show that the drag is balancedby the thrust, the centrifugal force is balanced by the hori-zontal component of the lift, and the weight is balanced bythe vertical component of the lift. With the sideslip anglezero (coordinated turns), the lift vector always lies in theplane of symmetry.
The lift-to-weight ratio L/W is called the load factoris given the symbol n, and has units of g’s. It is calledthe load factor because it is a measure of the forces, orloading, impressed on the structure or occupants. For ex-ample, level flight is often referred to as l-g flight becauseL = W and n = 1. When n is equal to 2, the lift is twicethe weight of the aircraft and the wing span, for example,must accept a load that is twice the weight of the aircraftwithout damage or unacceptable deflections. Similarly, aperson in the aircraft is subjected to an additional forceequal to the individual’s weight. If the load factor exceedsthe tolerances of the structures or occupants, temporary orpermanent damage can occur.
Using the definition of the load factor and Eq. (47), onecan write Eq. (49) as:
n = L/W = 1/(cos φ) = (T/W )E (50)
which shows a direct coupling with the bank angle andwith the product of the thrust-to-weight and lift-to-dragratios. For any load factor, the corresponding bank angleis
φ = cos−1(1/n) (51)
When n is unity, the lift is equal to the weight and thebank angle is zero. When the bank angle is zero, Eq. (48)shows that the turning rate is also zero, indicating thatthere cannot be a steady-state coordinated turn without afinite bank angle. When the bank angle is 90◦, the loadfactor becomes infinite, which means that an aircraft can-not maintain a coordinated steady-state turn with a 90◦
bank angle and still hold a constant altitude. Turns with abank angle of 90◦ can be accomplished only by skiddingor by losing or gaining altitude, the latter requiring a T/Wgreater than 1.
Relevant expressions for χ are
χ = g tan φ
V= g(n2 − 1)1/2
V(52)
where χ is in radians per second, V is in feet per second,and g is taken to be equal to 32.2 ft/sec2. Since the airspeedV is a tangential velocity equal to χ r , expressions for rare
r = V
χ= V 2
g tan φ= V 2
g(n2 − 1)1/2(53)
The D/W ratio, using the parabolic drag polar, can bewritten:
D
W= qCD0
W/S+ K n2(W/S)
q. (54)
which, when set equal to T/W , can be solved for theturning airspeed,
y = T/S
ρSLσCD0
1 ±
(1 − n2
[Em(T/W )]2
)1/2
1/2
(55)
These expressions have several points of interest. Whenthe lift is equal to the weight, the load factor is unity, andthe turning values reduce to those for level flight, as mightbe expected. When the load factor is greater than unity, asin a turn, the airspeed will be less than that for level flight.Consequently, the pilot must increase the thrust when en-tering a turn if both the airspeed and altitude are to re-main constant. It should also be noted that specifying thebank angle (and thus the load factor) and the T/W ratiodetermines the airspeed and turning rate for a given al-titude and that there may be two possible combinations.

P1: FYK/FPW Revised Pages P2: FYK
Encyclopedia of Physical Science and Technology EN001-912 April 20, 2001 18:42
382 Aircraft Performance and Design
Not only does the airspeed drop off in a turn if the thrustis not increased, but also the stall speed increases as thesquare root of the load factor. For example, a bank angleof 30◦ (n = 1.155) increases the wing-level stall speed by7.5%.
Solving the turning rate and turning radius equations forseveral airspeed combinations leads to the conclusion thatlower airspeeds and lower altitudes give better turningperformance in terms of higher turning rates and smallerturning radii.
Inspection of Eq. (50) shows that for a given T/W , themaximum load factor (and maximum bank angle) occurswhen E is at a maximum and that the largest value of themaximum possible load factor occurs when both T/Wand E are at their maxima. Because of structural limita-tions (or passenger comfort), aircraft are limited to flightconditions that will not exceed a maximum allowable loadfactor, which for a transport is of the order of 2.5 g andfor a fighter aircraft is of the order of 8 g. The illustrativeturbojet has a maximum possible load factor at sea level of4.6 g. If the aircraft is not to exceed 2.5 g, the T/W ratiomust not exceed 0.137 g. The maximum possible load fac-tor decreases with altitude (decreasing T/W ), becomingunity at the absolute ceiling, so that the maximum bankangle is zero. An aircraft cannot make a steady turn at theabsolute ceiling without losing altitude.
Maximum turning rate (fastest turn) and minimum turn-ing radius (tightest turn) are the true measures of themaneuverability of an aircraft. Both are achieved at lowairspeeds and at sea level. As a consequence, air-to-aircombat may start at M 2 to M 3 and at 50,000–60,000 ftbut, if continued, will slow down and descend until the lowspeed–low altitude combat arena is reached or until oneof the aircraft is destroyed. The lower limit to the combatairspeed is the stall speed in the turn, and the lower limitto the combat altitude is the minimum altitude requiredfor pull-up from an evasive maneuver. A highly maneu-verable aircraft should have a large T/W , a low W/S, alarge aspect ratio and Oswald span efficiency, a low CD0,and a large maximum-lift coefficient. Most of these char-acteristics can be seen in a modern aircraft designed formaneuvering combat with the exception of the large as-pect ratio, which is kept small for structural and weightconsiderations.
There are two differences between fastest turns andtightest turns. The fastest turn load factor is proportionalto the square root of the maximum possible load factorand has no theoretical upper limit, whereas the tightestturn load factor cannot exceed 1.414 g. The tightest turnairspeeds are even lower than those for fastest turn andusually less than the stall speed for fighter aircraft, a phys-ically impossible situation.
V. PISTON–PROPELLER AIRCRAFT
Although the techniques used to evaluate the perfor-mance of turbojet aircraft can be applied directly to air-craft equipped with reciprocating engines and propellers(piston–props), their application is not as straightforwardor as simple. Since space is too limited for complete de-velopments and analyses of the various aspects of piston–prop performance, the approach used in this section isessentially one of comparison, with emphasis on the dif-ferences between the two classes of aircraft. The flightconditions for best performance and the design parame-ters are surprisingly different for the piston–prop.
The differences between the two arise from the factthat, whereas the turbojet engine produces thrust only, thepiston–prop produces power only. (The analyses and com-parative comments of this section apply to any conceivablepropulsion system that delivers power only.) The difficul-ties in applying the turbojet techniques to the piston–propanalyses have two root causes. The first is that the fuelconsumption rate of a piston–prop aircraft is proportionalto the brake horsepower of the engine. The second, andmore troublesome mathematically, is the fact that it is thethrust rather than the power that appears explicitly in theforce equations.
For level flight in the vertical plane (the flight-path angleis zero) the equations of interest can be written:
P = T V = DV ; L = W d X/dt = V
(56a)
dW
dt= −cHP = −cP
kηp= −cT V
kηp(56b)
In Eq. (56a), P and T V represent the available thrustpower, and DV represents the required (drag) power. Use-ful power-to-weight ratio expressions are
P/W = DV/L = V/E (57)
where E is the flight (instantaneous) lift-to-drag ratio.Introducing the parabolic drag polar into Eq. (57) yields
an expression that establishes the level-flight relationshipsbetween the thrust power and the airspeed in terms of theaircraft parameters and altitude, namely,
P
W= ρSLσ V 3
2(W/S)+ 2K (W/S)
ρSLσ V(58)
Unfortunately, there is no closed-form solution, and val-ues of the airspeed must be obtained by iteration. The firstterm on the right-hand side of Eq. (58) shows that the zero-lift drag power (required power) increases as the cube ofthe airspeed, whereas the zero-lift drag (required thrust)of the turbojet increases as the square of the airspeed. This

P1: FYK/FPW Revised Pages P2: FYK
Encyclopedia of Physical Science and Technology EN001-912 April 20, 2001 18:42
Aircraft Performance and Design 383
cubing effect is an important factor in limiting the max-imum airspeed of a piston–prop. For example, the max-imum sea-level airspeed of a high-performance piston–prop with a HP/W ratio of 0.1 hp/lb (two 375-hp engines)is 249 mph. If the maximum airspeed is doubled, the newHP/W ratio is 0.731 hp/lb, an increase by a factor of 7.31,and 15 engines would be required (not very likely).
The absolute ceiling occurs when the available poweris at a maximum and the required power is at a minimum,leading to an expression for the ceiling density ratio,
σc =[
1.155VPmin,SLσcr
(Pm/W )SL Em
]2/3
(59a)
where
VPmin,SL =[
2(W/S)
ρSL
]1/2( K
3CD0
)1/4
(59b)
In Eq. (59a), σcr is the critical density ratio for a tur-bocharged engine and should be set equal to unity foran aspirated engine. The ceiling of a piston–prop is de-pendent not only on the engine power-to-weight ratio andEm (as was the case with the turbojet) but also on the wingloading. As the wing loading is increased to increase thecruise airspeed, the ceiling is lowered, whereas the ceilingof a turbojet is independent of the wing loading.
Instantaneous (point) range expressions can be written:
d X
−dW= kηpV
cP= kηp E
cW(60)
Notice that this piston–prop mileage is explicitly indepen-dent of the airspeed, although the value of E is directlycoupled to the airspeed. For good mileage, the propellerefficiency and lift-to-drag ratio should be as large as possi-ble, and the aircraft weight and specific fuel consumptionshould be minimized. If the units of the mileage are milesper pound, k has a numerical value of 375; for miles pergallon, one multiplies by 6, the weight of 1 gal of gasoline.Although the propeller efficiency varies with the airspeed,with a well-designed, variable-pitch, constant-speed pro-peller, it can be assumed to be constant in the design op-erating airspeed range and to have a value between 80 and85%.
With the general assumptions of constant propeller ef-ficiency and specific fuel consumption along with a flightcondition of constant lift coefficient, integration of themileage expression yields the piston–prop version of theBreguet range equation,
X = 375ηp E
cln
(1
1 − ζ
)(61)
This equation is valid for both constant-altitude andcruise–climb flight, but there is no improvement in rangefor cruise–climb of a piston–prop as is the case with a
turbojet. It is customary to use the Breguet range equationfor the normal constant altitude–constant airspeed flightprogram.
By inspection, the best-range condition for a piston–prop is to cruise at the maximum lift-to-drag ratio (andat the ceiling for the required throttle setting). Note thatthe best range is independent of both the airspeed and thealtitude but that the aircraft must fly at the minimum-drag(best-range) airspeed. Increasing the best-range airspeedby increasing the altitude and/or wing loading will notincrease the range but will certainly reduce the flight timeand increase the power required.
For piston–prop aircraft characterized by low grossweights and moderate or low wing loadings, the best-range airspeed is considerably lower than the maximumairspeed. Furthermore, the distances normally flown are ofthe order of 1000 mi or even less, so that the design cruise-fuel weight fraction is low. Consequently, it is customaryto cruise at 75% of the maximum power available becausetime-of-flight savings are more important than any fuelsavings.
The differences between the best-range performance ofpiston–prop and turbojet aircraft can be seen by comparingthe respective Breguet range equations. An interesting andsignificant observation is that the 375ηp in the piston–prop equation is an equivalent best-range airspeed that isindependent of the actual airspeed at which the aircraft isflying. This means that if two piston–props have identicalEm’s and specific fuel consumptions, a 100-mph aircraftwill fly just as far as a 600-mph aircraft if the cruise-fuel weight fractions are also identical. The faster aircraft,obviously, will require only one-sixth of the time to makethe flight.
This equivalent best-range airspeed also means that apure turbojet with its higher specific fuel consumption isnot competitive with the piston–prop at lower airspeeds.For comparable aircraft the best-range airspeed of the tur-bojet will be 31% higher than that of the piston–prop. Thebest range, however, will always be less than that of thepiston–prop until the best-range airspeed satisfies a con-dition that is a function of the specific fuel consumptions,the Em’s, and the propeller efficiency. For example, if apiston–prop has a propeller efficiency of 85%, a specificfuel consumption of 0.5 lb/hr·hp, and an Em of 14 andthe turbojet has a specific fuel consumption of 0.8 lb/hr·lband an Em of 18, the turbojet must have a wing loading–altitude combination such that the best-range airspeed willbe 457 mph.
The condition for piston–prop maximum endurance isto fly at minimum power at the lowest possible airspeed.This implies an aircraft that has a low wing loading, alarge maximum lift-to-drag ratio, and a low specific fuelconsumption and that flies as low and as slowly as possible.

P1: FYK/FPW Revised Pages P2: FYK
Encyclopedia of Physical Science and Technology EN001-912 April 20, 2001 18:42
384 Aircraft Performance and Design
Since the maximum-endurance airspeed is at the start ofthe backside of the power curve, the operational airspeedis somewhat higher than the theoretical value so as toestablish the cruise airspeed at a stable equilibrium point.
Comparing performance other than range is much lessstraightforward and satisfying because it is difficult to es-tablish a true basis of comparison. Perhaps the best that canbe done is to specify identical wing loadings and drag po-lars (although identical CD0’s are very unlikely and modifyany analytical comparisons with observations and com-ments on the pertinent characteristics of the two types ofpropulsion systems.
With this definition of comparable aircraft, the onewith the larger T/W ratio should have the shorter takeoffground run. Evaluating the respective T/W ’s is not sim-ple, particularly since the HP/W ratio and not the T/Wratio is the propulsion characteristic of the piston–prop.Typical values for transport aircraft are 0.25 for the T/Wof a turbojet and 0.1 for the HP/W of a piston–prop. If therule of thumb relationship that 1 hp produces ∼2.5 lb ofstatic thrust is applied to the piston–prop, the two T/Wratios will be the same and so, therefore, should be thetakeoff runs. However, since the thrust of a turbojet fallsoff at low airspeeds, its actual takeoff T/W ratio will besmaller. If it is 80% of the nominal T/W ratio, then thetakeoff run of the piston–prop will be of the order of 80%of that for a turbojet.
There are other complications to be considered, how-ever. The first of these is the fact that, as the wing loadingof the piston–prop is increased in order to obtain highercruise speeds, the liftoff airspeed will increase, thus reduc-ing the effective T/W ratio of the piston–prop. Another,and probably more important, consideration is that theT/W ratio of the turbojet can be increased with a signifi-cantly lower increase in weight than that associated withincreasing the HP/W ratio of the piston–prop. After all ofthis discussion, the only conclusion that can be reachedis that it is not possible to make a flat statement as to thetakeoff superiority of either type of aircraft.
With respect to the maximum rate of climb, the tur-bojet has a decided superiority at higher wing loadings(of the order of 50 lb/ft2 or more) and has higher climbairspeeds. At lower wing loadings or at the lower climbspeeds imposed by air traffic control, the climb rates ofthe two aircraft are much closer together. In addition, theturbocharged piston–prop has the definite superiority ofminimizing the effects of an increasing altitude on theclimb rate.
Whereas the absolute ceiling of a turbojet is indepen-dent of the wing loading (as long as the ceiling airspeeddoes not exceed MDR), that of the piston–prop decreaseswith an increase in the wing loading. For both types ofaircraft, increases in Em and in T/W or HP/W raise the
ceiling, with somewhat larger proportionate increases forthe piston–prop. In general, the turbojet has a ceiling that isconsiderably higher than that of the aspirated piston–prop,but the turbocharged piston–prop is much more compet-itive. In fact, with a low wing loading, the turbochargedceiling might even be higher.
Turning performance is described in terms of the max-imum load factor, the fastest turn, and the tightest turn.Since the characteristics that determine the ceiling alsodetermine nmax, the nmax of the turbojet will generally behigher than that of the piston–prop. Turbocharging, how-ever, will not increase nmax; it will merely retard the de-crease with altitude. Looking at the fastest and tightestturns for comparable aircraft without regard for whetherthe aircraft is below the stall speed, the piston–prop seemsto have a slight edge, an edge that diminishes with in-creased wing loading. The maximum achievable lift co-efficient is always a key factor in determining maneuver-ability, regardless of the type of propulsion system.
It is difficult to compare these two classes of aircraftbecause of the fundamental differences in their character-istics. The piston–prop has better mileage than the turbojetbut is restricted to the low-speed regime by the excessiveweight of the large engines required for the higher air-speeds and by the decrease in the propeller efficienciesat high speeds. Furthermore, the complexity and main-tenance problems and costs associated with large internalcombustion engines are very high, and, finally, the increasein the wing loading required for the higher airspeeds ad-versely affects other aspects of performance.
Although the range of the piston–prop is in different toaltitude and airspeed, the faster (and thus the higher) theturbojet flies, the farther it can fly with a given fuel load.The upper limit to subsonic cruise airspeed is the drag-riseMach number, at which point Em begins to fall off. Theprimary disadvantage of the turbojet is its large specificfuel consumption, and a secondary disadvantage is lowthrust at very low airspeeds.
VI. TURBOPROP ANDTURBOFAN AIRCRAFT
Turboprops and turbofans are gas turbine engines, as is theturbojet, and are designed to minimize the disadvantagesof and exploit the advantages inherent in piston–prop andturbojet engines. The fundamental difference among thesethree engines is in how they produce thrust. The turbojetdoes it by expansion of hot gases through a nozzle, theturboprop uses a propeller, and the turbofan uses a multi-bladed fan, which is related in many ways to the propeller.The basic element of a gas turbine engine is the gas gen-erator, made up of the compressor(s), the burners, and the
P1: FYK/FPW Revised Pages P2: FYK
Encyclopedia of Physical Science and Technology EN001-912 April 20, 2001 18:42
Aircraft Performance and Design 385
turbines that drive the compressor. The mixture of air andfuel that passes through the gas generator is the primaryflow. The gas generator and primary flow are common toall three engines and serve as a baseline for a comparativeevaluation.
In a turbojet, the exhaust gases from the gas genera-tor expand through a nozzle and thrust is the only output.It is a single-flow engine whose distinguishing character-istics are its light weight, small frontal area, propulsiveefficiency that increases with airspeed, high specific fuelconsumption (the highest of the three), and low thrust atlow airspeeds.
In a turboprop, there are two flows: a primary flow thatdevelops jet thrust and a secondary (much larger) flowthrough the propeller that produces thrust power. The tur-boprop is primarily a power producer and is described insimilar terms as the piston–prop. The turboprop is pri-marily a replacement for the piston–prop since it is ca-pable of higher airspeeds and greater range for a givenaircraft weight because of its much lighter engine weightand lower CD0. Although heavier than a turbojet or a turbo-fan because of the propeller and gearbox, it is of the orderof four times lighter than a piston–prop of the same horse-power. Furthermore, although the frontal area is somewhatlarger than that of a turbojet, it is less than that of a piston–prop, and when the engine is operating, the CD0 is of theorder of that of a turbojet, which means higher Em’s than apiston–prop. The presence of the jet thrust, which thoughrelatively small is essentially constant, tends to flatten thethrust curves at the higher speeds and to reduce the rateof decrease of the propulsive efficiency. The turboprophas a low specific fuel consumption, of the order of butsomewhat higher than that of the piston–prop. One othermajor advantage over the piston–prop is its much lowermaintenance costs. Although its initial cost is higher, it isa simpler engine with greater reliability, especially withthe recent improvements in the gearbox.
A turbofan is a multiflow engine similar in many re-spects to a turboprop, except that the additional turbinesdirectly drive a fan that resembles an axial flow compres-sor. Even though with very high bypass ratios the turbofanmay produce more power than thrust and perform morelike a turboprop than a trubojet, it is customary to describeit as though it were a turbojet.
The turbofan combines the good propulsive efficiencyand high thrust at lower airspeeds of the piston–prop withthe constant thrust and increasing propulsive efficiency atthe higher airspeeds of the turbojet. Since the complexityand weight of the reduction gearbox and propeller gover-nor system of the turboprop are eliminated, the turbofan iseven simpler and lighter. Furthermore, the airflow throughthe ducted fan is not greatly affected by the airspeed,so that the decrease in propulsive efficiency at high air-
speeds is not as significant as the decrease associated withthe propeller efficiency of the turboprop. Consequently,the turbofan can be used at airspeeds up to and includ-ing low supersonic airspeeds. Although the frontal area islarger than that of the turbojet, the turbofan is considerablyshorter and the overall drag is not necessarily larger. Thespecific fuel consumption is much less than of the turbojetand, although it is more than that of the turboprop, it ap-proaches comparable values. The turbofan is also quieterthan the turbojet and much quieter than the turboprop, anadvantage in these days of increasing concern with noisepollution.
Since both the turboprop and turbofan are multiflow en-gines, the equivalent specific fuel consumptions are com-binations of hpsfc’s and tsfc’s and thus will vary with air-speed. Any value quoted in the literature is for a specificairspeed, which is not always given. The variation in thespecific fuel consumption with airspeed is greater for theturbofan than for the turboprop.
Since turboprops and turbofans represent different com-binations of the piston–prop and turbojet, their perfor-mance should fall somewhere between that of the piston–prop and that of the pure turbojet. Comparing turboprop,turbofan, and turbojet engines of comparable power (com-parable gas generators), one finds that the turboprop willdeliver the largest amount of thrust at the lower airspeeds,to include the aircraft standing still at the start of the takeoffrun. The thrust, however, will decrease at the most rapidrate of the three as the airspeed increases and, at liftoff,will probably be less than the other two. The turbofan willproduce less thrust than the turboprop at lower speeds butmore than the turbojet, which not only improves the take-off and early climb performance but also allows highergross weights for takeoff than the turbojet. The thrust de-creases with increasing airspeed but at a slower rate thandoes that of the turboprop because of the differences be-tween a fan and a propeller and because of the larger jetthrust component. As the bypass ratio increases, the per-formance of the turbofan approaches that of the turbopropat the lower airspeeds but retains some of the character-istics of the turbojet at the higher airspeeds. The turbojethas the lowest initial thrust of the three, but the thrustessentially remains constant with airspeed.
With respect to the other aspects of performance, theturboprop is sufficiently similar to the piston–prop that it isa reasonable approximation simply to use the piston–propequations without modification. The turbofan, however,is not necessarily as simple or as straightforward. If thebypass ratio is low, the turbojet equations can be usedwithout modification. As the bypass ratio is increased andthe ratio of power to thrust increases, the turbofan takes onmore of the characteristics of the turboprop and piston–prop, particularly at the lower airspeeds. It is still possible

P1: FYK/FPW Revised Pages P2: FYK
Encyclopedia of Physical Science and Technology EN001-912 April 20, 2001 18:42
386 Aircraft Performance and Design
to use the turbojet equations with the realization that theactual low-speed values might be somewhat different. Atthe higher airspeeds, the turbofan will perform more likea turbojet but with a lower specific fuel consumption.
Because of its superior fuel efficiency, the turbofanquickly replaced the turbojet for subsonic aircraft, and theturboprop replaced the piston–prop in many applications(such as commuter aircraft) because of its lighter weightand higher airspeeds. In recent years, however, the smallerregional jet (RJ), with 30–100 seats, is rapidly replacingthe turboprop as a feeder and short-range commercial air-craft (see Fig. 8). Although the RJ fuel efficiency is lowerthan that of the turboprop, the RJ has the advantages ofhigher cruising altitudes (above turbulence and weather),shorter flight times, less noise, and possibly higher publicacceptance because of its more modern appearance.
VII. CONVENTIONAL SUBSONICAIRCRAFT
A. The Specific Range
For an aircraft in unaccelerated level flight, the lift gener-ated by the lifting surfaces must be equal to the weight ofthe aircraft, and the thrust produced by the propulsion sys-tem must be equal to the drag, which resists the movementof the aircraft through the air. For almost any aircraft, thedistance it can fly with a given fuel load (its range) is animportant performance and design criterion. The specificrange (the distance traveled per unit weight of fuel) of apure turbojet is given by Eq. (23) and for a piston–propby Eq. (60). In these equations V is the true airspeed, Dis the drag, E is the flight lift-to-drag ratio (the aerody-namic efficiency), c and c are the respective specific fuelconsumptions, ηp is the propeller efficiency, and k is aconversion factor from engine power to propeller thrustpower.
The specific range of an aircraft is the exchange ratiobetween range and fuel; it has the units of miles per poundof fuel and is analogous to the mileage of an automobile,especially when expressed in miles per gallon (mpg). (Theapproximate weight of a gallon of jet fuel is 6.75 lb andthat of a gallon of gasoline is 6 lb.) Examination of Eqs.(23) and (60) shows that whereas the mileage of a tur-bojet/turbofan or turboprop is directly proportional to itsairspeed, that of a piston–prop or turboprop is explicitlyindependent of the airspeed but directly proportional tothe propeller efficiency. We must not forget, however, thatthe aerodynamic efficiency of any aircraft is directly cou-pled to its airspeed. These two expressions also show thatthe operational economy for both types of aircraft can beimproved (the mileage increased) by improving the aero-
dynamic efficiency (reducing the drag) and by reducingboth the specific fuel consumption and the total weight ofthe aircraft. Since turbofans and turboprops combine, tovarying degrees, the features of both the turboprop and thepiston–prop, their performance falls somewhere betweenthese two with the turbofan described as though it were aturbojet and the turboprop described as though it were apiston–prop.
B. Drag Reduction
Since the wing is the major source of the lift and drag of anaircraft, it can be used to discuss drag reduction options.The drag is directly proportional to the drag coefficientC D, which can be divided into two components, the zero-lift drag coefficient CD0 and the drag-due-to-lift coefficientCDi. With the common assumption of a parabolic dragpolar, the drag coefficient can be written as:
CD = CD0 + KC2L (62)
where:
K = 1/[π (AR)e] = S/(πb2e) (63)
In Eq. (4), AR is the aspect ratio of the wing, S the wingarea, b the wing span, and e the Oswald span efficiency,which is of the order of unity or less. If CD0 incorporatesthe drag of other components of the aircraft (fuselage andnacelles, for example), Eq. (3) can be considered to be thedrag polar of the aircraft, and the maximum lift-to-dragratio of the aircraft (Em) can be shown to be
Em = 1/[2(KCD0)1/2] (64)
It should be noted that Em is a design characteristic of aparticular aircraft; its value cannot be exceeded althoughan aircraft can, and often does, fly at lower values. Thehigher the value of Em is, the larger the mileage can be.It should also be noted that CD0 and K can be assumed tobe constant until the airspeed reaches the drag–rise Machnumber MDR, where the drag for a constant CL begins toincrease because of the formation of shock waves as thetransonic region is approached.
We see that the drag can be reduced, and the aerody-namic efficiency increased, by reducing CD0 and by in-creasing both the AR (by reducing S or increasing b) andthe Oswald span efficiency e. The application of compu-tational fluid dynamics (CFD), using the ever-increasingpower of modern computers, to the calculation of the flowfields around the wing and fuselage has led to more ef-ficient wings and lower-drag fuselages and nacelles. Inaddition to a reduction in CD0, such wings (such as thesupercritical wing) can either be made thicker (reducingweight) or have the sweep angle reduced (increasing b

P1: FYK/FPW Revised Pages P2: FYK
Encyclopedia of Physical Science and Technology EN001-912 April 20, 2001 18:42
Aircraft Performance and Design 387
and e) without affecting the MDR. Alternatively, by main-taining the same thickness and sweep, the MDR can beincreased.
It has been demonstrated that boundary layer controlcan extend the region of the laminar flow over the wing,control the turbulence, and greatly reduce the drag. Un-fortunately, the active systems used to date to remove orreduce the turbulent flow require energy and hardware andhave operational problems, such as keeping the myriadsuction holes of one scheme unplugged. Passive schemesusing riblets or shallow (a fraction of an inch) chordwisegrooves similar to those used on several racing yachtsshow promise and are being tested.
The Oswald span efficiency e is a measure of the aero-dynamic losses associated with the vortices at the tip of afinite wing. As the aspect ratio increases, so does the spanefficiency, approaching unity in the limit as the wing spanbecomes infinite. Furthermore, the addition of properlydesigned wing tips, end plates, and winglets to interferewith the vortex formation will also increase the span ef-ficiency. In addition to increasing the Oswald span effi-ciency, which reduces the drag, an increased AR in itselfalso reduces the drag. Because of the coupling betweenthe AR and e, they are sometimes combined into one pa-rameter, (AR)e, which is called the effective aspect ratio.
A large AR, which is obviously desirable from the view-point of reduced drag, calls for a large wing span and/ora small wing area. There are structural and weight limi-tations associated with a large wing span as well as suchpractical considerations as the size of hangar doors andthe space required for using loading docks at passengerterminals. As the wing area is decreased, the wing loadingincreases, calling for larger takeoff and landing airspeeds,thus requiring longer runways. In most cases, the maxi-mum allowable wing loading (smallest wing area) is es-tablished by the maximum allowable approach airspeed,which in turn is determined by the distance of the landingrun.
Equation (62) shows that, in addition to changing phys-ical characteristics, the wing drag can also be reducedby decreasing the CL of the wing. With a horizontal tailsurface and the center of gravity (cg) of the aircraft be-hind the aerodynamic center (ac) of the wing, as shownin Fig. 7(a), the sum of the wing lift and the tail lift mustequal the weight of the aircraft in level (cruise) flight, andthe sum of the pitching moments about the cg must beequal to zero. Consequently, the tail lift will be positiveand the lift to be generated by the wing need only be equalto the weight minus the tail lift, requiring a smaller CL andthus reducing the wing drag. If the cg is moved further aft,the required wing lift decreases, further decreasing the CL
and the drag of the wing. Since the required tail lift willincrease appropriately so as to keep the pitching moments
FIGURE 7 Possible wing–horizontal stabilizer combinations:(a) two-surface—wing and tail; (b) two-surface—wing and canard;and (c) three-surface—wing, tail, and canard.
equal to zero, the CL and drag of the tail will increase.However, the increase in tail drag will be much smallerthan the decrease in the wing drag because of the smallertail area. The latest versions of the Airbus and Boeing 747are being built with a fuel tank in the tail so that the cg canbe shifted farther to the rear during cruise than would bepossible with the normal wing tanks. An added benefit ofhaving the cg behind the ac of the wing is the fact that thewing should stall first (since the angle of attack of the tailis smaller than that of the wing); when it does, the pos-itive tail lift will generate a nose-down pitching momentto initiate a stall recovery.
Canards, horizontal lifting surfaces placed ahead of thewing, are beginning to reappear (the Wright Flyer used acanard), but there is some question as to whether they are
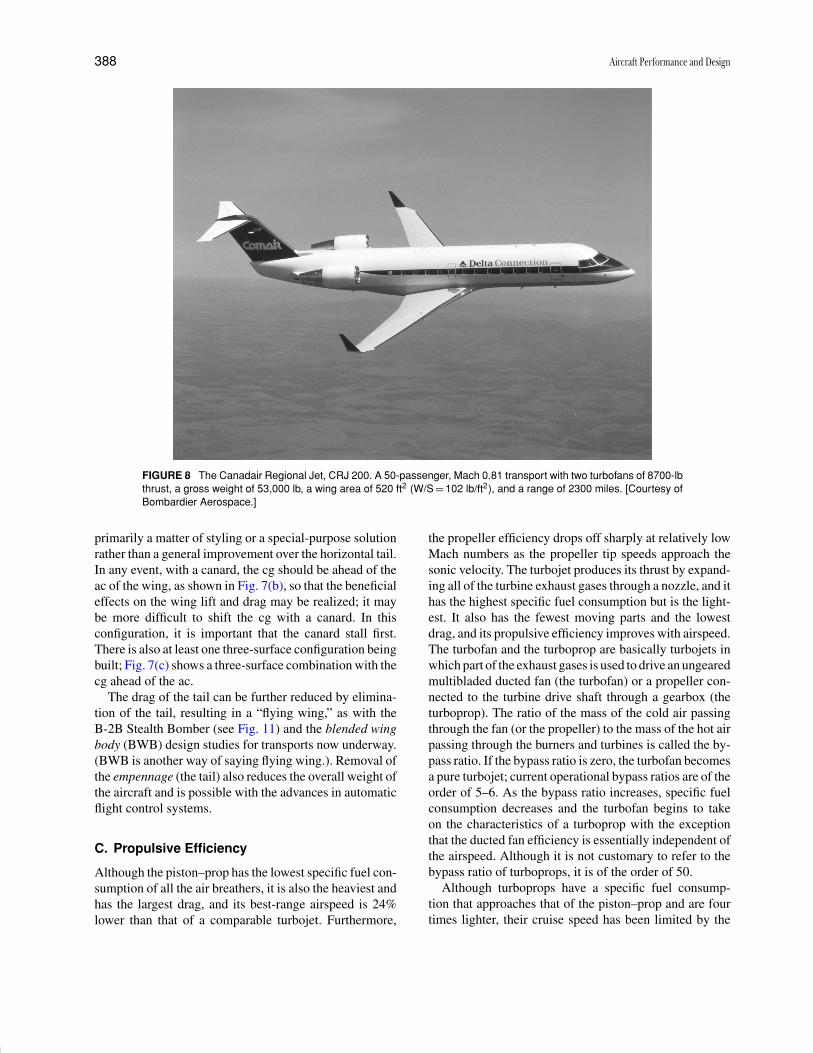
P1: FYK/FPW Revised Pages P2: FYK
Encyclopedia of Physical Science and Technology EN001-912 April 20, 2001 18:42
388 Aircraft Performance and Design
FIGURE 8 The Canadair Regional Jet, CRJ 200. A 50-passenger, Mach 0.81 transport with two turbofans of 8700-lbthrust, a gross weight of 53,000 lb, a wing area of 520 ft2 (W/S = 102 lb/ft2), and a range of 2300 miles. [Courtesy ofBombardier Aerospace.]
primarily a matter of styling or a special-purpose solutionrather than a general improvement over the horizontal tail.In any event, with a canard, the cg should be ahead of theac of the wing, as shown in Fig. 7(b), so that the beneficialeffects on the wing lift and drag may be realized; it maybe more difficult to shift the cg with a canard. In thisconfiguration, it is important that the canard stall first.There is also at least one three-surface configuration beingbuilt; Fig. 7(c) shows a three-surface combination with thecg ahead of the ac.
The drag of the tail can be further reduced by elimina-tion of the tail, resulting in a “flying wing,” as with theB-2B Stealth Bomber (see Fig. 11) and the blended wingbody (BWB) design studies for transports now underway.(BWB is another way of saying flying wing.). Removal ofthe empennage (the tail) also reduces the overall weight ofthe aircraft and is possible with the advances in automaticflight control systems.
C. Propulsive Efficiency
Although the piston–prop has the lowest specific fuel con-sumption of all the air breathers, it is also the heaviest andhas the largest drag, and its best-range airspeed is 24%lower than that of a comparable turbojet. Furthermore,
the propeller efficiency drops off sharply at relatively lowMach numbers as the propeller tip speeds approach thesonic velocity. The turbojet produces its thrust by expand-ing all of the turbine exhaust gases through a nozzle, and ithas the highest specific fuel consumption but is the light-est. It also has the fewest moving parts and the lowestdrag, and its propulsive efficiency improves with airspeed.The turbofan and the turboprop are basically turbojets inwhich part of the exhaust gases is used to drive an ungearedmultibladed ducted fan (the turbofan) or a propeller con-nected to the turbine drive shaft through a gearbox (theturboprop). The ratio of the mass of the cold air passingthrough the fan (or the propeller) to the mass of the hot airpassing through the burners and turbines is called the by-pass ratio. If the bypass ratio is zero, the turbofan becomesa pure turbojet; current operational bypass ratios are of theorder of 5–6. As the bypass ratio increases, specific fuelconsumption decreases and the turbofan begins to takeon the characteristics of a turboprop with the exceptionthat the ducted fan efficiency is essentially independent ofthe airspeed. Although it is not customary to refer to thebypass ratio of turboprops, it is of the order of 50.
Although turboprops have a specific fuel consump-tion that approaches that of the piston–prop and are fourtimes lighter, their cruise speed has been limited by the

P1: FYK/FPW Revised Pages P2: FYK
Encyclopedia of Physical Science and Technology EN001-912 April 20, 2001 18:42
Aircraft Performance and Design 389
degradation in the propeller efficiency at higher airspeeds.The fuel shortage in the mid-1970s and the subsequentincrease in prices sparked the development of two ultra-high bypass (UHB) engines, one known as a propfan andthe other as an unducted fan (UDF), which in appearanceresemble each other. They each have 2 rows of counter-rotating blades (6 or more in each row) that are approxi-mately 12 ft in diameter; the blades do not resemble con-ventional propeller blades, being highly swept and havingvariable camber. The propfan is essentially a turbopropwith a gearbox that reduces the high rpm of the turbine tothat of conventional propellers; the rpm and the pitch ofthe blades can be varied. The unducted fan, on the otherhand, is essentially a turbofan with a bypass ratio of theorder of 28; it has no gearbox and operates at a constantrpm (that of the turbine), although the pitch of the bladescan be varied through feathering and into reverse. With theduct removed, it is necessary to give greater considerationto the fan efficiency.
Although the propeller efficiency has been extended,it still drops off at the higher subsonic Mach numbers.Furthermore, the best-range airspeed of aircraft using bothof these UHB engines is still lower than that of the pureturbojet and turbofan so that at competitive airspeeds theUHB lift-to-drag ratio will also be lower. In spite of theseoff-design point degradations at the high subsonic Machnumbers of current airliners, the specific range of UHB-equipped aircraft is sufficiently higher to make such anaircraft commercially attractive at Mach 0.8.
Although both types of engines were flown on demon-strator aircraft and design studies for commercial aircraftwith UHB engines were started, current efforts seem tohave ceased.
The thermal efficiency of gas turbine engines is stronglydependent on the turbine inlet temperature, which is pri-marily limited by the physical properties of the turbineblades. There are ongoing investigations into new materi-als and alloys, into techniques for forming turbine bladesand fastening them to the hub, and for controlling the clear-ance between the blade tips and the hubs. As the turbineinlet temperature increases, so does the exhaust tempera-ture, with a subsequent increase in acoustic noise, whichmust be considered in light of the drive for quieter engines.
In concluding this section, mention should be made ofthe increasing use of derated turboprops to replace piston(reciprocating) engines; derating means that the propellerselected cannot absorb all of the sea-level power devel-oped by the engine. As the engine shaft power decreaseswith altitude, the propeller thrust power will remain con-stant until the maximum engine power available decreasesto that value. The altitude at which the engine power andpropeller thrust power are equal is analogous to the crit-ical altitude of a turbocharged piston–prop and can be ashigh as 20,000 ft; the derated turboprop behaves like a
turbocharged piston–prop but with a much lighter weightand less complexity.
D. Weight Reduction
A 5% reduction in weight means a 5% increase in thespecific range and generally a reduction in the initial costof the aircraft. Consequently, weight reduction, along withincreasing propulsion performance, is always an activeprogram.
Since the wing is the heaviest component of an aircraft,the decreases in the wing area being made to reduce thedrag also reduce the weight of the aircraft. In addition,the use of active flight controls to shift air loads fromthe outboard region of the wing toward the wing rootsmeans a lighter wing for a given wing span or a higheraspect ratio wing for the same weight. Active controlsalso allow stability requirements to be relaxed, permittingsmaller horizontal tail (and canard) surfaces and smallertail lengths, thus reducing both the weight and the taildrag.
New aluminum alloys can cut weight with a slight in-crease in cost, but the use of advanced composite mate-rials, such as graphite-fiber laminates, shows the greatestpromise for major reductions in structural weight. Over thepast years, there has been an increasing use of compositesfor secondary structures (rudders, speed brakes, flaps), butnow primary structures (wings, fuselages, empennages)are being made from composites. Approximately 80% ofthe structure of the tiltrotor aircraft (including the rotorblades) to be discussed in Section VIII is fabricated fromcomposite materials with an estimated weight savings of25%. Although the current overall cost of using compos-ites is approximately the same as that of conventional ma-terials, the labor costs are less. With reductions in thecost of the composite materials and improvements in thestrength-to-weight ratios of the fibers and laminates, thesavings in both cost and weight should increase. Addi-tional advantages of composite structures are greater cor-rosion resistance and ease of repair.
The weight of the gas turbine engines continues to bereduced, thus increasing the payload ratio of an aircraft.Other areas of future weight reduction are the use of high-pressure (8000 psi) hydraulic systems and the replacementof hydraulic actuators by electromechanical actuators andhydraulic lines by electrical wires and optical fibers.
VIII. VERTICAL AND SHORT TAKEOFFAND LANDING AIRCRAFT
The horizontal takeoff and landing runs of a conventionalfixed-wing aircraft are directly proportional to its wingloading. Consequently, as the wing loading increases to
P1: FYK/FPW Revised Pages P2: FYK
Encyclopedia of Physical Science and Technology EN001-912 April 20, 2001 18:42
390 Aircraft Performance and Design
improve the performance (block time and range), so doesthe required runway length; as the traffic at a particular air-port increases, so does the need for additional runways andadditional land. As a result, airports for metropolitan areasare generally very large and located at some distance fromthe heart of the city, creating traffic and parking problemsand increasing the overall travel time.
The takeoff run is also inversely proportional to thethrust-to-weight (T/W ) ratio and to the lift coefficientC1 used for takeoff. Increasing the thurst, however, re-quires heavier engines, which increase the weight of theaircraft and thus reduce the specific range of the aircraft. Inturn, more fuel is needed, which also increases the weightand requires larger engines. In addition, as the weight in-creases, the wing area needs to be increased if the originalwing loading is to be maintained; then, the weight willincrease and the cycle begins again. With respect to re-ducing the takeoff run by increasing the C1 beyond thevalues currently achieved with leading-edge and Fowler-type trailing-edge flaps, the high-lift flap devices and tech-niques currently under study would add to the weight of theaircraft and compromise the aerodynamic efficiency. Fur-thermore, for high wing-loading aircraft, there is a trade-off between the decrease in the ground run (favorable)and the increase in drag (unfavorable); aircraft usuallyuse less flaps for takeoff than for landing, when both highdrag (for steeper descents) and low airspeed (for shorterlanding runs) are desirable.
Although the prospects of reducing the runway require-ments for long-range aircraft are not encouraging, thesame is not true for short- and medium-range transportsused for travel between smaller towns and cities, wherelong runways are not available, and the large hub airportsfor interface with long-range aircraft and for travel be-tween city-pairs that are not great distances apart, such asthe New York–Washington or San Francisco–Los Angelescity-pairs. Surveys have shown that the average range forsuch city-pairs within the United States is of the order of200 miles.
With such ranges, the airspeed (and block time) is notas important as the runway length reduction, and STOL(short takeoff and landing) aircraft begin to look attrac-tive. They are characterized by lower wing loadings and alarge CL, resulting in low takeoff and landing airspeeds,and possibly an increased T/W (with a lower range re-quirement, the additional wing, engine, and flap weightscan be accommodated by reducing the fuel weight).
With half the wing loading and double the takeoff CL,for example, the takeoff run will be approximately one-fourth of the original distance; doubling the T/W ratiowill further reduce the takeoff run to one-eighth. Further-more, the climb-outs and descents of STOL aircraft will bemuch steeper, so that departure and approach patterns will
be much smaller and obstacle clearance (buildings on theflight paths, for example) will be less of a problem. Withthese reduced requirements, there are plans for STOL run-ways at the hub airports, so located that the traffic patternsdo not interfere with those of the main runways, and forexclusively STOL airports to be located closer to the pop-ulation centers. Unfortunately, these plans do call for addi-tional land, even though the amount is less, in areas whereland is unavailable or scarce and very expensive, and littlehas been done to produce a true STOL aircraft. However,work on high CL technology continues with emphasis onmaintaining attached flow over large trailing-edge flapsby blowing, either by using power from the engines orby mounting the engines above the wing and using theexhaust or slip-stream directly.
V/STOL aircraft (aircraft that can take off and land ver-tically and have an inherent STOL capability) appear to bethe appropriate solution for the feeder and intercity mis-sions; they are also attractive to the military for tacticaluse from unprepared sites and from ships. Such aircraft,however, require a vertical T/W ratio greater than unity.Helicopters can, and do, meet this requirement and are nu-merous. Unfortunately, they also have high drag and lowaerodynamic efficiencies (lift-to-drag ratios of the orderof three), are noisy, and are limited to short-range mis-sions and to airspeeds less than 200 mph and altitudes lessthan 20,000 ft. When the weight of a helicopter exceedsits vertical lift capability, takeoff can be accomplished byusing a short run, giving the helicopter a STOL capability.
Although useful, the helicopter is not the solution tothe feeder and intercity problem. What is needed is anaircraft that can take off and land vertically and cruiseas a conventional aircraft. One early and unconventionalapproach was to stand a pistonprop aircraft (the POGO)on its tail for takeoff and landing and then rotate it to thehorizontal for cruise; this was not a satisfactory solution.Other approaches investigated included using lift fans inthe wings for vertical flight, tilting the wing so that theengines were vertical for takeoff and landing, and swiv-elling the nozzles of a jet engine so that the thrust wouldbe vertical for takeoff and landing. This last approach wasadopted and is being used in a military combat aircraft, theHarrier, which is a tactical strike aircraft operating fromboth land and ships. As with the helicopter, larger payloadsthat exceed the vertical lift capability can be handled byoperating the aircraft in a STOL mode, sometimes with aninclined ramp resembling a ski jump. Unfortunately, theweight of the large jet engine(s) required to give a T/Wratio greater than unity results in an aircraft with a lowpayload capability and a short range and, consequently,no real commercial application.
Another approach investigated was the tiltrotor conceptin which large propellers (rotors) are located at each tip of a

P1: FYK/FPW Revised Pages P2: FYK
Encyclopedia of Physical Science and Technology EN001-912 April 20, 2001 18:42
Aircraft Performance and Design 391
FIGURE 9 The Bell Boeing V-22 Osprey landing on the deck of an assault carrier. A military tiltrotor VSTOL (verticaland short takeoff and landing) transport with a capacity of 24 combat troops, two 6150-SHP turboshaft engines, amaximum vertical takeoff weight of 47,000 lb, and a maximum airspeed of 315 mph. [Courtesy of Bell Boeing.]
fixed wing and are tilted from the vertical to the horizontalfor cruise to combine the capability of the helicopter withthat of the fixed-wing aircraft. After proving the sound-ness of this approach with a demonstrator aircraft, theXV-15, the U.S. Department of Defense authorized thedevelopment and production of the V-22 Osprey Tiltrotoraircraft (see Fig. 9). This is a 50,000-lb aircraft with twoturboshaft engines, each in its own tiltable pod driving athree-bladed 38-ft-diameter, rotor. It is a unique aircraft inmany ways, including the use of composites for the rotorsand the majority of the structure, and should truly mergethe performance of a helicopter with that of a turboprop.It is expected to have a maximum airspeed in excess of300 mph, a ceiling of the order of 28,000 ft, and a maxi-mum specific range approaching that of the turboprop butat a higher cruise airspeed. Although this is a military air-craft with a 6000-lb payload and a range of the order of1000 miles, the commercial potential has been recognizedand a 40-passenger conversion should pose no problems.It is of interest to note that the XV-15 demonstrator aircraftflew from Battery Park in lower Manhattan to the Pentagonin Washington, D.C., in 40 min. The tiltrotor may well bethe solution to the intercity and feeder problem.
IX. MILITARY AIRCRAFT
In addition to the tiltrotor of the previous section, the mil-itary is interested in increasing the agility of its fighteraircraft; agility can be thought of as comprising maneuver-
ability (turning, diving, climbing), controllability, and ac-celeration. After detection and identification, aerial com-bat between individual aircraft may well start with thelaunch of air-to-air missiles at high supersonic Mach num-bers (Mach 2.0 to Mach 3.0) and at high altitudes (50,000–60,000 ft), with the aircraft functioning simply as launchplatforms for the missiles. Some interceptor aircraft in thepast were designed primarily for that function, with lim-ited maneuverability and even without guns. Without amissile kill, the engagement becomes a dogfight, and sur-vivability and victory depend upon the maneuverability ofthe aircraft and the skill of the pilot. Since the maneuver-ability of an aircraft improves as airspeed and altitude de-crease, as the engagement continues, the aircraft will slowdown and descend until the low-speed, low-altitude com-bat arena is reached (or one of the aircraft is destroyed).Although the maneuverability is highest at sea level, thelower limit to the combat altitude is the minimum altituderequired for pull-up from an evasive maneuver.
The maneuvering ability of an aircraft can be describedin terms of its maximum turning rate (fastest turn) andits minimum turning radius (tightest turn). For best turn-ing performance, both maneuvers theoretically call for alarge T/W ratio, a low wing loading, a large aspect ratio, alow CD0, a low altitude, and low airspeeds. Only the highAR is missing in modern fighters because of the struc-tural, weight, and aerodynamic considerations involvedin high-g and supersonic flight. Furthermore, increasingthe wing area so as to decrease the wing loading requires alarger wing span [b = (S × AR)1/2] to maintain the same

P1: FYK/FPW Revised Pages P2: FYK
Encyclopedia of Physical Science and Technology EN001-912 April 20, 2001 18:42
392 Aircraft Performance and Design
AR, also increasing the weight and structural problems.Although steady-state fastest and tightest turns are not nec-essarily high-g maneuvers, there are many times when theaircraft will be put in the position of turning with high-g forces. Consequently, modern fighter aircraft rely onlower wing loadings, lower CD0’s, and higher T/W’s fortheir maneuverability and accept the penalties associatedwith lower AR’s and lower lift-to-drag ratios. High T/W’salso provide sufficient acceleration for an aircraft to escapeand regain airspeed and altitude before rejoining battle.
Although the design characteristics for fastest and tight-est turn are similar if not identical, the two types of turnsdo differ. First of all, the load factors (g’s) are different; thefastest-turn load factor is proportional to the square root ofthe maximum attainable load factor and has no theoreticalupper limit, whereas the tightest-turn load factor cannotexceed 1.4 g’s. Then, although theoretical airspeeds arelow (often lower than the stall speed of the aircraft), thetightest-turn airspeeds are even lower than those for thefastest turn.
Since, in both cases, the turning performance improvesas the airspeed is decreased, it seems obvious that everyeffort should be made to reduce the stall speed by increas-ing the maximum lift coefficient and the high angle ofattack aerodynamic performance. This has been the majorobjective of various tests of canards, strakes, and variablecamber (mission adaptive) wings and of such devices asdrooped leading edges and thrust deflectors, which are de-signed to improve stability and controllability at these highangles of attacks and low airspeeds. In addition, there havebeen tests of vertical and canted canards, which, when usedin conjunction with other control surfaces in a fly-by-wiresystem, can translate the aircraft horizontally and verti-cally without rotation. They can rotate the aircraft aboutthe vertical axis without banking or turning.
The X-31 Enhanced Maneuverability Aircraft Programwas a joint U.S./German program with two prototype air-craft built by Rockwell/MBB. These aircraft use a canardand a variable camber wing along with a thrust-vectoringcapability. The vectored thrust will not only improve theturning performance but will also so improve the control-lability at high angles of attack that the aircraft can breakthe stall barrier to fly in the poststall region at angles ofattack larger than the normal stall angle and at airspeedslower than the stall speed.
Since its targets are usually located deep inside the en-emy country, a strategic bomber must survive or evadeattacks by enemy surface-to-air defenses and interceptoraircraft if it is to accomplish its mission and then return.During World War II, this penetration, as it is called, wascarried out at high (approaching the ceiling of the aircraft)altitudes above or at the extreme end of the range of anti-aircraft guns with defense against enemy aircraft by escort
aircraft (within their limited-by-fuel range) and by gunsaboard the bomber. After the war, the B-52, a subsonicjet bomber, was designed to penetrate in such a manner.As antiaircraft guns were replaced by long-range surface-to-air missiles with various types of guidance, many withterminal guidance systems, and interceptor aircraft wereequipped with air-to-air missiles, it became apparent thatthe B-52 was very exposed and vulnerable at high alti-tudes. Consequently, its mission was changed to a low-level (on-the-deck) penetration where it would be diffi-cult, if not impossible, to track the B-52 with ground-basedradar (although it would be exposed to downward-lookingradar), where it could not be reached by the long-rangemissiles and where the time of exposure (the time to crossfrom horizon to horizon) to specific short-range missilesand other weapons would be short.
The X-31 Enhanced Maneuverability Fighter Programwas a joint U.S./German program with two prototypesbuilt by Rockwell/MBB. These aircraft used moveablecanards and strakes, a variable camber wing, and thrustvectoring to improve both the turning performance and thecontrollability at high angles of attack and low airspeeds(the combat arena for fighter aircraft). It was possible withthe X-31 to break the stall barrier and to fly in the poststallregion at angles of attack larger than the normal stall angleand at airspeeds lower than the conventional stall speed.The results of this program have been introduced into theF-22 Raptor (see Fig. 3), an all-purpose, highly maneuver-able fighter with supercruise capability, vectored nozzles,a large complement of weapons (including a 20-mm can-non) in internal bays, and stealth characteristics.
The B-1B Lancer strategic bomber (see Fig. 10) alsopenetrates at low level at a high subsonic speed, using itssupersonic dash capability to reduce the time required toreach the penetration area. The B-1B has a low wing withvariable sweep; the leading edge can be varied from 15to 67.5◦, reducing the wingspan from 137 ft to 78 ft. Theaircraft is almost 150 ft in length.
The B-1B has four very low bypass ratio turbofan en-gines, each with approximately 31,000 lb of unaugmentedthrust: afterburners are used for supersonic flight with amaximum Mach number of the order of 1.25. It has a four-man crew and a low radar cross section and is equippedwith sophisticated offensive avionics and terrain follow-ing systems. The structure, of special aluminum alloys andtitanium, is hardened to sustain nuclear blasts and over-pressures. The maximum gross weight is approximately500,000 lb and the unrefueled range is of the order of7500 miles. There are three internal (rotary) weapons baysto carry missiles and bombs.
Although vulnerability is reduced, low-level penetra-tion has its own problems. Terrain clearance and ob-stacle avoidance, either manually or automatically, are

P1: FYK/FPW Revised Pages P2: FYK
Encyclopedia of Physical Science and Technology EN001-912 April 20, 2001 18:42
Aircraft Performance and Design 393
FIGURE 10 The B-1B Lancer, originally built by Rockwell International. A low-level penetration strategic bomber witha Mach 1.2 capability, a crew of four, a swing wing, four low-bypass turbofans of the 31,000-lb (unaugmented) thrustclass, and a maximum gross weight of 470,000 lb. [Courtesy of Boeing.]
not simple tasks. Furthermore, at these low altitudes andhigh airspeeds, the dynamic pressure is very high, which,when combined with the maneuvers associated with ter-rain clearance and avoidance and low-altitude turbulence,imposes large structural loads on the aircraft. For exam-ple, the B-52s have had their main wing spars replaced andhave been reskinned at least once. Cruise missiles carriedby the penetrating bomber can be launched at low altitudesbut standoff missiles and thermonuclear (TN) bombs willrequire a pop-up maneuver of some kind at the end of thepenetration.
In spite of the reasons given above for low-altitude pen-etration, the newest bomber, the B-2 Spirit, is designed topenetrate at higher altitudes at a high subsonic airspeed;it does not have a supersonic capability. The B-2 is pop-ularly referred to as the STEALTH bomber because it isdesigned to be as undetectable as possible by dramati-cally reducing both its radar cross section (RCS) and itsinfrared (IR) signature. If the bomber is detected, it is ex-pected that the reduced radar and IR targets, along withchaff and electronic and heat decoys, will prevent effectivetracking and lock-on of surface and air-launched missiles.The combination of a low-level penetration by the B-1Band a high-altitude stealthy penetration by the B-2 are ex-pected to saturate and confuse existing enemy radars anddefenses and require the deployment of additional and newdefenses.
The B-2, being built by Northrop/Boeing, is a flyingwing (see Fig. 11). It is a descendant of the XB-49, which
was designed by Jack Northrop and flown in the late 1940s.(The XB-49 had stability and control problems and a lim-ited cg shift, problems that can be handled by modern flightcontrol and stability augmentation systems.) The B-2 hasa crew of two and is powered by four engines. Its approx-imate dimensions are a height of 17 ft, a length of 69 ft,and a wing span of 172 ft, so that it is only slightly longerthan an F-15 fighter but has a wing span approaching thatof a B-52.
Among the techniques used to reduce the RCS are theabsence of vertical stabilizers to eliminate radar reflec-tions, the use of composites for the airframe to absorbmicrowaves, the use of radar-absorbing blankets aroundthe engines and weapons bays, and the use of S-shaped en-gine air inlets to prevent radar from reaching and detectingthe compressor blades. It is believed that the purpose ofthe saw-toothed trailing edge of the wing is to permit theengine exhausts to be placed against the trailing edge soas to reduce the IR signature. Since hot exhaust gases canbe easily detected from long distances, they will probablybe cooled and diluted by the addition of ambient air. Thereobviously will be no external stores whatsoever with all ofits 45,000 lb of payload being carried internally, probablywith a rotary carrier of the type used in the B-1B. Currentplanning calls for a fleet of 132 aircraft with an estimatedcost on the order of $60 billion.
There is also a STEALTH fighter, the F-117ANighthawk, built by the Lockheed Martin Corporation(see Fig. 12). Although the aircraft became operational

P1: FYK/FPW Revised Pages P2: FYK
Encyclopedia of Physical Science and Technology EN001-912 April 20, 2001 18:42
394 Aircraft Performance and Design
FIGURE 11 The B-2 Spirit (the STEALTH Bomber), originally manufactured by the Northrop Corporation. A high-subsonic-flying wing with multirole missions, a crew of two, four high-bypass-ratio turbofans of the 18,000-lb class,and a typical maximum weight of 335,000 lb. [Courtesy of the U.S. Air Force.]
in 1983, it was not officially acknowledged until 1988.It is a single-place, subsonic, twin-engine aircraft with adelta wing, without a horizontal stabilizer but with doublecanted, vertical stabilizers. It is a penetration strike fighterto be used against radar and missile installations and otherspecial targets, such as command posts. It was used in theGulf War.
X. ADVANCED SUPERSONICCOMMERCIAL AIRCRAFT
The actual and projected increase in traffic among the Pa-cific Rim countries has sparked a renewed interest in anadvanced supersonic transport (SST). Currently, a nonstopflight from Los Angeles to Tokyo takes 11 hr or more in ahigh subsonic Mach number transport; a Mach 2.7 aircraftwould reduce that time to less than 4 hr. Such an aircraftwould have to be economically competitive, amortizingits development and production costs as well as meetingits operating costs and providing a reasonable profit bycharging no more than first-class fares. The Concorde isapparently showing a profit but it is not attempting to re-coup its development and production costs and is chargingpremium fares for a limited group of passengers.
Mach 3 seems to be a reasonable upper limit for anadvanced SST, particularly when thinking about a rangeof the order of 7500 miles (6500 nautical miles). Athigher Mach numbers, the higher skin temperatures leadto requirements for large amounts of insulation (andpossibly no fuel in the wings) and active cooling, aswell as the possibility of being forced to switch to moreexotic materials. The higher skin temperatures may alsorequire a cooling-off period after landing that could delayboth the unloading and turn-around time. Furthermore,turbojets reach their operating limits at about Mach 3,so new combined-cycle engines (turbo-ramjets) wouldbe needed. Finally, the time spent in acceleration,decelcration, and ground operations, rather than actualcruise time, would dominate the block time.
An important indicator in determining and comparingoperational efficiencies of passenger transports is the valueof the seat-miles per gallon of fuel (seat-miles/gal) param-eter, which is simply the mileage of Eq. (23) multipliedby the number of passengers.
A current Mach 0.85 transport with 450 passengers, alift-to-drag ratio (E) of 17.7, and a c of 0.6 and weigh-ing 800,000 lb has a value of 63 seat-miles/gal. On theother hand, an SST with a cruise Mach number of 2.7,250 passengers, an E of 10, and a c of 1.5 and also
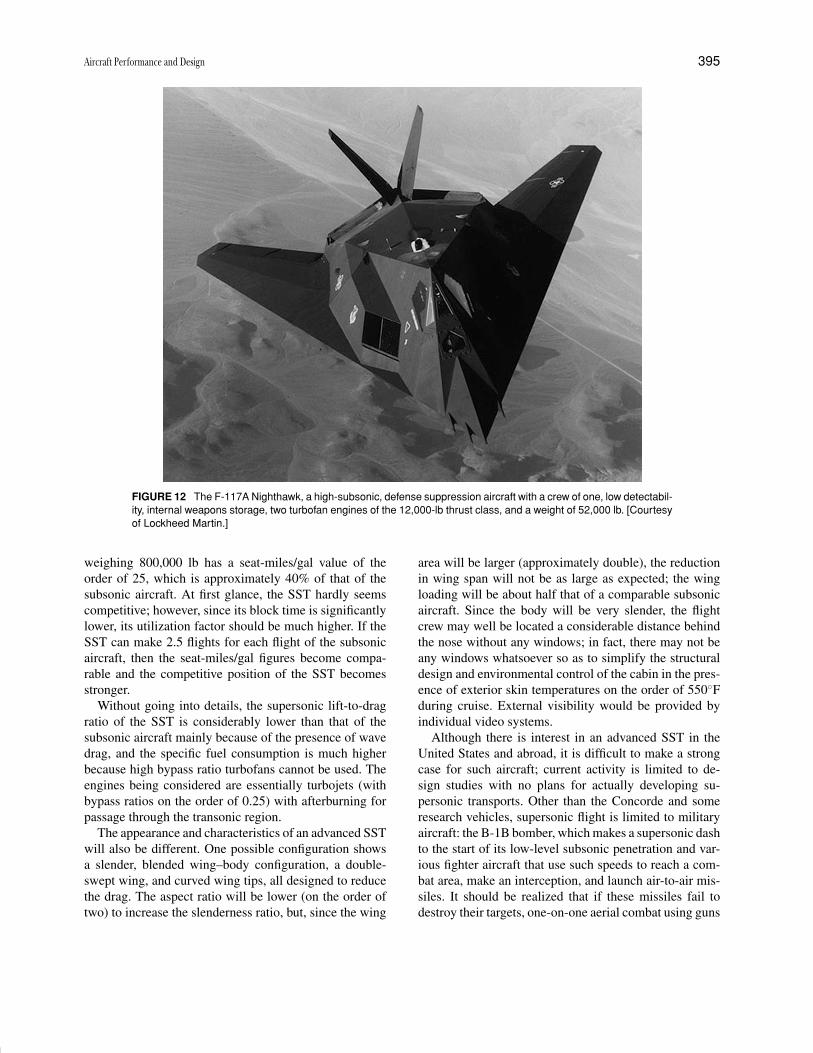
P1: FYK/FPW Revised Pages P2: FYK
Encyclopedia of Physical Science and Technology EN001-912 April 20, 2001 18:42
Aircraft Performance and Design 395
FIGURE 12 The F-117A Nighthawk, a high-subsonic, defense suppression aircraft with a crew of one, low detectabil-ity, internal weapons storage, two turbofan engines of the 12,000-lb thrust class, and a weight of 52,000 lb. [Courtesyof Lockheed Martin.]
weighing 800,000 lb has a seat-miles/gal value of theorder of 25, which is approximately 40% of that of thesubsonic aircraft. At first glance, the SST hardly seemscompetitive; however, since its block time is significantlylower, its utilization factor should be much higher. If theSST can make 2.5 flights for each flight of the subsonicaircraft, then the seat-miles/gal figures become compa-rable and the competitive position of the SST becomesstronger.
Without going into details, the supersonic lift-to-dragratio of the SST is considerably lower than that of thesubsonic aircraft mainly because of the presence of wavedrag, and the specific fuel consumption is much higherbecause high bypass ratio turbofans cannot be used. Theengines being considered are essentially turbojets (withbypass ratios on the order of 0.25) with afterburning forpassage through the transonic region.
The appearance and characteristics of an advanced SSTwill also be different. One possible configuration showsa slender, blended wing–body configuration, a double-swept wing, and curved wing tips, all designed to reducethe drag. The aspect ratio will be lower (on the order oftwo) to increase the slenderness ratio, but, since the wing
area will be larger (approximately double), the reductionin wing span will not be as large as expected; the wingloading will be about half that of a comparable subsonicaircraft. Since the body will be very slender, the flightcrew may well be located a considerable distance behindthe nose without any windows; in fact, there may not beany windows whatsoever so as to simplify the structuraldesign and environmental control of the cabin in the pres-ence of exterior skin temperatures on the order of 550◦Fduring cruise. External visibility would be provided byindividual video systems.
Although there is interest in an advanced SST in theUnited States and abroad, it is difficult to make a strongcase for such aircraft; current activity is limited to de-sign studies with no plans for actually developing su-personic transports. Other than the Concorde and someresearch vehicles, supersonic flight is limited to militaryaircraft: the B-1B bomber, which makes a supersonic dashto the start of its low-level subsonic penetration and var-ious fighter aircraft that use such speeds to reach a com-bat area, make an interception, and launch air-to-air mis-siles. It should be realized that if these missiles fail todestroy their targets, one-on-one aerial combat using guns
P1: FYK/FPW Revised Pages P2: FYK
Encyclopedia of Physical Science and Technology EN001-912 April 20, 2001 18:42
396 Aircraft Performance and Design
and cannons quickly becomes subsonic at lower altitudes,approaching the ground in the limit.
XI. HYPERSONIC AIRCRAFT AND THENATIONAL AEROSPACE PLANE
Entering and leaving space using rocket engines only is acomplicated and expensive process, requiring the verticallaunch of heavy vehicles with two or more stages andwith structures that cannot withstand side forces. Rocketengines, although light in weight, are not very efficient andcannot use oxygen from the atmosphere, so that launchvehicles using rocket engines must carry large quantitiesof both fuel and oxidizer. For example, 75% of the spaceshuttle’s lift-off weight of 4.4 million pounds is propellantand 83% of that is oxygen. As one author wrote, “A launchvehicle carrying oxygen through the atmosphere is like afish in the ocean carrying a canteen of water.”
With the advent of space travel, there has been a fasci-nation with the idea of an aerospace plane for both civilianand military use, a vehicle that would take off and land hor-izontally (CTOL) and have a single-stage-to-orbit (SSTO)capability. The same knowledge and technologies could beused for a family of hypersonic transports that could cruiseat hypersonic velocities (Mach 5 or higher) at altitudes be-tween 80,000 and 150,000 ft. Such aircraft could be usedas civilian and military transports (the Orient Express)or as a recoverable first stage for space launches. TheAerospace Plane would use combinations of air-breathingengines to accelerate the aircraft within the sensible atmo-sphere (up to about 45 miles) to as high a Mach numberas possible and then switch to rocket engines for the finalacceleration and for flight outside of the atmosphere. (TheNational Aerospace Plane [NASP] program, which withits X-30 test vehicle was directed toward the developmentof an Mach 25 aircraft, has been canceled.)
A major element of an aerospace plane or hypersonictransport is the propulsion system, particularly the airbreathers. Air breathers not only use oxygen from the at-mosphere but are more efficient than rocket engines andare much more complex. However, the specific impulse ofan air breather can be an order of magnitude (ten times)greater than that of rocket engines at the lower Mach num-bers and two to three times higher at hypersonic Machnumbers. This greater propulsive efficiency can improvethe payload ratio, which is the mass placed in orbit for agiven gross liftoff weight (GLOW), by factors of three tofive.
Unfortunately, no one air-breathing engine can span thiswide spectrum of airspeeds. High specific impulse turbo-jets can accelerate the aircraft to Mach 2 or 3, at whichpoint a ramjet would take over. Rather than using different
engines, the two might be combined into a single engine,the air turbo-ramjet (ATR) in which the engine compressesthe intake air mechanically at the lower Mach numbers andwith ram pressure at the higher Mach numbers with theincoming air bypassing the compressors and entering thecombustion chambers directly. In both the turbojet andramjet, combustion takes place with the intake air sloweddown to subsonic velocities. At about Mach 6, subsoniccombustion is no longer feasible since the increases intemperature associated with slowing the air down are toohigh, even for nonmoving engine parts. This is the timeto switch to a supersonic combustion ramjet (the scram-jet) in which the intake air remains supersonic; engineheating is reduced since less of the kinetic energy of theair is transformed to thermal energy. There is a problemassociated with supersonic combustion, the problem ofsustaining the combustion process, which is analogous tokeeping a match lit in a hurricane. A fuel particle at Mach7 has less than a millisecond to ignite before being sweptout the exhaust, and the traditional hydrocarbons (jet fuel)are unfortunately too slow to ignite. However, hydrogen,which has a substantially reduced ignition time, should besatisfactory, but a switch in propellants, unless hydrogen isused in the ATR, would also be required. The short mixingtime available in the scramjet requires that the hydrogenbe injected from struts that span the air inlet. These injec-tor struts will be subjected to formidable structural loadsfrom both the shock waves in the engine flow and thedifferential thermal stresses from the −375◦F hydrogenwithin the strut and the 1700◦F air without.
An important, and as yet unanswered, question is theupper limit for efficient scramjet operation; current esti-mates range from Mach 10 to Mach 25 (orbital velocity).In any event, rocket engines would have to be used out-side the atmosphere. The exact speed at which scramjetsbecome ineffective or inefficient may determine the fea-sibility of an aerospace plane; the earlier the switch fromscramjet to rocket, the larger the amount of liquid oxygento be carried and the heavier the vehicle. Some skepticssay that a switch around Mach 17 or higher is needed ifthe takeoff size and weight are to be of the same order ofmagnitude as that of a conventional aircraft.
Since hydrogen will be required for the scramjets andis the logical fuel for the rocket engines, it seems wise tohave a single fuel and use hydrogen for the turbojets andramjets (or the air turbo-ramjets). Not only is hydrogen asatisfactory fuel for these engines (the Russians are cur-rently flight testing the TU 155 with hydrogen-fueled en-gines), it also has other advantages. It is cleaner, with onlysteam as the combustion product, and, pound for pound,it has three times the energy of jet fuel. Its disadvantagesare that its lower density (a fifth of that of jet fuel) requireslarger tanks and, since it is cryogenic, it requires special
P1: FYK/FPW Revised Pages P2: FYK
Encyclopedia of Physical Science and Technology EN001-912 April 20, 2001 18:42
Aircraft Performance and Design 397
handling, equipment, and tanks. At present, liquid hydro-gen is usually obtained from the liquefaction of natural gasand is expensive (about three times the cost of jet fuel).
The propulsion system must be carefully integrated withthe airframe inasmuch as the airframe forms part of thepropulsion system. The forebody of the vehicle providesthe surface to shape and compress the shock wave forproper inlet entrance, and the afterbody provides the ex-pansion surface for the nozzle. In other words, there willbe no bolt-on engines. Highly sophisticated CFD will berequired to accomplish the propulsion–airframe integra-tion as well as the blended wing–body configuration. Inaddition, CFD will be vital to the prediction of perfor-mance and behavior at speeds and altitudes that cannot bereproduced in ground based wind tunnels.
Other areas of technology essential to the success ofthe aerospace plane and hypersonic aircraft are thoseof advanced materials, structures, and thermal control.Long-life composite structures may be needed for theliquid-hydrogen fuel tank, along with fully reusable, high-temperature, lightweight materials for the engines and air-frame. Active cooling will be required for high heat fluxareas, such as the nose, leading edges, and probably forthe engines.
There are those who doubt the economic soundness ofsuch a family of vehicles, who feel that the projected trafficand utilization do not warrant its development and will notprovide a suitable payback, and who feel that the estimateddevelopment cost of $3 billion is grossly underestimated.This program may well be justified only on the basis oftechnology development and demonstration that may bebeneficial for other applications.
An aircraft is only one element of the complex air trans-portation system which, in addition to the aircraft, com-prises: the airways and air traffic control; the airports, withtheir runways, taxiways, ground control, terminal build-ings, and loading facilities; and other supporting facili-ties, such as parking lots, access roads both on and to theairports, and shuttle services. As the number of aircraft,flights, and passengers continues to increase, so does thecongestion in all aspects of the transportation system, lead-ing to increasing delays, frustration, and possibly gridlock.In an effort to reduce airways congestion, serious consid-eration is being given to the concept of free flight, wherebyeach aircraft is given its choice of how to proceed fromone airport to another without traveling a specified anddefined airway. Obviously, such free flight requires ade-quate navigation and control systems, both autonomousand external to the aircraft, along with proximity warn-ing and collision avoidance systems. Although free flightmight free up the airways, the airport nodes still exist andare needed for landings and takeoffs.
There has been no mention in this article of a growingclass of airborne vehicles that do not have a pilot on board.Such a vehicle is referred to as an unmanned aerial vehicle(UAV) and one definition is “a powered aerial vehicle thatdoes not carry a human operator, uses aerodynamic forcesto provide aerodynamic lift, can fly autonomously or be pi-loted remotely, can be expendable or recoverable, and cancarry a lethal or nonlethal payload.” Ballistic or semibal-listic missiles and artillery projectiles are not consideredto be UAVs. The development of UAVs was spurred bythe need of the military for airborne intelligence, recon-naissance, and surveillance (the ISR mission) without thecosts, risks, and other limitations associated with the use ofhuman crews. Without the need to provide space and sup-port for a human crew, the size and weight of comparableunmanned vehicles can be significantly reduced and mis-sion duration can be increased. UAVs come in all sizes andconfigurations, ranging from hand-launched versions withlimited payload, range, and duration to a high-altitude,long-endurance UAV flying at altitudes up to 65,000 ftwith an endurance of 40 hr, a payload of 1800 lb, a weightof 26,000 lb, and a wing span of 113 ft. In addition tomilitary missions, UAVs have a large potential for civilianuses—for example, serving as communications relays inlieu of geocentric satellites. Whatever the future of UAVsmight be, they must be compatible with and safely sharethe air space with existing traffic.
SEE ALSO THE FOLLOWING ARTICLES
AIRCRAFT SPEED AND ALTITUDE • AIRPLANES, LIGHT •COMPUTATIONAL AERODYNAMICS • FLIGHT (AERODY-NAMICS) • JET AND GAS TURBINE ENGINES • V/STOLAIRPLANES
BIBLIOGRAPHY
“All the World’s Aircraft,” Jane’s Publishing Co., London.“All the World’s Uninhabited Aerial Vehicles and Targets,” Jane’s Pub-
lishing Co., London.Anderson, J. D., Jr. (1999). “Aircraft Performance and Design,”
WCB/McGraw-Hill, Boston, MA.Hale, F. J. (1984). “Introduction to Aircraft Performance, Selection, and
Design,” Wiley, New York.Tennekes, H. (1997). “The Simple Science of Flight From Insects to
Jumbo Jets,” MIT Press, Cambridge, MA.“Aerospace America,” American Institute of Aeronautics and Astronau-
tics, Reston, VA.“Aerospace Engineering,” SAE International, Warrrendale, PA.“Aerospace International,” Royal Aeronautical Society, London.“Air and Space,” Smithsonian Institution, Washington, D.C.“Aviation Week and Space Technology,” McGraw-Hill, New York.“Avionics Magazine,” Phillips Business Information, Inc., Potomac, MD.