end-group functionalization of poly(3-hexylthiophene) as an efficient route to photosensitize...
TRANSCRIPT

Published: May 12, 2011
r 2011 American Chemical Society 2031 dx.doi.org/10.1021/am200262w |ACS Appl. Mater. Interfaces 2011, 3, 2031–2041
RESEARCH ARTICLE
www.acsami.org
End-Group Functionalization of Poly(3-hexylthiophene) as an EfficientRoute to Photosensitize Nanocrystalline TiO2 Films for PhotovoltaicApplicationsRobin A. Kr€uger, Terry J. Gordon, Thomas Baumgartner,* and Todd C. Sutherland*
Department of Chemistry, University of Calgary, 2500 University Drive NW, Calgary, AB T2N 1N4, Canada
bS Supporting Information
’ INTRODUCTION
Dye-sensitized solar cells1 and polymer solar cells2 have madeenormous progress recently and reached the stage of commercialviability, including companies such as, Dyesol, Solaronix, andPeccell Technologies, Inc. Toward solar cell optimization, aplethora of materials have been synthesized, which have provideddetailed insight into structure�property relationships such ascharge generation and charge transport in a concerted effort tounderstand and enhance the efficiency of these solar cells.However, improvements in the fields of dye-sensitized solar cells(DSSCs) and polymer-based, bulk-heterojunction (BHJ) solarcells have been carried out independently with little designcrossover. The best performing dyes for DSSCs are carboxy-substituted ruthenium polypyridyl complexes that reach efficien-cies as high as 12%.3 Drawbacks of these DSSC materials is theuse of rare, expensive metal centers and the synthetic steps neededto prepare the dyes in high purity are often quite extensive. Notableprogress has beenmade bymoving away fromexpensivemetals andemploy fully organic dyes as inexpensive sensitizers,4 which hasbeen coupled with lower efficiencies than the ruthenium counter-parts and long-term stability. In the BHJ research community,many polymers have been developed for solar cells that have shownvery efficient light harvesting properties.5 Most research hasfocused on alkylthiophene-derivatives as the donor materials in
BHJ solar cells because of its reasonable absorption profile, narrowband gap (∼1.9 eV), ability to self-assemble, adopt a favorablephase morphology when blended with an electron acceptor such as[6,6]-phenyl-C61-butyric acid methyl ester (PCBM), high holemobility (∼1 cm2 V�1 s�1) and solution processability.6 Remark-ably, there are only a few research groups that have taken advantageof the light harvesting properties and processability of conjugatedpolymers to sensitizemetal-oxides, such as TiO2.
7 Several strategiesare employed to anchor sensitizer molecules to TiO2, includingcarboxylic acids, catechols,8 sulfonates,9 silanes,10 and phosphonicacids.11 Recently, poly(3-hexylthiophene), (P3HT) was synthe-sized from a silica nanoparticle employing Grignard metathesis(GRIM) of a modified organosilica nanoparticle precursor.12 Todate, two approaches have been explored that merge the propertiesof conjugated polymers with those of TiO2 DSSCs. One approachinvolves the preparation of side-chain functionalized polyelectro-lytes with carboxylic acid and cyanoacrylic acidmoieties to promotechemisorption of the polymer sensitizer on TiO2 through alkylchain or arylamine spacers, which resulted in photovoltaic perfor-mances ranging from 0.33 to 3.39%.7h�l,13 The second approach
Received: March 2, 2011Accepted: April 27, 2011
ABSTRACT: Bulk heterojunction (BHJ) and dye-sensitized solar cells (DSSCs) have seenincreased popularity over recent years and each technology has experienced tremendousimprovements in power conversion efficiencies (PCEs), reaching 8 and 12%, respectively.The two technologies have been on independent improvement pathways, and this workestablishes a link between them by using the archetypical hole conductor (poly-3-hexylthio-phene, P3HT) in BHJs as a sensitizer on TiO2 for DSSC applications. Three polymers weresynthesized and examined as potential TiO2 sensitizers in DSSCs under AM1.5 solarradiation. Using Grignard metathesis, regioregular P3HT was synthesized then functionalizedwith either one or two cyanoacrylic acid linkermoieties to bind to the TiO2 surface. End-groupmodification resulted inminimal changes to the optical and electronic properties as compared to pristine P3HT. Cyclic voltammetry(CV) experiments at anodic potentials of adsorbed sensitizer quantified the amount of alkylthiophene adsorbed on the TiO2,whereas under reductive sweeps, cyanoacrylic acid end-group binding was determined. CVs of each polymer indicated that loadingwas drastically different as compared to pristine P3HT with the lowest loading on TiO2 and monofunctionalized P3HT exhibitedthe highest loading. The DSSCs showed power conversion efficiencies (PCEs) of 0.1%, 0.2 and 2.2% for the polymer-sensitizedTiO2 of the unfunctionalized, monofunctionalized and difunctionalized polymers, respectively. DSSCs were then subjected toelectrochemical impedance spectroscopy (EIS) in the dark and under monochromatic light radiation. The large variance inperformance for the functionalized-P3HT sensitizers is attributed to differences in the adsorption modes of sensitizer on the TiO2
surface, which in the difunctionalized case limits electrolyte recombination and favors forward charge transfer reactions.
KEYWORDS: energy conversion, polythiophene, thin films, electrochemistry, mesoporous TiO2, sensitizers
2032 dx.doi.org/10.1021/am200262w |ACS Appl. Mater. Interfaces 2011, 3, 2031–2041
ACS Applied Materials & Interfaces RESEARCH ARTICLE
installs carboxylic acid linkers directly to the conjugated polymerbackbone, either along the main chain or as end-groups, andexhibited a similar range of PCEs between 0.9 to 2.99%.7c,d,f,m
Importantly, only one account reports the end-group functionaliza-tion of polythiophene for use as a TiO2 sensitizer for solar cellapplications with a photovoltaic performance of 0.9%.7c
Here we report on the efficient and facile end-group functio-nalization of regioregular P3HT that enables chemisorption viacyanoacrylic acid linkers onto mesoporous TiO2 and illustratesthe material’s potential as a potent polymer sensitizer for DSSCapplications.
’RESULTS AND DISCUSSION
Polymer Synthesis and Characterization. The Grignardmetathesis (GRIM) polymerization, developed by McCullough14
to obtain highly regioregular P3HT, P1, was employed asdepicted in Scheme 1. Because of the proposed reaction mecha-nism of the GRIM polymerization,15 the majority of theterminal thiophenes will possess an alpha-hydrogen or analpha-bromine substituent (H/Br) and a minor fraction ofthe polymer will be alpha-hydrogen terminated at both termini(H/H).15a
Regioregular P1 was further functionalized with cyanoacrylicacid because this functional group has been shown to bind effi-ciently to mesoporous TiO2.
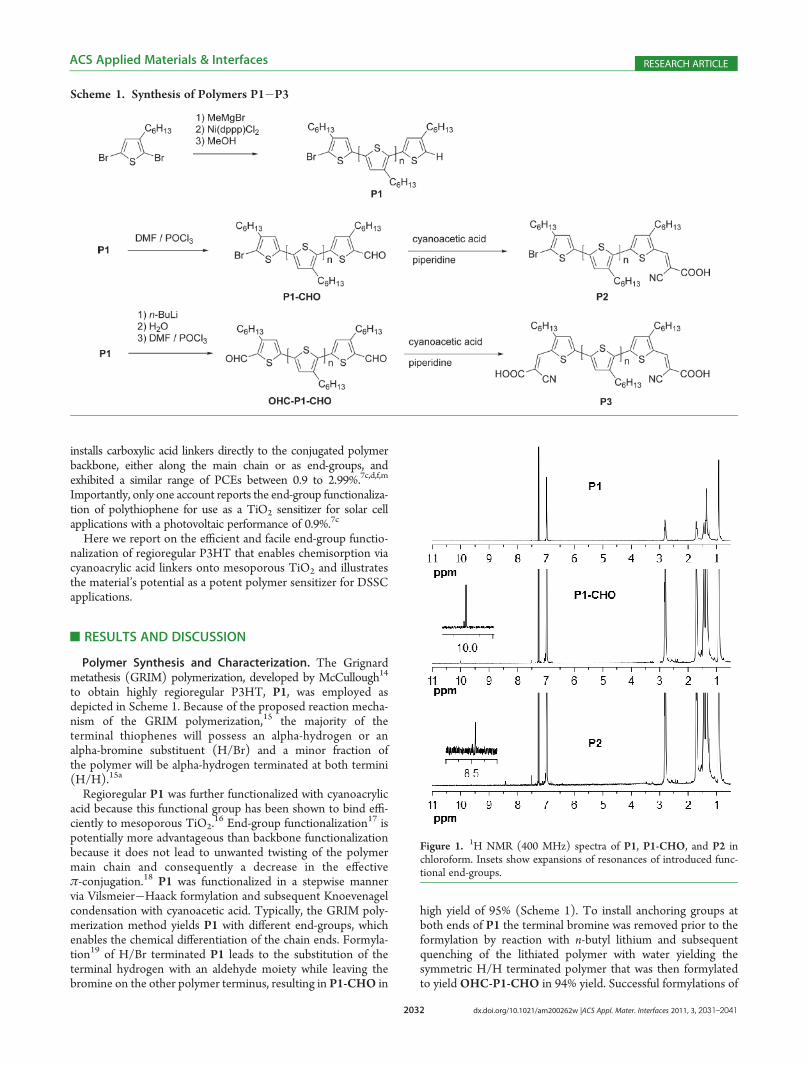
16 End-group functionalization17 ispotentially more advantageous than backbone functionalizationbecause it does not lead to unwanted twisting of the polymermain chain and consequently a decrease in the effectiveπ-conjugation.18 P1 was functionalized in a stepwise mannervia Vilsmeier�Haack formylation and subsequent Knoevenagelcondensation with cyanoacetic acid. Typically, the GRIM poly-merization method yields P1 with different end-groups, whichenables the chemical differentiation of the chain ends. Formyla-tion19 of H/Br terminated P1 leads to the substitution of theterminal hydrogen with an aldehyde moiety while leaving thebromine on the other polymer terminus, resulting in P1-CHO in
high yield of 95% (Scheme 1). To install anchoring groups atboth ends of P1 the terminal bromine was removed prior to theformylation by reaction with n-butyl lithium and subsequentquenching of the lithiated polymer with water yielding thesymmetric H/H terminated polymer that was then formylatedto yieldOHC-P1-CHO in 94% yield. Successful formylations of
Scheme 1. Synthesis of Polymers P1�P3
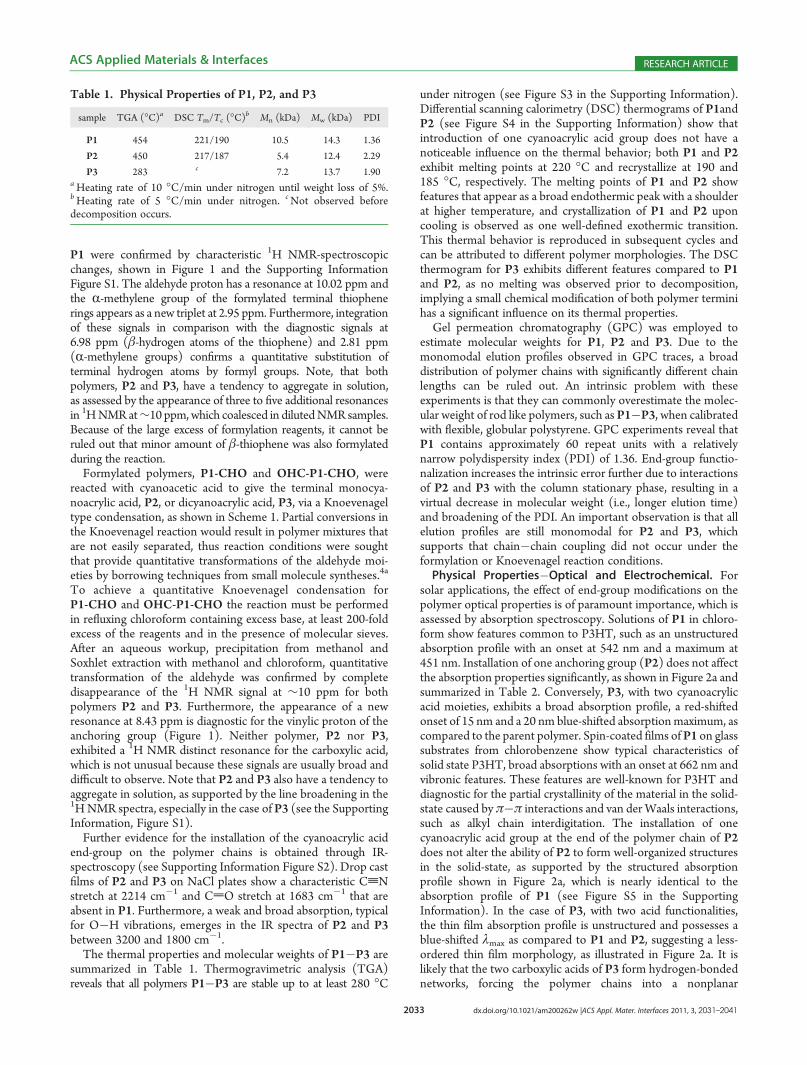
Figure 1. 1H NMR (400 MHz) spectra of P1, P1-CHO, and P2 inchloroform. Insets show expansions of resonances of introduced func-tional end-groups.
2033 dx.doi.org/10.1021/am200262w |ACS Appl. Mater. Interfaces 2011, 3, 2031–2041
ACS Applied Materials & Interfaces RESEARCH ARTICLE
P1 were confirmed by characteristic 1H NMR-spectroscopicchanges, shown in Figure 1 and the Supporting InformationFigure S1. The aldehyde proton has a resonance at 10.02 ppm andthe R-methylene group of the formylated terminal thiophenerings appears as a new triplet at 2.95 ppm. Furthermore, integrationof these signals in comparison with the diagnostic signals at6.98 ppm (β-hydrogen atoms of the thiophene) and 2.81 ppm(R-methylene groups) confirms a quantitative substitution ofterminal hydrogen atoms by formyl groups. Note, that bothpolymers, P2 and P3, have a tendency to aggregate in solution,as assessed by the appearance of three to five additional resonancesin 1HNMRat∼10 ppm,which coalesced in dilutedNMR samples.Because of the large excess of formylation reagents, it cannot beruled out that minor amount of β-thiophene was also formylatedduring the reaction.Formylated polymers, P1-CHO and OHC-P1-CHO, were
reacted with cyanoacetic acid to give the terminal monocya-noacrylic acid, P2, or dicyanoacrylic acid, P3, via a Knoevenageltype condensation, as shown in Scheme 1. Partial conversions inthe Knoevenagel reaction would result in polymer mixtures thatare not easily separated, thus reaction conditions were soughtthat provide quantitative transformations of the aldehyde moi-eties by borrowing techniques from small molecule syntheses.4a
To achieve a quantitative Knoevenagel condensation forP1-CHO and OHC-P1-CHO the reaction must be performedin refluxing chloroform containing excess base, at least 200-foldexcess of the reagents and in the presence of molecular sieves.After an aqueous workup, precipitation from methanol andSoxhlet extraction with methanol and chloroform, quantitativetransformation of the aldehyde was confirmed by completedisappearance of the 1H NMR signal at ∼10 ppm for bothpolymers P2 and P3. Furthermore, the appearance of a newresonance at 8.43 ppm is diagnostic for the vinylic proton of theanchoring group (Figure 1). Neither polymer, P2 nor P3,exhibited a 1H NMR distinct resonance for the carboxylic acid,which is not unusual because these signals are usually broad anddifficult to observe. Note that P2 and P3 also have a tendency toaggregate in solution, as supported by the line broadening in the1HNMR spectra, especially in the case of P3 (see the SupportingInformation, Figure S1).Further evidence for the installation of the cyanoacrylic acid
end-group on the polymer chains is obtained through IR-spectroscopy (see Supporting Information Figure S2). Drop castfilms of P2 and P3 on NaCl plates show a characteristic CtNstretch at 2214 cm�1 and CdO stretch at 1683 cm�1 that areabsent in P1. Furthermore, a weak and broad absorption, typicalfor O�H vibrations, emerges in the IR spectra of P2 and P3between 3200 and 1800 cm�1.The thermal properties and molecular weights of P1�P3 are
summarized in Table 1. Thermogravimetric analysis (TGA)reveals that all polymers P1�P3 are stable up to at least 280 �C
under nitrogen (see Figure S3 in the Supporting Information).Differential scanning calorimetry (DSC) thermograms of P1andP2 (see Figure S4 in the Supporting Information) show thatintroduction of one cyanoacrylic acid group does not have anoticeable influence on the thermal behavior; both P1 and P2exhibit melting points at 220 �C and recrystallize at 190 and185 �C, respectively. The melting points of P1 and P2 showfeatures that appear as a broad endothermic peak with a shoulderat higher temperature, and crystallization of P1 and P2 uponcooling is observed as one well-defined exothermic transition.This thermal behavior is reproduced in subsequent cycles andcan be attributed to different polymer morphologies. The DSCthermogram for P3 exhibits different features compared to P1and P2, as no melting was observed prior to decomposition,implying a small chemical modification of both polymer terminihas a significant influence on its thermal properties.Gel permeation chromatography (GPC) was employed to
estimate molecular weights for P1, P2 and P3. Due to themonomodal elution profiles observed in GPC traces, a broaddistribution of polymer chains with significantly different chainlengths can be ruled out. An intrinsic problem with theseexperiments is that they can commonly overestimate the molec-ular weight of rod like polymers, such as P1�P3, when calibratedwith flexible, globular polystyrene. GPC experiments reveal thatP1 contains approximately 60 repeat units with a relativelynarrow polydispersity index (PDI) of 1.36. End-group functio-nalization increases the intrinsic error further due to interactionsof P2 and P3 with the column stationary phase, resulting in avirtual decrease in molecular weight (i.e., longer elution time)and broadening of the PDI. An important observation is that allelution profiles are still monomodal for P2 and P3, whichsupports that chain�chain coupling did not occur under theformylation or Knoevenagel reaction conditions.Physical Properties�Optical and Electrochemical. For
solar applications, the effect of end-group modifications on thepolymer optical properties is of paramount importance, which isassessed by absorption spectroscopy. Solutions of P1 in chloro-form show features common to P3HT, such as an unstructuredabsorption profile with an onset at 542 nm and a maximum at451 nm. Installation of one anchoring group (P2) does not affectthe absorption properties significantly, as shown in Figure 2a andsummarized in Table 2. Conversely, P3, with two cyanoacrylicacid moieties, exhibits a broad absorption profile, a red-shiftedonset of 15 nm and a 20 nm blue-shifted absorptionmaximum, ascompared to the parent polymer. Spin-coated films ofP1 on glasssubstrates from chlorobenzene show typical characteristics ofsolid state P3HT, broad absorptions with an onset at 662 nm andvibronic features. These features are well-known for P3HT anddiagnostic for the partial crystallinity of the material in the solid-state caused by π�π interactions and van derWaals interactions,such as alkyl chain interdigitation. The installation of onecyanoacrylic acid group at the end of the polymer chain of P2does not alter the ability of P2 to form well-organized structuresin the solid-state, as supported by the structured absorptionprofile shown in Figure 2a, which is nearly identical to theabsorption profile of P1 (see Figure S5 in the SupportingInformation). In the case of P3, with two acid functionalities,the thin film absorption profile is unstructured and possesses ablue-shifted λmax as compared to P1 and P2, suggesting a less-ordered thin film morphology, as illustrated in Figure 2a. It islikely that the two carboxylic acids of P3 form hydrogen-bondednetworks, forcing the polymer chains into a nonplanar
Table 1. Physical Properties of P1, P2, and P3
sample TGA (�C)a DSC Tm/Tc (�C)b Mn (kDa) Mw (kDa) PDI
P1 454 221/190 10.5 14.3 1.36
P2 450 217/187 5.4 12.4 2.29
P3 283 c 7.2 13.7 1.90aHeating rate of 10 �C/min under nitrogen until weight loss of 5%.bHeating rate of 5 �C/min under nitrogen. cNot observed beforedecomposition occurs.

2034 dx.doi.org/10.1021/am200262w |ACS Appl. Mater. Interfaces 2011, 3, 2031–2041
ACS Applied Materials & Interfaces RESEARCH ARTICLE
conformation, whereas the single carboxylic acid in P2 has lessability to hydrogen-bond and is capable of maintaining a planarconfiguration of the long polymer chains through π�π and vander Waals interactions. Lohwasser and co-workers7c observedsimilar morphological changes with carboxy-terminated P3HTusing P-XRD. The absorption profiles of P1, P2, and P3 loadedto TiO2 is shown in Figure 2b and all exhibit similar absorptiononsets to the spin-cast films, extending as far as∼725 nm for P2andP3, and∼650 nm forP1. However, the absorption profiles ofFigure 2b, show a clear difference in optical density, which iscorrelated to the loading quantity on TiO2 and P2 is moredensely packed, followed byP3 then the control polymer withoutanchoring group, P1. Attempts were made to desorb andquantify the amount of bound polymers by incubating theTiO2 films in basic EtOH and THF, however, no quantifiablepolymer was desorbed by UV�vis absorption assessment, ren-dering this typical assay for loading quantity not practical forthese polymers. Photographs of the polymer solutions can befound in Figure S6 in the Supporting Information and sensitizersadsorbed on TiO2 are shown as an inset in Figure 2b; anddifferences in the color of the adsorbed materials can be clearlyobserved, even though all loading concentrations were similar,which will be discussed in more detail below.To evaluate the HOMO energy levels of P1, P2 and P3, cyclic
voltammagrams (CVs) were measured for drop cast films ofP1�P3 from chloroform solutions on a glassy carbon workingelectrode (Figure S7). Although differences in the oxidationpotentials are small, ∼0.06 to 0.10 V vs Fc/Fcþ, there is a cleartrend to lower oxidation potential as the number of cyanoacrylicacid groups increases from P1 to P3. This trend is likely due to
deprotonation of P2 and P3 in the electrolyte solution and thusthe carboxylate terminated polymers are easier to oxidize. Theonsets of the oxidation potentials can be employed to estimatethe HOMO energy levels, assuming the Fc/Fcþ HOMO energylevel is located at �4.8 eV.20 In conjunction with the opticalabsorption onset of the films, which estimates the HOMO�LUMO energy gap, the LUMO energy levels can also beapproximated. Importantly, the overall optical and electronicfeatures of P1, P2, and P3 are similar, and thus any differencesobserved in solar cell performance will be likely due to thecyanoacrylic acid linker chemistry, the TiO2 surface inter-actions with the polymer main chains, and polymer�polymerinteractions.The experimentally determined ELUMO levels of polymers
P1�P3 indicated that the energetics are thermodynamicallyfavorable to inject electrons into the TiO2 conduction band.Likewise, the EHOMO level is lower in energy than the I�/I3
�
redox couple in the electrolyte solution, which is needed forregeneration of the photo-oxidized sensitizer.The TiO2 was incubated in a solution containing ∼6 mg of
polymer in 10 mL of chloroform for 18 h at room temperature inthe dark. Excess loosely bound polymer was rinsed from the TiO2
surface with THF until the rinsing solvent was colorless. Polymersensitizer-loaded TiO2 working electrodes were then subjectedto CV analysis to determine the amount of thiophene andcyanoacrylic acid that were electrochemically accessible bychanging the electrode potential. The oxidative scans of P1, P2,and P3 to assess the quantity of thiophenes that are electro-chemically oxidizable on the electrode are shown in Figure 3.There are two characteristics in describing TiO2 films of P1 to
Figure 2. (a) UV�vis absorption spectra of P2 (circles) and P3 (triangles) in chloroform solutions (lines) and films on glass (solid fills). (b) UV�visabsorption spectra of P1 (squares), P2 (circles), and P3 (triangles) adsorbed on 6 μm thick TiO2 films. Inset: photograph of polymers loaded on TiO2.
Table 2. Optical and Electrochemical Summary of Polymers P1, P2 ,and P3 in Solution (CHCl3) and Thin Films
sample absorption onset solution (nm) (eV)a absorption onset film (nm) (eV)b EOX vs Fc/Fcþ (V)c EHOMO (eV)d ELUMO (eV)e
P1 542 (2.20) 662 (1.87) 0.46 �5.26 �3.39
P2 535 (2.32) 653 (1.90) 0.35 �5.15 �3.25
P3 557 (2.23) 649 (1.91) 0.29 �5.09 �3.18a In chloroform. b Spin-coated from chlorobenzene solutions. cDrop-cast from chloroform solution on a glassy carbon working electrode. dAssuming theFc/Fcþ HOMO energy level at �4.8 eV. e ELUMO calculated from the electrochemical oxidation potential onset and the UV�vis absorption onset.

2035 dx.doi.org/10.1021/am200262w |ACS Appl. Mater. Interfaces 2011, 3, 2031–2041
ACS Applied Materials & Interfaces RESEARCH ARTICLE
P3: First, the oxidation current due to the oxidation of thiophenerings, and second, the capacitance of the films on the TiO2
substrates. P1 shows little oxidation current (integrated charge of8.1 μC) due to electrochemically oxidizing P1 up to 1.7 V (vs Ag|AgCl|CH3CN), suggesting the loading is very low and the P1that is bound has minimal contact with the substrate, which iscorroborated by the lighter color film for P1 on TiO2, shown inFigure 2b inset. The capacitance of the P1 film is 4.5 μF cm�2 at0.4 V, where no faradaic current is produced. P2 sensitized TiO2
shows a much larger oxidizing current in the thiophene oxidationregion and integrates to 3.4 mC, indicating a much larger loadingcompared to P1, which is consistent with the observed color ofthe loaded dye as shown in Figure 2b inset. Note the capacitanceof the TiO2 film adsorbed with P2 has increased to 100 μF cm�2
at 0.4 V, suggesting the film/sensitizer has a higher dielectricconstant than P1, which is consistent with an oxidized(electrochemically p-doped) film and counterion flux. P3 alsoshows electrochemical oxidation peaks due to thiophene and thetotal charge is similar to P2 at 3.3 mC, indicating a similarquantity of oxidizable thiophenes are present on the TiO2
substrate. Interestingly, the film capacitance measured at thesame potential (0.4 V) increases to 339 μF cm�2. Assumingelectrode areas are the same, capacitance values are proportionalto permittivity of the film and inversely proportional to filmthickness of the sensitizer layer. The capacitance values suggestP1 is a thin film that is highly penetrated with electrolyte, P2 is athicker film that is moderately oxidatively doped and P3 forms asimilar thickness layer to P2 and a film that is heavily oxidativelydoped. Note, P2 also exhibits a small shoulder at <1 V, whichcould be due to different microenvironments of this loadedpolymer on TiO2 because this shoulder is absent in the drop castfilms on a glassy carbon electrode. In a separate experiment, thepolymer films on TiO2 were subjected to a reductive potentialsweep, as shown in Figure 3, which should electrochemicallyreduce the linker group. The reductive potential sweep for P1does not display a reduction peak, as expected because it does notcontain the cyanoacrylic acid linker. Both P2 and P3 do showreduction peaks and the resulting integrated current for P2 andP3 is 0.44 mC and 0.26 mC, respectively. Surprisingly, the totalcharge of the reduction peak for P2 is nearly double that of P3.Normalizing the integrated current by dividing by the number ofredox active cyanoacrylic acid moieties, suggests that the numberof polymer chains attached to the TiO2 surface for the P2 film isapproximately four times that of the P3 sensitized film. However,
the oxidation peaks of thiophene show similar quantities ofpolythiophene are electrochemically oxidizable. The differencein linker loading suggests that the P3 sensitizer has more redox-active thiophenes, which could be due to a higher p-doping abilityof P3 compared to P2. On the basis of the quantity of cyanoacry-lic acid linker present, the P2 sensitizer likely exists as a close-packed monolayer extending outward toward the electrolyte,whereas P3 possessing two binding moieties, orientates itself in amore flat/planar configuration along the TiO2 surface. With boththe quantity of thiophene in contact with the electrode and thenumber of cyanoacrylic acid groups, a model of the polymer filmcan be constructed and is shown in Figure 4.Taking into account the optical and electrochemical data
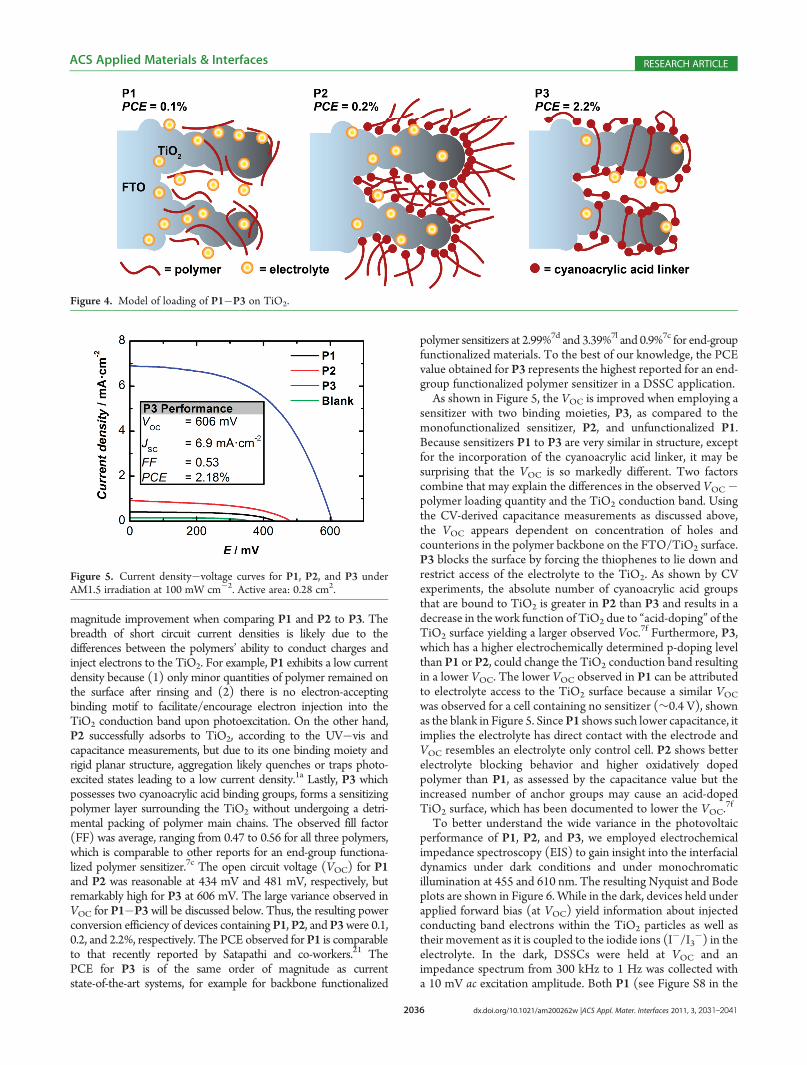
permits the formation of a model to explain the differences inthe film properties, shown in Figure 4. The TiO2 particles areapproximately 20 nm in diameter and the outstretched polymerswould be of similar dimension as illustrated by the mesoporousTiO2 supported on FTO. In the case of P1, the polymer chainsphysisorb to the TiO2 surface at low loading, as supported byboth optical and electrochemical measurements and the electro-lyte has ready access to the TiO2 surface. In P2 devices, thepolymer chemisorbs to the TiO2 surface at much higher densitythan P1, as supported by optical measurements and CV sweeps.P2 shows a much higher number of cyanoacrylic acid groupsbound to the TiO2, but the amount of thiophene that is inelectrochemical contact with the electroactive surface is onlymoderate. The P2 film is modestly oxidatively doped and thedensity of polymer chains may result in the chains ‘standing’ onend. The higher loading of P2 sensitized TiO2 is supported bythe optical density of the devices shown in the inset of Figure 2b.The difference in loading density is partly responsible for thedifference in the observed open circuit voltage (VOC), see below,due to a greater surface acid concentration leading to protonatedTiO2.
7f In the case of P3 devices, the number of linker groupsattached to the TiO2 is less than P2, but the amount of redoxactive thiophene is the same, suggesting intimate contact of thethiophene rings with the TiO2 surface leading to a much higherp-doping level than P2. If the double-linker P3 sensitizer is lyingflat on the surface, then the electron-rich heterocycles mayincrease the conduction band of TiO2 leading to a larger VOCas will be discussed in the following section.Device Fabrication. With the knowledge that P2 and P3
adsorb to TiO2 via the cyanoacrylic acid linker, polymer-sensitized solar cells were fabricated and the current density�voltage (JV) characteristics were measured under AM1.5 irradia-tion at 100 mW 3 cm
�2. Components for cell fabrication, namelythe thickness of the TiO2 substrates (6 μm) and choice ofelectrolyte (Dysesol High Performance Electrolyte (HPE)) werechosen for the following reasons. Thinner TiO2 films wereemployed because the polymer sensitizers strongly absorb be-tween 400 and 650 nm and because of the anticipated highsensitizer loading due to the cyanoacrylic acid linker, which isknown to possess excellent TiO2 binding characteristics, and themolecular weights of polymers employed (>12 kDa). The electro-lyte, which is a critical component in Ru-based and fully organicdevices, was selected because it has been shown to perform well inRu-based DSSC applications under the testing conditions. The JVperformance curves for P1 through P3 are shown in Figure 5.Dramatic differences in both the short circuit current (JSC) andopencircuit voltage (VOC) are apparent betweenP1,P2, andP3. The JSCmeasured for the polymer devices P1, P2 and P3 were 0.41, 0.92,and 6.9 mA cm�2, respectively, which represent nearly an order of
Figure 3. Oxidative and reductive potential sweeps of adsorbed P1, P2,and P3 on 6 μm thick TiO2 on FTO. Scan rate: 500 mV s�1.
2036 dx.doi.org/10.1021/am200262w |ACS Appl. Mater. Interfaces 2011, 3, 2031–2041
ACS Applied Materials & Interfaces RESEARCH ARTICLE
magnitude improvement when comparing P1 and P2 to P3. Thebreadth of short circuit current densities is likely due to thedifferences between the polymers’ ability to conduct charges andinject electrons to the TiO2. For example, P1 exhibits a low currentdensity because (1) only minor quantities of polymer remained onthe surface after rinsing and (2) there is no electron-acceptingbinding motif to facilitate/encourage electron injection into theTiO2 conduction band upon photoexcitation. On the other hand,P2 successfully adsorbs to TiO2, according to the UV�vis andcapacitance measurements, but due to its one binding moiety andrigid planar structure, aggregation likely quenches or traps photo-excited states leading to a low current density.1a Lastly, P3 whichpossesses two cyanoacrylic acid binding groups, forms a sensitizingpolymer layer surrounding the TiO2 without undergoing a detri-mental packing of polymer main chains. The observed fill factor(FF) was average, ranging from 0.47 to 0.56 for all three polymers,which is comparable to other reports for an end-group functiona-lized polymer sensitizer.7c The open circuit voltage (VOC) for P1and P2 was reasonable at 434 mV and 481 mV, respectively, butremarkably high for P3 at 606 mV. The large variance observed inVOC for P1�P3 will be discussed below. Thus, the resulting powerconversion efficiency of devices containing P1, P2, and P3were 0.1,0.2, and 2.2%, respectively. The PCE observed for P1 is comparableto that recently reported by Satapathi and co-workers.21 ThePCE for P3 is of the same order of magnitude as currentstate-of-the-art systems, for example for backbone functionalized
polymer sensitizers at 2.99%7d and 3.39%7l and 0.9%7c for end-groupfunctionalized materials. To the best of our knowledge, the PCEvalue obtained for P3 represents the highest reported for an end-group functionalized polymer sensitizer in a DSSC application.As shown in Figure 5, the VOC is improved when employing a
sensitizer with two binding moieties, P3, as compared to themonofunctionalized sensitizer, P2, and unfunctionalized P1.Because sensitizers P1 to P3 are very similar in structure, exceptfor the incorporation of the cyanoacrylic acid linker, it may besurprising that the VOC is so markedly different. Two factorscombine that may explain the differences in the observed VOC�polymer loading quantity and the TiO2 conduction band. Usingthe CV-derived capacitance measurements as discussed above,the VOC appears dependent on concentration of holes andcounterions in the polymer backbone on the FTO/TiO2 surface.P3 blocks the surface by forcing the thiophenes to lie down andrestrict access of the electrolyte to the TiO2. As shown by CVexperiments, the absolute number of cyanoacrylic acid groupsthat are bound to TiO2 is greater in P2 than P3 and results in adecrease in the work function of TiO2 due to “acid-doping” of theTiO2 surface yielding a larger observed Voc.
7f Furthermore, P3,which has a higher electrochemically determined p-doping levelthan P1 or P2, could change the TiO2 conduction band resultingin a lower VOC. The lower VOC observed in P1 can be attributedto electrolyte access to the TiO2 surface because a similar VOCwas observed for a cell containing no sensitizer (∼0.4 V), shownas the blank in Figure 5. SinceP1 shows such lower capacitance, itimplies the electrolyte has direct contact with the electrode andVOC resembles an electrolyte only control cell. P2 shows betterelectrolyte blocking behavior and higher oxidatively dopedpolymer than P1, as assessed by the capacitance value but theincreased number of anchor groups may cause an acid-dopedTiO2 surface, which has been documented to lower the VOC.
7f
To better understand the wide variance in the photovoltaicperformance of P1, P2, and P3, we employed electrochemicalimpedance spectroscopy (EIS) to gain insight into the interfacialdynamics under dark conditions and under monochromaticillumination at 455 and 610 nm. The resulting Nyquist and Bodeplots are shown in Figure 6. While in the dark, devices held underapplied forward bias (at VOC) yield information about injectedconducting band electrons within the TiO2 particles as well astheir movement as it is coupled to the iodide ions (I�/I3
�) in theelectrolyte. In the dark, DSSCs were held at VOC and animpedance spectrum from 300 kHz to 1 Hz was collected witha 10 mV ac excitation amplitude. Both P1 (see Figure S8 in the
Figure 4. Model of loading of P1�P3 on TiO2.
Figure 5. Current density�voltage curves for P1, P2, and P3 underAM1.5 irradiation at 100 mW cm�2. Active area: 0.28 cm2.
2037 dx.doi.org/10.1021/am200262w |ACS Appl. Mater. Interfaces 2011, 3, 2031–2041
ACS Applied Materials & Interfaces RESEARCH ARTICLE
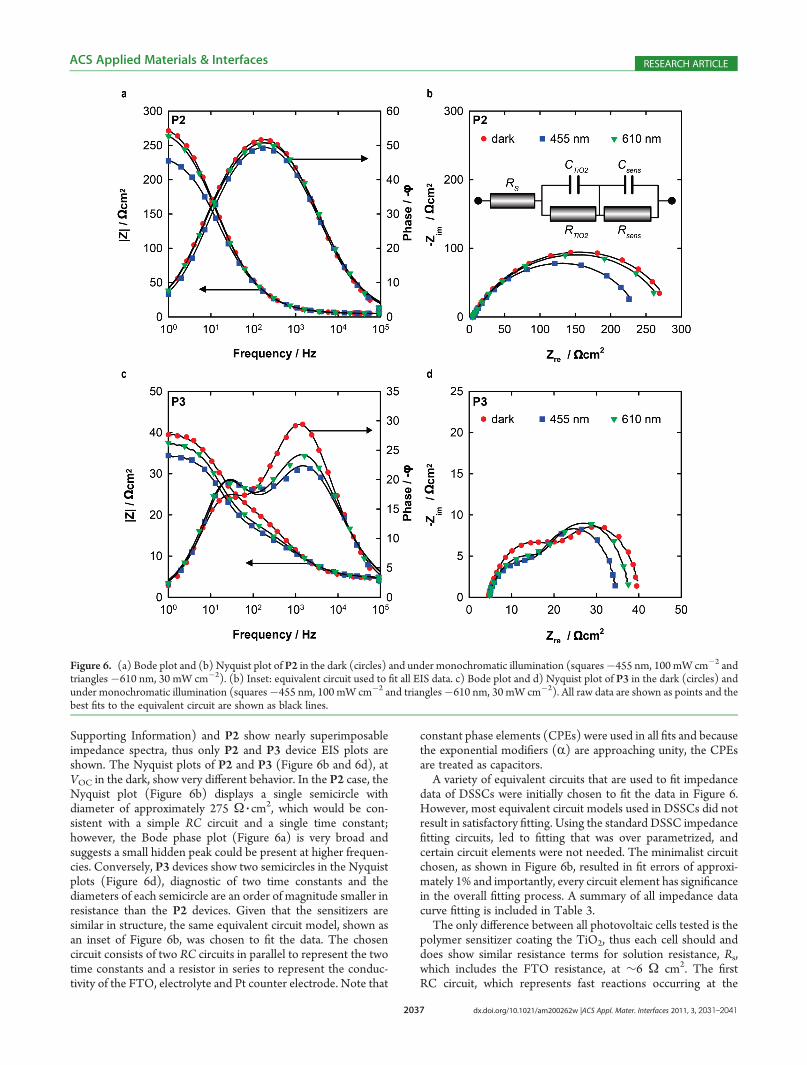
Supporting Information) and P2 show nearly superimposableimpedance spectra, thus only P2 and P3 device EIS plots areshown. The Nyquist plots of P2 and P3 (Figure 6b and 6d), atVOC in the dark, show very different behavior. In the P2 case, theNyquist plot (Figure 6b) displays a single semicircle withdiameter of approximately 275 Ω 3 cm
2, which would be con-sistent with a simple RC circuit and a single time constant;however, the Bode phase plot (Figure 6a) is very broad andsuggests a small hidden peak could be present at higher frequen-cies. Conversely, P3 devices show two semicircles in the Nyquistplots (Figure 6d), diagnostic of two time constants and thediameters of each semicircle are an order of magnitude smaller inresistance than the P2 devices. Given that the sensitizers aresimilar in structure, the same equivalent circuit model, shown asan inset of Figure 6b, was chosen to fit the data. The chosencircuit consists of two RC circuits in parallel to represent the twotime constants and a resistor in series to represent the conduc-tivity of the FTO, electrolyte and Pt counter electrode. Note that
constant phase elements (CPEs) were used in all fits and becausethe exponential modifiers (R) are approaching unity, the CPEsare treated as capacitors.A variety of equivalent circuits that are used to fit impedance
data of DSSCs were initially chosen to fit the data in Figure 6.However, most equivalent circuit models used in DSSCs did notresult in satisfactory fitting. Using the standard DSSC impedancefitting circuits, led to fitting that was over parametrized, andcertain circuit elements were not needed. The minimalist circuitchosen, as shown in Figure 6b, resulted in fit errors of approxi-mately 1% and importantly, every circuit element has significancein the overall fitting process. A summary of all impedance datacurve fitting is included in Table 3.The only difference between all photovoltaic cells tested is the
polymer sensitizer coating the TiO2, thus each cell should anddoes show similar resistance terms for solution resistance, Rs,which includes the FTO resistance, at ∼6 Ω cm2. The firstRC circuit, which represents fast reactions occurring at the
Figure 6. (a) Bode plot and (b) Nyquist plot of P2 in the dark (circles) and under monochromatic illumination (squares�455 nm, 100 mW cm�2 andtriangles�610 nm, 30 mW cm�2). (b) Inset: equivalent circuit used to fit all EIS data. c) Bode plot and d) Nyquist plot of P3 in the dark (circles) andunder monochromatic illumination (squares�455 nm, 100 mW cm�2 and triangles�610 nm, 30 mW cm�2). All raw data are shown as points and thebest fits to the equivalent circuit are shown as black lines.
2038 dx.doi.org/10.1021/am200262w |ACS Appl. Mater. Interfaces 2011, 3, 2031–2041
ACS Applied Materials & Interfaces RESEARCH ARTICLE
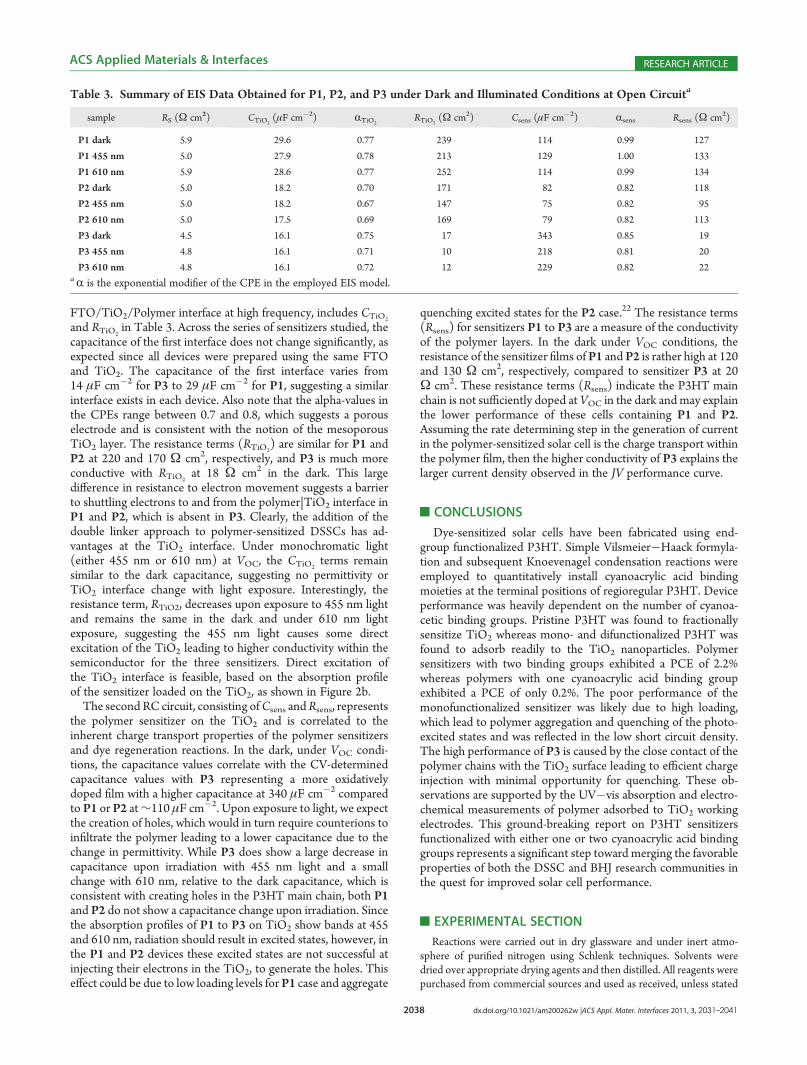
FTO/TiO2/Polymer interface at high frequency, includes CTiO2
and RTiO2in Table 3. Across the series of sensitizers studied, the
capacitance of the first interface does not change significantly, asexpected since all devices were prepared using the same FTOand TiO2. The capacitance of the first interface varies from14 μF cm�2 for P3 to 29 μF cm�2 for P1, suggesting a similarinterface exists in each device. Also note that the alpha-values inthe CPEs range between 0.7 and 0.8, which suggests a porouselectrode and is consistent with the notion of the mesoporousTiO2 layer. The resistance terms (RTiO2
) are similar for P1 andP2 at 220 and 170 Ω cm2, respectively, and P3 is much moreconductive with RTiO2
at 18 Ω cm2 in the dark. This largedifference in resistance to electron movement suggests a barrierto shuttling electrons to and from the polymer|TiO2 interface inP1 and P2, which is absent in P3. Clearly, the addition of thedouble linker approach to polymer-sensitized DSSCs has ad-vantages at the TiO2 interface. Under monochromatic light(either 455 nm or 610 nm) at VOC, the CTiO2
terms remainsimilar to the dark capacitance, suggesting no permittivity orTiO2 interface change with light exposure. Interestingly, theresistance term, RTiO2, decreases upon exposure to 455 nm lightand remains the same in the dark and under 610 nm lightexposure, suggesting the 455 nm light causes some directexcitation of the TiO2 leading to higher conductivity within thesemiconductor for the three sensitizers. Direct excitation ofthe TiO2 interface is feasible, based on the absorption profileof the sensitizer loaded on the TiO2, as shown in Figure 2b.The second RC circuit, consisting ofCsens andRsens, represents
the polymer sensitizer on the TiO2 and is correlated to theinherent charge transport properties of the polymer sensitizersand dye regeneration reactions. In the dark, under VOC condi-tions, the capacitance values correlate with the CV-determinedcapacitance values with P3 representing a more oxidativelydoped film with a higher capacitance at 340 μF cm�2 comparedto P1 or P2 at∼110 μF cm�2. Upon exposure to light, we expectthe creation of holes, which would in turn require counterions toinfiltrate the polymer leading to a lower capacitance due to thechange in permittivity. While P3 does show a large decrease incapacitance upon irradiation with 455 nm light and a smallchange with 610 nm, relative to the dark capacitance, which isconsistent with creating holes in the P3HT main chain, both P1and P2 do not show a capacitance change upon irradiation. Sincethe absorption profiles of P1 to P3 on TiO2 show bands at 455and 610 nm, radiation should result in excited states, however, inthe P1 and P2 devices these excited states are not successful atinjecting their electrons in the TiO2, to generate the holes. Thiseffect could be due to low loading levels forP1 case and aggregate
quenching excited states for the P2 case.22 The resistance terms(Rsens) for sensitizers P1 to P3 are a measure of the conductivityof the polymer layers. In the dark under VOC conditions, theresistance of the sensitizer films of P1 and P2 is rather high at 120and 130 Ω cm2, respectively, compared to sensitizer P3 at 20Ω cm2. These resistance terms (Rsens) indicate the P3HT mainchain is not sufficiently doped at VOC in the dark andmay explainthe lower performance of these cells containing P1 and P2.Assuming the rate determining step in the generation of currentin the polymer-sensitized solar cell is the charge transport withinthe polymer film, then the higher conductivity of P3 explains thelarger current density observed in the JV performance curve.
’CONCLUSIONS
Dye-sensitized solar cells have been fabricated using end-group functionalized P3HT. Simple Vilsmeier�Haack formyla-tion and subsequent Knoevenagel condensation reactions wereemployed to quantitatively install cyanoacrylic acid bindingmoieties at the terminal positions of regioregular P3HT. Deviceperformance was heavily dependent on the number of cyanoa-cetic binding groups. Pristine P3HT was found to fractionallysensitize TiO2 whereas mono- and difunctionalized P3HT wasfound to adsorb readily to the TiO2 nanoparticles. Polymersensitizers with two binding groups exhibited a PCE of 2.2%whereas polymers with one cyanoacrylic acid binding groupexhibited a PCE of only 0.2%. The poor performance of themonofunctionalized sensitizer was likely due to high loading,which lead to polymer aggregation and quenching of the photo-excited states and was reflected in the low short circuit density.The high performance of P3 is caused by the close contact of thepolymer chains with the TiO2 surface leading to efficient chargeinjection with minimal opportunity for quenching. These ob-servations are supported by the UV�vis absorption and electro-chemical measurements of polymer adsorbed to TiO2 workingelectrodes. This ground-breaking report on P3HT sensitizersfunctionalized with either one or two cyanoacrylic acid bindinggroups represents a significant step toward merging the favorableproperties of both the DSSC and BHJ research communities inthe quest for improved solar cell performance.
’EXPERIMENTAL SECTION
Reactions were carried out in dry glassware and under inert atmo-sphere of purified nitrogen using Schlenk techniques. Solvents weredried over appropriate drying agents and then distilled. All reagents werepurchased from commercial sources and used as received, unless stated
Table 3. Summary of EIS Data Obtained for P1, P2, and P3 under Dark and Illuminated Conditions at Open Circuita
sample RS (Ω cm2) CTiO2(μF cm�2) RTiO2
RTiO2(Ω cm2) Csens (μF cm�2) Rsens Rsens (Ω cm2)
P1 dark 5.9 29.6 0.77 239 114 0.99 127
P1 455 nm 5.0 27.9 0.78 213 129 1.00 133
P1 610 nm 5.9 28.6 0.77 252 114 0.99 134
P2 dark 5.0 18.2 0.70 171 82 0.82 118
P2 455 nm 5.0 18.2 0.67 147 75 0.82 95
P2 610 nm 5.0 17.5 0.69 169 79 0.82 113
P3 dark 4.5 16.1 0.75 17 343 0.85 19
P3 455 nm 4.8 16.1 0.71 10 218 0.81 20
P3 610 nm 4.8 16.1 0.72 12 229 0.82 22aR is the exponential modifier of the CPE in the employed EIS model.
2039 dx.doi.org/10.1021/am200262w |ACS Appl. Mater. Interfaces 2011, 3, 2031–2041
ACS Applied Materials & Interfaces RESEARCH ARTICLE
otherwise. Adapted from Rieke and co-workers 2,5-dibromo-3-hexyl-thiophene was prepared by using NBS as the brominating reagent.23
1H NMR spectra were recorded on Bruker Avance-II 400 MHzspectrometers. Chemical shifts were referenced to tetramethylsilane(TMS). Photophysical data were recorded in either chloroform solutionor as thin films (spin-coated onto glass substrates) on an UV�vis�NIRCary 5000 spectrophotometer. Gel permeation chromatography (GPC)analyses were carried out on a Waters Breeze instrument equipped withtwo styragel HR4E and HR5 columns. Tetrahydrofuran (THF) solu-tions for GPC analysis were eluted at 30 �C and at a flow rate of 1.0 mLmin�1 and analyzed using a UV detector. Molecular weights andmolecular weight distributions were reported against polystyrene stan-dards. Gel permeation chromatography experiments overestimate themolecular weight of rod like polymers like P3HT24 when calibrated withpolystyrene. Adding polar groups to the polymer chains slows theelution time due to interaction of the polymers with the columnmaterialand leads to underestimate the polymer weight. To estimate the yields ofthe polymers we assumed that the molecular weight of P1, determinedby GPC, was the highest precision of all polymers studied here.Furthermore, we assumed that end-group functionalization does notaffect the molecular weight. Thus, the number average molecular mass(Mn) of P1 was used to determine the yields of all transformations, eventhough GPC values of all polymers were available. Thermal analyseswere performed using TA-Q200 DSC and TA-Q50 TGA instrumentsunder N2 atmosphere.Films were prepared by spin-coating polymer solutions 5�
7 mg mL�1 in CHCl3 or chlorobenzene (Laurel Technologies, WS-400� 10�6 NPP-lite) under atmospheric conditions using the followingconditions: cleaned glass slide (4 cm2 optical measurements) at 750 rpmfor 1 min. Films for cyclic voltammetry measurements were drop cast(5�7 mg mL�1 in CHCl3) onto a glassy carbon electrode and air-dried.Cyclic voltammetry was carried out using an Autolab PGSTAT302instrument, with a glassy carbon disk as working electrode, Pt wire ascounter electrode, and a Ag|AgCl|(nBu)4NCl0.1M reference electrode;supporting electrolyte was 0.1 M [NBu4]PF6 in CH3CN; standard scanrates were 500 mV s�1. Electrochemical impedance spectroscopy (EIS)was performed using a Zahner IM6 impedance analyzer coupled tomonochromatic diode light source over a frequency range of 1 Hz to300 kHz with an ac amplitude of 10 mV. Cells were held at theirrespective open circuit potentials obtained from the JV measurements,while the EIS spectrumwas recorded. The resulting spectra were fit to anequivalent circuit model using a Thales 4.02 software package.Device Fabrication. Prescreen printed TiO2 working electrodes
on tec 8 FTO glass were purchased from Dyesol and heated to 500 �Cprior to dipping into sensitizing solutions. The films of transparent Dyesol18NR-T TiO2 were 6 μm thick and possess an active area of 0.28 cm2.Polymer sensitizing solutions were prepared by dissolving∼6mg ofP1�P3 in 10 mL chloroform. The working electrodes were taken out of theoven and dipped into the sensitizing baths while warm; approximately40�50 �C, sealed and incubated in the dark for 18 h. Following incubationin the sensitizer solution, the films were rinsed with either toluene or THFto remove weakly bound polymer. Films were rinsed until the rinsingsolvent was colorless. Working electrodes and predrilled platinizedcounter electrodes (Dyesol) were heat-sealed together using 30 μm thickthermoplacstic Surlyn gaskets (Dyesol) and a Dyesol Test Cell AssemblyMachine sealer. The cells were filled with an acetonitrile-based electrolyte(Dyesol High Performance Electrolyte batch TEL-294F) via a home-builtvacuum backing filling apparatus. Finally, cells were then sealed withaluminum-backed thermoplastic sealant using a Dyesol Fill Hole Sealer.Photovoltaic measurements were made using a class A Newport solarsimulator with a 150 W Xe lamp and power output was calibrated to anNREL certified monocrystalline Si reference cell. JV characteristics wereobtained using a Keithley 2420 source meter employing a delay time of50 ms prior to recording an JV curve.
Synthesis. P1. According to a method reported by McCullough14
methylmagnesium bromide in butyl ether (34 mL; 1M) was added to asolution of 2,5-dibromo-3-hexyl-thiophene (11.02 g ; 33.80 mmol) inTHF (250 mL) and refluxed for 50 min under an atmosphere ofnitrogen. After cooling the reaction mixture to room temperature 1,3-bis(diphenylphosphino)propane nickel(II) chloride (196 mg ; 0.36mmol) was added in one portion and refluxing was continued for 100min. Subsequently, the reaction mixture was concentrated to 100 mLand dropped in to methanol (800 mL) under vigorous stirring. Theprecipitate was collected by filtration and washed with methanol. Toremove residual catalyst and short polymer chains, the crude polymerwas exhaustively Soxhlet-extracted with methanol and hexanes, respec-tively. The product was obtained by subsequent extraction with chloro-form and precipitation into methanol.
Yield: 2.88 g (50%). Mn = 10.5 kDa, Mw = 14.3 kDa, polydispersityindex (PDI) = 1.36. 1HNMR (400MHz, CDCl3): δ = 6.98 (50H, s, Har),6.90 (1H, s, Har of hydrogen terminated end-group), 2.81 (100H, t,R-CH2), 2.62 (2H, t, R-CH2 of hydrogen terminated end-group),1.76�1.63 (100H, m, β-CH2), 1.50�1.24 (300H, m, CH2), 0.96�0.85(150H, m, CH3).
P1-CHO. Adapted from Surin and co-workers.19 A solution of P1(490 mg) in dry toluene was deoxygenated by purging with nitrogen for30 min. DMF (2 mL) and POCl3 (2 mL) were then added. The reactionmixture was stirred at 75 �C under nitrogen in the dark for 24 h before itwas cooled to room temperature, quenched with a saturated aqueoussolution of sodium acetate (5 mL) and poured into cold methanol(200 mL). The precipitate was collected by filtration and Soxhlet-extracted with methanol for 16 h and then with chloroform. The chloro-form fraction was evaporated to dryness and yielded the product as blacksolid with a green tint.
Yield: 0.47 g (95%). Mn = 10.7 kDa, Mw = 16.2 kDa, polydispersityindex (PDI) = 1.51. 1H NMR (400 MHz, CDCl3): δ = 10.02 (1H, s,CHO), 6.98 (120H, s, Har), 2.95 (2H, t, R-CH2 of aldehyde terminatedend-group), 2.81 (240H, t, R-CH2), 1.77�1.64 (240H, m, β-CH2),1.50�1.26 (720H, m, CH2), 0.96�0.84 (360H, m, CH3).
P2. Under nitrogen, P1-CHO (470 mg), cyanoacetic acid (1 g; 11.7mmol), and piperidine (1 mL; 10.0 mmol) were dissolved in chloroform(150 mL) and refluxed for 24 h. The condensing chloroform was passedthrough molecular sieves to bind water that was released by the reaction.The reaction mixture was then poured into diluted HCl (pH ∼3�4).After phase separation, the aqueous layer was extracted with chloroformonce. The combined chloroform layers were washed with water (3 �100 mL), dried with sodium sulfate, and evaporated to dryness. Theresidue was redissolved in a minimum amount of hot toluene andprecipitated into methanol (300 mL methanol containing 1 mL con-centrated HCl). The precipitate was collected by filtration and Soxhlet-extracted with methanol for 16 h to remove residual reagents andsubsequently with chloroform. The chloroform fraction was evaporatedto dryness, redissolved in a minimum amount hot toluene and pre-cipitated into methanol (150 mL of methanol containing 0.5 mL ofconcentrated HCl). After drying under vacuum the product wasobtained as a dark olive green solid.
Yield: 0.45 g (96%). Mn = 5.4 kDa, Mw = 12.4 kDa, polydispersityindex (PDI) = 2.29. 1H NMR (400 MHz, CDCl3): δ = 8.43 (1H, s,Hvinyl), 6.98 (82H, s, Har), 2.81 (180H, t,R-CH2), 1.77�1.65 (180H, m,β-CH2), 1.49�1.27 (540H, m, CH2), 0.95�0.84 (270H, m, CH3).
CHO-P1-CHO. Adapted from Surin and co-workers.19 Undernitrogen, P1 (500 mg) was dissolved in dry THF (150 mL) andcooled to 0 �C. A solution of n-butyllithium in hexanes (4 mL; 2.5M)was then added and the reaction mixture was stirred for 30 min at thattemperature before water was added to quench the reaction. Theresulting suspension was evaporated to dryness, redissolved inchloroform, washed with water (3 � 100 mL), dried with sodiumsulfate, and evaporated to dryness. The remaining residue was

2040 dx.doi.org/10.1021/am200262w |ACS Appl. Mater. Interfaces 2011, 3, 2031–2041
ACS Applied Materials & Interfaces RESEARCH ARTICLE
dissolved in dry toluene (80 mL) under nitrogen and DMF (2 mL)and POCl3 (2 mL) were added. The reaction mixture was stirred at75 �C under nitrogen in the dark for 24 h before it was cooled to roomtemperature, quenched with a saturated aqueous solution of sodiumacetate (10 mL), and poured in to cold methanol (200 mL). Theprecipitate was collected by filtration and Soxhlet-extracted withmethanol for 16 h and then with chloroform. The chloroform fractionwas evaporated to dryness and yielded the product as black solid witha green tint.
Yield: 0.47 g (94%). Mn = 8.2 kDa, Mw = 14.5 kDa, polydispersityindex (PDI) = 1.77. 1H NMR (400 MHz, CDCl3): δ = 10.02 (2H, s,CHO), 6.98 (40H, s, Har), 2.95 (4H, t, R-CH2 of aldehyde terminatedend-group), 2.81 (80H, t, R-CH2), 1.77�1.64 (80H, m, β-CH2),1.50�1.26 (240H, m, CH2), 0.96�0.84 (120H, m, CH3).P3. Under nitrogen, OHC-P1-CHO (100 mg), cyanoacetic acid
(0.5 g ; 5.8 mmol) and piperidine (0.5 mL ; 5.0 mmol) were dissolved inchloroform (50 mL) and refluxed for 24 h. The condensing chloroformwas passed through molecular sieves to bind water that was released bythe reaction. The reaction mixture was then poured into diluted HCl(pH ∼3�4). After phase separation, the aqueous layer was extractedwith chloroform once. The combined chloroform layers were washedwith water (3� 100 mL), dried with sodium sulfate, and evaporated todryness. The residue was redissolved in a minimum amount of hottoluene and precipitated in methanol (200 mL of methanol and 1 mL ofconcentrated HCl). The precipitate was collected by filtration andSoxhlet-extracted with methanol for 16 h to remove residual reagentsand subsequently with chloroform. The chloroform fraction was evapo-rated to dryness, redissolved in minimum amount hot toluene andprecipitated into methanol (100 mL of methanol and 0.5 mL ofconcentrated HCl). After drying in vacuum the product was obtainedas a dark olive green solid.
Yield: 0.09 g (90%). Mn = 7.2 kDa, Mw = 13.7 kDa, polydispersityindex (PDI) = 1.90. 1H NMR (400 MHz, CDCl3): δ = 8.43 (2H, s,Hvinyl), 6.98 (56H, s, Har), 2.81 (112H, t,R-CH2), 1.77�1.65 (112H, m,β-CH2), 1.49�1.27 (336H, m, CH2), 0.95�0.84 (168H, m, CH3).
’ASSOCIATED CONTENT
bS Supporting Information. 1H NMR spectra of OHC-P1-CHO and P3 in chloroform; UV�vis absorption spectra of P1 inchloroform solutions and solid-state on glass; CVs of P1 to P3 asdrop cast films on a glassy carbon electrode; IR-spectra of P1-P3;TGA traces of P1�P3 under nitrogen; DSC traces of P1�P3under nitrogen; Photographs of solutions of P1, P2, and P3; EISspectra of P1. This material is available free of charge via theInternet at http://pubs.acs.org.
’AUTHOR INFORMATION
Corresponding Author*E-mail: [email protected] (T.B.); [email protected] (T.S.).
’ACKNOWLEDGMENT
We thank NSERC of Canada, Canada School of Energy andEnvironment, Canadian Foundation for Innovation, AlbertaSmall Equipment Grants Program, and the Berlinguette lab foruse of the DSSC assembling and testing equipment. T.B. thanksAlberta Ingenuity�now part of Alberta Innovates TechnologyFutures�for a New Faculty Award.
’REFERENCES
(1) (a) Hagfeldt, A.; Boschloo, G.; Sun, L.; Kloo, L.; Pettersson, H.Chem. Rev. 2010, 110, 6595–6663. (b) O’Regan, B.; Gr€atzel, M. Nature1991, 353, 737–740.
(2) (a) Thompson, B. C.; Fr�echet, J. M. J. Angew. Chem., Int. Ed.2008, 47, 58–77. (b) Cheng, Y.-J.; Yang, S.-H.; Hsu, C.-S. Chem. Rev.2009, 109, 5868–5923. (c) Beaujuge, P. M.; Amb, C. M.; Reynolds, J. R.Acc. Chem. Res. 2010, 43, 1396–1407. (d) Helgesen, M.; Sondergaard,R.; Krebs, F. C. J. Mater. Chem. 2010, 20, 36–60.
(3) (a) Yu, Q.; Wang, Y.; Yi, Z.; Zu, N.; Zhang, J.; Zhang, M.; Wang,P. ACS Nano 2010, 4, 6032–6038. (b) Chen, C.-Y.; Wang, M.; Li, J.-Y.;Pootrakulchote, N.; Alibabaei, L.; Ngoc-le, C.-h.; Decoppet, J.-D.; Tsai,J.-H.; Gr€atzel, C.; Wu, C.-G.; Zakeeruddin, S. M.; Gr€atzel, M. ACS Nano2009, 3, 3103–3109.
(4) (a) Zeng, W.; Cao, Y.; Bai, Y.; Wang, Y.; Shi, Y.; Zhang, M.;Wang, F.; Pan, C.; Wang, P. Chem. Mater. 2010, 22, 1915–1925. (b)Caballero, R. n.; Barea, E. M.; Fabregat-Santiago, F.; de la Cruz, P.;M�arquez, L.; Langa, F.; Bisquert, J. J. Phys. Chem. C 2008, 112, 1862318627.
(5) (a) Hou, J.; Chen, H.-Y.; Zhang, S.; Chen, R. I.; Yang, Y.; Wu, Y.;Li, G. J. Am. Chem. Soc. 2009, 131, 15586–15587. (b) Liang, Y.; Xu, Z.;Xia, J.; Tsai, S.-T.; Wu, Y.; Li, G.; Ray, C.; Yu, L. Adv. Mater. 2010,22, E135–E138.
(6) Ma, W.; Yang, C.; Gong, X.; Lee, K.; Heeger, A. J. Adv. Funct.Mater. 2005, 15, 1617–1622.
(7) (a) Liu, Y.; Summers, M. A.; Edder, C.; Fr�echet, J. M. J.;McGehee, M. D. Adv. Mater. 2005, 17, 2960–2964. (b) Liu, X.; Zhu,R.; Zhang, Y.; Liu, B.; Ramakrishna, S. Chem. Commun. 2008, 37893791. (c) Lohwasser, R. H.; Bandara, J.; Thelakkat, M. J. Mater. Chem.2009, 19, 4126–4130. (d) Fang, Z.; Eshbaugh, A. A.; Schanze, K. S. J. Am.Chem. Soc. 2011, 133, 3063–3069. (e) Wang, M.; Wang, X. Sol. EnergyMater. Sol. Cells 2007, 91, 1782–1787. (f) Liu, Y.; Scully, S. R.;McGehee,M. D.; Liu, J.; Luscombe, C. K.; Fr�echet, J. M. J.; Shaheen, S. E.; Ginley,D. S. J. Phys. Chem. B 2006, 110, 3257–3261. (g) Kim, Y.-G.; Walker, J.;Samuelson, L. A.; Kumar, J.Nano Lett. 2003, 3, 523–525. (h) Senadeera,G. K. R.; Nakamura, K.; Kitamura, T.; Wada, Y.; Yanagida, S. Appl. Phys.Lett. 2003, 83, 5470–5472. (i) Mwaura, J. K.; Zhao, X.; Jiang, H.;Schanze, K. S.; Reynolds, J. R. Chem. Mater. 2006, 18, 6109–6111. (j)Senadeera, G. K. R.; Kitamura, T.; Wada, Y.; Yanagida, S. Sol. EnergyMater. Sol. Cells 2005, 88, 315–322. (k) Coakley, K.M.;McGehee,M. D.Appl. Phys. Lett. 2003, 83, 3380–3382. (l) Zhang, W.; Fang, Z.; Su, M.;Saeys, M.; Liu, B.Macromol. Rapid Commun. 2009, 30, 1533–1537. (m)Liu, J.; Kadnikova, E. N.; Liu, Y.; McGehee, M. D.; Fr�echet, J. M. J. J. Am.Chem. Soc. 2004, 126, 9486–9487.
(8) (a) An, B.-K.; Hu, W.; Burn, P. L.; Meredith, P. J. Phys. Chem. C2010, 114, 17964–17974. (b) Mosurkal, R.; He, J.-A.; Yang, K.;Samuelson, L. A.; Kumar, J. J. Photochem. Photobiol., A 2004, 168, 191196. (c) Rice, C. R.;Ward,M. D.; Nazeeruddin, M. K.; Gr€atzel, M.New J.Chem. 2000, 24, 651–652.
(9) Wang, Z.-S.; Li, F.-Y.; Huang, C.-H.Chem. Commun. 2000, 20632064.(10) Brennan, B. J.; Keirstead, A. E.; Liddell, P. A.; Vail, S. A.; Moore,
T. A.; Moore, A. L.; Gust, D. Nanotechnology 2009, 20, 505203.(11) (a) Park, H.; Bae, E.; Lee, J.-J.; Park, J.; Choi, W. J. Phys. Chem. B
2006, 110, 8740–8749. (b) Pechy, P.; Rotzinger, F. P.; Nazeeruddin,M. K.; Kohle, O.; Zakeeruddin, S. M.; Humphry-Baker, R.; Gr€aetzel, M.J. Chem. Soc., Chem. Commun. 1995, 65–66.
(12) Krebs, F. C.; Senkovskyy, V.; Kiriy, A. IEEE J. Sel. Top. QuantumElectron. 2010, 16, 1821–1826.
(13) (a) Jiang, H.; Zhao, X.; Shelton, A. H.; Lee, S. H.; Reynolds,J. R.; Schanze, K. S. ACS Appl. Mater. Interfaces 2009, 1, 381–387. (b)Yanagida, S.; Senadeera, G. K. R.; Nakamura, K.; Kitamura, T.; Wada, Y.J. Photochem. Photobiol., A 2004, 166, 75–80.
(14) Loewe, R. S.; Khersonsky, S. M.;McCullough, R. D.Adv. Mater.1999, 11, 250–253.
(15) (a) Iovu, M. C.; Sheina, E. E.; Gil, R. R.; McCullough, R. D.Macromolecules 2005, 38, 8649–8656. (b) Lohwasser, R. H.; Thelakkat,M. Macromolecules 2011, 44, 3388–339710.1021/ma200119s.
2041 dx.doi.org/10.1021/am200262w |ACS Appl. Mater. Interfaces 2011, 3, 2031–2041
ACS Applied Materials & Interfaces RESEARCH ARTICLE
(16) Mishra, A.; Fischer, M. K. R.; B€auerle, P. Angew. Chem., Int. Ed.2009, 48, 2474–2499.(17) (a) Jeffries-EL, M.; Sauv�e, G.; McCullough, R. D. Adv. Mater.
2004, 16, 1017–1019. (b) Jeffries-EL, M.; Sauv�e, G.; McCullough, R. D.Macromolecules 2005, 38, 10346–10352. (c) Liu, J.; McCullough, R. D.Macromolecules 2002, 35, 9882–9889.(18) McCullough, R. D. Adv. Mater. 1998, 10, 93–116.(19) Surin, M.; Coulembier, O.; Tran, K.; Winter, J. D.; Lecl�ere, P.;
Gerbaux, P.; Lazzaroni, R.; Dubois, P. Org. Electron 2010, 11, 767–774.(20) Li, Y.; Cao, Y.; Gao, J.; Wang, D.; Yu, G.; Heeger, A. J. Synth.
Met. 1999, 99, 243–248.(21) Satapathi, S.; Yan, F.; Anandakathir, R.; Yang, K.; Li, L.;
Mosurkal, R.; Samuelson, L. A.; Kumar, J. J. Macromol. Sci., Part A: PureAppl. Chem. 2010, 47, 1180–1183.(22) Xu, W.; Pei, J.; Shi, J.; Peng, S.; Chen, J. J. Power Sources 2008,
183, 792–798.(23) Chen, T.-A.; Wu, X.; Rieke, R. D. J. Am. Chem. Soc. 1995,
117, 233–244.(24) Holdcroft, S. J. Polym. Sci., Part B: Polym. Phys. 1991,
29, 1585–1588.