end of cycle report 21 - at the heart of connecting people
TRANSCRIPT

End of Cycle Report
UCAS Analysis and ResearchDecember 2016
2016
Security marking: PUBLIC Page 2 of 142
Document owner: UCAS Analysis & Research 15 December 2016
Foreword This is our seventh End of Cycle Report and my last as Chief Executive of UCAS. Our
unique, centralised admissions service in the UK provides a rich data resource and
we have made it a pillar of the work of the charity to use this to create deep insights
into progression, participation, and equalities in higher education admissions. This
year’s report covers in depth some of the key issues for students and higher
education. It is supported by new, powerful, interactive data explorers for
investigating equality of access, and hundreds of data sets describing our system,
adding to the millions of freely available data points we have on our website.
I doubt whether there has been a period in higher education where timely expert
insight has been more important, as the experience of students and the shape of the
sector has changed and changed again. This year, our analysis tracks the sector as it
enters what we think will be several years of overall flat demand for undergraduate
education, driven by demographic changes in the young population in the UK, and
perhaps strong headwinds for demand from the EU and international students.
Two topics stand out for me over the period. The first is how the experience of
students has changed, particularly for those in England, where the combination of
higher fees and the removal of central controls on recruitment numbers have
changed the relationship between students and universities. Many universities have
responded to this new environment of flat demand and competitive recruitment by
broadening their intake and, more often than not, recruiting students whose grades
would not, in the past, have attracted an offer.
When I took over at UCAS in 2010, students chased places – now the places chase
them. Students and their advisers are still adjusting to this new world: almost two
thirds of students with some A level grade profiles get five out of five offers. While
this might feel good for students, it almost certainly suggests they are not being
ambitious enough in the universities or subjects they are choosing. My advice to
students (and their parents) is to use one of their five choices for a stretching course
they would love to do, and prepare to be surprised with an offer. The evidence
suggests that an attractive and stretching offer can act as its own spur to higher
achievement.
But for me, the second and most important set of findings over the period, and this
year, is that of equality and what the findings say about unrealised potential among
young people. The way UCAS measures equality has evolved, and we’ve gone from
raw numbers to entry rates that take account of the population, then expanded the
range of equality groups we can measure. Last year, we introduced a new approach
to measuring equality, and with some further developments this year, we’ve put it at
the centre of our reporting of these trends, and for good reason. By conflating the
effect of many different dimensions of equality simultaneously, we now have a more
complete picture of differences in entry to university than ever before.

Security marking: PUBLIC Page 3 of 142
Document owner: UCAS Analysis & Research 15 December 2016
There is much to celebrate in improvements to access over the last decade. Those
young people with combinations of background characteristics associated with the
lowest entry rates to higher education are over 70 per cent more likely to enter
university today than they were in 2006. This central trend is reflected in several
different ways. Ten years ago, there were almost 200 parliamentary constituencies
where going to university was so unusual that fewer than one in five children did so.
Today, only around 20 constituencies are in that category. Children living in the
lowest income families are more likely than ever to enter higher education, 80 per
cent more than a decade ago. Ten years ago, children in the Black ethnic group had
the lowest chance of going to university – today, they are 80 per cent more likely to
go to university, and more likely to go than young people on average.
It is right to proclaim these achievements. But something different stands out for
me. So great were the differences in entry to higher education a decade ago that
even these significant increases take us to a point of still unacceptable inequality of
access. Simply because of combinations of characteristics such as income, sex, ethnic
group, and where they live, some young people are four times more likely to enter
higher education than others in their peer group. When we consider those
universities with the highest entry requirements, that differential is more like ten
times, meaning some universities are seemingly out of reach for great swathes of the
population, by accident of birth.
Young people who come from poor families, or are men, or in the White ethnic
group have no less intrinsic potential to benefit from higher education than their
peers. And that makes me reflect on the huge waste of potential these current
inequalities imply. Of that fifth of the young population with the poorest access to
university, just 14,500 go to university each year – only around 6,000 more than a
decade ago. But if they have the same intrinsic potential to go as others in the
population, this means a further 40,000 each year are left out. If the next ten years
are like the last, we will still be around 34,000 short. And the most troubling result in
the report this year is that even that estimate might be optimistic. In the past two
application cycles, there has been no improvement in our overall measure of relative
equality at all. If this doesn’t change, we will be no further forward in a decade’s
time than we are today.
Most would agree they want things to get better, and quickly. How to do it is more
difficult. Our own research has demonstrated that almost all of these differences can
be tied back to levels of attainment, and that the admissions process itself is ‘fair’ in
that it gives similar outcomes to people with similar grades, regardless of their
background.
But my view is that these differences are now so wide, and the waste of potential
they imply so great, that a new approach and determination is needed. The most
important of these is to follow and act on what the data and evidence tell us. Too
much of the differences that exist today have been driven by groups that have been

Security marking: PUBLIC Page 4 of 142
Document owner: UCAS Analysis & Research 15 December 2016
left behind, as entry rates have increased, and are seemingly overlooked by outreach
activities.
A good example is the difference between men and women. We report that this has
reached record levels this year, with 36.8 per cent of UK young women entering
higher education compared to 27.2 per cent of men, a record gap of 9.6 percentage
points. Three quarters of the lowest entry rate fifth of the population is male. I’ve
encountered many arguments as to why this doesn’t merit concerted action, but
remain unconvinced. For example, it isn’t true that men are over-represented at top
universities. Women are now 32 per cent more likely than men to enter higher tariff
universities, up from 28 per cent just a year ago.
Perhaps the most common argument is that the gap between men and women is
small compared to that between rich and poor. This was arguably true ten or fifteen
years ago, but not today. Our analysis demonstrates that, once population shares
are adjusted for, the difference between men and women is now more or less the
same as the difference between rich and poor. So if you are concerned about
differences by income background, you should be concerned about sex too. Once we
use data to target our attention to those groups where there is the greatest return
on reducing differences, we will begin to see inequality fall.
It remains my view that these worrying inequalities cannot be tackled by the higher
education community on its own. It is clear that improvements in GCSE attainment
are the biggest drivers of better access to higher education, and driving up GCSE
attainment in key groups that are under-represented in HE means intervening at Key
Stage 2 and Key Stage 3, where the foundations for later achievement are built.
Working with primary and secondary educators and the many charities and social
enterprises that support children who are struggling with early education, is surely
the way forward for the higher education sector to make a step change in access.
This suggests a major collaborative initiative across multiple phases of education,
implying a decade or more before we start seeing significant results. But with the
new story told by the data in this report, I believe it is one that should start now.
Mary Curnock Cook
Chief Executive
Security marking: PUBLIC Page 5 of 142
Document owner: UCAS Analysis & Research 15 December 2016
Notes to the report
Population estimates
The population estimates used for the entry rates in this report are based on the
most recent mid-year estimates and national population projections published by
the Office for National Statistics, which have been revised following the 2011 census.
These are updated from the population estimates used for similar reporting in
previous years. The revised population estimates are higher for the young age group,
resulting in lower entry rates. The key elements of the trends in entry rates as
previously reported are generally unaltered by the new estimates.
Scotland
UCAS covers the overwhelming majority of full-time undergraduate provision for
people living in England, Wales, and Northern Ireland, so the statistics on
acceptances or entry rates can be taken as being very close to all recruitment to full-
time undergraduate higher education. In Scotland, there is a substantial section of
higher education provision that is not included in UCAS' figures. This is mostly full-
time higher education provided in further education colleges, which represents
around one third of young full-time undergraduate study in Scotland, and this
proportion varies by geography and background within Scotland. Accordingly, figures
on entry rates or total recruitment in Scotland reflect only the part of full-time
undergraduate study that uses UCAS.
In 2014, there were fewer very late acceptances than in other cycles recorded in the
UCAS data for some Scottish providers. These changes may mean that the number of
applicants and acceptances to Scottish UCAS providers in 2014 recorded through
UCAS could be understated by up to 2,000, compared to how applicants and
acceptances have been reported in recent cycles. This means that comparing 2014
applicants and acceptances for Scottish providers (or those from Scotland) to other
cycles may not give an accurate measure of change.
In 2015, around 120 courses at Scottish providers which were previously part of the
UCAS Teacher Training scheme, moved into the UCAS Undergraduate scheme. As
such, the number of applicants and acceptances to Scottish providers in 2015
recorded through UCAS will include those which were previously part of UCAS
Teacher Training, meaning that comparing 2015 applicants and acceptances for
Scottish providers (or those from Scotland, particularly those aged 21 or over) to
previous cycles may not give a like-for-like measure of change.

Security marking: PUBLIC Page 6 of 142
Document owner: UCAS Analysis & Research 15 December 2016
Contents
Section 1 – Key findings ...................................................................................... 13
Applicants, acceptances, and admission routes ................................................... 14
Applicant numbers unchanged in 2016, but higher acceptance rates mean a
record 535,200 are placed in higher education through UCAS, up by half a per
cent .......................................................................................................................... 14
Applicants placed at their firm ‘first’ choice continue to increase ......................... 14
Applicants placed through Clearing increase to highest number on record .......... 14
Country and age.................................................................................................. 14
More applicants from the UK placed than ever before. Increases from 18 and 19
year olds offset falls from older students to take total to record 465,500 ............ 14
Acceptances from Scotland and Northern Ireland increase to record levels ......... 15
Acceptances from the EU increase by 7.0 per cent to 31,400 in 2016, the highest
on record ................................................................................................................. 15
Acceptances from outside the EU fall for the first time since 2011, by 2.3 per cent
to 38,300 ................................................................................................................. 16
Increases in total acceptances to providers in Northern Ireland, Scotland, and
Wales increase by 2 to 3 per cent. English providers have similar recruitment as
last year ................................................................................................................... 16
Entry rates for young people ............................................................................... 16
Strong increases in 18 year old entry rates across the UK. Young people in
England, Scotland, and Wales more likely to enter higher education than ever
before ...................................................................................................................... 16
In England, 43 per cent of the young population enter higher education by age 19,
the highest ever level, but first time 19 year old entry rates in England decrease 17
Differences in young entry rates to higher education between groups ................. 18
Combining different background characteristics into a single measure gives fullest
measure of differences in entry rates for England ................................................. 18
For the fifth of the English population with the lowest entry rates, 13.6 per cent
entered higher education in 2016, an increase of 0.1 percentage points .............. 18
For the fifth of the English population with the highest entry rates, 52.1 per cent
entered higher education in 2016, an increase of 1.2 percentage points .............. 18
No material change in the overall equality of entry to higher education in
England .................................................................................................................... 19
Security marking: PUBLIC Page 7 of 142
Document owner: UCAS Analysis & Research 15 December 2016
Entry rates to higher tariff providers show a ten-fold difference between the
highest and lowest entering fifths of the English population ................................. 19
Entry rates for lower income young people in England increase to record level,
but rate of increase slows and the difference to other young people increases ... 20
The entry rate for the White ethnic group increases but remains lower than for
other ethnic groups ................................................................................................. 21
Difference in entry rates between women and men at record levels, as women
become 32 per cent more likely than men to enter higher tariff providers .......... 21
Entry rates increase in all regions of England, but large differences persist .......... 22
Parliamentary constituencies where one in five or fewer enters higher education
have fallen in number by almost 90 per cent since 2006 ....................................... 22
Young people living in wards with low participation rates (POLAR) become more
likely than ever to enter higher education in England and Wales .......................... 23
Young people living in areas of higher deprivation in Scotland (SIMD quintile 1)
are 12 per cent more likely to enter higher education through UCAS than last
year .......................................................................................................................... 23
Offer-making ...................................................................................................... 23
Number of offers made by providers continues to grow, exceeding 1.9 million in
2016, but rate of growth is slowing ........................................................................ 23
More main scheme applicants receive multiple offers, half have four or more, a
third have five ......................................................................................................... 23
Offer rates increase for all age groups, except those aged over 25 ....................... 24
English providers increase offer rates to UK applicants ......................................... 24
Qualifications and provider groups ..................................................................... 24
Entry rate for 18 year olds holding BTECs as their main qualification falls ............ 24
More applicants placed at higher and medium tariff providers, but the number
placed at lower tariff providers falls ....................................................................... 25
Proportion of acceptances with higher grades at A level continues to fall at higher
tariff providers......................................................................................................... 25
Medium tariff providers recruit more lower grade A level students, while lower
tariff providers recruit fewer .................................................................................. 25
Section 2 – Analytical overview ........................................................................... 27
Applicants ........................................................................................................... 28
Applicant numbers unchanged in 2016 but differing trends by domicile .............. 28
Acceptances ........................................................................................................ 29

Security marking: PUBLIC Page 8 of 142
Document owner: UCAS Analysis & Research 15 December 2016
UK domiciled acceptances increase to a record number in the 2016 cycle ........... 29
Acceptances from other countries in the EU increase 7 per cent in 2016 ............. 29
Acceptances from outside the EU decrease for the first time since 2011 ............. 29
Acceptances from UK domiciled 18 and 19 year olds increase to record levels, but
fall in older age groups ............................................................................................ 30
Acceptances from England remain unchanged, but increase in the rest of the
UK ............................................................................................................................ 32
Acceptances to higher education providers in all UK countries increase, with
largest increase for providers in Scotland ............................................................... 34
Acceptances continue to increase at higher and medium tariff providers, but
lower tariff providers experience first fall since 2012 ............................................ 36
Acceptance rates ................................................................................................ 37
Acceptance rate increased in 2016, as acceptances increased at a greater rate
than number of applicants ...................................................................................... 37
Acceptance rate for UK main scheme applicants at highest since 2009 ................ 38
Acceptance rates continue to increase for UK and EU students, while acceptance
rates for students from outside of the EU fall ........................................................ 39
Acceptance rates increase for UK 18 to 25 year olds ............................................. 40
Acceptance rates for 18 year olds increase for all UK domiciles, and reach new
highs in England and Wales ..................................................................................... 41
Entry rates for 18 and 19 year olds from the UK .................................................. 42
18 year olds in England, Scotland, and Wales were more likely to enter higher
education in the 2016 cycle than any previous year .............................................. 42
19 year old entry rates increase to new highs in Northern Ireland, Scotland, and
Wales, but decrease in England .............................................................................. 44
Cohort entry rates for young people reach highs across England, Wales, and
Scotland ................................................................................................................... 46
Entry rates by region ............................................................................................... 47
Entry rates highest in Northern Ireland and London in 2016 ................................. 48
Entry rates increase in all regions of England ......................................................... 49
London and Yorkshire and the Humber show largest increases in 18 year old entry
rates between 2006 and 2016 ................................................................................ 49
Entry rates by parliamentary constituency .......................................................... 50
Entry rates of 18 year olds vary across constituencies from 14 per cent to 63 per
cent .......................................................................................................................... 50
Security marking: PUBLIC Page 9 of 142
Document owner: UCAS Analysis & Research 15 December 2016
Wide range of changes in entry rates between 2006 and 2016 ............................. 52
Acceptances and entry rates from Europe ........................................................... 54
Changes in acceptances vary across European countries ....................................... 54
Entry rates vary across European countries ........................................................... 57
Number of acceptances from European countries varies by GDP.......................... 58
Acceptances to higher tariff providers increase again to new highs for all GDP EU
country groups ........................................................................................................ 60
Acceptances to medium and lower tariff providers from higher GDP countries fall
in 2016, but increase for other countries ............................................................... 61
Offer-making to main scheme applicants in 2016 ................................................ 63
Offers made in 2016 increase by 1.2 per cent to over 1.9 million, highest recorded
total ......................................................................................................................... 63
Offers made to all applicants who make a full set of choices increase by 1 per cent
to almost 1.7 million, the highest level recorded ................................................... 64
Over half of applicants receive four or more offers and almost a third have five
offers to choose between ....................................................................................... 65
Offer rates for young applicants increase in 2016 to new highs ............................ 66
Offer rates to applicants aged between 20 and 25 increase in 2016, but fall for
older applicants ....................................................................................................... 66
Offer-making by providers .................................................................................. 67
English providers more likely than ever to make offers to UK 18 year olds, offer
rates from Scottish and Northern Irish providers continue to decrease ................ 67
English providers increase offer rates to 18 year olds from England, Northern
Ireland, and Wales .................................................................................................. 69
Providers in Wales increase offer-making to Welsh applications .......................... 70
Offer rates by Scottish providers to 18 year old applicants from England and
Northern Ireland at record level ............................................................................. 71
Small increase in offer rates for most predicted A level grade profiles in 2016 .... 72
Across a wide range of predicted grade profiles, over 98 per cent of young
applicants who made five choices received an offer .............................................. 73
Between one and two thirds of applicants receive five offers, depending on
predicted grades ..................................................................................................... 74
Acceptance routes .............................................................................................. 75
Record numbers accepted through firm choice ..................................................... 75
Security marking: PUBLIC Page 10 of 142
Document owner: UCAS Analysis & Research 15 December 2016
Number accepted through insurance choice and Extra unchanged in 2016 .......... 75
Record number accepted through Clearing (from direct and main scheme) ......... 75
Number accepted through Adjustment continues to fall ....................................... 76
UK 18 year olds: record numbers of firm and main scheme Clearing accepts ....... 76
Entry rates by background .................................................................................. 78
Combining multiple equality dimensions into a single equality measure .............. 78
Entry rates for each MEM group increase to highest recorded values in 2016, but
smallest increase for the most disadvantaged group ............................................. 79
Entry rate ratio for the most advantaged to most disadvantaged multiple equality
measure groups has remained stable since 2014 ................................................... 81
Entry rates to higher tariff providers for those least likely to enter HE are 57 per
cent higher than ten years ago ............................................................................... 82
Entry rates to medium tariff providers increase in 2016 across all multiple equality
measure groups ....................................................................................................... 84
Entry rates to lower tariff providers fall across all multiple equality measure
groups for the first time since 2012 ........................................................................ 85
Entry rates for single equality dimensions .............................................................. 86
18 year old women over a third more likely to enter higher education than men 86
By age 19, 47 per cent of women have entered higher education, over 11
percentage points higher than men........................................................................ 88
Women becoming substantially more likely to enter higher tariff providers than
men.......................................................................................................................... 90
Entry rates for disadvantaged 18 year olds increase in all UK countries ................ 92
Entry rates for disadvantaged 18 year olds increase by nearly a third in five years
in England, and by nearly three quarters since 2006 ............................................. 92
Entry rates for advantaged 18 year olds at similar levels to recent cycles ............. 92
Entry rate differences by background unchanged in all UK countries ................... 95
Highest recorded entry rates for English 18 year olds from all backgrounds ........ 96
Cohort entry rates increase to new highs for young people from disadvantaged
backgrounds ............................................................................................................ 97
Entry rates to all types of provider increase for disadvantaged English 18 year
olds .......................................................................................................................... 99
Entry rates to higher tariff providers by background span wide range .................. 99
Entry rates to medium tariff providers increase from all backgrounds in 2016 ... 101
Security marking: PUBLIC Page 11 of 142
Document owner: UCAS Analysis & Research 15 December 2016
Small and reducing difference in entry rates to lower tariff providers by
background ............................................................................................................ 102
Entry rate for Scottish 18 year olds from the most deprived areas (SIMD) 51 per
cent higher than in 2006 ....................................................................................... 103
Entry rates by income background and ethnic group for state school pupils in
England ............................................................................................................. 105
Entry rates for non-FSM pupils increase five times faster than FSM pupils in 2016,
but both reach new highs ..................................................................................... 105
Entry rates to lower tariff providers fall for FSM and non-FSM pupils in 2016 .... 107
Entry rates increase for all ethnic groups, but large differences persist .............. 109
Large differences in entry rates by ethnic group for English pupils accepted to
higher tariff providers ........................................................................................... 111
Entry rates to medium tariff providers at record high for all ethnic groups ........ 113
Entry rates to lower tariff providers highest for the Asian ethnic group, lowest for
the White ethnic group ......................................................................................... 114
Differences in entry rates by sex and ethnic group account for a large and
increasing proportion of the entry rate gap between areas ................................ 116
Qualifications held by applicants ........................................................................ 121
One fifth of the 18 year old population in the UK entered with A levels as their
main qualification .................................................................................................. 121
Entry rate for UK 18 year olds holding BTECs as their main qualification falls ..... 121
Entry rates for young people holding a combination of A levels and BTECs
continues to increase ............................................................................................ 122
Entry rates to higher education through UCAS for those holding SQA qualifications
increase to a new high .......................................................................................... 122
Relatively few young people enter higher education holding the International
Baccalaureate ........................................................................................................ 122
Acceptance rates for applicants increase for all qualification groups .................. 123
Increase in acceptance rate for applicants holding both A levels and BTECs, and
remains higher than for the BTEC only group ....................................................... 123
Despite increase in 2016, acceptance rate for applicants holding SQAs remains
lower than for any other qualification group ....................................................... 124
Acceptance rate for applicants holding the IB second highest only to A level
group ..................................................................................................................... 124
Proportion of 18 year olds with ABB+ falls in 2016 for all tariff groups ............... 125
Security marking: PUBLIC Page 12 of 142
Document owner: UCAS Analysis & Research 15 December 2016
Proportion of acceptances that are ABB+ through A levels continues to fall for
higher and medium tariff providers, lowest proportion on record for medium
tariff providers....................................................................................................... 127
Proportion of 18 year old ABB+ students who have BTECs doubles between 2008
and 2016 ................................................................................................................ 128
Proportion of acceptances holding higher grades at BTEC decrease for lower and
medium tariff providers for the first time ............................................................ 128
Acceptance rates to higher tariff providers unchanged in 2016 for all grade
profiles, largest changes for applicants with lower grades to medium and lower
tariff providers....................................................................................................... 130
Acceptances holding A levels remain stable for higher tariff providers in England,
increase at medium tariff providers, and fall at lower tariff providers ................ 131
Acceptance rates to medium tariff providers increase for applicants holding BTECs
in 2016, but fall for lower tariff providers ............................................................ 132
BTEC acceptances to higher and medium tariff providers up, but fall at lower tariff
providers ............................................................................................................... 134
Recruitment changes for providers ..................................................................... 135
Acceptances in 2016 increase for the majority of higher and medium tariff
providers ............................................................................................................... 135
Most providers that had decreases in acceptances between 2012 and 2015, and
again in 2016, are lower tariff ............................................................................... 135
Changes in recruitment in 2016 only unrelated to share of intake holding
BTECs ..................................................................................................................... 136
Section 3 – Glossary ........................................................................................... 138

Section 1Key findings

Security marking: PUBLIC Page 14 of 142
Document owner: UCAS Analysis & Research 15 December 2016
Applicants, acceptances, and admission routes
Applicant numbers unchanged in 2016, but higher acceptance rates mean a record
535,200 are placed in higher education through UCAS, up by half a per cent There were 718,400 applicants in 2016, almost the same (100 fewer) than in 2015.
In the 2016 cycle, 535,200 applicants were placed in higher education through UCAS
(‘acceptances’). There were 2,900 more applicants placed in 2016 than in 2015, an
increase of 0.5 per cent.
The increase in acceptances in 2016 is a result of an increase in the proportion of
applicants who are placed (the ‘acceptance rate’). This increased by 0.4 percentage
points in 2016 to 74.5 per cent.
Applicants placed at their firm ‘first’ choice continue to increase
The majority of applicants are placed at the offer they set as their firm choice. In
2016, 386,300 applicants were placed at their firm choice, an increase of 2,200 (0.6
per cent) from 2015, and the highest number ever placed by UCAS through this
route.
After increasing over recent cycles, the number of applicants placed through their
insurance choice remained constant in 2016, at 39,500.
Applicants placed through Clearing increase to highest number on record
In 2016, 64,900 applicants were placed through Clearing. This is an increase of 500
(0.8 per cent) on the 2015 cycle, and the highest number ever placed through this
route.
There are two ways applicants can use Clearing. Main scheme applicants who were
placed through the Clearing process increased by 900 (1.8 per cent) to 50,000. This is
the highest number of main scheme applicants placed through this route.
Applicants who apply later and are accepted directly though the Clearing process
decreased by 400 (2.4 per cent) to 14,900.
Country and age
More applicants from the UK placed than ever before. Increases from 18 and 19
year olds offset falls from older students to take total to record 465,500
Acceptances from the UK increased to 465,500 in 2016, an increase of 0.4 per cent
(1,800 acceptances), a smaller increase than has been typical in recent cycles. The
increase in acceptances resulted from an increase in the acceptance rate. Applicants
from the UK fell by 0.3 per cent, the first fall in UK applicants since 2012.
Security marking: PUBLIC Page 15 of 142
Document owner: UCAS Analysis & Research 15 December 2016
All the increase in UK acceptances came from increases in 18 and 19 year olds. The
number of 18 year olds accepted in 2016 increased by 1.5 per cent (3,600
acceptances) to 238,900, the highest number ever placed. The number of 19 year old
acceptances increased by 0.5 per cent (500 acceptances) to 92,200, also the highest
number ever placed from this age group.
Acceptances for older age groups decreased in 2016. The number of students placed
aged between 21 to 25 fell by 2.9 per cent (1,600 acceptances) to 52,000. In total,
acceptances for those aged 20 and over fell by 1.7 per cent (2,300 acceptances).
Acceptances from Scotland and Northern Ireland increase to record levels
There were 394,300 acceptances from England in 2016, unchanged from 2015, and
the first time since 2012 that acceptances from England did not increase.
Applicants placed from Northern Ireland, Scotland, and Wales all increased in 2016.
There were 14,800 applicants placed from Northern Ireland, an increase of 5.3 per
cent (700 acceptances) to the highest number recorded.
Not all HE students from Scotland are placed through UCAS – those who are totalled
35,700 in 2016, an increase of 2.6 per cent (900 acceptances) and the highest
number recorded through UCAS.
There were 20,700 applicants placed from Wales, an increase of 1.0 per cent (200
acceptances) over 2015.
Acceptances from the EU increase by 7.0 per cent to 31,400 in 2016, the highest on
record
In 2016, acceptances from the EU increased by 2,000 (7.0 per cent) to 31,400, a
similar rate of increase as in recent years. This higher number of EU acceptances is
due to an increase in the number of EU applicants (5.6 per cent to 53,600), and an
increase in the proportion of those applicants being placed (the acceptance rate
increased by 0.7 percentage points to 58.5 per cent, the highest level since 2009).
There are wide variations across Europe in both the numbers of acceptances and the
change in 2016. Of countries recording a larger number of acceptances, there were
above average increases from Poland (+27 per cent), Germany (+21 per cent), Spain
(+18 per cent), and Bulgaria (+9 per cent). There were over 1,000 acceptances from
each of these countries in 2016.
Over the last ten years, the strongest growth in acceptances from the EU has come
from countries with lower levels of GDP per capita. Since 2006, the number of
acceptances from these countries has tripled to reach 8,900 in 2016. Acceptances
from EU countries with higher, medium, and lower levels of GDP per capita all
increased in 2016 at a similar rate as in recent years.
Security marking: PUBLIC Page 16 of 142
Document owner: UCAS Analysis & Research 15 December 2016
Acceptances from outside the EU fall for the first time since 2011, by 2.3 per cent
to 38,300
In 2016, the number of acceptances from non-EU countries fell by 2.3 per cent (900
acceptances) to 38,300. This is the first time acceptances from non-EU countries
have fallen since 2011.
This fall in numbers was the result of both a decrease in the number of applicants,
which decreased by 1.9 per cent (1,500 applicants) to 74,300 in 2016, and a decrease
in the acceptance rate, which fell by 0.2 percentage points to 51.6 per cent, the
lowest recorded value. The acceptance rate of non-EU applicants is relatively low
compared to the acceptance rates for EU and UK applicants.
Increases in total acceptances to providers in Northern Ireland, Scotland, and
Wales increase by 2 to 3 per cent. English providers have similar recruitment as last
year
Acceptances to English providers were similar to last year, increasing by 0.1 per cent
(500 acceptances) to 450,500.
Not all HE providers in Scotland recruit through UCAS. Providers in Scotland who
recruit through UCAS increased their acceptances by 3.2 per cent (1,500
acceptances) in 2016 to 47,900, the highest on record.
Welsh providers had 26,300 acceptances (+2.3 per cent, +600 acceptances), and
providers in Northern Ireland had 10,400 acceptances (+2.8 per cent, +300
acceptances).
Entry rates for young people
The number of UK 18 year olds placed by UCAS is a product of both the size of the
population and the proportion of 18 year olds in the population who are placed (the
‘entry rate’). For the 2016 cycle, the number of 18 year olds (aligned to school
cohorts) was estimated to have decreased by 2.1 per cent in England, 1.5 per cent in
Northern Ireland, 2.2 per cent in Scotland, and 3.6 per cent in Wales.
Entry rates report the proportion of the population that enters higher education,
and by taking changes in population size into account, give a better indication than
overall numbers of the trends in the chances of entering higher education.
Strong increases in 18 year old entry rates across the UK. Young people in England,
Scotland, and Wales more likely to enter higher education than ever before
The proportion of the English 18 year old population who entered higher education
through UCAS increased by 1.2 percentage points to 32.5 per cent, the highest
recorded entry rate for England. This increase means young people were 4 per cent
more likely to enter higher education than in 2015, and 31 per cent more likely to
enter than in 2006. Entry rates for England have increased every year since 2012.
Security marking: PUBLIC Page 17 of 142
Document owner: UCAS Analysis & Research 15 December 2016
Entry rates for 18 year olds living in Northern Ireland are higher than elsewhere in
the UK at 34.8 per cent. In 2016, the entry rate increased by 1.4 percentage points (4
per cent proportionally), reversing the fall in entry rate in 2015.
In Scotland, entry rates for 18 year olds recorded through UCAS are lower than for
other countries, but not all higher education provision in colleges in Scotland is
recruited for through UCAS. In 2016, the entry rate was 25.3 per cent, an increase of
0.8 percentage points (3 per cent proportionally) and the highest on record.
In Wales, 29.5 per cent of 18 year olds were placed through UCAS into higher
education in 2016, an increase of 1.3 percentage points (4 per cent proportionally).
This is the highest entry rate recorded for Wales, and is the fifth consecutive cycle in
which entry rates have increased.
In England, 43 per cent of the young population enter higher education by age 19,
the highest ever level, but first time 19 year old entry rates in England decrease
In England, 11.1 per cent of 19 year olds in the population were placed in higher
education through UCAS for the first time in 2016. This is 0.4 percentage points
lower than in 2015, and is the first time (with the exception of 2012 when higher
tuition fees were introduced) that the proportion has fallen.
This fall is from the same cohort of young people whose entry at age 18 in 2015
increased by 0.9 percentage points to 31.3 per cent. This increase in the entry rate at
age 18 last year meant that, despite the fall in first time entry aged 19 this year, the
proportion of the cohort that entered higher education by age 19 still increased, by
0.5 percentage points. Although this was a smaller increase in the rate compared to
the last two cycles, the entry rate by age 19 was the highest on record at 42.5 per
cent.
The proportion of young people who enter higher education by the time they are
age 19 also increased in Wales by 1.3 percentage points to 37.5 per cent, the highest
ever recorded in Wales. In Northern Ireland, the entry rate by age 19 also increased
by 0.2 percentage points to 43.1 per cent.
Not all young people in Scotland enter higher education through UCAS. The
proportion of the young population who are recorded as entering by age 19
increased by 1.2 percentage points in 2016, to 31.8 per cent. This is the largest
annual increase recorded for Scottish young people since 2009, and takes the entry
rate to its highest measured value.
Security marking: PUBLIC Page 18 of 142
Document owner: UCAS Analysis & Research 15 December 2016
Differences in young entry rates to higher education between groups
Combining different background characteristics into a single measure gives fullest
measure of differences in entry rates for England
The UCAS Undergraduate 2015 End of Cycle Report demonstrated that entry rates
for 18 year olds differed substantially, not just across characteristics such as income
background or ethnic group, but also the intersections of these different
characteristics. The fullest picture of differences in entry to higher education is given
by considering a range of equality characteristics simultaneously through statistical
methods. An expanded multiple equality dimension measure, considering area and
income background, school sector, sex, and ethnic group combined, is used to report
on levels and trends of differences in entry to higher education.
For the fifth of the English population with the lowest entry rates, 13.6 per cent
entered higher education in 2016, an increase of 0.1 percentage points
The multiple equality measure (MEM) group 1 contains those groups in the young
English population that have the lowest entry rates in higher education across a
combination of population characteristics. The young population the statistical
methods identify as being in this group are predominantly men and attended schools
in the state sector, where they were recorded as being in the White ethnic group,
coming from a low income family, and living in a neighbourhood with lower HE entry
rates.
The entry rate to higher education for MEM group 1 in 2016 was 13.6 per cent. This
is an increase of 0.1 percentage points from last year, making young people in this
group around 1 per cent more likely to enter higher education.
The entry rate of young people in this group has increased every year, from 7.8 per
cent in 2006 to 13.6 per cent in 2016, an increase of 5.8 percentage points, meaning
they were 74 per cent more likely to enter in 2016 than a decade previously.
The annual increase in the entry rate in 2015 and 2016 has been lower than the
recent trend. In 2015, this was related to lower rates of increase from men and the
White ethnic group, and in 2016, it is related to lower rates of increase from young
people from lower income backgrounds.
For the fifth of the English population with the highest entry rates, 52.1 per cent
entered higher education in 2016, an increase of 1.2 percentage points
The multiple equality measure (MEM) group 5 contains those groups in the young
English population that have the highest entry rates in higher education across a
combination of population characteristics. The young people in this group are
typically women, attended an independent school or were at a state school, and are
living in a high entry rate neighbourhood, not from a lower income background, and
were in the Asian and Chinese ethnic groups.
Security marking: PUBLIC Page 19 of 142
Document owner: UCAS Analysis & Research 15 December 2016
The entry rate to higher education for group 5 in 2016 was 52.1 per cent. This is an
increase of 1.2 percentage points from last year, making young people in this group
around 2 per cent more likely to enter higher education.
The entry rate for this group is 5.1 percentage points higher than in 2006 (47.0 per
cent) meaning they have become 11 per cent more likely to enter higher education
over this period. The annual increase in the entry rate in 2015 and 2016 was higher
than the recent trend. In 2015, this was related to higher rates of increase from
women and the Asian ethnic group. In 2016, it is related to higher rates of increase
from women from the White ethnic group and from areas with higher HE entry
rates, and the Asian ethnic group.
No material change in the overall equality of entry to higher education in England
One way to summarise the differences in entry rates across the multiple equality
dimensions is to track the difference between groups one and five, those with the
lowest and highest entry rates. As the overall entry rate to higher education has
been increasing over the past decade, using the ratio of the entry rates between
these groups can be helpful, and directly measures how much more likely group 5 is
to enter HE than group 1.
In 2006, young people in group 5 were 6.0 times more likely to enter than those in
group 1. This ratio then declined to 3.8 times by 2014. Since then, the ratio has not
decreased further. This means that over the past couple of years, there has been no
material change in the overall relative equality of entering higher education.
Entry rates to higher tariff providers show a ten-fold difference between the
highest and lowest entering fifths of the English population
The multiple equality measures identify those groups with the highest and lowest
entry rates to higher education overall. The same groups can also be used to look at
how entry rates to different types of providers, grouped by the typical strength of
qualifications held by their students, vary across these groups.
For 18 year olds in England, the entry rates to higher tariff providers (those
universities and colleges with, on average, the highest qualification levels of
acceptances) show greater differences across backgrounds than the entry rates to
other types of provider.
In 2016, entry rates to these providers range from 2.3 per cent for applicants in the
multiple equality measure group 1, to 24.5 per cent for the applicants in multiple
equality measure group 5.
The entry rate for group 1 has increased from 2.2 per cent in 2015 to 2.3 per cent in
2016, an increase of 0.1 percentage points, meaning these young people have
become 5 per cent more likely to enter higher tariff providers in 2016. Since 2006,
Security marking: PUBLIC Page 20 of 142
Document owner: UCAS Analysis & Research 15 December 2016
the entry rate for group 1 has increased by 57 per cent proportionally, from 1.4 per
cent to 2.3 per cent.
The entry rate to higher tariff providers for young people in group 5 – those
combinations of characteristics that have the highest entry rates – was 24.5 per cent
in 2016, an increase of 0.2 percentage points (1 per cent proportionally).
The increases in the entry rates of both group 1 and five take each group to its
highest recorded level. Young people in group 5 were 10.8 times more likely to enter
higher tariff providers than young people in group 1. This is a reduction in the ratio
from the 2015 cycle (11.2) and substantially less than in 2006 (16.2).
Difference in entry rates to other types of providers are lower. Entry rates to
medium tariff providers in 2016 ranged from 4.4 per cent for group 1, to 15.2 per
cent for group 5, a ratio of 3.5. For lower tariff providers, entry rates by background
are in a comparatively narrow range between 6.9 per cent (group 1) and 13.9 per
cent (group 4).
Entry rates for lower income young people in England increase to record level, but
rate of increase slows and the difference to other young people increases
One of the characteristics included in the multiple equality measure for England is
whether young people come from a lower income background, measured by
whether they were previously in a state school in England and received free school
meals.
Young people in this group became 1.6 per cent more likely to enter higher
education in 2016, with their entry rate increasing by 0.3 percentage points to 16.1
per cent. This group of young people is almost 80 per cent more likely to enter
higher education than they were in 2006, but the increase in the entry rate in 2016 is
less than recent cycles, which have typically seen proportional increases of 7 per
cent each year. Most lower income pupils enter a lower tariff group provider. In
2016, the entry rate of these young people to lower tariff providers decreased.
The entry rate for young people who attended state schools but did not previously
receive free school meals was 32.8 per cent, an increase of 1.4 percentage points,
five times larger than the increase for lower income young people.
These differential entry rate growth rates mean the difference between lower
income and other state school children increased in 2016, both proportionally and in
absolute percentage point terms. The percentage point difference in 2016 was 16.7
percentage points, the highest level recorded.

Security marking: PUBLIC Page 21 of 142
Document owner: UCAS Analysis & Research 15 December 2016
The entry rate for the White ethnic group increases but remains lower than for
other ethnic groups
One of the characteristics included in the multiple equality measure for England is
the ethnic group of young people who are in state schools.
The entry rate for English 18 year olds from state schools increased for all ethnic
groups in 2016.
The entry rates for pupils from most ethnic groups lie in a range from 28.7 per cent
(White ethnic group) to 42.9 per cent (Asian ethnic group). The entry rate for pupils
in the Chinese ethnic group is higher at 57.9 per cent.
The largest increases in entry rates in 2015 were for pupils in the Asian group (+1.9
percentage points to 42.9 per cent) and the Mixed ethnic group (+1.2 percentage
points to 33.0 per cent).
For the ninth consecutive year, the White ethnic group had the lowest entry rate of
any ethnic group, standing at 28.7 per cent in 2016. The gap in entry rates between
the White ethnic group and the Mixed ethnic group, the ethnic group with the
second lowest entry rate, widened to 4.3 percentage points.
Difference in entry rates between women and men at record levels, as women
become 32 per cent more likely than men to enter higher tariff providers
The entry rate for 18 year old women in the UK was 36.8 per cent, 9.6 percentage
points higher than for men (27.2 per cent), the largest points difference recorded.
Young women are 35 per cent (proportionally) more likely to enter than men in
2016.
The difference in 18 year old entry rates between men and women equates to
37,000 fewer 18 year old men entering higher education this year than would be the
case if men had the same entry rate as women.
The difference in entry rates between men and women widens by a further 1.5
percentage points when entry at ages 18 and 19 are considered together.
Young women are more likely to enter all types of higher education provider than
young men. Young women have become increasing more likely relative to men to
enter higher tariff providers. In 2006, they were 18 per cent more likely to enter
higher tariff providers than men, and were 32 per cent more likely than men to enter
higher tariff providers in 2016.
In England, it is possible to compare the entry rate differences between men and
women to differences between equivalently sized population groups formed on an
income-based measure. In 2006, the entry rate differences between men and
women were around half the size of the differences between equivalently sized
income-based groups of young people. Since 2006, the differences between men

Security marking: PUBLIC Page 22 of 142
Document owner: UCAS Analysis & Research 15 December 2016
and women have increased, while the differences between income-based groups
have reduced. In 2016, the differences between men and women are around 90 per
cent of the size of the difference between income-based groups.
Entry rates increase in all regions of England, but large differences persist
The proportion of the 18 year old population that enters higher education varies
across the different regions of England. In 2016, the lowest entry rates were in the
South West (28.2 per cent) and the North East (28.9 per cent). The highest entry rate
was for 18 year olds living in London, where 39.9 per cent entered higher education
in 2016. Young people in London were 38 per cent more likely to enter higher
education than those living in the South West and North East in 2016.
Entry rates increased in all English regions in 2016. The North East, East Midlands,
East of England, and South East had proportional increases of 4 per cent or greater,
larger than the proportional increase for England as a whole. The South West, which
has the lowest entry rate in 2015, had the smallest increase of any region in 2016 – 2
per cent proportionally – widening the difference between the South West and
other regions.
Parliamentary constituencies where one in five or fewer enters higher education
have fallen in number by almost 90 per cent since 2006
The 650 parliamentary constituencies in the UK show a finer grain geography of 18
year old entry rates across the UK, though their relatively small size means their
entry rates can vary by a few percentage points from year to year through random
fluctuations alone.
Parliamentary constituencies show a wider range of entry rates than regions. Most
constituencies (around 80 per cent) have entry rates between 20 and 40 per cent.
However, 22 constituencies have entry rates of lower than 20 per cent, and 40
constituencies have entry rates of 45 per cent or higher.
Many parliamentary consistencies show large increases in entry rates over the past
decade, with young people becoming over 50 per cent more likely to enter higher
education in over 100 constituencies. In 2006, there were 186 constituencies where
one in five or fewer entered higher education. By 2016, that number had fallen to 22
constituencies, a reduction of almost 90 per cent.
In Scotland, not all higher education provided in further education colleges recruits
through UCAS, so UCAS’ university entry rates for Scottish constituencies will be
lower the than entry rate to all higher education.

Security marking: PUBLIC Page 23 of 142
Document owner: UCAS Analysis & Research 15 December 2016
Young people living in wards with low participation rates (POLAR) become more
likely than ever to enter higher education in England and Wales
In England, the entry rate for 18 year olds living in wards with low participation
(POLAR3 quintile 1) increased by 1.0 percentage point (5 per cent proportionally) to
19.5 per cent, the highest level recorded.
Entry rates for this group in England have increased every cycle since 2006, making
POLAR3 quintile 1 young people in England 29 per cent more likely to enter
university in 2016 than four years ago, and 73 per cent more likely to enter higher
education than in 2006.
In Wales, the entry rate for this group increased by 1.6 percentage points (10 per
cent proportionally) to 18.2 per cent, the highest on record, and in Northern Ireland,
it increased by 0.2 percentage points (1 per cent proportionally) to 16.0 per cent,
close to the highest recorded level.
Young people living in areas of higher deprivation in Scotland (SIMD quintile 1) are
12 per cent more likely to enter higher education through UCAS than last year
In Scotland, the entry rate for 18 year olds living in areas of higher deprivation (SIMD
quintile 1) increased by 1.1 percentage points (12 per cent proportionally) to 10.9
per cent, the highest on record. Not all higher education in Scotland recruits
students through UCAS.
Offer-making
Number of offers made by providers continues to grow, exceeding 1.9 million in
2016, but rate of growth is slowing
Providers made over 1.9 million offers to main scheme applicants in 2016, 24,000
(1.2 per cent) more than in 2015, and the fourth consecutive cycle that the number
of offers has increased.
The growth in offer-making is slowing down. The increase in 2016 (24,000 offers) is
only a third of the increase seen in 2015 (78,000 offers), and a quarter of the
increase in 2014 (101,000 offers).
More main scheme applicants receive multiple offers, half have four or more, a
third have five
In 2016, 94 per cent of main scheme applicants who made five choices received at
least one offer, and 57 per cent of these applicants received four or five offers (1
percentage point higher than in 2015). The proportion having the maximum five
offers increased to 33 per cent in 2016, the highest level recorded.
Applicants were 29 per cent more likely to have five offers in 2016 than in 2012, and
54 per cent more likely than in 2011.

Security marking: PUBLIC Page 24 of 142
Document owner: UCAS Analysis & Research 15 December 2016
Offer rates increase for all age groups, except those aged over 25
Offer rates to applications from 18 year olds increased to 76.1 per cent, and for
applications from 19 year olds, the offer rate increased to 67.2 per cent. These are
the highest offer rates to these age groups during the reporting period. There were
also increases in offer rates to applicants aged between 20 and 25, but these remain
below the levels typical in 2008 and 2009.
Offer rates to applicants aged over 25 fell slightly to 35.7 per cent, 0.2 percentage
points lower than in 2015, but slightly higher than in 2014.
English providers increase offer rates to UK applicants
Offer rates from providers to applications from UK 18 year olds vary by provider
country. Offer rates to UK applicants from English providers increased to 78.3 per
cent (0.7 percentage points), offer rates from Welsh providers to UK applications
remained unchanged at 84.4 per cent, and offer rates from Northern Irish providers
fell by 0.8 percentage points to 83.1 per cent.
Offer rates from Scottish providers to UK applicants tend to be lower than offer rates
from providers in other parts of the UK. In 2016, the offer rate from Scottish
providers to UK applicants fell by 0.6 percentage points to 62.0 per cent. Offer rates
from Scottish providers to Scottish applicants fell (by 2.6 per cent proportionally) to
59.6 per cent, while offer rates from Scottish providers to English and Northern Irish
applicants increased. These changes mean that applicants from England and
Northern Ireland are around 15 per cent more likely to receive an offer from a
Scottish provider than applicants from Scotland.
Qualifications and provider groups
Entry rate for 18 year olds holding BTECs as their main qualification falls
In 2016, 3.5 per cent of UK 18 year olds were accepted into higher education holding
BTECs as their main qualification. This is a slight fall, 1 per cent proportionally,
compared to 2015, but set against a backdrop of steady increases since 2012.
Most UK 18 year olds who are accepted into higher education hold A levels as their
main qualification. In 2016, 20.1 per cent of UK 18 year olds were accepted into
higher education holding at least three A levels, up by 3 per cent on 2015.
A small proportion of UK 18 year olds are accepted into higher education holding a
combination of A levels and BTECs. In 2016, this proportion was 2.5 per cent, 10 per
cent higher than in 2015.
Security marking: PUBLIC Page 25 of 142
Document owner: UCAS Analysis & Research 15 December 2016
More applicants placed at higher and medium tariff providers, but the number
placed at lower tariff providers falls
Providers can be grouped by the average qualification level of their acceptances.
Acceptances to higher and medium tariff providers increased in 2016 to their highest
number on record.
Acceptances to higher tariff providers increased by 4,000 (+2.8 per cent) to 149,400.
Acceptances to medium tariff providers increased by 5,200 (+3.2 per cent) to
171,200, also the highest number on record.
Acceptances to lower tariff providers fell by 6,300 (-2.9 per cent) to 214,700. This is
the first time acceptances to lower tariff providers have fallen since 2012, with
acceptances in 2016 falling below the total for both 2015 and 2014 cycles.
Proportion of acceptances with higher grades at A level continues to fall at higher
tariff providers
The proportion of English 18 year old acceptances that have achieved grades
equivalent to ABB or above at A level can be used as a summary measure of the
qualification strength of acceptances.
Higher tariff providers have the highest proportions of these acceptances. In 2016,
72.7 per cent of their acceptances held ABB or above from A levels. This is a
decrease of 1.4 percentage points from the 74.1 per cent who held these
qualifications in 2015, and a decrease of 12.7 percentage points from 85.4 per cent
in 2011, when the proportion was at its highest. The reduction in this proportion in
2016 was less than the 0.3 percentage points typical in recent cycles.
At medium tariff providers, 15.5 per cent of English 18 year old acceptances held
ABB or above at A level, a fall of 1.6 percentage points from 2015. Very few who are
accepted to lower tariff providers – only 3.3 per cent in 2016 – hold these
qualifications.
The proportion of English 18 year olds at higher tariff providers who held higher
grades at BTEC increased in 2016, to 2.4 per cent (0.1 percentage points, 6 per cent
proportionally). The proportion holding higher BTEC grades at medium and lower
tariff providers fell. This is the first time the proportion has fallen for either of these
provider types since in the period. Despite the falls, the proportions were the second
highest on record, at 9.6 per cent for medium tariff providers, and 16.4 per cent for
lower tariff providers.
Medium tariff providers recruit more lower grade A level students, while lower
tariff providers recruit fewer
In 2016, there were an additional 5,200 applicants placed at medium tariff providers.
Around 40 per cent of this increase was from an additional 2,200 English 18 year old

Security marking: PUBLIC Page 26 of 142
Document owner: UCAS Analysis & Research 15 December 2016
applicants who were accepted holding A levels with grades equivalent to BBC and
below.
At lower tariff providers, 1,800 fewer English 18 year old applicants were accepted
with A level grades of BBC and below. There were also 1,100 fewer English 18 year
old applicants accepted holding BTECs equivalent to three A level grades. Combined,
these account for almost half of the overall fall in acceptances to lower tariff
providers in 2016.
There was no change in the number of English 18 year olds accepted to higher tariff
providers with A levels in 2016.

Section 2Analytical overview

Security marking: PUBLIC Page 28 of 142
Document owner: UCAS Analysis & Research 15 December 2016
Applicants
Applicant numbers unchanged in 2016 but differing trends by domicile
There were 718,400 applicants in 2016, almost the same (100 fewer) than in 2015.
This discontinues the recent trend of steadily increasing application numbers since
2012.
The large majority of applicants in each cycle are domiciled in the UK (590,500, 82
per cent of all applicants, in the 2016 cycle). There was a decrease of 1,500 (-0.3 per
cent) UK domiciled applicants in 2016, but the number of applicants from the UK
was still the second highest recorded. Applicants from the EU increased in 2016 by
2,900 (+5.6 per cent) to 53,600, the highest number of applicants recorded from this
domicile in any cycle. Applicants from countries outside of the EU decreased in 2016
by 1,500 (-1.9 per cent) to 74,300, the first fall in five years, and a contrast to the
annual increases typical since 2011.
Figure 1 Applicants by domicile group
UK
applic
ants
0
100,000
200,000
300,000
400,000
500,000
600,000
700,000
2006
2007
2008
2009
2010
2011
2012
2013
2014
2015
2016
Non−
UK
applic
ants
0
20,000
40,000
60,000
80,000
100,000
120,000
140,000UK
Other EUNot EU

Security marking: PUBLIC Page 29 of 142
Document owner: UCAS Analysis & Research 15 December 2016
Acceptances
There were 535,200 applicants accepted to start higher education in the 2016 cycle,
2,900 (+0.5 per cent) more than in the 2015 cycle. For the fourth year running, this is
the highest number of acceptances recorded in any cycle, although the increase this
year is smaller than the 3 to 7 per cent proportional increases seen each year since
2012.
UK domiciled acceptances increase to a record number in the 2016 cycle
Most acceptances are from the UK – in recent cycles, between 87 to 88 per cent of
the total. In 2016, there were 465,500 acceptances from the UK, up 1,800 (+0.4 per
cent), a smaller increase than last year, resulting in the highest number of
acceptances of UK domiciled applicants from any cycle, although a smaller increase
than from the 2014 cycle to the 2015 cycle.
Acceptances from other countries in the EU increase 7 per cent in 2016
EU domiciled acceptances form around 5 to 6 per cent of all acceptances, and have
increased in each cycle since 2006, apart from 2012. In 2016, acceptances from
other countries in the EU increased by 2,000 (+7.0 per cent) to a record 31,400.
Acceptances from outside the EU decrease for the first time since 2011
Around 7 to 8 per cent of acceptances are from applicants outside the EU. In 2016,
there were 38,300 acceptances from applicants outside the EU, down 900 (-2.3 per
cent) from 2015 and similar to the number accepted in 2014.
Figure 2 Acceptances by domicile group
UK
accepta
nces
0
100,000
200,000
300,000
400,000
500,000
2006
2007
2008
2009
2010
2011
2012
2013
2014
2015
2016
Non−
UK
accepta
nces
0
20,000
40,000
60,000
80,000
100,000UK
Other EUNot EU

Security marking: PUBLIC Page 30 of 142
Document owner: UCAS Analysis & Research 15 December 2016
Acceptances from UK domiciled 18 and 19 year olds increase to record levels, but
fall in older age groups
Around half of UK domiciled acceptances are from 18 year old applicants. In 2016,
there were 238,900 acceptances from UK 18 year olds, +3,600 (+1.5 per cent) from
2015 and the highest total recorded.
Acceptances from 19 year old applicants are usually around a fifth of all UK
domiciled acceptances. In 2016, the number of acceptances increased by 500 (+0.5
per cent) to 92,200, the highest recorded for 19 year old applicants.
20 year old acceptances make up around 7 per cent of all UK domiciled acceptances.
In 2016, acceptances from 20 year olds decreased by 500 (-1.5 per cent) to 32,500.
This was the second consecutive year the number of 20 year old acceptances has
decreased, but the number was still 600 (1.9 per cent) higher than the number in
2013.
A large set of teacher training courses at providers in Scotland were recruited for
through the UCAS Undergraduate scheme for the first time in 2015, having
previously been recruited for through UCAS Teacher Training. Acceptances to these
courses tended to be aged 21 and over.
Around 11 per cent of all UK domiciled acceptances are from 21-25 year olds. In
2016, the number of 21-25 year old acceptances decreased by 1,600 (-2.9 per cent)
to 52,000, the second highest number recorded.
Around 10 per cent of all UK domiciled acceptances are from applicants aged 26 or
over. Following strong increases in the 2008 and 2009 cycles, the number of
acceptances from this age group decreased between 2010 and 2012. This trend
reversed again, with the number of acceptances increasing in each cycle up to 2015
when it reached 48,700, their highest recorded value. In 2016, there were 48,400
acceptances aged 26 and over, a reduction of 300 (-0.5 per cent) on the 2015
number.

Security marking: PUBLIC Page 31 of 142
Document owner: UCAS Analysis & Research 15 December 2016
Figure 3 UK acceptances by age group
Accepta
nces
0
50,000
100,000
150,000
200,000
250,000
2006
2007
2008
2009
2010
2011
2012
2013
2014
2015
2016
181920
21 to 2526 and over

Security marking: PUBLIC Page 32 of 142
Document owner: UCAS Analysis & Research 15 December 2016
Acceptances from England remain unchanged, but increase in the rest of the UK
Figure 4 shows acceptances by applicant country of domicile in the UK. Acceptances
from England are shown against their own (left hand side) axis as numbers for this
group are higher than those from other countries.
In most cycles since 2006, the number of acceptances from England has increased. In
2016, the number of acceptances was 394,300, which is slightly lower, by around
100, compared to 2015. This is only the third time since 2006 that the number of
acceptances from England has not increased. However, the number in 2016 was 15
per cent higher than in 2012; the last time the number of acceptances from England
decreased, and when tuition fees in England were increased.
Between 2014 and 2015, acceptances from Northern Ireland fell by 400 (-2.8 per
cent) to 14,000. In 2016, the number of acceptances increased by 700 (+5.3 per
cent), more than reversing the previous years’ fall and reaching a new record high of
14,800.
In 2016, acceptances from Scotland increased by 900 (+2.6 per cent), resulting in a
record total of 35,700. In 2014, there were fewer late acceptances to Scotland
recorded in the UCAS data than is typical for some Scottish providers, meaning that
comparing acceptances in 2014 with other cycles may not fully reflect trends in total
recruitment in Scotland. Also, from 2015, a large set of teacher training courses at
providers in Scotland were recruited for through the UCAS Undergraduate scheme,
having previously been recruited for through UCAS Teacher Training. These two
factors are estimated to account for around 3,600 of the 4,500 increase observed
between 2014 and 2015.
Acceptances from Wales increased for the fifth consecutive cycle to 20,700, an
increase of 200 (+1.0 per cent) and reaching a new high.
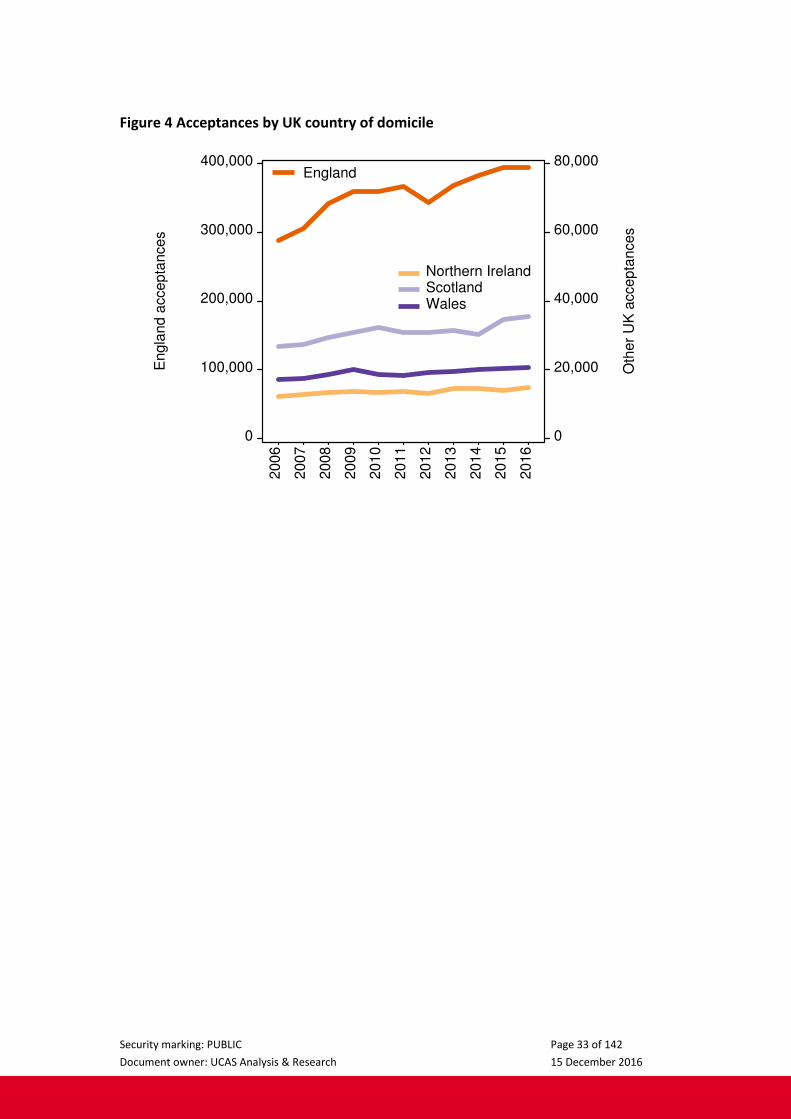
Security marking: PUBLIC Page 33 of 142
Document owner: UCAS Analysis & Research 15 December 2016
Figure 4 Acceptances by UK country of domicile
Engla
nd a
ccepta
nces
0
100,000
200,000
300,000
400,000
2006
2007
2008
2009
2010
2011
2012
2013
2014
2015
2016
Oth
er
UK
accepta
nces
0
20,000
40,000
60,000
80,000England
Northern IrelandScotlandWales
Security marking: PUBLIC Page 34 of 142
Document owner: UCAS Analysis & Research 15 December 2016
Acceptances to higher education providers in all UK countries increase, with largest
increase for providers in Scotland
Figure 5 shows the number of acceptances by country of higher education provider.
Since acceptances to providers in England are much higher than to any other
country, they are shown on a separate axis (left hand side). Most of the increase in
acceptances over the period has been to English providers. Between the 2006 cycle
and the 2011 cycle, the number of acceptances to English providers increased by
more than a quarter to 415,100. Following a fall in the 2012 cycle, acceptances at
English providers have increased in each cycle. In 2016, the number of acceptances
to providers in England increased slightly to 450,500 (+500, +0.1 per cent).
Higher education providers in Northern Ireland had 10,400 acceptances in 2016, an
increase of +300 (+2.8 per cent) on the 2015 cycle, but not enough to offset the -9.7
per cent fall in acceptances in 2015.
Acceptances to higher education providers in Scotland increased to a new recorded
high of 47,900 (+1,500, +3.2 per cent). In 2014, there were fewer late acceptances to
Scotland recorded in the UCAS data than is typical for some Scottish providers,
meaning that comparing acceptances in 2014 with other cycles may not fully reflect
trends in total recruitment in Scotland. Also, a large set of teacher training courses at
providers in Scotland were recruited for through the UCAS Undergraduate scheme
for the first time in 2015, having previously been recruited for through UCAS Teacher
Training. These two factors are estimated to account for around 3,800 of the 4,400
increase in acceptances to providers in Scotland in 2015, compared with 2014.
Acceptances to higher education providers in Wales increased to 26,300 (+600, +2.3
per cent), the highest number since 2009.

Security marking: PUBLIC Page 35 of 142
Document owner: UCAS Analysis & Research 15 December 2016
Figure 5 Acceptances by provider country
Engla
nd a
ccepta
nces
0
80,000
160,000
240,000
320,000
400,000
480,000
2006
2007
2008
2009
2010
2011
2012
2013
2014
2015
2016
Oth
er
UK
accepta
nces
0
20,000
40,000
60,000
80,000
100,000
120,000England
Northern IrelandScotlandWales
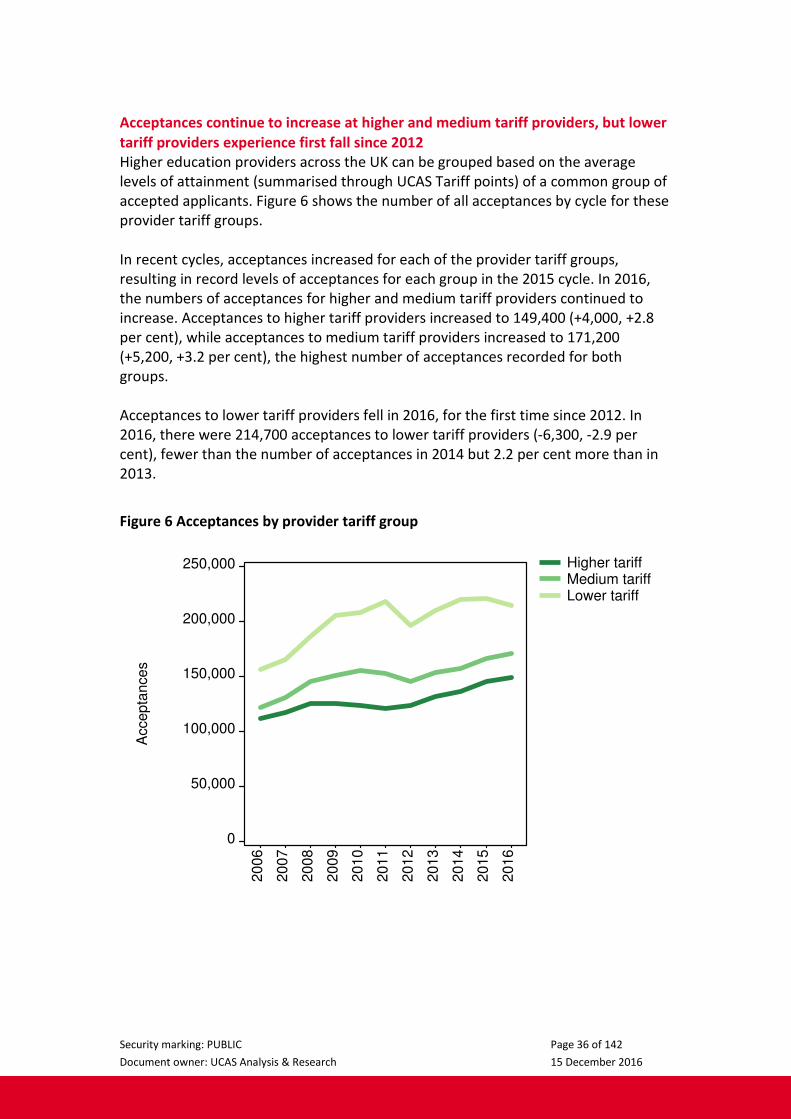
Security marking: PUBLIC Page 36 of 142
Document owner: UCAS Analysis & Research 15 December 2016
Acceptances continue to increase at higher and medium tariff providers, but lower
tariff providers experience first fall since 2012
Higher education providers across the UK can be grouped based on the average
levels of attainment (summarised through UCAS Tariff points) of a common group of
accepted applicants. Figure 6 shows the number of all acceptances by cycle for these
provider tariff groups.
In recent cycles, acceptances increased for each of the provider tariff groups,
resulting in record levels of acceptances for each group in the 2015 cycle. In 2016,
the numbers of acceptances for higher and medium tariff providers continued to
increase. Acceptances to higher tariff providers increased to 149,400 (+4,000, +2.8
per cent), while acceptances to medium tariff providers increased to 171,200
(+5,200, +3.2 per cent), the highest number of acceptances recorded for both
groups.
Acceptances to lower tariff providers fell in 2016, for the first time since 2012. In
2016, there were 214,700 acceptances to lower tariff providers (-6,300, -2.9 per
cent), fewer than the number of acceptances in 2014 but 2.2 per cent more than in
2013.
Figure 6 Acceptances by provider tariff group
Accepta
nces
0
50,000
100,000
150,000
200,000
250,000
2006
2007
2008
2009
2010
2011
2012
2013
2014
2015
2016
Higher tariffMedium tariffLower tariff

Security marking: PUBLIC Page 37 of 142
Document owner: UCAS Analysis & Research 15 December 2016
Acceptance rates
The proportion of applicants who have a place at the end of the cycle is termed the
acceptance rate, and reflects the relationship between total applicants and total
acceptances. Since the number of acceptances may be subject to number control or
physical constraints, it can be broadly interpreted as the ‘difficulty’ of gaining
admission to higher education in a particular year. However, becoming accepted
requires both a higher education provider to make an offer to the applicant, and the
applicant to accept and meet the conditions of the provider’s offer. Therefore,
changes in the acceptance rate can also reflect differences in applicant choices, or
preference to enter higher education.
Acceptance rate increased in 2016, as acceptances increased at a greater rate than
number of applicants
The acceptance rate for all applicants in 2016 increased to 74.5 per cent (+0.4
percentage points). This increase between cycles in the acceptance rate is a result of
an increase in acceptances, while the number of applicants remained largely
unchanged from the previous cycle. Despite this increase, the acceptance rate has
still not returned to the level seen between the 2006 and 2008 cycles (of between 77
and 78 per cent). The proportion of acceptances from outside the UK has increased
in recent years. This, in combination with lower acceptance rates for non-UK
applicants, means it is unlikely the overall acceptance rate will increase to values
seen in 2008 and earlier.
Figure 7 Applicants, acceptances, and the acceptance rate
Num
ber
of applic
ants
and a
ccepta
nces
0
200,000
400,000
600,000
800,000
2006
2007
2008
2009
2010
2011
2012
2013
2014
2015
2016
Perc
enta
ge o
f applic
ants
65%
70%
75%
80%
85%AcceptancesApplicants
Acceptance rate

Security marking: PUBLIC Page 38 of 142
Document owner: UCAS Analysis & Research 15 December 2016
Acceptance rate for UK main scheme applicants at highest since 2009
UK main scheme applicants are the largest group of applicants, typically 78 to 80 per
cent of the total. Main scheme applicants are able to make up to five initial course
choices, followed by the opportunity to use other routes later in the cycle. The
acceptance rates of this group best reflect the ‘difficulty’ of gaining admission to
higher education in a particular year.
The acceptance rate for UK main scheme applicants decreased by almost 6
percentage points in 2010, due to a continuing trend in the increase of applicants
which was not matched by the increase in the number of acceptances. Between
2011 and 2015, the acceptance rate increased each year. In 2016, the acceptance
rate increased again to 78.5 per cent (+0.5 per cent) and remains between 1 and 2
percentage points lower than it was in 2007 and 2008.
Figure 8 Applicants, acceptances, and the acceptance rate for UK main scheme
applicants only
Nu
mb
er
of
ap
plic
an
ts a
nd
acce
pta
nce
s
0
200,000
400,000
600,000
800,000
20
06
20
07
20
08
20
09
20
10
20
11
20
12
20
13
20
14
20
15
20
16
Pe
rce
nta
ge
of
ap
plic
an
ts
65%
70%
75%
80%
85%AcceptancesApplicants
Acceptance rate

Security marking: PUBLIC Page 39 of 142
Document owner: UCAS Analysis & Research 15 December 2016
Acceptance rates continue to increase for UK and EU students, while acceptance
rates for students from outside of the EU fall
A higher proportion of UK domiciled applicants are accepted than applicants from
outside the UK. The acceptance rate for UK domiciled applicants increased to 78.8
per cent (+0.5 percentage points) in 2016. Acceptance rates for this group remained
below the 80 to 81 per cent values typical between 2006 and 2008.
The acceptance rate for EU applicants in 2016 was 58.5 per cent, an increase of 0.7
percentage points and reaching the highest rate since the large decrease in 2010.
Before 2010, the acceptance rate for EU applicants was typically 60 to 62 per cent.
The acceptance rate for applicants from outside the EU fell by 0.2 percentage points
in 2016, to 51.6 per cent, the lowest value recorded. This means that non-EU
applicants remain around 15 per cent less likely to be placed in 2016 than was typical
in the 2006 to 2010 cycles.
Figure 9 Acceptance rates by applicant domicile group
Accepta
nce r
ate
50%
60%
70%
80%
90%
2006
2007
2008
2009
2010
2011
2012
2013
2014
2015
2016
UKOther EUNot EU

Security marking: PUBLIC Page 40 of 142
Document owner: UCAS Analysis & Research 15 December 2016
Acceptance rates increase for UK 18 to 25 year olds
In each cycle, the acceptance rate for UK 18 year olds is at a very similar level to the
acceptance rate for 19 year olds. In 2016, the acceptance rate was 85.0 per cent for
18 year olds (+0.8 percentage points) and also 85.0 per cent for 19 year olds (+0.1
percentage points), a record high for both age groups.
The acceptance rates for older age groups are consistently lower. For 20 year olds,
the acceptance rate increased in 2016 to 78.0 per cent (+0.6 percentage points),
almost reaching the highest recorded acceptance rate of 79 per cent in 2007 and
2008.
For those aged 21 to 25 years old, the acceptance rate increased to 67.7 per cent
(+0.2 percentage points), but remained lower than the acceptance rates typical
before 2009 (70 to 71 per cent).
Applicants aged 26 and over were the only age group to show a decrease in
acceptance rate in 2016, falling by 0.3 percentage points to 60.2 per cent, and
remaining much lower than the acceptance rate that was typical before 2009 (66 to
68 per cent). The proportion of applicants aged 26 and over who applied for nursing
courses, which have relatively low acceptance rates, increased in 2016.
Figure 10 Acceptance rates for UK domiciled applicants by age group
Accepta
nce r
ate
50%
60%
70%
80%
90%
100%
2006
2007
2008
2009
2010
2011
2012
2013
2014
2015
2016
181920
21 to 2526 and over
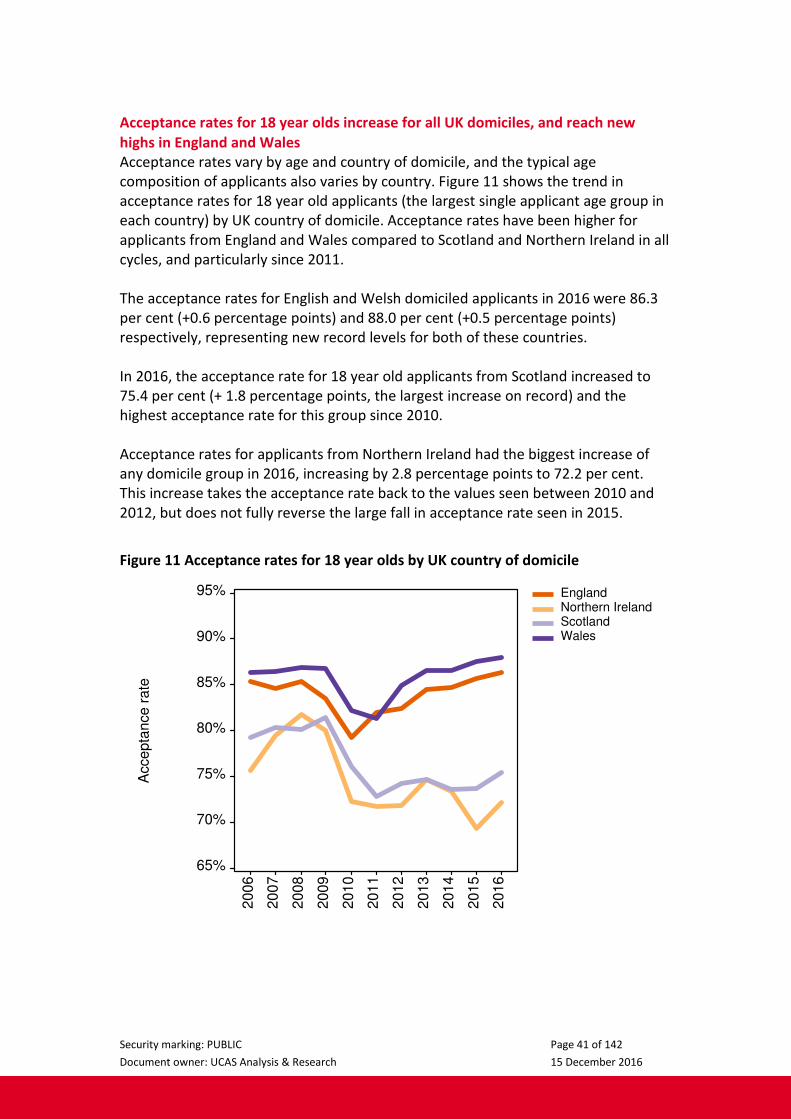
Security marking: PUBLIC Page 41 of 142
Document owner: UCAS Analysis & Research 15 December 2016
Acceptance rates for 18 year olds increase for all UK domiciles, and reach new
highs in England and Wales
Acceptance rates vary by age and country of domicile, and the typical age
composition of applicants also varies by country. Figure 11 shows the trend in
acceptance rates for 18 year old applicants (the largest single applicant age group in
each country) by UK country of domicile. Acceptance rates have been higher for
applicants from England and Wales compared to Scotland and Northern Ireland in all
cycles, and particularly since 2011.
The acceptance rates for English and Welsh domiciled applicants in 2016 were 86.3
per cent (+0.6 percentage points) and 88.0 per cent (+0.5 percentage points)
respectively, representing new record levels for both of these countries.
In 2016, the acceptance rate for 18 year old applicants from Scotland increased to
75.4 per cent (+ 1.8 percentage points, the largest increase on record) and the
highest acceptance rate for this group since 2010.
Acceptance rates for applicants from Northern Ireland had the biggest increase of
any domicile group in 2016, increasing by 2.8 percentage points to 72.2 per cent.
This increase takes the acceptance rate back to the values seen between 2010 and
2012, but does not fully reverse the large fall in acceptance rate seen in 2015.
Figure 11 Acceptance rates for 18 year olds by UK country of domicile
Accepta
nce r
ate
65%
70%
75%
80%
85%
90%
95%
2006
2007
2008
2009
2010
2011
2012
2013
2014
2015
2016
EnglandNorthern IrelandScotlandWales

Security marking: PUBLIC Page 42 of 142
Document owner: UCAS Analysis & Research 15 December 2016
Entry rates for 18 and 19 year olds from the UK
18 year olds in England, Scotland, and Wales were more likely to enter higher
education in the 2016 cycle than any previous year
The entry rate is the proportion of the population accepted into higher education
through UCAS. The entry rate refers to the cycle in which the applicant is accepted
and includes both acceptances for immediate entry to higher education and those
that are deferred until the next academic year.
In 2016, 32.5 per cent of the English 18 year old population were accepted into
higher education, an increase of 1.2 percentage points, continuing the trend of
increasing entry rates recorded every year since 2012. This was the highest level
recorded for this group of applicants, and 7.7 percentage points higher than in 2006
(31 per cent proportionally).
Following decreases in 2014 and 2015 in the entry rate for 18 year olds in Northern
Ireland, the entry rate increased in 2016 to 34.8 per cent, the same level as in 2014.
Entry rates for 18 year olds from Northern Ireland have varied between 32.3 per
cent and 35.7 per cent across the period, the highest rate of any country across the
UK in each year reported.
Entry rates for 18 year olds in Scotland are lower than for other countries on this
measure, since not all higher education provision in further education colleges, an
important component of provision in Scotland, is recruited for through UCAS.
Around one third of young entrants in Scotland will be in further education colleges
and not recorded in these statistics. The UCAS entry rates for 18 year olds in
Scotland increased in 2016 to 25.3 per cent (+0.8 percentage points), the highest
recorded in the period.
In Wales, the entry rate increased by 1.3 percentage points to 29.5 per cent, the
highest rate seen across the period, and continuing the trend of increasing entry
rates recorded each year since 2011.

Security marking: PUBLIC Page 43 of 142
Document owner: UCAS Analysis & Research 15 December 2016
Figure 12 Proportion of 18 year olds accepted for entry by cycle and country of
domicile E
ntr
y r
ate
(cycle
)
15%
20%
25%
30%
35%
40%
2006
2007
2008
2009
2010
2011
2012
2013
2014
2015
2016
EnglandNorthern IrelandScotlandWales
Security marking: PUBLIC Page 44 of 142
Document owner: UCAS Analysis & Research 15 December 2016
19 year old entry rates increase to new highs in Northern Ireland, Scotland, and
Wales, but decrease in England
The first time entry rate of 19 year olds is the proportion of the 19 year old
population that are accepted for entry to higher education for the first time. It
excludes the small number of accepted applicants who were accepted to start higher
education at age 18, but who then applied and were accepted again at age 19. It
does not include acceptances at age 18 who intend to start their courses age 19
(deferred acceptances) since these are already included in the 18 year old cycle-
based entry rate.
In 2016, the first time entry rate for 19 year olds from England decreased by 0.4
percentage points to 11.1 per cent. This decrease is the first since 2012.
For 19 year olds in Northern Ireland, the first time entry rate increased by +1.6
percentage points to 9.5 per cent, the highest on record. This increase follows a
decrease in the entry rate at age 18 for the same cohort in 2015.
Entry rates for 19 year olds in Scotland are lower than for other countries on this
measure, since not all higher education provision in colleges in Scotland is recruited
for through UCAS. After falling for two successive years, the first time entry rate for
19 year olds from Scotland increased by 0.7 percentage points to 6.5 per cent in
2015, and increased again by 0.2 percentage points to 6.7 per cent in 2016, the
highest on record.
For 19 year olds in Wales, the first time entry rate in 2016 was 9.2 per cent, an
increase of 0.2 percentage points on 2015.

Security marking: PUBLIC Page 45 of 142
Document owner: UCAS Analysis & Research 15 December 2016
Figure 13 Proportion of 19 year olds accepted for entry for the first time by country
of domicile F
irst−
tim
e e
ntr
y r
ate
(cycle
)
0%
5%
10%
15%
20%
25%
2006
2007
2008
2009
2010
2011
2012
2013
2014
2015
2016
EnglandNorthern IrelandScotlandWales

Security marking: PUBLIC Page 46 of 142
Document owner: UCAS Analysis & Research 15 December 2016
Cohort entry rates for young people reach highs across England, Wales, and
Scotland
When looking at entry rates for single age groups, changes in entry year can make it
difficult to interpret whether young people are becoming more or less likely to enter
higher education.
One measure that is less influenced by changes in age of entry is a cohort-based
entry rate that combines entry to higher education at ages 18 and 19. It has the
advantage that it is unaffected by changes in the choice to apply and be accepted for
entry at ages 18 or 19. It has the disadvantage that it cannot yet report on a
complete rate for the cohort that was aged 18 in 2016, since they are yet to have the
opportunity to apply at age 19. Figure 14 shows the proportion of a young cohort
(referenced by the year the cohort would be aged 18) that is accepted for entry aged
either 18 or 19.
In England, 42.5 per cent of the cohort aged 18 in 2015 were accepted to enter
higher education either at age 18 in 2015 or at age 19 in 2016, the highest on record.
This was an increase of 0.5 percentage points compared to the cohort aged 18 in
2014. This increase was driven by the increase in the 18 year old entry rate only,
since the first time 19 year old entry rate for the cohort fell. It continued the trend of
annual increases for each cohort since those aged 18 in 2006. The cohort from
England aged 18 in 2015 was 28 per cent more likely to be accepted to higher
education through UCAS by the age of 19 than the cohort that was age 18 in 2006,
the greatest rate of increase recorded across the countries of the UK.
The entry rate for the 2015 cohort from Wales increased by 1.3 percentage points to
37.5 per cent, a new high. This rate was 5.8 percentage points higher than the rate
for the cohort that was 18 in 2006, making them 18 per cent more likely to enter
higher education than the earlier cohort.
For young people from Northern Ireland, the entry rate for the cohort aged 18 in
2014 fell by 1.1 percentage points, but in 2015 it increased by 0.2 percentage points
to reach 43.1 per cent. The increase in 2016 is driven by the increase in the first time
19 year old entry rate, which more than offset the fall in the 18 year old entry rate
for the cohort.
The 2015 cohort entry rate for Scotland (lower than on comparable student record
measures since not all higher education providers in Scotland use UCAS) increased
by +1.2 percentage points to 31.8 per cent. This is the largest single year increase in
the cohort entry rate for Scotland since 2009, resulting in the cohort that was 18 in
2015 being 19 per cent more likely to have been accepted to enter higher education
by age 19 than the cohort age 18 in 2006.

Security marking: PUBLIC Page 47 of 142
Document owner: UCAS Analysis & Research 15 December 2016
Figure 14 Young entry rate (cohort) by country
Entr
y r
ate
(cohort
)
20%
25%
30%
35%
40%
45%
Year aged 18
20
06
20
07
20
08
20
09
20
10
20
11
20
12
20
13
20
14
20
15
20
16
EnglandNorthern IrelandScotlandWales
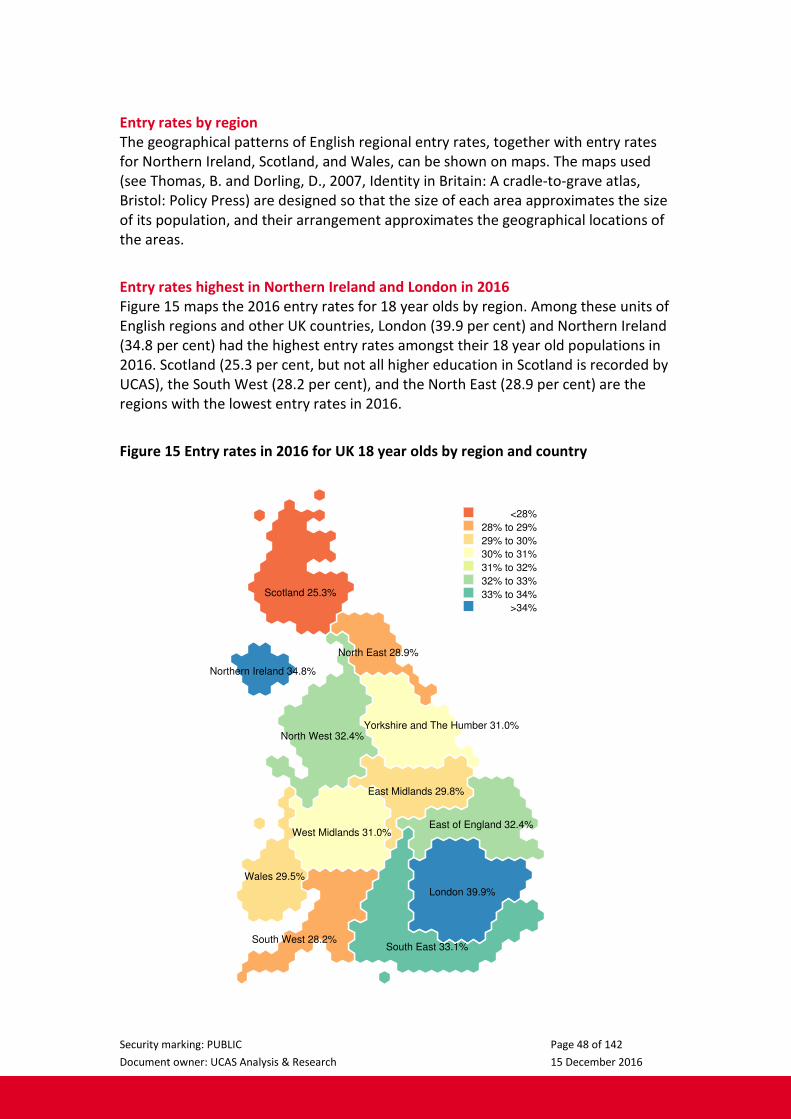
Security marking: PUBLIC Page 48 of 142
Document owner: UCAS Analysis & Research 15 December 2016
Entry rates by region
The geographical patterns of English regional entry rates, together with entry rates
for Northern Ireland, Scotland, and Wales, can be shown on maps. The maps used
(see Thomas, B. and Dorling, D., 2007, Identity in Britain: A cradle-to-grave atlas,
Bristol: Policy Press) are designed so that the size of each area approximates the size
of its population, and their arrangement approximates the geographical locations of
the areas.
Entry rates highest in Northern Ireland and London in 2016
Figure 15 maps the 2016 entry rates for 18 year olds by region. Among these units of
English regions and other UK countries, London (39.9 per cent) and Northern Ireland
(34.8 per cent) had the highest entry rates amongst their 18 year old populations in
2016. Scotland (25.3 per cent, but not all higher education in Scotland is recorded by
UCAS), the South West (28.2 per cent), and the North East (28.9 per cent) are the
regions with the lowest entry rates in 2016.
Figure 15 Entry rates in 2016 for UK 18 year olds by region and country
<28%
28% to 29%
29% to 30%
30% to 31%
31% to 32%
32% to 33%
33% to 34%
>34%
North East 28.9%
North West 32.4%Yorkshire and The Humber 31.0%
East Midlands 29.8%
West Midlands 31.0%East of England 32.4%
London 39.9%
South East 33.1%South West 28.2%
Wales 29.5%
Scotland 25.3%
Northern Ireland 34.8%

Security marking: PUBLIC Page 49 of 142
Document owner: UCAS Analysis & Research 15 December 2016
Entry rates increase in all regions of England
The trends in entry rates for regions in England are shown in Figure 16. The trends
for each region are similar over the period, with entry rates increasing between 2006
and 2011, falling in 2012, then increasing each year since. In 2016, entry rates
increased for all regions. The East Midlands, East of England, South East, and London
had the largest increases of between 1.3 and 1.5 percentage points, meaning 18 year
olds in those regions were between 3 to 5 per cent more likely to enter HE
proportionally. The North West (+0.8 percentage points, +2.6 per cent
proportionally) and the South West (+0.6 percentage points, +2.2 per cent
proportionally) had the smallest increases in entry rates in 2016.
London and Yorkshire and the Humber show largest increases in 18 year old entry
rates between 2006 and 2016
Entry rates increased between 2006 and 2016 for all regions, with the largest
increases in London (+10.7 percentage points, +37 per cent proportionally) and
Yorkshire and the Humber (+8.2 percentage points, +36 per cent proportionally). The
entry rate in the South West had the lowest increase in entry rates during this
period, increasing by +5.5 percentage points (+24 per cent proportionally).
Figure 16 Entry rates for 18 year olds by English region
Entr
y r
ate
(cycle
)
20%
25%
30%
35%
40%
2006
2007
2008
2009
2010
2011
2012
2013
2014
2015
2016
North EastNorth WestYorkshire and the HumberEast MidlandsWest MidlandsEast of EnglandLondonSouth EastSouth West

Security marking: PUBLIC Page 50 of 142
Document owner: UCAS Analysis & Research 15 December 2016
Entry rates by parliamentary constituency
There are 650 parliamentary constituencies in the UK (533 in England, 59 in
Scotland, 40 in Wales, and 18 in Northern Ireland). Parliamentary constituencies are
much smaller than regions, with populations of typically just over 1,000 18 year olds,
and are designed to have a more uniform population size than other geographies.
This makes them a particularly suitable smaller geographical unit for reporting entry
rates.
Entry rates of 18 year olds vary across constituencies from 14 per cent to 63 per
cent
Figure 17 shows all the parliamentary constituencies in the UK. In this map, each
parliamentary constituency is shown as a circle, where the size of each circle
approximates the size of the constituency population, and their arrangement
approximates the geographical locations of the constituencies.
The proportion of 18 year olds in a constituency who enter higher education through
UCAS varied from 14 per cent to 63 per cent in 2016. Young people living in the
constituencies with the highest entry rates were four and a half times more likely to
enter higher education than those living in constituencies with the lowest rates.
Entry rates also vary between constituencies within a region. In the East of England
(the region with the most variation in entry rates in 2016), entry rates ranged from
15 per cent in the constituency with the lowest entry rate, to 59 per cent in the
constituency with the highest entry rate. This was a 45 percentage point range in
entry rates within the region, with 18 year olds in the constituency with the highest
entry rate in the region being almost four times as likely the enter higher education
than those in the constituency with the lowest entry rate. In the North East, the
English region with the least variation, entry rates ranged from 23 to 40 per cent (17
percentage points).
Similar variation was seen among parliamentary constituencies in Northern Ireland,
Scotland, and Wales.
In Wales, the range was from 20 per cent to 44 per cent, while in Northern Ireland,
the range was from 24 per cent to 41 per cent.
In Scotland, entry rates range from 15 per cent to 46 per cent. Around one third of
young entrants in Scotland will be studying higher education at a further education
college in Scotland which is not recorded through UCAS. The proportion studying in
further education colleges in some constituencies can be higher, at around half. So
the UCAS entry rates in these constituencies will understate total HE entry rates,
including HE in further education colleges, possibly by around one half in extreme
cases.
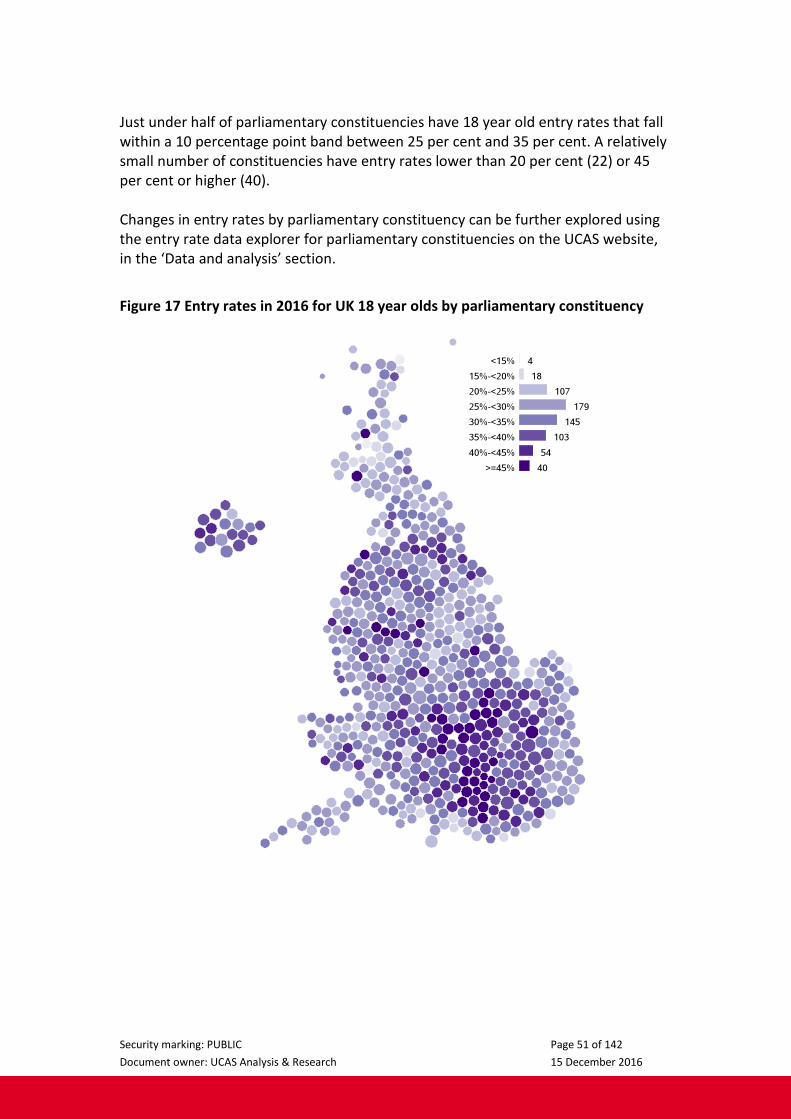
Security marking: PUBLIC Page 51 of 142
Document owner: UCAS Analysis & Research 15 December 2016
Just under half of parliamentary constituencies have 18 year old entry rates that fall
within a 10 percentage point band between 25 per cent and 35 per cent. A relatively
small number of constituencies have entry rates lower than 20 per cent (22) or 45
per cent or higher (40).
Changes in entry rates by parliamentary constituency can be further explored using
the entry rate data explorer for parliamentary constituencies on the UCAS website,
in the ‘Data and analysis’ section.
Figure 17 Entry rates in 2016 for UK 18 year olds by parliamentary constituency
<15% 415%-<20% 1820%-<25% 10725%-<30% 17930%-<35% 14535%-<40% 10340%-<45% 54>=45% 40

Security marking: PUBLIC Page 52 of 142
Document owner: UCAS Analysis & Research 15 December 2016
Wide range of changes in entry rates between 2006 and 2016
The relatively small population of constituencies means that changes in entry rates
from one cycle to the next can have a high ratio of random variation compared to
the level of underlying annual change. Looking at changes over a longer period,
where underlying changes may be greater, can reduce this.
In 2006, the entry rates were lower than in 2016 for most constituencies, with most
constituencies (over 80 per cent) having entry rates of between 15 and 35 per cent.
Between 2006 and 2016, entry rates increased in the majority of constituencies. In
26 constituencies (4 per cent), the entry rate in 2016 was lower than the entry rate
in 2006. In 114 constituencies (18 per cent), the entry rate of 18 year olds increased
by (proportionally) 50 per cent or more.
Changes in entry rates by parliamentary constituency can be further explored using
the entry rate data explorer for parliamentary constituencies on the UCAS website,
in the ‘Data and analysis’ section.
Figure 18 Entry rates in 2006 for UK 18 year olds by parliamentary constituency
<15% 4415%-<20% 14220%-<25% 18725%-<30% 12930%-<35% 8535%-<40% 3740%-<45% 18>=45% 8

Security marking: PUBLIC Page 53 of 142
Document owner: UCAS Analysis & Research 15 December 2016
Figure 19 Proportional change in 18 year old entry between 2006 and 2016 by
parliamentary constituency
<0% 260%-<10% 7310%-<20% 14120%-<30% 12230%-<40% 10640%-<50% 6850%-<60% 44>=60% 70

Security marking: PUBLIC Page 54 of 142
Document owner: UCAS Analysis & Research 15 December 2016
Acceptances and entry rates from Europe
Changes in acceptances vary across European countries
Acceptances from applicants domiciled in the EU, excluding the UK, increased by 7
per cent in the 2016 cycle. The geographical patterns in the number of acceptances,
the proportional increase in acceptances, and young entry rates by country can be
shown on maps. The following maps show selected countries in the EU, and also
Norway and Switzerland.
Figure 20 shows the number of acceptances in 2016 from countries across Europe.
Those domiciled in France have the largest number of acceptances, at 3,200 in 2016.
Other countries with a large number of acceptances are Italy and Romania, each
with over 2,500 placed applicants to UK higher education in 2016. Spain, Germany,
and Poland all had over 2,000 placed applicants.
The proportional change in acceptances from applicants domiciled in Europe, for
different countries, is shown in Figure 21. The largest proportional increase (51 per
cent) was from Slovakia, which had 560 acceptances in 2016. The second largest
proportional increase (48 per cent) was from Croatia, the newest member of the EU,
which had 250 acceptances in 2016.
Of the countries with a proportional increase of more than the 7 per cent average,
Poland (2,100 acceptances, +27 per cent proportionally), Germany (2,100
acceptances, +21 per cent proportionally), Spain (2,200 acceptances, +18 per cent
proportionally), and Bulgaria (1,800 acceptances, +9 per cent proportionally) all had
more than 1,000 acceptances in 2016.
Acceptances decreased from six countries across Europe, with Norway (1,000
acceptances, -30 per cent proportionally) having the largest absolute decrease, and
the Republic of Ireland (2,000 acceptances, -6 per cent proportionally), having the
largest absolute decrease of the countries in the EU.
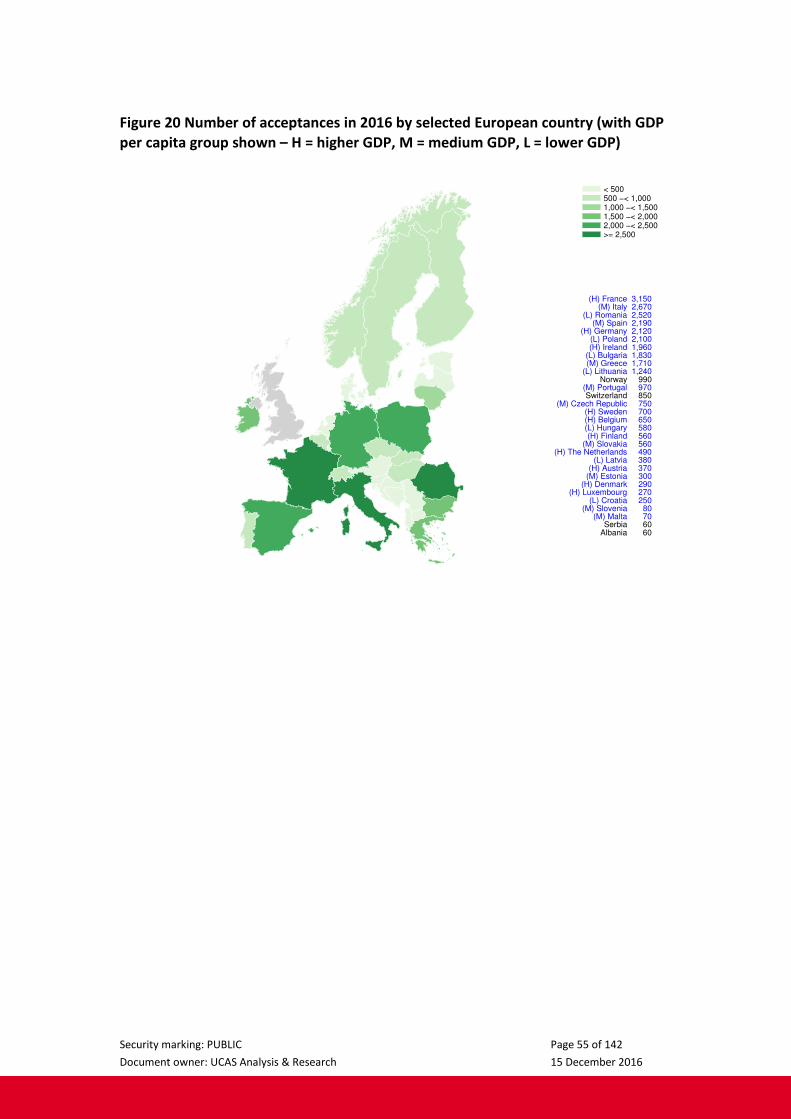
Security marking: PUBLIC Page 55 of 142
Document owner: UCAS Analysis & Research 15 December 2016
Figure 20 Number of acceptances in 2016 by selected European country (with GDP
per capita group shown – H = higher GDP, M = medium GDP, L = lower GDP)
< 500500 −< 1,0001,000 −< 1,5001,500 −< 2,0002,000 −< 2,500>= 2,500
(H) France 3,150(M) Italy 2,670
(L) Romania 2,520(M) Spain 2,190
(H) Germany 2,120(L) Poland 2,100(H) Ireland 1,960
(L) Bulgaria 1,830(M) Greece 1,710
(L) Lithuania 1,240 Norway 990
(M) Portugal 970 Switzerland 850
(M) Czech Republic 750(H) Sweden 700(H) Belgium 650(L) Hungary 580(H) Finland 560
(M) Slovakia 560(H) The Netherlands 490
(L) Latvia 380(H) Austria 370
(M) Estonia 300(H) Denmark 290
(H) Luxembourg 270(L) Croatia 250
(M) Slovenia 80(M) Malta 70 Serbia 60
Albania 60

Security marking: PUBLIC Page 56 of 142
Document owner: UCAS Analysis & Research 15 December 2016
Figure 21 Changes in acceptances for 2016 relative to 2015, by selected European
country (with GDP per capita group shown – H = higher GDP, M = medium GDP, L =
lower GDP)
< −5%−5% −< 0%0% −< 5%5% −< 10%10% −< 15%>= 15%
(M) Slovakia 51%(L) Croatia 48%
(M) Czech Republic 32%(L) Poland 27%
Serbia 27% Albania 24%
(M) Portugal 21%(H) Germany 21%
(M) Spain 18%(M) Malta 17%
(L) Hungary 12%(M) Slovenia 11%(L) Bulgaria 9%
(L) Lithuania 7%(L) Latvia 7%
(H) Denmark 6%(M) Greece 6%(H) Austria 5%
Switzerland 4%(H) France 3%
(L) Romania 3%(H) The Netherlands 3%
(M) Italy 1%(H) Luxembourg 1%
(H) Finland −0%(M) Estonia −1%(H) Ireland −6%
(H) Sweden −6%(H) Belgium −6%
Norway −30%

Security marking: PUBLIC Page 57 of 142
Document owner: UCAS Analysis & Research 15 December 2016
Entry rates vary across European countries
Figure 22 shows the estimated cohort entry rate by age 19 from countries across
Europe for young people that were age 18 in 2015. The cohort entry rate is the
proportion of the population accepted to UK higher education through UCAS either
at age 18 or age 19. The following entry rates are calculated using population
estimates published by The World Bank (The World Bank: Health Nutrition and
Population Statistics: The United Nations Population Division’s World Population
Prospects, and World Bank’s estimates from World Bank’s population projections).
The cohort entry rate for those aged 18 in 2015 varied from 0.1 per cent of the
young population from Germany to 2.8 per cent of the young population from
Luxembourg.
Figure 22 Young entry rate (cohort) by selected European country (with GDP per
capita group shown – H = higher GDP, M = medium GDP, L = lower GDP)
< 0.2%0.2% −< 0.3%0.3% −< 0.4%0.4% −< 0.7%0.7% −< 1.0%>= 1.0%
(H) Luxembourg 2.8%(L) Lithuania 2.6%(L) Bulgaria 2.3%(H) Ireland 2.0%
(M) Estonia 1.7%(L) Latvia 1.5%
(M) Greece 0.9%(L) Romania 0.9%
Norway 0.8%(M) Malta 0.7%
Switzerland 0.7%(M) Slovakia 0.5%
(M) Czech Republic 0.5%(M) Portugal 0.5%(H) Belgium 0.4%(H) Finland 0.4%
(L) Hungary 0.4%(L) Poland 0.3%(L) Croatia 0.3%
(M) Slovenia 0.3%(M) Italy 0.3%
(H) Sweden 0.3%(M) Spain 0.3%
(H) Austria 0.3%(H) France 0.2%
(H) The Netherlands 0.2%(H) Denmark 0.1%(H) Germany 0.1%
Security marking: PUBLIC Page 58 of 142
Document owner: UCAS Analysis & Research 15 December 2016
Number of acceptances from European countries varies by GDP
Figure 23 shows the number of acceptances from non-UK EU applicants split by the
Gross Domestic Product (GDP) per capita of their country of home domicile (The
World Bank: World Development Indicators). Countries are grouped into three
categories, referred to as ‘GDP groups’; countries with a GDP per capita of $0 –
$15,000 were assigned to the lower GDP group, countries with a GDP per capita of
>$15,000 – $30,000 were assigned to the medium GDP group, and countries with a
GDP per capita of >$30,000 were assigned to the higher GDP group. Countries that
entered the EU during the reporting period (Romania and Bulgaria in 2007, and
Croatia in 2013) have their acceptance numbers included only once they became EU
members.
The trends in acceptances by country GDP groups vary. In 2006, there were 9,700
acceptances from higher GDP European countries, over 50 per cent more than the
number of acceptances from medium GDP countries (5,900), and three and a half
times more than lower GDP countries (2,700). Since then, the number of
acceptances from higher GDP countries increased to a high of 11,500 in 2009, before
falling to a low of 9,000 in 2012, then increasing in each consecutive year to reach
10,500 in 2016, 9 per cent higher than at the start of the period in 2006.
Acceptances from medium and lower GDP countries had a different trend.
Acceptances from medium GDP countries increased in every cycle, with the
exception of the 2008 and 2012 cycles, to reach 11,600 acceptances in 2016, nearly
double the number in 2006, and greater than the number of acceptances from
higher GDP countries. Acceptances from lower GDP countries also increased in each
year, except in 2012, to reach 8,900 in 2016, three and a half times higher than in
2006.
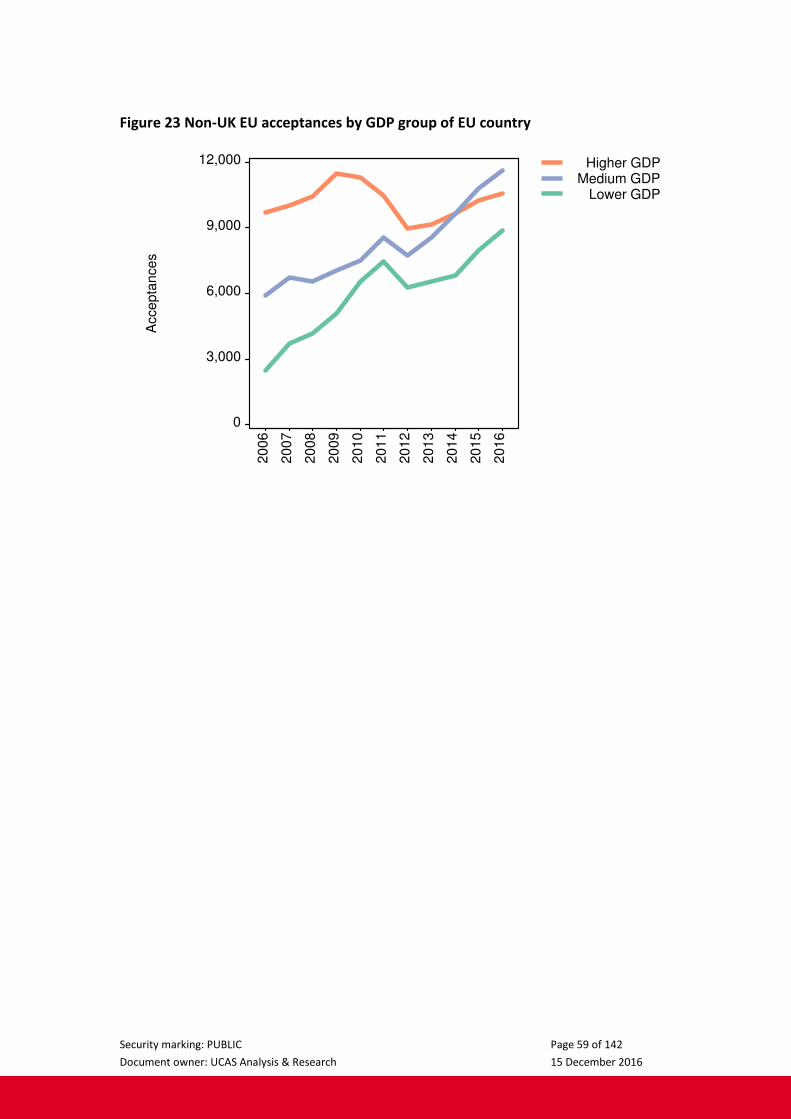
Security marking: PUBLIC Page 59 of 142
Document owner: UCAS Analysis & Research 15 December 2016
Figure 23 Non-UK EU acceptances by GDP group of EU country
Accepta
nces
0
3,000
6,000
9,000
12,000
2006
2007
2008
2009
2010
2011
2012
2013
2014
2015
2016
Higher GDPMedium GDP
Lower GDP

Security marking: PUBLIC Page 60 of 142
Document owner: UCAS Analysis & Research 15 December 2016
Acceptances to higher tariff providers increase again to new highs for all GDP EU
country groups
Figure 24 shows the number of acceptances to higher tariff providers from each GDP
country group.
In 2016, acceptances to higher tariff providers increased for all GDP country groups
to their highest recorded values. Acceptances from higher GDP countries increased
by 400 (+10 per cent proportionally) to 4,600, the fourth consecutive increase in
acceptances from these countries to higher tariff providers. Acceptances from
medium GDP countries also increased by 400 (+10 per cent proportionally) to 4,300,
as did those from lower GDP countries, where acceptances also increased by 400
(+13 per cent proportionally) to reach 3,200.
Throughout the period, there have been more acceptances from higher GDP
countries than from medium or lower GDP countries. Since 2006, the number of
acceptances to higher tariff providers has increased by 1,600 (+57 per cent
proportionally) for higher GDP countries, by 2,400 (+128 per cent proportionally) for
medium GDP countries, and by 2,200 (+268 per cent proportionally) for lower GDP
countries.
Figure 24 Non-UK EU acceptances by GDP group of EU country to higher tariff
providers
Accepta
nces
0
1,000
2,000
3,000
4,000
5,000
2006
2007
2008
2009
2010
2011
2012
2013
2014
2015
2016
Higher GDPMedium GDP
Lower GDP

Security marking: PUBLIC Page 61 of 142
Document owner: UCAS Analysis & Research 15 December 2016
Acceptances to medium and lower tariff providers from higher GDP countries fall
in 2016, but increase for other countries
Acceptances to medium tariff providers from each GDP country group are shown in
Figure 25. For most of the period, there were more acceptances to medium tariff
providers from higher GDP countries than there were from medium and lower GDP
countries. However, since 2015, the number of acceptances from medium GDP
group countries was higher than the number of acceptances from higher GDP
countries.
Between 2006 and 2009, the number of acceptances from higher GDP countries
increased by 18 per cent to 4,300, the highest on record, before falling in each of the
following three years to reach their lowest value of 3,200 in 2012. Acceptances have
since remained broadly constant at between 3,200 and 3,400.
Acceptances from medium GDP countries increased from 2,000 in 2006 to 3,600 in
2015 (+1,600, +79 per cent), before increasing again in 2016 to 3,800 (+200, +6 per
cent) the highest on record, and higher than the number of acceptances from higher
GDP countries.
Acceptances from lower GDP countries increased from 900 in 2006 to 2,000 in 2015
(+1,100, +129 per cent), and then again in 2016 to 2,300 (+300, +15 per cent).
Despite the large growth in acceptances from lower GDP countries across the period,
the number of acceptances from this group remains lower than for medium and
higher GDP countries.
Figure 26 shows acceptances to lower tariff providers from each GDP country group.
The trends in acceptances to lower tariff providers are similar but more pronounced
than the trends for medium tariff providers. At the start of the period, acceptances
from higher GDP countries were higher than for other countries, but reached a low
in 2012 before remaining broadly stable until 2016. Acceptances from medium GDP
countries increased between 2006 and 2011, decreased in 2012, and then increased
in each subsequent year. Acceptances from lower GDP countries also increased
between 2006 and 2011, decreased in 2012, and increased each year since. In 2016,
there were 3,500 acceptances to lower tariff providers from both the medium and
lower GDP country groups, the highest number on record, and more than the
number of acceptances from higher GDP countries (2,600) to that tariff group.
In 2016, there were more acceptances from higher and medium GDP countries to
higher tariff providers than there were from these countries to medium or lower
tariff providers. The number of acceptances from lower GDP countries was higher at
lower tariff providers than it was at higher and medium tariff providers.

Security marking: PUBLIC Page 62 of 142
Document owner: UCAS Analysis & Research 15 December 2016
Figure 25 Non-UK EU acceptances by GDP group of EU country to medium tariff
providers A
ccepta
nces
0
1,000
2,000
3,000
4,000
5,000
2006
2007
2008
2009
2010
2011
2012
2013
2014
2015
2016
Higher GDPMedium GDP
Lower GDP
Figure 26 Non-UK EU acceptances by GDP group of EU country to lower tariff
providers
Accepta
nces
0
1,000
2,000
3,000
4,000
5,000
2006
2007
2008
2009
2010
2011
2012
2013
2014
2015
2016
Higher GDPMedium GDP
Lower GDP

Security marking: PUBLIC Page 63 of 142
Document owner: UCAS Analysis & Research 15 December 2016
Offer-making to main scheme applicants in 2016
Offers made in 2016 increase by 1.2 per cent to over 1.9 million, highest recorded
total
The number of offers made to all main scheme applicants is shown in Figure 27. The
offers made are shown split by the number of offers received by the applicant
(cumulative totals). The total number of offers made (represented by the 1-5 offers)
increased in 2016 by 23,700 (+1.2 per cent) to just over 1.9 million, the highest
number of offers made and continuing the trend seen since 2013 of an increasing
number of offers. The number of offers made to applicants who received offers for
all five of their choices increased by 16,600 (+2.1 per cent). The total number of
offers made to applicants with four or five offers also reached a record high of more
than 1.3 million. This means that for the fourth consecutive year, more than two
thirds of offers were made to applicants with four or five offers to choose between,
continuing the trend that offer-making is becoming more concentrated on applicants
with four or five offers.
Figure 27 Total number of offers made to all main scheme applicants by number of
offers received (cumulative categories)
Cum
ula
tive n
um
ber
of offers
0
250,000
500,000
750,000
1,000,000
1,250,000
1,500,000
1,750,000
2,000,000
2008
2009
2010
2011
2012
2013
2014
2015
2016
1−5 offers2−5 offers3−5 offers4−5 offers
5 offers

Security marking: PUBLIC Page 64 of 142
Document owner: UCAS Analysis & Research 15 December 2016
Offers made to all applicants who make a full set of choices increase by 1 per cent
to almost 1.7 million, the highest level recorded
Main scheme applicants who make five choices represent the large majority of
applications and form a more uniform group to assess patterns in the distribution of
offers made. There was an increase in total offers made to this group of 1.3 per cent
(21,500) to almost 1.7 million offers, the highest level recorded. More than three
quarters of offers made to this group were received by applicants who received four
or five offers in total. The greatest proportional increase in number of offers made to
five choice applicants was to those who received the maximum five offers, an
increase of +16,600, or +2.1 per cent, to 804,900 (representing 161,000 applicants
with five offers).
Figure 28 Total number of offers made to all applicants who made five choices by
number of offers received (cumulative categories)
Cum
ula
tive n
um
ber
of offers
0
250,000
500,000
750,000
1,000,000
1,250,000
1,500,000
1,750,000
2008
2009
2010
2011
2012
2013
2014
2015
2016
1−5 offers2−5 offers3−5 offers4−5 offers
5 offers
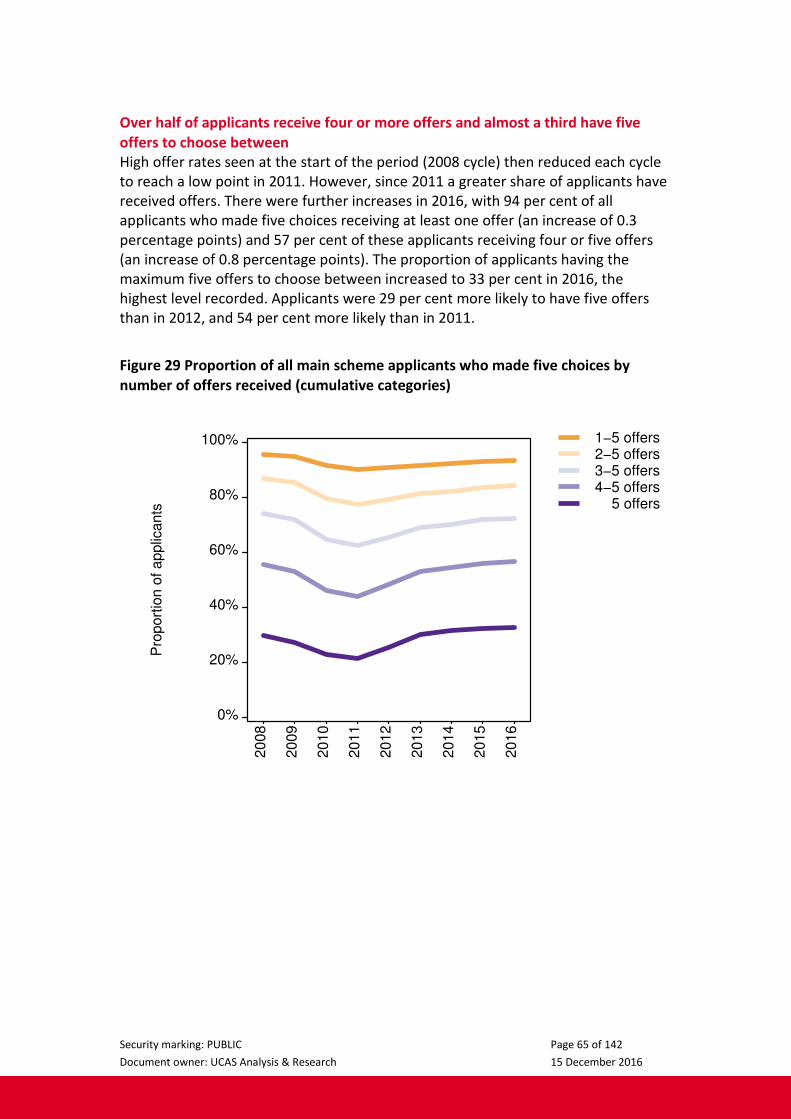
Security marking: PUBLIC Page 65 of 142
Document owner: UCAS Analysis & Research 15 December 2016
Over half of applicants receive four or more offers and almost a third have five
offers to choose between
High offer rates seen at the start of the period (2008 cycle) then reduced each cycle
to reach a low point in 2011. However, since 2011 a greater share of applicants have
received offers. There were further increases in 2016, with 94 per cent of all
applicants who made five choices receiving at least one offer (an increase of 0.3
percentage points) and 57 per cent of these applicants receiving four or five offers
(an increase of 0.8 percentage points). The proportion of applicants having the
maximum five offers to choose between increased to 33 per cent in 2016, the
highest level recorded. Applicants were 29 per cent more likely to have five offers
than in 2012, and 54 per cent more likely than in 2011.
Figure 29 Proportion of all main scheme applicants who made five choices by
number of offers received (cumulative categories)
Pro
port
ion o
f applic
ants
0%
20%
40%
60%
80%
100%
2008
2009
2010
2011
2012
2013
2014
2015
2016
1−5 offers2−5 offers3−5 offers4−5 offers
5 offers

Security marking: PUBLIC Page 66 of 142
Document owner: UCAS Analysis & Research 15 December 2016
Offer rates for young applicants increase in 2016 to new highs
Applications from younger applicants are more likely to receive offers than
applicants in other age groups. Applications from 18 year old applicants consistently
had the highest chance of receiving an offer, and this increased in 2016 to reach 76.1
per cent, the new highest total recorded over the period and almost 9 percentage
points higher than in 2011. Applications from 19 year olds were less likely to receive
an offer, compared to those from 18 year olds, but showed a similar pattern with an
increase in 2016 to 67.2 per cent, also a new high.
Offer rates to applicants aged between 20 and 25 increase in 2016, but fall for
older applicants
Applications from applicants aged 20 and over were less likely to receive offers than
those aged 18 and 19. In 2016, 57.7 per cent of applications from 20 year old
applicants received offers (up 0.9 percentage points from the 2015 cycle). The offer
rate of 45.1 per cent for applicants aged 21 to 25 was also up on 2015, by 0.2
percentage points.
The offer rate for applicants aged 26 and older was 35.7 per cent in 2016, a decrease
of 0.2 percentage points on 2015. This is the first time the offer rate had fallen for
this age group since 2011. The offer rate for those aged 26 and older was less than
half the offer rate for 18 year olds, with a gap of 40 percentage points between them
in 2016.
Figure 30 Offer rate (application level) for all main scheme applicants by age group,
excluding under 18s
Offer
rate
30%
40%
50%
60%
70%
80%
2008
2009
2010
2011
2012
2013
2014
2015
2016
181920
21 to 2526 and over

Security marking: PUBLIC Page 67 of 142
Document owner: UCAS Analysis & Research 15 December 2016
Offer-making by providers
Offer-making rates to applications will depend on the choices made by applicants (in
terms of the courses applied to) as well as the decisions made by providers.
However, since the pattern of choices made by applicants in terms of, for example,
tuition fees, has been shown to be generally similar over this period, changes in
trends in offer-making can be interpreted primarily as changes in provider offer-
making decisions – in particular, their demand for applicants of different types.
Given the strong association of the offer rate with age, this analysis concentrates on
offers made to 18 year old UK domiciled applicants to better identify changes in
provider behaviour.
English providers more likely than ever to make offers to UK 18 year olds, offer
rates from Scottish and Northern Irish providers continue to decrease
The proportion of applications from 18 year old UK domiciled applicants who receive
offers varies by the country of the provider. Between 2009 and 2011, applications
became less likely to receive offers from providers across the UK. From 2011 to
2014, the offer rates of English, Welsh, and Northern Irish providers increased year-
on-year. In 2015, the offer rate from English and Welsh providers increased while
the offer rate from Scottish and Northern Irish providers decreased. In 2016, this
pattern continued, with offer rates from English providers increasing by 0.7
percentage points to 78.3 per cent, the highest on record, while offer rates from
Northern Irish providers fell by 0.8 percentage points to 83.1 per cent. Offer rates
from Scottish providers fell by 0.6 percentage points to 62.0 per cent, meaning that
applications to Scottish providers continue to be less likely to receive offers than
applications made to providers in other countries. Offer rates from Welsh providers
remained unchanged at 84.4 per cent, meaning that applications to providers in
Wales were, on average, more likely to receive offers than applications made to
providers in other countries.

Security marking: PUBLIC Page 68 of 142
Document owner: UCAS Analysis & Research 15 December 2016
Figure 31 Offer rate (application level) to 18 year old UK main scheme applicants
by country of provider O
ffer
rate
40%
50%
60%
70%
80%
90%
2008
2009
2010
2011
2012
2013
2014
2015
2016
EnglandNorthern IrelandScotlandWales

Security marking: PUBLIC Page 69 of 142
Document owner: UCAS Analysis & Research 15 December 2016
English providers increase offer rates to 18 year olds from England, Northern
Ireland, and Wales
The offer rates in 2016 from English providers to applications from 18 year olds in
the different UK countries varied. The offer rate to applicants from Scotland was
61.2 per cent, 73.4 per cent for applicants from Northern Ireland, 75.8 per cent for
applicants from Wales, and 78.5 per cent for applicants from England. This range of
around 15 to 18 percentage points is common across the period, and the trends in
offer rates are generally undifferentiated by country of domicile.
In 2016, applications made to English providers from 18 year olds in all UK countries
were more likely than ever to receive offers – between 13 and 20 per cent more
likely (proportionally) than in 2011, when offer rates were at their lowest.
Figure 32 Offer rate (application level) from English providers to 18 year old UK
main scheme applicants by country of domicile
Offer
rate
fro
m E
nglis
h p
rovid
ers
40%
50%
60%
70%
80%
90%
2008
2009
2010
2011
2012
2013
2014
2015
2016
EnglandNorthern IrelandScotlandWales

Security marking: PUBLIC Page 70 of 142
Document owner: UCAS Analysis & Research 15 December 2016
Providers in Wales increase offer-making to Welsh applications
The large majority of UK applications to Welsh providers come from Wales and
England. The offer rate by Welsh providers in 2016 to applications from 18 year olds
was similar for applications from Wales and from England (just under 85 per cent).
The trends in offer rates have been similar to applicants from both countries over
the period, with offer rates to English applicants tending to be slightly higher.
The offer rate from Welsh providers increased by 0.7 percentage points to 84.5 per
cent for 18 year old applicants from Wales in 2016, its highest value on record, but
decreased by 0.4 percentage points for 18 year old applicants from England to 84.7
per cent. For 18 year old applicants from Wales, this followed increases in each cycle
from 2012 to 2015, meaning applications from Welsh applicants were 13 per cent
more likely to receive an offer than in 2011. English applicants to Welsh providers
are now 9 per cent more likely to receive an offer than in 2011.
Figure 33 Offer rate (application level) from Welsh providers to 18 year old UK
main scheme applicants from England and Wales
Offer
rate
fro
m W
els
h p
rovid
ers
40%
50%
60%
70%
80%
90%
2008
2009
2010
2011
2012
2013
2014
2015
2016
EnglandWales

Security marking: PUBLIC Page 71 of 142
Document owner: UCAS Analysis & Research 15 December 2016
Offer rates by Scottish providers to 18 year old applicants from England and
Northern Ireland at record level
In the 2008 and 2009 cycles, Scottish providers made offers to around three quarters
of applications from 18 year olds from Scotland, and around a half of applications
from 18 year olds from England. By 2011, offer-making rates to applications from
both countries had decreased to 57.4 per cent for Scottish applicants and 45.7 per
cent for English applicants.
In 2016, the offer rate to applications from Scottish applicants decreased by 1.6
percentage points to 59.6 per cent (-2.6 per cent proportionally) following a similar
decrease in 2014. The offer rate to applications from English applicants increased by
1.6 percentage points to 68.5 per cent (+2.4 per cent proportionally), exceeding the
previous recorded high of 66.9 per cent in 2015.
Since 2015, offer rates by Scottish providers to English and Northern Irish applicants
have been higher than offer rates to Scottish applicants. This contrasts to the period
between 2008 and 2011, when applications from Scottish applicants were more
likely to receive an offer than applications from English and Northern Irish
applicants. In 2016, applications from English and Northern Irish applicants were
around 15 per cent more likely to receive an offer than applications from Scottish
applicants.
Figure 34 Offer rate (application level) from Scottish providers to 18 year old UK
main scheme applicants from England, Northern Ireland, and Scotland
Offer
rate
fro
m S
cottis
h p
rovid
ers
40%
50%
60%
70%
80%
90%
2008
2009
2010
2011
2012
2013
2014
2015
2016
EnglandNorthern IrelandScotland

Security marking: PUBLIC Page 72 of 142
Document owner: UCAS Analysis & Research 15 December 2016
Small increase in offer rates for most predicted A level grade profiles in 2016
For 18 year old applicants who apply with A level results pending, it is possible to
investigate offer rates by the profile of three highest predicted A level grades. This
reflects the information available to the provider at the time the offer is made.
Figure 35 shows the offer rates to applications from English 18 year old applicants
across some of the most common predicted grade profiles.
The rank order of the level of offer-making to applicants holding each of these
profiles is complex, reflecting both provider decisions and the applicant choice of
course. For example, the offer rate to applications from applicants predicted AAB is
higher than for those predicted BBB. But when applicants are predicted one or more
A* grades, the offer rate goes down again, reflecting the different types of courses
applied to.
There was a relatively narrow range of offer rates across these grade profiles,
ranging (in 2016) from 77.8 per cent for A*A*A to 88.6 per cent for AAB. The offer
rates to applications from all selected grade profiles increased from 2012 to 2014,
and increased again in 2015 (with the exception of those predicted ABB). In the 2016
cycle, applications from those predicted BBB to AAB, and those predicted A*AA
increased the most, between 0.5 and 0.6 percentage points, while the offer rate for
those predicted AAA, A*A*A, and A*A*A* increased by just 0.1 percentage points.
Figure 35 Offer rate (application level) to 18 year old English domiciled main
scheme applicants by selected predicted grade profile of applicant
Offer
rate
60%
70%
80%
90%
100%
2010
2011
2012
2013
2014
2015
2016
A*A*A*A*A*AA*AAAAAAABABBBBB
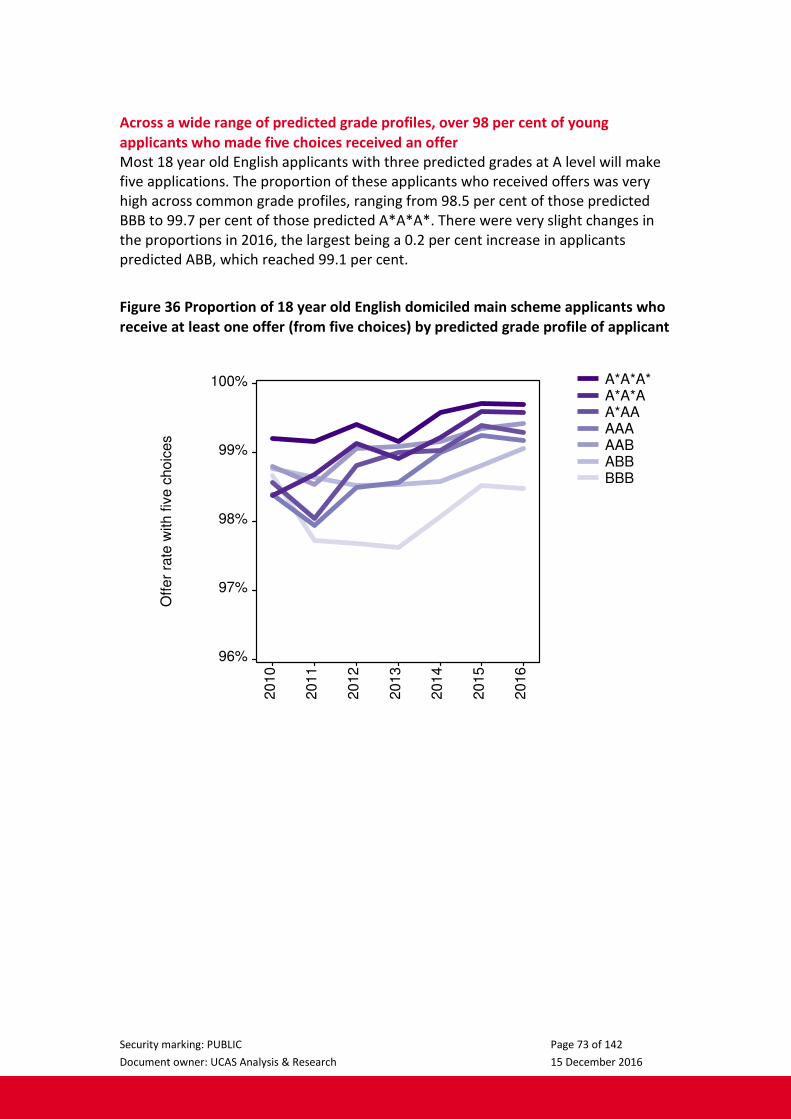
Security marking: PUBLIC Page 73 of 142
Document owner: UCAS Analysis & Research 15 December 2016
Across a wide range of predicted grade profiles, over 98 per cent of young
applicants who made five choices received an offer
Most 18 year old English applicants with three predicted grades at A level will make
five applications. The proportion of these applicants who received offers was very
high across common grade profiles, ranging from 98.5 per cent of those predicted
BBB to 99.7 per cent of those predicted A*A*A*. There were very slight changes in
the proportions in 2016, the largest being a 0.2 per cent increase in applicants
predicted ABB, which reached 99.1 per cent.
Figure 36 Proportion of 18 year old English domiciled main scheme applicants who
receive at least one offer (from five choices) by predicted grade profile of applicant
Offer
rate
with fiv
e c
hoic
es
96%
97%
98%
99%
100%
2010
2011
2012
2013
2014
2015
2016
A*A*A*A*A*AA*AAAAAAABABBBBB

Security marking: PUBLIC Page 74 of 142
Document owner: UCAS Analysis & Research 15 December 2016
Between one and two thirds of applicants receive five offers, depending on
predicted grades
Many 18 year old applicants who apply to five choices with three predicted A level
grades will get offers from all five of their applications. In 2016, the proportion
getting five offers ranged from 33.6 per cent of those predicted A*A*A to 65.0 per
cent of those predicted AAB.
In 2016, for applicants predicted between BBB and AAB, or predicted A*AA, the
probability of getting five offers was higher than in the previous cycle. Applicants
predicted these grades were proportionally 1 to 2 per cent more likely to receive five
offers than in 2015. The probability of applicants predicted AAA getting five offers
was around the same in 2016 as in 2015. Applicants predicted A*A*A were 3 per
cent less likely to receive five offers in 2016, compared to 2015, while those
predicted A*A*A* were 2 per cent less likely.
Between the 2011 and 2016 cycles, the proportion of applicants with predicted
grade profiles of AAB and above getting five offers increased by around a half. Over
the same period, the proportion of applicants with predicted grade profiles of ABB
and BBB getting five offers increased by around a third.
Figure 37 Proportion of 18 year old English domiciled main scheme applicants who
receive offers to each of their five choices by predicted grade profile of applicant
Pro
port
ion w
ith fiv
e o
ffers
15%
25%
35%
45%
55%
65%
2010
2011
2012
2013
2014
2015
2016
A*A*A*A*A*AA*AAAAAAABABBBBB
Security marking: PUBLIC Page 75 of 142
Document owner: UCAS Analysis & Research 15 December 2016
Acceptance routes
Record numbers accepted through firm choice
There are a number of different acceptance routes in the admissions cycle. Figure 38
shows the number of acceptances by acceptance route using a logarithmic scale, so
that the proportional changes can be seen more clearly across the large differences
in numbers accepted through the various routes.
Most acceptances, over 70 per cent, are from the applicant selecting an offer as their
firm choice and then satisfying any conditions attached to that offer. In 2016, firm
choice continued to be the most likely route of acceptance and the numbers
accepted by this route increased by 2,200 (+0.6 per cent proportionally) to 386,300,
the highest number of acceptances recorded through this route to date.
Number accepted through insurance choice and Extra unchanged in 2016
Acceptances through an insurance choice (for applicants who do not satisfy the
conditions of their firm offer) increased at a faster rate than acceptances through a
firm choice between 2006 and 2011, and then fell substantially in 2012. Between
2012 and 2015, the number of acceptances through this route increased each year,
and again by more proportionally than the acceptances to the firm route. In 2016
however, the number of acceptances through an insurance choice remained
constant at 39,500, accounting for 7.4 per cent of all acceptances that year.
Applicants who do not receive any offers from their five main scheme choices, or
decline any offers they do receive, are eligible to make choices through the Extra
process. Acceptances through Extra increased in each cycle between 2006 and 2011,
then fell substantially in 2012. Between 2012 and 2015, there were small decreases
in the number of these acceptances. In 2016, the number of acceptances through
the Extra route was 7,500, unchanged from 2015, and accounting for 1.4 per cent of
all acceptances.
Record number accepted through Clearing (from direct and main scheme)
There are two routes for Clearing: an applicant may have been unsuccessful in the
main scheme and then found a place in the Clearing process, or an applicant may
have applied directly to the Clearing process. Acceptances through the Clearing
process for those who were unsuccessful in the main scheme increased in 2016 to
50,000 (+900, +1.8 per cent proportionally), the highest recorded level. In 2016, the
number of applicants accepted by applying directly to the Clearing process fell to
14,900 (-400, -2.4 per cent proportionally). The total placed through both Clearing
routes was 64,900, an increase of 500 (+0.8 per cent proportionally) from 2015, and
the highest number ever placed through the Clearing routes. In 2016, 12.1 per cent
of acceptances were though Clearing.

Security marking: PUBLIC Page 76 of 142
Document owner: UCAS Analysis & Research 15 December 2016
Number accepted through Adjustment continues to fall
The Adjustment route (where applicants can ‘adjust’ to a place at another provider if
they meet and exceed the conditions of their firm choice) was used by 900
acceptances in 2016, down by a fifth (-200, -21.3 per cent proportionally) and still a
very small share of acceptances.
Figure 38 Acceptances by acceptance route (logarithmic scale)
Accepta
nces
100
500
1,000
5,000
10,000
50,000
100,000
500,000
2006
2007
2008
2009
2010
2011
2012
2013
2014
2015
2016
AdjustmentFirm choiceInsurance choiceExtraClearing (mainscheme apps)Clearing (direct apps)Other mainschemeRPA
UK 18 year olds: record numbers of firm and main scheme Clearing accepts
The profile of acceptance routes varies across age and domicile groups. Figure 39
shows the trends in the number of UK 18 year olds entering by acceptance route.
Acceptances through the firm choice route dominate (179,500, 75 per cent of all
acceptances) and increased slightly in 2016 (+1,600, +0.9 per cent proportionally).
The number accepted through their insurance choice was 25,600 in 2016, an
increase on 2015 of 400, +1.5 per cent proportionally.
The number accepted through Clearing after applying in the main scheme increased
by 1,700 (+6.7 per cent proportionally) to 26,500, the highest recorded. Applying and
being accepted direct to Clearing is a less frequently used route for this group of
applicants, and has remained constant at 1,500.
In 2016, the number of UK 18 year olds accepted through Extra was 2,700, which
remains unchanged from 2015.

Security marking: PUBLIC Page 77 of 142
Document owner: UCAS Analysis & Research 15 December 2016
Adjustment usage fell in 2016 with 600 (-100, -18 per cent proportionally) UK 18 year
olds placed through this route.
Figure 39 UK domiciled 18 year old acceptances by acceptance route (logarithmic
scale)
Acce
pta
nce
s
100
500
1,000
5,000
10,000
50,000
100,000
500,0002
00
6
20
07
20
08
20
09
20
10
20
11
20
12
20
13
20
14
20
15
20
16
AdjustmentFirm choiceInsurance choiceExtraClearing (mainscheme apps)Clearing (direct apps)Other mainschemeRPA
Security marking: PUBLIC Page 78 of 142
Document owner: UCAS Analysis & Research 15 December 2016
Entry rates by background
Entry rates for 18 year olds can differ across various dimensions, specifically sex,
ethnic group, where people live (using the POLAR3 classification), secondary
education school sector (state or private), and income background (as measured by
whether a person was in receipt of free school meals (FSM), a means-tested benefit
while at school). Statistical methods can be used that consider differences across all
of these characteristics simultaneously to provide an overall measure of the
difference in entry rates. This is important because there is a wide variation in entry
rates across combinations of these groups (see UCAS Undergraduate End of Cycle
Report 2015). Entry rates are used in these calculations because they directly
measure the level of representation of different groups in HE, allowing the
identification of those who are ‘disadvantaged’ in terms of their entry rate to
university.
Combining multiple equality dimensions into a single equality measure
Using statistical modelling techniques and a linked data set of pupils in English
schools (including those in independent schools) who were aged 18 between 2006
and 2010 (source: National Pupil Database and School Census, Department for
Education), a range of equality dimensions (sex, ethnic group, POLAR3, secondary
education sector type, and FSM status1) are combined to create an equality
measure, which can then be estimated for pupils who were aged 18 in later years.
The methods used seek to predict whether an individual enters higher education or
not when aged 18, using only the equality characteristics and their interactions with
each other. The resulting predicted entry probability, termed the multiple equality
measure (abbreviated to MEM), is based on 2006 to 2010 data, and is used to
aggregate pupils into groups, where group 1 contains those least likely to enter
higher education (‘most disadvantaged’ in this context), and group 5 contains those
most likely to enter higher education (‘most advantaged’ in this context). Entry rates
can then be calculated for each group and the trend assessed between groups across
time.
The way in which the multiple equality measure groups are formed means that
within a group, there is a mixture of people from different backgrounds and with
different characteristics. For example, 64 per cent of young people in MEM group 1
were from POLAR3 Q1 (most disadvantaged) areas, and 4 per cent were from Q5
(most advantaged) areas. Similarly, 59 per cent of people in MEM group 1 were
pupils previously in receipt of free school meals, 74 per cent were men, and 91 per
cent were from the White ethnic group.
1 The National Pupil Database and School Census only records the ethnic group and geographical
information (from which POLAR3 quintile is derived) of pupils in state schools. Pupils in independent
schools, who have high entry rates, were assigned to have a separate ethnic group and POLAR3
quintile outside of the normal groupings.
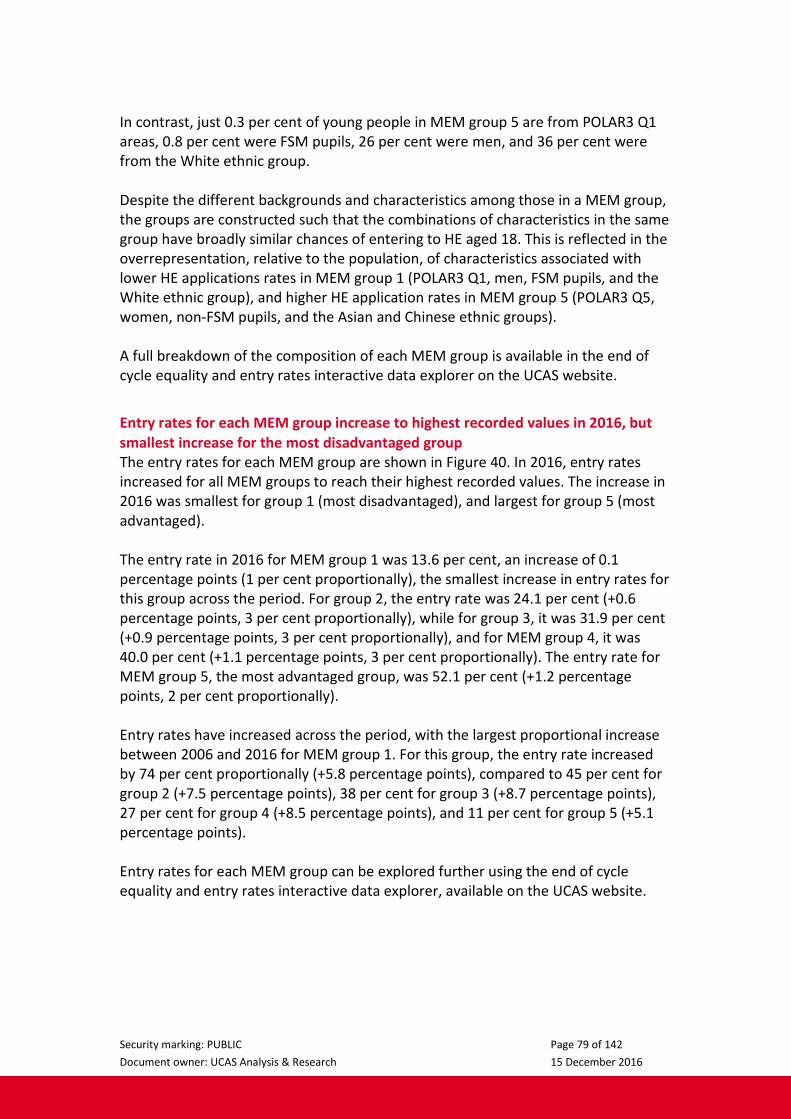
Security marking: PUBLIC Page 79 of 142
Document owner: UCAS Analysis & Research 15 December 2016
In contrast, just 0.3 per cent of young people in MEM group 5 are from POLAR3 Q1
areas, 0.8 per cent were FSM pupils, 26 per cent were men, and 36 per cent were
from the White ethnic group.
Despite the different backgrounds and characteristics among those in a MEM group,
the groups are constructed such that the combinations of characteristics in the same
group have broadly similar chances of entering to HE aged 18. This is reflected in the
overrepresentation, relative to the population, of characteristics associated with
lower HE applications rates in MEM group 1 (POLAR3 Q1, men, FSM pupils, and the
White ethnic group), and higher HE application rates in MEM group 5 (POLAR3 Q5,
women, non-FSM pupils, and the Asian and Chinese ethnic groups).
A full breakdown of the composition of each MEM group is available in the end of
cycle equality and entry rates interactive data explorer on the UCAS website.
Entry rates for each MEM group increase to highest recorded values in 2016, but
smallest increase for the most disadvantaged group
The entry rates for each MEM group are shown in Figure 40. In 2016, entry rates
increased for all MEM groups to reach their highest recorded values. The increase in
2016 was smallest for group 1 (most disadvantaged), and largest for group 5 (most
advantaged).
The entry rate in 2016 for MEM group 1 was 13.6 per cent, an increase of 0.1
percentage points (1 per cent proportionally), the smallest increase in entry rates for
this group across the period. For group 2, the entry rate was 24.1 per cent (+0.6
percentage points, 3 per cent proportionally), while for group 3, it was 31.9 per cent
(+0.9 percentage points, 3 per cent proportionally), and for MEM group 4, it was
40.0 per cent (+1.1 percentage points, 3 per cent proportionally). The entry rate for
MEM group 5, the most advantaged group, was 52.1 per cent (+1.2 percentage
points, 2 per cent proportionally).
Entry rates have increased across the period, with the largest proportional increase
between 2006 and 2016 for MEM group 1. For this group, the entry rate increased
by 74 per cent proportionally (+5.8 percentage points), compared to 45 per cent for
group 2 (+7.5 percentage points), 38 per cent for group 3 (+8.7 percentage points),
27 per cent for group 4 (+8.5 percentage points), and 11 per cent for group 5 (+5.1
percentage points).
Entry rates for each MEM group can be explored further using the end of cycle
equality and entry rates interactive data explorer, available on the UCAS website.
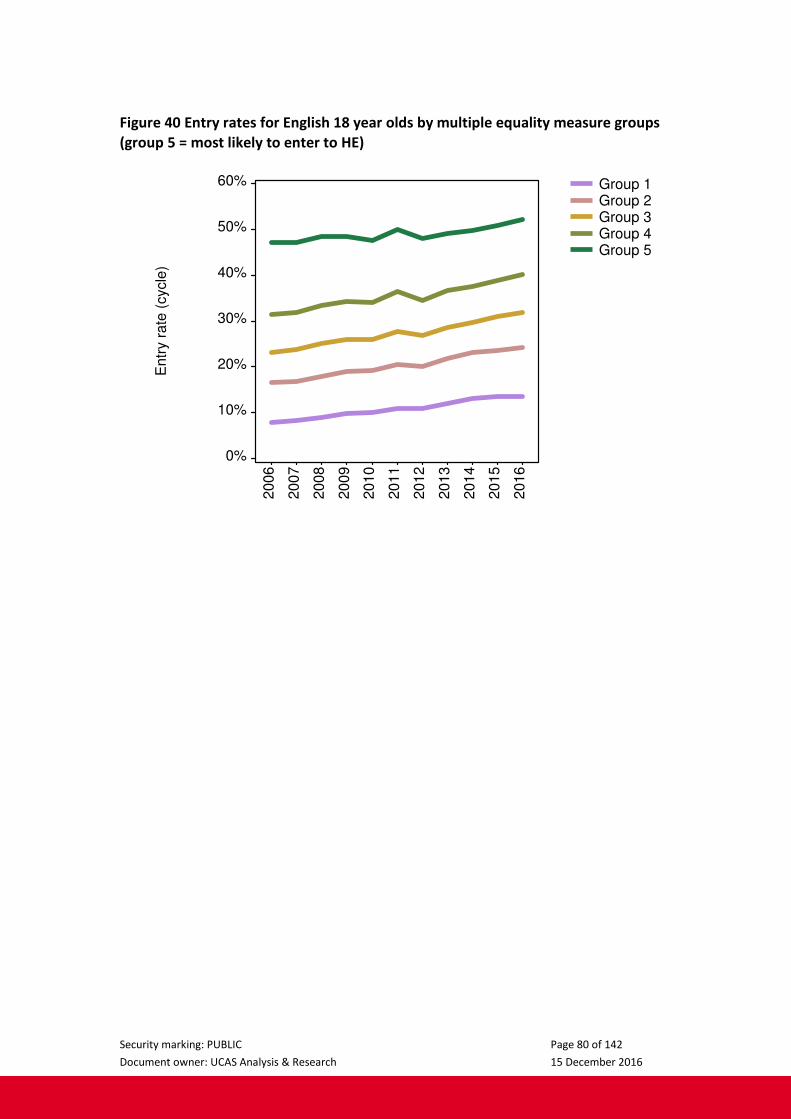
Security marking: PUBLIC Page 80 of 142
Document owner: UCAS Analysis & Research 15 December 2016
Figure 40 Entry rates for English 18 year olds by multiple equality measure groups
(group 5 = most likely to enter to HE)
Entr
y r
ate
(cycle
)
0%
10%
20%
30%
40%
50%
60%
2006
2007
2008
2009
2010
2011
2012
2013
2014
2015
2016
Group 1Group 2Group 3Group 4Group 5
Security marking: PUBLIC Page 81 of 142
Document owner: UCAS Analysis & Research 15 December 2016
Entry rate ratio for the most advantaged to most disadvantaged multiple equality
measure groups has remained stable since 2014
Figure 41 shows the ratio of 18 year old entry rates for MEM group 5 to MEM group
1. In 2006, this entry rate ratio was 6.0, meaning the most advantaged 18 year olds,
according to the MEM, were six times more likely to enter than the most
disadvantaged. The ratio decreased in each of the subsequent eight years to reach
3.8 in 2014, meaning that entry rates between the most advantaged and
disadvantaged areas became more equal on this measure. The ratio remained at 3.8
in 2015 (the first time it had not fallen since 2006) and again in 2016.
Figure 41 18 year old entry rate ratio: Multiple equality measure groups (group
5:group 1)
En
try r
ate
ra
tio
(G
rou
p5
:Gro
up
1)
1.0
2.0
3.0
4.0
5.0
6.0
7.0
20
06
20
07
20
08
20
09
20
10
20
11
20
12
20
13
20
14
20
15
20
16
Multiple equality measure

Security marking: PUBLIC Page 82 of 142
Document owner: UCAS Analysis & Research 15 December 2016
Entry rates to higher tariff providers for those least likely to enter HE are 57 per
cent higher than ten years ago
Figure 42 shows the entry rates to higher tariff providers for each multiple equality
measure group. Due to the large range across the groups, entry rates are plotted on
a logarithmic scale (to show the proportional changes more clearly). There is a
marked progression from lower to higher entry rates across the disadvantaged to
advantaged groups that is maintained throughout the period. This is characterised
by each group being between 50 and 140 per cent more likely to be accepted to
higher tariff providers than the preceding (more disadvantaged) group.
In 2016, 2.3 per cent of 18 year olds from the most disadvantaged MEM group
(those least likely to enter to HE) entered a higher tariff provider. This is an increase
of 0.1 percentage points (+5 per cent proportionally) on 2015, and 0.8 percentage
points (+57 per cent proportionally) higher than in 2006.
The entry rate for MEM group 2 to higher tariff providers in 2016 was 5.3 per cent,
for MEM group 3 it was 8.0 per cent, and for MEM group 4 it was 12.4 per cent.
These rates were between 3 to 5 per cent higher than they were in 2015, and
between 20 and 30 per cent higher than they were in 2006.
18 year olds from the most advantaged MEM group (those most likely to enter to
HE) had an entry rate of 24.5 per cent in 2016, an increase of 0.2 percentage points
(+1 per cent proportionally) on 2015, and 1.1 percentage points (+5 per cent
proportionally) on 2006.
These patterns in entry rates mean that 18 year olds from the most advantaged
MEM group were over ten and a half times more likely to enter a higher tariff
provider than 18 year olds from the most disadvantaged MEM group, down from
being 16 times more likely in 2006. These ratios are higher than those found when
the groups are based on POLAR3 alone, as the additional characteristics used in the
MEM groups permit a greater separation of advantaged and disadvantaged groups
in this regard.
Entry rates for each MEM group to higher tariff providers can be explored further
using the end of cycle equality and entry rates interactive data explorer, available on
the UCAS website.

Security marking: PUBLIC Page 83 of 142
Document owner: UCAS Analysis & Research 15 December 2016
Figure 42 Entry rates for English 18 year olds by multiple equality measure groups
to higher tariff providers (logarithmic scale)
Entr
y r
ate
(cycle
)
1%
5%
10%
20%
30%
2006
2007
2008
2009
2010
2011
2012
2013
2014
2015
2016
Group 1Group 2Group 3Group 4Group 5

Security marking: PUBLIC Page 84 of 142
Document owner: UCAS Analysis & Research 15 December 2016
Entry rates to medium tariff providers increase in 2016 across all multiple equality
measure groups
Since 2006, entry rates for all multiple equality measure groups have increased. In
2016, 4.4 per cent of 18 year olds in MEM group 1 entered a medium tariff provider,
an increase of 0.4 percentage points (+9 per cent proportionally) on 2015. For 18
year olds in MEM group 5, the entry rate was 15.2 per cent in 2016, an increase of
1.0 percentage point (+7 per cent proportionally) on 2015.
These patterns in entry rates mean that 18 year olds from the most advantaged
MEM group were three and half times more likely to enter a medium tariff provider
than 18 year olds from the most disadvantaged MEM group. This has fallen from
being five and a half times more likely at the start of the period in 2006.
Entry rates in 2016 were 8.3 per cent for MEM group 2, 11.0 per cent for MEM group
3, and 13.7 per cent for MEM group 4, between 0.6 and 1.1 percentage points (+8 to
+9 per cent proportionally) higher than in 2015. In 2016, the entry rate for MEM
group 2 was almost double (91 per cent proportionally) the entry rate for MEM
group 1. This is larger than, for example, the proportional difference in entry rates
between MEM group 5 and MEM group 2 (82 per cent).
Entry rates to medium tariff providers for MEM groups can be explored further using
the end of cycle equality and entry rates data explorer on the UCAS website.
Figure 43 Entry rates for English 18 year olds by multiple equality measure groups
to medium tariff providers (logarithmic scale)
En
try r
ate
(cycle
)
1%
5%
10%
20%
30%
20
06
20
07
20
08
20
09
20
10
20
11
20
12
20
13
20
14
20
15
20
16
Group 1Group 2Group 3Group 4Group 5

Security marking: PUBLIC Page 85 of 142
Document owner: UCAS Analysis & Research 15 December 2016
Entry rates to lower tariff providers fall across all multiple equality measure groups
for the first time since 2012
Entry rates to lower tariff providers across the multiple equality measure groups are
closer together than they are for higher and medium tariff providers. In 2016, the
entry rate for MEM group 1 was 6.9 per cent, the lowest of all the groups. For MEM
group 2, the entry rate in 2016 was 10.6 per cent, for MEM group 3 it was 13.0 per
cent, for group 4 it was 13.9 per cent (the highest of all the groups), and for MEM
group 5 the entry rate was 12.4 per cent.
These patterns in entry rates mean that in 2016, 18 year olds from the most
advantaged MEM group were over one and half times more likely to enter a lower
tariff provider than 18 year olds from the most disadvantaged MEM group.
Entry rates to lower tariff providers have increased since 2006 for all MEM groups,
by 72 per cent for group 1 (the largest proportional increase of all the groups), and
by 14 per cent for group 5 (the smallest proportional increase of all the groups). In
2016, the entry rates decreased for all MEM groups, by between 5 per cent
proportionally (group 1), and 0.4 per cent proportionally (group 5).
Entry rates for each MEM group can be explored further using the end of cycle
equality and entry rates interactive data explorer, available on the UCAS website.
Figure 44 Entry rates for English 18 year olds by multiple equality measure groups
to lower tariff providers (logarithmic scale)
Entr
y r
ate
(cycle
)
1%
5%
10%
20%
30%
2006
2007
2008
2009
2010
2011
2012
2013
2014
2015
2016
Group 1Group 2Group 3Group 4Group 5
Security marking: PUBLIC Page 86 of 142
Document owner: UCAS Analysis & Research 15 December 2016
Entry rates for single equality dimensions
The multiple equality measure statistics give an overall picture of the differences and
trends in entry rates across the young population. The levels and trends in the entry
rates are reported below for each of the equality dimensions used to create the
multiple equality measure. These trends help to understand the relationship
between each equality dimension, and the patterns in entry rates across the groups
formed from the multiple equality measure.
18 year old women over a third more likely to enter higher education than men
In 2016, around 37 per cent of the UK 18 year old population applied to higher
education through UCAS, and around 32 per cent were accepted for entry. These
national rates were a mixture of different rates for men and women. Figure 45
shows the application rates and entry rates for UK domiciled 18 year old men and
women.
The application rate for women was substantially higher than that for men for the
whole period. Despite increases in the application rate for men since 2006, the
application rate for men in 2016 (31.9 per cent) remained below the level for women
ten years previously in 2006 (33.3 per cent). For both men and women, the
application rate increased in 2016 (2.8 per cent proportionally for men, 2.9 per cent
for women). In 2016, as in most of the more recent cycles, 18 year old women were
around a third more likely (36 per cent proportionally) to apply than 18 year old
men, but the percentage point difference widened for a third successive year in 2016
to 11.5 percentage points.
The entry rate for women was considerably higher than the entry rate for men
across the whole period. For 18 year olds in 2016, the entry rate increased (3.7 per
cent proportionally for men, 3.8 per cent for women) to the highest recorded levels
for both men (27.2 per cent) and women (36.8 per cent). As with application rates,
18 year old women were around a third (35 per cent) more likely to enter higher
education than 18 year old men. The entry rate for women remains higher than the
application rate for men.
The absolute difference in entry rates between men and women widened by 0.4
percentage points in 2016 to 9.6 percentage points – the largest difference
recorded. The difference in 18 year old entry rates between men and women
equates to 37,000 fewer 18 year old men entering higher education this year than
would be the case if men had the same entry rate as women.
The overall UK 18 year old application and entry rates increased in 2016. The
application rate in 2016 was 37.5 per cent, 1.0 percentage point higher than in 2015
(+3 per cent proportionally). The entry rate in 2016 was 31.9 per cent, an increase of
1.2 percentage points (+4 per cent proportionally) on 2015.

Security marking: PUBLIC Page 87 of 142
Document owner: UCAS Analysis & Research 15 December 2016
Entry rates by sex for 18 year olds from England, Northern Ireland, Scotland, and
Wales can be explored further in the end of cycle equality and entry rates interactive
data explorer, available on the UCAS website.
Figure 45 UK domiciled 18 year old application and entry rates by sex
Applic
ation a
nd e
ntr
y r
ate
15%
20%
25%
30%
35%
40%
45%
2006
2007
2008
2009
2010
2011
2012
2013
2014
2015
2016
Application: MenApplication: WomenEntry: MenEntry: Women
Figure 46 UK domiciled 18 year old application and entry rates
Applic
ation a
nd e
ntr
y r
ate
15%
20%
25%
30%
35%
40%
45%
2006
2007
2008
2009
2010
2011
2012
2013
2014
2015
2016
ApplicationEntry

Security marking: PUBLIC Page 88 of 142
Document owner: UCAS Analysis & Research 15 December 2016
By age 19, 47 per cent of women have entered higher education, over 11
percentage points higher than men
Cohort application rates and cohort entry rates for UK domiciled young men and
women are shown in Figure 47. These measures combine the proportion of the
population that applied or were accepted for entry at age 18, with the proportion of
the same population that applied or were accepted for entry at age 19 a year later.
As such, they give a representation of the total proportion of a young cohort that has
been accepted for entry into higher education by age 19. These rates have the
drawback that they cannot yet be reported for the cohort that was aged 18 in 2015,
since they have not yet had the opportunity to apply at age 19.
For the 2015 cohort (those who were 18 in 2015, and 19 in 2016), the cohort
application rate for women was 52.8 per cent, compared to 40.2 per cent for men.
The cohort entry rate was 47.2 per cent for women who were aged 18 in 2015,
compared to 36.0 per cent for men.
Throughout this period, the application rate and entry rate for each cohort of young
women was substantially higher than the application rate and entry rate for each
cohort of young men. For the 2015 cohort, women were 31 per cent more likely to
apply for higher education by age 19 than men, and 31 per cent more likely to be
accepted to enter higher education by age 19.
For both women and men, the cohort application and entry rates have increased
since 2006. The cohort of young women that was 18 in 2015 was around 26 per cent
more likely to apply, and 29 per cent more likely to be accepted to enter higher
education than the cohort that was 18 in 2006. For men, the cohort that was 18 in
2015 was around 21 per cent more likely to apply and 22 per cent more likely to be
accepted than the cohort that was 18 in 2006.
For the 2015 cohort, application and entry rates increased for both sexes to their
highest levels. The entry rate for women increased by 1.1 percentage points (2.3 per
cent proportionally). Although the cohort entry rate for men increased, it did so by
only 0.1 percentage points (0.3 per cent proportionally), a much smaller increase
than for recent cohorts. These different patterns of increases for men and women
mean that the difference in the cohort entry rates between men and women has
increased to 11.1 percentage points, the largest recorded.
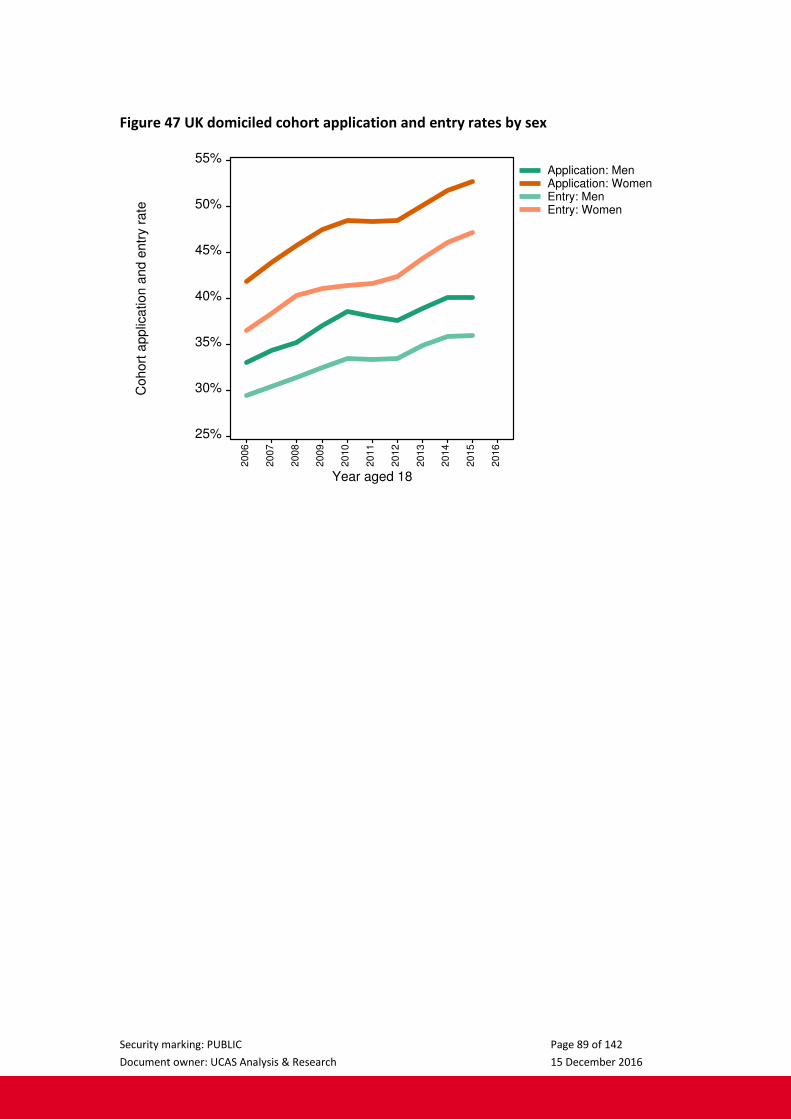
Security marking: PUBLIC Page 89 of 142
Document owner: UCAS Analysis & Research 15 December 2016
Figure 47 UK domiciled cohort application and entry rates by sex C
ohort
applic
ation a
nd e
ntr
y r
ate
25%
30%
35%
40%
45%
50%
55%
Year aged 18
20
06
20
07
20
08
20
09
20
10
20
11
20
12
20
13
20
14
20
15
20
16
Application: MenApplication: WomenEntry: MenEntry: Women

Security marking: PUBLIC Page 90 of 142
Document owner: UCAS Analysis & Research 15 December 2016
Women becoming substantially more likely to enter higher tariff providers than
men
Figure 48 shows the trend in the entry rate ratio for women to men (that is, how
much more likely women are to enter HE than men) for higher, medium, and lower
tariff providers. The entry rate ratios were greater than 1.0 for entry to all three
provider tariff groups, showing that 18 year old women have been consistently more
likely to enter all types of higher education than 18 year old men.
Over the last decade, the relative difference between men and women entering
higher tariff providers increased. In 2006, women were 18 per cent more likely to
enter higher tariff providers than men. By 2015, this had increased, so that women
were 28 per cent more likely to enter than men. In 2016, the difference increased
again, so women were 32 per cent more likely to enter than men, the highest
relative difference in this period.
The entry rate ratio for medium tariff providers in 2016 was 1.3. That is, women
were just under a third more likely to enter medium tariff providers than men. The
entry rate ratio for medium tariff providers fell in 2016, reversing the increase in
2015 and taking the entry rate ratio for medium tariff providers below that of high
tariff providers for the first time.
Lower tariff providers have had the greatest entry rate ratio between men and
women for each cycle. The ratio has been relatively variable from cycle to cycle
(compared to higher and medium tariff providers), but has been at least 1.4 in every
year. In 2016, the entry rate ratio remained constant, with 18 year old UK women 45
per cent more likely to enter lower tariff providers than men.
Entry rates for UK 18 year olds to higher, medium, and lower tariff providers by sex
can be explored further using the end of cycle equality and entry rates interactive
data explorer, available on the UCAS website.
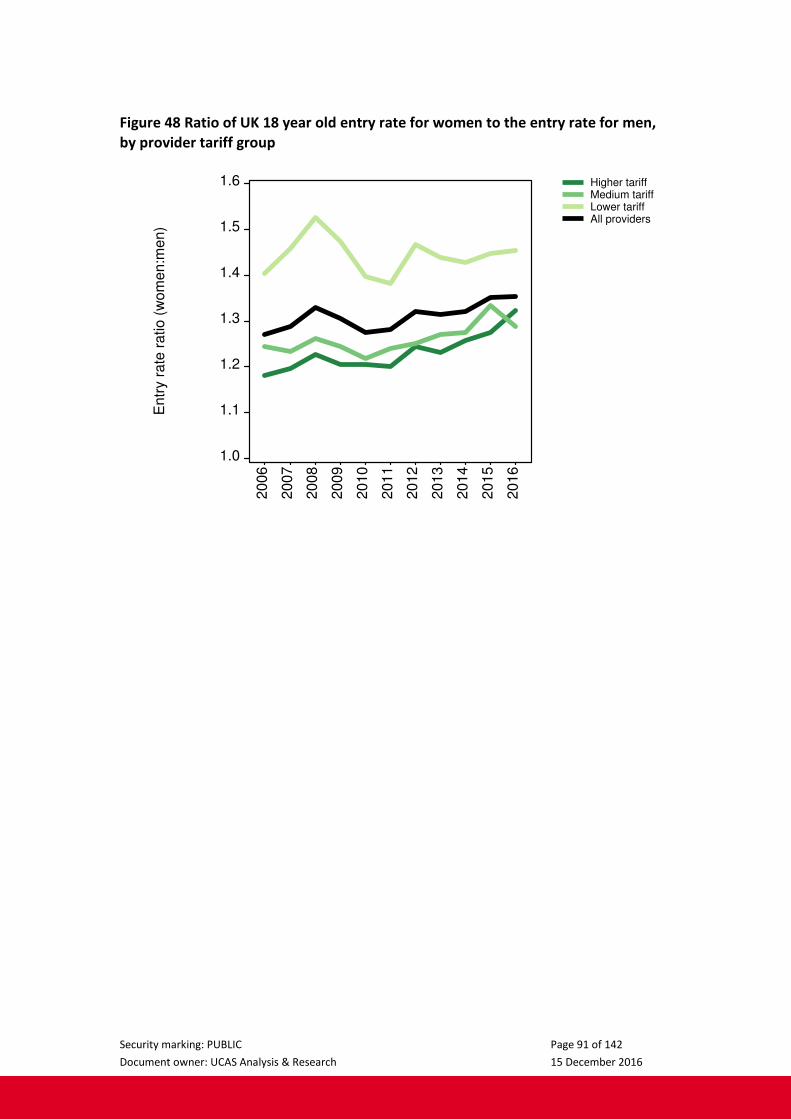
Security marking: PUBLIC Page 91 of 142
Document owner: UCAS Analysis & Research 15 December 2016
Figure 48 Ratio of UK 18 year old entry rate for women to the entry rate for men,
by provider tariff group E
ntr
y r
ate
ratio (
wom
en:m
en)
1.0
1.1
1.2
1.3
1.4
1.5
1.6
2006
2007
2008
2009
2010
2011
2012
2013
2014
2015
2016
Higher tariffMedium tariffLower tariffAll providers

Security marking: PUBLIC Page 92 of 142
Document owner: UCAS Analysis & Research 15 December 2016
Entry rates for disadvantaged 18 year olds increase in all UK countries
Figure 49 shows the proportion of the 18 year old population living in the most
disadvantaged areas (POLAR3 Q1) that were accepted for entry, by country of
domicile. The entry rates for Scotland will be lower than the total entry rates to
higher education, since not all higher education providers in Scotland use UCAS.
In 2016, the entry rates increased for England to 19.5 per cent (+1.0 percentage
point, +5 per cent proportionally), for Scotland to 10.7 per cent (+0.2 percentage
points, +2 per cent proportionally), for Northern Ireland to 16.0 per cent (+0.2
percentage points, +1 per cent proportionally), and for Wales to 18.2 per cent (+1.6
percentage points, +10 per cent proportionally). These increases continue the longer
term trend of increasing entry rates for disadvantaged 18 year olds across the
period, with entry rates increasing to the highest recorded values in each country,
with the exception of Northern Ireland, where they are at their second highest
recorded level.
Entry rates for disadvantaged 18 year olds increase by nearly a third in five years in
England, and by nearly three quarters since 2006
In all countries, the entry rate for 18 year olds from the most disadvantaged areas
increased over the period between 2006 and 2016. Compared with entry rates from
five years ago, in 2011, 18 year olds from these disadvantaged areas were around 29
per cent (England), 18 per cent (Northern Ireland), and 35 per cent (Scotland and
Wales) more likely to be accepted for entry in 2016.
Disadvantaged young people in England have become more likely to enter higher
education in every cycle in the period. They are now around 73 per cent more likely
to enter in 2016 than they were in 2006.
In 2016, disadvantaged young people in Northern Ireland were 31 per cent more
likely to enter higher education than in 2006. In Wales, disadvantaged young people
were 45 per cent more likely to enter than in 2006, while in Scotland, they were 57
per cent more likely to enter.
Entry rates for advantaged 18 year olds at similar levels to recent cycles
Figure 50 shows the entry rate of 18 year olds from the most advantaged areas
(POLAR3 Q5) by country. The entry rates for Scotland will be lower than the total
entry rates to higher education, since not all higher education providers in Scotland
use UCAS. The entry rates across all countries are generally three to four times
higher than for the most disadvantaged group, but do not show the same pattern of
increase over the period.
In England, the entry rate for 18 year olds living in advantaged areas increased to
46.3 per cent (+1.5 percentage points, 3.2 per cent proportionally) in 2016. In Wales,
the entry rate increased to 46.4 per cent (+2.5 percentage points, 5.8 per cent
proportionally) in 2016. The entry rate for 18 year olds living in advantaged areas
also increased in Scotland, standing at 37.6 per cent (+0.9 percentage points, 2.5 per

Security marking: PUBLIC Page 93 of 142
Document owner: UCAS Analysis & Research 15 December 2016
cent proportionally) in 2016. In Northern Ireland, the entry rate remained constant
in 2016 at 46.2 per cent, 0.5 percentage points higher than in 2006 (1 per cent
proportionally).
18 year old entry rates by POLAR3 quintile and country can be explored further in
the end of cycle equality and entry rates interactive data explorer, available on the
UCAS website.
Figure 49 18 year old entry rates for disadvantaged areas (POLAR3 Q1) by country
of domicile
Entr
y r
ate
(cycle
)
0%
5%
10%
15%
20%
25%
2006
2007
2008
2009
2010
2011
2012
2013
2014
2015
2016
EnglandNorthern IrelandScotlandWales

Security marking: PUBLIC Page 94 of 142
Document owner: UCAS Analysis & Research 15 December 2016
Figure 50 18 year old entry rates for advantaged areas (POLAR3 Q5) by country of
domicile E
ntr
y r
ate
(cycle
)
30%
35%
40%
45%
50%
55%
2006
2007
2008
2009
2010
2011
2012
2013
2014
2015
2016
EnglandNorthern IrelandScotlandWales

Security marking: PUBLIC Page 95 of 142
Document owner: UCAS Analysis & Research 15 December 2016
Entry rate differences by background unchanged in all UK countries
Figure 51 shows, for each country of the UK, relative differences in the entry rates of
18 year olds by background. It shows the entry rate ratio, quantifying how much
more likely those in the most advantaged areas were to enter higher education than
those in the most disadvantaged areas. That is, the entry rate from the most
advantaged areas divided by the entry rate for the most disadvantaged areas. An
entry rate ratio of 1.0 indicates equal chances of entering higher education for the
two groups. Entry rate ratios greater than 1.0 indicate that 18 year olds from the
most advantaged backgrounds are more likely to enter than those from the most
disadvantaged areas – for example, an entry ratio of 2.5 means the advantaged
group is two and half times more likely to enter than the disadvantaged group.
In all four countries, 18 year olds living in the most advantaged areas were much
more likely to enter higher education than 18 year olds in the most disadvantaged
areas. This relative difference decreased between 2006 and 2016. In 2016, the
differences between the advantaged and disadvantaged areas remained broadly
unchanged in England (2.4), Scotland (3.5), Northern Ireland (2.9) and Wales (2.6),
since 2015. In 2006, the entry rate ratios were: England (3.7), Northern Ireland (3.7),
Scotland (5.5) and Wales (3.5).
In each cycle, the entry rate ratio was greater for applicants domiciled in Scotland,
though this difference reduced over the period. This may reflect that not all higher
education admissions in Scotland are recorded through UCAS.
Figure 51 18 year old entry rate ratios: most advantaged areas (POLAR3 Q5)
relative to most disadvantaged areas (POLAR3 Q1) by country of domicile
Entr
y r
atio (
Q5:Q
1)
1
2
3
4
5
6
7
2006
2007
2008
2009
2010
2011
2012
2013
2014
2015
2016
EnglandNorthern IrelandScotlandWales

Security marking: PUBLIC Page 96 of 142
Document owner: UCAS Analysis & Research 15 December 2016
Highest recorded entry rates for English 18 year olds from all backgrounds
Figure 52 shows the entry rates for English 18 year olds by area-based background
(POLAR3). There is a progression from lower to higher entry rates across the
disadvantaged to advantaged groups that is maintained throughout the period. The
entry rates for all groups increased across the period.
In the 2016 cycle, entry rates increased from 2015 in each of the groups. The most
disadvantaged group (POLAR3 Q1) had the largest proportional increase of 5.3 per
cent, compared to proportional increases of 3 to 4 per cent for the other groups. The
most advantaged group (POLAR3 Q5) had the largest percentage point increase (1.5
percentage points), compared to +1 percentage point increases for the other groups.
The increase in entry rates for each group mean that the 2016 entry rate was the
highest recorded for all groups. The entry rates in 2016 were 19.5 per cent in quintile
1 (Q1), 26.2 per cent in quintile 2 (Q2), 31.5 per cent in quintile 3 (Q3), 37.2 per cent
in quintile 4 (Q4), and 46.3 per cent in quintile 5 (Q5).
Entry rates by POLAR3 quintile for 18 year olds in England, Northern Ireland,
Scotland, and Wales can be explored further using the end of cycle equality and
entry rates interactive data explorer, available on the UCAS website.
Figure 52 18 year olds in England, entry rates by POLAR3 groups (Q5 = advantaged)
Entr
y r
ate
(cycle
)
0%
10%
20%
30%
40%
50%
2006
2007
2008
2009
2010
2011
2012
2013
2014
2015
2016
Q1Q2Q3Q4Q5
Security marking: PUBLIC Page 97 of 142
Document owner: UCAS Analysis & Research 15 December 2016
Cohort entry rates increase to new highs for young people from disadvantaged
backgrounds
Figure 53 reports cohort entry rates for English young people by area-based
background. This measure combines the proportion of the population accepted for
entry at age 18 with the proportion of the same population accepted for entry at age
19, a year later. As such, it gives a representation of the total proportion of a young
cohort that has been accepted for entry into higher education by age 19. It is
therefore unaffected by people switching their age of entry between age 18 and age
19.
The entry rates are higher on this cohort measure than for entry at age 18 alone. For
the young cohort that was aged 18 in 2015 and living in the most disadvantaged
areas (POLAR3 Q1), 26.0 per cent were accepted for entry aged either 18 in 2015 or
19 in 2016. This is an increase of 0.7 percentage points (2.7 per cent proportionally)
on the previous cohort (2014).
The cohort rate for those living in the most disadvantaged areas has increased by
between half a percentage point and 2 percentage points each year, resulting in the
entry rate for the 2015 cohort being 10.3 percentage points (65 per cent
proportionally) higher than the 2006 cohort.
For 18 year olds in 2015 living in the most advantaged areas (POLAR3 Q5), 59.4 per
cent – around three in every five young people – were accepted for entry aged
either 18 in 2015 or 19 in 2016. This is a decrease (-0.4 percentage points, -0.7 per
cent proportionally) in the cohort entry rate for this group on the previous cohort.

Security marking: PUBLIC Page 98 of 142
Document owner: UCAS Analysis & Research 15 December 2016
Figure 53 Young entry rate (cohort) in England by POLAR3 groups (Q5 =
advantaged)
Entr
y r
ate
(cohort
)
10%
20%
30%
40%
50%
60%
70%
Year aged 18
20
06
20
07
20
08
20
09
20
10
20
11
20
12
20
13
20
14
20
15
20
16
Q1Q2Q3Q4Q5

Security marking: PUBLIC Page 99 of 142
Document owner: UCAS Analysis & Research 15 December 2016
Entry rates to all types of provider increase for disadvantaged English 18 year olds
Figures 54 to 56 show the English 18 year old entry rates to each of the three
provider tariff groups by area-based background (POLAR3). The uneven distribution
of providers by tariff group across the UK, in combination with the relatively small
number of entrants from different background groups, means that the large
population bases in England provide the clearest way to look at trends by
background and type of provider.
The difference in entry rates between backgrounds is greatest for the higher tariff
providers and lowest for the lower tariff providers. The range in entry rates between
the most disadvantaged and the most advantaged in 2016 is 4 per cent to 21 per
cent for entry to higher tariff providers, and 6 per cent to 14 per cent for medium
tariff providers. For lower tariff providers, entry rates from all backgrounds are in the
narrow range of 10 to 13 per cent.
Entry rates to higher tariff providers by background span wide range
Figure 54 shows entry rates to higher tariff providers by background for the 18 year
old population in England against a logarithmic axis (so the proportional changes are
clearer). There is a marked progression from lower to higher entry rates across the
disadvantaged to advantaged groups that is maintained throughout the period. This
is characterised by each quintile group being between 40 and 97 per cent more likely
to be accepted to higher tariff providers than the preceding (more disadvantaged)
quintile group.
In 2016, the entry rate for applicants from the most disadvantaged areas (POLAR3
quintile 1) to higher tariff providers was 3.6 per cent. The entry rate for the most
advantaged applicants (POLAR3 quintile 5) was 21.3 per cent. Entry rates increased
for all groups in 2016. For the most disadvantaged, the entry rate increased by 0.3
percentage points (8.6 per cent proportionally). For the most advantaged group, the
entry rate increased by 0.6 percentage points (3.1 per cent proportionally).
Since 2011, entry rates have increased from 2.4 per cent to 3.6 per cent for the most
disadvantaged (1.2 percentage points, 51 per cent proportionally). For the most
advantaged group, the increase has been from 17.9 per cent to 21.3 per cent (3.4
percentage points, 19 per cent proportionally).
These patterns in entry rates mean the most advantaged applicants were 5.9 times
more likely to enter higher tariff providers than the most disadvantaged in 2016 – a
decline from 8.5 times more likely in 2006, and down from 6.3 times more likely in
2015.
18 year old entry rates by POLAR3 quintile, country and tariff group can be explored
further using the end of cycle equality and entry rates interactive data explorer,
available on the UCAS website.

Security marking: PUBLIC Page 100 of 142
Document owner: UCAS Analysis & Research 15 December 2016
Figure 54 English 18 year olds, entry rates to higher tariff providers by POLAR3
groups (logarithmic scale)
Entr
y r
ate
(cycle
)
1%
5%
10%
20%
30%
2006
2007
2008
2009
2010
2011
2012
2013
2014
2015
2016
Q1Q2Q3Q4Q5

Security marking: PUBLIC Page 101 of 142
Document owner: UCAS Analysis & Research 15 December 2016
Entry rates to medium tariff providers increase from all backgrounds in 2016
Entry rates to medium tariff providers (Figure 55) have generally increased across
the period in all areas, but there were greater increases in entry rates from the more
disadvantaged areas.
The entry rate to medium tariff providers for English 18 year olds from the most
advantaged areas was 14.2 per cent in 2016, while the entry rate from the most
disadvantaged areas was 6.3 per cent. This means the most advantaged applicants
were 2.2 times more likely to enter medium tariff providers than the most
disadvantaged in 2016 – a decline from 3.4 times more likely in 2006, and down
from 2.3 times more likely in 2015.
18 year old entry rates by POLAR3 quintile, country and tariff group can be explored
further using the end of cycle equality and entry rates interactive data explorer,
available on the UCAS website.
Figure 55 English 18 year olds, entry rates to medium tariff providers by POLAR3
groups (logarithmic scale)
Entr
y r
ate
(cycle
)
1%
5%
10%
20%
30%
2006
2007
2008
2009
2010
2011
2012
2013
2014
2015
2016
Q1Q2Q3Q4Q5

Security marking: PUBLIC Page 102 of 142
Document owner: UCAS Analysis & Research 15 December 2016
Small and reducing difference in entry rates to lower tariff providers by
background
For entry to lower tariff providers (Figure 56), there is much less differentiation in
entry rates by background compared to medium and higher tariff providers. In 2016,
the entry rates from all backgrounds to lower tariff providers were within a 3.3
percentage point range, a decrease from 3.7 percentage points in 2015 (in 2006, the
range was 4.7 percentage points).
In 2016, the 18 year old entry rates ranged from 9.6 per cent for those living in the
most disadvantaged areas (POLAR3 Q1), to 12.9 per cent (for those living in POLAR3
Q3 areas). The entry rate for those living in the most advantaged areas (POLAR3 Q5)
was 10.8 per cent. Entry rates for those living in POLAR3 Q3 to Q5 areas fell by
between 1 and 3 per cent proportionally, while for POLAR Q1 areas, they increased
by 1 per cent (entry rates for those living in POLAR3 Q2 areas were unchanged).
In 2006, the entry rate to lower tariff providers from the most advantaged areas was
1.9 times the entry rate from the most disadvantaged areas. By the end of the
period in 2016, the entry rate from the most advantaged areas was 1.1 times the
entry rate from the most disadvantaged areas.
18 year old entry rates by POLAR3 quintile, country and tariff group can be explored
further using the end of cycle equality and entry rates interactive data explorer,
available on the UCAS website.
Figure 56 English 18 year olds, entry rates to lower tariff providers by POLAR3
groups (logarithmic scale)
Entr
y r
ate
(cycle
)
1%
5%
10%
20%
30%
2006
2007
2008
2009
2010
2011
2012
2013
2014
2015
2016
Q1Q2Q3Q4Q5

Security marking: PUBLIC Page 103 of 142
Document owner: UCAS Analysis & Research 15 December 2016
Entry rate for Scottish 18 year olds from the most deprived areas (SIMD) 51 per
cent higher than in 2006
Figure 57 shows the entry rates for Scottish 18 year olds by area-based background
based on the Scottish Index of Multiple Deprivation (SIMD 20122). SIMD ranks small
geographical areas in Scotland by their relative level of deprivation across a range of
measures, which are used to form five groups with equal population sizes. Not all
higher education providers in Scotland use UCAS, meaning there is a substantial
section of provision (mostly offered through further education colleges) that is not
included in UCAS’ figures. This means these entry rates will be lower than the total
entry to higher education.
There is a progression from lower to higher entry rates from the most deprived to
the least deprived areas that was maintained throughout the period. The entry rates
in 2016 were 10.9 per cent from Q1 areas (most deprived), 18.0 per cent from Q2,
24.1 per cent from Q3, 31.1 per cent from Q4, and 42.3 per cent from Q5 areas (least
deprived). This means the entry rates from the least deprived areas are 3.9 times as
high as the entry rates from the most deprived areas, compared to 5.8 times as high
in 2006 and 2008.
Entry rates increased in 2016 from all areas, with the most deprived areas having the
largest proportional increase (+11.7 per cent), and less deprived areas having smaller
increases (+3.1 per cent in Q2, +0.6 per cent in Q3, +2.6 per cent in Q4, and +2.9 per
cent in Q5). The proportional increase for Q1 was one of the largest seen over the
period.
The percentage point changes for each of the SIMD groups were +1.1 percentage
points for Q1 areas, +0.5 percentage points for Q2 areas, +0.1 percentage points for
Q3, +0.8 percentage points for Q4, and +1.2 percentage points for Q5 areas.
The 2016 entry rate for the most deprived areas was the highest on record – 51 per
cent higher than in 2006, and 33 per cent higher compared to 2011.
Entry rates for 18 year olds from Scotland by SIMD group can be explored further
using the end of cycle equality and entry rates interactive data explorer, available on
the UCAS website.
2 For consistency with previous 2016 cycle reporting, entry rates are reported using the SIMD12
measure, rather than the more recent SIMD15.
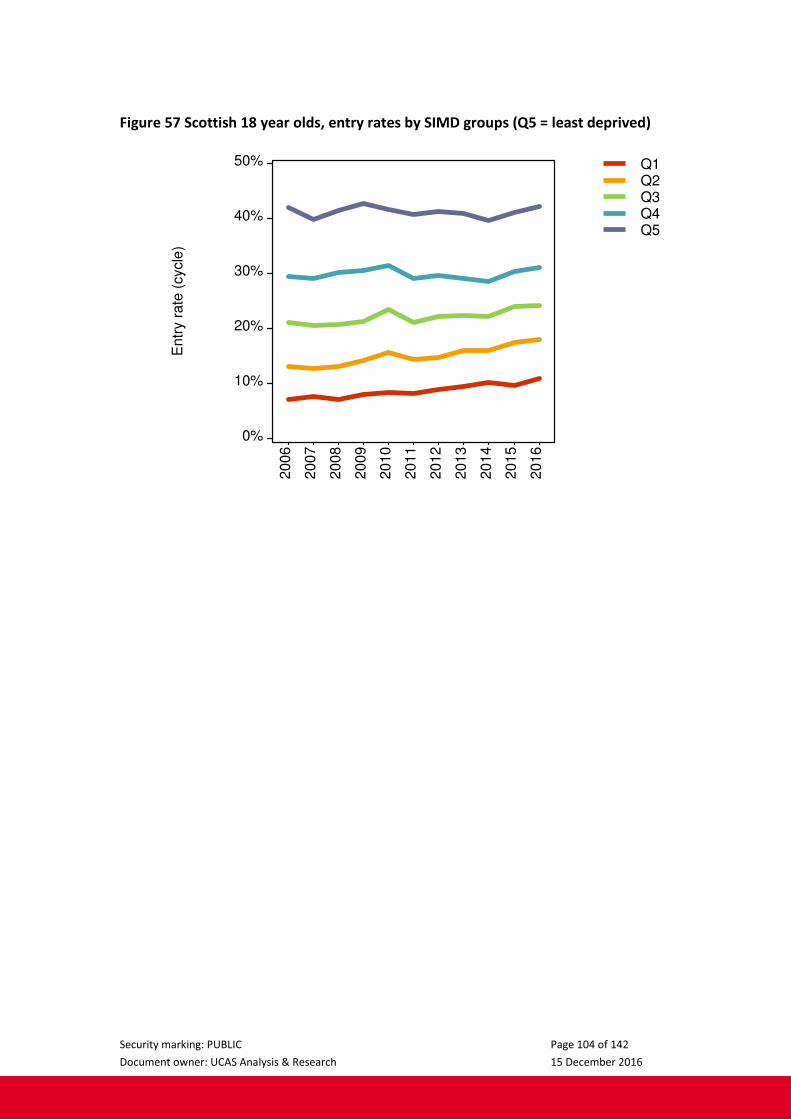
Security marking: PUBLIC Page 104 of 142
Document owner: UCAS Analysis & Research 15 December 2016
Figure 57 Scottish 18 year olds, entry rates by SIMD groups (Q5 = least deprived)
Entr
y r
ate
(cycle
)
0%
10%
20%
30%
40%
50%
2006
2007
2008
2009
2010
2011
2012
2013
2014
2015
2016
Q1Q2Q3Q4Q5

Security marking: PUBLIC Page 105 of 142
Document owner: UCAS Analysis & Research 15 December 2016
Entry rates by income background and ethnic group for state school
pupils in England
For pupils attending state schools in England, administrative data sets record
whether an individual is receiving free school meals (FSM, a means-tested benefit
that can be used as an indicator of low income) and their ethnic group. Linking these
pupil data sets (source: National Pupil Database and School Census, Department for
Education) to the UCAS admissions data allows the calculation of entry rates by
these categories recorded in the pupil data sets when the applicant was age 15.
To calculate these statistics, a conservative linking method has been used, that
requires a full match across a range of identifying details to English domiciled UCAS
applicants. This necessarily makes the entry rate lower than the true value (for
example, ambiguous matches are not used). The linking method, and differences in
scope between the two data sources, introduces more uncertainty into these linked
entry rates than the other methods used in this report that do not rely on record
linking. All the entry rates for FSM and ethnic group are based on linking.
Entry rates for non-FSM pupils increase five times faster than FSM pupils in 2016,
but both reach new highs
Between 12 and 15 per cent of the state school 15 year old population were in
receipt of free school meals (FSM) over the period3.
In 2016, the entry rate for young people who received FSM aged 15 was 16.1 per
cent, 0.3 percentage points higher than in 2015, and a proportional increase of 1.6
per cent. The entry rate for non-FSM pupils in 2016 was 32.8 per cent, an increase of
1.4 percentage points – five times greater than the increase for FSM pupils – and a
proportional increase of 4.3 per cent.
Since 2006, the entry rate for FSM pupils increased by 78 per cent proportionally,
compared to a proportional increase of 33 per cent for the non-FSM entry rate over
the same period.
Between 2006 and 2015, the entry rate for non-FSM pupils was between 14.6 and
15.8 percentage points higher than for FSM pupils. The proportional difference had
been steadily falling during this time – in 2006, non-FSM pupils were over two and
half times more likely to enter HE aged 18 than FSM pupils, but by 2015, this had
reduced such that non-FSM pupils were just under twice as likely to enter HE than
FSM pupils.
However, the larger increase in entry rates for non-FSM pupils in 2016 meant that
the percentage point gap in entry rates between non-FSM and FSM pupils widened
3 Changes to the coverage of the free school meal indicator in the School Census for the 2013/14
academic year, affecting those applying in the 2016 cycle aged 18, have made it necessary to adjust
identification of the FSM group in the UCAS data. This means that entry rates reported for the FSM
and non-FSM groups differ slightly from those in previous end of cycle reports.

Security marking: PUBLIC Page 106 of 142
Document owner: UCAS Analysis & Research 15 December 2016
to its largest recorded value of 16.7 percentage points, and that the proportional
difference increased so that non-FSM pupils became over twice as likely to enter HE
than FSM pupils.
Entry rates for former English state school pupils by free school meal status can be
explored further using the end of cycle equality and entry rates interactive data
explorer, available on the UCAS website.
Figure 58 Entry rates for English 18 year old state school pupils by free school meal
(FSM) status at age 15
Entr
y r
ate
5%
10%
15%
20%
25%
30%
35%
2006
2007
2008
2009
2010
2011
2012
2013
2014
2015
2016
Not receiving FSMReceiving FSM
Security marking: PUBLIC Page 107 of 142
Document owner: UCAS Analysis & Research 15 December 2016
Entry rates to lower tariff providers fall for FSM and non-FSM pupils in 2016
For young English people in 2016 who were formerly in English state schools and not
in receipt of free school meals (non-FSM), 12.1 per cent entered lower tariff
providers, 11.2 per cent entered medium tariff providers, and 9.5 per cent entered
higher tariff providers. Non-FSM entry rates decreased in 2016 to lower tariff
providers, but increased to medium and higher tariff providers to the highest levels
recorded.
Entry rates to all types of providers were lower for the FSM group compared to the
non-FSM group. In 2016, for those who were in receipt of FSM, 8.9 per cent entered
lower tariff providers, 4.8 per cent entered medium tariff providers, and 2.5 per cent
entered higher tariff providers. As with the non-FSM group, the entry rates to lower
tariff providers decreased in 2015, but increased to medium and higher tariff
providers, again to the highest recorded levels.
Comparing the entry rates of FSM and non-FSM pupils to higher tariff providers,
non-FSM pupils were 3.8 times more likely to enter a higher tariff provider than FSM
pupils in 2016. They were also 2.3 times more likely to enter a medium tariff
provider, and 1.4 times more likely to enter a lower tariff provider, than FSM pupils
in 2016.
Compared to 2015, the entry rate to higher tariff providers for FSM pupils increased
by 8.2 per cent proportionally, compared to 4.6 per cent for non-FSM pupils.
Compared to 2011, the proportional increase in entry rates to higher tariff providers
for FSM pupils (+73 per cent) was double that for non-FSM pupils (35 per cent).
In 2016, the percentage point difference in entry rates to higher tariff providers for
the two groups is 7.0 percentage points, the largest difference recorded, and +0.2
percentage points wider than in 2015.
Entry rates for former English state school pupils to higher, medium, and lower tariff
providers by free school meal status can be explored further using the end of cycle
equality and entry rates interactive data explorer, available on the UCAS website.
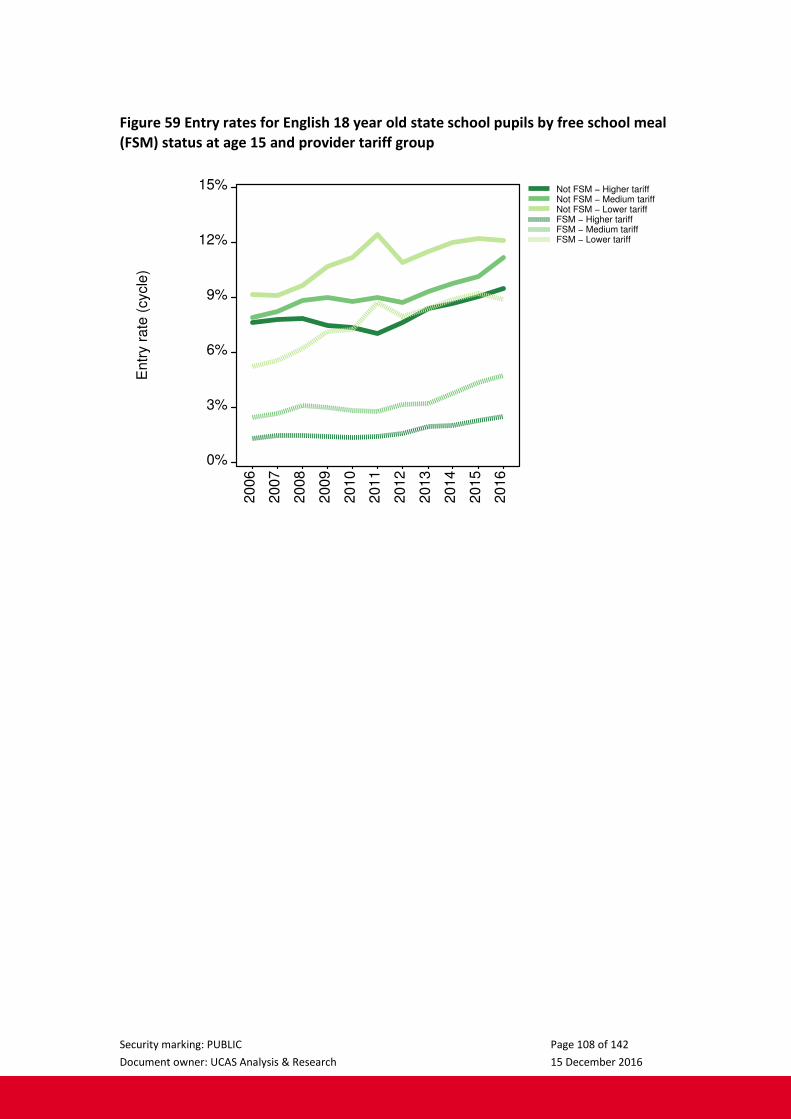
Security marking: PUBLIC Page 108 of 142
Document owner: UCAS Analysis & Research 15 December 2016
Figure 59 Entry rates for English 18 year old state school pupils by free school meal
(FSM) status at age 15 and provider tariff group E
ntr
y r
ate
(cycle
)
0%
3%
6%
9%
12%
15%
2006
2007
2008
2009
2010
2011
2012
2013
2014
2015
2016
Not FSM − Higher tariffNot FSM − Medium tariffNot FSM − Lower tariffFSM − Higher tariffFSM − Medium tariffFSM − Lower tariff

Security marking: PUBLIC Page 109 of 142
Document owner: UCAS Analysis & Research 15 December 2016
Entry rates increase for all ethnic groups, but large differences persist
The entry rates for 18 year olds who were formerly in English state schools varies by
the ethnic group recorded in the pupil data sets. In 2016, former state school pupils
recorded as being in the Chinese ethnic group have the highest entry rate (57.9 per
cent) and those recorded in the White ethnic group have the lowest (28.7 per cent).
The entry rates for all ethnic groups increased in 2016, reaching the highest recorded
values for each group. For the White ethnic group, the entry rate was 28.7 per cent
(+0.9 percentage points, +3 per cent proportionally), 42.9 per cent for the Asian
ethnic group (+1.9 percentage points, +5 per cent proportionally), 37.5 per cent for
the Black ethnic group (+0.8 percentage points, +2 per cent proportionally), 33.0 per
cent for the Mixed ethnic group (+1.2 percentage points, +4 per cent proportionally),
57.9 per cent for the Chinese ethnic group (+0.4 percentage points, +1 per cent
proportionally), and 37.0 per cent for the Any other ethnic group (+1.1 percentage
points, +3 per cent proportionally).
Young people recorded in the Black ethnic group have the largest increase in entry
rates over the period, increasing from 20.9 per cent in 2006 to 37.5 per cent in 2016,
a proportional increase of 79 per cent.
Since 2008, the White ethnic group have had the lowest entry rate of all ethnic
groups. Since 2006, the entry rate for the White group has increased from 21.7 per
cent to 28.7 per cent in 2016, a percentage point increase of +7.0 percentage points
(the smallest increase of any ethnic group) and a proportional increase of 32 per
cent. In 2016, the proportional difference in entry rates between the White ethnic
group and the Mixed ethnic group (which had the second lowest entry rate)
increased slightly to 15 per cent (compared to 14 per cent in 2015). The proportional
difference between the White ethnic group and the Black ethnic group reduced from
32 per cent in 2015 to 20 per cent in 2016.
Entry rates for former English state school pupils by ethnic group can be explored
further using the end of cycle equality and entry rates interactive data explorer,
available on the UCAS website.
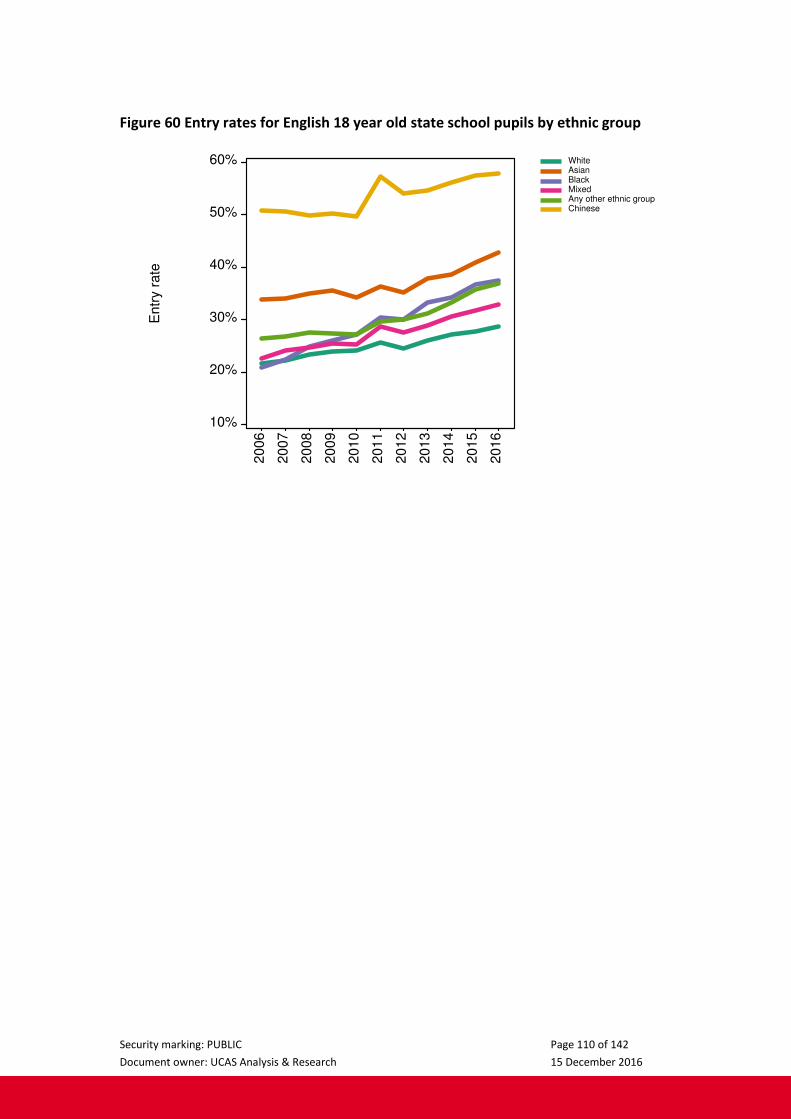
Security marking: PUBLIC Page 110 of 142
Document owner: UCAS Analysis & Research 15 December 2016
Figure 60 Entry rates for English 18 year old state school pupils by ethnic group
Entr
y r
ate
10%
20%
30%
40%
50%
60%
2006
2007
2008
2009
2010
2011
2012
2013
2014
2015
2016
WhiteAsianBlackMixedAny other ethnic groupChinese
Security marking: PUBLIC Page 111 of 142
Document owner: UCAS Analysis & Research 15 December 2016
Large differences in entry rates by ethnic group for English pupils accepted to
higher tariff providers
The entry rates for 18 year olds accepted to higher tariff providers varies by ethnic
group. In 2016, the entry rate to higher tariff providers from the Chinese ethnic
group was 27.8 per cent, the highest on record and considerably higher than for
other ethnic groups. The lowest entry rate to higher tariff providers is for the Black
ethnic group at 6.0 per cent in 2016. The other ethnic groups have entry rates to
higher tariff providers in a relatively small range of between 8.5 and 10.0 per cent.
The entry rates to higher tariff providers for all ethnic groups increased in 2016,
reaching the highest recorded values for each group. For the Chinese ethnic group,
the entry rate was 27.8 per cent (+1.4 percentage points, +5 per cent
proportionally), 10 per cent for the Mixed ethnic group (+0.8 percentage points, +9
per cent proportionally), 9.5 per cent for the Asian ethnic group (+0.2 percentage
points, +2 per cent proportionally), 8.8 per cent for the Any other ethnic group (+0.2
percentage points, +2 per cent proportionally), 8.5 per cent for the White ethnic
group (+0.4 percentage points, +5 per cent proportionally), and 6.0 per cent for the
Black ethnic group (+0.4 percentage points, +7 per cent proportionally).
Young people recorded in the Black ethnic group have the lowest entry rate to
higher tariff providers. However, this group had the largest proportional increase in
entry rates to higher tariff providers over the period of 107 per cent, with entry rates
increasing from 2.9 per cent in 2006 to 6.0 per cent in 2016. The Black group also
had the second largest proportional increase in 2016 of 7 per cent. Despite this, the
entry rate for the Black ethnic group remains 2.5 percentage points lower than the
White ethnic group, the group which had the second lowest entry rate to higher
tariff providers in 2016.
Entry rates for former English state school pupils to higher tariff providers by ethnic
group can be explored further using the end of cycle equality and entry rates
interactive data explorer, available on the UCAS website.

Security marking: PUBLIC Page 112 of 142
Document owner: UCAS Analysis & Research 15 December 2016
Figure 61 Entry rates for English 18 year old state school pupils to higher tariff
providers by ethnic group E
ntr
y r
ate
0%
5%
10%
15%
20%
25%
30%
2006
2007
2008
2009
2010
2011
2012
2013
2014
2015
2016
WhiteAsianBlackMixedAny other ethnic groupChinese

Security marking: PUBLIC Page 113 of 142
Document owner: UCAS Analysis & Research 15 December 2016
Entry rates to medium tariff providers at record high for all ethnic groups
For entry to medium tariff providers, there is much less variability in entry rates
across ethnic groups, compared with those to higher tariff providers. In 2016, the
highest entry rates to medium tariff providers are from the Chinese ethnic group
(18.9 per cent) and the lowest from the White ethnic group (9.8 per cent).
The entry rates to medium tariff providers for all ethnic groups increased in 2016,
reaching the highest recorded values for each group. For the Chinese ethnic group,
the entry rate was 18.9 per cent (+1.7 percentage points, +10 per cent), 13.5 per
cent for the Asian ethnic group (+1.7 percentage points, +14 per cent
proportionally), 13.1 per cent for the Black ethnic group (+1.2 percentage points, +10
per cent proportionally), 12.8 per cent for the Any other ethnic group (+1.8
percentage points, +17 per cent proportionally), 10.9 per cent for the Mixed ethnic
group (+0.8 percentage points, +8 per cent proportionally), and for the White ethnic
group, the entry rate was 9.8 per cent (+0.8 percentage points, +8 per cent
proportionally).
The entry rates to medium tariff providers are greater than those to higher tariff
providers for all ethnic groups, apart from the Chinese group.
Entry rates for former English state school pupils to medium tariff providers by
ethnic group can be explored further using the end of cycle equality and entry rates
interactive data explorer, available on the UCAS website.
Figure 62 Entry rates for English 18 year old state school pupils to medium tariff
providers by ethnic group
Entr
y r
ate
0%
5%
10%
15%
20%
25%
30%
2006
2007
2008
2009
2010
2011
2012
2013
2014
2015
2016
WhiteAsianBlackMixedAny other ethnic groupChinese

Security marking: PUBLIC Page 114 of 142
Document owner: UCAS Analysis & Research 15 December 2016
Entry rates to lower tariff providers highest for the Asian ethnic group, lowest for
the White ethnic group
The entry rates for lower tariff providers varied by ethnic group, with a range of
around 9 percentage points in 2016. Former pupils recorded as being in the Asian
ethnic group had the highest entry rate to lower tariff providers (19.9 per cent in
2016) and those in the White ethnic group had the lowest (10.5 per cent in 2016).
The entry rates to lower tariff providers for all ethnic groups decreased in 2016, with
the exception of the Asian ethnic group which remained the same. The rate for the
Asian ethnic group was 19.9 per cent (constant), for the Black ethnic group it was
18.4 per cent (-0.8 percentage points, -4 per cent proportionally), for the Any other
ethnic group it was 15.3 per cent (-0.8 percentage points, -4 per cent), for the Mixed
ethnic group it was 12.0 per cent (-0.4 percentage points, -4 per cent proportionally),
for the Chinese ethnic group it was 11.1 per cent (-2.6 percentage points, -19 per
cent proportionally), and for the White ethnic group the entry rate was 10.5 per cent
(-0.2 percentage points, -2 per cent proportionally). The entry rates in 2016 for all
ethnic groups were lower than in 2011.
The entry rates to lower tariff providers are higher than those to medium and higher
tariff providers for all ethnic groups, apart from the Chinese group where entry rates
are highest for higher tariff providers. Entry rates to lower tariff providers for the
Black ethnic group are three times higher than they are for higher tariff providers,
and for the Asian ethnic group, they are twice as high. The entry rate to lower tariff
providers for the White group is one quarter higher than it is for higher tariff
providers, a similar proportional difference as for the Mixed ethnic group.
Entry rates for former English state school pupils to lower tariff providers by ethnic
group can be explored further using the end of cycle equality and entry rates
interactive data explorer, available on the UCAS website.

Security marking: PUBLIC Page 115 of 142
Document owner: UCAS Analysis & Research 15 December 2016
Figure 63 Entry rates for English 18 year old state school pupils to lower tariff
providers by ethnic group E
ntr
y r
ate
0%
5%
10%
15%
20%
25%
30%
2006
2007
2008
2009
2010
2011
2012
2013
2014
2015
2016
WhiteAsianBlackMixedAny other ethnic groupChinese

Security marking: PUBLIC Page 116 of 142
Document owner: UCAS Analysis & Research 15 December 2016
Differences in entry rates by sex and ethnic group account for a large and
increasing proportion of the entry rate gap between areas
The differences in entry rates between, for example, POLAR3 quintiles 1 and 5, are
very much larger than those seen between men and women, or the White ethnic
group and other ethnic groups. However, direct comparison of the size of the gaps
between men and women, ethnic groups, and area-based measures of disadvantage
is not always straightforward due to the different shares of the population these
groups account for. For example, when comparing entry rates by sex, approximately
one half of the population is compared to the other half. But when comparing entry
rates for the most advantaged and disadvantaged areas using POLAR3 quintiles 1
and 5, only the most extreme 20 per cent of the population are being compared to
each other. The use of these smaller and more extreme comparison groups means
that large differences can occur more readily than is the case when comparing (for
example) men and women.
One way of making a comparison of the differences in entry rates between different
characteristics is to form groups that represent the same share of the population.
This can be done using aggregates of small areas (such as Census wards), grouped
using either entry rates or a measure of income.
Figure 64 shows the entry rates for men and women, alongside the entry rates for
two groups formed from areas which account for the same shares of the population
as men and women. The group labelled ‘disadvantaged areas’ contains the areas
which are the most disadvantaged as measured using the 18 year old entry rate, and
account for 51 per cent of the 18 year old population, the same share that men
account for. The group labelled ‘advantaged areas’ contains areas which are the
least disadvantaged (again, according to entry to HE) and account for the remaining
49 per cent of the population.
Across the period, the entry rates for disadvantaged and advantaged areas have
increased. Despite accounting for the same share of the population as men and
women, the entry rates for advantaged areas are consistently higher than the entry
rates for women, while the entry rates for disadvantaged areas are consistently
lower than the entry rates for men. However, the percentage point gap between
women and men has increased during the period, from 5.9 percentage points in
2006 to 9.7 percentage points in 2016.
The percentage point difference between advantaged and disadvantaged areas has
decreased very slightly during the period, from 15.7 percentage points in 2006 to
15.3 percentage points in 2016. These different patterns mean that in 2006, the
entry rate gap for women and men was around a third of the entry rate gap (38 per
cent) between those living in the most and least disadvantaged areas, once
population shares are accounted for. By 2016, the gap between women and men
was almost two thirds (63 per cent) of the gap between the most advantaged and
disadvantaged areas.

Security marking: PUBLIC Page 117 of 142
Document owner: UCAS Analysis & Research 15 December 2016
Figure 64 Entry rates for English 18 year old state school pupils by sex, and by areas
grouped using 18 year old entry rates E
ntr
y r
ate
0%
10%
20%
30%
40%
50%
2006
2007
2008
2009
2010
2011
2012
2013
2014
2015
2016
MenWomenDisadvantaged areas (entry rate)Advantaged areas (entry rate)
Figure 65 shows a similar analysis, but here the FSM indicator has been used to split
the population into the advantaged areas and disadvantaged areas groupings. The
disadvantaged areas group is formed from FSM pupils (which account for the first 13
per cent of the English state school pupil population) and then by adding non-FSM
pupils from areas which have the largest proportions of the population that are FSM.
This group accounts for 51 per cent of the population, the same as men. The
advantaged areas group contains the remainder of the population.
Across the period, the entry rates for the disadvantaged and advantaged area groups
have increased. Despite accounting for the same share of the population, the entry
rates for advantaged areas are consistently higher than the entry rates for women,
while the entry rates for disadvantaged areas are consistently lower than the entry
rates for men.
The percentage point difference in entry rates between the disadvantaged and
advantaged area groups has decreased during the period, from 12.8 percentage
points in 2006 to 10.9 percentage points in 2016. These different patterns mean that
in 2006, the gap between men and women was around half (47 per cent) of the
percentage point gap between those living in high and low FSM areas, but by 2016,
this had almost doubled to 89 per cent of the gap.
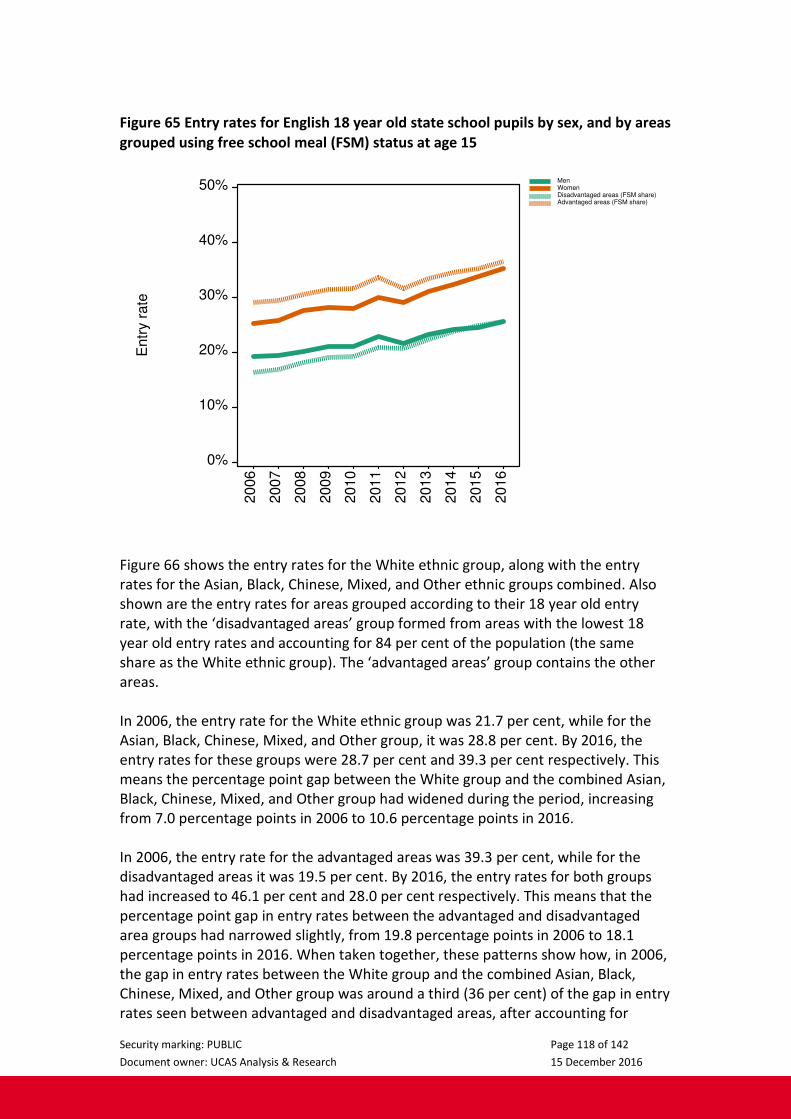
Security marking: PUBLIC Page 118 of 142
Document owner: UCAS Analysis & Research 15 December 2016
Figure 65 Entry rates for English 18 year old state school pupils by sex, and by areas
grouped using free school meal (FSM) status at age 15 E
ntr
y r
ate
0%
10%
20%
30%
40%
50%
2006
2007
2008
2009
2010
2011
2012
2013
2014
2015
2016
MenWomenDisadvantaged areas (FSM share)Advantaged areas (FSM share)
Figure 66 shows the entry rates for the White ethnic group, along with the entry
rates for the Asian, Black, Chinese, Mixed, and Other ethnic groups combined. Also
shown are the entry rates for areas grouped according to their 18 year old entry
rate, with the ‘disadvantaged areas’ group formed from areas with the lowest 18
year old entry rates and accounting for 84 per cent of the population (the same
share as the White ethnic group). The ‘advantaged areas’ group contains the other
areas.
In 2006, the entry rate for the White ethnic group was 21.7 per cent, while for the
Asian, Black, Chinese, Mixed, and Other group, it was 28.8 per cent. By 2016, the
entry rates for these groups were 28.7 per cent and 39.3 per cent respectively. This
means the percentage point gap between the White group and the combined Asian,
Black, Chinese, Mixed, and Other group had widened during the period, increasing
from 7.0 percentage points in 2006 to 10.6 percentage points in 2016.
In 2006, the entry rate for the advantaged areas was 39.3 per cent, while for the
disadvantaged areas it was 19.5 per cent. By 2016, the entry rates for both groups
had increased to 46.1 per cent and 28.0 per cent respectively. This means that the
percentage point gap in entry rates between the advantaged and disadvantaged
area groups had narrowed slightly, from 19.8 percentage points in 2006 to 18.1
percentage points in 2016. When taken together, these patterns show how, in 2006,
the gap in entry rates between the White group and the combined Asian, Black,
Chinese, Mixed, and Other group was around a third (36 per cent) of the gap in entry
rates seen between advantaged and disadvantaged areas, after accounting for

Security marking: PUBLIC Page 119 of 142
Document owner: UCAS Analysis & Research 15 December 2016
population shares. By 2016, the gap between the White ethnic group and the
combined Asian, Black, Chinese, Mixed, and Other group had increased to 58 per
cent of the size of the gap between advantaged and disadvantaged areas.
Figure 66 Entry rates for English 18 year old state school pupils by ethnic group,
and by areas grouped using 18 year old entry rates
Entr
y r
ate
10%
20%
30%
40%
50%
2006
2007
2008
2009
2010
2011
2012
2013
2014
2015
2016
WhiteAsian, Black, Chinese, Mixed, OtherDisadvantaged areas (entry rate)Advantaged areas (entry rate)
Figure 67 shows a similar analysis but using the FSM indicator to split the population
into more advantaged and disadvantaged groups, in the same way as for the analysis
by sex above (Figure 65). Here the disadvantaged areas group accounts for 84 per
cent of the population, the same as the White ethnic group.
Once again, we see that the entry rates for all groups have increased across the
period. In 2006, the entry rate for disadvantaged areas was 20.3 per cent, compared
to 34.7 per cent for advantaged areas (14.3 percentage point gap). By 2016, the
rates had increased to 28.9 per cent and 41.5 per cent respectively (12.6 percentage
point gap). This means the gap between the White ethnic group and the combined
Asian, Black, Chinese, Mixed, and Other group was around half (49 per cent) of the
size of the gap between advantaged and disadvantaged areas in 2006, after
accounting for population share. By 2016, the gap between the White ethnic group
and the combined Asian, Black, Chinese, Mixed, and Other group was around 84 per
cent of the advantaged to disadvantaged areas gap.
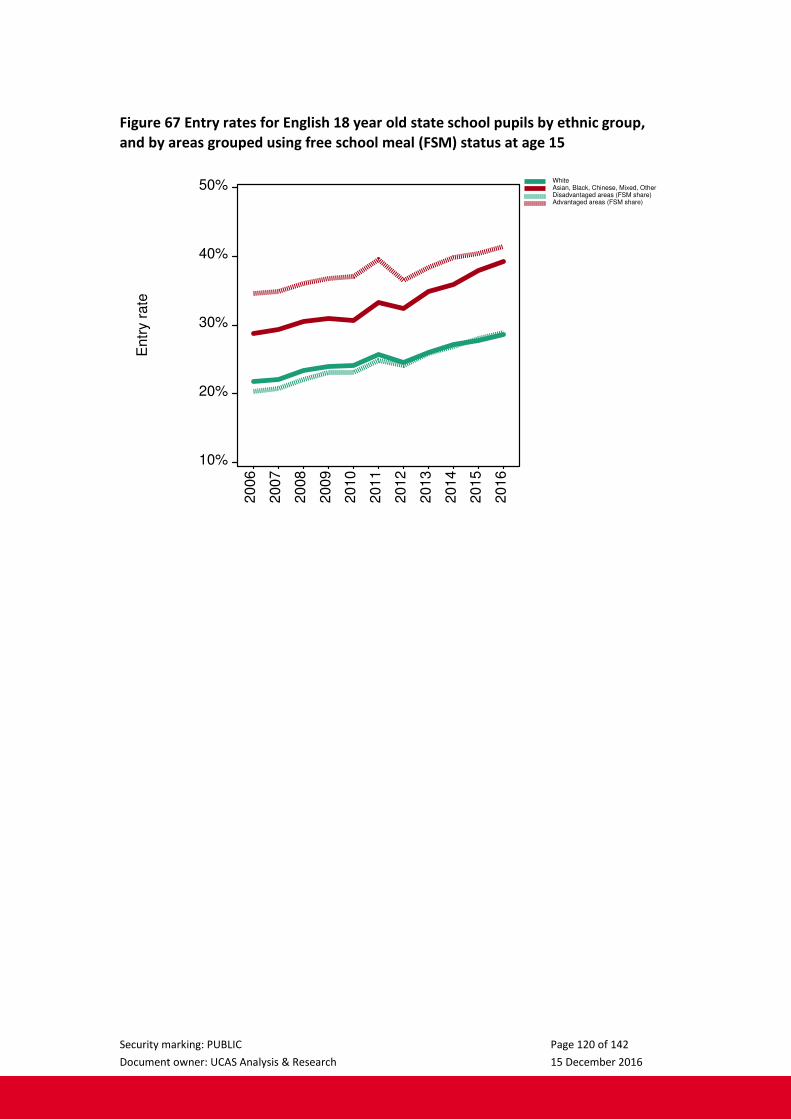
Security marking: PUBLIC Page 120 of 142
Document owner: UCAS Analysis & Research 15 December 2016
Figure 67 Entry rates for English 18 year old state school pupils by ethnic group,
and by areas grouped using free school meal (FSM) status at age 15 E
ntr
y r
ate
10%
20%
30%
40%
50%
2006
2007
2008
2009
2010
2011
2012
2013
2014
2015
2016
WhiteAsian, Black, Chinese, Mixed, OtherDisadvantaged areas (FSM share)Advantaged areas (FSM share)

Security marking: PUBLIC Page 121 of 142
Document owner: UCAS Analysis & Research 15 December 2016
Qualifications held by applicants
Entry to higher education is often determined by the type and strength of the
qualifications held by an applicant. This analysis includes both qualifications that
applicants list as achieved when they apply and those that are awarded during the
application cycle itself. The qualifications applicants hold when they apply or enter
higher education can vary, depending on which country they are from and their age.
UK 18 year old applicants are the largest single group of applicants by country and
age. This section describes the type and strength of qualifications held by this group
and how they have changed in the 2016 cycle.
A levels are the most widely held qualification among 18 year old acceptances from
the UK; around two-thirds held A levels in 2016. Other qualifications widely held by
this group are BTECs, Scottish Highers and Advanced Highers (abbreviated to SQAs
for Scottish Qualifications Authority), and the International Baccalaureate (IB). 18
year olds are often accepted holding combinations of qualifications, most frequently
a combination of A levels and BTECs.
In this section, UK 18 year olds are grouped by the combination of qualifications they
were recorded as having attained by the end of the cycle. Applicants holding three or
more A levels, and not holding any of the other three qualification types, are
reported in the ‘A level only’ group. Applicants with Level 3 BTECs (to the equivalent
amount of three A levels) and not holding any of the other three qualification types
are assigned to the ‘BTEC only’ group. Applicants with at least three Scottish Highers
or Scottish Advanced Highers are in the ‘SQA only’ group. Applicants achieving the
International Baccalaureate and not holding any of the other three qualification
types are in the ‘IB only’ group. Applicants with a combination of A levels and BTECs
(to the equivalent amount of three A levels) are reported as holding ‘A level & BTEC’.
Applicants who are not assigned to any of these groups are not reported. In 2016,
these accounted for around 13 per cent of UK 18 year old applicants, and 11 per cent
of acceptances.
One fifth of the 18 year old population in the UK entered with A levels as their
main qualification
Figure 68 reports the proportion of the UK 18 year old population that was accepted
to enter higher education (the entry rate) split by the type of qualification held by
accepted applicants. The entry rates for those holding A levels only are shown on a
separate axis (left hand side) as they are so much more widely held compared with
the other qualifications. In 2016, 20.1 per cent of the UK 18 year old population were
accepted for entry and were holding at least three A level qualifications. This was 0.5
percentage points higher (+3 per cent proportionally) than in 2015, and is the
highest entry rate for this group in the period.
Entry rate for UK 18 year olds holding BTECs as their main qualification falls
The next mostly widely held qualification among UK 18 year olds is BTECs. In 2016,
3.5 per cent of UK 18 year olds were accepted for entry holding only BTECs (to the

Security marking: PUBLIC Page 122 of 142
Document owner: UCAS Analysis & Research 15 December 2016
equivalent of three A levels, e.g. the Extended Diploma), falling slightly (by less than
0.1 percentage points, -1 per cent proportionally) compared to 2015. This is the first
time the entry rate for UK 18 year olds holding only BTECs has fallen since 2012, but
due to strong growth between 2008 and 2015, the entry rate in 2016 remains 90 per
cent higher than the rate at the start of the period in 2008. In 2016, 91 per cent of
these applicants holding only BTEC qualifications were from England.
Entry rates for young people holding a combination of A levels and BTECs
continues to increase
In 2016, 2.5 per cent of UK 18 year olds entered HE holding a combination of A levels
and BTECs, 4.2 times the entry rate in 2008 (0.6 per cent), and 10 per cent higher
than in 2015.
The entry rate for the combined BTEC only and A level and BTEC groups was 6.0 per
cent in 2016, up from 5.8 per cent in 2015.
Entry rates to higher education through UCAS for those holding SQA qualifications
increase to a new high
Young people from Scotland entering higher education through UCAS generally hold
Scottish Highers, or Scottish Highers in combination with Advanced Highers (SQA
awards). The entry rates for UK 18 year olds on this measure are low because few
applicants outside of Scotland hold SQA qualifications. Between 2008 and 2015,
there was little change in the entry rate of UK 18 year olds holding SQA awards since
2008, with the entry rate ranging between 1.7 and 1.8 per cent each cycle. In 2016,
the entry rate increased to 1.9 per cent (+0.1 percentage points, 4 per cent
proportionally). The entry rates for those holding SQA awards will be lower than the
total entry to higher education holding SQA awards, since not all higher education
providers in Scotland use UCAS.
Relatively few young people enter higher education holding the International
Baccalaureate In 2016, the entry rate for UK 18 year olds entering higher education holding the
International Baccalaureate (IB) was 0.3 per cent, just over 2,000 acceptances. This
entry rate was relatively unchanged since 2010, ranging between 0.2 and 0.3 per
cent, but was twice the rate in 2008.
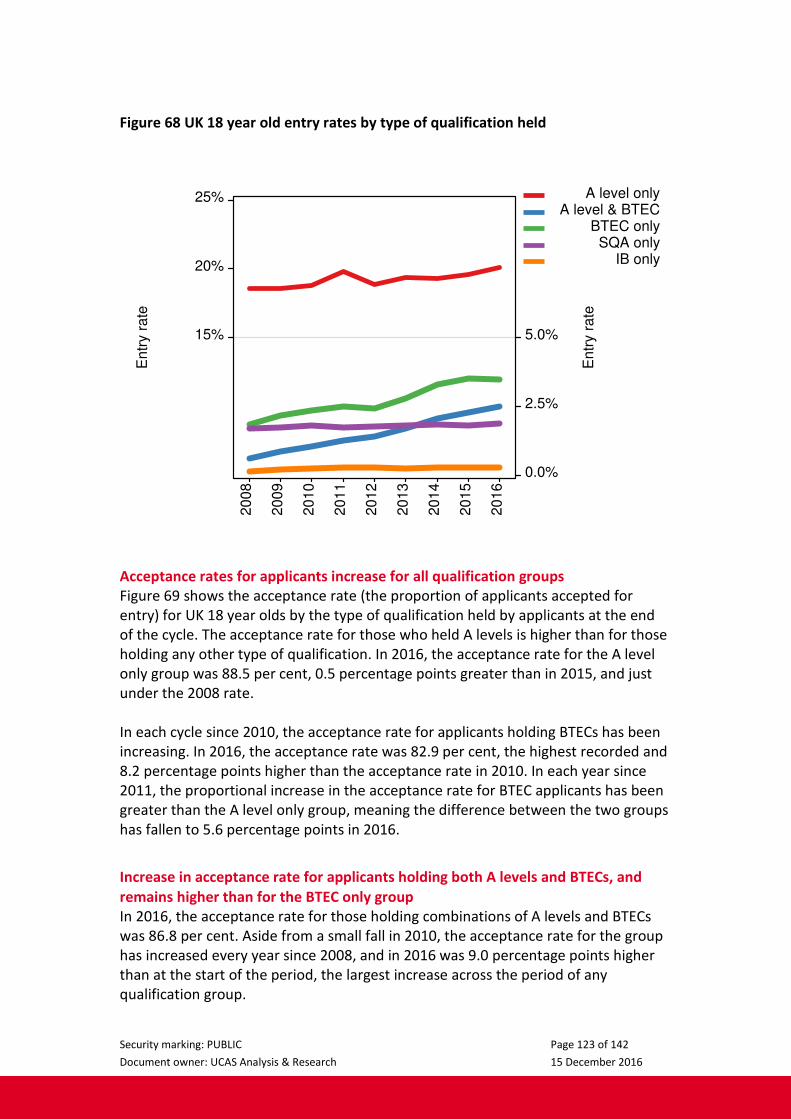
Security marking: PUBLIC Page 123 of 142
Document owner: UCAS Analysis & Research 15 December 2016
Figure 68 UK 18 year old entry rates by type of qualification held
Entr
y r
ate
15%
20%
25%
2008
2009
2010
2011
2012
2013
2014
2015
2016
Entr
y r
ate
0.0%
2.5%
5.0%
A level onlyA level & BTEC
BTEC onlySQA only
IB only
Acceptance rates for applicants increase for all qualification groups
Figure 69 shows the acceptance rate (the proportion of applicants accepted for
entry) for UK 18 year olds by the type of qualification held by applicants at the end
of the cycle. The acceptance rate for those who held A levels is higher than for those
holding any other type of qualification. In 2016, the acceptance rate for the A level
only group was 88.5 per cent, 0.5 percentage points greater than in 2015, and just
under the 2008 rate.
In each cycle since 2010, the acceptance rate for applicants holding BTECs has been
increasing. In 2016, the acceptance rate was 82.9 per cent, the highest recorded and
8.2 percentage points higher than the acceptance rate in 2010. In each year since
2011, the proportional increase in the acceptance rate for BTEC applicants has been
greater than the A level only group, meaning the difference between the two groups
has fallen to 5.6 percentage points in 2016.
Increase in acceptance rate for applicants holding both A levels and BTECs, and
remains higher than for the BTEC only group
In 2016, the acceptance rate for those holding combinations of A levels and BTECs
was 86.8 per cent. Aside from a small fall in 2010, the acceptance rate for the group
has increased every year since 2008, and in 2016 was 9.0 percentage points higher
than at the start of the period, the largest increase across the period of any
qualification group.
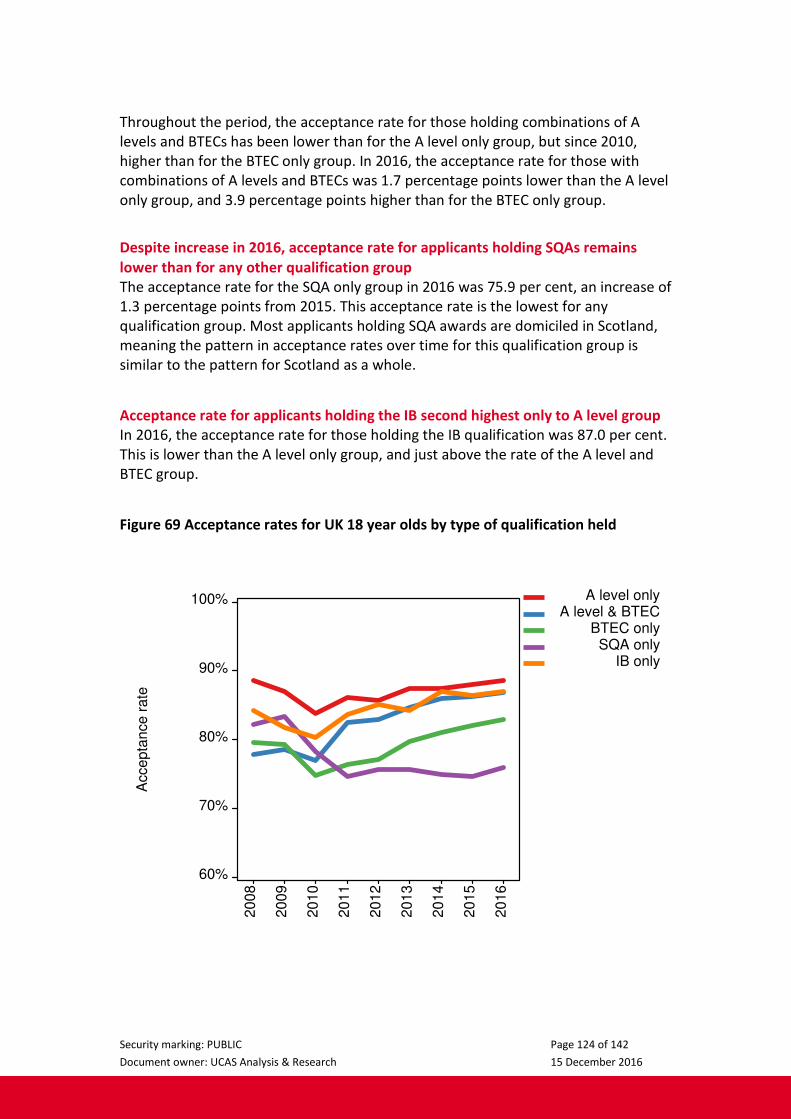
Security marking: PUBLIC Page 124 of 142
Document owner: UCAS Analysis & Research 15 December 2016
Throughout the period, the acceptance rate for those holding combinations of A
levels and BTECs has been lower than for the A level only group, but since 2010,
higher than for the BTEC only group. In 2016, the acceptance rate for those with
combinations of A levels and BTECs was 1.7 percentage points lower than the A level
only group, and 3.9 percentage points higher than for the BTEC only group.
Despite increase in 2016, acceptance rate for applicants holding SQAs remains
lower than for any other qualification group The acceptance rate for the SQA only group in 2016 was 75.9 per cent, an increase of
1.3 percentage points from 2015. This acceptance rate is the lowest for any
qualification group. Most applicants holding SQA awards are domiciled in Scotland,
meaning the pattern in acceptance rates over time for this qualification group is
similar to the pattern for Scotland as a whole.
Acceptance rate for applicants holding the IB second highest only to A level group In 2016, the acceptance rate for those holding the IB qualification was 87.0 per cent.
This is lower than the A level only group, and just above the rate of the A level and
BTEC group.
Figure 69 Acceptance rates for UK 18 year olds by type of qualification held
Accepta
nce r
ate
60%
70%
80%
90%
100%
2008
2009
2010
2011
2012
2013
2014
2015
2016
A level onlyA level & BTEC
BTEC onlySQA only
IB only

Security marking: PUBLIC Page 125 of 142
Document owner: UCAS Analysis & Research 15 December 2016
Proportion of 18 year olds with ABB+ falls in 2016 for all tariff groups
One summary statistic of the overall strength of grades held by students at a
provider is the proportion holding combinations of qualifications with higher grades
(denoted ABB+ here, reflecting the A level grades represented in the attainment
group). For English 18 year old acceptances to English providers, that proportion
increased from 35.4 per cent in 2008, to 42.0 per cent in 2011. It has decreased in
each cycle since, reaching 39.6 per cent in 2016. The proportion with ABB+
qualifications varies substantially by the tariff group of the provider, and trends in
the proportion vary by provider group.
The proportion of English 18 year old acceptances holding ABB+ is much higher at
English higher tariff providers than at other English providers. At these providers, the
proportion increased from 73.8 per cent in 2008 to a high of 88.8 per cent in 2011.
Since then, it has decreased in each cycle, to reach 77.1 per cent in 2016. This is a
reduction of 1.1 percentage points from 2015, the smallest reduction seen since the
proportion began to fall in 2011.
The proportion holding ABB+ at medium tariff providers increased from 22.4 per
cent to 33.8 per cent between 2008 and 2011. In 2012, the proportion decreased by
4.5 percentage points and there were further decreases in each cycle since so that
by 2016, the proportion was 25.6 per cent. This is a reduction of 1.9 percentage
points from 2015, the largest reduction in three years.
The proportion holding ABB+ at lower tariff providers increased in every cycle
between 2006 and 2015. However, in 2016, the proportion holding ABB+ decreased
for the first time, to 20.2 per cent. Despite this decrease, the proportion holding
ABB+ at lower tariff providers was 73 per cent higher in 2016 than in 2008.
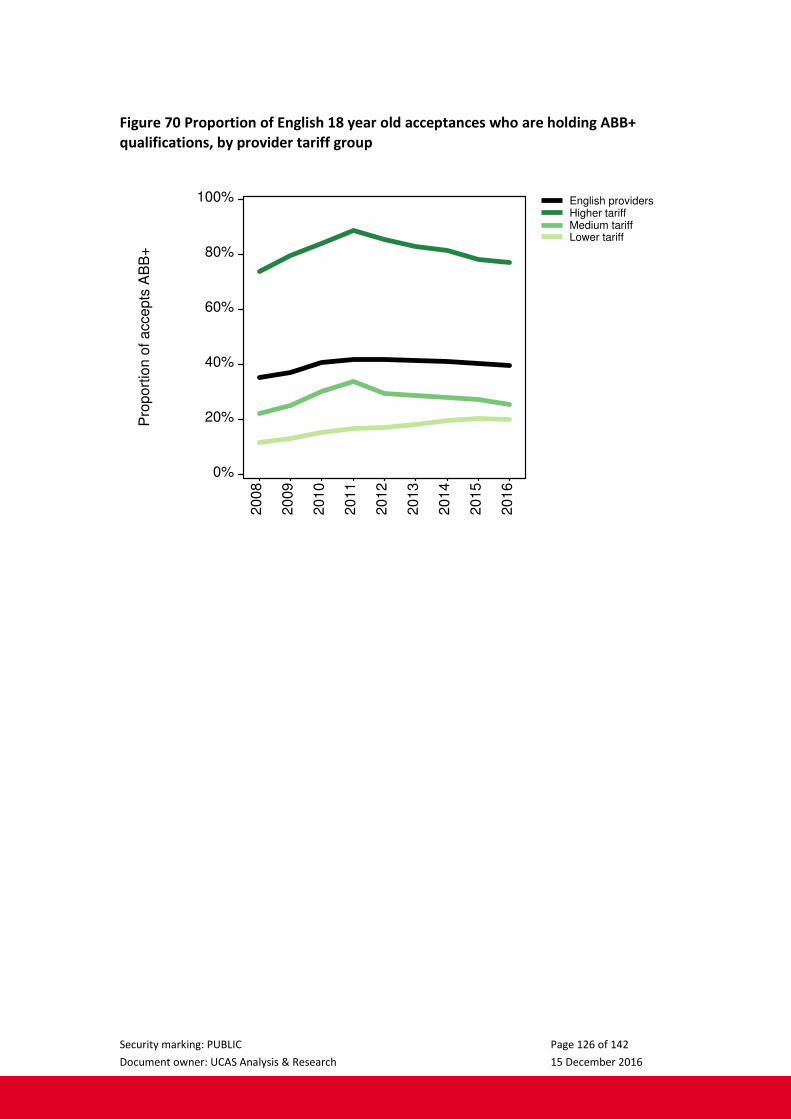
Security marking: PUBLIC Page 126 of 142
Document owner: UCAS Analysis & Research 15 December 2016
Figure 70 Proportion of English 18 year old acceptances who are holding ABB+
qualifications, by provider tariff group P
roport
ion o
f accepts
AB
B+
0%
20%
40%
60%
80%
100%
2008
2009
2010
2011
2012
2013
2014
2015
2016
English providersHigher tariffMedium tariffLower tariff

Security marking: PUBLIC Page 127 of 142
Document owner: UCAS Analysis & Research 15 December 2016
Proportion of acceptances that are ABB+ through A levels continues to fall for
higher and medium tariff providers, lowest proportion on record for medium tariff
providers
The proportion of English 18 year old acceptances to English providers who are ABB+
through their A level qualifications has fallen each year since 2011. In 2016, the
proportion of acceptances that were A level ABB+ was 28.8 per cent, down from
29.6 per cent in 2015, and from 34.1 per cent in 2011.
The proportion of acceptances to higher tariff providers that are A level ABB+ is
much higher than for English providers as a whole, ranging between 71.8 per cent
and 85.4 per cent since 2008. In 2016, the proportion of acceptances to higher tariff
providers that were A level ABB+ was 72.7 per cent, down slightly from 74.1 per cent
in 2015, and the lowest since 2008.
The proportion of acceptances to medium and lower tariff providers that are A level
ABB+ is lower than for English providers as a whole. For medium tariff providers, the
proportion was 15.5 per cent in 2016, a fall compared to 2015 when the proportion
was 17.0 per cent, and the lowest proportion on record. For lower tariff providers,
the proportion of acceptances that were A level ABB+ was 3.3 per cent in 2016, the
same as in 2015 and 2014.
Figure 71 Proportion of English 18 year old acceptances who are holding A level
ABB+ qualifications, by provider tariff group
Pro
port
ion o
f accepts
AB
B+
0%
20%
40%
60%
80%
100%
2008
2009
2010
2011
2012
2013
2014
2015
2016
English providersHigher tariffMedium tariffLower tariff
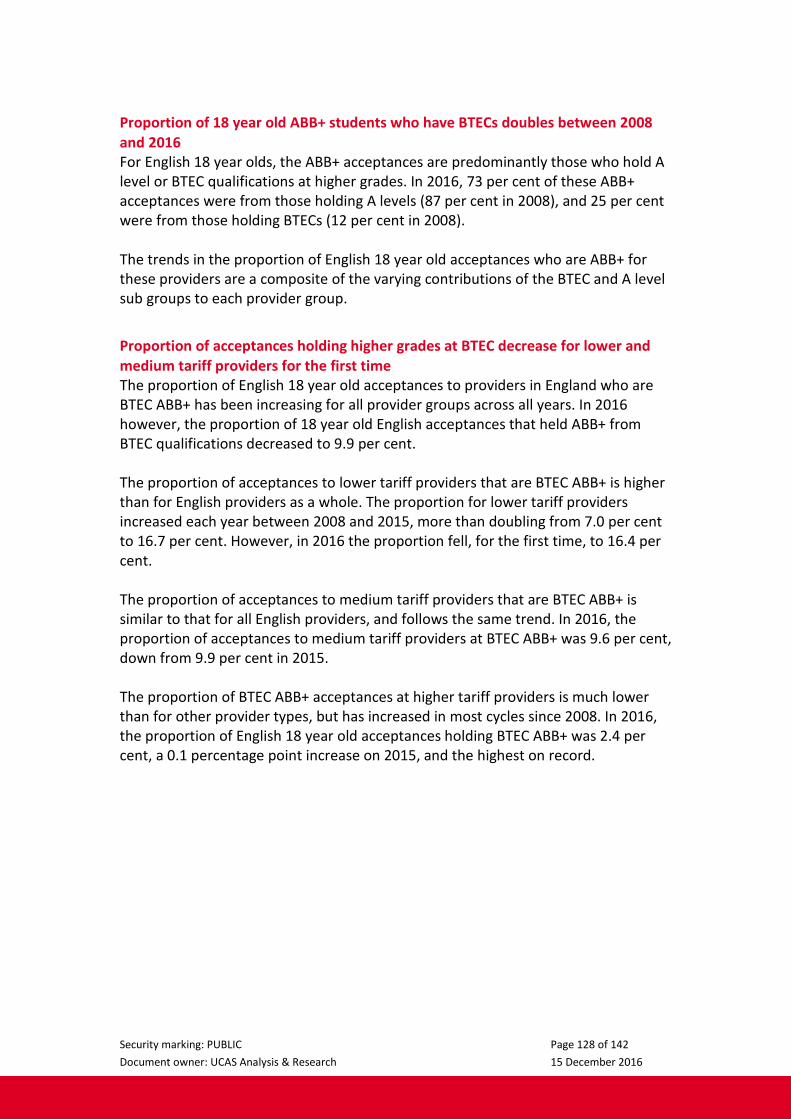
Security marking: PUBLIC Page 128 of 142
Document owner: UCAS Analysis & Research 15 December 2016
Proportion of 18 year old ABB+ students who have BTECs doubles between 2008
and 2016
For English 18 year olds, the ABB+ acceptances are predominantly those who hold A
level or BTEC qualifications at higher grades. In 2016, 73 per cent of these ABB+
acceptances were from those holding A levels (87 per cent in 2008), and 25 per cent
were from those holding BTECs (12 per cent in 2008).
The trends in the proportion of English 18 year old acceptances who are ABB+ for
these providers are a composite of the varying contributions of the BTEC and A level
sub groups to each provider group.
Proportion of acceptances holding higher grades at BTEC decrease for lower and
medium tariff providers for the first time
The proportion of English 18 year old acceptances to providers in England who are
BTEC ABB+ has been increasing for all provider groups across all years. In 2016
however, the proportion of 18 year old English acceptances that held ABB+ from
BTEC qualifications decreased to 9.9 per cent.
The proportion of acceptances to lower tariff providers that are BTEC ABB+ is higher
than for English providers as a whole. The proportion for lower tariff providers
increased each year between 2008 and 2015, more than doubling from 7.0 per cent
to 16.7 per cent. However, in 2016 the proportion fell, for the first time, to 16.4 per
cent.
The proportion of acceptances to medium tariff providers that are BTEC ABB+ is
similar to that for all English providers, and follows the same trend. In 2016, the
proportion of acceptances to medium tariff providers at BTEC ABB+ was 9.6 per cent,
down from 9.9 per cent in 2015.
The proportion of BTEC ABB+ acceptances at higher tariff providers is much lower
than for other provider types, but has increased in most cycles since 2008. In 2016,
the proportion of English 18 year old acceptances holding BTEC ABB+ was 2.4 per
cent, a 0.1 percentage point increase on 2015, and the highest on record.

Security marking: PUBLIC Page 129 of 142
Document owner: UCAS Analysis & Research 15 December 2016
Figure 72 Proportion of English 18 year old acceptances who are holding BTEC
ABB+ qualifications, by provider tariff group
Pro
po
rtio
n o
f a
cce
pts
AB
B+
0%
4%
8%
12%
16%
20%
20
08
20
09
20
10
20
11
20
12
20
13
20
14
20
15
20
16
English providersHigher tariffMedium tariffLower tariff

Security marking: PUBLIC Page 130 of 142
Document owner: UCAS Analysis & Research 15 December 2016
Acceptance rates to higher tariff providers unchanged in 2016 for all grade profiles,
largest changes for applicants with lower grades to medium and lower tariff
providers
Figure 73 covers English 18 year old applicants in the 2015 and 2016 cycles with
three A levels, who were either accepted to English providers or made a main
scheme application to an English provider but were unplaced (in total, around
150,000 per cycle). The applicants are grouped by the number of A level grades they
obtained (A* treated as six grades, E as one, labelled by a typical grade profile). For
each group, the proportion of applicants accepted to higher, medium, or lower tariff
providers (or left unplaced) is shown. This statistic simply describes the proportion of
all applicants (regardless of what type of providers they applied to) with those
grades who were in each category at the end of the cycle. The corresponding pattern
for the 2011 cycle is shown as a thinner grey line.
Applicants with the highest A level grades are most likely to enter higher tariff
providers, those with the lowest grades are most likely to enter lower tariff
providers, and those with grades in between are most likely to enter medium tariff
providers. Applicants with the lowest number of A level grades are the most likely to
be unplaced.
The proportion of applicants in each grade profile accepted to higher tariff providers
is similar for the 2015 and 2016 cycles. This is in contrast to the increase in the
acceptance rates between both of these cycles and 2011, for applicants with CCC to
A*A*A.
In 2016, the proportion of applicants accepted to medium and lower tariff providers
is similar to the proportion in 2015, for applicants with BBB and above. For
applicants with BBC and below, the proportion accepted to medium tariff providers
increased by between 1 and 6 percentage points (depending on the grade profile),
while the proportion accepted to lower tariff providers decreased by between 2 and
5 percentage points.
The higher proportion of applicants (not accounting for any changes in the size of
the groups in 2016) with BBC or below accepted to medium tariff providers,
amounts to an additional 2,200 acceptances in 2016, around 40 per cent of the
increase in acceptances to medium tariff providers in 2016. The lower proportion of
applicants with BBC or below accepted to lower tariff providers, amounts to a
decrease of 1,800 acceptances in 2016, around 30 per cent of the overall fall in
acceptances to lower tariff providers.
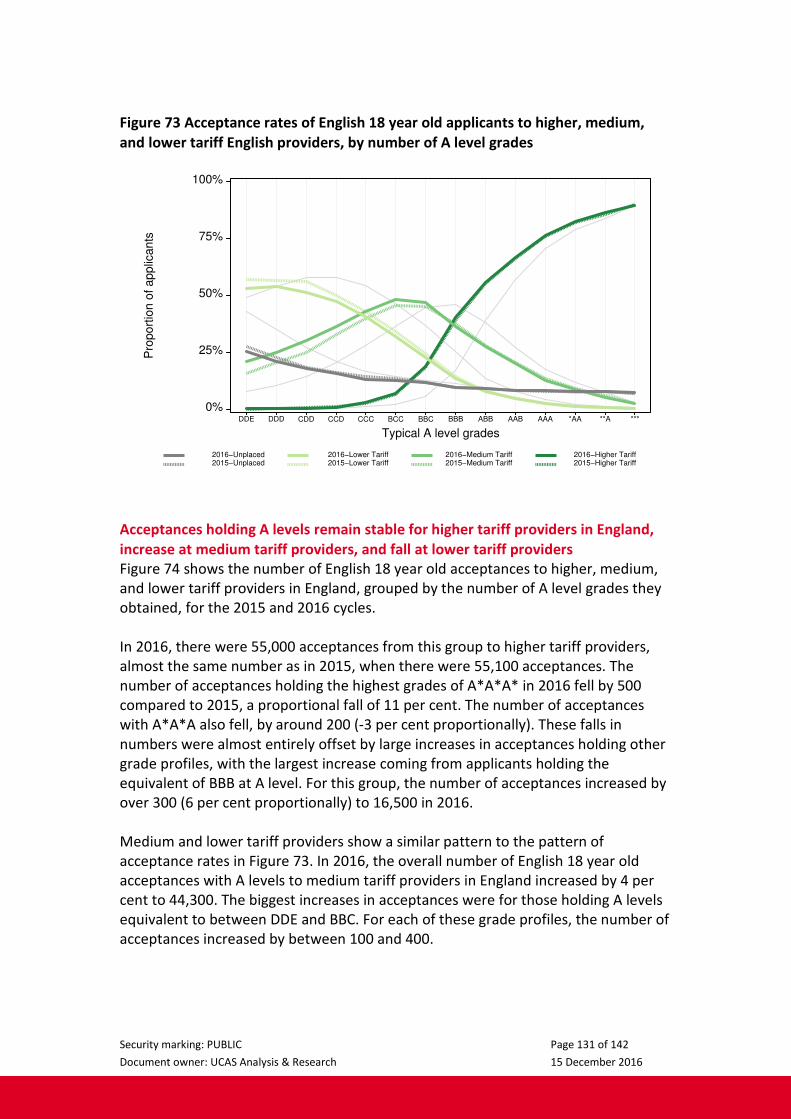
Security marking: PUBLIC Page 131 of 142
Document owner: UCAS Analysis & Research 15 December 2016
Figure 73 Acceptance rates of English 18 year old applicants to higher, medium,
and lower tariff English providers, by number of A level grades P
roport
ion o
f applic
ants
0%
25%
50%
75%
100%
Typical A level grades
DDE DDD CDD CCD CCC BCC BBC BBB ABB AAB AAA *AA **A ***
2016−Unplaced 2016−Lower Tariff 2016−Medium Tariff 2016−Higher Tariff2015−Unplaced 2015−Lower Tariff 2015−Medium Tariff 2015−Higher Tariff
Acceptances holding A levels remain stable for higher tariff providers in England,
increase at medium tariff providers, and fall at lower tariff providers Figure 74 shows the number of English 18 year old acceptances to higher, medium,
and lower tariff providers in England, grouped by the number of A level grades they
obtained, for the 2015 and 2016 cycles.
In 2016, there were 55,000 acceptances from this group to higher tariff providers,
almost the same number as in 2015, when there were 55,100 acceptances. The
number of acceptances holding the highest grades of A*A*A* in 2016 fell by 500
compared to 2015, a proportional fall of 11 per cent. The number of acceptances
with A*A*A also fell, by around 200 (-3 per cent proportionally). These falls in
numbers were almost entirely offset by large increases in acceptances holding other
grade profiles, with the largest increase coming from applicants holding the
equivalent of BBB at A level. For this group, the number of acceptances increased by
over 300 (6 per cent proportionally) to 16,500 in 2016.
Medium and lower tariff providers show a similar pattern to the pattern of
acceptance rates in Figure 73. In 2016, the overall number of English 18 year old
acceptances with A levels to medium tariff providers in England increased by 4 per
cent to 44,300. The biggest increases in acceptances were for those holding A levels
equivalent to between DDE and BBC. For each of these grade profiles, the number of
acceptances increased by between 100 and 400.
Security marking: PUBLIC Page 132 of 142
Document owner: UCAS Analysis & Research 15 December 2016
The number of acceptances to lower tariff providers fell by 6 per cent to 32,000 in
2016. The largest falls, of between 100 and 400 acceptances, were among those with
A levels equivalent to DDD and BBC.
Figure 74 English 18 year old acceptances to higher, medium, and lower tariff
English providers, and unplaced applicants, by number of A level grades
Num
ber
of applic
ants
0
5,000
10,000
Typical A level grades
DDE DDD CDD CCD CCC BCC BBC BBB ABB AAB AAA *AA **A ***
2016−Unplaced 2016−Lower Tariff 2016−Medium Tariff 2016−Higher Tariff2015−Unplaced 2015−Lower Tariff 2015−Medium Tariff 2015−Higher Tariff
Acceptance rates to medium tariff providers increase for applicants holding BTECs
in 2016, but fall for lower tariff providers Figure 75 shows the proportion of applicants accepted to higher, medium, and lower
tariff providers in England, for English 18 year old applicants holding a Level 3 BTEC
qualification equivalent in size to three A levels. Acceptance rates are plotted by the
grade profile achieved, ranging from three Pass (P) grades through to three
Distinction* (D*) grades.
Across all BTEC grade profiles, acceptance rates to lower tariff providers were higher
than for medium tariff providers, which in turn were greater than the acceptance
rates for higher tariff providers. In 2016, applicants with BTEC grade profiles of MPP
through to DMM were most likely to be accepted to lower tariff providers, with
acceptance rates of over 60 per cent. Applicants with BTEC grades of D*DD and
above were least likely to be accepted to a lower tariff provider, though the
acceptance rates were still relatively high (compared to the acceptance rates for
higher and medium tariff providers) at around 50 per cent.
Applicants with higher BTEC grades were more likely to be placed at higher and
medium tariff providers than applicants with lower BTEC grades. For example, 4 per
cent of BTEC applicants with PPP were accepted to medium tariff providers, and
none were accepted to higher tariff providers. However, 27 per cent of BTEC

Security marking: PUBLIC Page 133 of 142
Document owner: UCAS Analysis & Research 15 December 2016
applicants with D*D*D* were accepted to medium tariff providers, and 10 per cent
were accepted to higher tariff providers.
Between 2015 and 2016, the acceptance rates to lower tariff providers for applicants
with grades of MMM or above fell. The largest fall, 6 per cent proportionally, was for
applicants with DDD.
At the same time, acceptance rates to medium tariff providers, for the same
applicants, increased. The largest increase in acceptance rates to medium tariff
providers was for applicants with MMM, which increased by 33 per cent
proportionally (3.8 percentage points). But there were also large increases in
acceptance rates to medium tariff providers for applicants with MPP, MMP, DMM,
and DDD, which all increased by at least 10 per cent proportionally.
The acceptance rate to higher tariff providers for 18 year old English applicants
holding BTECs remained unchanged in 2016.
Figure 75 Acceptance rates of English 18 year old applicants to higher, medium,
and lower tariff English providers, by BTEC grade profile
Pro
port
ion o
f applic
ants
0%
25%
50%
75%
100%
Typical BTEC profile
PPP MPP MMP MMM DMM DDM DDD *DD **D ***
2016−Unplaced 2016−Lower Tariff 2016−Medium Tariff 2016−Higher Tariff2015−Unplaced 2015−Lower Tariff 2015−Medium Tariff 2015−Higher Tariff
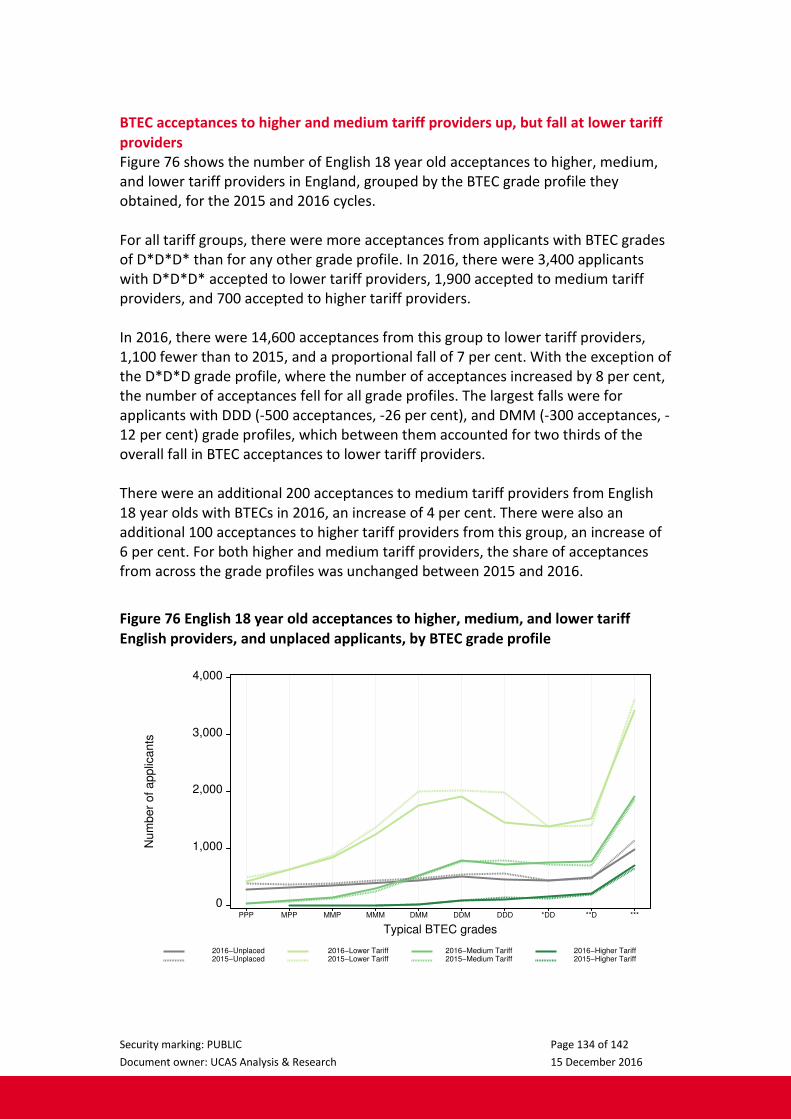
Security marking: PUBLIC Page 134 of 142
Document owner: UCAS Analysis & Research 15 December 2016
BTEC acceptances to higher and medium tariff providers up, but fall at lower tariff
providers
Figure 76 shows the number of English 18 year old acceptances to higher, medium,
and lower tariff providers in England, grouped by the BTEC grade profile they
obtained, for the 2015 and 2016 cycles.
For all tariff groups, there were more acceptances from applicants with BTEC grades
of D*D*D* than for any other grade profile. In 2016, there were 3,400 applicants
with D*D*D* accepted to lower tariff providers, 1,900 accepted to medium tariff
providers, and 700 accepted to higher tariff providers.
In 2016, there were 14,600 acceptances from this group to lower tariff providers,
1,100 fewer than to 2015, and a proportional fall of 7 per cent. With the exception of
the D*D*D grade profile, where the number of acceptances increased by 8 per cent,
the number of acceptances fell for all grade profiles. The largest falls were for
applicants with DDD (-500 acceptances, -26 per cent), and DMM (-300 acceptances, -
12 per cent) grade profiles, which between them accounted for two thirds of the
overall fall in BTEC acceptances to lower tariff providers.
There were an additional 200 acceptances to medium tariff providers from English
18 year olds with BTECs in 2016, an increase of 4 per cent. There were also an
additional 100 acceptances to higher tariff providers from this group, an increase of
6 per cent. For both higher and medium tariff providers, the share of acceptances
from across the grade profiles was unchanged between 2015 and 2016.
Figure 76 English 18 year old acceptances to higher, medium, and lower tariff
English providers, and unplaced applicants, by BTEC grade profile
Num
ber
of applic
ants
0
1,000
2,000
3,000
4,000
Typical BTEC grades
PPP MPP MMP MMM DMM DDM DDD *DD **D ***
2016−Unplaced 2016−Lower Tariff 2016−Medium Tariff 2016−Higher Tariff2015−Unplaced 2015−Lower Tariff 2015−Medium Tariff 2015−Higher Tariff

Security marking: PUBLIC Page 135 of 142
Document owner: UCAS Analysis & Research 15 December 2016
Recruitment changes for providers
Since the changes made to tuition fees and student number controls that came into
place for the 2012/13 entry cycle, recruitment across providers has varied. For most
providers, the number of acceptances has increased, but for other providers it has
fallen. These patterns in recruitment are investigated for the 154 largest providers
(accounting for 95 per cent of all acceptances in 2016) that have been consistent
users of UCAS since 2007.
Acceptances in 2016 increase for the majority of higher and medium tariff
providers
Figure 77 shows proportional changes in recruitment at provider-level over two
different time intervals. Changes between 2012 and 2015 are plotted against the
horizontal axes, while changes between 2015 and 2016 are plotted against the
vertical axes. Providers on the right hand side of the graph increased their total
recruitment numbers between 2012 and 2015, while providers on the upper half of
the graph increased their recruitment between 2015 and 2016. Each provider is
coloured according to tariff group.
Between 2012 and 2015, around two thirds of providers increased their recruitment.
The higher tariff group increased in size by 18 per cent during this period, with
almost all increasing their recruitment. Recruitment to medium tariff providers
increased by 17 per cent, with three quarters of providers in this group increasing in
size. Just over half of lower tariff providers increased their recruitment between
2012 and 2015, with an 8 per cent proportional change in recruitment for the lower
tariff group.
Between 2015 and 2016, just under half of providers increased their recruitment.
The higher tariff group of providers grew by 3 per cent, with around three quarters
increasing their numbers of acceptances. The medium tariff group also grew by 3 per
cent, with two thirds of medium tariff providers increasing in size. In 2016, the lower
tariff group decreased in size by 3 per cent. Two thirds of lower tariff providers had a
reduction in numbers, with the rest having increases.
Most providers that had decreases in acceptances between 2012 and 2015, and
again in 2016, are lower tariff
Among the set of providers that increased in size between 2012 and 2015, around
half had further increases in 2016. Among the providers that decreased in size
between 2012 and 2015, over half had further decreases in 2016, with the majority
being lower tariff.

Security marking: PUBLIC Page 136 of 142
Document owner: UCAS Analysis & Research 15 December 2016
Figure 77 Selected provider-level changes in recruitment between 2015 and 2016,
relative to recruitment changes between 2012 and 2015
Pro
port
ional change 2
016 v
s 2
015
−25%
0%
25%
Proportional change 2015 vs 2012
−50% −25% 0% 25% 50%
Higher tariffMedium tariff
Lower tariff
Changes in recruitment in 2016 only unrelated to share of intake holding BTECs
Figure 78 shows the proportional change in recruitment (English domicile only) at
each provider against the proportion recruited that held BTECs as their main
qualification. The share of acceptances to higher tariff providers that hold BTECs as
their main qualification (between 0 and 9 per cent) is generally smaller than for
medium (between 1 and 33 per cent) and lower tariff providers (between 3 and 42
per cent). However, the proportional changes in recruitment between 2015 and
2016 ranged between +/-20 per cent for most providers.

Security marking: PUBLIC Page 137 of 142
Document owner: UCAS Analysis & Research 15 December 2016
Figure 78 Selected provider-level changes in recruitment between 2015 and 2016,
relative to the share that hold BTECs as their main qualification, English domicile
only P
roport
ional change 2
016 v
s 2
015
−25%
0%
25%
Percentage of applicants holding only BTECs
0% 25% 50%
Higher tariffMedium tariff
Lower tariff
Section 3Glossary

Security marking: PUBLIC Page 139 of 142
Document owner: UCAS Analysis & Research 15 December 2016
ABB+ The high grade qualification combinations that were used in the number control
arrangements for most courses in England in the 2013/14 academic year. They
approximate the categories that relate to the Higher Education Funding Council for
England (HEFCE) student number control arrangements in that year from
information recorded in the UCAS system. The assessment of entry qualifications
uses a number of data sources, including information provided by applicants
themselves.
Acceptance An applicant who at the end of the cycle has been placed for entry into higher
education.
Acceptance rate The number of acceptances divided by the number of applicants.
Adjustment An acceptance route where applicants who have met and exceeded the conditions
of their firm choice choose to take up an alternative offer.
Age This analysis uses country-specific age definitions that align with the cut off points
for school and college cohorts in the different administrations of the UK. For
England and Wales, ages are defined on 31 August, for Northern Ireland on 1 July,
and for Scotland on 28 February the following year. Defining ages in this way
matches the assignment of children to school cohorts. For applicants outside of the
UK, a cohort cut off of 31 August has been used.
A level points A level grades are assigned points such that A* = 6 points, A = 5, B = 4, C = 3, D = 2,
and E = 1. Achieved A level grade profiles of applicants are assigned the total
number of points of their best three achieved grades, for example a grade profile
of AAB would be worth 14 A level points.
Applicant A person who has made an application in the UCAS system. Counts of applicants
include those applying through the main scheme, late applicants direct to Clearing,
and records of prior acceptance (RPAs).
Application rate The number of applicants divided by the estimated base population.
Base population
estimate
The population estimates are based on Office for National Statistics mid-year
estimates and national population projections (published in June 2015). For 16 to
20 year olds, the estimates are obtained by ageing 15 year olds from the
appropriate number of years earlier. This approach avoids the estimates being
susceptible to changes in net migration (including overseas students) during these
ages. Older ages are obtained from the mid-year estimates and national population
projections without ageing. In both cases, the estimates are adjusted from age at
mid-year to age on the country-specific reference dates using the monthly
distribution of births. Analysis of application rates by area-based background are
supported through small area population estimates available from the Office for
National Statistics, National Records for Scotland, and the Northern Ireland
Statistics Research Agency. These small area population estimates have been
revised to be consistent with the national level population estimates.

Security marking: PUBLIC Page 140 of 142
Document owner: UCAS Analysis & Research 15 December 2016
BTEC Originally Business and Technician Education Council, BTECs are qualifications now
offered by Pearson. The Level 3 BTECs covered in this analysis include the following
from the NQF framework:
• National Awards
• National Certificate
• National Diploma
• Subsidiary Certificates
They also include the following qualifications in the QCF framework:
• Extended Diploma
• Diploma
• Subsidiary Diploma
• 90-credit Diploma
The majority of BTECs are awarded to applicants from England.
Clearing An acceptance route available late in the application cycle.
Cohort A group of the population all born in the same academic year, and are therefore,
for example, all aged 18 on a particular reference date.
Defer (deferred) Most acceptances are into the academic year that starts immediately at the end of
the cycle, for example into 2015/16 from the 2015 application cycle. Acceptances
can also be deferred for entry into the following academic year, for example into
2016/17 from the 2015 cycle. These are called deferred acceptances.
Direct Clearing Applied via Clearing without an initial application through the main scheme (i.e.
prior to the 30 June deadline).
Domicile Declared area of permanent residence.
Entry rate Number of acceptances from a UCAS application cycle divided by the estimated
base population.
Extra An acceptance route where applicants holding no offers after using all five main
scheme choices can make additional choices.
Firm choice An offer made by a provider which has been confirmed by the applicant as their
first choice. These can be either conditional (dependent on achieving specified
conditions) or unconditional (applicant has met specific conditions and are
assumed to be accepted or placed at the provider).
FSM Free school meals – a means-tested benefit that can be used as an indicator of low
income, which has been sourced from the National Pupil Database (NPD). Changes
to the coverage of the free school meal indicator in the School Census for the
2013/14 academic year, affecting those applying in the 2016 cycle aged 18, have
made it necessary to adjust identification of the FSM group in the UCAS data. This
means that entry rates reported for the FSM and non-FSM groups differ slightly
from those in previous end of cycle reports.

Security marking: PUBLIC Page 141 of 142
Document owner: UCAS Analysis & Research 15 December 2016
GDP Gross Domestic Product – a measure of economic growth based on goods and
services within a period of time.
HE Higher education.
HEFCE Higher Education Funding Council for England.
Higher tariff provider A provider that belongs to the higher tariff group, from the grouping of providers
based on the average levels of attainment of their UK 18 year old accepted
applicants (summarised through UCAS Tariff points) in recent cycles. The other two
groups are medium tariff providers and lower tariff providers. Each group of
providers accounted for around a third of all UK 18 year old acceptances in recent
cycles.
IB International Baccalaureate Diploma.
Insurance choice An offer made by a provider which has been confirmed by the applicant as their
second choice, in case the conditions of their firm choice are not met. These can be
either conditional (dependent on achieving specified requirements) or
unconditional (no further requirements to be met).
Main scheme The main UCAS application scheme through which up to five course choices can be
applied to. This opens in September and closes to new applications on 30 June the
following year.
Main scheme Clearing Where an applicant was unsuccessful in the main scheme (i.e. applied before 30
June), and subsequently found a place using Clearing.
Multi-dimensional
equality measure
(MEM)
The multiple equality measure (MEM) brings together information on several
equality dimensions for which large differences in the probability of progression
into higher education exist. These equality dimensions include sex, ethnic group,
where people live (using the POLAR3 classification), secondary education school
sector (state or private), and income background (as measured by whether a
person was in receipt of free school meals (FSM), a means-tested benefit while at
school).
These equality dimensions are combined using statistical modelling techniques and
a linked data set of pupils in English schools who were aged 18 between 2006 and
2010 (source: National Pupil Database and School Census, Department for
Education). The probability of entry to higher education aged 18 is then calculated
based on these equality characteristics and their combinations.
These probabilities are then used to aggregate pupils into groups, where group 1
contains those least likely to enter higher education (“most disadvantaged” in this
context), and group 5 contains those most likely to enter higher education (“most
advantaged” in this context). The composition of these groups, and their entry
rates, can then be calculated and the trends in these assessed over time.
National pupil
database (NPD)
The Department for Education's National Pupil Database (NPD) holds a range of
information about pupils who attend schools and colleges in England. For this

Security marking: PUBLIC Page 142 of 142
Document owner: UCAS Analysis & Research 15 December 2016
analysis, a link has been formed between individuals attending state schools and
colleges in the NPD at 15 years old and those who were 18 years old in UCAS’ data
three years later.
Non-EU Countries outside the European Union, including the Channel Islands and the Isle of
Man.
Offer Provider decision to grant a place to an applicant. May be subject to the applicant
satisfying academic and/or other criteria.
Offer rate The proportion of applications that receive an offer.
POLAR3 Developed by HEFCE and classifies small areas across the UK into five groups
according to their level of young participation in HE. Each of these groups
represents around 20 per cent of young people and is ranked from quintile 1 (areas
with the lowest young participation rates, considered as the most disadvantaged)
to quintile 5 (highest young participation rates, considered most advantaged).
Provider A higher education provider – a university or college.
RPA Record of Prior Acceptance. When a provider informs UCAS of applicants it has
accepted outside of the normal application process (e.g. individuals who have
applied directly to the provider).
Reply Applicant response to any offers received – this could be firm, insurance, or
decline.
SIMD Scottish Index of Multiple Deprivation identifies small area concentrations of
multiple deprivation across all of Scotland, providing a relative measure of
deprivation among small areas (data zones). In this report, the SIMD 2012 has been
used to group areas in each year in the times series, from 2006 to 2016.
SQA Scottish Qualifications Authority – Higher and Advanced Higher qualifications taken
by young people in Scotland when applying to higher education.
Tariff A numerical summary of qualification level.
UK United Kingdom. Excludes the Channel Islands and the Isle of Man.

RosehillNew Barn LaneCheltenhamGL52 3LZ
t: +44 (0) 1242 545 469www.ucas.com