end of degree work - uji
TRANSCRIPT

Degree in Finance and Accounting
ACADEMIC YEAR 2018-2019
END OF DEGREE WORK
VALUE INVESTING: ANALYSIS OF LISTED COMPANIES
Author: Carlos Serrano Montoliu
Tutor: Luisa Nieto Soria
CASTELLÓN, JULY 2019
INDEX
Introduction – Purpose of Work ………………………………………………………………3
Block 1 – Fundamental Analysis ……………….…………………………………………….4
Block 2 – Analysis of Financial Statements ………………………………………………...7
I. Short-term liquidity Analysis …………………………………………………………7
1.1 Working Capital Analysis ………………………………………...……………...8
1.2 Operating Cycle Analysis ………………………………………………………12
II. Analysis of long-term Capital Structure and Solvency…………………………...16
2.1 Equity Analysis ………………………………………………………………….16
2.2 Debt Analysis ……………………………………………………………………20
III. Analysis of return on investment and utilization of assets ……………………….24
IV. Analysis of results of operations …………………………………………………...28
Block 3 – The main Market Value Ratios ………………………………………………….33
Block 4 – Louis Vuitton Analysis ……………………………………………………………41
I. Analysis Louis Vuitton Financial Statements ………………………………..………42
II. Analysis Louis Vuitton Market Value Ratios …………………………………….…..56
III. Result of the purchase of Louis Vuitton shares ……….…………………....……...61
Conclusion …………………………………………………………………….…………….. 63
Bibliography ………..………………………………………………………….…………..... 65
Annexes ………………………………..……………………………………………………. 68

3
INTRODUCTION
Purpose of the work
The main purpose of this graduate work is the adequate selection of investment
opportunities with a long-term vision considering the analysis of the financial
information offered in the annual accounts and other analytical tools of great
recognition. After describing these ratios, information will be compiled on a specific
company, on which an exhaustive analysis will be carried out on its current situation
and future potential, in order to know if it is suitable for the purchase of shares of the
same.
Firstly, through the analysis of the financial statements, a correct interpretation of the
company's financial situation will be made, using a large number of financial ratios,
which are used by most analysts, gathered according to different approaches, such as
solvency or liquidity, with the purpose of creating a predetermined financial analysis
format that allows automating the process of selecting potentially profitable securities
with which design long-term investment strategies in the securities market.
Next up, a series of stock market ratios where the quotation price is involved will be
detailed. These are the ratios that the analyst uses to detect investment opportunities
considering the behaviour of the companies in the stock market.
Finally, the financial and stock market ratios previously analysed will be implemented
on the basis of Louis Vuitton's annual accounts and historical share price, evaluating
the 2016 year-end results together with those of the four years prior to this one, and
then comparing them with the results obtained at the end of 2017 and 2018, as well as
the current share price, with the final aim of corroborating whether the purchase
decisions previously estimated at the end of 2016 are based on a good foundation.
4
BLOCK I – THE FUNDAMENTAL ANALYSIS
What is fundamental analysis?
Fundamental analysis is a valuation method that attempts to calculate the intrinsic
value of a share by analysing the company's Financial Statements. The comparison of
this information with the behaviour of the stock allows the analyst to discover if the
price of the stock is overvalued or undervalued, considering the factors that can
produce fluctuations in market prices, such as legislative changes, political changes,
etc....
Bernstein (1993, pp.27) states that "The analysis of financial statements is the critical
process of evaluating a company's present and past financial position and results of
operations, with the primary objective of establishing the best possible estimates and
predictions of future conditions and results.”
This analysis seeks to identify those companies that are undervalued in the market
based on a series of criteria formulated by the analyst, which are related to the profits
obtained, the capital structure, the value of the asset, the working capital, the liquidity
and solvency of the company, and other issues that allow the company to obtain
sufficient information to determine whether the market price reflects the situation of the
company.
According to Graham (1949, pp.305), the securities analyst deals with the past, present
and future of any specific security, describing the company that issued it; summarizes
its operating results and financial situation; exposes its strengths and weaknesses, its
possibilities and risks; estimates its future profit-generating capacity based on
hypotheses or ``approximate estimates´´.
5
What is Value Investing?
Value Investing is an investment philosophy that takes advantage of short-term
fluctuations in prices to invest in the long term based on the so-called ``Safety Margin´´.
The ``Safety Margin´´ is the difference between the intrinsic value of a share and its
current market price and allows you to detect when a share is at a lower or higher price
than its real value.
- If intrinsic value > market price: it is recommended to buy.
- If intrinsic value < market price: it is recommended to sell.
Graham and Dood (1934 pp.35) affirm that “the investor should wait for periods of
depressed business and market levels to buy representative common stocks, since he
is unlikely to be able to acquire them at other times except at prices that the future may
cause him to regret.”
Efficient market hypothesis, EMH
In 1970, Eugene Fama, an American economist who won the Nobel Prize in
economics, developed a hypothesis that studied the reaction of market prices to
financial and other information.
Fama (1970, pp.383) affirm that “the primary role of the capital market is allocation of
ownership of the economy's capital. In general terms, the ideal is a market in which
prices provides accurate signal for resource allocation: that, is market in which firms
can make production-investment decisions, and investors can choose among the
securities that represent ownership of firm's under the assumption that security prices
at any time ''fully reflect'' all available information. A market in which prices always ''fully
reflect'' available information is called ''efficient''.

6
This informative efficiency is mainly due to three factors: competition, relative freedom
of entry and the low cost of information on financial markets. Therefore, according to
Fama, the new asset price reflected by the market after the publication of the
information is considered the new equilibrium price.
Depending on the market, there are three possible scenarios:
- EMH in its weak form: Establishes that current market prices reflect information
based on historical prices.
- EMH in its semi-strong form: Market prices reflect all publicly disclosed information.
- EMH in its strong form: Affirms that prices reflect all information, including privileged
information.
The movement of new information and its correct interpretation is developed from the
well-informed segments of the market to those who are less informed and who absorb
more slowly. This fact explains why the distribution of the new information is gradual
and not immediate.
According to Bernstein (1933, pp.19), the enormous resources that must be devoted to
a competent analysis of companies has made some segments of the stock markets
more efficient than others. Thus, the market for the shares of larger companies is more
efficient because there are many more analysts who follow these values and are
compensated for doing so, than those who follow the values of smaller, lesser-known
companies.
Palepu, Healy and Bernard (2000, pp.13-5) say that "evidence pointing to highly
efficient stock markets come in a variety of forms:
- When information is announced publicly, markets react very quickly.
- It is difficult to identify analysts or specific funds that have consistently generated
extraordinarily high returns.
- Several studies suggest that stock prices reflect a rather complex level of
fundamental analysis.”
7
BLOCK II – ANALYSIS OF FINANCIAL STATEMENTS
Martínez and Somohano (2002, pp.30) affirm that "accounting, from an open
conception, is defined as the process of identifying, measuring and communicating
economic information that allows you to formulate judgments based on information and
decision-making of those who use said information. "
According to Bernstein (1993, pp.35), one of the best definitions of the function of
accounting is the one contained in the Accounting Research Study (ARS). According to
this study, the function of accounting consists in:
1. Measure the resources owned by specific entities.
2. Reflect claims against these entities and their participation in them.
3. The measurement of the changes produced in those resources and credits.
4. Assign changes to a specified period of time.
5. Expressing this in monetary terms as a common denominator.
The most important financial statements are the balance sheet, the profit and loss
account and the cash flows, which will be examined in greater depth and analysed in
order to make a correct valuation of the company.
I. Short-term liquidity analysis
A company's liquidity is measured by the degree to which it is able to meet its short-
term obligations. In other words, it is the ease with which assets can be transformed
into cash.
Martínez and Somohano (2002, pp. 449) state that "it is necessary to consider that the
liquidity of a company must have the adequate measure, that is to say, that it does not

8
present either an excess that entails idle resources, which will diminish the global
profitability of the company, nor a defect that entails a shortage of liquid resources
necessary to develop the operating activity, which will suppose difficulties to meet all
the payments, prevent possible expansions and/or the saving of additional costs. ”
1.1. Analysis of Working Capital
According to Bernstein (1993, pp.544), current assets include cash and other assets
that can reasonably be expected to be able to convert into cash, sold or consumed
during the normal operating cycle of the company (short-term investments, receivables,
inventories and prepaid expenses).
Walsh (1994, pp.20) states that "these consignments are in constant motion. When
inventories are sold, they become accounts receivable, and once paid, they become
treasury.”
The two most significant items in this part of the balance sheet are inventories and
receivables, which often make up 50% of the total assets of the company.
Cash is the definitive measure of current assets, as current liabilities are settled with
cash.
Current liabilities are obligations that will require the use of current assets for their
liquidation, or alternatively, the creation of other current liabilities. These are accounts
payable, notes payable, short-term bank and other loans, taxes and other accrued
expenses, and the short-term portion of the long-term debt.
1.1.1. Working Capital Ratio
In order to analyse liquidity, working capital or rolling fund should be highlighted, which
is the excess of current assets over current liabilities. There is a current deficit when
current liabilities exceed current assets.

9
Working Capital Ratio = Current Assets – Current Liabilities
Working Capital > 0: Positive working capital means that the company has the ability
to meet its closest payment commitments.
Working Capital < 0: Negative working capital means that the company is not able to
assume all of its short-term debts, and therefore has no liquidity.
Working Capital = 0: Nil working capital shows that the company risks running out of
liquidity if short-term collection expectations are not met.
According to Martínez and Somohano (2002, pp. 448), a positive net cash flow implies
an excess of liquidity and capital: it would make it possible for the company to expand
or modify its financial structure. Negative net cash implies a liquidity deficit, which leads
to more resources being obtained or a reduction in working capital requirements.
What can be stated is that, for most companies, the continued maintenance of a
negative working capital generates a situation of financial imbalance that may lead to a
future suspension of payments. However, an excessive working capital represents a
significant increase in the opportunity cost, losing opportunities to make capital
profitable.
It should be noted that there are a number of sectors and/or companies whose nature
implies having a negative working capital, such as the food sector, where customers
are charged in cash and suppliers are usually paid in ninety days, which allows them to
continue operating with a high volume of stocks and little liquidity.

10
1.1.2. Current Ratio
Miralles and Sánchez (2010, pp.318) say that "this ratio measures the relationship
between current assets and current liabilities, not as a difference but as a quotient.
Therefore, the current ratio is defined as:"
Current Ratio = Current Assets / Current Liabilities
The current ratio is called “current” because, unlike some other liquidity ratios, it
incorporates all current assets and liabilities.
The current ratio is a liquidity ratio that measures a company's ability to pay short-term
obligations or those due within one year. It tells investors and analysts how a company
can maximize the current assets on its balance sheet to satisfy its current debt and
other payables.
In order for the company to not have liquidity problems, the value of the liquidity ratio
must be close to 2, approximately, or between 1.5 and 2. If this ratio is less than 1.5, it
indicates that the company may have a greater probability of suspending payments.
Perhaps one might think that a liquidity ratio of 1 would allow current liabilities to be
met without problems. However, possible late payments by customers and finding
difficulties in selling all stocks in the short term make it advisable for the working capital
to be positive and, therefore, for current assets to be greater than short-term debts.
This situation depends on how the company collects and pays, since there are sectors
where the collections are made very quickly and the payments very late and this allows
them to operate with a negative working capital. If the liquidity ratio is much higher than
2, it may mean that you have idle current assets without generating any profitability.
Current Ratio < 1,5: Lack of liquidity
1,5 < Current Ratio < 2: Adequate liquidity
Current Ratio > 2: Excess liquidity
11
1.1.3. Cash Ratio
To complete the analysis of working capital, we highlight the Cash Ratio, which
establishes the proportion of cash and cash equivalents over current liabilities.
According to Corporate Finance Institute (n.d.), the cash ratio is a liquidity metric that
indicates a company’s capacity to pay off short-term debt obligations with its cash and
cash equivalents. Compared to other liquidity ratios such as the current ratio and quick
ratio, the cash ratio is a stricter, more conservative measure because only cash and
cash equivalents (a company’s most liquid assets) are used in the calculation.
Cash Ratio = Cash and Cash Equivalents
Current Liabilities
This ratio measures the portion of current debts that could be paid off immediately
through the company's cash at that very moment. Therefore, the positive evolution of
this ratio is a factor that decreases the risk of declaring suspension of payments.
1.1.4. Acid Test Ratio
Another of the most commonly used ratios when analysing current assets and liabilities
is the acid test, which is the coefficient resulting from the difference between current
assets and inventories with respect to current liabilities.
Acid Test Ratio = Current Assets – Total Inventories
Current Liabilities
Acid Test > 1: The company has sufficient liquidity to meet its closest payment needs
with its most liquid assets without having to dispose of its goods. It is an obvious
symptom that the company does not have financial problems in a short-term vision.

12
Acid Test < 1: The company has liquidity problems, since the short-term resources are
insufficient to satisfy the closest debts settled, the company should try to get rid of their
stocks as soon as possible to generate the necessary liquidity.
According to Martínez and Somohano (2002, pp. 451), in order to meet current
liabilities, all the elements of current assets are taken into account, except for
inventories, as they are a realisable subjected to prior sale. For this reason, some
authors identify stocks as an asset with reduced liquidity, liquidity in the strict sense or
immediate solvency.
1.2. Operating Cycle Analysis
Urias (1995, pp.232) states that "working capital needs will depend on the operating
cycle which will be different for each type of company and what the company will
always have to try to optimize will always be the time of that cycle that involves
investment that has to be financed, financing that implies a cost. ”
According to Somoza (2018, pp.91), the ratios representing business dynamics, also
known as dynamic ratios, include all those that include the timing of both collections
and payments. Reference should be made to the average maturation period, which
contains an estimation of the different periods for each one of the activities taking place
in the enterprise.
1.2.1. Days Inventories Outstanding (DIO) Ratio
Inventories represent investments made in order to obtain a return. Performance
comes from the profit that can be derived from sales.
Martínez and Somohano (2002, pp. 445) define the average storage period as "the
average time that elapses from the completion and entry of finished products into
storage until they are sold to customers".

13
This ratio is calculated by dividing the average of inventories by the annual cost of
inventories sold, all multiplied by the number of days of the year.
DIO = Average of Inventories x 360
Cost of Sales
According to Urias (1995, pp.264), a storage period longer than expected or than the
one that already existed, on average, in the sector in which the company operates, will
indicate a retention of products due to a lack of sales.
An increase in this period with respect to that initially foreseen would imply some kind
of weakness in the purchasing policy or malfunctions in the production service.
1.2.2. Days Sales Outstanding (DSO) Ratio
The measure of liquidity is related to the speed at which, on average, accounts
receivable will be converted into cash. In this case too, rotation is one of the best ways
of measurement that can be used as it gives an indication of the speed of collection.
According to Bernstein (1993, pp.556), the average accounts receivable turnover figure
indicates how many times, on average, accounts receivable have been renewed, that
is, generated and collected in the year.
This number is calculated by dividing the balances receivable in the year by the sales
made in the year and multiplying this result by the days of the year, that is, 360 days.

14
DSO = Average of Accounts Receivable x 360
Sales
This figure can be used to estimate the speed with which the company recovers its
sales, in other words, the liquidity generated by customers throughout the year.
1.2.3. Days Payables Outstanding (DPO) Ratio
Urias (1995, pp.264) states that "the turning ratio of operating liabilities will show us the
number of times that, in a period, the debt with suppliers becomes effective, so it would
be necessary to have the figure for purchases on credit for the period and the average
credit balances for this concept.
To calculate this ratio, the average balance of the vendor account is divided by the
purchases made during the year, then the result is multiplied by the number of days in
a year, obtaining the days that, on average, the company takes to satisfy the debts
contracted with its suppliers.
DPO = Average of Trade Accounts Payable x 360
Annual Purchases
Annual purchases = Cost of Goods Sold + Closing Inventory − Opening Inventory
To the extent that a company has difficulties in realising its current assets, it will look
for an extension of the payment period to its suppliers, so a reduction of this period of
time implies that the company is fairly healthy in terms of liquidity.

15
1.2.4. Operating cycle and Net Operating Cycle
Martínez and Somohano (2002, pp. 451) define the average maturation period as "the
time that elapses, on average, between the disbursement of a monetary unit invested
in the exploitation cycle and its recovery once the goods sold to the customers have
been collected.”
Therefore, a company that reflects a reduction in the average maturation period
consecutively over several years of operation is indicating an improvement in the
business model that is reflected in the increase in liquidity.
The average economic maturation period consists of the addition of the average
storage period and the average period of collection from customers.
OPERATING CYCLE = DIO + DSO
According to Miralles and Sánchez (2010, pp.308), the average period of financial
maturation is defined as the average period of maturation minus the period granted by
suppliers to make a payment.
NET OPERATING CYCLE = DIO + DSO – DPO
For the analysis of listed companies, the analyst will use the average period of
maturation of the company in previous years to try to know if the company has
improved its efficiency regarding the processes that encompass its business model. If
there is a reduction in the average period of economic and financial maturation over the
years, it is a clear sign that the company is improving the efficiency of the processes
directly related to its operating activity.
16
II. Analysis of long-term capital structure and solvency
The process of assessing a company's long-term solvency differs significantly from the
process of assessing short-term liquidity.
Rojo (2011, pp.251) states that "long-term solvency has to do with the company's
expected ability to meet its long-term payment commitments. In this sense, this
solvency is largely guaranteed if the company is profitable, generating sufficient cash in
the future.”
According to Miralles and Sánchez (2010, pp.341), a company may have high liquidity
at a certain point in time, but if it is not profitable and does not generate resources it will
be unable to maintain that liquidity, compromising its long-term solvency.
Bernstein (1993, p. 607) states that 'the capital structure of a company is basically
made up of equity and debt. The financial stability inherent in a company and the risk of
insolvency to which it is exposed, depend to a large extent on the origins of its funds.”
2.1. Equity Analysis
According to Bernstein (1993, p. 614), equity is the basic risk capital of a company. The
most notorious feature of these is that they do not have a mandatory return that must
be paid in any case; therefore, they are the funds that the company can most
confidently invest in long-term assets and expose to greater risk.
Urías (1995, pp.291) says that "A company’s own financing is divided into two main
sections: contributions from owners and self-financing.”
The contributions of the owners measure their participation in the company's risk, these
are captured through share issues, and allow the company to finance itself in exchange

17
for the participation of the shareholders in the distribution of profits; therefore, with this
type of financing the company assumes a lower risk in the event of losses occurring.
It should be noted that in an environment of rising interest rates, the company will
benefit more from obtaining financing by issuing shares than by contracting debts with
banks.
2.1.1. Internal financing
According to Urias (1995, pp.291), given that the reserves appearing on a company's
balance sheet can have different origins; share premium, capital gains or revaluations
and retained profits, only reserves belonging to the latter category should be computed
as self-financing enrichment.
The depreciation of a fixed asset and the endowment of the reserve that represents its
replacement reduces the profit obtained by the company and is called replacement
self-financing.
For the analysis of the capital structure, emphasis is placed on self-financing of
enrichment, since this reinvestment suggests that the company is developing an
expansion strategy in exchange for renouncing to the company's dividend yield.
Therefore, a constant annual increase of this item is a determining factor for the growth
of the company.
Miralles and Sánchez (2010, pp.356) states that "the fact that the company retains
profits instead of allocating the funds to shareholders via dividends improves the
solvency of the company, means an increase in the equity guarantee and allows
additional funds to undertake new investments in a self-financing way, with no need to
get to external indebtedness. ”

18
2.1.2. Capitalization Ratio of the Period
This ratio makes it possible to know the capitalisation carried out in the last financial
year, dividing the enrichment self-financing by the annual net profit:
Capitalization Ratio of the Period = Annual Internal Financing
Net Profit
Miralles and Sánchez (2010, pp.357) state that "this ratio is an indicator of the
company's capacity to constitute its reserves; through its comparison over time we can
get an idea of the policy that the company will follow in terms of endowment of the
reserves.”
Maximum value = 1 = all profit is retained in the form of reserves
Minimum value = 0 = all profit is distributed via dividend
A value close to the unit would indicate that most of the resources generated by the
company are destined for reinvestment in its structure, increasing equity and therefore
increasing the theoretical value of the shares at the same time.
However, a close to zero value would indicate that the company is rewarding
shareholders directly with the profits obtained, so it is not trying to increase its
structure, these policies are usually given in companies that belong to mature sectors.
Depending on the investment strategy followed by the investor, that is to say, if he
seeks to obtain benefits by increasing the quoted price or by distributing dividends, he
will be interested in a value close to one or close to zero, respectively.
19
2.1.3. Ratio of Financial Autonomy
Martínez and Somohano (2002, pp. 455) say that this ratio "makes it possible to
measure the degree of independence that the company has according to the origin or
source of the financial resources it uses. It will indicate for each monetary unit of
external resources applied in the activity how much of its own resources is used.”
This ratio is the coefficient generated by dividing the liability payable by the total
shareholders' equity:
Ratio of Financial Autonomy = Total Liabilities
Total Equity
Financial autonomy implies the possibility for the company to choose the most
appropriate way to finance itself.
If the value of the ratio is high, that is, exceeds one unit, there is relatively little debt,
indicating a greater possibility of choosing the most appropriate source of financing, as
lenders will not be very demanding.
On the other hand, if the value of the ratio is low, the company will not be in a position
to choose the form of financing it wants, as due to the high indebtedness the lenders
will perceive a high probability of default.
It should be noted that an excessively high value is not optimal for the company, as the
shareholders would bear the entire financial risk of the company.
Ratio of financial autonomy = 1 = The company has some financial autonomy.
Ratio of financial autonomy < 0,7 = The company does not have financial autonomy.
Ratio of financial autonomy > 1,5 = The company has too much financial autonomy.
20
2.2. Debt Analysis
Miralles and Sánchez (2010, pp.349) say that "since companies need to go abroad in
search of financing when their net worth is insufficient to make planned investments
and maintain their level of activity, debt ratios are elaborated to provide information on
the structural situation of liabilities and net worth, making it possible to diagnose the
amount and quality of payment commitments acquired (current and non-current
debts).”
2.2.1. Debt/Equity Ratio
The debt ratio is equal to the total debt divided by the liability.
According to Bernstein (1993, pp. 625), this is the broadest ratio in this area, as it
measures the ratio between financial debt and total liabilities, which in addition to
financial debt contemplates the rest of liabilities.
Debt/Equity Ratio = Total Liabilities
Total Equity
If we obtained a ratio equivalent to 1.20, this means that for each monetary unit the
company has, it uses 1.20 monetary units in the form of debt.
According to Miralles and Sánchez (2010, pp.352), it can be said that the optimum
value of the debt ratio is around 1, so that there is a balance between own and external
resources.

21
2.2.2 Debt Quality Ratio
Urias (1995, pp.292) says that "the difference between long-term and short-term
liabilities should be noted; the higher the short-term to long-term liabilities ratio is the
greater the risk of insolvency.”
Therefore, this ratio is calculated by dividing short-term debts by long-term debts.
Debt Quality Ratio = Current Liabilities
Non-Current Liabilities
According to Amat (2008, pp.96), the lower the value of this ratio, the better the quality
of the debt is with regard to the time limit.
2.2.3. Banking Debt/Equity Ratio
In order to carry out a more detailed debt analysis, it is necessary to distinguish
between commercial debt and bank debt, with greater emphasis on the latter.
Miralles and Sánchez (2010, pp.353) say that "bank indebtedness implies greater
financial risk and higher financial charges (interests) than financing via suppliers.”
Banking Debt/Equity Ratio = Banking Debt
Total Equity
A constant annual reduction in this ratio would be an indication that the company is
reducing its risk of insolvency.
22
2.2.4. Debt Coverage Ratio
Highly indebted companies with high interest rates can see how a big part or even all of
their profit is taken away by creditors in the form of interest. However, in other
companies, financial expenses have little influence on the outcome, so creditors will
have greater security in the collection of the outstanding debt.
Bernstein (1993, pp.645) says that "the profit coverage ratio test is a proof of a
company's ability to meet its fixed costs from its current profits.”
Debt Coverage Ratio = Profit before interest and taxes
Financial Costs
Minimum value = To ensure the survival of a company, the value of the ratio must be
greater than one, otherwise, the ratio indicates that the profit is completely absorbed by
the interest generated by the debt incurred.
Optimal value = As high as possible. No problems are considered to exist when the
ratio is greater than 3. However, in stable companies’ smaller ratios might be allowed.
2.2.5. Total Assets/Total Liabilities Ratio
Miralles and Sánchez (2010, pp.347) say that "this ratio is an indicator of the global
capacity of the company's assets to face all its debts with third parties, regardless of
their maturity. In other words, it shows the guarantee that the company offers to its
creditors, in the hypothetical event of liquidation of the company, as a result of the
assets it holds.”
Therefore, this ratio is the result of dividing total assets by total liabilities.

23
Total Assets/Total Debt Ratio = Total Assets
Total Liabilities
If the equity is positive, the assets will exceed the liabilities, in this case the ratio will
have a value greater than one. The ideal situation is for the ratio to be as high as
possible, but at least above 1.50.
On the contrary, this ratio should never be less than 1, since this situation is indicative
of serious financial problems such as insolvency or bankruptcy, meaning that own
capital has been consumed, normally due to the successive accumulation of losses.
Total Debt to Total Assets Ratio > 1.50 = No insolvency problems.
1 < Total Debt to Total Assets Ratio < 1.5 = Low insolvency risk
Total Debt to Total Assets Ratio < 1 = High insolvency risk
2.2.6. Leverage Effect
According to Urias (1995, pp.294), the possible advantages of a debt relationship are
given, on the one hand, because the costs incurred by the debt are fixed and it is not
necessary to remunerate it on the basis of profit, in such a way that, if the company's
yields are higher than its financial cost, its use will leave a supplementary margin for
the owners. On the other hand, the remuneration of the debt, that is, the financial
expenses, are tax-deductible expenses, which is not the case with dividends paid on
own capital.
The financial leverage ratio is known as the ratio between the return on equity (ROE)
and the return on total assets (ROA).

24
r1 = ROE = Net Profit / Total Equity
r2 = ROA = Profit before taxes and interest / Total Assets
Financial Leverage = r1 / r2
If the ratio is greater than one, that is, if r1>r2, interest-bearing borrowings contribute to
a higher return on equity than it would be if the company was not in debt. Therefore, in
this case, the use of external funds is economically convenient.
If the ratio is equal to the unit, i.e. r1=r2, the use of external funds is indifferent.
Finally, if the ratio is less than one, i.e. r1<r2, the cost of borrowing reduces the return
on equity.
Therefore, financial leverage can have both positive and negative effects.
III. Analysis of return on investment and asset utilization Return on investment is the relationship between net profit and the capital invested in
generating it and it is considered to be one of the most valid and widely recognised
measures of a company's performance.
The effectiveness of the operating results determines the company's ability to survive
financially, to attract donors and to reward them adequately.
3.1. Operating Cash Flow/Total Assets Ratio
Miralles and Sánchez (2010, pp.382) say that "it is an indicator of asset performance
by comparing the cash generated by operating activities with total assets employed.
The higher this ratio, the greater the yield and cash generated.”

25
It provides information on how many monetary units the company receives in the form
of cash for carrying out its operating activity with regards to one unit of the total asset
that makes up the company.
OCF/Total Assets Ratio = Cash from Operating Activities
Total Assets
Therefore, sustainable growth over time in this ratio indicates that the return on assets
is increasing.
3.2. Asset Turnover Ratio
According to Wild, Subramanyam and Halsey (2007, pp.434), asset turnover measures
the intensity with which companies use assets. The most relevant measure of the use
of assets is sales, since sales are essential to quantify the profitability of the assets that
make up the company. In specific cases, such as start-ups or developing companies,
the analysis of turnover has to recognise that most of the assets are dedicated to future
business activities.
Asset Turnover Ratio = Annual Sales / Total Assets
The Asset Turnover Ratio reflects the efficiency of the company in managing its assets
to generate sales. This ratio is calculated by taking the net turnover and dividing it by
the total assets. The higher the value of this ratio, the greater the productivity of the
assets to generate sales and therefore the profitability of the business.

26
3.3. Operating Profit Margin
The operating margin is the proportion of the profits that the company perceives with
respect to the total income generated by its sales, taking only operating expenses into
account.
Operating Profit Margin = Operating Profit
Total Sales
Walsh (2003, pp.68) states that "this ratio, that identifies profit as a percentage of
sales, is a well-known parameter and is almost universally used for controlling a
company's operating profits.”
3.4. Return on assets (ROA)
Economic profitability is the first and main purpose of a company, since it measures the
efficiency of the behaviour of investments regardless of how they have been financed.
According to Bernstein (1993, pp.664), return on total assets (ROA) is perhaps the best
measure of a company's operational efficiency. It measures the return on all assets
entrusted to management. By removing the effect of the method used to finance the
assets from that calculation, the analyst can focus on the evaluation or projection of
operating results.
As far as profit is concerned, if total assets are considered as the basis for investment,
profit is used with interest expenses and taxes discounted, since interest is considered
as a payment to suppliers of capital and does not influence the return generated by the
company's assets, as is the case with taxes payable.

27
It should be noted that ROA can also be calculated by multiplying the operating profit
margin by the assets turnover, a factor that allows us to break down economic
profitability and analyse it in greater detail, since the first ratio indicates the profitability
obtained from the sales made, and the second, the production capacity that falls on the
company's assets.
Return of Assets = EBIT
Total Assets
Return of Assets = Operating Profit Margin X Asset Turnover
3.5 Return on equity (ROE)
Return on equity (ROE), also known as financial performance (RF), refers to the
performance that remains exclusively with the shareholders.
This measure of profitability is influenced by the form of financing and the tax effect
since in the numerator, in the measure of the result, the interest on the debt and taxes
would have already been subtracted, leaving only the shareholders to be remunerated.
Return on Equity = Net Profit
Shareholders Equity
According to Walsh (2003, pp.58), this ratio is indisputably one of the most important in
corporate finances. It measures the absolute returns delivered to shareholders in
relation to their absolute investment. A good figure means success in the business: it
results in a high share price and makes it easier to raise new funds. These would allow
the company to grow, given the right market conditions, and at the same time lead to
higher profits. All this leads to a high value and a continuous growth of the wealth of its
owners.
28
It emphasizes that financial profitability does depend on the way the company is
financed. The ideal situation is to obtain maximum profitability, because the objective of
any company is to maximize the wealth of shareholders. Therefore, a positive financial
return indicates that the shareholders are getting a return on the company, even if it is
small, while a negative financial return indicates that the shareholders are losing funds
in the company.
Miralles and Sánchez (2010, pp.373) say that "when financial leverage has a positive
effect, the debts generated cause an increase in economic profitability (ROA) higher
than the cost of the debt, which generates an increase in financial profitability (ROE).”
IV. Sales Revenue Analysis
According to Bernstein (1993, pp. 699): Knowing the main sources of income (sales) is
important for the analysis of the income statement, especially when the analysis refers
to a company with multiple markets. Each important market or product line can have its
own pattern of growth, profitability and future potential.
4.1. Sales Figures
The best way to analyse the composition of income is through a proportional statement
showing the percentage of each of the main income classes over the total.
The volume of revenue can be divided by different product lines or by geographic
areas, in order to detect those markets in which the company in question shows the
greatest strengths.
Let's see a real example with the sales figures of Avon Products, a company that
manufactures cosmetic products of great international recognition:

29
Sales figure by product lines:
Source: Avon Products, Inc. Annual Report, 2018.
Sales figure by geographical area:
Source: Avon Products, Inc. Annual Report, 2018.

30
4.2. Sales Growth Ratio
According to Miralles and Sánchez (2010, pp.381), the ratio of the evolution of sales
measures how sales have evolved in the last fiscal year. It simply indicates whether the
company has sold more or less than the previous year. If the company has sold more,
the ratio will have a value greater than 1. If the company has sold less, it will have a
value less than 1.
Sales Growth Ratio = Annual Sales
Last Year Sales
A value higher than the unit of this ratio for several consecutive years is a strong
indication that the company is growing and improving its market share, and that it must
be considered relevant in the analysis.
4.3. Operating Cash Flow/Sales Ratio
According to Somoza (2018, pp.93), this ratio takes in the numerator the cash flows
from operating activities that appear in the statement of cash flows. By dividing it by
sales, it measures what percentage of sales becomes liquidity. The higher the ratio, the
more funds the company generates per unit of currency sold.
OCF/Sales Ratio = Operating Cash Flow
Annual Sales
This ratio is an indicator to measure the capacity that a company has to convert its
sales into cash, that is, independently of the sales that are made, this ratio reflects the
management of collections made by the company.
31
4.4. Operating Ratio
The operating ratio is another intermediate measure in the analysis of the income
statement. It measures the relationship between all operating costs and net sales and
is calculated as follows:
Operating Ratio = Cost of Sales + Other Operating Cost
Net Sales
Bernstein (1993, pp.744) states that "it is a ratio designed to make possible a
comparison in the company of the proportion of each monetary unit generated by sales
that is absorbed by all operating costs.”
Therefore, the progressive decrease in the value of this ratio would indicate a better
management of the company's operating costs.
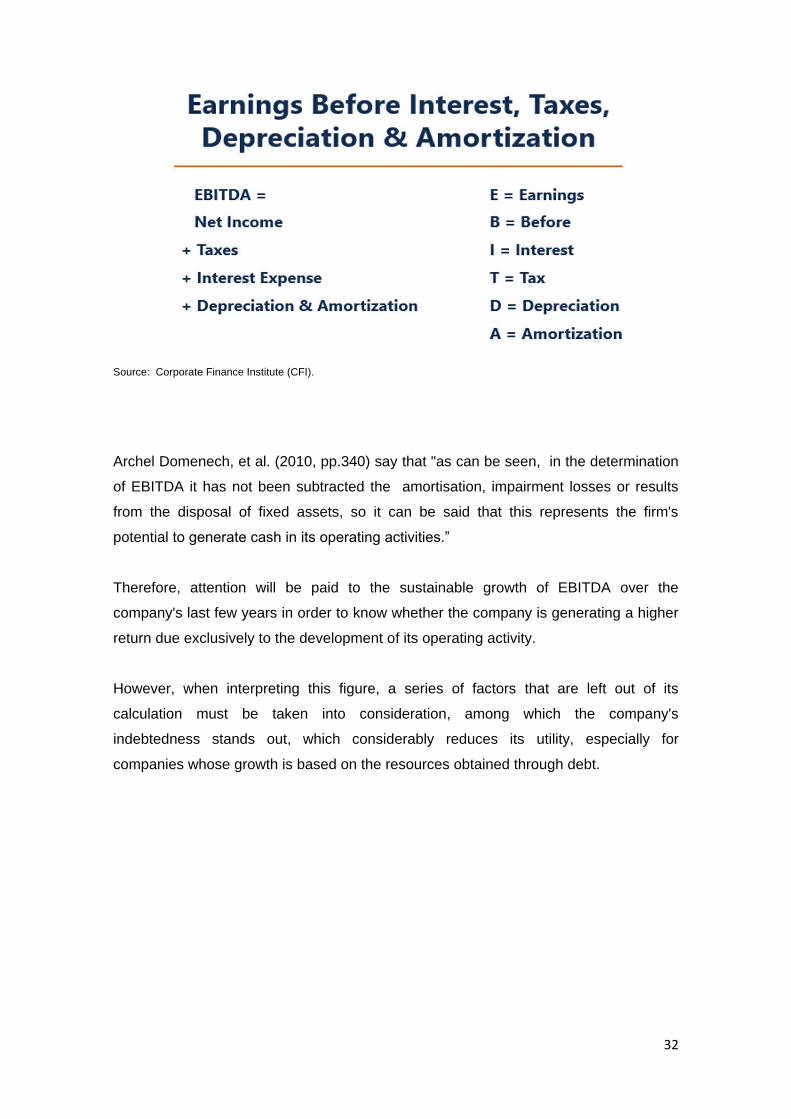
4.5. Earnings before interest, taxes, depreciation and amortization (EBITDA)
The EBITDA (earnings before interest, taxes, depreciation and amortization), is a
variation of the EBIT or operating profit, which considers the depreciations and
amortizations of the assets. This is one of the indicators that in recent times is
achieving greater diffusion.
32
Source: Corporate Finance Institute (CFI).
Archel Domenech, et al. (2010, pp.340) say that "as can be seen, in the determination
of EBITDA it has not been subtracted the amortisation, impairment losses or results
from the disposal of fixed assets, so it can be said that this represents the firm's
potential to generate cash in its operating activities.”
Therefore, attention will be paid to the sustainable growth of EBITDA over the
company's last few years in order to know whether the company is generating a higher
return due exclusively to the development of its operating activity.
However, when interpreting this figure, a series of factors that are left out of its
calculation must be taken into consideration, among which the company's
indebtedness stands out, which considerably reduces its utility, especially for
companies whose growth is based on the resources obtained through debt.
33
BLOCK III – THE MAIN MARKET VALUE RATIOS
Stock market key figures are called stock market key figures because they usually
contain the quoted price. In most cases they contain it explicitly, but there are other
cases in which it is contained within the calculation. This causes the volatility in these
ratios to resemble the volatility of the quoted price.
1. Earnings per Share (EPS)
Earnings per share is the quotient between profit for the year and the number of shares
outstanding, which shows the profit for each share:
EPS = Net Income
Common shares outstanding
According to Walsh (2003, pp. 144), EPS does not serve to compare the returns per
share of one company with another, because some companies may decide to have a
large number of shares of low par value and others a small number of shares, but with
a higher par value.
Although the absolute amount of returns per share says nothing about the company's
performance, the growth of this value over time is a very important statistic. Therefore,
a positive and stable evolution over time of this ratio indicates that the company has
profits with a steady growth, and therefore are high quality profits.
In addition to the preceding paragraph, with respect to the interpretation of this ratio,
some caution must be exercised because although there may be an increase in
earnings per share, financial profitability may remain unchanged or decreases. This is
due to the fact that the company, after the growth in net assets obtained by the
capitalisation of profits finds that the financial profitability of the following year in
percentage terms is lower than that given prior to the allocation of the reserve.

34
2. The Earnings Yield
Graham and Dood (1934, pp.385) affirm that “the earnings ratio, earnings return or
earnings yield, is the ratio of the annual earnings to the market price (e.g., a stock
earning $6 and selling at 50 shows an earnings yield of 12%).”
Earnings Yield = Earnings per Share
Market Price per Share
Therefore, this ratio is the percentage of return obtained from a share with respect to its
market price, which decreases when the share price increases, and vice versa. Since
the share price is controlled by the market, the return on profit represents the rate of
return demanded by the investment community to the company.
Well-appreciated companies show low profitability values because profitability for
profits falls when the stock increases in market value.
The great advantage of earnings yield is that it allows the company to compare
different types of investments, mainly fixed income, to see what kind of return we can
expect from each investment.
3. Price-to-Earnings Ratio (PER)
The most popular price ratio used to assess the value of common stock is the price-
earnings ratio. El PER (Price-earnings ratio) is obtained by dividing the market value of
the company's shares, also known as the capitalisation value, by the net profit of the
company, or in other words, the share price by the EPS.

35
Price-to-Earnings per Share Ratio = Market Price per Share
Earnings per Share
Garcia and Martinez (2018 pp.179) say that "given that the PER tells us how many
monetary units to disburse for each unit of profit in the company it tells us:
- If a company is more expensive (higher PER) or cheaper (lower PER).
- The higher the PER, the bigger the growth expectations.
- The time it takes for the investor to recoup the investment, depending on the profit.”
The PER is used as a comparative tool between companies belonging to the same
industry to try to detect those companies with growth potential but which are quoted at
a premium with respect to the sector, that is to say, with a PER lower than the one of
the sectors they belong to. It can also be compared with previous years of the same
company, in order to appreciate how the expectations that the market had of that
company have changed
4. Cash Flow per Share
According to Miralles and Sánchez (2010, pp.392), this indicator establishes the
relationship between a Cash Flow measure and the number of shares in circulation.
This Cash Flow can be simply the cash generated in the exploitation activities, or it can
be the free Cash Flow.
Analysts commonly highlight the synthesis of Cash Flow as the net profit generated in
the year plus depreciation and amortization
Cash Flow per Share = Cash Flow from operating activities
Common shares outstanding

36
The Cash Flow per share tries to measure the cash flow of the company that would
correspond to each shareholder, for each share in their possession.
The higher the ratio, the greater the expectation of funds corresponding to each
security and, therefore, it is more interesting to invest in a company with a high CFA.
On the contrary, a low CFA implies that a company is not adequately remunerating its
shareholders via cash flow generation and, by extension, through the subsequent
distribution of dividends.
5. Price-to-Cash Flow Ratio (P/CF)
A price-cash flow ratio is measured as a company’s current stock price divided by its
current annual cash flow per share.
According to Archel Domenech, et al. (2010, pp.396), the only difference with PER is
that the denominator considers the flow of money generated by the company, rather
than the profit. The interpretation is equivalent to the PER ratio.
Price-to-Cash Flow per Share Ratio = Market Price per Share
Cash Flow per Share
The main advantage of the P/CF ratio is that it eliminates the problems of accounting
conservatism by not taking into account the depreciation and provisions policy. It is
more applicable to a number of sectors where the weight of depreciation and
provisions is high while in others where they are not so capital-intensive, it will be less
important.
To sum up, it is a relationship between the price or quotation of the share and the funds
generated by the company and it must be considered that a lower ratio means cheaper
investment opportunities.
37
6. Dividend per Share (DPS)
According to Walsh (2003, pp.146), the total yields of a share consist of the dividend
received plus the increase in the share price over a given period of time. Although for
some investors, growth is the most important thing, many potential shareholders pay
close attention to dividends. These investors look at the absolute dividend per share
and a stable but growing payment history.
Dividend per Share = Total Dividends Paid
Common shares outstanding
In conclusion, if the investor tries to look for value, he will look for companies that
provide a high DPA, whereas if the investor's strategy is based on growth, he will look
for companies that offer a lower DPA.
7. The Dividend Yield
García and Martínez (2018 pp.180) state that "the dividend yield is the quotient
between the dividend per share distributed annually by the company and the price paid
per share.”
Dividend Yield = Dividend per Share
Market Price per Share
This ratio measures the yield obtained via dividend with respect to the current share
price of the analysed company, which allows the analyst to make comparisons on the
dividend distribution policy with respect to previous years or with respect to the
competition in a simple way considering the evolution of the share in the market.
Therefore, the higher the share price, the lower the ratio.
38
8. Pay-Out Ratio
According to Gitman and Joehnk (2005, pp.205), the Pay-Out Ratio indicates how
much of the company's profits is destined to pay its shareholders in the form of
dividends. If profits increase over time, so will dividends.
Pay-Out Ratio = Dividend per Share
Earnings per Share
A low pay-out indicates a high profit retention policy, which suggests that the company
is aiming for a high growth while a high pay-out shows that dividends are fairly safe,
that is, there is a strong dividend policy, which encourages an investment in the group,
allowing it to obtain financing more easily, which it can use for its investment projects,
amortize its debts, improve its capital structure…
Depending on whether the investment objective is value or growth, companies with a
high or a low pay-out will be sought, respectively.
9. Annual Sales per Share
This figure is the resulting quotient between the revenues generated by annual sales
and the number of shares outstanding.
Annual Sales per Share = Annual Sales
Common shares outstanding
A prolonged increase in this ratio, keeping the denominator fixed, indicates that the
company is increasing its market share, a crucial factor for growth.
39
10. Book Value per Share
According to Archel Domenech, et al. (2010, pp.477), the book value of the share, also
known as the book value, is obtained directly from the information contained in the
balance sheet, without further transformation. It is calculated by dividing the net asset
value of the company by the number of shares issued.
Book Value per Share = Total Equity
Common shares outstanding
Shares are presumably listed at a value greater than their book value. If not, it will
indicate that something is very wrong with the company's prospects and profitability.
11. Price-to-Book Ratio
García and Martínez (2018 pp.179) state that "the price-to-book ratio relates the share
price to the book value of the share, the book value of the share being equal to the sum
of share capital, reserves and profit for the year, discounting the dividends distributed.”
Price-to-Book Ratio = Market Price per Share
Book Value per Share
Reflects the proportion in which the share trades above its book value. The difference
between the market price and the book value reflects the present value of future profits.
If its value is greater than 1, it is said that the company ``creates value´´. If it is less it is
called ``destruction of value´´.
40
The book value is a static value, while the share price reflects the market's
expectations of the company's future. To the extent that as long as a company has a
business with high growth capacity, an imaginative and flexible management, a good
image of its products in the market, etc., the market will assign a high ratio to this
company.
According to Walsh (1994, pp.156), the ratio market price to book value provides the
definitive, and perhaps the most accurate, assessment of the company's overall market
status.
The ratio relates the company's market capitalisation to shareholders' equity. To put it
another way, it compares the current stock market value with the shareholders'
investment in the company.
Once the company's records have been reasonably appraised, the ratio can provide
valid information. A value less than one means that the shareholders' investment has
decreased in value; it has been wasted. On the other hand, when this value is well
above the unit, it means that the investment has multiplied. It is the investors'
perception of the company's performance in terms of profits, balance sheet soundness
and growth that determines where this ratio will be located.

41
BLOCK IV – ANALYSIS OF LOUIS VUITTON (LVMH)
Louis Vuitton has been selected to test the ratios described above. Louis Vuitton is a
French company dedicated to luxury leather goods and is currently listed on the
CAC40. The company has a worldwide recognition, an annual turnover of 37,600
million euros at the close of fiscal year 2016, and a current capitalization of 176,000
million euros.
In order to measure the effectiveness of the analysis, a scenario has been established
in which the results for the year 2016 have just been published and will be analysed
together with the results of the four previous years, in order to determine whether the
evolution of LVMH is sufficiently favourable for the purchase of shares at that time.
The results for 2017 and 2018 will also be analysed in order to observe the evolution of
Louis Vuitton, taking into account the figures from previous years.
On the one hand, the company will be valued from a financial point of view, taking into
consideration the ratios that are directly related to the financial statements. On the
other hand, an analysis will be made of the stock market ratios, in which the quoted
price of the company is considered, and, therefore, the market expectations.
Finally, after having described the situation of Louis Vuitton by these ratios, an
explanation will be given on the potential appreciated in the company and the
01/05/2019 quoted price will be compared with the date on which the purchase of
shares was proposed, that is, 31/01/2017, with the objective of observing the
profitability that would have been obtained, both via dividing and via price if the open
position had been maintained until now.

42
I. Analysis of Luis Vuitton’s Financial Statements
1. Short-term liquidity analysis
1.1. Analysis of Working Capital
Source: Own elaboration based on data from LVMH Annual Reports, 2018-2012.
1.1.1. Working Capital Ratio
Regarding the working capital, in 2016 this is equivalent to 6,585 million euros. Positive
values were observed during the five years analysed, as well as a substantial increase
over this period, increasing by 38.32%.
This factor implies that the company has no problems in satisfying its debts in the short
term, as well as the possibility of expanding or modifying its financial structure with
fewer difficulties.
1.1.2. Current Ratio
As regards to the liquidity ratio, since it is a positive working capital, this ratio is also
positive and, as stated above, it is considered optimal when it yields values between
1.5 and 2, since there are always risks of non-payment with regard to customers and
risks of losses due to bad investments in the short term, which can reduce liquidity.

43
In the case of LVMH, it is observed that over the period analysed, the average value is
close to 1.5, considering that a ratio equal to or greater than this value is always
sought, we can state that the company has sufficient liquidity to meet its closest
payment commitments considering the possible impairment of current assets.
1.1.3. Cash Ratio
On the other hand, regarding the cash flow ratio, this ratio has increased from 0.23 to
0.28% over the period from 2012 to 2016 (discounting 2014, which is influenced by the
sale of Hermès shares).
Therefore, after corroborating that cash and cash equivalents with respect to short-term
debts have increased, this fact can be interpreted as a factor improving the liquidity of
the group.
1.1.4. Acid Test
As far as the analysis of the acid test is concerned, it can be seen that the company
has a certain dependence on the goods it stores, since it would not be able to fully
satisfy its short-term debts without them, since in every financial year the ratio does not
exceed the unit, which is the optimum value.
However, there is a low growth in the ratio, which, although is not a great improvement,
indicates that during the period under analysis Louis Vuitton has not been increasing
the number of stocks with respect to its current liabilities, a fact that would negatively
affect liquidity since it would depend to a greater extent on the goods accumulated in
the warehouse, so that, although the risk of liquidity is not reduced, it is not increased
either.
44
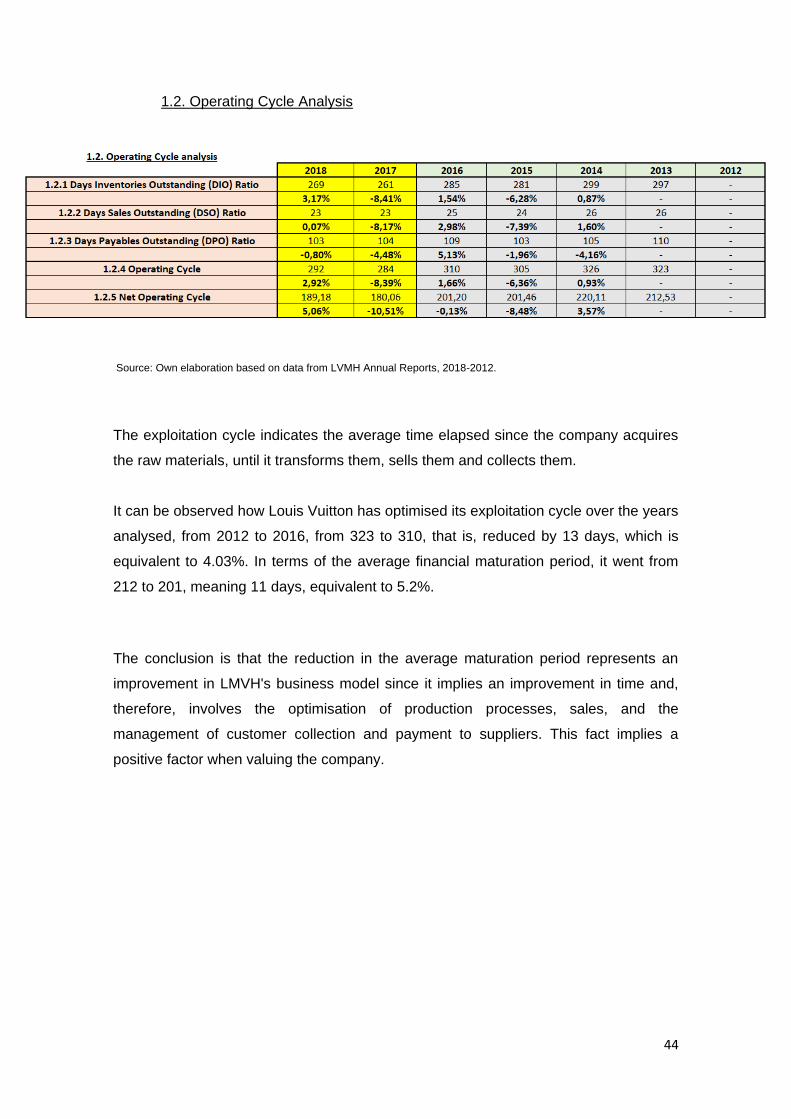
1.2. Operating Cycle Analysis
Source: Own elaboration based on data from LVMH Annual Reports, 2018-2012.
The exploitation cycle indicates the average time elapsed since the company acquires
the raw materials, until it transforms them, sells them and collects them.
It can be observed how Louis Vuitton has optimised its exploitation cycle over the years
analysed, from 2012 to 2016, from 323 to 310, that is, reduced by 13 days, which is
equivalent to 4.03%. In terms of the average financial maturation period, it went from
212 to 201, meaning 11 days, equivalent to 5.2%.
The conclusion is that the reduction in the average maturation period represents an
improvement in LMVH's business model since it implies an improvement in time and,
therefore, involves the optimisation of production processes, sales, and the
management of customer collection and payment to suppliers. This fact implies a
positive factor when valuing the company.
45
2. Analysis of long-term Capital Structure and Solvency
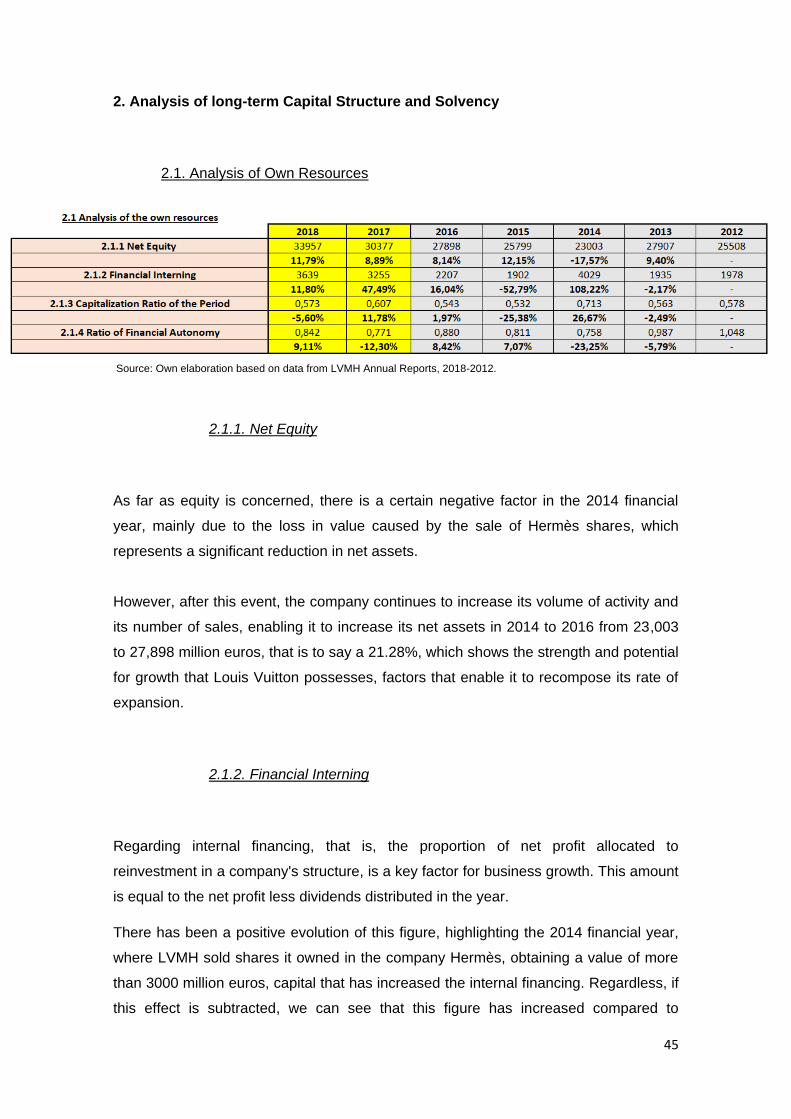
2.1. Analysis of Own Resources
Source: Own elaboration based on data from LVMH Annual Reports, 2018-2012.
2.1.1. Net Equity
As far as equity is concerned, there is a certain negative factor in the 2014 financial
year, mainly due to the loss in value caused by the sale of Hermès shares, which
represents a significant reduction in net assets.
However, after this event, the company continues to increase its volume of activity and
its number of sales, enabling it to increase its net assets in 2014 to 2016 from 23,003
to 27,898 million euros, that is to say a 21.28%, which shows the strength and potential
for growth that Louis Vuitton possesses, factors that enable it to recompose its rate of
expansion.
2.1.2. Financial Interning
Regarding internal financing, that is, the proportion of net profit allocated to
reinvestment in a company's structure, is a key factor for business growth. This amount
is equal to the net profit less dividends distributed in the year.
There has been a positive evolution of this figure, highlighting the 2014 financial year,
where LVMH sold shares it owned in the company Hermès, obtaining a value of more
than 3000 million euros, capital that has increased the internal financing. Regardless, if
this effect is subtracted, we can see that this figure has increased compared to
46
previous years, and that in 2016, with 2207 million euros, Louis Vuitton will have the
largest endowment for this type of reserve in its history.
Therefore, we agree in the positivity that this factor reflects for the potential growth of
the company.
2.1.3. Capitalization Ratio of the Period
The capitalization ratio for the period indicates the percentage of the profit that goes to
reinvestment in the group, so the closer it is to the unit, the greater the company's
expansion strategy.
LVMH shows an average ratio over the five years analysed of 55%, that is to say that
slightly more than half of the profits are reinvested. Although it does not increase
significantly, it does not diminish either, so we can deduce that the growth strategy
maintains a constant pace over time.
2.1.4. Ratio of Financial Autonomy
With regard to the ratio of financial autonomy, it indicates the relationship between the
company's equity and all of its liabilities. The higher this ratio, the lower the financial
risk of the company.
It is observed that in LVMH, from 2014 to 2016 there is an increasement of 16.1%, the
current value being 0.88, which means that, for every euro of debt, the company uses
88 cents of its own capital. Considering that a value greater than 0.7 of this ratio
reflects that the company has financial autonomy, it is observed that in the years
analyzed the company always maintains the ratio of financial autonomy above 0.7, so it
has never presented any problem of dependence on its creditors.
47
2.2. Debt Analysis
Source: Own elaboration based on data from LVMH Annual Reports, 2018-2012.
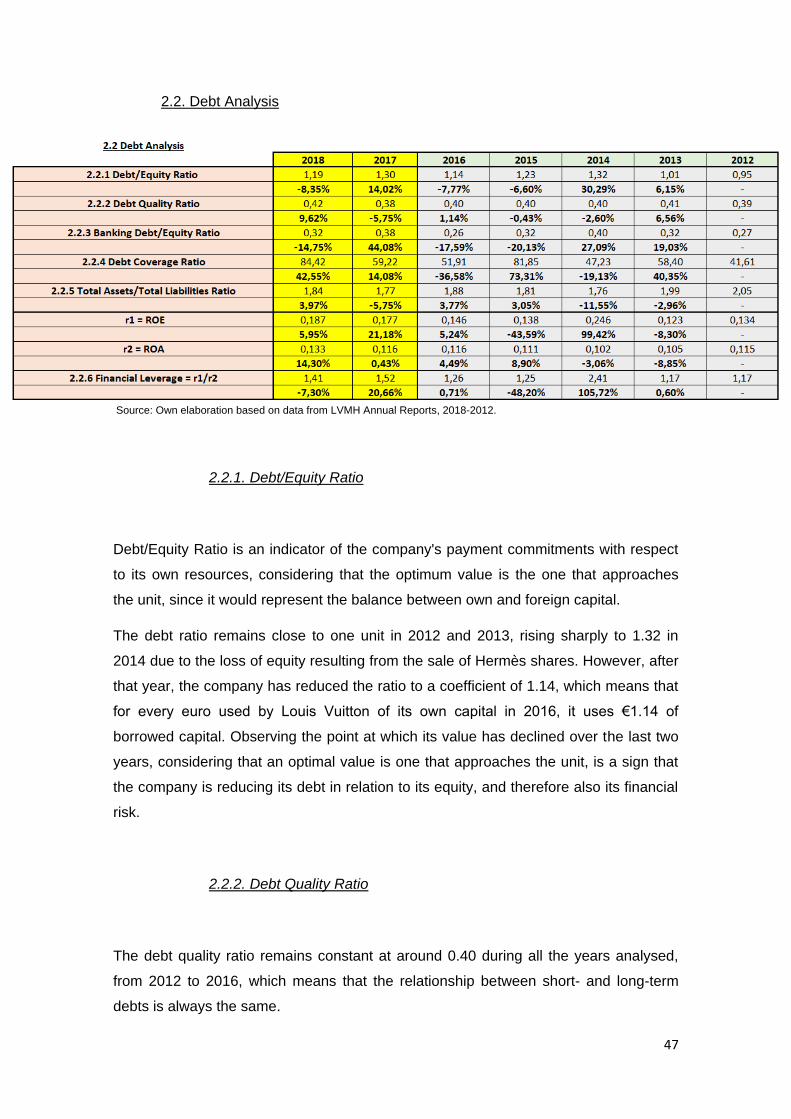
2.2.1. Debt/Equity Ratio
Debt/Equity Ratio is an indicator of the company's payment commitments with respect
to its own resources, considering that the optimum value is the one that approaches
the unit, since it would represent the balance between own and foreign capital.
The debt ratio remains close to one unit in 2012 and 2013, rising sharply to 1.32 in
2014 due to the loss of equity resulting from the sale of Hermès shares. However, after
that year, the company has reduced the ratio to a coefficient of 1.14, which means that
for every euro used by Louis Vuitton of its own capital in 2016, it uses €1.14 of
borrowed capital. Observing the point at which its value has declined over the last two
years, considering that an optimal value is one that approaches the unit, is a sign that
the company is reducing its debt in relation to its equity, and therefore also its financial
risk.
2.2.2. Debt Quality Ratio
The debt quality ratio remains constant at around 0.40 during all the years analysed,
from 2012 to 2016, which means that the relationship between short- and long-term
debts is always the same.
48
To summarize there are no destabilising elements in the structure of the debt, which is
a positive factor to consider, despite the fact that the value of the ratio is not reduced
over time.
2.2.3. Banking Debt/Equity Ratio
Bank debt is the debt with the highest charges and risks, therefore, a reduction in the
bank debt ratio is a fact that greatly reduces the risks of insolvency of the company.
Following the negative impact of Hermès shares in 2014 on the company's equity,
Louis Vuitton reduced its bank debt against equity by 20% and 17% respectively in
2015 and 2016, giving a current value of 0.26 compared to 0.40 in 2014. Consequently,
we can say that the company has significantly reduced its risk of insolvency.
2.2.4. Debt Coverage Ratio
The financial expense coverage ratio at 2016 year-end stands at 51.91, that is that with
the result before taxes and interest, financial expenses could be paid 52 times, which
means that the part of the financial expenses has hardly any impact on the profit
obtained each year.
This ratio remains around this value throughout the period analysed, so we can state
that financial expenses do not pose any threat to its results.
2.2.5. Total Assets/Total Liabilities Ratio
With respect to this ratio, whenever it exceeds the unit it indicates that the assets
exceed the value of the liabilities, but this does not indicate that the company has
sufficient solvency to face its future payments, since it is necessary to consider the
possible impairment of the assets, so one indicator that the company has a good
financial capacity is that this ratio is above 1.50.

49
In the case of Louis Vuitton, the figure for 2016 is 1.88, considering that in the last five
financial years its lowest value has been 2014 with 1.76, so we can say that LVMH
does not have serious insolvency risks.
2.2.6. Financial Leverage
Another key ratio when analysing the company's indebtedness is financial leverage
since it determines the profitability generated from the debts contracted.
In this case, Louis Vuitton's financial leverage is positive during the years under review,
with a figure in 2016 of 1.26, which means that borrowed funds increase the total return
by 26% compared to the return that would have been obtained by financing it with just
with own funds. Therefore, it is confirmed that the debt generated creates higher yields
than the ones that would be obtained without contracting them.
This ratio oscillates within a stable range, which ranges between 1.17 and 1.26, during
the years analysed, so it can be said that the company always creates value from the
debts generated.
3. Analysis of return on investment and asset utilization
Source: Own elaboration based on data from LVMH Annual Reports, 2018-2012.

50
3.1. Operating Cash Flow/Total Assets Ratio
This ratio measures the return on assets in relation to the cash flow generated by
operating activities, that is to say, the number of cash units received by LVMH for each
monetary unit of the group's total assets. Therefore, the higher the ratio, the more cash
generated and the higher the yield obtained.
From 2012 to 2016, the ratio has maintained a constant positive evolution year after
year, going from 0.083 to 0.104, which is equivalent to an increase of 25.30%, meaning
that. the group's assets generate 25% more cash than five years ago, which is a great
indicator of the increase in productivity.
3.2. Asset Turnover Ratio
The asset turnover ratio shows the ability of assets to generate sales, so a positive and
sustainable development of this indicator is a key factor in verifying that the company is
in a growth phase.
Louis Vuitton in 2016 obtained a ratio of 0.63, and since 2013, it has maintained a
constant annual growth, increasing in these four years by 21.15%, which means that
the assets of the group are profitable, in terms of sales made, 21.15% more than four
years ago.
3.3. Operating Profit Margin Ratio
This ratio establishes the relationship, in percentage terms, between operating profit
and total revenues. Therefore, the constant increase of this figure is an indication that
the productivity is increasing.
From 2012 onwards, Louis Vuitton's ratio has been declining until 2014, from 0.205 to
0.177. However, from 2015 onwards, this trend is reversed, increasing from 2014 to
2016, from 0.177 to 0.184, that is, a 10.40%. This confirms that the company is
improving its margin.

51
3.4. Return on Assets (ROA)
The net return on assets (ROA) or economic return indicates the operating efficiency of
a company, as it measures the relationship between the operating margin (discounting
interest and rates) and total assets. This is also calculated by multiplying the asset
turnover by the operating margin ratio.
By breaking down the ROA into the two key figures described above an interpretation
can be made. In the years under review, the asset turnover ratio gradually improved,
while the operating margin declined in the first two years and increased in the last two.
Consequently, it is observed that ROA also decreases in the first two years from
11.52% to 10.18%, then grows to 11.58% in 2016, increasing by 13.75% in the last two
years, which is a positive factor in terms of the use of assets that the company follows
to generate profitability.
3.5. Return on Equity (ROE)
The net return on equity (ROE), or financial return, is the return directly perceived by
the shareholders.
In the case of Louis Vuitton, discounting the effect of Hermès in 2014, from 2013
onwards, the ROE follows a positive annual evolution, increasing in four years by
18.40%, obtaining in 2016 the highest financial profitability to date, with a value of
14.57%, which continues to increase in future years.
Therefore, it can be said that there is a positive and constant evolution of the return on
equity, a decisive factor in determining the growth of the company and the
maximization of wealth for its owners.
52
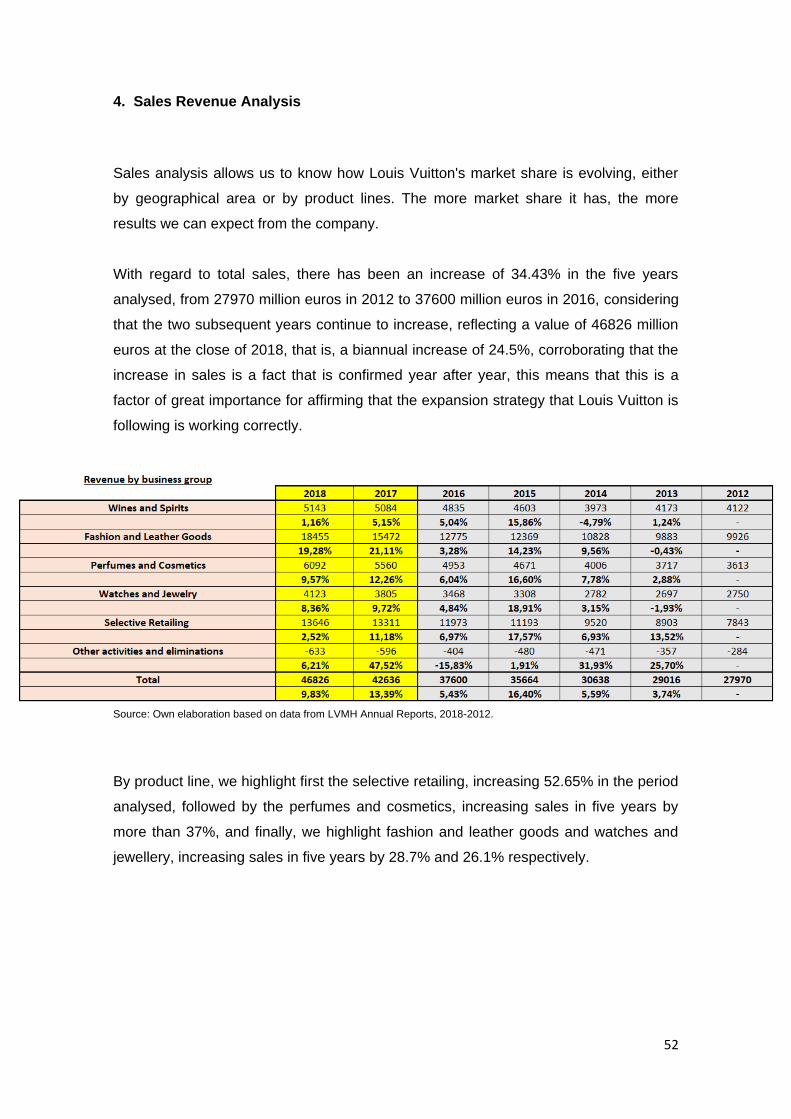
4. Sales Revenue Analysis
Sales analysis allows us to know how Louis Vuitton's market share is evolving, either
by geographical area or by product lines. The more market share it has, the more
results we can expect from the company.
With regard to total sales, there has been an increase of 34.43% in the five years
analysed, from 27970 million euros in 2012 to 37600 million euros in 2016, considering
that the two subsequent years continue to increase, reflecting a value of 46826 million
euros at the close of 2018, that is, a biannual increase of 24.5%, corroborating that the
increase in sales is a fact that is confirmed year after year, this means that this is a
factor of great importance for affirming that the expansion strategy that Louis Vuitton is
following is working correctly.
Source: Own elaboration based on data from LVMH Annual Reports, 2018-2012.
By product line, we highlight first the selective retailing, increasing 52.65% in the period
analysed, followed by the perfumes and cosmetics, increasing sales in five years by
more than 37%, and finally, we highlight fashion and leather goods and watches and
jewellery, increasing sales in five years by 28.7% and 26.1% respectively.

53
Source: Own elaboration based on data from LVMH Annual Reports, 2018-2012.
By geographical area, we would highlight mainly the United States, where sales
increased by 57.8% from 2012 to 2016, from 6,433 to 10,152 million euros. A
considerable growth can also be seen in Europe (excluding France) of 27.35% and in
Asia (excluding Japan) of almost 25%. It should be noted that in other smaller markets,
located around the world, sales have also risen sharply, from 2,797 million euros to
4,512 million euros, equivalent to an increase of 61.31%.
Source: Own elaboration based on data from LVMH Annual Reports, 2018-2012.
4.1. Sales Growth Ratio
This ratio is obtained by dividing the year's sales by those of the previous year.
Therefore, if a value greater than one is obtained, this indicates that there has been an
increase in sales with respect to the previous year.

54
During all Louis Vuitton years this ratio exceeds the unit, so it is indicating that it always
increases its sales over the previous year, which is a very positive factor when
assessing the performance of the company.
4.2. Operating Cash Flow/Sales Ratio
This ratio is the resulting ratio of the Cash Flow generated by operating activities
between annual sales, so it measures how much of Louis Vuitton's sales are converted
into cash.
In addition, this ratio remains constant from 2012 to 2016, around 0.16. Therefore, for
every euro generated from sales, the company receives 0.16 cents in cash. Although
the ratio does not increase significantly over time, it does not decrease either, so it is
not a factor that negatively affects the company's operating activity, as the capacity to
generate cash through sales remains constant.
4.3. Operating Ratio
This ratio measures the relationship between the sales generated in the year and all
the operating costs attributable to those sales, that is to say, the proportion of each
euro generated by sales that is absorbed via operating costs.
In the case of LVMH, from 2012 to 2016 this ratio remains constant, with an average
over these five years of 0.80, meaning that for every euro generated by the group, 80
cents are absorbed by operating costs. A progressive reduction of this ratio value
would be a great indicator that the company is applying a correct cost reduction policy,
however, as it does not increase, it does not represent a negative factor for the
company.

55
4.4. Earnings before interest, taxes, depreciation and amortization (EBITDA)
EBITDA (earnings before interest, taxes, depreciation and amortization), commonly
known as gross operating profit calculated before deductibility of financial expenses, is
an approximate indicator of a company's ability to generate profits based solely on its
productive activity.
In the case of Louis Vuitton, there has been a positive and constant evolution of
EBITDA during all the years, discounting the effect of the sale of Hermès shares in
2014, from 2012 to 2016 has increased by 27%, giving a current value of 8475 million
euros, so we can say that the company is obtaining higher returns based directly on its
activity of exploitation, the sale of luxury fashion items.
5. Observations on the analysis of Louis Vuitton’s Financial Statements
In terms of liquidity, solvency and the use of assets and the return generated, the
company has performed magnificently over the last five financial years. In fact, if we
look at the results for the 2017 and 2018 financial years, we can see how both income
and net income continue to grow.
Therefore, with regard to the possible purchase of shares of the company at the
beginning of 2017, the analysis carried out on the financial statements considers Louis
Vuitton as a company with great potential for growth both in its structure and business
model, as well as in its quoted price on the financial market.

56
II. Analysis of Louis Vuitton’s Market Value Ratios
The study of stock market ratios allows the analyst to obtain a series of asset valuation
criteria considering the volatility of the asset in the financial market, which will be
determined by the future expectations reflected by the company. Therefore, its use is
vital for a complete analysis of the financial asset in question.
For the calculation of stock market ratios, the quoted price was taken into account for
the day on which the results for the last financial year were published. In this case, this
means the last day of January.
Market Price of LVMH at the close of the day on which the annual results are published:
Source: Own elaboration based on historic data market of LVMH.
Source: Own elaboration based on historic data market of LVMH and data from LVMH Annual Reports, 2018-2012.

57
1. Earnings per Share (EPS)
Earnings per share is the coefficient resulting from dividing net profit by the number of
shares outstanding.
The profit per share for Louis Vuitton in 2016 is €8.06. If we discount the 2014 financial
year, we can observe how the EPS grows throughout all the years analysed. In 2012,
earnings per share were €6.82, meaning that they have increased by 18% over the last
five years, so the company maintains a stable rate of growth in earnings per share,
which is a key element when it comes to investing in a company.
2. Earnings Yield
Earnings Yield ratio measures the relationship between the EPS and the current listed
price.
In this case, the ratio gradually decreased between 2013 and 2016, from 5.73% to
4.32%, meaning a reduction of 32.64%, while EPS has increased. This means that the
quotation price is increasing, mainly due to the strong growth expectations that the
market has.
3. Price/Earnings Ratio (PER)
Discounting the effect of the sale of Hermès shares in 2014, the PER has increased
year after year during the period from 2013 to 2016, going from a value of 17.44 to one
of 23.16, that is, an increase equivalent to 32.8%, mainly due to the strong increase in
sales and the great expectations of expansion of the business model.
Therefore, the increase in the PER is a confirmation of the strong growth expectations
that have been detected by the market.

58
4. Cash Flow per Share (CFS)
For this case, in the numerator we have chosen the Cash Flow of the exploitation
activities, in order to detect which is the direct amount that the company receives in
cash from its main activity for each share that is in circulation.
Louis Vuitton has increased its sales during all the years analysed while it has not
issued any more shares. As a result, Cash Flow per share has also increased at a very
similar rate. In 2012 the Cash Flow per share was €8.19 and in 2016 €11.24, which
means that in the last five years it has increased by 37.24%, a really positive factor
from the point of view of the investor, who observes that year after year their shares
have a greater capacity to generate cash.
5. Price/Cash Flow Ratio
The Price/Cash Flow ratio comes from the division of the quoted price between the
Cash Flow per share. It is a ratio similar to the PER, however, it considers the cash
generated, not the net yield, which can be more easily manipulated.
In this case, LVMH has a ratio between 12.71€/share and 15.27€/share. By 2016 the
value is 15.25€/share, bordering on the historical maximum of the company given in
2014 to 15.69€/share. This ratio detects the strong growth expectations that the market
has on the group, which are present within the five years.
6. Dividend per Share (DPS)
Over the five years under analysis, the dividend distributed per share increases, due to
the constant increase in profits, the DPS goes from €2.88 in 2012, to €3.68 in 2016, an
increase of 27.78%, creating a greater value for shareholders, which is a great
incentive to invest in the company.
59
7. Dividend Yield
With respect to the profitability of dividends, when considering the quoted price, despite
the increase in the DPS, the ratio decreases, mainly due to the fact that the strong
growth expectations that move the quoted price upwards cause the profitability of
dividends with respect to that price to be reduced.
The ratio remained stable at around 2.30%, but in 2016 the share price rose more
markedly, bringing the ratio to 1.98%, meaning bringing it down more than 10% than
the previous year's figure.
To sum up, the expansion of Louis Vuitton's business model has led to an upward
revaluation of the company, reducing the Dividend Yield in the last fiscal year, a clear
sign that the interest in the share is bigger.
8. Pay-Out Ratio
Pay-Out ratio is the percentage of net profits allocated to the distribution of dividends.
Louis Vuitton maintains a fairly conservative dividend distribution policy with respect to
previous years, maintaining a constant value of 45% for all the years under review
(2012-2016). Maintaining a high Pay-Out serves to encourage shareholders and
potential shareholders, which allows the company to generate a certain attraction in the
financial markets, and thus obtain the possibility of attracting more financing to carry
out their investment projects and / or amortize their debt.
9. Annual Sales per Share
This ratio shares great similarities with the Cash Flow per Share, but in this case the
relationship between annual sales and outstanding shares is established.
In the case of Louis Vuitton, it can be seen that in all the years analysed the ratio has
increased. This is due to the fact that the company is increasing its market share year
after year, going from annual sales per share in 2012 of 55.69€ to 74.51€ in 2016,
60
which is equivalent to an increase of 33.8%, a key factor in determining the company's
potential performance.
10. Book Value per Share
The book value per share results from dividing the net worth by the number of shares
outstanding, and shows, in terms of the company's equity, the value of each share.
LVMH suffers a large loss of equity with the sale of Hermès shares in 2014, yielding a
book value per share of 45.65€. However, in the following two years, net equity
increased to such an extent that the book value per share in 2016 was €55.28, the
equivalent to a biannual increase of 21.1%, showing great potential for recovery and
value creation.
11. Price-Book Ratio
This ratio reflects the proportion in which the share is quoted above its book value.
By 2016, the company has the highest Price-Book ratio in history, at 3.38, which
means that the company is listed at a price more than three times higher than its book
value, which confirms Louis Vuitton's potential performance, as shareholders expect
profits to continue to grow solidly.
12. Observations on the analysis of Louis Vuitton's market value ratios
Therefore, after analysing the stock market ratios, we can state that there is great
potential for growth due to the constant annual increase in sales, which is present
throughout all the years and has created great expectations of growth that have had a
full impact on the share price, and which are conducive to an expansionist phase of its
business model on a large scale.
Also noteworthy is the high dividend provided by LVMH, which provides a substantial
return that reduces investment risk.
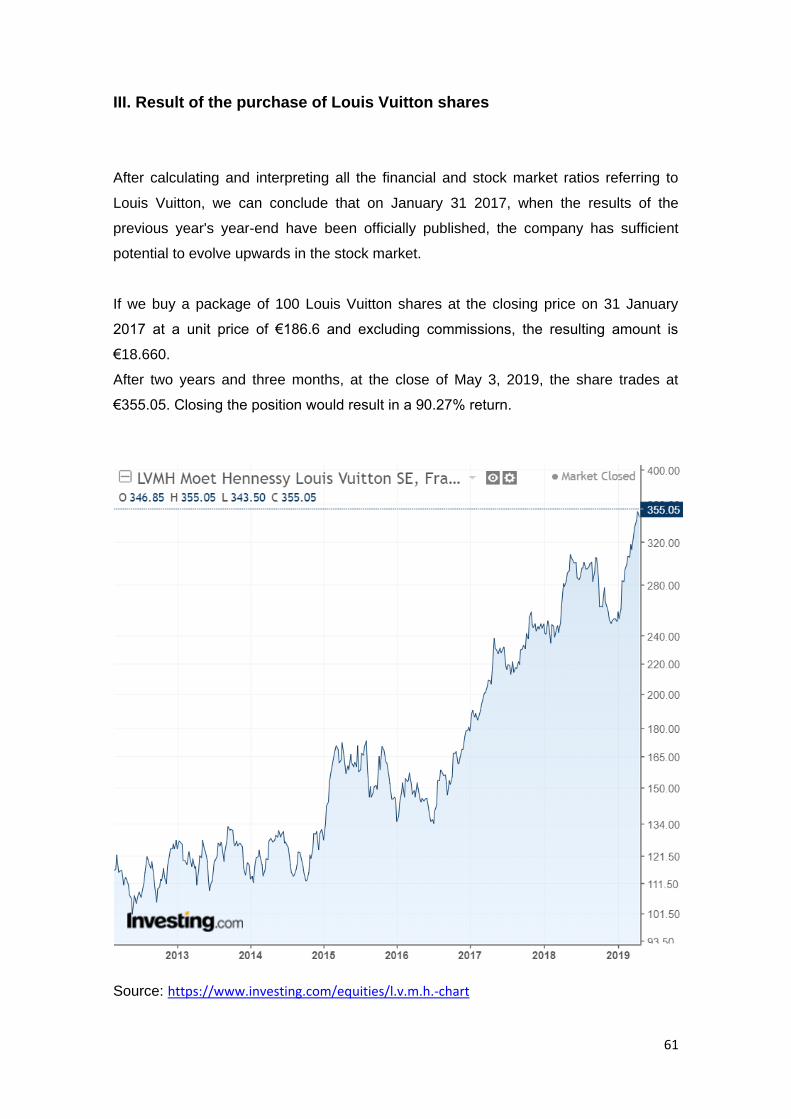
61
III. Result of the purchase of Louis Vuitton shares
After calculating and interpreting all the financial and stock market ratios referring to
Louis Vuitton, we can conclude that on January 31 2017, when the results of the
previous year's year-end have been officially published, the company has sufficient
potential to evolve upwards in the stock market.
If we buy a package of 100 Louis Vuitton shares at the closing price on 31 January
2017 at a unit price of €186.6 and excluding commissions, the resulting amount is
€18.660.
After two years and three months, at the close of May 3, 2019, the share trades at
€355.05. Closing the position would result in a 90.27% return.
Source: https://www.investing.com/equities/l.v.m.h.-chart

62
The return obtained via dividend must be added to this return obtained through the
market because since the purchase of the shares the company has distributed profits
on several occasions, as detailed in the following table:
Source: Own elaboration based on data from LVMH Annual Reports, 2018-2017.
Therefore, the total gross return obtained if the position closes on 3 May 2019 is
101.28%, with an annualised return of 44%, which is a great investment success.
Dividend Yield = 100 shares x (4€+4.2€+5€+5.4€+6€) = 2,460€ = 13.18% of initial investment
Profitability via price = 100 shares x (355.05-186.6) = 16,845€ = 90.27% of initial investment
TOTAL RETURN = 16,845€ + 2,460€ = 19,305€ = 103.45% of initial investment
INITIAL INVESTMENT 31/01/17 = 100 shares x 186.6€ = 18,660€
FINAL VALUE OF INVESTMENT 03/05/19 = (100 shares x 355.05€) + 2,460€ = 37,965 €
63
CONCLUSION
In this dissertation, a system of analysis for listed companies has been composed to
determine whether they are eligible for investment or not, based on the information
provided through the financial statements and a series of stock market ratios for the
last five years. In order to verify the validity of the model, the five years from 2012 to
2016 have been chosen to compare the evolution of the quoted price in the two
subsequent years.
Firstly, a large number of financial ratios have been described that allow an exhaustive
analysis of the financial statements of any company, which have been grouped by
different sets of ratios, allowing different approaches to the analysis of the company's
accounting. These approaches are liquidity, capital structure and solvency, return on
investment and asset utilisation, and analysis of revenue generated by sales. It is worth
analysing the financial statements from different perspectives due to the different
nature of the accounting items that compose each of them.
After the analysis of the financial statements through the different sets of ratios, the
most currently used stock market ratios have been described and analysed.
Emphasizing that stock market ratios are those in which the share price is involved,
they allow the analysis of listed companies considering the expectations that the
market has of them and the volatility of the assets.
Having described all the different ratios, both financial and stock market that allow a
complete analysis of any company listed on the stock market, all of these have been
put into practice through the analysis of Louis Vuitton, a French company listed on the
CAC40 with a current capitalisation in excess of 170,000 million euros.
After calculating all the ratios mentioned above and describing their interpretation, with
reference to the financial years 2012 to 2016, it can be said that the company has a
great potential return due to the constant increase in sales and excellent management
of the capital structure and production processes.

64
Therefore, after observing that LVMH is a wise option, based on the previously
conducted studies, the purchase of shares is simulated on January 31, 2017, the day
on which the annual report for the previous year is published. At present, as of 2 May
2019, a total return of 101.28% has been obtained, so the analysis has been effective.
To conclude, it should be pointed out that it has been possible to develop, through
Excel, a stock valuation system that acts in an automated way by entering the figures
of the financial statements of any company in the corresponding boxes it automatically
calculates all the ratios that we use to analyse the company in question. Therefore,
independently of the analysis carried out, a powerful and complete tool for the analysis
of listed companies has been created.

65
Bibliography
- Bernstein, L. A., 1993. Financial Statement Analysis: Theory, Application and
Interpretation, 5th ed. New York: Richard D. Irwin, Inc.
- Graham, B., 1949. The Intelligent Investor, 16th ed. Translated from Spanish by
I. Bengoechea. New York: Harper & Row, Publisher, Inc.
- Graham, B. and Dodd, D. L., 1934. Security Analysis, 6th ed. New York: The
McGraw-Hill Companies, Inc.
- Palepu, K., Healy, P. and Bernard, V., 2000. Analysis & Valuation Using
Financial Statements, 2nd ed. Translated from Spanish by A. Deras. Nashville:
Western College Publishing.
- Martínez García, F. J. and Somohano Rodríguez, F.M., 2002. Análisis de
estados contables. Madrid: Ediciones Pirámide.
- Urías Valiente, J., 1995. Análisis de estados financieros. 2nd ed. Madrid:
McGraw-Hill/Interamericana de España, S.A.
- García Olalla, M. and Martínez García, F. J, 2018. Manual del asesor
financiero. 2nd ed. Madrid: Ediciones Paraninfo, S.A.
- Garrido Miralles, P. and Íñiguez Sánchez, R., 2010. Análisis de estados
contables: Elaboración e interpretación de la información financiera. Madrid:
Ediciones Pirámide.
- Somoza López, A., 2018. Análisis de estados financieros consolidados. Madrid:
Ediciones Pirámide.
66
- Walsh, C., 1994. Key Management Ratios. Translated from Spanish by J. Mir.
London: Pitman Publishing.
- Amat, O., 2008. Análisis de los Estados Financieros: Fundamentos y
aplicaciones. 8th ed. Barcelona: Ediciones Gestión 2000.
- Rojo Ramírez, A., 2011. Análisis Económico-Financiero de la empresa. Madrid:
Ibergarceta Publicaciones, S.L.
- Wild, J. J., Subramanyam, K. R. and Halsey, R. F., 2007. Financial Statement
Analysis. 9th ed. New York: The McGraw-Hill Companies, Inc.
- Archel Domenech, P., Lizarraga Dallo F., Sánchez Alegría S. and Cano
Rodríguez M., 2010. Estados contables: Elaboración, Análisis e interpretación.
Madrid: Ediciones Pirámide.
- Gitman, L. J., Joehnk, M. D., 2004. Fundamentos de Inversión. Madrid:
Pearson Educación, S.A.
- Corporate Finance Institute, n.d. Cash Ratio. Corporate Finance Institute,
[online] Available at:
<https://corporatefinanceinstitute.com/resources/knowledge/finance/cash-ratio-
formula/>
- The Journal of Finance Vol. 25, No. 2, Papers and Proceedings of the Twenty-
Eighth Annual Meeting of the American Finance Association New York, Efficient
Capital Markets: Review of Theory and Empirical Work. (E. Fama) , N.Y.
December, 28-30, 1969 (May, 1970), pp. 383-417 (35 pages), [online] Available
at: <https://www.jstor.org/stable/2325486?seq=1#metadata_info_tab_contents>
67
Websites consulted
- Avon Products. Annual Report: 2018.
http://investor.avonworldwide.com/2018OnlineReport (Accessed 27th February
2019)
- Louis Vuitton Moët Hennessy. Annual Report: 2012-2018.
https://www.lvmh.com/investors/publications/?publications=29 (Accessed 1st
March 2019)
- Investing. https://www.investing.com/equities/l.v.m.h.-chart (Accessed 3rd May
2019)

68
Annexes
Consolidated statement of financial position of LVMH (2012-2018) in millions €:

69
Consolidated income statement of LVMH (2012-2018) in millions €:
Consolidated cash flow statement of LVMH (2012-2018) in millions €:

70
Battery of used financial ratios:
1. Short-term liquidity analysis
1.1. Analysis of Working Capital
1.1.1. Working Capital Ratio
1.1.2. Current Ratio
1.1.3. Cash Ratio
1.1.4. Acid Test
1.2. Operating Cycle Analysis
1.2.1. Days Inventories Outstanding (DIO) Ratio
1.2.2. Days Sales Outstanding (DSO) Ratio
1.2.3. Days Payables Outstanding (DPO) Ratio
1.2.4. Operating Cycle
1.2.5. Net Operating Cycle
2. Analysis of capital structure and long-term solvency
2.1. Equity Analysis
2.1.1. Net Equity
2.1.2. Financial Interning
2.1.3. Capitalization Ratio of the Period
2.1.4. Ratio of Financial Autonomy
2.2. Debt Analysis
2.2.1. Debt/Equity Ratio
2.2.2. Debt Quality Ratio
2.2.3. Banking Debt/Equity Ratio
2.2.4. Debt Coverage Ratio
2.2.5. Total Assets/Total Liabilties Ratio
2.2.6. Financial Leverage

71
3. Analysis of return on investment and asset utilization
3.1. Operating Cash Flow/Total Assets Ratio
3.2. Asset Turnover Ratio
3.3. Operating Profit Margin Ratio
3.4. Return on Assets (ROA)
3.5. Return on Equity (ROE)
4. Sales Revenue Analysis
4.1. Sales Growth Ratio
4.2. Operating Cash Flow/Sales Ratio
4.3. Operating Ratio
4.4. EBITDA
Battery of used market ratios:
1. Earnings per Share (EPS)
2. Earnings Yield
3. Price/Earnings Ratio (PER)
4. Cash Flow per Share (CFS)
5. Price/Cash Flow Ratio
6. Dividend per Share (DPS)
7. Dividend Yield
8. Pay-Out Ratio
9. Annual Sales per Share
10. Book Value per Share
11. Price-Book Ratio

72