end of silent elections
DESCRIPTION
This article explores empirically the competitive strategies of politicalparties aimed at maximizing electoral support in the early years ofdemocratic elections. By spreading through geographical space in searchof votes, candidates and parties challenged adversaries in their strongholds– a process that led to a reduction in the number of safe seats anduncontested constituencies. Evidence covers eight European countriesfrom the early nineteenth century until World War I and is based onconstituency-level data. The increasing competition among parties isdescribed, and the impact of the ‘massification of politics’ evaluated: (1)the extension of voting rights; (2) the challenge to conservatives andliberals by mass parties (mainly social democrats after the IndustrialRevolution) and the supremacy of the left–right cleavage over culturalresistances; and (3) the change from a majoritarian to PR formula as anincentive for parties to spread across constituencies. The analogy betweencompetition in the geographical and ideological space is illustrated.TRANSCRIPT

http://ppq.sagepub.com/Party Politics
http://ppq.sagepub.com/content/9/4/411The online version of this article can be found at:
DOI: 10.1177/135406880394001
2003 9: 411Party PoliticsDaniele Caramani
The End of Silent Elections : The Birth of Electoral Competition, 1832-1915
Published by:
http://www.sagepublications.com
On behalf of:
Political Organizations and Parties Section of the American Political Science Association
can be found at:Party PoliticsAdditional services and information for
http://ppq.sagepub.com/cgi/alertsEmail Alerts:
http://ppq.sagepub.com/subscriptionsSubscriptions:
http://www.sagepub.com/journalsReprints.navReprints:
http://www.sagepub.com/journalsPermissions.navPermissions:
http://ppq.sagepub.com/content/9/4/411.refs.htmlCitations:
at Humboldt -University zu Berlin on August 18, 2011ppq.sagepub.comDownloaded from
THE END OF SILENT ELECTIONS
The Birth of Electoral Competition, 1832–1915
Daniele Caramani
A B S T R A C T
This article explores empirically the competitive strategies of politicalparties aimed at maximizing electoral support in the early years ofdemocratic elections. By spreading through geographical space in searchof votes, candidates and parties challenged adversaries in their strong-holds – a process that led to a reduction in the number of safe seats anduncontested constituencies. Evidence covers eight European countriesfrom the early nineteenth century until World War I and is based onconstituency-level data. The increasing competition among parties isdescribed, and the impact of the ‘massification of politics’ evaluated: (1)the extension of voting rights; (2) the challenge to conservatives andliberals by mass parties (mainly social democrats after the IndustrialRevolution) and the supremacy of the left–right cleavage over culturalresistances; and (3) the change from a majoritarian to PR formula as anincentive for parties to spread across constituencies. The analogy betweencompetition in the geographical and ideological space is illustrated.
KEY WORDS � silent elections � electoral competition � suffrage � PR
Introduction
In the first Danish election to the Folketing in 1849 (the lower house of theRigsdag, introduced after the February Revolution of 1848), the seatreturned by the constituency of Odder (Århus) was won by G. Winter ofVenstre, of the Liberal Party. Almost 30 years later, in 1876, the same candi-date won the same seat again. In the interim, 13 elections took place andG. Winter was never opposed by any other candidate (except in 1852, andthen later in 1879). Elections therefore never really took place in Odder forthree decades. Winter had always been ‘elected by acclamation’ (valgt vedkåring), a procedure adopted in the case of unopposed candidates. He waseventually defeated in 1884.
PA R T Y P O L I T I C S V O L 9 . N o . 4 pp. 411–443
Copyright © 2003 SAGE Publications London Thousand Oaks New Delhiwww.sagepublications.com
1354-0688(200307)9:4;411–443;033573
at Humboldt -University zu Berlin on August 18, 2011ppq.sagepub.comDownloaded from

Such cases were not limited to single-member constituencies. In 1832,1
the county constituency of Lancashire-Northern returned two seats to West-minster, and both remained uncontested until 1865. Actual voting thereforenever took place until 1868 (the first election after the Second Reform Billof 1866). In seven out of nine general elections, the two seats were splitbetween one conservative and one liberal candidate. In two elections – 1837and 1841 – the seats were won by two conservatives. The winners, however,were always the same people, changing from liberal to conservative.
Similar situations occurred under different electoral formulas. Thearrondissement of Sint-Niklaas (Flanders) returned three seats between1847 and 1892 with a two-ballot formula and multiple vote. In 13 electionsout of 16 of this period,2 the Parti catholique won all seats with 100 percentof the vote at the first ballot. Only in 1848 did the Parti libéral win a seat(18.57 percent at the first ballot), and until 1894 no other candidatecontested that constituency and a second ballot was never needed.
These three stories reflect how electoral competition between candidatesand parties emerged laboriously. The nineteenth century witnessed the moststriking changes in political life with the transition from absolutist to parlia-mentary regimes, and with the progressive entry of the masses on thepolitical stage. Parliaments that in many cases had not been convened sincethe end of the Middle Ages were reintroduced. Even though in some casesthey were still based on estate representation, in all countries these bodieswere soon transformed into modern parliaments based on territorialrepresentation. Yet – as contemporary observers such as Tocqueville andLampedusa noted – democratic revolutions did not lead to immediatechange. The systems that developed in the nineteenth century remained non-competitive, and prolonged the control of the elites of the past on localpolitical life. Since competition did not suddenly appear in the aftermath ofdemocratic reforms, powerful local notables remained long unopposed. Theearly history of elections is full of examples such as those above, with seatssolidly in the hands of the same person and – later, with the developmentof party structures – with opposition parties long not daring to venture intounfriendly territory.
The rules of the game themselves were not favourable to competition.The franchise remained restricted through census and capacity require-ments, the abolition of which has been continuous but hard-fought. In somecases, elections remained indirect or otherwise unequal with few votershaving the right to cast more votes than most others on the basis of taxation,property, literacy, and so on.3 The possibilities of challenging establishedelites were therefore limited and, under such voting conditions, oppositionto notables could hardly be expressed through the electoral channel. Inseveral countries, the control over areas by given political groups wasfurther reinforced by cultural elements, such as linguistic or religiousaffiliations or political subcultures. Before industrialization, urbanizationand the development of communication had increased geographical mobility,
PA RT Y P O L I T I C S 9 ( 4 )
412
at Humboldt -University zu Berlin on August 18, 2011ppq.sagepub.comDownloaded from

ethno-linguistic and religious strongholds could not readily be eroded.Majoritarian formulas, which in their many variations were employed in allcountries in the nineteenth century, constituted a powerful hindrance tocompetition. The high thresholds for representation that these formulas set– especially when combined with single-member constituencies – discouragedcandidates from contesting constituencies controlled by antagonists.
In this article, I explore empirically and comparatively the birth andhistorical growth of electoral competition in eight European countries fromthe nineteenth century until World War I. Using constituency-level electoraldata, I describe party strategy aimed at maximizing electoral support byexpanding through geographical space, and test hypotheses about theimpact of the ‘massification of politics’ on the development of partycompetition. First, I consider the impact of the extension of voting rights tolarger sectors of the society. Second, I evaluate the weight of the entry ofnew mass parties (mainly social democrats through enfranchisement and theIndustrial Revolution) producing the supremacy of the left–right cleavageover cultural resistances. Third, I investigate whether the change of electoralformula from majoritarian to PR did introduce incentives high enough tobreak down the monopoly of representation of given political groups ingiven areas.
Framework for Analysis
Electoral Competition
From a historical perspective, a definition of electoral competition shouldstart from its basic aspect. Competition is first a matter of contestedness:there is competition when there are at least two candidates for one seat.4
On the contrary, there is no competition in constituencies in which thenumber of candidates equals the number of seats to be returned (forexample, one candidate for one seat). The majoritarian electoral formulasin force during the nineteenth and early twentieth century in all Europeancountries were mostly based on single-member constituencies. A con-stituency is therefore competitive insofar as the single seat is contested byat least two candidates. It follows that the greater the number of contestedconstituencies, the greater the degree of competition.
A definition based on the number of contested constituencies implies aclose relationship with the territorial spread of parties across constituencies.For a high number of contested constituencies to arise, parties must diffusethrough territory to challenge constituencies dominated by other parties. Aregionalized party system would on the contrary indicate the existence ofnon-competitive areas, with the domination of one party. The competitionin a political system therefore increases with the transformation of terri-torial or sectional cleavages into functional or ideological cleavages.
C A R A M A N I : T H E E N D O F S I L E N T E L E C T I O N S
413
at Humboldt -University zu Berlin on August 18, 2011ppq.sagepub.comDownloaded from

However, even in the case of a contested constituency, the level ofcompetition is low if there is a party or a candidate dominating all others.Besides contestedness, therefore, a competitive situation arises with partiesreceiving evenly matched support and with an equal chance of winning theseat. By contrast, the greater the distance between the elected and non-elected candidate(s), the lower the competition in a constituency in termsof marginality, that is, when the shift from one party or candidate to theother of a reduced number of votes is sufficient to modify the outcome.5
The degree of competition in a system is therefore also closely related to thedegree of homogeneity across territory of party strength.6 This article islimited to the analysis of electoral competition in terms of contestedness ofconstituencies and seats as engendered by the spread of candidates andparties across territory. It will be the task of further investigation to analyseempirically the growth of competition in terms of marginality among candi-dates and of homogeneity of support across regions.
Countries and Time Period
Up until World War I, starting with the first elections available accordingto countries, electoral systems varied a great deal among countries, mixingfeatures of repeated-ballot systems with direct/indirect vote, in some casesopen voting, and estate representation. Furthermore, a large amount ofinformation is missing, especially concerning the party affiliation of candi-dates. It is therefore impossible to carry out a thorough exploration. This‘pilot’ analysis considers instead eight European countries with mostlydirect majoritarian electoral systems:
• Britain (1832–1935): plurality formula in single- and multi-memberconstituencies; Ireland (1832–1910), which is considered as a separatecase; Denmark (1849–1913): plurality formula in single-memberconstituencies.
• Belgium (1847–98), Germany (1871–1912), The Netherlands(1888–1913) and Norway (1906–18): two-ballot formulas in mostlysingle-member constituencies. In Switzerland (1848–1917) a three-ballot,then two-ballot system (since 1900) was used.7
The starting point of the period of time varies for each country accordingto (1) patterns of state formation (2) the development of free elections, and(3) the availability of data sources.8 For all countries the analysis ends withthe last election before the introduction of PR – except for the UnitedKingdom, where PR was never introduced and for which data is presentedup until 1935.
In several countries, democratic institutions developed under foreigndomination before independence. This is the case in Norway, which wasunder Swedish rule from 1815 until 1905. Norwegian elections, however,are considered since 1906, the first direct election to the Storting after
PA RT Y P O L I T I C S 9 ( 4 )
414
at Humboldt -University zu Berlin on August 18, 2011ppq.sagepub.comDownloaded from

independence from Sweden.9 Ireland returned representatives to theWestminster parliament until 1918, but is considered here as a separate casebecause of the divergent development of its party system after the 1880s.In the case of Belgium, independence from the Low Countries and the intro-duction of parliamentary life with competitive elections were two parallelprocesses. Elections to the Chambre des représentants have been held since1830 but registered only since 1847–48, which corresponds with the waveof democratization that invested the whole of Europe. Elections are regis-tered since 1848 also in the cases of Denmark and Switzerland. In theformer, the date corresponds to the transition from the absolutist regime,whereas in the latter it corresponds to the foundation of the federal stateand the unification on national grounds of cantonal electoral laws. Unifi-cation is the starting date for the German Empire (elections from 1871 until1912, the last election before World War I).
In several of the cases mentioned, the starting date corresponds to thetransition from representation by estates (inherited from the Middle Ages)to general parliamentary representation. This transition occurred in 1848in the case of Dutch elections to the Tweede Kamer. Data, however, areavailable only since 1888, in correspondence with the constitutionalrevision that reduced census requirements and abolished ‘double constituen-cies’.10 Representation by estates did not exist in England; 1832 is the dateof the First Reform Bill and the first registered elections (the earliest case ofthe analysis).
Data
Data required are election results by parties and candidates at the level ofsingle constituencies. The data used for analysis in this article are thosepublished in machine-readable form in the CD-ROM that accompanies thehandbook on Elections in Western Europe since 1815. Electoral Results byConstituencies (Caramani, 2000).11 Figures are limited to general electionsand lower houses.12 No by-elections are considered, but staggered elections(élections partielles) are included in the analysis in the case of the BelgianChambre des représentants (with half of the house renewed every twoyears). For each election, the data include the number of persons entitled tovote, voters and valid votes by constituencies. Also included are the numberof votes for each party and/or candidate (for each ballot if applicable), aswell as the number of uncontested constituencies.13
Indicators
Of the two interrelated dimensions of party competition discussed above –contestedness and territorial spread – the first has been considered in anumber of studies (Cornford, 1970; Craig, 1977; Rose and Urwin, 1975;Urwin, 1982a). During the early periods of electoral development, plurality
C A R A M A N I : T H E E N D O F S I L E N T E L E C T I O N S
415
at Humboldt -University zu Berlin on August 18, 2011ppq.sagepub.comDownloaded from

systems were characterized by a high number of uncontested constituencies.The more uncontested constituencies, the less competition given that uncon-tested constituencies are dominated by one party, or candidate, in theabsence of competitors.
The use of such a simple indicator, however, varies depending upon themagnitude of constituencies. Table 1 gives a general overview of the elec-toral systems in force in the various countries in the nineteenth and earlytwentieth centuries. An important difference among majoritarian formulasconcerns whether they are based on single-member or multi-memberconstituencies. In electoral systems based on single-member constituencies,the number of constituencies equals the number of seats, and therefore thenumber of uncontested constituencies equals the number of unopposedseats. In most cases, however, single-member constituencies were combinedwith two-member or multi-member constituencies (for example, in theUnited Kingdom and Ireland). In systems based on multi-memberconstituencies, the number of seats exceeds the number of constituencies.There is therefore a distinction to be made between uncontested constituen-cies and unopposed seats.14 In several cases, two or more candidates ofdifferent parties were unopposed. It was frequent in the United Kingdomthat, in two-member constituencies, one conservative and one liberal wereunopposed.15 It can therefore be misleading to limit the count to uncon-tested constituencies (see Rose and Urwin, 1975). Since the two or moreseats in the same constituency can be won unopposed by different parties,the territorial spread of parties does not necessarily lead to a lowering ofthe number of uncontested constituencies.
PA RT Y P O L I T I C S 9 ( 4 )
416
Table 1. Electoral systems in eight countries: 1832–World War I
Number of Electoral ConstituencyCountry Period elections formula magnitude
Belgium 1847–1898 29 Two-ballot Single-member/Multi-member
Britain 1832–1935 20 Plurality Single-member/Multi-member
Denmark 1849–1915 31 Plurality Single-memberGermany 1871–1912 13 Two-ballot Single-memberIreland 1832–1910 20 Plurality Single-member/
Multi-memberNetherlands 1888–1913 9 Two-ballot Single-memberNorway 1906–1918 13 Two-ballot Single-memberSwitzerland 1848–1899 24 Three-ballot Single-member/
1902–1917 Two-ballot Multi-member
Notes: The 29 Belgian elections include five general elections (1848, 1857, 1864, 1870 and1890) and 24 partial renewals. In Denmark, two elections in the same year were held in1853, 1864 and 1881. The election to the Constituent Assembly of 1848 is not included. Inthe United Kingdom (and Ireland) in 1910 two elections were held (January and December).
at Humboldt -University zu Berlin on August 18, 2011ppq.sagepub.comDownloaded from

Although the distinction between single-member and multi-memberconstituencies applies also to repeated-ballot formulas (two-ballot andthree-ballot),16 with these formulas it is also possible to operationalize thelevel of competition by (1) counting the number of constituencies in whicha second ballot was necessary for electing a representative (the higher thenumber of such constituencies, the higher competition), or (2) counting thenumber of uncontested constituencies at second ballot (the higher thenumber of such constituencies, the lower competition).17
For both single-member and multi-member constituencies – because ofthe frequent redistricting and redistribution, and for the sake of cross-national comparison – figures below are based mostly on the number ofuncontested constituencies as a percentage of the total number ofconstituencies.18
Evidence
Plurality Systems
A case of a pure single-member plurality system is Denmark from 1849 until1915. When candidates were unopposed, voters could ask to vote either‘yes’ or ‘no’ for the unopposed candidate. Until 1898 voting was carriedout by a show of hands. The electoral committee decided, by looking at thecrowd, whether or not a candidate could be declared elected on the basisof a show of hands, and only in the case of ambiguity was a count taken.19
When there was more than one candidate, the electoral committee decidedwho was to be elected by looking at the crowd (only in the case of uncer-tainty was a roll-call election carried out). Such cases have been counted asuncontested constituencies. The fact that no count was needed demonstratesthe ‘uncontestedness’ of that constituency (with only marginal oppositioncandidates).
As can be seen from the left-hand graph in Figure 1, the number of uncon-tested constituencies decreases continuously from 1853 to 1905. This showsthat there are fewer and fewer constituencies dominated by one of the twomain parties – Højre or Venstre – in which the other is absent, indicating aclear and progressive increase in the rate of competition in Danish electorallife. Uncontested constituencies displayed in the graph include mostly thosewon by Højre and Venstre, the two main parties of the Danish system untilWorld War I. Other parties won unopposed seats sporadically. These partiesstarted to appear in 1872 (the Social Democrats contested oneconstituency). During the 1890s the United Liberals (Forenede Venstre), theModerates (Forhandlende Venstre), the Radikale Venstre and the agrarians(since 1905) made their appearance.
Let us now turn to a typical case of multi-member plurality elections –that of the United Kingdom since 1832, which includes also Ireland until
C A R A M A N I : T H E E N D O F S I L E N T E L E C T I O N S
417
at Humboldt -University zu Berlin on August 18, 2011ppq.sagepub.comDownloaded from

1918.20 Constituencies returned up to four seats, but through the mechan-ism of limited voting a maximum of only three votes could be cast. Varia-tions occurred over time with ‘redistributions’ of seats: the number of seatsreturned by constituencies was changed, and, in some cases, constituencieswere disenfranchised because of corrupt practices.
As in Denmark, the party system was dominated by two main parties:Conservatives and Liberals. By the mid-nineteenth century, Chartist andlater Liberal Unionist candidates began to challenge these parties, but theimpact of ‘third’ parties on the party system format was limited until theappearance of Labour candidates towards the end of the century. In Ireland,Conservatives and Liberals had been challenged since the 1870s by Nation-alists and Unionists. Since the 1880s, conservative candidates have notcontested Irish constituencies and the Liberals underwent a rapid decline(although they continued to contest Irish constituencies until 1918). Asshown in the right-hand graph of Figure 1, Ireland and Great Britain presenttwo different patterns. On the one hand, the number of uncontestedconstituencies declines in Great Britain, indicating a progressive increase inthe rate of competition until the 1930s. On the other hand, in Ireland themovement is more erratic and does not give rise to a clear trend. This differ-ence is due to the persistent partisan structure in Britain and to the radicalchanges that occurred in the Irish party system.
In Britain the Conservative and Liberal parties were therefore never chal-lenged until the growth of the Labour Party (see also Figure 4 below). InIreland, by contrast, the decrease in the number of uncontested constituen-cies between 1874 and 1885 was caused by the appearance of two newantagonists: the Nationalists and the Unionists. Their presence in mostconstituencies made them competitive and the overall number of uncontested
PA RT Y P O L I T I C S 9 ( 4 )
418
Denmark
1909
1898
1887
1879
1869
1864
1854
1849
100
80
60
40
20
0
Britain
1950
1929
1922
1910
1895
1885
1868
1857
1841
1832
100
80
60
40
20
0
Ireland
Figure 1. Percentage of uncontested constituencies in Denmark and theUnited Kingdom
at Humboldt -University zu Berlin on August 18, 2011ppq.sagepub.comDownloaded from

constituencies declined rapidly. By 1885, nationalist candidates were mainlyunopposed, increasing the overall number of uncontested constituencies forthat particular election. In 1892, however, the Anti-Parnell Nationaliststransformed Irish constituencies into competitive ones again by opposingthe Parnell Nationalists. In 1895 the Anti-Parnell Nationalists were mainlyuncontested. Since 1890 the (newly unified) Nationalists won the majorityof the constituencies unopposed making the system non-competitive onceagain.21
Constituencies versus Seats
What are the figures when we consider seats in conjunction with constituen-cies? Table 2 gives the number of uncontested seats for the first, second,third and fourth candidates for both Conservatives and Liberals in Britain.
The first columns for both Conservatives and Liberals show that onecandidate has been declared elected unopposed in his constituency. In 1832this happened in 44 (out of 335) constituencies for the Conservatives and in81 for the Liberals. Among the 44 constituencies in which a conservativecandidate has been elected, in 6 of them a second conservative candidate wasalso elected unopposed. Similarly, of the 81 liberal uncontested constituen-cies, in 24 a second candidate has been elected unopposed. The total numberof uncontested constituencies in which candidates won an unopposed seat,therefore, appears in the first columns of each party. The remaining columnsprovide information about the additional seats won by unopposed candi-dates in the same constituencies (for example, in 1859 in one constituencyfour liberal candidates were elected unopposed). The sum of the columnstherefore gives the total number of unopposed seats won in an election.
The table indicates in the first place that constituencies in which morethan two candidates of the same party were elected unopposed are rare (seethird and fourth candidate column). Second, there is a sudden drop in thenumber of constituencies in which two candidates of the same party wereelected unopposed after the Third Reform Bill (1884–85) which reducedthe number of two-member constituencies in favour of single-memberconstituencies. In addition, constituencies in which two candidates of thesame party were elected unopposed became rare.
Third, the table gives the total number of constituencies in which candi-dates of different parties were elected unopposed. This more importantinformation is obtained by subtracting the overall number of uncontestedconstituencies from the sum of the constituencies in which either at least oneconservative or one liberal candidate has been elected unopposed. In 1832,for example, there were 125 constituencies in which either a conservative ora liberal had been elected unopposed. However, in total there were 104uncontested constituencies. Therefore, in 21 constituencies both parties werepresent with unopposed candidates. These are ‘shared constituencies’ inwhich both a liberal and a conservative candidate were elected unopposed.
C A R A M A N I : T H E E N D O F S I L E N T E L E C T I O N S
419
at Humboldt -University zu Berlin on August 18, 2011ppq.sagepub.comDownloaded from

PA
RT
Y P
OL
ITIC
S 9
(4)
420
Table 2. Uncontested constituencies and unopposed seats in the United Kingdom: 1832–1910
Conservatives Liberals Total
Total Total Sum of 1stElection 1st 2nd 3rd Conservative 1st 2nd 3rd 4th Liberal Uncontested candidates ‘Sharedyear candidate candidate candidate seats candidate candidate candidate candidate seats constituencies columns constituencies’
1832 44 6 0 50 81 24 0 0 105 104 125 211835 80 20 0 100 100 26 0 0 126 146 180 341837 76 26 0 102 68 13 0 0 81 116 144 281841 123 56 4 183 70 13 0 0 83 166 193 271847 123 54 2 179 105 21 0 0 126 196 228 321852 99 42 2 143 65 13 0 0 78 147 164 171857 98 36 0 134 116 33 0 0 149 186 214 281859 115 41 0 156 127 30 1 1 159 197 242 451865 82 32 2 116 110 22 0 0 132 164 192 281868 43 22 0 65 69 11 0 0 80 100 112 121874 72 44 0 116 47 3 1 0 51 106 119 131880 29 23 0 52 36* 3 0 0 39 56 65 91885 4 2 0 6 12 1 0 0 13 17 16 01886 83 4 0 87 37 1 0 0 38 150 120 01892 22 2 0 24 10 1 0 0 11 42 32 01895 98 3 0 101 9 0 0 0 9 124 107 01900 121 4 0 125 22 0 0 0 22 165 143 01906 3 0 0 3 23 0 0 0 23 31 26 01910 5 1 0 6 0 0 0 0 0 10 5 01910 51 2 0 53 31 0 0 0 31 95 82 0
Notes: Irish constituencies (1832–1918) not included. In 1910 two elections (January and December); (*) Among which one Liberal/Labour candidate. These were nomineesof Liberal associations but ‘campaigned mainly on trade union and labour issues’ (Craig, 1977: xv).
at Hum
boldt -University zu B
erlin on August 18, 2011
ppq.sagepub.comD
ownloaded from

Figure 2 shows the evolution of ‘shared constituencies’. Shared constituen-cies in which both a conservative and a liberal were unopposed drops tozero in 1885 after the Third Reform Bill, which carried out a large redistri-bution of seats. Most multi-member constituencies were abolished andreplaced by single-member constituencies. For this reason the overall numberof constituencies increases from 352 to 542. As can be seen from Figure 2,the percentage of shared constituencies is limited, reaching a maximum of45 in 1859 (12.8 percent of the total number of constituencies and 22.8percent of the number of uncontested constituencies). The remainder ofuncontested constituencies were either single-member constituencies, inwhich there was one unopposed candidate, or two-member constituencies,in which there were unopposed candidates of the same party. The fact thatseats within the same constituency were rarely shared between the candi-dates of different parties reinforces previous indications of a low rate ofcompetition. Most constituencies – either single- or multi-member – attestfor the presence of one party only.
Two-Ballot Systems
Among the countries under scrutiny using a two-ballot formula, the numberof uncontested constituencies at first ballots is low.22 At first sight, this
C A R A M A N I : T H E E N D O F S I L E N T E L E C T I O N S
421
18851880
18741868
18651859
18571852
18471841
18371835
1832
Per
cen
tag
e
50
40
30
20
10
0
As a % of totaluncontestedconstituencies
As a % of totalnumber ofconstituencies
Figure 2. ‘Shared constituencies’ in Britain, 1832–85
at Humboldt -University zu Berlin on August 18, 2011ppq.sagepub.comDownloaded from

indicates a higher rate of competition. However, if we also look at secondballots, the picture changes. To assess the emergence of national competi-tive patterns in two-ballot formulas, the number of constituencies in whicha second ballot was necessary for electing a representative is an importantadditional indicator in formulas in which the actual allocation of seats iscarried out in the second ballot: the more constituencies in which a secondballot was required, the greater the competition. For comparative purposes(through both space and time) we use the number of constituencies in whicha second ballot was carried out as a percentage of the total number ofconstituencies.
Among our cases, two-ballot formulas were used mostly in single-memberconstituencies.23 As shown in Figure 3, the longest trend is that of Belgium,for which both partial and general elections have been considered. Thesetwo types of election display a parallel trend: elections held alternately in19 and 22 arrondissements and general renewals of the Chambre desreprésentants are characterized by a low number of second ballots until theearly 1880s. This number then increases suddenly to a high of almost 60percent of the constituencies, indicating an increased competitiveness incorrespondence with the introduction of male universal suffrage in 1893(PR was introduced in 1898). The same trend characterizes the Reich period
PA RT Y P O L I T I C S 9 ( 4 )
422
1915
1909
1905
1898
1894
1891
1887
1882
1878
1874
1868
1863
1857
1852
1847No
. of
seco
nd
bal
lots
as
% o
f to
tal c
on
stit
uen
cies 70
60
50
40
30
20
10
0
Belgium
Germany
NetherlandsNorway
General elections in Belgium
Figure 3. Percentage of constituencies in which a second ballot was held inBelgium, Germany, The Netherlands and Norway, 1847–1915
at Humboldt -University zu Berlin on August 18, 2011ppq.sagepub.comDownloaded from

of two-ballot elections in single-member constituencies from 1871 until1912, the last election before the Weimar constitution: the number ofconstituencies in which no candidate reached the absolute majority in thefirst ballot increases from zero in 1871 and 1874 to almost 50 percentduring the 1880s and 1890s.
For the Netherlands and Norway the period of time is shorter. After theabolition of ‘double constituencies’ in the Netherlands in 1888, electionswere held in single-member kiesdistricten. During the period until WorldWar I the percentage of second ballots is similar to those of Belgium andGermany during the same period. In the case of the Netherlands, it is inter-esting to consider the number of constituencies in which second ballots wereuncontested. These are cases in which one of the two run-off candidateswithdraws, which occurred often during the whole of the 1888–1917period: from a minimum of 50 out of 100 constituencies in 1897, to amaximum of 63 in 1909. Although, therefore, in many constituencies nocandidate could be declared elected on the basis of the first ballot, in mostof them the difference in terms of votes between the two run-off candidateswas high enough to lead one of the two candidates to withdraw.
From 1815 until 1903 Norway voted with an indirect system:valgmandsvalgene (election of great electors) and stortingsvalgene (electionof representatives by great electors). Elections became direct in 1906 (two-ballot formula). Since the 1880s, however, the two main parties had coveredalmost 100 percent of the constituencies (at least at the level ofvalgmandsvalgene). This competitive pattern also appears in the number ofsecond ballots needed for electing representatives in the 123–6 valgkredsenbetween 1906 and 1918, the last election before the introduction of PR. Asshown in Figure 3, the number of second ballots as a percentage of the totalnumber of constituencies is between 50 and 60, a little higher than thepercentages of Germany and the Netherlands.
The Massification of Politics and the Lowering of EntryBarriers
The National Revolution and Enfranchisement
Among the factors usually put forward as accounting for the developmentof party competition, the early development of representative bodies and ofpluralist parliamentary life is one of the most important. It is argued thatparty competition is inherently linked to a precocious democratic life andold parliamentary traditions. Indeed, the ‘National Revolution’ hasfollowed diverse patterns in Europe. Not only was the timing of the intro-duction and development of free elections very different from country tocountry, but also the strength and duration of previous parliamentarytraditions varied a great deal among European states: while in some cases
C A R A M A N I : T H E E N D O F S I L E N T E L E C T I O N S
423
at Humboldt -University zu Berlin on August 18, 2011ppq.sagepub.comDownloaded from

the development of democratic life was smooth and progressive, the intro-duction of constitutional government in other cases was a sudden andabrupt change from previous absolutism.
Britain and Switzerland are both characterized by a long-term andsmooth trajectory. The Representation of the People Act adopted in 1832(which included Ireland, although with different franchise provisions) didnot constitute a violent break from representative traditions that were notdiscontinued – as in most continental countries – during the absolutistperiod. Similarly, in Switzerland the formation of the federal state in 1848could rely upon old democratic practices. On the contrary, in Denmark thetransition from absolutism in 1848–49 was sudden and abrupt. In othercases, democratic progress was accomplished simultaneously with move-ments of national independence and/or unification. The Belgian revolutionof 1830, when independence from the United Kingdom of the Netherlands(which also included the Duchy of Luxembourg) was achieved, introducedelections with a two-ballot majority system based on a restricted franchise.In Germany, national unification in 1870 definitely introduced maleuniversal suffrage and a two-ballot electoral system.
Furthermore, in many states, after the absolutist period, estate parlia-ments were introduced as a first step in the direction of general parlia-mentary representation. Among our cases, this occurred in the Netherlands,where elections to the Tweede Kamer from 1815 until 1849 were mediatedby Provincial Councils in turn based on estate representation. In Belgiumitself this was the case before independence in 1830. During the reaction-ary period that followed the 1848 revolution in most states, includingGermany, parliaments were reorganized as curial systems, with the excep-tion of Bavaria, Baden and Prussia, where the three-class electoral systemwas introduced.
A closely related element to the development of parliamentary life is theextension of voting rights to the entire male population. This process toovaries a great deal among European states. In most of the countriesconsidered here the introduction of (male) universal suffrage was gradual.Franchise was extended progressively in Belgium (universal suffrage in1893),24 Norway (1900), Denmark, the Netherlands, the United Kingdomand Ireland (1918). In Switzerland and in Germany, on the contrary, theextension of the franchise to all males occurred earlier and abruptly in1848. However, whereas in Switzerland there were no reversals, thehistory of Germany has been more agitated with the definite extension in1871 after the period of reaction that invested most German states beforeunification.25
Independently from the richness in diversity of national trajectoriestowards free elections and mass suffrage, however, the above evidence doesnot support the hypothesis of a strong link between the type and durationof the traditions of representation, processes of enfranchisement, and thebirth of electoral competition. Competition does not take off earlier in
PA RT Y P O L I T I C S 9 ( 4 )
424
at Humboldt -University zu Berlin on August 18, 2011ppq.sagepub.comDownloaded from

Britain than in other countries despite longer parliamentary and electoralpractices. In all countries, on the contrary, the different indicators used tomeasure the degree of contestedness of constituencies display a similartendency towards increasing competition in the second half of the nine-teenth century. Furthermore, for several countries there is evidence that thelevels of competition increase before the crucial extensions of voting rights,that is, before the introduction of male universal suffrage. Whereas forBelgium, Germany and Switzerland male universal suffrage is introducedbefore or in correspondence with the development of competition in thesecond half of the nineteenth century, in Britain, Denmark and the Nether-lands during the same period competition increases in spite of a restrictedfranchise which was not extended until after World War I.
The Industrial Revolution and the Entry of New Parties
The concomitant timing of development of party competition during thesecond half of the nineteenth century therefore suggests that other factorshave played a more important role, namely, the appearance of new chal-lengers during this period as a result of political mobilization caused byprocesses of industrialization and urbanization. The entry of new competi-tors – in particular social democrats and labour parties – has changed theconfiguration of European party systems towards the end of the nineteenthcentury into a more competitive one.
The opposition between conservatives and liberals was typical of politicsin the age of restricted electorates. If one looks broadly at the Europeanparty systems of the nineteenth century, the pattern appears to be almostinvariably that of conservatives versus liberals – although in several coun-tries conservatives were Catholic parties (as in Belgium and Switzerland,and later also in Germany) opposed to centralizing secularized liberalparties. New parties emerged from the impact of the Industrial Revolutionthat mobilized large strata of workers and peasants. The end of the centurywitnessed the rise of mass working-class parties in all countries (and largeagrarian parties in the Nordic countries and in several Germanic areas).
This section attempts to evaluate the weight of the appearance of suchnew parties – spreading into and contesting an increasing number ofconstituencies hitherto controlled by conservatives and liberals – on theoverall decline in the number of unopposed seats. The alternative hypoth-esis would be that this decrease resulted from the spread of conservativesand liberals themselves challenging the strongholds of the opposing party.The information on party affiliation allows us to determine the extent towhich competition arises from the appearance of new political forces orwhether new parties entered an already competitive configuration createdby the ‘mutual challenge’ of the main existing parties.
The entry of new parties in the electoral arena can be shown with fourcases for which the time series of electoral results by parties is longer:
C A R A M A N I : T H E E N D O F S I L E N T E L E C T I O N S
425
at Humboldt -University zu Berlin on August 18, 2011ppq.sagepub.comDownloaded from

Belgium, Denmark, Switzerland and Britain in the nineteenth and beginningof the twentieth century.26 In all four cases – with some variations – threemain party families of the early party systems are considered: two old estab-lished families (conservatives or Catholics on the one hand and liberals onthe other) and one ‘new’ family (the social democrats). In Belgium, theparties considered are the Union catholique belge, the Parti libéral and Partiouvrier belge. In Denmark, Højre and Venstre have been considered asconservative and liberal. The Socialdemokrater represent the new entrant.27
In Switzerland, the Radicals (Freisinnig-Demokratische Partei) have beenconsidered instead of the liberal wing (Liberal-Demokratische Partei),together with the Katholische Konservative and the SozialdemokratischePartei der Schweiz. Finally, in Britain the Conservative Party, Liberal Partyand Labour Party have been considered. In all these countries, majoritarianformulas (two/three-ballot formula in Belgium and Switzerland, plurality inDenmark and Britain) made the existence of other parties difficult andsporadic.
Figure 4 shows the simultaneous appearance and territorial spread of newparties in Europe.28 In all countries the social democrats spread throughnational territories in the last decades of the nineteenth century and in thefirst part of the twentieth century. This occurs in correspondence with themobilization of the new working strata of society – either already enfran-chised (as in Switzerland) or still deprived of the right to vote. Mass partiesof the working class, along with agrarian parties in the Nordic countries,and later people’s parties in Catholic countries, etc. (for example, inDenmark the Radikale Venstre displays a similar pattern to that of theSocial Democrats), were able – also because of pre-existing social organiz-ations (namely, unions) – to mobilize the new working-class and peasantelectorates.
Furthermore, in the four cases considered we find conservatives andliberals – the other ‘side’ of the left–right cleavage – covering most of theconstituencies since the beginning of the period considered, that is, since the major transitions towards democratic elections. These were the partiesthat first mobilized restricted electorates under the régime censitaire andcapacitaire. Social democratic and labour parties appear under the effect ofsocio-economic transformations and geographical mobility resulting fromindustrialization and urbanization. This occurs towards the end of the nine-teenth century, and the territorial spread of this party family is both suddenand rapid, as the solid lines show in Figure 4.29
In Belgium, Catholics and Liberals are present in more than 80 percentof the constituencies; since the 1880s, Catholics are present in all constituen-cies. The share of constituencies in which conservatives and liberals presentcandidates is approximately the same in Switzerland and in Britain. Theperiod considered for Switzerland starts with the Sonderbundkrieg betweenProtestant nation-builders and Catholic cantons at the foundation of thefederal state. The cleavage between Radicals and Catholics was reflected in
PA RT Y P O L I T I C S 9 ( 4 )
426
at Humboldt -University zu Berlin on August 18, 2011ppq.sagepub.comDownloaded from

C A R A M A N I : T H E E N D O F S I L E N T E L E C T I O N S
427
1913
1906
1898
1890
1881
1873
1866
1861
1854
1849
100
80 60 40 20 0
Den
mar
k
1902
1896
1890
1884
1878
1868
1863
1857
1852
1847
100
80 60 40 20 0
Bel
gium
1919
1914
1908
1902
1896
1890
1884
1878
1872
1866
1860
1854
1848
100
80 60 40 20 0
Sw
itzer
land
Number of constituencies in which parties are present as a %of total number of constituencies
1935
1929
1923
1910
1900
1892
1885
1874
1866
1857
1847
1837
1832
100
80 60 40 20 0
Bri
tain
Co
nse
rvat
ives
/Cat
ho
lics
Lib
eral
sS
ocia
l Dem
ocra
ts
Figu
re 4
.Te
rrit
oria
l spr
ead
of c
onse
rvat
ives
, lib
eral
s an
d so
cial
dem
ocra
ts in
fou
r co
untr
ies,
183
2–19
35
at Humboldt -University zu Berlin on August 18, 2011ppq.sagepub.comDownloaded from

a clear-cut territorial segmentation of the vote. British parties wereconstantly present in 70–90 percent of the constituencies without signifi-cant variations over time. The coverage of territory was very large for bothConservatives and Liberals (during this period the Chartists were present ina very small number of constituencies). The electoral reforms of 1867–68and 1884–85 (Franchise Act and Redistribution Act) stimulated thenational organization of political parties (see Urwin (1980 and 1982a) onthis point). Party support, however, remained dominated by local strains.Historically, liberal support (and later the vote for Labour) correspondedto the distribution of English Nonconformism, whereas Anglican religios-ity tended to be associated with conservative support in the regions of thesoutheast and around London. Liberal support was therefore stronger inthe areas on the remove from the centre.30
Whereas in Belgium, Switzerland and Britain the proportion of territorialcoverage by conservatives, Catholics and liberals is stable through time, inDenmark the ‘Right’ and ‘Left’ increased the number of constituencies inwhich they presented candidates over the decades. In the early elections afterthe sudden transition from absolutism to democratic representation, the twoparties were present in around half of the valgkredse. Both parties expandedin the 1860s to 1870s, reaching around 80 percent of the constituencies.Each of the two parties increasingly challenged the domination of the otherin further constituencies during this period. A retrenchment then againoccurred to some extent in the 1890s and 1900s for Højre and later alsofor Venstre.
What has been the impact of the spread of social democrats on the rateof contestedness? For Denmark and the United Kingdom the number ofseats won in uncontested constituencies by each party is also known, andallows us to verify whether the overall decline in the number of uncontestedconstituencies is caused by the appearance of new parties contesting anincreasing number of seats that up to that point were won by either theConservatives or the Liberals, or whether alternatively this decrease hasbeen determined by the spread of the support of the Conservatives andLiberals themselves – Højre or Venstre in Denmark – challenging the strong-holds of the adversary party.
Figure 5 answers this question for Denmark. Social Democrats contestthe first election in 1872. As it appears, however, by that time the overallnumber of uncontested constituencies had already dropped dramatically. Inthe Danish case, the entry of the Social Democrats was therefore not at theorigin of the contestedness of constituencies. The entry of this new partyaffected the overall number of uncontested constituencies only marginally.As can be seen earlier in Figure 4, the spread of the Conservatives (Højre)and of the Liberals (Venstre) started long before 1872. Percentages of terri-torial coverage by these two parties increase continuously from 1849 until1890, after which all three parties cover a similar portion of territory(around 60–70 percent). Also the reduction in the number of uncontested
PA RT Y P O L I T I C S 9 ( 4 )
428
at Humboldt -University zu Berlin on August 18, 2011ppq.sagepub.comDownloaded from

C A R A M A N I : T H E E N D O F S I L E N T E L E C T I O N S
429
Højre
19131906
18981890
18811873
18661861
18541849
Nu
mb
er o
f u
nco
nte
sted
co
nst
itu
enci
es
50
40
30
20
10
0
Venstre SocialDemocrats
Figure 5. Number of uncontested constituencies for Højre, Venstre and SocialDemocrats in Denmark, 1849–1913
Conservatives
19311924
19221910
19001892
18851874
18661857
18471837
1832
Per
cen
tag
e o
f u
nco
nte
sted
co
nst
itu
enci
es
50
40
30
20
10
0
Liberals Labour
Figure 6. Percentage of uncontested constituencies for Conservatives, Liberals andLabour in Britain, 1832–1935
at Humboldt -University zu Berlin on August 18, 2011ppq.sagepub.comDownloaded from
constituencies had started long before 1872 (Figure 5) through the ‘mutualchallenge’ of the Conservatives and Liberals and to the diffusion of thesetwo parties through constituencies.31
According to Figure 6, the same pattern seems to apply in the British case.Before the appearance of Labour towards the end of the century, partiesother than the Conservatives and the Liberals were weak and sporadic (theother main political formations were the Chartists, the Liberal Unionistsand independent candidates). The first Labour candidates did not enter theelectoral arena before the end of the century. Their entry is extremelysudden: by 1910, they cover already around 80 percent of the constituen-cies. As early as the 1850s, however, Conservatives and Liberals had wona decreasing number of uncontested constituencies. Before 1900 the onlyantagonist that made these constituencies competitive was the ‘other’ party,either the Conservative or Liberal Party.
Unlike Denmark, however, Figure 4 shows that Conservatives andLiberals were present in almost all constituencies already in 1832 (between70 and 90 percent of territorial coverage). The reduction in the number ofuncontested constituencies for both parties displayed in Figure 6, therefore,is caused not so much by the spread of these parties through constituencies,but by the redistribution of seats. A part of the drop in the number of uncon-tested constituencies between 1866 and 1885 can be attributed to theroughly 20 percent of ‘shared constituencies’ which disappear by 1885 (seeFigure 2). These constituencies were uncontested but both parties werepresent. If these are divided into single-member constituencies, the twoparties contest the single seat.
The Irish case (see Figure 7) is different from both Britain and Denmark.There is no decline of conservative and liberal uncontested constituenciesuntil the 1870s, and only in 1874 and 1880 did the number of uncontestedconstituencies decline dramatically. After 1885 the graph shows thecomplete change in the party system with the entry of Nationalists as thedominant party. A replacement of parties therefore took place after 1885with Nationalists winning up to 60–65 percent of the constituencies un-opposed. Furthermore, the Unionists also won between 5 and 10 percent ofthe constituencies unopposed since 1866. Overall, therefore, almost three-quarters of the constituencies were not competitive from 1885 until WorldWar I. In Belgium, finally, Catholics and Liberals have occupied mostconstituencies since 1847. However, it is only since 1894, the moment atwhich universal suffrage is introduced and the Socialists enter the electoralarena, that the number of second ballots really increases (see Figure 3), indi-cating growth in the rate of competition.
In conclusion, therefore, whereas in Denmark competition seems to haveoriginated from the mutual challenge among conservatives and liberals,and in Britain also through the redistricting and redistribution of seats, inBelgium the entry of new actors through the mobilization of the working-class electorate seems to have had a stronger impact. In all cases, however,
PA RT Y P O L I T I C S 9 ( 4 )
430
at Humboldt -University zu Berlin on August 18, 2011ppq.sagepub.comDownloaded from

by the time of the entry of new actors onto the political arena, conserva-tives and liberals had already occupied the available political space andcreated competition independently from new parties. At their appearance,therefore, the new mass parties issued from the Industrial Revolution – andin some cases from the enlargement of suffrage – did not create a competi-tive configuration, but rather entered already competitive party systems.
In some cases, as in Britain, the appearance of labour parties evenreplaced the liberal party. The process of dépassement par la gauche of theliberals as the ‘second’ party of the system takes place in the 1930s (seeFigure 4), when the Liberal Party contests only about 30 percent of theconstituencies. In other cases, the social democrats – as well as agrariansand, later, communist parties – transformed competition from two-partyinto multi-party competition. This difference is partly due to the electoralformula.
The Lowering of Entry Barriers: Majoritarian versus PRFormulas
The third factor to be considered causing increased competition in partysystems is the lowering of the entry barriers represented by the electoral law.Majoritarian systems set very high thresholds for representation, making theentry of new and small parties problematic.32 This concerns in particular
C A R A M A N I : T H E E N D O F S I L E N T E L E C T I O N S
431
Conservatives
19101900
18921885
18741865
18571847
18371832
Per
cen
tag
e o
f u
nco
nte
sted
co
nst
itu
enci
es
80
60
40
20
0
Liberals
Nationalists
Unionists
1918
Figure 7. Percentage of uncontested constituencies for Conservatives, Liberals,Nationalists and Unionists in Ireland, 1832–1918
at Humboldt -University zu Berlin on August 18, 2011ppq.sagepub.comDownloaded from

the new parties of the working class which mobilized the left electorate.Furthermore, given the high thresholds typical of the majoritarian systemsin force in all countries until the beginning of the twentieth century, estab-lished parties too were not encouraged to spread in territories in which theycould not hope to reach the majority of the votes, indispensable in a ‘first-past-the-post’ system. As a consequence, it has been argued that majoritar-ian systems inhibited competition by increasing the persistence of territorialand subcultural electoral strongholds. It is therefore plausible that the intro-duction of PR around World War I has increased the competitiveness ofparty systems.
According to Duverger (1950 and 1951), majoritarian systems – inparticular plurality systems based on single-member constituencies – do notfoster the spread of parties in new constituencies. On the contrary, plural-ity allows parties whose support is territorially concentrated to survivedespite their national weakness: ‘minorities can secure representation on thenational level only because they constitute the majority in certainconstituencies. The effect is that the majority vote accentuates geographicaldivisions of opinion: it might even be said that it tends to convert a nationalcurrent of opinion [. . .] into a regional opinion, as its only chance ofrepresentation is in those parts of the country where its strength is greatest’(Duverger, 1951: 331–32). In addition, parties have no incentive to increaseefforts in campaigning and in presenting candidates in those constituenciesin which they do not have a chance of winning the seat. This is not the casewith PR, which represents a strong incentive for spreading in all constituen-cies and in adversary strongholds. Parties are encouraged to expand and topresent candidates in all constituencies where, even with a small number ofvotes, it is possible to win seats: ‘in the countries which have adopted PRafter having been used to the majority system, we can see a sort of gradual“nationalization” of opinion’ (Duverger, 1951: 332).33
This view of PR systems favouring the spread of competition is shared byother research. For Rose and Urwin, in ‘multi-member constituencies ofproportional representation [. . .] there is much more incentive for partiesto offer a full slate of candidates in all regions’ (1975: 19). For example,Urwin notes about Germany that ‘[t]he particular variant of proportionalrepresentation introduced in the Weimar Republic encouraged parties tocontest every electoral district’ (1982b: 192). Also Rokkan notes that‘proportional representation systems encourage a wider participation whilemajority systems discourage minorities’ (1970: 350).34
With list systems, the presence of several candidates of one and the sameparty hinders single personalities from campaigning idiosyncratically andfavours a national standard partisan campaigning along ideo-logical–programmatic lines. General issues therefore take a more importantplace with respect to particular local ones: ‘the list system [. . .] compels theelector to vote for a party rather than for personalities, that is to say, for asystem of ideas and an organization of national scale rather than for the
PA RT Y P O L I T I C S 9 ( 4 )
432
at Humboldt -University zu Berlin on August 18, 2011ppq.sagepub.comDownloaded from

champions of local interests’ (Duverger, 1951: 333; see, on the same point,Rokkan, 1970: 21). In general, the fewer the seats returned in oneconstituency, the more small parties are penalized.35 Therefore parties haveno incentive to present candidates in constituencies in which they are weak.This emphasizes the relationship between the disproportionality of the elec-toral formula (the difference in the share of votes and seats) and the spreadof party support across constituencies. The higher the disproportionality,the higher the disparities between territorial units and, therefore, the smallerthe number of constituencies in which parties contest adversaries. Histori-cally, electoral formulas and magnitudes of constituencies largely overlap:plurality formulas and, more generally, majoritarian systems (repeated-ballot systems)36 were usually based on single-member constituencies(although two- and three-member constituencies were frequent in Britain aswell as in other countries); PR systems are always based on multi-memberconstituencies.
In reality, the hypothesis of a strong link between PR and the birth ofcompetition is difficult to test, because the introduction of PR electoralformulas by or in the aftermath of World War I fundamentally altered thetype of electoral competition. PR did not so much increase electoralcompetition as change its nature. The single-member plurality formula isthe ideal-typical case of a ‘winner-takes-all’ type of competition, in whichthe candidate or party receiving the most votes takes 100 percent of thestakes in a constituency. With PR, on the contrary, parties compete for thelargest ‘share of the cake’ in each constituency.37 Instead of ‘all-or-nothing’,the rationale in multi-member PR constituencies is to run for election evenin those constituencies in which support is supposed to be weak, since thiswill lead to some reward in terms of seats.
Electoral formulas had rather strong consequences on the format of partycompetition. With the introduction of PR at the beginning of the twentiethcentury, new parties could be incorporated into a multi-party configuration.On the contrary, under plurality systems the entry of new parties challengesthe existence itself of the existing parties. This appears clearly in Figure 4,in which it is shown that in Britain (the only country which did not switchto PR after World War I) the Labour Party replaced the Liberal Party in theelectoral competition in most constituencies during the 1930s. On thecontrary, in most other European countries – which all introduced someform of PR by or after World War I – the format of party competition wasmodified through the addition and incorporation of new parties.38
What appears clearly in the different graphs, however, is that the trendtowards more competition in European party systems occurs before theintroduction of PR and, therefore, independently from the changes in the electoral formula. After World War I, PR has increased the incentivesfor new and established parties to spread through constituencies and has mobilized voters’ turnout (all votes count) by not hindering them from voting for the weakest parties in their constituencies. However, at
C A R A M A N I : T H E E N D O F S I L E N T E L E C T I O N S
433
at Humboldt -University zu Berlin on August 18, 2011ppq.sagepub.comDownloaded from

the time PR was introduced, competition had already developed indepen-dently from changes in the rules of the game, with parties spreading insearch of new votes in spite of the barriers set by disproportional represen-tation systems.
From Territorial to Functional Competition
‘Silent elections’ – élections tacites or stille Wahlen – progressivelydisappeared from the European electoral landscape. By World War Icompetition had started off everywhere. Non-competitive configurationssurvived only in some cases, usually in the most traditional or remote loca-tions. In Ireland, uncontested constituencies continued to exist after theintroduction of STV. In 1922, when the first election to the Dáil after inde-pendence was held, there were still 8 (out of 28) uncontested constituen-cies. The last uncontested constituency is Donegal West in 1944. InSwitzerland, uncontested cantons continued to exist after the introductionof PR in 1919, mostly in the smaller alpine cantons in which the only seatis allocated by plurality. Between 1919 and 1987 the number of suchcantons has varied from one to three.39 Similarly, the Valle d’Aosta in Italyand the Åland Islands in Finland are under the control of ethno-linguisticparties. In the United Kingdom, most university and business seats wereuncontested until they were abolished with the redistricting of 1950.40 Withthe exception of these few cases, however, multi-party competition afterWorld War I imposed itself everywhere, indicating the most radical changein political practice, and with competition and democracy becoming over-lapping concepts (Schumpeter, 1954).
With the gradual disappearance of territorial strongholds, competitiontransformed from territorial into functional. Functional competition hasbeen described after World War II by spatial analyses of electoral behav-iour and party systems. According to the model, political competition takesplace on an imaginary ‘ideological space’ in which political parties movein search of the optimal location for the maximization of votes (Downs,1957). This model was inspired by the work on geographical localizationof firms carried out by economists (Hotteling, 1929). It is a functionalanalogy of what had been developed on the basis of originally geographi-cal concepts – ‘location’, ‘space’, ‘distance’, ‘hunting ground’ (Panebianco,1988), ‘(de)radicalisation’ – and from what had happened at the territoriallevel. These models describe the competition of the second half of the twentieth century and, consequently, the geographical dimension of competition has disappeared. The functional–ideological dimensions ofconflict considered by spatial analyses are mainly the left–right andreligious dimensions (Sartori, 1976). Evidence above, however, has shownthat the same competitive logic working on the ideological level alsoworked on the territorial level at an earlier stage of electoral development.
PA RT Y P O L I T I C S 9 ( 4 )
434
at Humboldt -University zu Berlin on August 18, 2011ppq.sagepub.comDownloaded from
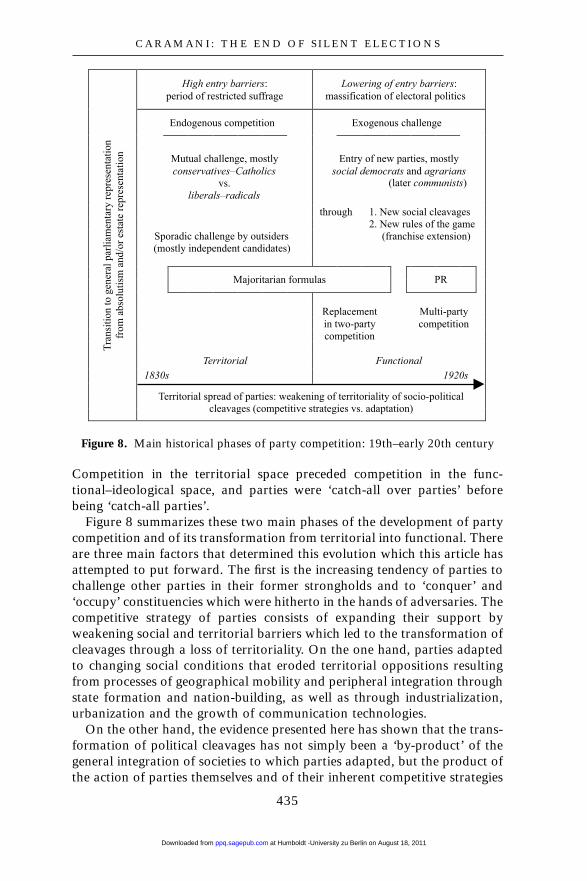
Competition in the territorial space preceded competition in the func-tional–ideological space, and parties were ‘catch-all over parties’ beforebeing ‘catch-all parties’.
Figure 8 summarizes these two main phases of the development of partycompetition and of its transformation from territorial into functional. Thereare three main factors that determined this evolution which this article hasattempted to put forward. The first is the increasing tendency of parties tochallenge other parties in their former strongholds and to ‘conquer’ and‘occupy’ constituencies which were hitherto in the hands of adversaries. Thecompetitive strategy of parties consists of expanding their support byweakening social and territorial barriers which led to the transformation ofcleavages through a loss of territoriality. On the one hand, parties adaptedto changing social conditions that eroded territorial oppositions resultingfrom processes of geographical mobility and peripheral integration throughstate formation and nation-building, as well as through industrialization,urbanization and the growth of communication technologies.
On the other hand, the evidence presented here has shown that the trans-formation of political cleavages has not simply been a ‘by-product’ of thegeneral integration of societies to which parties adapted, but the product ofthe action of parties themselves and of their inherent competitive strategies
C A R A M A N I : T H E E N D O F S I L E N T E L E C T I O N S
435
High entry barriers:
period of restricted suffrage
Lowering of entry barriers:
massification of electoral politics
Endogenous competition Exogenous challenge
Mutual challenge, mostly
conservativesÐCatholics
vs.
liberalsÐradicals
Entry of new parties, mostly
social democrats and agrarians
(later communists)
through 1. New social cleavages
2. New rules of the game
(franchise extension)Sporadic challenge by outsiders
(mostly independent candidates)
Majoritarian formulas PR
Replacement
in two-party
competition
Multi-party
competition
Territorial Functional
1830s 1920s
Transitionto
generalparliamentary
representation
from
absolutism
and/orestate
representation
Territorial spread of parties: weakening of territoriality of socio-political
cleavages (competitive strategies vs. adaptation)
Figure 8. Main historical phases of party competition: 19th–early 20th century
at Humboldt -University zu Berlin on August 18, 2011ppq.sagepub.comDownloaded from

which led them to break down territorial barriers. Parties tended to expandin search of support all over the country. At the territorial level – as laterat the ideological level – they tended to cover as much space as possible. Ifparties faced and adapted to new social conditions, it is also true that theycontributed to create conditions that favoured them; and the outcome hasbeen less clear-cut territorial oppositions.41
To mobilize the most remote and peripheral electorates, parties needed acapillary network of local organizations. They therefore developed central-ized national agencies for the control of local candidacies and relied uponmore efficient campaigning techniques which became available with techno-logical progress. Candidates in single-member constituencies during theperiod of majoritarian elections until World War I became increasingly‘party candidates’. They no longer represented merely their constituenciesbut rather nationwide functional interests and values. Candidates becamerepresentatives chosen by national and central party organizations ratherthan the expression of the notabilat local. Parties also started interveningdirectly on questions and set the agenda on issues which are not territori-ally delimited and which could be accepted in all areas of the country. Theyaddressed issues and presented platforms which appealed to large sectors ofthe electorate.42 In much the same way as on the ideological level, positionsof parties were ‘nationalized’ to make them acceptable to a larger propor-tion of voters; on the territorial level parties abandoned local claims andprivileged national ones. This was done by emphasizing issues which werenational in scope.
The second factor leading to functional competition is the disruptiveimpact of the Industrial Revolution and the consequent supremacy of anationwide and territorially homogeneous left–right dimension over terri-torially based cultural resistances. The ‘massification’ of politics and themobilization of working classes and peasants allowed for the rise of anexogenous challenge to established parties coming from new mass parties,in particular labour parties and social democrats, but also agrarians andcommunists. The impact of these new challengers which emerged from theIndustrial Revolution and its new cleavages was to increase the rate ofcompetitiveness in party systems, and the non-territorial nature and nation-wide scope of the left–right cleavage determined the fast pace at which socialdemocrat candidates spread across constituencies. Territorial oppositionsgave the way to ideological competition and, in this sense, the hegemony ofthe left–right dimension has been a strong factor in the ‘nationalization’ ofelectorates and party systems.43
Finally, the third factor that definitively transformed competition fromterritorial into functional is the general transition in continental Europe toPR. This formula had a major effect on reducing territorial opposition. Afterits introduction, competition mainly opposes groups and parties on an ideo-logical non-territorial basis. The change of the electoral formula frommajoritarian to PR introduced incentives high enough for attempting to
PA RT Y P O L I T I C S 9 ( 4 )
436
at Humboldt -University zu Berlin on August 18, 2011ppq.sagepub.comDownloaded from

break down the monopoly of representation of given political groups ingiven areas. Not only did PR favour the access and growth of social demo-crats and consequently the domination of the left–right dimension, but PRhas represented a strong incentive for parties to spread across territory.Whereas the majority vote accentuates geographical divisions of opinion,the list system hinders local particularisms and favours a national standardparty organization and programme. National issues therefore occupy amore important place with respect to territorially localized ones.
Acknowledgements
This article is based on a collection of electoral data published in the formof a handbook and CD-ROM (Caramani, 2000). I wish to renew my grati-tude to the persons who contributed to that project. For comments on earlierversions of this article, I am particularly indebted to Stefano Bartolini.
Notes
1 The 1832 election was the first after the First Reform Bill in which the largestseat redistribution and constituency changes were carried out in the UnitedKingdom.
2 Only five general elections took place in Belgium from 1847 to 1898. Theremaining 24 elections were partial, with half of the Chambre des représentantsrenewed every 2 years with 2 alternating groups of constituencies.
3 For example in Belgium, with the vote plural from 1893 to 1914. In Norway,voting remained indirect until 1903.
4 This concept refers to the first of four concepts introduced by Bartolini (1999and 2000), contestability, in regard to party competition. Contestability pointsto the extent to which conditions for the electoral market to be open are met,that is, the thresholds for entry for candidates and parties. Contestedness pointsto the degree to which elections are contested once the main barriers to entryhave been removed. The former refers to whether or not it is possible to contestelections, the latter to how much elections are actually contested.
5 For Stokes the degree of competition is determined by two factors: (1) the scopeof change between two elections, that is, the number of shifted votes; and (2) thesize of the majority, that is, the margin or distance between the two major parties(Stokes, 1967). Sundquist (1973: 333–40) defines a competitive party system asone characterized by an equal balance between parties, a roughly 50/50 balancebetween the two parties. See, along the same lines, Key (1964).
6 The link between territorially uniform electoral support for parties and thecompetitiveness of elections was first established by Schattschneider in his studyon American politics (1960, see especially Chapter 5 on ‘The Nationalization ofPolitics’). He shows that the sectionalism of American voting behaviour – withthe Republican Party concentrated in the North East and Middle West, and theDemocratic Party in the South – ‘curtailed competition’ (1960: 84). This
C A R A M A N I : T H E E N D O F S I L E N T E L E C T I O N S
437
at Humboldt -University zu Berlin on August 18, 2011ppq.sagepub.comDownloaded from

situation changed in 1932, when a national political alignment replaced sectionalcleavages. Electoral support of the two major parties diffused throughout thenational territory, producing a two-party system throughout the country. Thisproduced ‘a very great extension of the area of party competition’ (1960: 90).Other authors have established a close link between the homogeneity of terri-torial configurations of voting behaviour and the degree of competitiveness ofpolitical systems (for example, Urwin, 1974, 1982a, b). However, Claggett,Flanigan and Zingale have noted that ‘there appears to be some confusionbetween increasing nationalization in this sense of convergence in the levels ofsupport and increasing competitiveness of the party system. These phenomenaare not necessarily connected’ (1984: 81). It is only if a 50/50 configuration isdiffused in many constituencies that the rate of competition increases, bothlocally and nationally. For a discussion, see Caramani (1996).
7 For Switzerland, data by party affiliation are available only at the level of 25cantons rather than constituency level; for this reason, a systematic analysis ofuncontested constituencies is not possible. There were between 47 and 52(depending on the period) single- and multi-member constituencies (Bezirke).
8 For these reasons other countries are excluded from the analysis. In Austria,representation by estates (five curiae) was abolished only after the 1900/01election. In Finland, the first election after the abolition of estates was held in1907 (still under Russian rule). In France, reliable data are available only since1910, with the adoption of the new Règlement de la Chambre (allowing repre-sentatives to belong to no more than one parliamentary group). In Italy, data byparties since 1861 (unification) are sporadic, not least because of the fluid natureof the party system. Furthermore, the aggregation of results by party affiliation(regions) does not allow for a significant analysis. In Greece, elections have beenregistered only since 1926 after the abolition of lead ballots and in Luxembourgsince 1919 (election to the constituent assembly). Data are fragmented and unre-liable for Portugal and Spain before the transitions to democracy in the 1970sdespite longer periods of parliamentary life during the nineteenth century.
9 Present-day spelling is adopted for proper names throughout the article (forexample, Storting instead of Storthing). For historical spelling, see Caramani(2000: 16).
10 Direct elections in two-member constituencies with one of the two represent-atives elected for 4 years every 2 years.
11 See Caramani (2000: 1017–75) for complete official and secondary data sources.The CD-ROM gives results by candidates and parties at the level of singleconstituencies which have been collected and computerized since the earliestelections according to standard rules. Data are available in different programmes(SPSS, SAS, Excel), formats (absolute figures, row and column percentage distri-butions), as well as structures: for analysing data (horizontal time dimension),building time series (vertical time dimension), and matching socio-economic data(mixed structure).
12 In Norway, one-quarter of the elected representatives to the Folketing constitutesthe upper house (Odelsting) and three-quarters the lower house (Lagting).
13 The main missing cases are results for the 1912 German election for some parties(information for 3 to 329 Wahlkreise out of 397), for 16 constituencies (out of100) in the 1888–94 Dutch elections, and for the six cantons (out of 25) in whichvoting was open from 1848 until 1869 in Switzerland.
PA RT Y P O L I T I C S 9 ( 4 )
438
at Humboldt -University zu Berlin on August 18, 2011ppq.sagepub.comDownloaded from

14 To stress terminologically the distinction between constituencies and seats, I speakof ‘uncontested constituencies’ and ‘unopposed seats’ or ‘candidates’ or ‘parties’.
15 On the contrary, in 1859 all seats of the four-member constituency of the Cityof London were won unopposed by four liberal candidates.
16 In Germany, The Netherlands and Norway (1906–18) the two-ballot formulawas combined with single-member constituencies; whereas in Belgium andSwitzerland the two-ballot (or three-ballot) formula was based on both single-member and multi-member constituencies.
17 To do this, cases in which the exhaustive ballot is uncontested because of thewithdrawal of candidates before election must be added.
18 The total number of constituencies for which data are missing has beensubtracted from the total number of constituencies.
19 In Denmark, elections between 1849 and 1915 were held in 100–13 single-member valgkredse. After 1901 (when secret balloting was introduced), if therewas a single candidate, elections did not take place unless 50 voters asked forthe ‘yes/no’ vote.
20 In Great Britain, the number of parliamentary constituencies varied between 333in 1832 and 585 in 1935. For Ireland, considered separately for 1832–1910, thenumber of constituencies is 64–6, and 101 since 1885. Because figures for Britaindo not include the number of Irish uncontested constituencies, they differ fromthose presented by Craig (1977: 624) and Urwin (1982a). For Britain, figures forthe entire period include only conservative/liberal unopposed seats.
21 Only a small number of uncontested constituencies was won by the Unionists.22 The number of uncontested constituencies in Belgium was one in 1848 and one
in 1894 (both at the first ballot). In The Netherlands, the number of uncontestedconstituencies was also low: from a minimum of 5 in 1913 to a maximum of 11in 1901–09.
23 In Belgium, elections were held in 41 arrondissements during 1847–98 thengrouped in 30 constituencies in 1900. In Germany, the 382 Wahlkreise of 1871were raised to 397 in 1874 with the annexation of Alsace-Lorraine. In TheNetherlands the number of kiesdistricten was 100 over the entire 1888–1917period. During 1906–18, elections in Norway were held in 123–6 landdistrikterand kjøstæder (rural and urban districts).
24 In Belgium, a plural voting system was introduced along with universal malesuffrage. One additional vote was given to persons in the higher tax brackets,heads of households and capitalists; two additional votes were given to teachersand persons with higher education.
25 Competition was also affected by the prolonged use in some countries of indirectelections, either indirect elections as such (elections in two or more steps withthe use of great electors) or elections by the members of provincial councils. InBelgium, elections remained indirect until 1847; in Denmark until 1849; inGermany in several states until national unification; in The Netherlands until1848; in Norway until 1906; and in Switzerland elections in the cantons wereindirect until the creation of the federal state in 1848. In the United Kingdom(and in Ireland) elections have never been indirect.
26 Similar figures, not reproduced here, can be obtained for Germany and TheNetherlands since the 1870s/1880s.
27 Agrarians too appear as ‘new’ parties with enfranchisement and the IndustrialRevolution. However, Denmark, among the Scandinavian countries, is the only
C A R A M A N I : T H E E N D O F S I L E N T E L E C T I O N S
439
at Humboldt -University zu Berlin on August 18, 2011ppq.sagepub.comDownloaded from

case in which a large agrarian party did not develop (agrarian candidatescontested elections only during 1898–1903 and, later, the Bondepartiet from1935 to 1939).
28 The measure is the number of constituencies in which a party is present(nominator) as a percentage of the total number of constituencies (denominator).To adjust for missing data the number of missing constituencies has beensubtracted from the total number of constituencies. Furthermore, uncontestedconstituencies have been considered as constituencies in which the unopposedparty is present.
29 Among the four countries considered, it appears in Figure 4 that the spread ofworkers’ candidates was faster in the two more industrialized countries, Belgiumand Britain, whereas it was more gradual in Denmark and Switzerland.
30 Until the end of the 1860s this was the case also in Ireland, at the time returningMPs to Westminster. Conservatives and Liberals were each present in around 70percent of the constituencies, with the exception of the 1847 election in whichPeelete and Repealer candidates increased their share of the vote and challengedthe two main parties in several constituencies. However, by 1885 conservativecandidates stopped contesting Irish constituencies and Nationalists began todominate the system. From this moment on, also, the Liberals underwent a steepprocess of territorial retrenchment.
31 Unopposed seats won by Radikale Venstre and Forhandlende Venstre have notbeen included in the graph.
32 Rokkan’s ‘third threshold of democratisation’ (1999: 254).33 A similar conclusion has been reached by Mair in his analysis of the national-
ization of electoral strategies in Ireland under STV (1987: 128). As also notedby Hanham (1959) in the British case, elections were not always general in thesense that, for a long time, local and constituency-level factors prevailed onnational competition.
34 Furthermore, Rokkan notes that PR leads to the abandonment of local client-eles; with plurality systems, marginal votes are useless if the constituency is safewhether the party wins or loses the seat, while with PR each vote counts andtherefore mobilization is encouraged in every single constituency (Rokkan, 1970:333 and 337).
35 Among the many analyses reaching this conclusion, see Lijphart (1994).36 The reasoning is the same with repeated-ballot formulas: parties must have a
strong chance of reaching the second ballot to present a candidate and this ispossible only for larger parties in a given constituency. There is no incentive topresent a candidate who has no chance of reaching the second ballot, sincerepresentation will not be secured.
37 More generally, this is true for all electoral systems – even majoritarian ones –based on multi-member constituencies. However, majoritarian systems werehistorically based on small constituencies in terms of magnitude, whereas PRsystems have always been based on much larger constituencies (if one exceptsSTV as a PR formula).
38 This is Sartori’s well-known hypothesis (1968), sometimes referred to as the‘strategy of the weak’, about the introduction of PR in terms of survival of theold parties facing the challenge of new mass-mobilization parties and preferringthe safety of their established positions of control in minority parties to the uncer-tainties of mergers (Rokkan, 1970: 88–90).
PA RT Y P O L I T I C S 9 ( 4 )
440
at Humboldt -University zu Berlin on August 18, 2011ppq.sagepub.comDownloaded from

39 Mostly Appenzell Inner-Rhoden and Obwalden (where the Catholics dominateup to the present with more than 85 percent of the vote), Appenzell Ausser-Rhoden (where the Radicals dominate), and Glarus (where social democrat andindependent candidates dominate). Only in 1939, exceptionally, was the numberof uncontested cantons nine.
40 Also in Ireland the constituency of Dublin University was uncontested until itwas abolished in 1937.
41 As Lipset and Rokkan wrote, ‘we consider the possibility that the parties them-selves produce their own alignments independently from the geographical, socialand cultural conditions of the movements’ (1967: 3).
42 In the American case, Schattschneider noted that ‘the party realignment of 1932is closely related to a deep change in the agenda of American politics’ (1960: 93).The high degree of territoriality of American politics dissipated because after1932 it became dominated by national rather than local questions. The Depres-sion and the New Deal had the effect of nationalizing political issues. Thisprocess was reinforced a decade later by international events focusing theattention of the entire nation: World War II and the beginning of the Cold War.
43 See my forthcoming volume on the formation of national electorates and partysystems, and on the progressive territorial homogenization of electoral behaviour(Caramani, 2003).
References
Bartolini, S. (1999) ‘Collusion, Competition and Democracy. Part I’, Journal ofTheoretical Politics 11: 435–70.
Bartolini, S. (2000) ‘Collusion, Competition and Democracy. Part II’, Journal ofTheoretical Politics 12: 33–65.
Caramani, D. (1996) ‘The Nationalisation of Electoral Politics. Conceptual Recon-struction and Review of the Literature’, West European Politics 19: 205–24.
Caramani, D. (2000) Elections in Western Europe since 1815. Electoral Results byConstituencies [supplemented with CD-ROM]. London and New York: Macmillan.
Caramani, D. (2003) The Nationalization of Politics. The Formation of NationalElectorates and Party Systems in Western Europe. Cambridge and New York:Cambridge University Press (forthcoming).
Claggett, W., W. Flanigan and N. Zingale (1984) ‘Nationalization of American Elec-torate’, American Political Science Review 78: 77–91.
Cornford, J. (1970) ‘Aggregate Election Data and British Party Alignments,1885–1910’, in E. Allardt and S. Rokkan (eds) Mass Politics: Studies in PoliticalSociology, pp. 107–16. New York: Free Press.
Craig, F. (1977) British Parliamentary Election Results 1832–85. London:Macmillan.
Downs, A. (1957) An Economic Theory of Democracy. New York: Harper and Row.Duverger, M. (1950) L’influence des systèmes électoraux sur la vie politique. Paris:
Presses de la Fondation Nationale des Sciences Politiques.Duverger, M. (1951) ‘The Influence of the Electoral System on Political Life’, Inter-
national Social Science Bulletin 3: 314–52. Hanham, H. (1959) Elections and Party Management. Politics in the Time of
Disraeli and Gladstone. London: Longmans.
C A R A M A N I : T H E E N D O F S I L E N T E L E C T I O N S
441
at Humboldt -University zu Berlin on August 18, 2011ppq.sagepub.comDownloaded from

Hotteling, H. (1929) ‘Stability in Competition’, The Economic Journal 39: 41–57.Key, V. Jr. (1964) Politics, Parties, and Pressure Groups, 5th edn. New York: Crowell.Lijphart, A. (1994) Electoral Systems and Party Systems. A Study of Twenty-Seven
Democracies, 1945–90. Oxford: Oxford University Press.Lipset, S. and S. Rokkan (1967) ‘Cleavage Structures, Party Systems, and Voter
Alignments. An Introduction’, in S. Lipset and S. Rokkan (eds) Party Systems andVoter Alignments. Cross-National Perspectives, pp. 1–64. New York: Free Press.
Mair, P. (1987) ‘Party Organization, Vote Management, and Candidate Selection:Toward the Nationalization of Electoral Strategy in Ireland’, in H. Penniman andB. Farrell (eds) Ireland at the Polls 1981, 1982, and 1987. A Study of Four GeneralElections, pp. 104–30. Washington, DC: American Enterprise Institute for PublicPolicy Research.
Panebianco, A. (1988) Political Parties: Organization and Power. Cambridge andNew York: Cambridge University Press.
Rokkan, S. (1970) Citizens, Elections, Parties. Oslo and New York: Universitets-forlaget – McKay.
Rokkan, S. (1999) ‘State Formation, Nation-Building, and Mass Politics in Europe’,in The Theory of Stein Rokkan, P. Flora et al. (eds). Oxford: Oxford UniversityPress.
Rose, R. and D. Urwin (1975) Regional Differentiation and Political Unity inWestern Nations. London and Beverly Hills: Sage Professional Papers in Contem-porary Political Sociology (06–007).
Sartori, G. (1968) ‘The Sociology of Parties: A Critical Review’, in D. Stammer (ed.)Party Systems, Party Organizations, and the Politics of the New Masses, pp. 1–25.Berlin: Institut für Politische Wissenschaft an der Freien Universität Berlin.
Sartori, G. (1976) Parties and Party Systems. A Framework for Analysis. Cambridge:Cambridge University Press.
Schattschneider, E. (1960) The Semisovereign People. A Realist’s View of Democracyin America. New York: Holt, Rinehart and Winston.
Schumpeter, J. (1954) Capitalism, Socialism and Democracy. London: Allen andUnwin.
Stokes, D. (1967) ‘Parties and the Nationalization of Electoral Forces’, in W.Chambers and W. Burnham (eds) The American Party Systems. Stages of PoliticalDevelopment, pp. 182–202. New York: Oxford University Press.
Sundquist, J. (1973) Dynamics of the Party System. Alignment and Realignment ofPolitical Parties in the United States. Washington DC: Brookings Institution.
Urwin, D. (1974) ‘Germany: Continuity and Change in Electoral Politics’, in R.Rose (ed.) Regional Differentiation and Political Unity in Western Nations’,pp. 107–70. London and Beverly Hills: Sage Professional Papers in ContemporaryPolitical Sociology (06–007).
Urwin, D. (1980) ‘Towards the Nationalisation of British Politics? The Party System,1885–1940’, in O. Büsch (ed.) Wählerbewegung in der europäische Geschichte,pp. 225–58. Berlin: Colloquium Verlag.
Urwin, D. (1982a) ‘Territorial Structures and Political Development in the UnitedKingdom’, in S. Rokkan and D. Urwin (eds) The Politics of Territorial Identity.Studies in European Regionalism, pp. 19–74. London: Sage.
Urwin, D. (1982b) ‘Germany: From Geopolitical Expression to Regional Accommo-dation’, in S. Rokkan and D. Urwin (eds) The Politics of Territorial Identity.Studies in European Regionalism, pp. 165–250. London: Sage.
PA RT Y P O L I T I C S 9 ( 4 )
442
at Humboldt -University zu Berlin on August 18, 2011ppq.sagepub.comDownloaded from

DANIELE CARAMANI is a professional fellow at the Mannheim Centre forEuropean Social Research (MZES, University of Mannheim). He holds a PhD fromthe European University Institute, and has taught at the universities of Geneva andFlorence. In 2000–02 he was ‘Vincent Wright Fellow in Comparative Politics’ at theRobert Schuman Centre for Advanced Studies. Recent work includes Elections inWestern Europe since 1815. Electoral Results by Constituencies (London and NewYork, Macmillan, 2000 [supplemented with CD-ROM]); and The Nationalization ofPolitics (Cambridge and New York: Cambridge University Press, 2003 (forthcoming)).ADDRESS: Mannheim Centre for European Social Research (MZES), University ofMannheim, L7, 1, 68161 Mannheim, Germany. [email: [email protected]]
Paper submitted 18 April 2002; accepted for publication 8 November 2002.
C A R A M A N I : T H E E N D O F S I L E N T E L E C T I O N S
443
at Humboldt -University zu Berlin on August 18, 2011ppq.sagepub.comDownloaded from