end-of-waste criteria for waste plastic...
TRANSCRIPT

END-OF-WASTE CRITERIA FOR WASTE PLASTIC FOR CONVERSION
TECHNICAL PROPOSALS
FIRST WORKING DOCUMENT NOVEMBER 2011
IPTS
SEVILLA, SPAIN


1
TABLE OF CONTENTS Table of contents ........................................................................................................................ 1 1 Introduction ........................................................................................................................ 3
1.1 Background ................................................................................................................ 3 1.2 Objectives................................................................................................................... 4 1.3 Scope definition.......................................................................................................... 5 1.4 Structure of this document ......................................................................................... 7
2 Background information on plastics, waste plastic reclamation and recycling ................. 9 2.1 Plastics: general description and characteristics ........................................................ 9
2.1.1 Production .......................................................................................................... 9 2.1.2 Waste plastic .................................................................................................... 13 2.1.3 Waste plastic characterisation .......................................................................... 17
2.2 Waste plastic management ....................................................................................... 18 2.2.1 Generation of post-consumer plastic by source ............................................... 22 2.2.2 Trends of waste plastic generation by polymer type and application .............. 31 2.2.3 Overall mass balance........................................................................................ 32
2.3 Waste plastic reprocessing and recycling................................................................. 38 2.3.1 Reprocessing .................................................................................................... 39 2.3.2 Collection ......................................................................................................... 39 2.3.3 Sorting .............................................................................................................. 41 2.3.4 Removal of contaminants................................................................................. 42 2.3.5 Cleaning ........................................................................................................... 42 2.3.6 Recycling.......................................................................................................... 43
2.4 Uses of recycled waste plastics ................................................................................ 49 2.5 Structure of the reprocessing industry...................................................................... 52
2.5.1 Collection and sorting ...................................................................................... 53 2.5.2 Examples of plastics recycling market structure in some Member States ....... 58 2.5.3 Additional considerations on competitiveness of the market........................... 60
2.6 Economic and market aspects of plastic recycling................................................... 62 2.6.1 Costs of plastic recycling ................................................................................. 62 2.6.2 Costs of regulatory compliance and administrative work................................ 65 2.6.3 Prices ................................................................................................................ 66
2.7 Market size and future potential............................................................................... 75 2.7.1 Nature of the supply ......................................................................................... 75 2.7.2 Main suppliers and main users ......................................................................... 76 2.7.3 Strong demand from China .............................................................................. 76 2.7.4 Composition of traded plastic .......................................................................... 77 2.7.5 Plastic type market differences ........................................................................ 78
2.8 Technical specifications and standards .................................................................... 79 2.8.1 Overview of existing standards ........................................................................ 79 2.8.2 Control of quality ............................................................................................. 91 2.8.3 Standards for recycled plastics, and for end uses............................................. 93
2.9 Legislation and regulation........................................................................................ 98 2.9.1 Packaging Directive ......................................................................................... 98 2.9.2 Waste shipment regulation - WSR................................................................... 99 2.9.3 WEEE............................................................................................................. 102 2.9.4 ELV ................................................................................................................ 103 2.9.5 ROHS ............................................................................................................. 103 2.9.6 REACH .......................................................................................................... 104
2
2.9.7 Plastics intended for food contact applications .............................................. 107 2.9.8 By-products .................................................................................................... 109 2.9.9 Other regulatory elements in trade ................................................................. 110 2.9.10 VAT................................................................................................................ 111
2.10 Environmental and health issues ............................................................................ 111 3 End-of-waste criteria ...................................................................................................... 117
3.1.1 Outline of EoW criteria .................................................................................. 119 3.2 Product quality requirements ................................................................................. 119
3.2.1 Content of contaminants: non-plastic components and non-targeted plastics120 3.3 Requirements on input materials............................................................................ 125
3.3.1 Restriction of sources ..................................................................................... 126 3.4 Requirements on treatment processes and techniques ........................................... 128 3.5 Requirements on the provision of information ...................................................... 131 3.6 Requirements on quality assurance procedures (quality management) ................. 134 3.7 Application of end-of-waste criteria ...................................................................... 138
4 Description of Impacts ................................................................................................... 141 4.1 Environmental and health impacts ......................................................................... 141 4.2 Market impacts....................................................................................................... 141 4.3 Legislative impact .................................................................................................. 141
5 References ...................................................................................................................... 143 6 Glossary.......................................................................................................................... 145 7 Acronyms ....................................................................................................................... 151 8 Annex I. Characterisation of recycled plastics in EN standards .................................... 153 9 Annex II. CONSIDERATIONS ON PRODUCT QUALITY CRITERIA .................... 156 10 Annex III: national classification for recovered plastics in france............................. 162 11 Annex IV: Original application categories used for the classification in PAS-103... 164 12 Annex V: Typologies of plastic waste in Germany ................................................... 166
3
1 INTRODUCTION
1.1 Background The new Waste Framework Directive (2008/98/EC, in the following referred to as ‘the Directive’ or WFD) among other amendments introduces a procedure for defining end-of-waste (EoW) criteria, which are criteria that a given waste stream has to fulfil in order to cease to be waste. Waste streams that are candidates for the EoW procedure must have undergone a recovery operation, and comply with a set of specific criteria. The actual shape of such criteria is to be defined specifically for each waste stream, but Article 6 of the WFD defines the general conditions that a waste material has to follow, in the following terms: ‘certain specified waste shall cease to be waste [within the meaning of point (1) of Article 3] when it has undergone a recovery, including recycling, operation and complies with specific criteria to be developed in accordance with the following conditions: (a) The substance or object is commonly used for a specific purpose; (b) A market or demand exists for such a substance or object; (c) The substance or object fulfils the technical requirements for the specific purpose referred to in (a) and meets the existing legislation and standards applicable to products; and (d) The use of the substance or object will not lead to overall adverse environmental or human health impacts.’ Moreover, Articles 6(2) and 39(2) of the Directive specify the political process of decision-making for the criteria on each end-of-waste stream, in this case a Comitology procedure1 with Council and Parliament scrutiny. As input to this decision-making process in Comitology, the European Commission prepares proposals for end-of-waste criteria for a number of specific waste streams, including waste plastic. The expected outputs of this process are legal texts (likely Regulations) on end-of-waste for the concerned streams. A methodology guideline2 to develop end-of-waste criteria has been elaborated by the Joint Research Centre's Institute for Prospective Technological Studies (JRC-IPTS) as part of the so-called ‘End-of-Waste Criteria’ report. The European Commission is currently working on preparing proposals for end-of-waste criteria for specific waste streams according to the legal conditions and following the JRC methodology guidelines. As part of this work, the IPTS prepares separate studies with technical information that will support each of the proposals for end-of-waste criteria. Besides describing the criteria, these studies include all the background information necessary for ensuring conformity with the conditions of Article 6 of the Directive.
1 The progress of the Comitology processes on the WFD can be followed at: http://ec.europa.eu/transparency/regcomitology/index_en.htm 2 End-of-waste documents from the JRC-IPTS are available from http://susproc.jrc.ec.europa.eu/activities/waste/. See in particular the operational procedure guidelines of Figure 5 in the "End-of-Waste Criteria" report.

4
For each waste stream, the technical studies are developed based on the contributions from stakeholders, by means of a Technical Working Group. The Technical Working Group on waste plastic is composed of experts from Member States administration, industry, NGOs and academia. The experts of the group are expected to contribute with data, information or comments to draft versions of this report, and through participation in two expert workshops organised by the IPTS. The first workshop is to be held 22 November 2011.
1.2 Objectives The objective of this report is to present in a structured way the type of information needed for the development of end-of-waste criteria for waste plastic. It also sketches the possible structure and content of criteria for waste plastic. The content of this report, and in particular a number of highlighted questions, will be discussed at the first workshop of 22 November 2011. A later version of this report will incorporate the contributions from experts of the Technical Working Group. The reviewed report is to include an updated version of the background data, including a comprehensive techno-economic analysis of waste plastic recycling, and analyses of the potential economic, environmental and legal impacts when waste plastic ceases to be waste. These update data will be used as the basis for defining the technical requirements that waste plastic has to fulfil in order to cease to be waste in the EU, in conformity with Article 6 of the WFD, and for supporting proposals of end-of-waste criteria. Terminology note In this report, the term waste plastic is used as a generic term referring to plastic from industrial or household origin which is collected, sorted, cleaned and in general reclaimed and processed for conversion. Conversion is understood as the transformation of plastic material into finished and semi-finished plastic products. Other related terms in use in the industry to define one or more waste plastic types are recovered plastic, plastic scrap, plastic recyclate, and in particular in CEN standards, recycled plastic and plastic waste. Most often, the term plastic scrap relates to pre-consumer waste plastic, although the term can sometimes also be seen encompassing post-consumer waste, e.g. in ISRI Scrap specification circular. The choice of the term waste plastic is made for practical reasons in this report, and does not bear any implicit judgment about the value or shape of the plastic material. When reading waste plastic, one should bear in mind that alternative terms may also be currently used in trade, customs, or industry. By the provision of appropriate definitions and complementary recitals, a legal text on end of waste could make use of a different term than the one used in this report.

5
Question 1 Comments on the suitability, acceptance and day-to-day use of the term waste plastic would be appreciated from the experts, as there seems to be a wide range of available options. Could the terms plastic scrap or plastic recyclate which seem more neutral, be used instead? Are the terms polymer and resin of frequent use in the recycled plastic industry, or are these terms normally reserved for the virgin materials?
1.3 Scope definition Potential for energy recovery of waste plastic - restriction of scope to recycling The scope of this document and the proposals of end-of-waste criteria included in it refer to waste plastic for conversion, i.e. waste plastic that is reprocessed into a ready input for re-melting in the production of plastic articles. Plastic conversion is understood as the transformation of raw plastic materials in granular or powder form by application of processes involving pressure, heat and/or chemistry, into finished or semi-finished products for the industry and end-users. The use of waste plastic that has ceased to be waste in non-recycling recovery operations such as energy recovery, backfilling purposes, or filter material are not part of the scope of the end-of-waste criteria here presented. Feedstock (chemical) recycling is also excluded from the scope3. Despite being also a recycling operation, this route has currently very limited volumes and geographical spread in the EU, only ca. 50.000 tonnes are treated yearly, compared to >5Mt for mechanical recycling (conversion). In addition, as is discussed in the report, the acceptance criteria of contamination for feedstock recycling is different than for mechanical recycling, as the nature and amount of materials that these two recycling options can handle are widely different. End-of-waste criteria shall be designed as to not alter the practice, technology development and markets of these other uses different from recycling into new plastic articles. Such alternative uses may continue to utilise waste plastic regulated under waste law. In other words, waste plastic that meets end-of-waste criteria can also be sold for these non-recycling uses, but in doing so, the material will not cease top be waste. A detailed explanation of the rationale for this limitation of scope is provided in the following. In the EU, several waste plastic fractions are for a number of reasons not appropriate for plastic recycling processes. This can be either because the polymer type does not allow
3 The inclusion or exclusion of feedstock recycling in the scope of these EoW proposals are further discussed in Section 2.3.6.2. .
6
recycling, because of a high content of non-plastic components, or because of a high content of other plastic types the mixture of which would spoil the properties of the end plastic product. Fractions that do not find a way into plastic recycling have other possible outlets in the EU, most notably: Feedstock recycling into energy products. Energy use of waste plastic in incineration plants (normally without intermediate
treatment). Energy use of waste plastic in cement plants (sometimes with shredding or other size
homogenisation treatment). Recycling for other purposes than the processing into plastic articles, e.g: use for
insulation purposes, sometimes with the addition of chemicals such as fire retardants, fungal resistance chemicals, or binding chemicals.
Use as filler material, or for filtering purposes (sometimes with shredding or other size homogenisation treatment).
Disposal in landfills. Waste plastic not currently used for recycling is normally a heterogeneous material, both as regards polymer types and non-plastic material content. Of a total annual generation of plastics in the EU in 2008 of ca. 50 Mt, only about a half (24.9Mt) was collected in the same year as post-consumer waste from households and commerce. The remaining amount is explained as the trade balance (more exports than imports, as the EUs domestic consumption was ca. 40Mt), and the accumulation of stocks of durable materials that did not arise as waste in the same year. Of the 24.9 Mt collected for waste management in 2008, about a half (12.1Mt) was disposed of via landfills and incineration without energy recovery, and the other half was evenly distributed between recycling (5.3 Mt) and energy recovery (7.5 Mt) as part of MSW or more targeted forms such as RDF, or plastic rejects from other industry (e.g. paper mills pulp rejects)4. Of the amount sent for energy recovery, ca. 10% were incinerated in cement kilns5, i.e. some 800.000 tonnes. In cement kilns, this waste plastic was used as energy source and clinker additive. The most important reason for not including energy recovery, feedstock recycling, and non-remelting recycling as part of the currently developed EoW criteria is that the technical requirements, the legislation and the standards that would apply for waste plastic destined to feedstock and non-remelting recycling or energy would be both conceptually and in the details totally different from those that apply for remelting recycling. Mechanical recycling involves processing of the waste plastic polymers into a new product that can only be made of such polymers. In contrast, incineration is a chemical reaction of substitution of other fuels, and non-remelting recycling purposes look for totally different properties (calorific value, 4 Eurostat 2008 data, Plastics Europe 2008 data. 5 In 2008 the EU27, ca. 27.3 PJ/yr were used for this purpose (about 0.8 Mt tonnes assuming conservatively an average calorific value in waste plastics of 30MJ/kg). Cembureau, pers. comm. Inneke Claes, Cembureau, Brussels, February 2009/October 2011.

7
insulation, density, volume) than melting purposes (type and quality of polymer, presence and type of non-plastic components). Feedstock recycling acceptance criteria of e.g. contamination is much more lenient than mechanical recycling, as the nature of the process allows handling with these impurities. Following this logic, international standards (e.g. CEN, ISO) for waste plastic have little in common with standards or technical specifications for solid recovered fuels. Different types of pollutants are of concern in each case. The quality criteria, containing limit values and impurity thresholds, would be essentially different, and it would be a wrong approach to attempt to merge all limit values for the sole purpose of creating a set of EoW criteria encompassing all uses of waste plastic. Another argument supporting the limitation of scope presented is the avoidance of conflict with existing legislation promoting recycling, both at EU level and national or regional level. The packaging waste Directive (94/62/EC amended by 2004/12/EC and 2005/20/EC including extended deadlines for new Member States) sets targets for the recycling of a number of recyclable packaging materials, including plastics. In case the criteria on EoW was not limited to recycling, part of plastic packaging may be diverted as EoW to non-recycling uses, and this may create additional difficulties in the achievement of the recycling targets agreed by Member States under the packaging directive. Some Member States or regions have additional prescriptions under waste law to avoid the incineration of recyclable material e.g. Flanders, Denmark, and Netherlands. These prescriptions would not apply to material that is not any more waste. By limiting the scope of end-of-waste to plastics recycling, this loophole is avoided. In a parallel study, the IPTS is assessing the extent to which materials derived from waste (e.g. RDF, waste plastic fuels) fulfil the conditions of Art 6 of the WFD, and could be candidates for developing end-of-waste criteria in the future. The results of this study are expected in 2012. Reusable plastic products Plastic is used widely in packaging applications, in both flexible and rigid forms. Some of these forms are reusable, predominantly in the rigid applications such as crate, pallets, trays and refillable bottles for beverages. In such cases, and when return systems are provided, the used products still have a value for their functionality as products and not only because of the value of the polymer material (PE, PET, etc..) that they contain. Used, but reusable products are thus not waste. One of the pre-conditions for a waste material for ceasing to be waste is indeed that it is waste and it has undergone a waste recovery operation. Not being waste in the first place, used reusable products are thus not part of the scope of this report.
1.4 Structure of this document This document consists of three clearly differentiated chapters. The first part of the study (Chapter 2) presents an overview of waste plastic, its composition, the types and sources of scrap, its processing, grading and recycling. The chapter contains information on the fulfilment of the four conditions set out in Art. 6 of the Directive, namely the existence of a market demand and a specific use for waste plastic, the identification of health and environmental impacts that may result from a change of status, the conditions for conformity with standards and quality requirements, and the legislative framework of waste
8
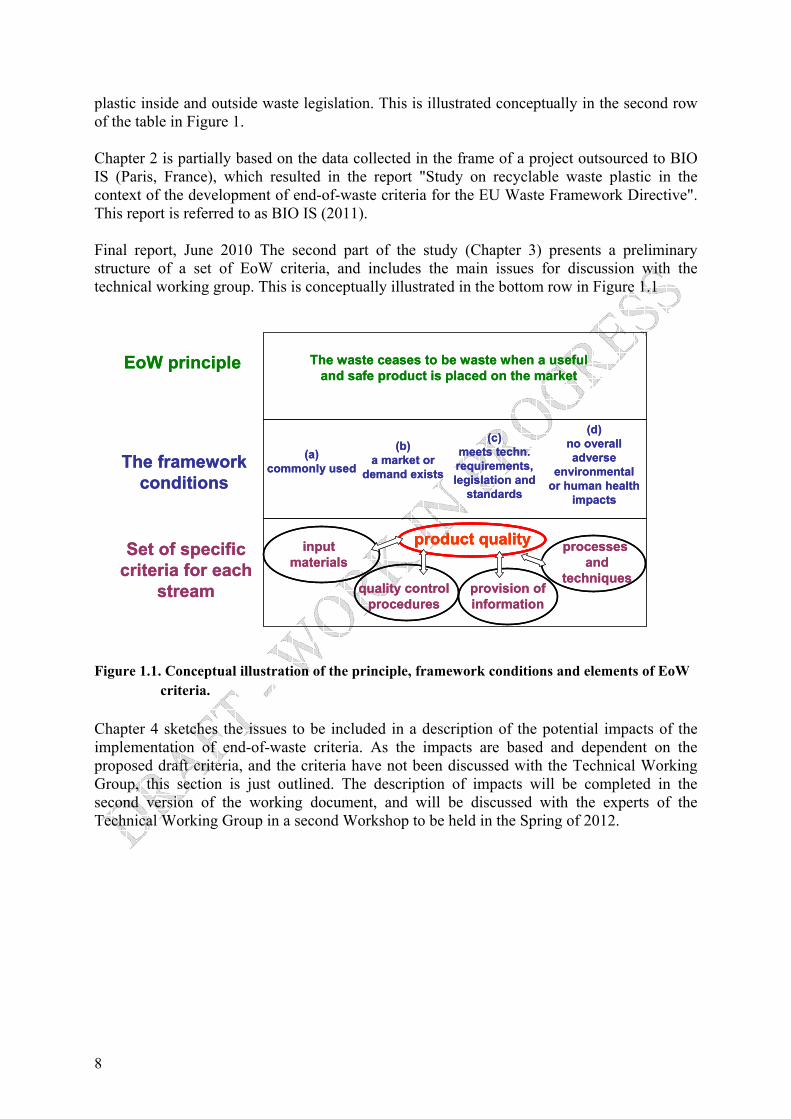
plastic inside and outside waste legislation. This is illustrated conceptually in the second row of the table in Figure 1. Chapter 2 is partially based on the data collected in the frame of a project outsourced to BIO IS (Paris, France), which resulted in the report "Study on recyclable waste plastic in the context of the development of end-of-waste criteria for the EU Waste Framework Directive". This report is referred to as BIO IS (2011). Final report, June 2010 The second part of the study (Chapter 3) presents a preliminary structure of a set of EoW criteria, and includes the main issues for discussion with the technical working group. This is conceptually illustrated in the bottom row in Figure 1.1
(a)commonly used
(b)a market or
demand exists
(c)meets techn. requirements, legislation and
standards
(d)no overall adverse
environmental or human health
impacts
The framework conditions
Set of specific criteria for each
stream
The waste ceases to be waste when a useful and safe product is placed on the market
EoW principle
product qualityinput materials
processesand
techniquesquality control
proceduresprovision of information
(a)commonly used
(b)a market or
demand exists
(c)meets techn. requirements, legislation and
standards
(d)no overall adverse
environmental or human health
impacts
The framework conditions
Set of specific criteria for each
stream
The waste ceases to be waste when a useful and safe product is placed on the market
EoW principle
product qualityproduct qualityinput materials
processesand
techniquesquality control
proceduresprovision of information
Figure 1.1. Conceptual illustration of the principle, framework conditions and elements of EoW criteria.
Chapter 4 sketches the issues to be included in a description of the potential impacts of the implementation of end-of-waste criteria. As the impacts are based and dependent on the proposed draft criteria, and the criteria have not been discussed with the Technical Working Group, this section is just outlined. The description of impacts will be completed in the second version of the working document, and will be discussed with the experts of the Technical Working Group in a second Workshop to be held in the Spring of 2012.

9
2 BACKGROUND INFORMATION ON PLASTICS, WASTE PLASTIC RECLAMATION AND RECYCLING
2.1 Plastics: general description and characteristics A plastic material is an organic solid, essentially a polymer of high molecular mass. A polymer is a chain of several thousand of repeating molecular units of monomers. The monomers of plastic are either natural or synthetic organic compounds. Plastics can be classified by chemical structure, i.e. by the main monomer of the polymer's backbone and side chains. Some important groups in these classifications are the acrylics, polyesters, silicones, polyurethanes, and halogenated plastics. Plastics can also be classified by the chemical process used in their synthesis, such as condensation, and cross-linking. Other classifications are based on properties that are relevant for manufacturing or product design, e.g. thermoplasticity, biodegradability, electrical conductivity, density, or resistance to various chemical products. The vast majority of plastics are composed of polymers of carbon and hydrogen alone or with oxygen, nitrogen, chlorine or sulphur in the backbone. Plastics often contain additives to improve specific properties, e.g. hardness, softness, UV resistance, flame formation resistance. Most plastics characterise by their malleability or plasticity during manufacture, that allows them to be cast, pressed, or extruded into a variety of shapes such as films, tubes, bottles, fibres, plates, or boxes. Due to their relatively low cost, ease of manufacture, versatility, low density, and low water permeability, plastics are used in an enormous range of products. They compete many traditional materials, such as wood, stone, metals, paper, glass, or ceramics.
2.1.1 Production The production of polymers involves a series of steps in which the raw materials are progressively processed to produce formulated polymeric materials to meet the specific requirements of the wide range of end applications. As an example the primary raw material, oil, gas, etc., is initially 'cracked' in a petrochemical process producing a range of products from which naphtha6 is passed to the next stage of monomer production. The monomer is then converted to the desired grade of polymer as determined by the application needs of the converted product. Formulations are achieved as part of the polymerisation and granulation process, and/or through separate compounding operations
6 Naphta is a group of liquid hydrocarbons encompassing the lightest and most volatile fractions in petroleum. Naphtha is a colourless to reddish-brown aromatic liquid, very similar to gasoline, and boiling between 30 °C and 200 °C.
10
where polymers and/or additives (such as colours, plasticizers, impact modifiers etc.) are blended to meet the specific application requirements. Almost all plastics are currently derived from fossil sources, mainly oil and gas. Only 0.1-0.2% is derived from renewable organic sources such as starch, corn or sugar. 2.1.1.1 Conversion
Plastic articles are produced from the polymer, usually in powder, granulate, pellet or flake form, by a range of different processes, generally termed as conversion. For example, rigid packaging such as bottles and drums use a moulding process where an extruded length of tube is inflated whilst still above its softening point into a mould which forms the shape/size of the container. Conversely, flexible packaging film is produced by extrusion techniques, such as casting, blowing or callendering depending on the material and the thickness. The films are then usually printed with product (content) data and may also be laminated to other plastic films or non plastic materials. The opportunity to use recycled polymers as substitutes of virgin polymers is very much influenced, and limited, by the end-use application. Transparent plastic products need the use of transparent resins. However, transparent recycled resins are difficult to obtain from mixed colour input, and in order to avoid colour contamination they often require the set-up of closed loops of collection of e.g. beverage bottles of the same type. Applications that involve direct contact with foodstuffs meet also limitations as to the origin of the recycled input, for safety and health reasons. 2.1.1.2 Main figures of generation and use of plastics in the EU
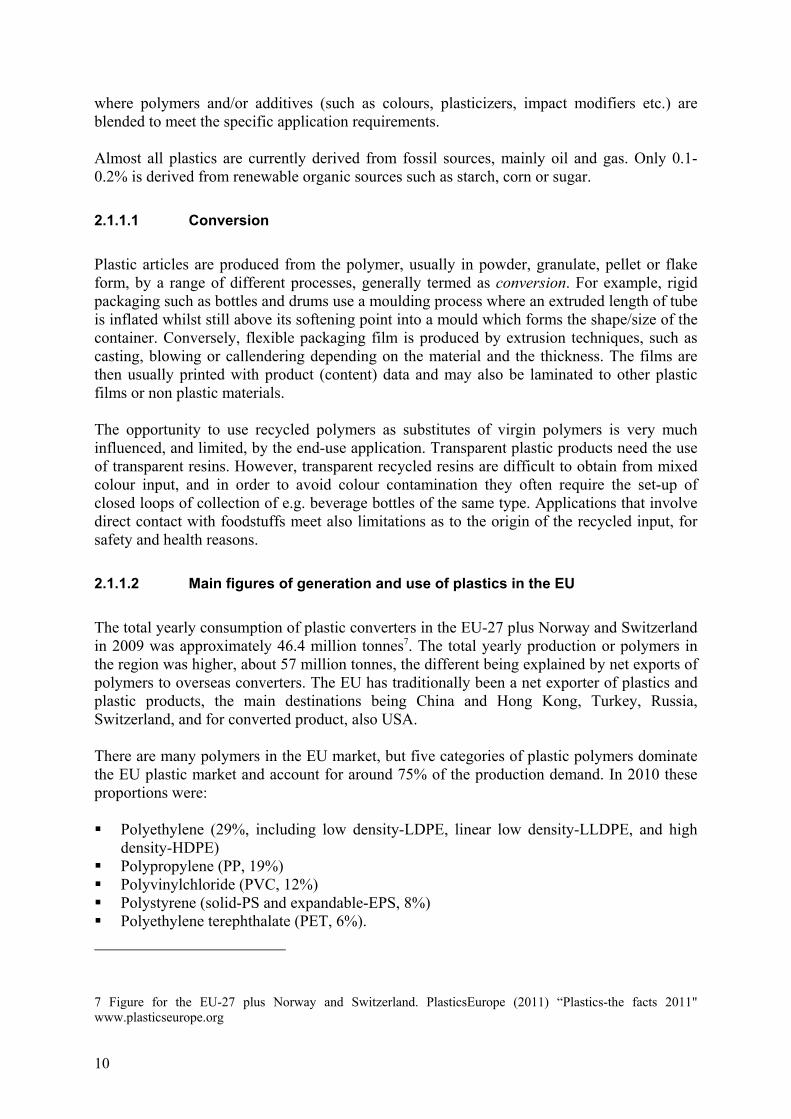
The total yearly consumption of plastic converters in the EU-27 plus Norway and Switzerland in 2009 was approximately 46.4 million tonnes7. The total yearly production or polymers in the region was higher, about 57 million tonnes, the different being explained by net exports of polymers to overseas converters. The EU has traditionally been a net exporter of plastics and plastic products, the main destinations being China and Hong Kong, Turkey, Russia, Switzerland, and for converted product, also USA. There are many polymers in the EU market, but five categories of plastic polymers dominate the EU plastic market and account for around 75% of the production demand. In 2010 these proportions were: Polyethylene (29%, including low density-LDPE, linear low density-LLDPE, and high
density-HDPE) Polypropylene (PP, 19%) Polyvinylchloride (PVC, 12%) Polystyrene (solid-PS and expandable-EPS, 8%) Polyethylene terephthalate (PET, 6%).
7 Figure for the EU-27 plus Norway and Switzerland. PlasticsEurope (2011) “Plastics-the facts 2011" www.plasticseurope.org
11
Figure 2.1. Demand by industry of different plastics in the EU27+NO+CH in 2008, by plastic type. Source: PlasticsEurope et al. 2011.
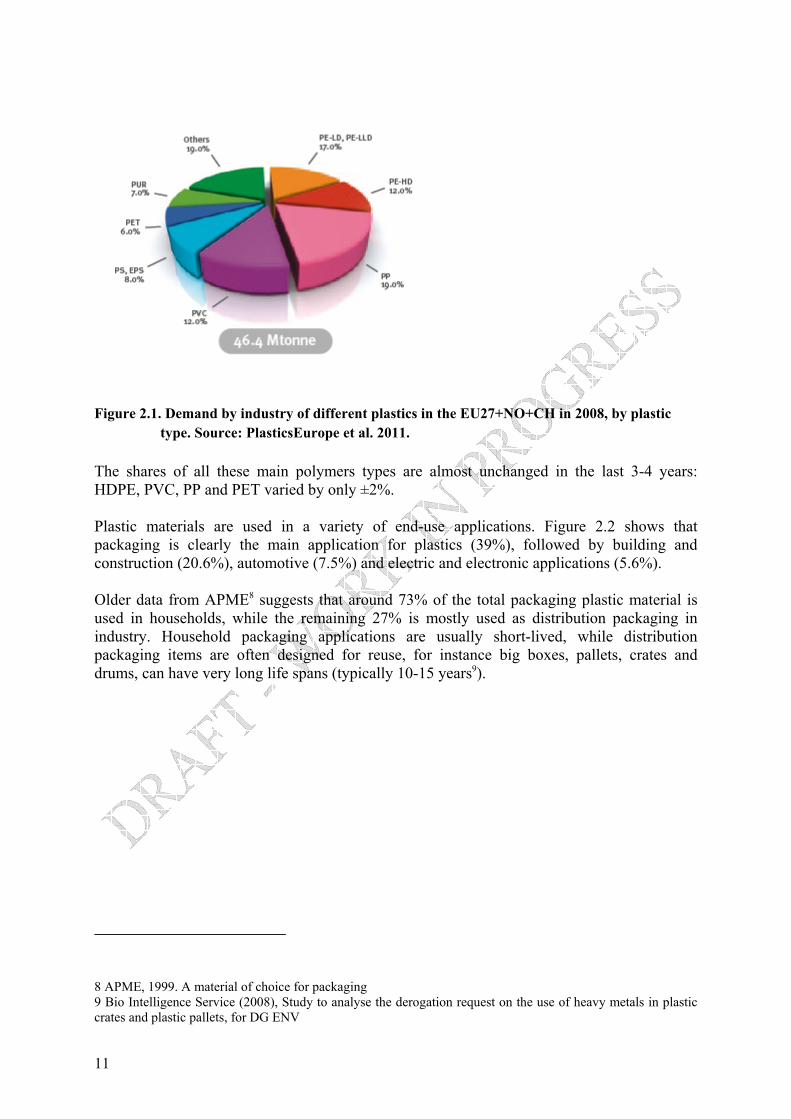
The shares of all these main polymers types are almost unchanged in the last 3-4 years: HDPE, PVC, PP and PET varied by only ±2%. Plastic materials are used in a variety of end-use applications. Figure 2.2 shows that packaging is clearly the main application for plastics (39%), followed by building and construction (20.6%), automotive (7.5%) and electric and electronic applications (5.6%). Older data from APME8 suggests that around 73% of the total packaging plastic material is used in households, while the remaining 27% is mostly used as distribution packaging in industry. Household packaging applications are usually short-lived, while distribution packaging items are often designed for reuse, for instance big boxes, pallets, crates and drums, can have very long life spans (typically 10-15 years9).
8 APME, 1999. A material of choice for packaging 9 Bio Intelligence Service (2008), Study to analyse the derogation request on the use of heavy metals in plastic crates and plastic pallets, for DG ENV
12
Figure 2.2. Demand by industry of different plastics in the EU27+NO+CH in 2010, by end-use sector. Source: PlasticsEurope et al. 2011.
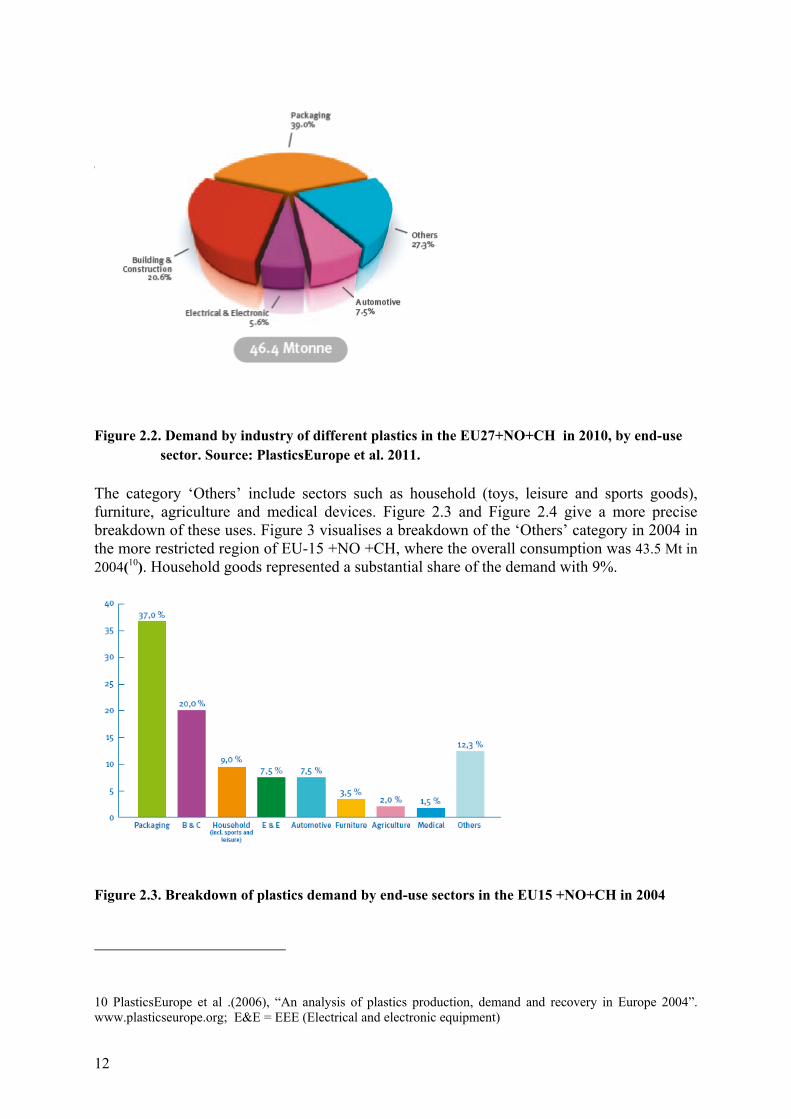
The category ‘Others’ include sectors such as household (toys, leisure and sports goods), furniture, agriculture and medical devices. Figure 2.3 and Figure 2.4 give a more precise breakdown of these uses. Figure 3 visualises a breakdown of the ‘Others’ category in 2004 in the more restricted region of EU-15 +NO +CH, where the overall consumption was 43.5 Mt in 2004(10). Household goods represented a substantial share of the demand with 9%.
Figure 2.3. Breakdown of plastics demand by end-use sectors in the EU15 +NO+CH in 2004
10 PlasticsEurope et al .(2006), “An analysis of plastics production, demand and recovery in Europe 2004”. www.plasticseurope.org; E&E = EEE (Electrical and electronic equipment)
13
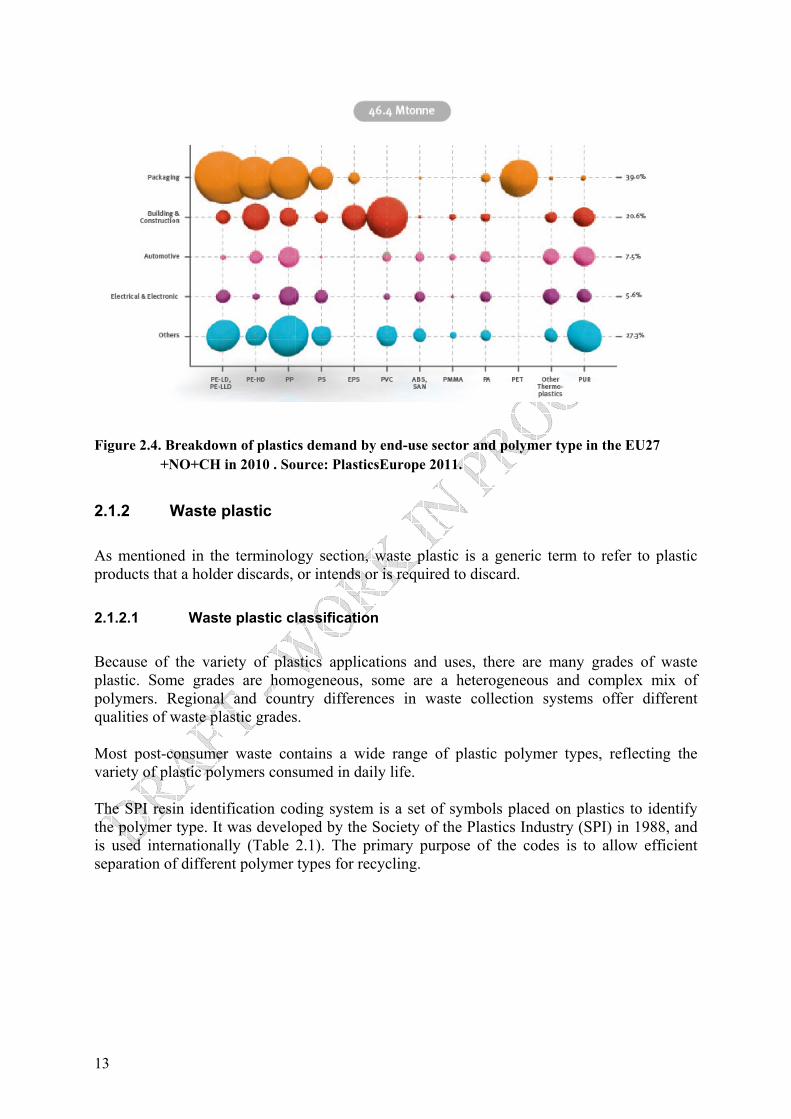
Figure 2.4. Breakdown of plastics demand by end-use sector and polymer type in the EU27 +NO+CH in 2010 . Source: PlasticsEurope 2011.
2.1.2 Waste plastic As mentioned in the terminology section, waste plastic is a generic term to refer to plastic products that a holder discards, or intends or is required to discard. 2.1.2.1 Waste plastic classification
Because of the variety of plastics applications and uses, there are many grades of waste plastic. Some grades are homogeneous, some are a heterogeneous and complex mix of polymers. Regional and country differences in waste collection systems offer different qualities of waste plastic grades. Most post-consumer waste contains a wide range of plastic polymer types, reflecting the variety of plastic polymers consumed in daily life. The SPI resin identification coding system is a set of symbols placed on plastics to identify the polymer type. It was developed by the Society of the Plastics Industry (SPI) in 1988, and is used internationally (Table 2.1). The primary purpose of the codes is to allow efficient separation of different polymer types for recycling.

14
Table 2.1. Main used polymers. Adapted from (ACC, 2011) Polymer name and image
Properties Uses
Polyethylene terephthalate (PETE, PET)
• Clear and optically smooth surfaces for oriented films and bottles • Excellent barrier to oxygen, water, and carbon dioxide • High impact capability and shatter resistance • Excellent resistance to most solvents • Capability for hot-filling
PET is clear, tough, and has good gas and moisture barrier properties. This resin is commonly used in beverage bottles and many injection-moulded consumer product containers. Cleaned, recycled PET flakes and pellets are in great demand for spinning fibre for carpet yarns, producing fiberfill and geo-textiles. Nickname: Polyester.
High-density polyethylene (HDPE)
• Excellent resistance to most solvents • Higher tensile strength compared to other forms of polyethylene • Relatively stiff material with useful temperature capabilities
HDPE is used to make many types of bottles. Unpigmented bottles are translucent, have good barrier properties and stiffness, and are well suited to packaging products with a short shelf life such as milk. Because HDPE has good chemical resistance, it is used for packaging many household and industrial chemicals such as detergents and bleach. Pigmented HDPE bottles have better stress crack resistance than unpigmented HDPE
Polyvinyl chloride (PVC or V)
• High impact strength, brilliant clarity, excellent processing performance • Resistance to grease, oil and chemicals
Pipe, fencing, shower curtains, lawn chairs, non-food bottles and children's toys. In addition to its stable physical properties, PVC has good chemical resistance, weatherability, flow characteristics and stable electrical properties. The diverse slate of vinyl products can be broadly divided into rigid and flexible materials.
Low density polyethylene (LDPE) Includes Linear Low Density Polyethylene (LLDPE).
• Excellent resistance to acids, bases and vegetable oils • Toughness, flexibility and relative transparency (good combination of properties for packaging applications requiring heat-sealing)
LDPE is used predominately in film applications due to its toughness, flexibility and relative transparency, making it popular for use in applications where heat sealing is necessary. LDPE also is used to manufacture some flexible lids and bottles as well as in wire and cable applications. Plastic bags, 6 pack rings, various containers, dispensing bottles, wash bottles, tubing, and various moulded laboratory equipment
Polypropylene (PP)
• Excellent optical clarity in biaxially oriented films and stretch blow moulded containers • Low moisture vapour transmission • Inertness towards acids, alkalis and most solvents
PP has good chemical resistance, is strong, and has a high melting point making it good for hot-fill liquids. This resin is found in flexible and rigid packaging, fibers, and large molded parts for automotive and consumer products. Auto parts, industrial fibres, food containers, and dishware

15
Polymer name and image
Properties Uses
Polystyrene (PS)
•Excellent moisture barrier for short shelf life products • Excellent optical clarity in general purpose form • Significant stiffness in both foamed and rigid forms. • Low density and high stiffness in foamed applications • Low thermal conductivity and excellent insulation properties in foamed form
PS is a versatile plastic that can be rigid or foamed. General purpose polystyrene is clear, hard and brittle. It has a relatively low melting point. Typical applications include protective packaging, foodservice packaging, bottles, and food containers. PS is often combined with rubber to make high impact polystyrene (HIPS) which is used for packaging and durable applications requiring toughness, but not clarity. Desk accessories, cafeteria trays, plastic utensils, toys, video cassettes and cases, clamshell containers, packaging peanuts, and insulation board and other expanded polystyrene products (e.g., Styrofoam)
Other plastics, including acrylic, fiberglass, nylon, polycarbonate, and polylactic acid, and multilayer combinations of different plastics
• Dependent on resin or combination of resins
Use of this code indicates that a package is made with a resin other than the six listed above, or is made of more than one resin and used in a multi-layer combination.
Figure 2.5 displays the different types of plastic polymers found in EU-15 waste plastic in 2004. The main five plastic polymers found in waste (PE, PET, PP, PS, and PVC) are also the polymers consumed in largest amounts (see Figure 2.1), with slightly different shares explained by the different efficiency of collection of the different plastic products, and the different lifetimes of the products. PE polymers (LLDPE, LDPE and HDPE) are overall the most abundant polymers in waste plastic because of their predominance in packaging applications11, which account for more than half the total waste plastic.
11 JRC, IPTS, “Assessment of the Environmental Advantages and Disadvantages of polymer recovery processes”, 2007

16
PE (LLDPE, LDPE, HDPE)32%
PP15%PU,PS
16%
PVC14%
Other (PET, ABS, SAN, PMMA, PA,
PC, ETP, PUR)23%
Figure 2.5. Plastic waste composition, EU-15 +NO +CH, 200412 A distinction is sometimes made regarding the industrial or consumer origin of the waste plastic. This distinction is important because some of the industrial streams are normally not regarded as waste, while most post-consumer and some industrial waste plastic is considered and classified as waste. The following terms are used: Internal waste plastic is composed of defective products detected and rejected by a quality control process during the industrial process of plastics manufacturing, transition phases of product changes (such as thickness and colour changes) and production off-cuts. These materials are often immediately absorbed by the respective industrial process as a raw material for a new manufacturing operation, not leaving the plastics manufacturing plant. Internal waste plastic is most often not registered as waste. External waste plastic is waste plastic that is collected and/or reprocessed with the purpose of recycling. External waste plastic can be of two types: (1) pre-consumer, also called post-industrial waste plastic, and (2) post-consumer waste plastic.
(1) Pre-consumer waste plastic is scrap resulting from the manufacturing of products that contain plastic as one of their components, and which leaves the specific facility where it was generated, often for recycling. This stream can currently be classified as waste by some authorities, and as non-waste by others (normally under the denomination by-product, which in some countries/regions is dealt with within waste legislation, and in others out of waste legislation). It can also be called post-industrial waste plastic. (2) Post-consumer waste plastic is a waste material originated after the use of plastic products at the consumer market. This stream is always classified as waste.
The development of end-of-waste criteria for waste plastic refers only to material that is waste, and therefore most often refers to external waste plastic. If internal waste is classified as waste, then it is also under the scope of end-of-waste. The main sources of post-consumer waste plastic are: Municipal solid waste (from household and commercial waste collection) Construction and demolition waste (C&D)
12 ACRR, Good practices guide on waste plastics recycling a guide by and for local and regional authorities
17
End-of-life vehicles (ELV) Waste from electric and electronic equipment (WEEE)
By nature, pre-consumer waste plastic is on average more homogeneous, and often may need little treatment other than size reduction, or no treatment at all. Waste plastic from post-consumer origins will almost always need different degrees of sorting, collection and treatment.
2.1.3 Waste plastic characterisation Standards EN 153-42(PS)/-44(PE)/-45(PP)/-46(PVC) and -48(PET) are an important reference for a description of some of the most relevant physical and chemical characteristics of recycled plastics, including e.g. colour, fine particle content, hardness, or impact strength. It also describes the method for determination of these properties, from simple visual inspection to more elaborated laboratory tests that require specific description in annexes. The full description of the properties is provided in an overview table in Annex I. Despite their extension, the information of relevance in the context of end-of-waste is limited in these standards, and in some of them, absent. For instance, the presence of impurities or contamination is not present in some of the standards, and it is described heterogeneously across the mentioned standards using different terminology for the different polymer recyclates. A brief description of the key characteristics for end –of-waste is provided below, and a discussion of the potential use of existing standards in the criteria is included in Chapter 3. 2.1.3.1 Contaminants
Contaminants are materials present in waste plastic that are undesired for its further recycling. Contaminants can be classified in two groups: non-plastic material components, and plastic material components that are detrimental for recycling and further manufacturing. 2.1.3.2 Non-plastic material components
Metals (ferro-magnetic and non-ferro-magnetic) Non-metal non-glass inorganics: Ceramics, Stones and Porcelain Glass. Organics (non-hazardous) (paper, rubber, food remains, wood, textiles, organic plastic
additives) Hazards (hazardous materials contained in plastic packaging, such as medicines, paint,
solvents, and in general chemical waste) 2.1.3.3 Plastic material components
Plastic product quality is severely affected by the presence in waste plastic of more than one polymer of different structure. When a mix of polymers is melted for recycling, at the melting temperature of one of them, the polymers with lower fusion point will gasify and burn leaving solid burnout solids, while the higher fusion point polymers will stay intact. Both elements are
18
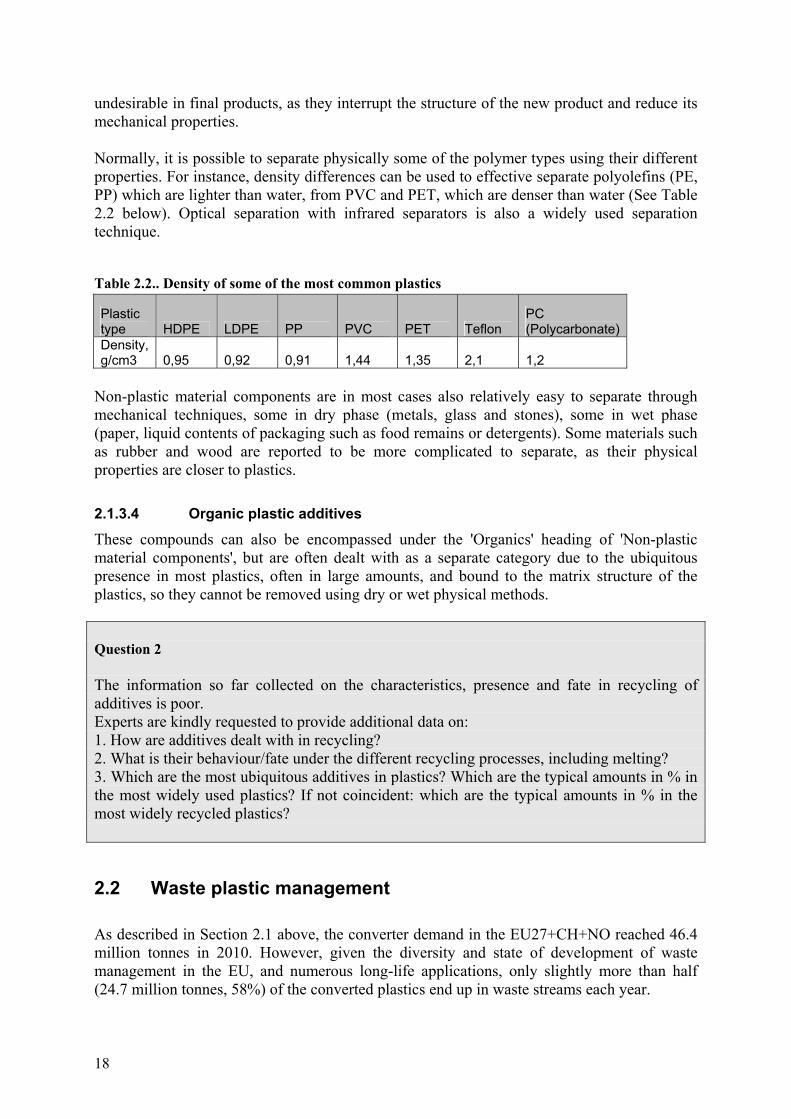
undesirable in final products, as they interrupt the structure of the new product and reduce its mechanical properties. Normally, it is possible to separate physically some of the polymer types using their different properties. For instance, density differences can be used to effective separate polyolefins (PE, PP) which are lighter than water, from PVC and PET, which are denser than water (See Table 2.2 below). Optical separation with infrared separators is also a widely used separation technique.
Table 2.2.. Density of some of the most common plastics
Plastic type HDPE LDPE PP PVC PET Teflon
PC (Polycarbonate)
Density, g/cm3 0,95 0,92 0,91 1,44 1,35 2,1 1,2
Non-plastic material components are in most cases also relatively easy to separate through mechanical techniques, some in dry phase (metals, glass and stones), some in wet phase (paper, liquid contents of packaging such as food remains or detergents). Some materials such as rubber and wood are reported to be more complicated to separate, as their physical properties are closer to plastics. 2.1.3.4 Organic plastic additives
These compounds can also be encompassed under the 'Organics' heading of 'Non-plastic material components', but are often dealt with as a separate category due to the ubiquitous presence in most plastics, often in large amounts, and bound to the matrix structure of the plastics, so they cannot be removed using dry or wet physical methods. Question 2 The information so far collected on the characteristics, presence and fate in recycling of additives is poor. Experts are kindly requested to provide additional data on: 1. How are additives dealt with in recycling? 2. What is their behaviour/fate under the different recycling processes, including melting? 3. Which are the most ubiquitous additives in plastics? Which are the typical amounts in % in the most widely used plastics? If not coincident: which are the typical amounts in % in the most widely recycled plastics?
2.2 Waste plastic management As described in Section 2.1 above, the converter demand in the EU27+CH+NO reached 46.4 million tonnes in 2010. However, given the diversity and state of development of waste management in the EU, and numerous long-life applications, only slightly more than half (24.7 million tonnes, 58%) of the converted plastics end up in waste streams each year.
19
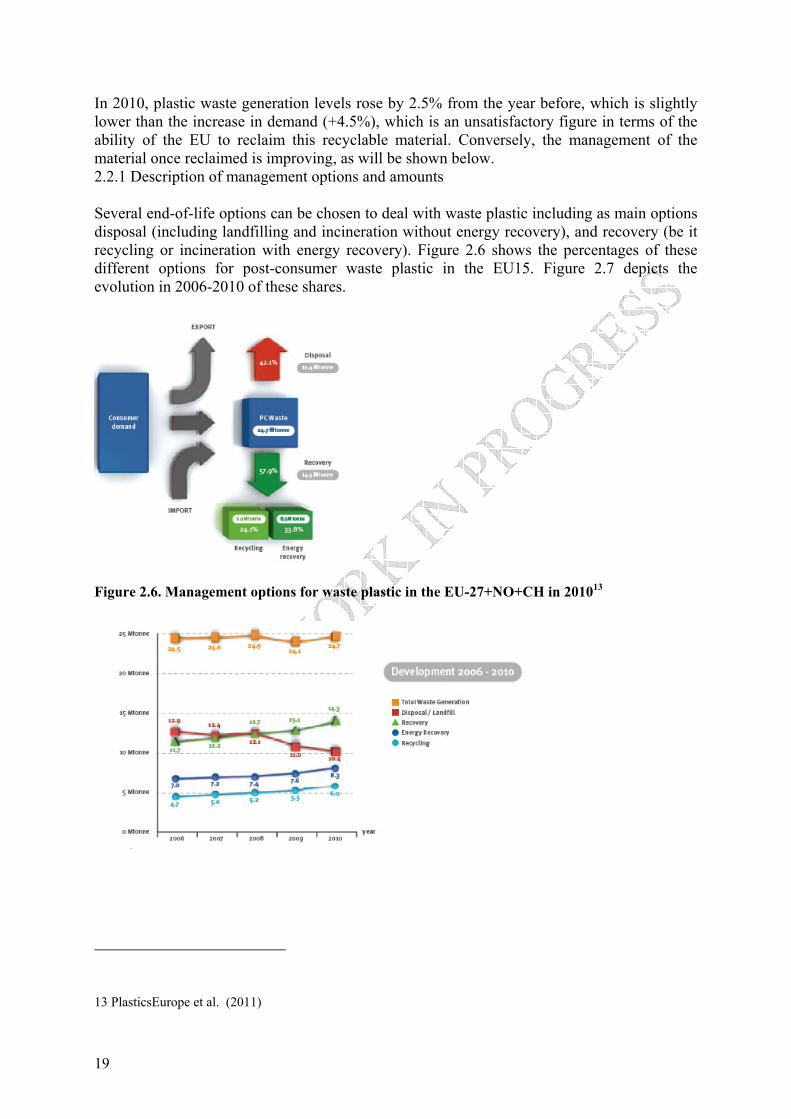
In 2010, plastic waste generation levels rose by 2.5% from the year before, which is slightly lower than the increase in demand (+4.5%), which is an unsatisfactory figure in terms of the ability of the EU to reclaim this recyclable material. Conversely, the management of the material once reclaimed is improving, as will be shown below. 2.2.1 Description of management options and amounts Several end-of-life options can be chosen to deal with waste plastic including as main options disposal (including landfilling and incineration without energy recovery), and recovery (be it recycling or incineration with energy recovery). Figure 2.6 shows the percentages of these different options for post-consumer waste plastic in the EU15. Figure 2.7 depicts the evolution in 2006-2010 of these shares.
Figure 2.6. Management options for waste plastic in the EU-27+NO+CH in 201013
13 PlasticsEurope et al. (2011)
20
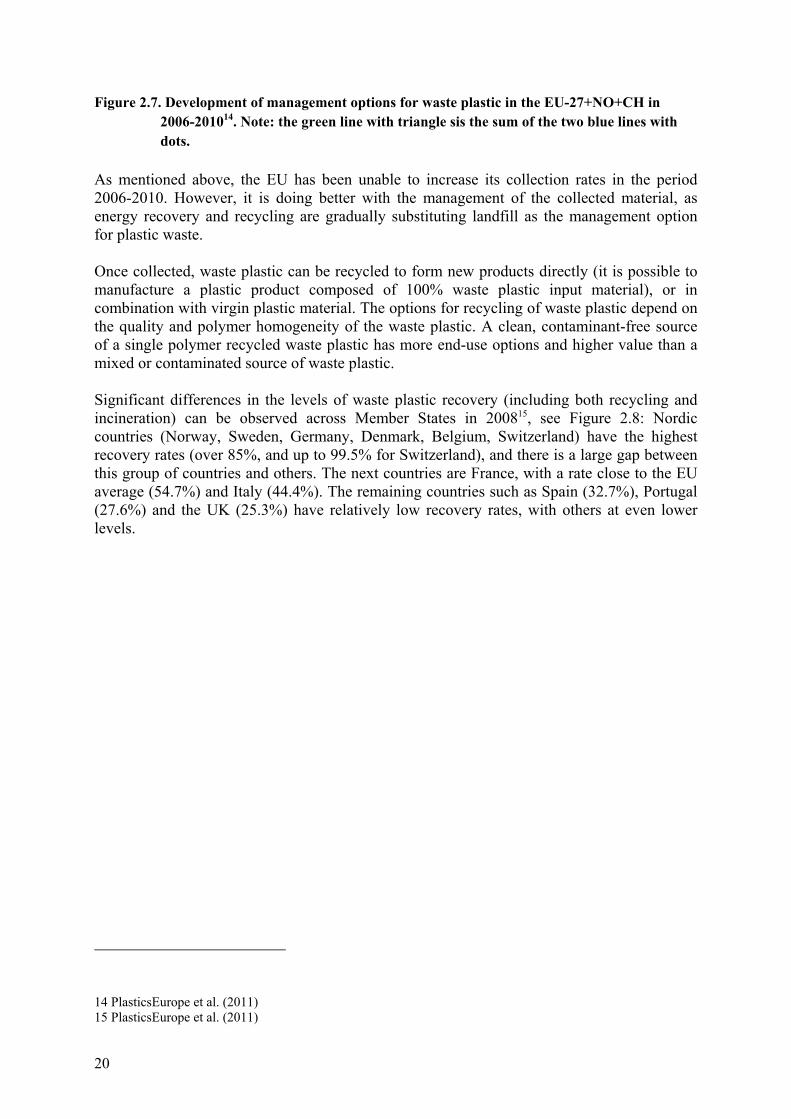
Figure 2.7. Development of management options for waste plastic in the EU-27+NO+CH in 2006-201014. Note: the green line with triangle sis the sum of the two blue lines with dots.
As mentioned above, the EU has been unable to increase its collection rates in the period 2006-2010. However, it is doing better with the management of the collected material, as energy recovery and recycling are gradually substituting landfill as the management option for plastic waste. Once collected, waste plastic can be recycled to form new products directly (it is possible to manufacture a plastic product composed of 100% waste plastic input material), or in combination with virgin plastic material. The options for recycling of waste plastic depend on the quality and polymer homogeneity of the waste plastic. A clean, contaminant-free source of a single polymer recycled waste plastic has more end-use options and higher value than a mixed or contaminated source of waste plastic. Significant differences in the levels of waste plastic recovery (including both recycling and incineration) can be observed across Member States in 200815, see Figure 2.8: Nordic countries (Norway, Sweden, Germany, Denmark, Belgium, Switzerland) have the highest recovery rates (over 85%, and up to 99.5% for Switzerland), and there is a large gap between this group of countries and others. The next countries are France, with a rate close to the EU average (54.7%) and Italy (44.4%). The remaining countries such as Spain (32.7%), Portugal (27.6%) and the UK (25.3%) have relatively low recovery rates, with others at even lower levels.
14 PlasticsEurope et al. (2011) 15 PlasticsEurope et al. (2011)

21
Figure 2.8. Recycling and energy recovery rates in the EU27 +CH in 2008 16. The difference until 100% is disposal (land filing and incineration without energy recovery)
In Figure 2.8, it can be observed that the recycling rates of European countries, which include all mechanical and feedstock recycling, are more homogeneous than the recovery rates, the highest being Germany with around 34% and the lowest being Greece with 8%. An obvious contrast appears between countries with high recovery rates and those with low recovery rates, with an apparent limitation to increase of recycling rates: while some countries with low recovery rates recycle almost all the recovered waste (Greece, Lithuania, Poland, Estonia), others with recovery rates over 80% (Switzerland, Denmark, Germany, Sweden, Belgium, Austria, Netherlands, Norway, Luxemburg) have recycling rates ‘only’ around 30%. The incineration of waste plastic, even with energy recovery, is not always seen as a suitable solution to its management. In several member states, initiatives have been taken to reduce the large amount of waste plastic being sent for energy recovery, and to encourage more recycling. In the Netherlands for example, a general principle putting recycling as the minimum standard for recyclable waste plastic is laid down in The National Plan on Waste and Management for 2009-2015 called LAP217, and in Germany, the current price charged to waste management bodies by incinerating operations (about €120 per tonne of waste incinerated) is more or less equivalent to price charged by recyclers. 16 PlasticsEurope et al. (2009) “An analysis of European plastics production, demand and recovery for 2008”, available at: www.plasticseurope.org; E&E = EEE (Electrical and electronic equipment) 17 Pers.comm Ton Post, Ministry of Housing, Spatial Planning and the Environment, The Netherlands

22
2.2.1 Generation of post-consumer plastic by source Figure 2.9 and Table 2.3 below summarise 2008 figures of waste plastic generation per sector, in the EU27+NO+CH. In general, plastic packaging constitutes the largest contributor to total waste generation (approximately 63% of total waste plastic generated). But in addition, plastic packaging is also the source of waste plastic with the highest rate of recycling (approximately 29% of the total plastic packaging waste generated is recycled). Waste plastics from sources other than packaging show much lower generation amounts (Table 2.3), and also show lower recycling rates compared to packaging. In particular, the ELV and WEEE sectors have the lowest recycling rates, despite their share of waste plastic generated being similar to C&D and agricultural waste plastic sources.
Figure 2.9. Total volumes generated (Mt) and proportions of post-consumer plastic waste by application (EU-27 +NO +CH, 200818)
Table 2.3. Quantification of post-consumer plastic waste by sector in EU27 +NO +CH, 2008 (19)
Sector Plastic waste generated (kt)
Plastic waste recycled (kt)
Recycling vs. Generation (%)
Packaging20 15 597 4 517 29.0 C&D 1 425 225 15.8 ELV 1 247 112 9.0 Agricultural 1 243 262 21.1 WEEE 1 145 87 7.6 Other 4 241 94* 2.2 TOTAL 24 898 5 297 21.3
18 PlasticsEurope (2009) “An analysis of European plastics production, demand and recovery for 2008”; WEEE: Waste electrical and electronic equipment 19 Huysman, 2009, Plastic Waste Management in Europe, EPRO 20 Included both household and commercial packaging
23
The reasons why plastic packaging waste is the main source of the total waste plastic are evident: firstly and foremost, a significant share of total production of plastic, secondly, a relatively short product life, and thirdly, a prominent use of waste management systems that are associated to registration and control of flows, and therefore allow higher quality statistics. 2.2.1.1 Waste plastic in Municipal solid waste
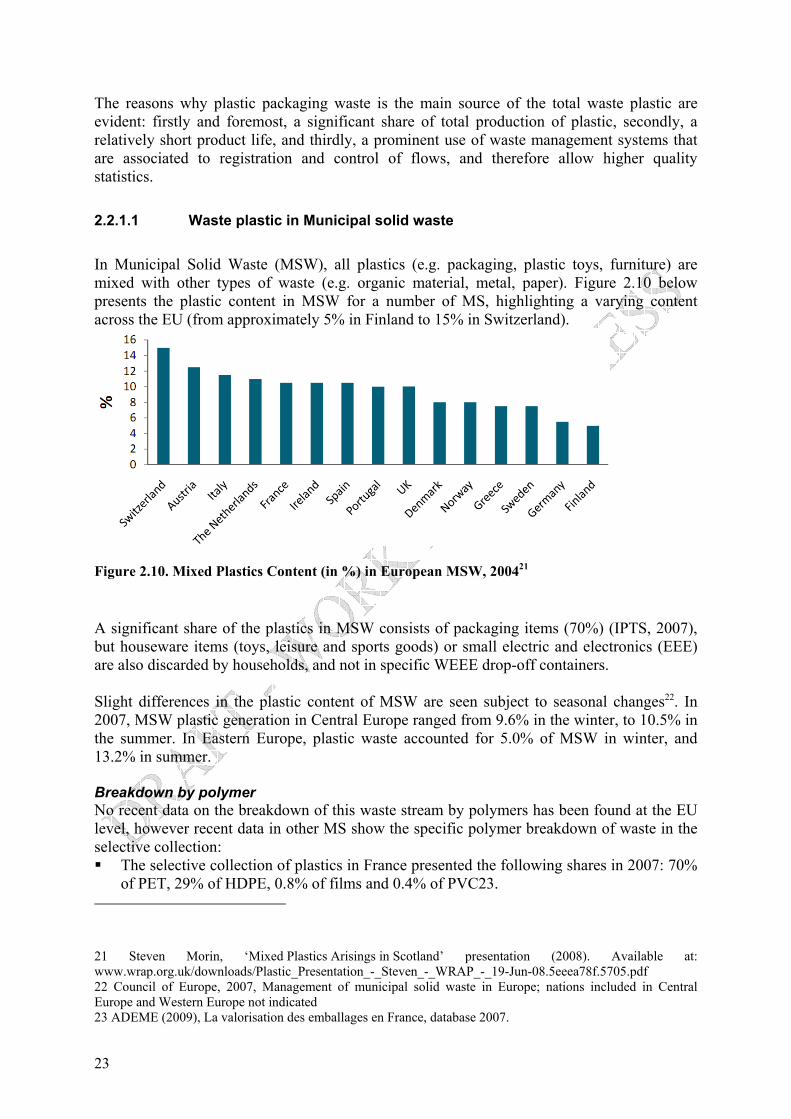
In Municipal Solid Waste (MSW), all plastics (e.g. packaging, plastic toys, furniture) are mixed with other types of waste (e.g. organic material, metal, paper). Figure 2.10 below presents the plastic content in MSW for a number of MS, highlighting a varying content across the EU (from approximately 5% in Finland to 15% in Switzerland).
Figure 2.10. Mixed Plastics Content (in %) in European MSW, 200421 A significant share of the plastics in MSW consists of packaging items (70%) (IPTS, 2007), but houseware items (toys, leisure and sports goods) or small electric and electronics (EEE) are also discarded by households, and not in specific WEEE drop-off containers. Slight differences in the plastic content of MSW are seen subject to seasonal changes22. In 2007, MSW plastic generation in Central Europe ranged from 9.6% in the winter, to 10.5% in the summer. In Eastern Europe, plastic waste accounted for 5.0% of MSW in winter, and 13.2% in summer. Breakdown by polymer No recent data on the breakdown of this waste stream by polymers has been found at the EU level, however recent data in other MS show the specific polymer breakdown of waste in the selective collection: The selective collection of plastics in France presented the following shares in 2007: 70%
of PET, 29% of HDPE, 0.8% of films and 0.4% of PVC23. 21 Steven Morin, ‘Mixed Plastics Arisings in Scotland’ presentation (2008). Available at: www.wrap.org.uk/downloads/Plastic_Presentation_-_Steven_-_WRAP_-_19-Jun-08.5eeea78f.5705.pdf 22 Council of Europe, 2007, Management of municipal solid waste in Europe; nations included in Central Europe and Western Europe not indicated 23 ADEME (2009), La valorisation des emballages en France, database 2007.

24
In Belgium, where only bottles are collected, the breakdown of the collected plastics in 2002 was: 78% PET (of which, 65% is clear, 29% is blue and 6% is green) and 22% HDPE24. The same breakdown for PET/HDPE is still true in 200925.
In Hungary, the plastic packaging waste collected by different methods (bring banks and kerbside “comingled” collection) have the following shares26:
PET accounts for 72.05%, LDPE for 5.75%, HDPE/PP for 10.80% and residues for 11.40%27;
the separate collection from households in ÖKO-Pannon’s system had the following shares in 200928: 78.44% of PET, 10.67% of HDPE/PP and 10.89% of other plastics. Also plastics accounted for 25.12% of the total amount of waste in the separate collection system.
In Ireland, polymer sorting and grading of plastic waste is not yet done to any large degree.
Breakdown by plastic product type Table 2.4 below presents an example the content of plastic in MSW in different regions of the UK. Although the total amount was similar across the various regions, there were some notable differences based mainly on the type of product. In England and Wales for example, the percentage of plastic bottles was relatively low in comparison to plastic films, where as in Scotland, this difference was smaller (Table 2.4). Plastic packaging (films, bottles and others) accounted for large part of plastics collected, with other dense plastics being present at a range between 1.9 and 2.6%.
Table 2.4. Percentage of plastics in residual household collected waste in the UK and the Republic of Ireland, 2009 (WRAP29, EPA30)
Type Wales
(2009) Scotland (2009) Undisclosed
English County (2008)
UK (2009) Republic of Ireland (2008)30
Plastic film
6.0 4.5 5.5
Plastic bottles
1.7 3.3 1.9
Other plastic packaging
3.2 4.0 2.4
Other dense plastic
1.9 2.0 2.6
Total 12.8 13.8 12.4
14 13.6
24 Plarebel factsheet (2002), available at: www.epro-plasticsrecycling.org/ 25 Pers. comm. with Plarebel. 26 Pers. comm. with the National Association of Recyclers of Hungary. 27 According to Remoplast Nonprofit PLC 28 According to ÖKO-Pannon Nonprofit PLC, the most significant Producer Responsibility Organisation for packaging waste in the country 29 WRAP, 2009, The composition of municipal solid waste in Wales. 30 The Irish Environment Protection Agency, 2009, National Waste Report 2008
25
2.2.1.2 Commercial waste
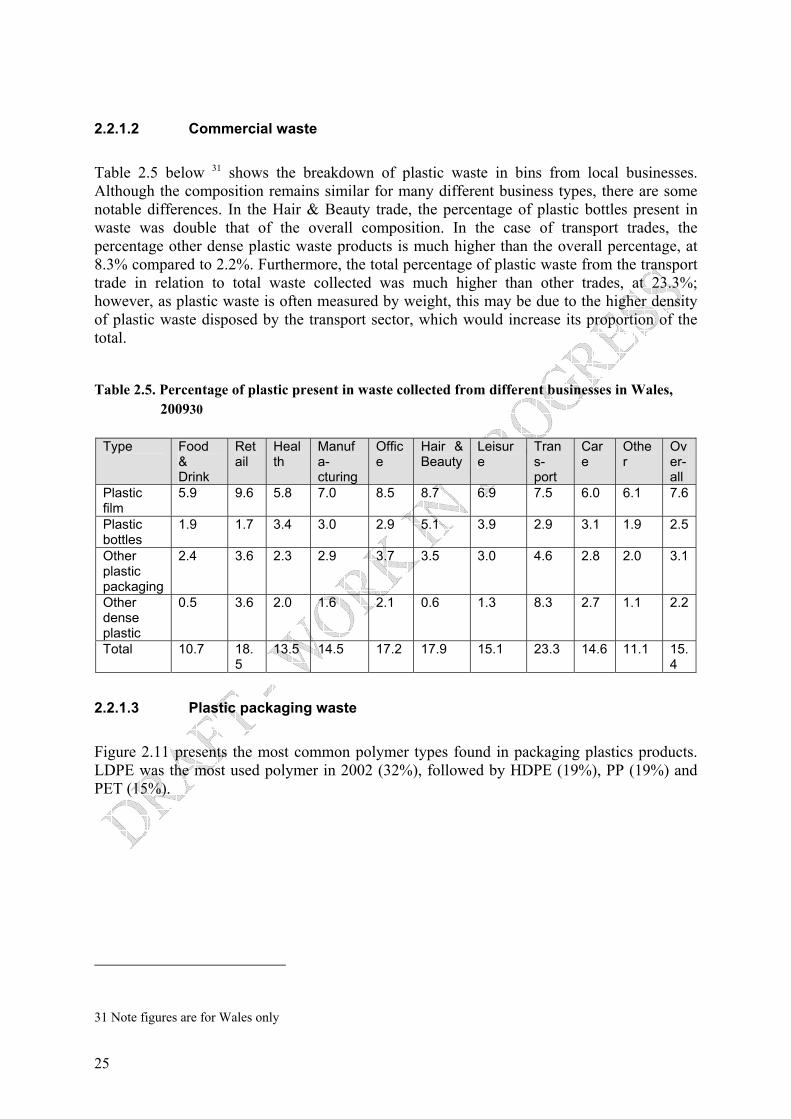
Table 2.5 below 31 shows the breakdown of plastic waste in bins from local businesses. Although the composition remains similar for many different business types, there are some notable differences. In the Hair & Beauty trade, the percentage of plastic bottles present in waste was double that of the overall composition. In the case of transport trades, the percentage other dense plastic waste products is much higher than the overall percentage, at 8.3% compared to 2.2%. Furthermore, the total percentage of plastic waste from the transport trade in relation to total waste collected was much higher than other trades, at 23.3%; however, as plastic waste is often measured by weight, this may be due to the higher density of plastic waste disposed by the transport sector, which would increase its proportion of the total.
Table 2.5. Percentage of plastic present in waste collected from different businesses in Wales, 200930
Type Food
& Drink
Retail
Health
Manufa-cturing
Office
Hair & Beauty
Leisure
Trans-port
Care
Other
Over-all
Plastic film
5.9 9.6 5.8 7.0 8.5 8.7 6.9 7.5 6.0 6.1 7.6
Plastic bottles
1.9 1.7 3.4 3.0 2.9 5.1 3.9 2.9 3.1 1.9 2.5
Other plastic packaging
2.4 3.6 2.3 2.9 3.7 3.5 3.0 4.6 2.8 2.0 3.1
Other dense plastic
0.5 3.6 2.0 1.6 2.1 0.6 1.3 8.3 2.7 1.1 2.2
Total 10.7 18.5
13.5 14.5 17.2 17.9 15.1 23.3 14.6 11.1 15.4
2.2.1.3 Plastic packaging waste
Figure 2.11 presents the most common polymer types found in packaging plastics products. LDPE was the most used polymer in 2002 (32%), followed by HDPE (19%), PP (19%) and PET (15%).
31 Note figures are for Wales only

26
Figure 2.11. Most consumed polymers in packaging, EU-15 +NO +CH 2002 (source: APME32)
Plastic packaging for food and beverage products frequently relies on different types of plastics, and can incorporate additional materials and adhesives. Clear plastic bottles, for example, may be composed of PET, whereas the (non-clear) caps are often made of PE, and the labels that are around the bottles may be composed of another type of plastic film (PS, PVC, PP) or material (paper). Each of these materials has very different properties and requires different recycling methods. Table 2.6 below presents the main polymers used in packaging applications. As already presented before, bottles are mainly made of PET and HDPE, while plastic bags and sacks mainly contain HDPE and LDPE. Many different polymers can be used to manufacture films (LDPE, PP, PET, OPP, PVC) while PS is mainly used in trays and protective and service packaging.
Table 2.6. Polymers in main household packaging applications (adapted from IPTS, 2007) Applications Most common polymers used
Dairy products HDPE Juices, Sauces HDPE, barrier PET, PP Water, Soft Drinks PET, barrier PET Beer and alcoholic beverages Barrier PET Oil, vinegar PET, PVC Non-food products (cleaning products, toiletries, lubricants, etc.)
HDPE, PET, PVC
Bottles
Medical products PET
Closures Caps and closures of bottles, jars, pots, cartons, etc.
PP, LDPE, HDPE, PVC
Carrier bags LDPE, HDPE Garbage bags HDPE, LDPE, LLDPE Bags and sacks Other bags and sacks LDPE, LLDPE, HDPE, PP, woven
PP 32 Association of Plastic Manufacturer in Europe (APME), “Plastics in Europe – An analysis of plastics consumption and recovery in Europe 2002 & 2003”, 2004

27
Applications Most common polymers used Pouches (sauces, dried soups, cooked meals)
PP, PET
Overwrapping (food trays and cartons)
OPP, bi-OPS
Wrapping, packets, sachets, etc. PP, OPP Wrapping (meat, cheese) PVDC Collection shrink film (grouping package for beverages, cartons, etc.)
LLDPE, LDPE
Cling stretch rap film (food) LLDPE, LDPE, PVC, PVDC Lidding (heat sealing) PET, OPA, OPP Lidding (MAP and CAP foods) Barrier PET, barrier layered
PET/PE and OPP/PE
Films
Lidding (dairy) PET Microwaveable ready meals, puddings
PP,C-PET
Ovenable ready meals C-PET Salads, desserts A-PET, PVC Vegetables PP, EPS Fish PP, PVC, A-PET, EPS Confectionery PVC, PS Dairy products PP,PS Meat, poultry A-PET, PVC, EPS
Trays
Soup PP, A-PET Blisters PET, PVC Pots, cups and tubs PP, PS Service packaging (vending cups, etc.)
PS Others
Protective packaging (‘clam’ containers, fish crates, loose filling, etc.)
EPS
Table 2.12 describes the polymer market share of the packaging sector in Spain: 28% of polymers are used to manufacture films, 25% for bags and sacks and 20% for bottles. The remaining share is split between miscellaneous applications (containers, protection, etc.). Given the share of the polymer types in the different applications, LDPE (76% of films, and 61% of bags and sacks) appears to be the most used polymer, just before PET (66% of bottles) and HDPE (28% of bottles and 31% of bags and sacks). PP represents 73% of closure items, e.g. bottles caps.

28
Figure 2.12. Approximate polymer market share in the packaging sector in Spain (2003, ANAIP33)
2.2.1.4 Plastic waste from construction and demolition
The main applications generating waste in the construction and demolition (C&D) sector are fitted furniture, floor and wall coverings (PVC), pipes and ducts, insulation materials (PU) and profiles (PVC) (see Figure 2.13).
Figure 2.13. Plastic consumption and waste composition by application (Source IPTS, 2007) Plastics used in construction have a long life span so in a time period of increasing consumption, the generation of plastic waste is low in a given year compared to plastics consumption in that same year. Polymer types used in various C&D applications are described in Table 2.7.
Table 2.7. Main polymers used by application
Applications Most common polymers used
33 ANAIP, ‘’Annual report 2003: Los plásticos en España. Hechos y cifras 2003’’, 2004

29
Applications Most common polymers used
Pipes and Ducts PVC, PP, HDPE, LDPE, ABS
Insulation PU, EPS, XPS Windows profiles Other profiles Floor and wall coverings
PVC
Lining PE, PVC
Fitted furniture PS, PMMA, PC, POM, PA, UP, amino
2.2.1.5 Plastic waste from electrical and electronic equipment (WEEE)
The predominant polymers used in Electrical and Electronic Equipment (EEE) are PP, PS and ABS, the latter being increasingly used. Table 2.8 presents the different polymer composition of some EEE products.
Table 2.8. Typical applications of plastic polymers in EEE sector (IPTS, 2007) Applications Type of plastics Components inside washing machines and dishwashers, casings of small household appliances (coffee makers, irons, etc.) Internal electronic components
PP
Components inside refrigerators (liner, shelving) Housings of small household appliances, data processing and consumer electronics
PS (HIPS)
Housings and casing of phones, small household appliances, microwave ovens, flat screens and certain monitors Enclosures and internal parts of ICT equipment
ABS
Housings of consumer electronics (TVs) and computer monitors and some small household appliances (e.g. hairdryers) Components of TV, computers, printers and copiers
PPO (blend HIPS/PPE)
Housings of ICT equipment and household appliances Lighting
PC
Housings of ICT equipment and certain small household appliances (e.g. kettles, shavers)
PC/ABS
Electrical motor components, circuits, sensors, transformers, lighting Casing and components of certain small household appliances (e.g. toasters, irons). Handle, grips, frames for ovens and grills Panel component of LCD displays
PET (PBT)
Insulation of refrigerators and dishwashers PU (foam) Lamps, lighting, small displays (e.g. mobile phones) PMMA Lighting equipment, small household appliances Switches, relays, transformer parts, connectors, gear, motor basis, etc.
PA
Gears, pinions POM Cable coating, cable ducts, plugs, refrigerator door seals, casings PVC Cable insulation and sheathing PE Housing, handles and soles of domestic irons, handles and buttons of grills and pressure cookers
UP polymers
Printed circuit boards EP polymers
Table 2.9 below describes the composition by polymer of a number of Waste Electrical and Electronic Equipment (WEEE) items. The complexity of construction of EEE items (for

30
example, all items described in Table 2.9 contain at least 3 different types of polymers) presents one of the technical barriers that can hamper access to and recycling of waste plastics contained in WEEE. Small household appliances can contain up to 6 different plastic types.
Table 2.9. Main polymers used in the manufacture of most common WEEE items collected (adapted from IPTS, 2007)
WEEE item Polymers Composition Printers/faxes PS (80%), HIPS (10%), SAN (5%), ABS, PP
Telecoms ABS (80%), PC/ABS (13%), HIPS, POM TVs PPE/PS (63%), PC/ABS (32%), PET (5%)
Toys ABS (70%), HIPS (10%), PP (10%), PA (5%), PVC (5%)
Monitors PC/ABS (90%), ABS (5%), HIPS (5%) Computer ABS (50%), PC/ABS (35%), HIPS (15%) Small household appliances
PP (43%), PA (19%), ABS-SAN (17%), PC (10%), PBT, POM
Refrigeration PS&EPS (31%), ABS (26%), PU (22%), UP (9%), PVC (6%),
Dishwashers PP (69%), PS (8%), ABS (7%), PVC (5%)
2.2.1.6 Waste plastics from the automotive sector
Plastics are increasingly used in vehicles for their distinctive qualities, such as impact and corrosion resistance, in addition to low weight and cost. Table 2.10 below describes the precise applications of these main polymers found in the automotive industry. Many components can be manufactured from different types of plastics, and PP can be used almost everywhere.
Table 2.10.: Polymers used in a typical car (IPTS, 2007)
Component Type of plastics Weight in average car (kg)
Bumper PP, ABS, PC/PBT 10 Seating PU, PP, PVC, ABS, PA 13 Dash board PP, ABS, SMA, PPE, PC 7 Fuel system HDPE, POM, PA, PP, PBT 6 Body (incl. Panels) PP, PPE, UP 6 Under-bonnet components PA, PP, PBT 9
Interior trim PP, ABS, PET, POM, PVC 20 Electrical components PP, PE, PBT, PA, PVC 7
Exterior trim ABS, PA, PBT, POM, ASA, PP
4
Lighting PC, PBT, ABS, PMMA, UP 5 Upholstery PVC, PU, PP, PE 8 Liquid containers PP, PE, PA 1
The weight percentages of most common polymers in the current and future plastic waste in End-of-life of Vehicles (ELV) was estimated as follows (IPTS, 2007):

31
Table 2.11. Most common polymers in ELV waste (IPTS, 2007) Plastic type Current use Future use PP 33-28% 43-38% PU 22-17% 13-8% ABS 17-12% 10-5% PVC 13-8% 10-5% PA 9-4% 11-6% HDPE 8-3% 12-7%
2.2.1.7 Waste plastics from agriculture
The most common polymers in agricultural plastic waste stream are LDPE and PVC. LDPE accounts for around 60-65% of the waste stream while PVC represents 18-23%. Table 2.12 below lists the types of polymers used in the agricultural applications. LDPE can indeed be used in all types of bags and nets, and lining of greenhouses and ground covers, while PVC is mainly used to manufacture pipes and fittings. Also, some PP is found in ropes and bags.
Table 2.12. Types of plastic by agricultural application (adapted from IPTS, 2007)
Applications Type of plastics PP
Fertiliser bags, liners LDPE
Seed bags PP Feed bags LDPE Agrochemical containers HDPE Nets and mesh LDPE
LDPE Pots and trays HDPE
PVC Pipes and fittings LDPE
LDPE Nets and mesh HDPE Rope, strings PP
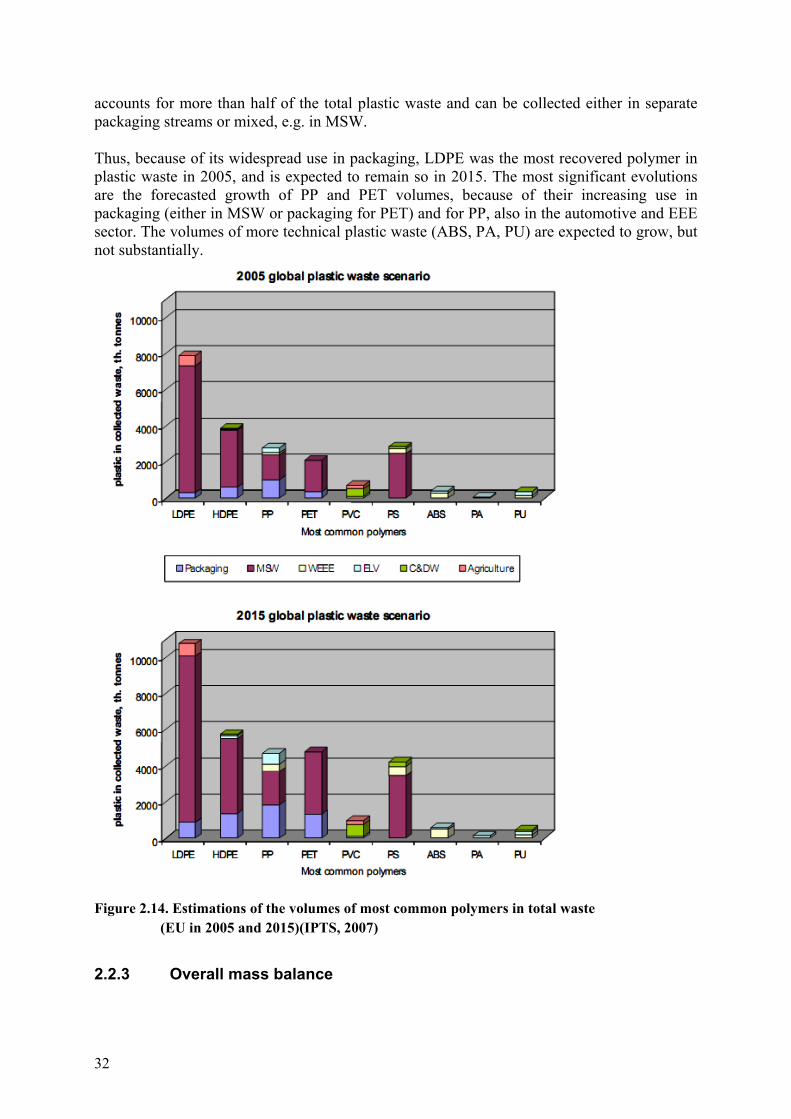
2.2.2 Trends of waste plastic generation by polymer type and application The ongoing developments in the plastic industry enable the continuous appearance of new plastic applications, resulting in the evolution of the plastics consumption and waste generation. The estimations of the total volume of the polymers in collected waste are described for each waste stream in 2005 and 2015 in Table 2.14. A significant piece of information that is not contained in these charts is the fact that packaging plastic waste
32
accounts for more than half of the total plastic waste and can be collected either in separate packaging streams or mixed, e.g. in MSW. Thus, because of its widespread use in packaging, LDPE was the most recovered polymer in plastic waste in 2005, and is expected to remain so in 2015. The most significant evolutions are the forecasted growth of PP and PET volumes, because of their increasing use in packaging (either in MSW or packaging for PET) and for PP, also in the automotive and EEE sector. The volumes of more technical plastic waste (ABS, PA, PU) are expected to grow, but not substantially.
Figure 2.14. Estimations of the volumes of most common polymers in total waste
(EU in 2005 and 2015)(IPTS, 2007)
2.2.3 Overall mass balance

33
In order to complete the mass balance picture of plastic production, consumption, and waste generation and management, two elements need to be described: (1) the trade balances, and (2) a better estimation of data for waste plastic from pre-consumer sources. 2.2.3.1 Trade
Plastics trade data is only available for plastic packaging waste. Plastic waste trade is an important aspect of plastics recycling in the EU. As some MS do not have the capacity, technology or financial resources to treat plastic waste locally, a significant amount may be exported for treatment. In addition to this, the price of plastics is also a factor which significantly affects the trade of plastic packaging waste. For instance, in Luxembourg 9.77 kt of plastic packaging was recycled, which closely relates to its plastic packaging recycling export figure of 9.76 kt in 2007, and is 38% of the total generation
Table 2.13. Plastic packaging waste materials trade for recycling at different MS in 200734
Area Material imports for recycling (kt)
Material exports for recycling (kt)
Austria - 9.90 Belgium - 84.25 Bulgaria 2.99 0.63 Cyprus - 1.42 Czech Republic - 28.35 Denmark 16.62 42.31 Estonia - 4.61 Finland - - France 13.00 188.96 Germany - 272.70 Greece - 40.70 Hungary - 1.49 Ireland 58.73 38.83 Italy - 4.32 Latvia - 1.41 Lithuania - 8.19 Luxembourg - 9.76 Netherlands - 60.00 Norway - 12.99 Poland - 47.70 Portugal - 0.14 Romania - 3.00 Slovakia - 0.06 Spain 3.24 - Sweden - 34.34 United Kingdom - 357.25
In order to determine just how much plastic packaging waste is treated outside of each EU MS, it is necessary to calculate the net trade. To determine the net trade of plastics recycling in each MS, the following calculation was used: 34 Eurostat data; includes municipal packaging waste which has been separated at the source. This data is based on the trade of raw plastic waste, in accordance with Article 1(a) or the Waste Directive 75/442/ECC (superseded by Directive 2008/98/EC on waste).
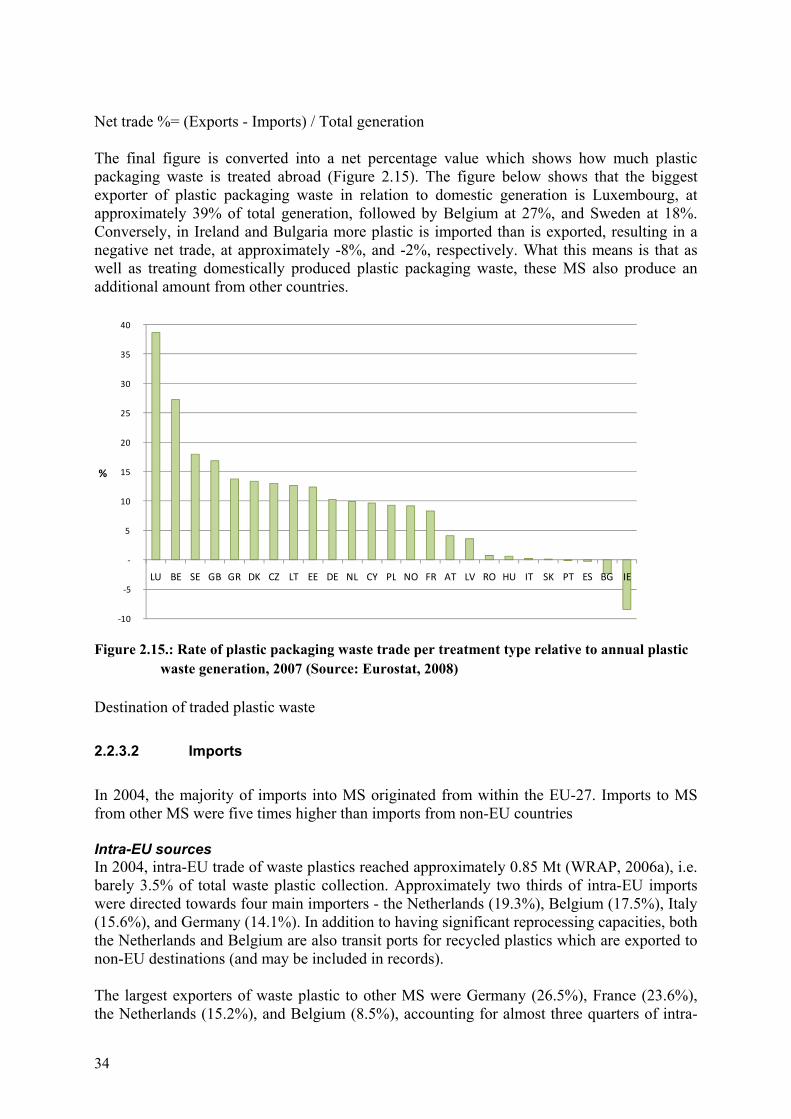
34
Net trade %= (Exports - Imports) / Total generation The final figure is converted into a net percentage value which shows how much plastic packaging waste is treated abroad (Figure 2.15). The figure below shows that the biggest exporter of plastic packaging waste in relation to domestic generation is Luxembourg, at approximately 39% of total generation, followed by Belgium at 27%, and Sweden at 18%. Conversely, in Ireland and Bulgaria more plastic is imported than is exported, resulting in a negative net trade, at approximately -8%, and -2%, respectively. What this means is that as well as treating domestically produced plastic packaging waste, these MS also produce an additional amount from other countries.
-10
-5
-
5
10
15
20
25
30
35
40
LU BE SE GB GR DK CZ LT EE DE NL CY PL NO FR AT LV RO HU IT SK PT ES BG IE
%
Figure 2.15.: Rate of plastic packaging waste trade per treatment type relative to annual plastic waste generation, 2007 (Source: Eurostat, 2008)
Destination of traded plastic waste 2.2.3.2 Imports
In 2004, the majority of imports into MS originated from within the EU-27. Imports to MS from other MS were five times higher than imports from non-EU countries Intra-EU sources In 2004, intra-EU trade of waste plastics reached approximately 0.85 Mt (WRAP, 2006a), i.e. barely 3.5% of total waste plastic collection. Approximately two thirds of intra-EU imports were directed towards four main importers - the Netherlands (19.3%), Belgium (17.5%), Italy (15.6%), and Germany (14.1%). In addition to having significant reprocessing capacities, both the Netherlands and Belgium are also transit ports for recycled plastics which are exported to non-EU destinations (and may be included in records). The largest exporters of waste plastic to other MS were Germany (26.5%), France (23.6%), the Netherlands (15.2%), and Belgium (8.5%), accounting for almost three quarters of intra-
35
EU exports. The inclusion of the Netherlands and Belgium as both significant importers and exporters of plastics is mainly due to the availability of recycling technologies in each country. For example, the largest recycling plant for EU generated LDPE films is found in the Netherlands (up to 37 kt in one facility). The most significant intra-EU plastic waste trade flows in 2004 were from Germany to the Netherlands (77 kt), France to Italy (65 kt) and from the Netherlands to Belgium (58 kt).
Table 2.14. Waste plastic exporters in the EU, 2004 (Source: WRAP, 2006a)
Exporting country Net weight (kt) Germany 225.0 France 201.7 Others 165.3 Netherlands 128.9 Belgium 72.8 Switzerland 71.5 UK 36.3 Sweden 29.1 Italy 28.4 Austria 20.9 Spain 13.5 TOTAL 993.3
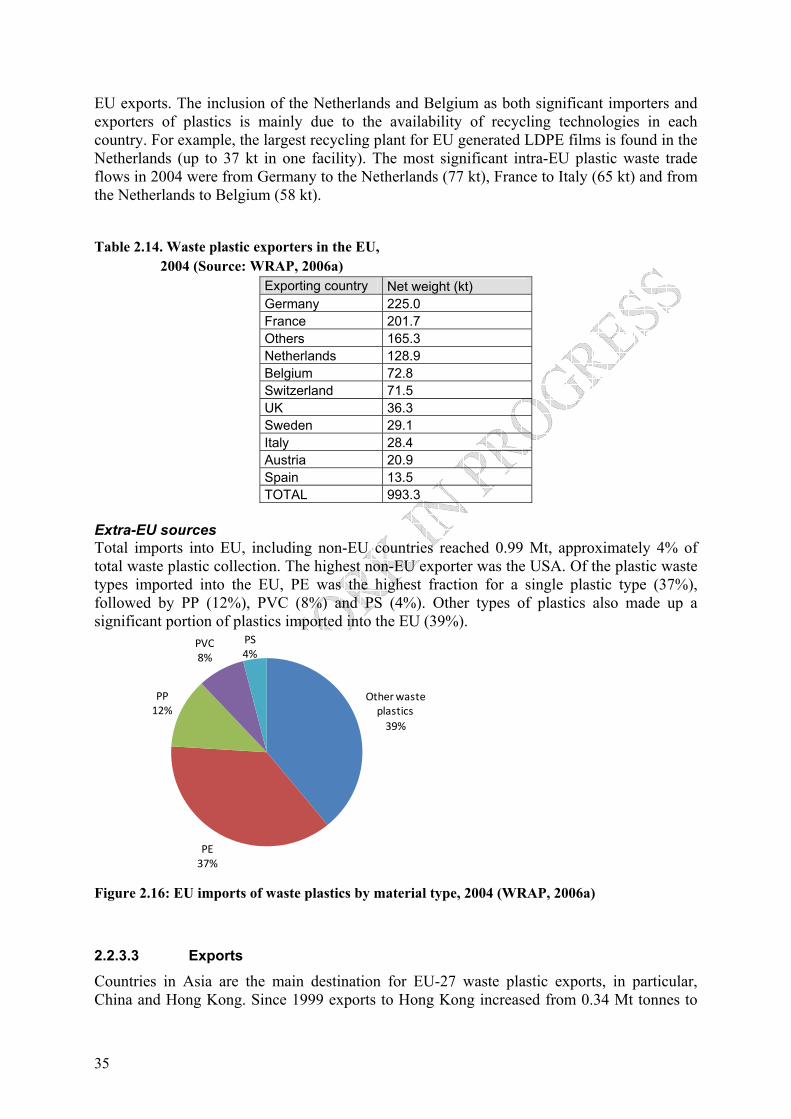
Extra-EU sources Total imports into EU, including non-EU countries reached 0.99 Mt, approximately 4% of total waste plastic collection. The highest non-EU exporter was the USA. Of the plastic waste types imported into the EU, PE was the highest fraction for a single plastic type (37%), followed by PP (12%), PVC (8%) and PS (4%). Other types of plastics also made up a significant portion of plastics imported into the EU (39%).
Other waste plastics
39%
PE37%
PP12%
PVC8%
PS4%
Figure 2.16: EU imports of waste plastics by material type, 2004 (WRAP, 2006a)
2.2.3.3 Exports
Countries in Asia are the main destination for EU-27 waste plastic exports, in particular, China and Hong Kong. Since 1999 exports to Hong Kong increased from 0.34 Mt tonnes to
36
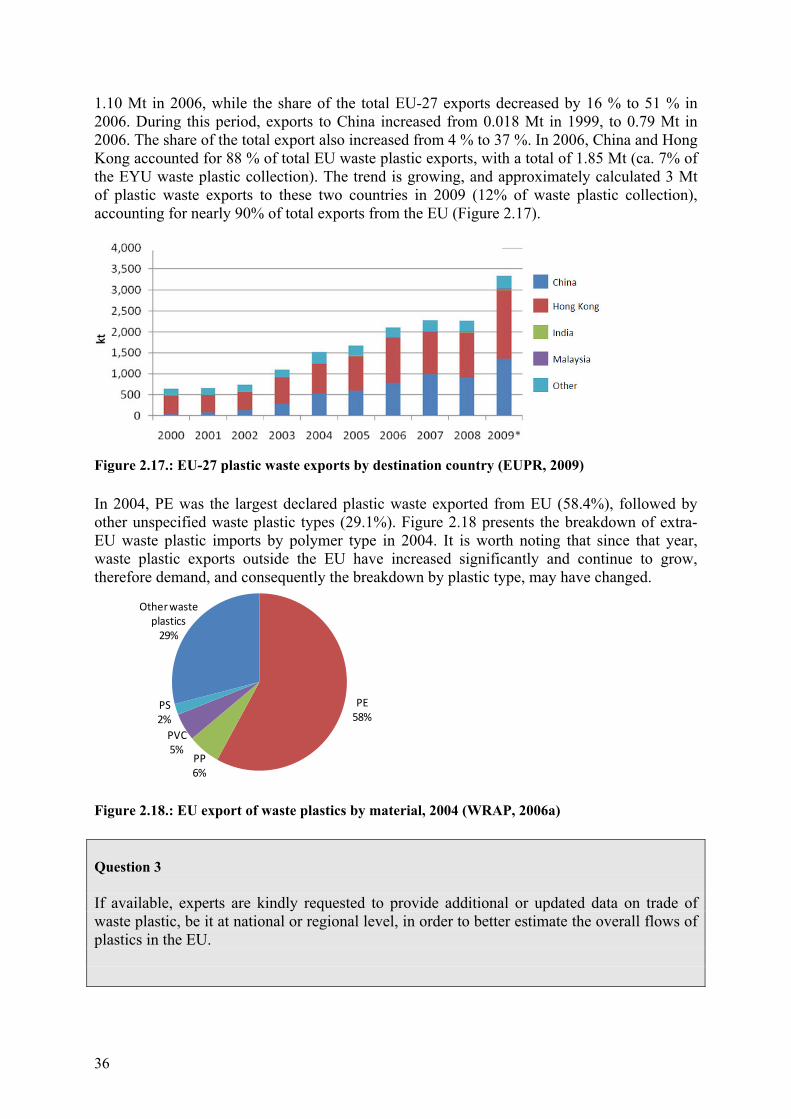
1.10 Mt in 2006, while the share of the total EU-27 exports decreased by 16 % to 51 % in 2006. During this period, exports to China increased from 0.018 Mt in 1999, to 0.79 Mt in 2006. The share of the total export also increased from 4 % to 37 %. In 2006, China and Hong Kong accounted for 88 % of total EU waste plastic exports, with a total of 1.85 Mt (ca. 7% of the EYU waste plastic collection). The trend is growing, and approximately calculated 3 Mt of plastic waste exports to these two countries in 2009 (12% of waste plastic collection), accounting for nearly 90% of total exports from the EU (Figure 2.17).
Figure 2.17.: EU-27 plastic waste exports by destination country (EUPR, 2009) In 2004, PE was the largest declared plastic waste exported from EU (58.4%), followed by other unspecified waste plastic types (29.1%). Figure 2.18 presents the breakdown of extra-EU waste plastic imports by polymer type in 2004. It is worth noting that since that year, waste plastic exports outside the EU have increased significantly and continue to grow, therefore demand, and consequently the breakdown by plastic type, may have changed.
PE58%
PP6%
PVC5%
PS2%
Other waste plastics
29%
Figure 2.18.: EU export of waste plastics by material, 2004 (WRAP, 2006a) Question 3 If available, experts are kindly requested to provide additional or updated data on trade of waste plastic, be it at national or regional level, in order to better estimate the overall flows of plastics in the EU.

37
2.2.3.4 Sources of waste plastic
Pre-consumer waste plastic streams are not well-recorded in the EU, as this type of waste plastic is not typically processed through the same waste management pathways as post-consumer waste plastic. National authorities do not have much information of the pre-consumer waste streams dealt with directly by the industry sector, either reused in industrial processes (melted and fed back into the production process in-house) or sold to reprocessors35 (dealt with by the private sector), without entering the publicly managed waste management systems. The pre-consumer waste plastic generation for thermoplastics such as PVC is very low because the major part of this waste is reprocessed without leaving the facilities (it is therefore internal scrap and by-product, not waste)36. However, waste plastic can also consist of unusable material, such as samples used for quality tests or plastics deteriorated by the start-up and shutdown periods of the machines (due to large heat variations). For fractions that cannot be fed back into the production process, open-loop recycling and other forms of recovery can be used. Some reprocessors are specialised in the recycling of pre-consumer waste plastic streams, and these markets are functioning relatively well, showing high recycling rates37. According to figures from 200038, it was found that almost all the plastic production scrap is being re-fed into the plastics production system; in other words, the recycling rate of pre-consumer waste is estimated at almost 100%, due to direct reprocessing of the scrap. Pre-consumer waste plastic is currently recycled to a greater extent than post-consumer waste plastic, as it is a homogeneous contaminant-free material, is easier to recover and is available in large volumes from individual sources39 (e.g. from a factory). In 2004, PlasticsEurope stated that approximately 90% of industrial scrap is recovered in all MS, with the majority being mechanically recycled40. In the UK for example, 95% of the 250-300 kt of industrial scrap produced is recycled41 and in Germany, almost 100% of pre-consumer plastic waste) was recovered in 200742. Due to data limitations, the data currently presented in this report is based on post-consumer waste generation figures, unless stated otherwise. The overall mass balance in the following sections therefore refers only to post-consumer waste plastic.
35 Reprocessors are companies involved in one or more of the recycling stages of waste plastics, from crushing and washing through to production of end-products 36 Pers.comm with Solvay 37 Ingham A., 2005. Improving recycling markets, chapter 3, OECD 38 Ingham A., 2005. Improving recycling markets, chapter 3, OECD 39 Hopewell, J. et al., 2009. Plastics recycling: challenges and opportunities. 40 Plastics Europe, “An analysis of plastics production, demand and recovery in Europe 2004”, 2006. 41 The sources do not mention whether this quantity contains both the reprocessing in the original process as well as recycling by a third party, or only the latter. British Plastics Foundation, ”Plastics Recycling” at: www.bpf.co.uk/bpfindustry/process_plastics_recycling.cfm; and www.wasteonline.org.uk/resources/InformationSheets/Plastics.htm; no date provided within source 42 OECD, Plastic from the commercial and private household sectors, 2009

38
Question 4 Experts are kindly requested to provide additional data on flows of pre-consumer waste plastic, be it at national or regional level, in order to better estimate the overall flows of plastics in the EU.
2.3 Waste plastic reprocessing and recycling In the following sections, the different technical processes for the waste plastic management will be described, including collection, cleaning, sorting, size reduction, and different recycling steps (Figure 2.19).
39
Figure 2.19. Waste plastic management steps, from collection to cleaning, sorting, size reduction, and different recycling steps43
2.3.1 Reprocessing Reprocessing is a broad term used to define any of the intermediate actions in the waste plastic chain between the end-users and the plastic converters. It encompasses companies or institutions undertaking activities such as collection, sorting, grading, classification, cleaning, baling, trading, storing, or transporting. The inlet material to these plants is waste or waste plastic. The outlet is waste plastic that may either be waste or non-waste.
2.3.2 Collection Waste plastics are collected through a range of systems covering industrial/commercial use and domestic users. Industrial/commercial waste plastics are usually collected as part of a contracted arrangement, and result in highly homogenous fractions. Most specialty plastics (e.g. polyamides, polycarbonates, PBT, PSU) are collected from industry, as they are only marginally present in e.g. municipal plastic waste, compared to common commodity polymers such as PP, HDPE, PS, PVC and LDPE. Commodity plastics from municipal waste can be reclaimed by various systems, depending on national and local conditions. Collection schemes differ depending on the source of the waste (e.g. household, industrial). The source of waste further determines the appropriate sorting and pre-treatment processes. Hence, depending on the waste stream considered and on the collection scheme, the sorting and separation of waste is more or less difficult and results in variations of the reprocessing costs and of the quality of the reprocessed material. Waste generated by industry, as well as by the agricultural and the construction sectors is generally collected by the private sectors. This waste has in general a higher added value. Overall, household waste plastic can be collected in three main ways: Mono-material collection: Waste plastic (in the form of mixed plastic types) is collected
separate from other types of recyclables (such as metals or glass). The waste plastic can be collected with all plastic types together, or targeting specific (e.g. PET bottles).
Multi-material collection: Waste plastic is collected together with other dry recyclable waste such as metals or glass, but separately from the remaining components of municipal solid waste such as food.
Mixed municipal solid waste collection: The waste plastic is collected together with the remaining components of municipal solid waste. Post-separation of dry recyclables such as metals, plastics and glass is possible, but frequently the resulting recyclables are highly contaminated and require intensive further treatment.
Both the mono-material or multi-material collection can happen in two ways:
43 Lardinois, I., van der Klundert, A. (1995), Plastic Waste: Options for small-scale resource recovery, WASTE Consultants, TOOL, http://www.waste.nl/page/252

40
Kerbside or door-to-door collection Drop-off locations or collection points Kerbside or door-to-door collection requires citizens to separate recyclable materials from the remaining components of their household waste, by putting them in specific waste bins. The bags are then collected from each household. Typically, 40 to 60% of targeted recyclables are returned through this type of collection44.. Door-to-door collection schemes result in a low degree of material contamination. The other way to selectively collect mixed waste plastic is through drop-off locations or collection points. Drop-off locations or collection points require citizens to collect their recyclables and to then dispose of them at specific locations. Usually, about 10 to 15% of recyclables are recovered through this method. Drop-off collection entails quite a high contamination level (10% - 30%)16. Some polymers such as PVC of wider use in outdoor and construction materials are mostly collected in drop off facilities. Despite the presence of selective collection systems, many recyclable materials can be lost in the mixed waste bin, usually incinerated or landfilled. For example, in France only one out of every two bottles finds its way to the plastic recycling bin45. In addition, mono-material collection can happen by refill/deposit systems, most frequently for beverage bottles. In refill/deposit systems bottles are sold with refundable deposits. Deposits may be charged on both refillable and single-use PET bottles. PET bottles can be recycled into their previous use (closed-loop recycling), or to other uses (e.g. polyester fibres for textiles). PET deposit programmes achieve very high return rates (90%) with very low levels of contamination of the post-consumer PET, resulting in higher market values. Sometimes, refill/deposit systems have been considered as barriers to cross-border trade In most EU Member States, the selective collection of plastic packaging is combined with the existence of green-dot systems. These systems operate on behalf of the manufacturers of products using plastic packaging, which under the producer responsibility legislation (Packaging Directive 94/62/EC) have to manage the collection of their own packaging. According to the directive, if a company does not join a Green Dot scheme, they must collect recyclable packaging themselves, although this is almost always impossible for mass products and only viable for low-volume producers. Green dot systems charge the producers with a fee for the collection of their packaging, which the producers normally transfer to the consumers as part of the product price. Green dot system logos are printed on the packaging whose manufacturer has paid the fee to the system. This way, consumers who see the logo can recognise recyclable packaging and its fate if disposed of in the appropriate bin. Once collected, green dot systems own in many cases the packaging, which they then sell to reprocessors and converters for further recycling.
44 What is PET?, available at: www.petcore.org/content/what-is-pet 45 Pers. comm...with Paprec

41
2.3.3 Sorting When collected plastic waste is mixed or “commingled” with other recyclables in multi-material collection schemes, the sorting requires steps to separate plastics from glass, paper, cardboards, metals, stones, etc. The same is true if the waste plastic is in mixed municipal solid waste. This type of sorting is usually conducted at Material Recovery Facilities (MRF), which then sell the sorted plastics materials to different recyclers depending on the properties and requirements wanted. Sorting waste plastic means not only to separate plastic from non-plastic content, but also to separate the waste plastic itself into the different plastic polymer categories and colours. This is important due to the fact that for plastic materials to be recycled into useable polymers, a pure stream of one or two polymers must be obtained. Inefficient sorting that leads to a mixture of different types of polymers may lead to a mixed plastic material that is not usable for recycling, or for which recycling is not economically feasible. In addition, in some cases the mix of plastic polymers may even result in safety or health risks; this is the case for example when PVC is mixed in PET recycling, which leads to the release of hydrochloric gases, or seriously impair the integrity of the final product when melting the PET polymers. PET and PVC have particular problems with cross-contamination as they appear visually very similar to one another, and have the same specific gravity (Table 2.2), therefore the use of conventional float and sink techniques may not be successful in separating them. There are two main methods for sorting plastic waste; through manual sorting, and using automated systems. Given the variety of plastics polymers, different techniques exist that are more or less appropriate depending on the type of polymer, including flotation, dissolution, optical sorting (spectroscopic identification, high frequency cameras) or other advanced techniques (using the dielectric properties, the colour, etc.). There is no universal technique as the sorting step greatly depends on the input and output materials. Infrared sorting is quite common for the sorting of packaging. Piezoelectric methods and high frequency cameras can be used to separate PVC. Elutriation is another method used to remove labels or light weight accessories: this process separates particles of different weights thanks to a stream of gas or liquid, usually upwards-oriented. Unfortunately, in the context of recycling of plastic bottles, this process is not suitable for removing cap material, as the weight of flakes produced from the crushing of caps is close to that of flakes resulting from crushing of the bottle46. It is in the interest of recyclers to encourage and promote sorting at source, as it increases plastic waste value and reduces the cost of reprocessing. Poor sorting hampers the economic viability of recycling. Waste from households can be highly contaminated by non recyclable residues: proposals from stakeholders to reduce contamination include improvement and simplification of sorting instructions and facilitation of sorting by reducing the complexity of products through Ecodesign47. Collected and sorted waste plastic is processed by the mechanical recycling industry into different intermediate or final shapes such as shredded plastic, flakes, agglomerates and regranulates, as well as profiles and sheets. These processes normally involve cleaning and removal of contaminants.
46 ACOR (2003), Recycling Guide for Fillers Marketing in HDPE. 47 Pers. comm. with FEDEREC
42
All these preparation steps can stand alone and deliver intermediates, or be an integral part of a conversion operation into end products such as garbage bags, or outdoor furniture.
2.3.4 Removal of contaminants Macro-physical contamination is much easier to remove than contamination at a microscopic level, especially if partially bound (like glues) or embedded by abrasion or impacting. This microscopic contamination can be due to the initial quality of the waste source but also to the baling, transport and handling of the waste (ingrained soil caused by abrasion or grinding). Such impurities may lead to production problems and loss of quality. Finally, chemical contamination, occurring by adsorption of flavourings, essential oils, etc. can lead to global contamination of the waste plastic stream considered. Complete removal of these chemical contaminants requires desorption, which is a slow process decreasing productivity (not common). Therefore, the plastic recycling sector tries to keep the streams as specific and separated as possible. Contaminated material can be used to manufacture low risk applications (e.g. non-food contact fibres). Sorting can be increasingly achieved by automatic identification at material recovery facilities. Automatised separation is largely more effective when accompanied by some degree of source separation, e.g. pre-separation at source of packaging recyclates (metals, plastics, glass, cartons) from organic waste. Sorting costs are still very high in France due to a lack of automation, considering that companies were often SMEs. Despite this delay in using automates, sorting processes are on the way to modernisation and techniques as optical sorting (NIR) start to spread over the sector. NIR and density separation techniques can separate waste plastic contaminated with brominated flame retardants from normal plastics, but these operations are very costly. In Austria, a facility (MBA Polymers) is specialised in the separation of plastics with flame retardants from other plastics48.
2.3.5 Cleaning The final step in the reprocessing of waste plastic is cleaning, which is used to remove contamination of the waste plastic with organic matter. Cleaning usually involves washing with water. The washing water can be treated at the reprocessing plant or led to the sewer. This step can take place after the sorting and the grinding stages as contacts with the treating water are facilitated, but other setups are possible. The washing can be done with hot or cold water, usually under agitation, and caustic soda can be added depending on the washing required. Sometimes, the residual content of packaging can help in the process, e.g. detergents help in the removal of paper labels and oils. Once in a water tank, the density differences of the polymers can help separate different types of plastics by flotation. Water-based glues, which are the most common adhesives, are diluted and removed during the washing process. When the wash water temperature is ambient, the rubber compound based glues cannot be removed during this process. 48 More information available at: www.mbapolymers.at

43
The waste plastic may not require washing, depending on the specifications of the customer. Samples are used to show the buyer the quality of the material and discuss the prices. After the washing operations, rinsing and drying steps can be carried out.
2.3.6 Recycling Two main types of recycling can be distinguished, mechanical and chemical (also called feedstock recycling). Mechanical recycling involves only the melting of the polymer, but not its chemical transformation. To a much smaller extent, recycling also takes place in the EU via chemical recycling, also called feedstock recycling, where a certain degree of polymeric breakdown takes place. An example of this is recycling of plastic in blast furnaces for the production of ‘pig iron’. Out of the total of about 25 Mt of post-consumer waste plastic collected in Europe (EU-27 plus Norway and Switzerland) in 2008, the following quantities were recycled by mechanical and chemical means49: Mechanical recycling: A total of 5.3 Mt of post-consumer waste plastic, representing 21%
of the total post-consumer waste plastic generated in Europe, were mechanically recycled Chemical recycling: A total of 74.7 kt of post-consumer waste plastic, representing only
0.3% of the total post-consumer waste plastic generated in Europe, were chemically recycled
Based on data from APME in 2002-200350, 87% of the mechanically recycled plastics are converted to recycled raw plastic intermediates (e.g. flakes, agglomerates, regrind, pellets, regranulates and profiles) while the remaining 13% are converted directly into products. Usually, the plastic that is directly reprocessed in products comes from the more contaminated streams and results in end uses with lower quality demands such as plant pots, flooring or outdoor furniture. The higher quality plastics can be used for a wider range of applications, with intermediary status as pellets or granules. Converters requiring supplementary virgin material may adapt the ratio of recycled/virgin material in their products, depending on the needs and market conditions. The annual growth in terms of mechanically recycled quantities is estimated at over 12%. In general, most of the mechanically recycled plastics are from the commercial and industrial sectors, with mainly bottles being recovered from domestic sources51. Improvements in the sorting and separation steps could help develop the use of this treatment method.
49 PlasticsEurope (2009) “An analysis of European plastics production, demand and recovery for 2008”, available at: www.plasticseurope.org 50 Aguado, J., Serrano, D.P. and San Miguel, G. (2006) “European trends in the feedstock recycling of plastic wastes”, to be published in Global NEST Journal. 51 British Plastics Foundation, ”Plastics Recycling”, Available at: www.bpf.co.uk/bpfindustry/process_plastics_recycling.cfm

44
Table 2.15 below presents different terms to refer to the two main types of waste plastic recycling (mechanical recycling and chemical recycling), and energy recovery. Energy recover is not within the scope of this end-of-waste study.
Table 2.15. Plastic recycling ‘cascade’ terminology52
ASTM D7209 – 06 standard definitions
Equivalent ISO 15270 standard definitions Other equivalent terms
Primary recycling Mechanical recycling Closed-loop recycling
Secondary recycling Mechanical recycling Downgrading
Tertiary recycling Chemical recycling Feedstock recycling
Quaternary recycling Energy recovery Valorisation
2.3.6.1 Mechanical recycling
Mechanical recycling refers to the processing of waste plastic by physical means (grinding, shredding, and melting) back to plastic products. The chemical structure of the material remains almost the same. At present, the recycling of waste plastic is dominated by mechanical processes. This recycling path is viable when waste plastics are or can easily by cleaned and sorted properly. Added to this, the process requires large and quite constant input. One of the most significant waste streams currently being treated using mechanical recycling is packaging waste. The five predominant plastic families, i.e. polyethylene (including low density-LDPE, linear low density-LLDPE, and high density-HDPE), polypropylene (PP), polyvinylchloride (PVC), polystyrene (solid-PS, expandable-EPS) and polyethylene terephthalate (PET), which are all thermoplastic, are also the most significant for mechanical recycling. The basic operations of mechanical recycling are presented in the Table 2.16 below.
Table 2.16. Mechanical recycling operations Process Description Cutting
Large plastic parts are cut by saw or shears for further processing
Shredding Plastics are chopped into small flakes.
Sorting Additional sorting (e.g. NIR) may be required once the material has been shredded.
Contaminants separation
Contaminants (e.g. paper, ferrous metals) are separated from plastic in cyclone separators and magnets.
Floating/Cleaning Different types of plastics are separated in a floating tank
52 Adapted from: Hopewell, J. et al., 2009. Plastics recycling: challenges and opportunities
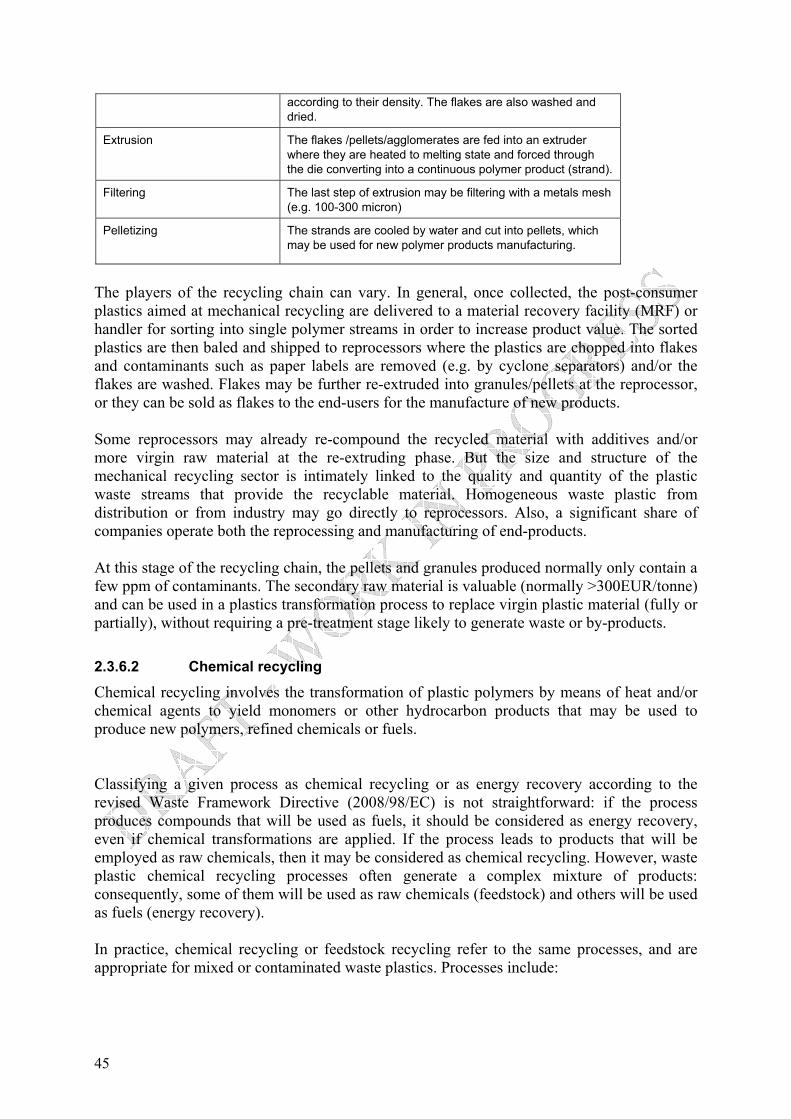
45
according to their density. The flakes are also washed and dried.
Extrusion
The flakes /pellets/agglomerates are fed into an extruder where they are heated to melting state and forced through the die converting into a continuous polymer product (strand).
Filtering The last step of extrusion may be filtering with a metals mesh (e.g. 100-300 micron)
Pelletizing
The strands are cooled by water and cut into pellets, which may be used for new polymer products manufacturing.
The players of the recycling chain can vary. In general, once collected, the post-consumer plastics aimed at mechanical recycling are delivered to a material recovery facility (MRF) or handler for sorting into single polymer streams in order to increase product value. The sorted plastics are then baled and shipped to reprocessors where the plastics are chopped into flakes and contaminants such as paper labels are removed (e.g. by cyclone separators) and/or the flakes are washed. Flakes may be further re-extruded into granules/pellets at the reprocessor, or they can be sold as flakes to the end-users for the manufacture of new products. Some reprocessors may already re-compound the recycled material with additives and/or more virgin raw material at the re-extruding phase. But the size and structure of the mechanical recycling sector is intimately linked to the quality and quantity of the plastic waste streams that provide the recyclable material. Homogeneous waste plastic from distribution or from industry may go directly to reprocessors. Also, a significant share of companies operate both the reprocessing and manufacturing of end-products. At this stage of the recycling chain, the pellets and granules produced normally only contain a few ppm of contaminants. The secondary raw material is valuable (normally >300EUR/tonne) and can be used in a plastics transformation process to replace virgin plastic material (fully or partially), without requiring a pre-treatment stage likely to generate waste or by-products. 2.3.6.2 Chemical recycling
Chemical recycling involves the transformation of plastic polymers by means of heat and/or chemical agents to yield monomers or other hydrocarbon products that may be used to produce new polymers, refined chemicals or fuels. Classifying a given process as chemical recycling or as energy recovery according to the revised Waste Framework Directive (2008/98/EC) is not straightforward: if the process produces compounds that will be used as fuels, it should be considered as energy recovery, even if chemical transformations are applied. If the process leads to products that will be employed as raw chemicals, then it may be considered as chemical recycling. However, waste plastic chemical recycling processes often generate a complex mixture of products: consequently, some of them will be used as raw chemicals (feedstock) and others will be used as fuels (energy recovery). In practice, chemical recycling or feedstock recycling refer to the same processes, and are appropriate for mixed or contaminated waste plastics. Processes include:

46
Chemical depolymerisation: This process involves the reaction of the plastic polymer with chemical reagents, yielding its starting monomers that can be processed to produce new polymers. Different processes exist, depending on the chemical agent; glycolysis, methanolysis, hydrolysis and ammonolysis being the most common. Chemical depolymerisation is only applicable to condensation polymers, mainly polyesters like PET and nylon, and cannot be used to reprocess addition polymers such as PE, PP or PVC53. Nylon depolymerisation is currently only carried out in the USA, and considered not economically viable in EU. Thermal cracking (also called pyrolysis): Involves the degradation of the polymeric materials by heating (usually in temperatures between 500-800°C) in the absence of oxygen. The plastics are converted back into the liquid petroleum products used to produce plastics and new plastics, synthetic fibres, lubricants and gasoline are the end products of the process. It also yields small amounts of carbonised char and a volatile fraction that may be separated into condensable hydrocarbon oil and a non-condensable high calorific gas that can be reused onsite. Therefore, the classification of the pyrolysis process as recycling (tertiary/feedstock recycling) or recovery may vary depending on the final use of the resulting use of output fractions. The proportion of each fraction and their composition depends primarily on the nature of the waste plastic but also on process conditions54. Thermal depolymerisation of polyolefins55, such as PE or PP, tends to break into a variety of smaller hydrocarbon intermediates whereas cracking of some other addition polymers56, such as PS and polymethyl methacrylate, yields a high proportion of their constituent monomers57. The main advantage of this technology when it is integrated with a traditional mechanical recycling process is that it can recycle mixed or commingled streams of plastics with high levels of contamination. Germany and Japan have several such plants already in operation58. Catalytic conversion (also called catalytic cracking): Involves the degradation of the polymers by means of catalyst. This type of conversion offers many advantages compared to thermal cracking including lower degradation temperatures and consequently lower energy consumption, higher conversion rates, and a narrower distribution of hydrocarbon products. Most processes produce higher quality fuels (gasoline and diesel fractions), gaseous olefins and aromatic compounds for the use as raw materials. Therefore, the classification of the catalytic cracking process as recycling (tertiary/feedstock recycling) or recovery may vary depending on the final use of the resulting use of output fractions. Although a commercial plant for catalytic conversion was launched in Poland a few years ago, this process is still mainly at laboratory scale in EU. 53 Aguado, J., Serrano, D.P. and San Miguel, G. (2006) “European trends in the feedstock recycling of plastic wastes”, to be published in Global NEST Journal. 54 Aguado, J., Serrano, D.P. and San Miguel, G. (2006) “European trends in the feedstock recycling of plastic wastes”, to be published in Global NEST Journal. 55 Polymers produced from the polymerisation of a simple alkene as monomer 56 Polymers produced by the addition of monomers, without the loss of any atom 57 Environment and Plastic Industry Council, “Plastic Recycling Overview”. www.plastics.ca/epic 58 Environment and Plastic Industry Council, “Plastic Recycling Overview”. www.plastics.ca/epic

47
Gasification: Gasification refers to the production of synthesis gas (syngas) by partial oxidation of organic matter at high temperatures (typically between 1200-1500°C) under mildly oxidising condition (usually steam, CO2 or sub-stoichiometric oxygen) which differs from the incineration process.59 Syngas, which consists primarily of CO and hydrogen and is free of dioxins and furan compounds, can be used in the synthesis of chemicals (e.g. methanol and ammonia) and to produce synthetic diesel, or may be combusted directly as a fuel. Depending on the waste plastic materials used, other compounds may be present in the gaseous stream and should be removed. The formation of significant amounts of heavy products (with high molecular weight) is one major problem of the process, which decreases the gas yield and in addition creates significant plugging problems60. The synthesis gas produced during the gasification process can be used as chemical raw materials or fuel. Therefore, the classification of the gasification process as recycling (tertiary/feedstock recycling) or recovery may vary depending on the final use of the synthesis gas. This technology has been used for more than half a century and spread all over the world, and especially on a large scale in Germany61 and Austria. However, the administrative and legislative requirements, which are heavier than for conventional recycling facilities, have prevented this technology from being widely implemented in certain other MS. Indeed, there is currently only one gasification plant in operation in Finland, where the official permit costs and requirements have been reported as burdensome. This burden appears to be also a barrier in Ireland62. Gasification facilities must hold a waste incineration licence, and emission measurements must be carried out frequently (in particular, dioxin and flue gas emissions must be measured at least twice a year). Blast furnace reducing agent: This is a special variation of the gasification: the synthesis gas formed is used directly as a chemical reactant to reduce the iron ore in the production of steel. Coal and coke used to be used as reduction agents in the furnace, before being replaced by heavy liquid petroleum fractions, and by plastic waste as first attempts in the 1990s. Voest-Alpine in Austria even uses mixed plastic waste in this process and can substitute up to 25% of the oil with it. Around 300 kt annually of ground plastic waste were used similarly by German companies63, and the process contributes highly to meet the ambitious national recovery target for plastic packaging waste64. The process could be thought of as quaternary recycling (energy recovery), as it is transformed neither into feedstock, nor a plastic product. To date, it has proven reliable and represents the main commercial process for plastic waste (in quantitative terms) within chemical recycling in EU, particularly in Germany65. 59 PlasticsEurope (2008) “An analysis of plastics production, demand and recovery in Europe 2007”, available at: www.plasticseurope.org 61 ASSURRE, “Plastic manufacturing and recycling”. 62 Pers. comm. with the Environmental Protection Agency (Ireland). 63 PlasticsEurope (2009) “An analysis of European plastics production, demand and recovery for 2008”, available at: www.plasticseurope.org 64 TNO “Chemical Recycling of Plastic waste (PVC and other polymers)”, 1999. For the European Commission, DG III.

48
Coke oven chemical feedstock recycling: Plastics can substitute part of the coal used to generate coke for use as the reducing agent in coke ovens (as in blast furnace process above). Hydrocarbon oil and coke oven gas, also produced during this process, are used, respectively, as chemical feedstock and to generate electricity. The classification of the coke oven chemical process as recycling (tertiary/feedstock recycling) or recovery may vary, depending on the use of output fractions. As the products of chemical/feedstock recycling processes may be used both as raw chemicals or fuels, there is no classification of these processes as closed-loop recycling or open-loop recycling, as different compounds can be obtained and used for two different purposes. Consequently, the environmental assessment of one chemical recycling process may even vary depending on the end uses of each plant. Even if the cracking of plastics into its monomers may be more energy intensive than mechanical recycling, a chemical recycling process may have greater environmental benefits than a mechanical downgrading process, depending on the final product’s quality. Chemical recycling is an elegant concept, and despite attracting scientific attention, it has not been widely commercialised so far because the process economics and because the quality of the products is lower than normal commercial grade feedstock66. Also, back-to-monomer recycling is so far only operational for certain types of polymers (PU, PA and polyester) while back-to-feedstock recycling (splitting polymers into raw materials substituting fuel or gas) is less demanding67. Some chemical recycling projects have been brought to the industrial scale, namely in Germany and France68. Feedstock recycling was tried in the UK but judged as economically not viable so that all recycling is currently mechanical69. Question 5 Comments on the potential inclusion/exclusion of chemical recycling in the scope of the end-of-waste criteria are welcome. To what extent would the criteria for mechanical recycling align with the chemical recycling? With the information collected so far, it seems chemical recycling is less stringent on the input quality than mechanical recycling. It also seems that high quality of output could be obtained despite the waste nature of the inputs. At the same time, the non-waste nature of some of the outputs such as synthesis gas is not questioned. Some operations such as in blast furnaces and coke ovens seem clearly out of the scope of EoW. It may thus make sense to concentrate on the priority stream, that is, mechanical recycling.
66 Juniper Analysis, “Plastic waste“, 2006. Available at www.juniper.co.uk/services/market_sectors/plastics.html 67 Wollny V. and Schmied M., 2000. Assessment of Plastic Recovery Options 68 Pers. comm. with Valorplast. 69 Pers. comm. with DEFRA.

49
2.4 Uses of recycled waste plastics This section identifies common end-uses for recycled plastic. Table 2.17 provides a general overview of the array of products currently produced. The main end applications of recycled plastics are opaque films and bags for the distribution sector, and building and construction materials. The most consistently present end-use product type is plastic films and packaging containers. In very general terms, LDPE and HDPE can be recycled from packaging. PVC is relatively difficult to recycle, and there are currently no large-scale recycling schemes operating for post-consumer PVC. PP shares many applications with other polymers, making it difficult to quickly identify and separate it, hampering its effective recovery. It is often melt together with the other main polyolefin (PE), which already reduces the quality compared to pure PP or PE and therefore the potential applications. Some applications require stringent requirements in terms of quality, which can require additional treatment (e.g. to produce food grade plastics). For instance, multi-layered containers which enclose the recycled plastic between layers of virgin plastic are being used in some drinks bottles, but recycling cannot eliminate the colours from plastics so they cannot be used in transparent or light coloured applications. A main challenge for the plastics recycling industry is that plastic processors require large quantities of recycled plastics, manufactured to strict specifications, which must remain at a competitive price in comparison to that of virgin plastic.
Table 2.17. Typical end-uses for different types of recycled waste plastic70
High-density polyethylene (HDPE) Containers, toys, housewares, industrial wrapping and film, gas pipes
Low-density polyethylene (LDPE) Film, bags, toys, coatings, containers, pipes, cable insulation Polyethylene terephthalate (PET) Fibres, bottles, film, food packaging, synthetic insulation
Polypropylene (PP) Film, battery cases, microwave containers, crates, car parts, electrical components
Polystyrene (PS) Electrical appliances, thermal insulation, tape cassettes, cups, plates
Poly Vinyl Chloride (PVC) Window frames, pipes, flooring, cling film (non food), toys, guttering, cable insulation, applications not related to the original use (traffic signals, shoes, etc.)
Once plastic waste is collected and treated, it must be converted to useable end products or face disposal. Waste plastic can be recycled into a secondary raw material to form new products directly, or in combination with virgin plastic material. The options for use of recycled plastic depend on the quality and polymer homogeneity of the material; a clean, contaminant-free source of a single polymer recycled waste plastic has more end-use options and higher value than a mixed or contaminated source of plastic waste. The use of recyclates
70 A.Ingham, 2005. OECD study “Improving recycling markets, Chapter 3

50
is heavily dependent on demand, which is influenced by the price of virgin material, as well as the quality of the recycled polymer. In 2000 (see Figure 2.20) it was estimated that products manufactured using LLDPE polymer had the highest ratio of recycled to virgin polymer (recycled material was 10% of total) in comparison with other polymers. Other recycled polymers such as PVC and thermosets were not used at all.
0
10
20
30
40
50
60
70
80
90
100
%
Recycled polymer Virgin material
Figure 2.20. Ratio of recycled to virgin polymer use in EU, 2000 (ACRR, 2004) The small ratio of recyclate to virgin material could be attributed to aspects such as contamination, technological availability and market demand. It is worth noting that these figures are from 2000 and therefore may not provide an accurate vision of the current market for recycled plastic polymers. More recent data from the UK shows significant use of recycled material for PET (see Figure 2.21). However, the ratios remain generally relatively low for other polymers (ACRR, 2004).
Figure 2.21. Ratio of recycled to virgin polymer use in the UK, 2005 As discussed earlier, the market for recycled plastics often involves ‘down cycling’ of plastics for cheaper and less demanding applications (e.g. the packaging and building sectors, opaque dark coloured plastics such as plastic bags and bins) – specifically for LDPE and HDPE plastics. The aim of the recycling industry is generally to keep the same application for a plastic material as the one it had: thus, it is easier to meet the requirements needed for

51
technical or legislative reasons. Because of the variety of the plastics industry, building a map of the precise waste plastic streams going through one type of recycling process and resulting in a specific application would be very hard. Figure 2.22 presents the main destination sectors and application of recycled plastics. Film and bags (around 30% share), miscellaneous building products (14%) and pipes (12%), and fibres in household products (9%) represented the main end uses of recycled plastics in 2002.
Figure 2.22. Destination sectors and main applications of recycled plastics (EU-15 +CH +NO, 200271)
PET has an independent and normally "cleaner" cycle by being mostly used in bottles, and is used either for production of new bottles, or is converted to textile fibres. Clean, recycled PET flake can be converted into many different products competing in the same markets. It is used again in bottles for non-food end uses like household chemicals and cleaners. In areas where local laws allow it such as the EU (Regulation (EC) 282/2008), the use of recycled PET for the manufacture of new drinking bottles is growing rapidly72. Recycled PET main end-uses identified are fibres, non-food bottles and sheets. The PET industry is constantly innovating and there are many developing markets for recycled PET such as:
71 APME, Plastics in Europe 2002 & 2003. 72 PlasticsEurope, the EU Packaging and Packaging Waste Directive, available at: www.plasticseurope.org/Content/Default.asp?PageID=1215
52
Polyurethane foams can be made from polyester polyols73 developed from PET flakes. This material is widely used in building and construction.
Engineered polymers made from recovered PET can be injection moulded to manufacture computer and automotive parts
Other alternative production processes use ‘spunbonded’ PET in the manufacture of shoe liners, webbing, and geotextiles (shoes, backpacks)74
The use of recycled PET for the manufacture of new beverage bottles is growing rapidly75 (in particular, with chemical depolymerisation). The main reasons lying behind the success of PET containers (such as bottles) is that they have a specific molecular structure (set into a web), which makes it unbreakable. Another advantage offered by recycled PET is that its physical properties allow for great freedom in design. Plastic bottles and films are also recycled in non-food packaging and agricultural films. Usually, the plastic that is directly converted in end products without an intermediate regranulate step comes from contaminated streams and results in end uses such as flower pots and other products with low appearance and quality physicochemical demands. The recycling of plastic waste from WEEE containing halogenated flame retardants is allowed only in the production fields where such flame retardants need to be added due to technical requirements.
2.5 Structure of the reprocessing industry Recycled plastic supply and production chains can be quite complex and consist of various types of activities, including brokering, with actors being involved in single or multiple processes in the chain. The market structure varies depending on the type of system set up by national authorities, as regards collection and sorting, especially for households (kerbside collection, drop off locations, refill/deposit systems). Integration and non-integration along the recycling chains also varies widely depending on the national context. The only feature common to all the Member States is that the market is currently dominated by SMEs. A simplified diagram of the structure of the supply and demand sides is provided in Figure 2.23. The vertical line in the middle of the figure sets the usual boundary between the supply side and the demand side, but this can also be between elements of the right hand side, e.g. if intermediates like flakes, pellets or granulates are traded.
73 Alcohols containing multiple hydroxyl groups 74 What is PET?, available at: www.petcore.org/content/what-is-pet 75 PlasticsEurope, the EU Packaging and Packaging Waste Directive, available at: www.plasticseurope.org/Content/Default.asp?PageID=1215
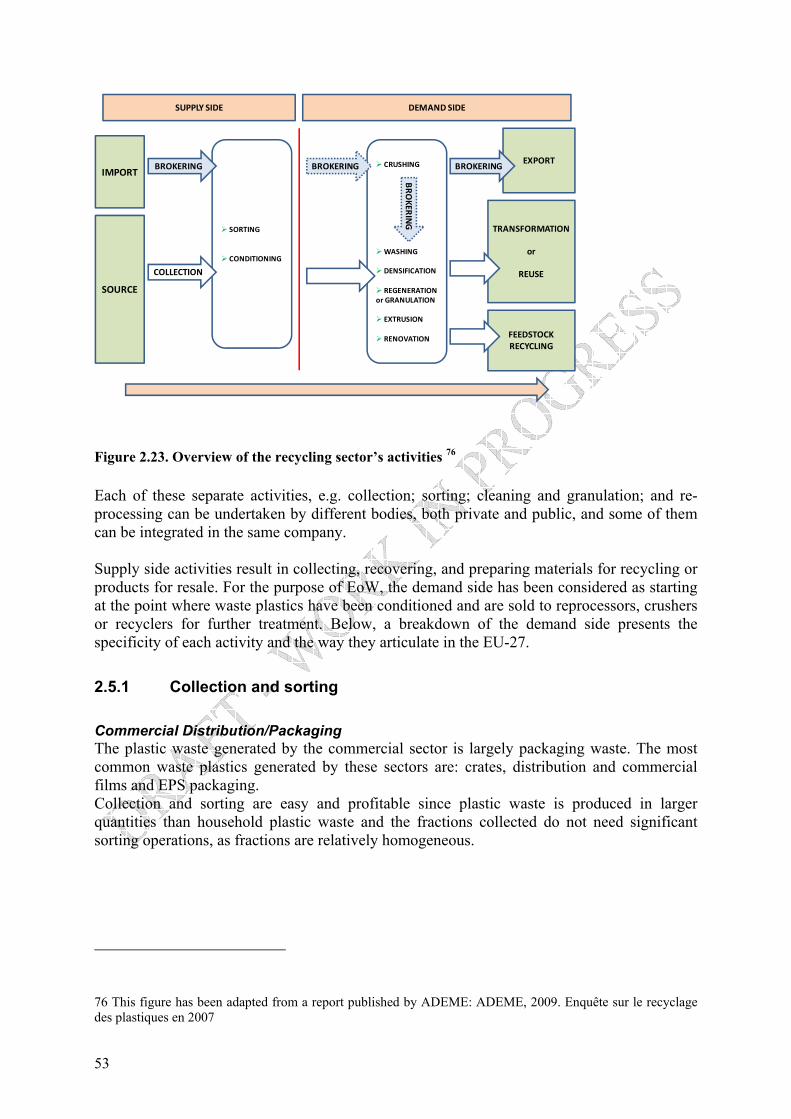
53
IMPORT
SOURCE
EXPORT
TRANSFORMATION
or
REUSE
FEEDSTOCK RECYCLING
SORTING
CONDITIONING
CRUSHING
WASHING
DENSIFICATION
REGENERATION or GRANULATION
EXTRUSION
RENOVATION
BROKERINGBROKERING
BR
OKER
ING
COLLECTION
SUPPLY SIDE DEMAND SIDE
BROKERING
Figure 2.23. Overview of the recycling sector’s activities 76 Each of these separate activities, e.g. collection; sorting; cleaning and granulation; and re-processing can be undertaken by different bodies, both private and public, and some of them can be integrated in the same company. Supply side activities result in collecting, recovering, and preparing materials for recycling or products for resale. For the purpose of EoW, the demand side has been considered as starting at the point where waste plastics have been conditioned and are sold to reprocessors, crushers or recyclers for further treatment. Below, a breakdown of the demand side presents the specificity of each activity and the way they articulate in the EU-27.
2.5.1 Collection and sorting Commercial Distribution/Packaging The plastic waste generated by the commercial sector is largely packaging waste. The most common waste plastics generated by these sectors are: crates, distribution and commercial films and EPS packaging. Collection and sorting are easy and profitable since plastic waste is produced in larger quantities than household plastic waste and the fractions collected do not need significant sorting operations, as fractions are relatively homogeneous.
76 This figure has been adapted from a report published by ADEME: ADEME, 2009. Enquête sur le recyclage des plastiques en 2007

54
Municipal Solid Waste In a majority of European countries, the recycling of waste plastic from households essentially corresponds to packaging waste plastic recycling. This is the main plastic waste stream stemming from households and also the main stream being recycled. Three main systems operate in the EU MS: door to door or kerbside collection, drop-off locations or collection points and the refill/deposit system. The ‘kerbside collection’ system offers a low degree of material contamination. Ireland, Germany, Sweden, Spain and Italy, for example, include all kinds of plastic packaging in their household collection schemes, either in a separate plastic collection fraction or together with other light packaging (‘yellow bin’ system). In Austria and the UK, the collection depends on the region considered: some collect all plastic packaging while other parts of the country only recover bottles for instance. In France, the system mainly focuses on bottles and some flexible plastics, and the question has been recently raised whether to comprise all plastic packaging in the future. Local authorities or municipalities are often involved in the management of household waste. In the UK, they can choose what to collect and how to collect it. In Norway, municipalities own the waste, which is collected by a transporter and recyclers buy the plastics from the municipality77. In France, local authorities have two options: they can either subscribe to the ‘Garantie de reprise’ (recovery guarantee) allowing Valorplast to deal with the collected waste (Valorplast is an intermediary between local authorities and recyclers), or contact the recyclers directly. Major recycling companies as PAPREC and SITA often sign contracts with local authorities, which entitle them to run the waste-related public service (‘delegation de service public’). The ‘collection points’ system is also widespread and often used in combination with the ‘kerbside collection’ system. Finally, the ‘refill and deposit’ system was largely widespread in countries such as the Netherlands, Germany, Switzerland and Austria but is now used to a lower extent since it has been considered as a barrier to cross-border trade78. This has been the case in Finland where the previous refilling system for crates was considered a barrier to trade and removed in 200879. In certain countries such as Denmark, the system is still in place and was extended to mineral water bottles in 200880. The table below illustrates choices made by certain EU Member States in 2002, in terms of collection systems for light packaging, and shows relatively even mix of options taken by the MS screened.
77 Pers. comm. with Erik Oland, from Gront Punkt, Norway 78 EUROPEN, 2009. Modern Beverage Container Policy 79 Communication with Vesa Kärhä, Finnish Plastics Industry Association 80 Packaging waste legislation in Denmark, available at: www.pro-e.org/Denmark
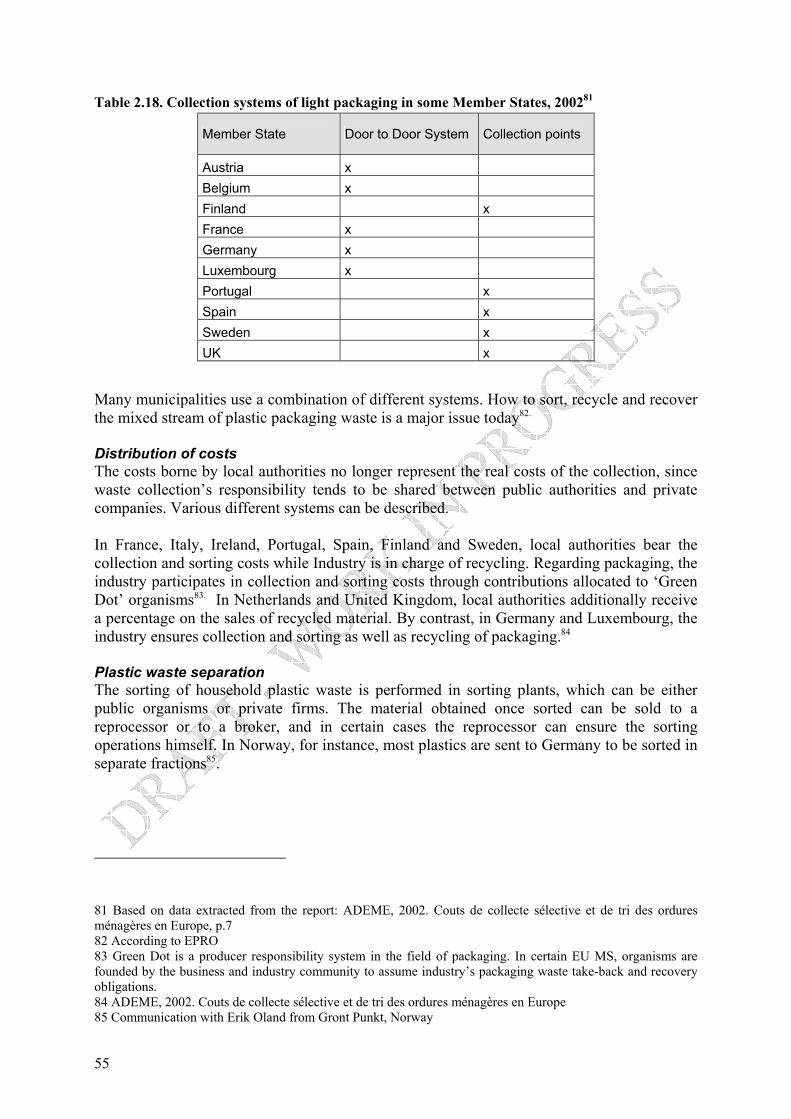
55
Table 2.18. Collection systems of light packaging in some Member States, 200281
Member State Door to Door System Collection points
Austria x Belgium x Finland x France x Germany x Luxembourg x Portugal x Spain x Sweden x UK x
Many municipalities use a combination of different systems. How to sort, recycle and recover the mixed stream of plastic packaging waste is a major issue today82. Distribution of costs The costs borne by local authorities no longer represent the real costs of the collection, since waste collection’s responsibility tends to be shared between public authorities and private companies. Various different systems can be described. In France, Italy, Ireland, Portugal, Spain, Finland and Sweden, local authorities bear the collection and sorting costs while Industry is in charge of recycling. Regarding packaging, the industry participates in collection and sorting costs through contributions allocated to ‘Green Dot’ organisms83. In Netherlands and United Kingdom, local authorities additionally receive a percentage on the sales of recycled material. By contrast, in Germany and Luxembourg, the industry ensures collection and sorting as well as recycling of packaging.84 Plastic waste separation The sorting of household plastic waste is performed in sorting plants, which can be either public organisms or private firms. The material obtained once sorted can be sold to a reprocessor or to a broker, and in certain cases the reprocessor can ensure the sorting operations himself. In Norway, for instance, most plastics are sent to Germany to be sorted in separate fractions85.
81 Based on data extracted from the report: ADEME, 2002. Couts de collecte sélective et de tri des ordures ménagères en Europe, p.7 82 According to EPRO 83 Green Dot is a producer responsibility system in the field of packaging. In certain EU MS, organisms are founded by the business and industry community to assume industry’s packaging waste take-back and recovery obligations. 84 ADEME, 2002. Couts de collecte sélective et de tri des ordures ménagères en Europe 85 Communication with Erik Oland from Gront Punkt, Norway

56
Construction and Demolition A number of experts consulted points to private sector handling of construction waste, and underdevelopment of systems to collect plastic waste from this sector due to lack of consideration at the planning stage in the construction process. Agricultural Another area producing a large amount of plastics is the agricultural sector, which generates large amounts of films (used for example for silage and greenhouse covering, etc). The main hindrance to the recycling of agricultural film 86 is the lack of financing in order to ensure collection and transport of waste films to the recycling plant. As a consequence of the film’s thinness, high tonnages must be transported to make the transport operations profitable. In the UK, Defra is discussing to introduce a producer responsibility scheme to encourage its collection and recovery.87 Norwegian farmers launched voluntary initiatives to collect and sort agricultural films in the mid-1990s, before the introduction of the national plastic recycling scheme88. The main challenges are the quality of the films, which need to be washed before reprocessing, and the long distances of transportation of a frequently heavily soiled material, which require optimising the transport system. Most farmers bring their recyclates to local recycling stations, but larger farms can also be visited by waste collectors. Green Dot Norway is then in charge of continuing the process. It collaborates with many waste collectors and ensures suitable baling of the material. There is a raising interest of public authorities to increase the recycling rate of this plastic waste stream, and recycling in this area is increasingly structured. Automotive Plastics in vehicles are used for their distinctive qualities, such as impact and corrosion resistance, and low weight, and low cost compared to alternative materials. Despite the relatively high recycling rate for ELVs, the proportion of plastics being recycled from ELVs is extremely low. One reason for this is the wide variety of polymer types and additives used, due to the demands of each specific each application. End-of-life vehicles are dismantled by specialised companies.
Electrical and Electronic Equipment Collection of WEEE is not well-organised in a large majority of EU MS. The existing systems include collection points established by municipalities, obligation for producer to take back the waste product, and voluntary collection by social organisms. There are two points at which plastic from WEEE can be sorted: during the dismantling process or after equipment has been shredded89. Although WEEE products can often be recycled entirely, the recycling of the plastic components can cause problems because of the content of flame retardants. A growing trend of WEEE dismantling has been witnessed during
86 ADEME, 2004. Gestion des films plastiques agricoles usagés : analyse des expériences existantes et des problèmes soulevés 87 Information available at: www.letsrecycle.com. Website provided by Department for Environment, Food and Rural affairs. 88 PlasticsEurope, 2009. An analysis of European plastics production, demand and recovery for 2008, available at: www.plasticseurope.org 89 Wastewatch, Plastics in the UK economy, a guide to polymer use and the opportunities for recycling

57
the last few years, as demonstrated by a study of ADEME90. In Ireland 100% of WEEE is exported to be sorted and reprocessed abroad91. 2.5.1.1 Conditioning
Conditioners carry out value-adding processes, such as compacting waste plastic into bales. 2.5.1.2 Reclaimers
This category is very generic, as the companies included can run several different activities such as transport of waste, brokering and recovery (leading to the production of recyclates). It is worth noting that in certain cases brokers might be counted separately. 2.5.1.3 Crushers
Crushers process waste plastic, and this crushed plastic will be later reintroduced in a production process or sold to plastic reprocessors/converters who will re-granulate it, add additives, colours etc. 2.5.1.4 Reprocessors
The activity of reprocessors usually consists of the production of recyclates like pellets, aggregates, regrind, and flakes taking waste plastic as input, but it can also involve melting and extrusion, in which case the output are regranulates or profiles. In some cases, especially for lower quality plastics, the regranulate/profile step is by-passed by direct conversion to end-products, such as or outdoor furniture. 2.5.1.5 Brokers
Brokers are involved at various levels of the recycling chain. On the supply side, brokers play a role by importing waste plastic which will eventually be sold to undergo further sorting and conditioning treatments or will be directly sold to the reprocessors. On the demand side they play a role after the sorting and cleaning operations, at a point where the waste plastic is generally conditioned or crushed (e.g. in bales) to be sold to crushers, reprocessors or recyclers. 2.5.1.6 Converters
Converters manufacture semi-finished or finished products by a number of operations involving pressure, heat and/or chemical addition, using as input a plastic intermediate, normally as powder, flakes, regranulates, pellets, aggregates or profiles. The process involves the re-melting of the plastic, and may also involve extrusion and filtering.
90 ADEME, 2009. Enquête sur le recyclage des plastiques en 2007 91 Pers. comm. with Louise Connolly from the Irish organism ‘Rx3’. To progress the development of new markets for recyclables, the Irish Government established the Market Development Group Rx3 for ‘Recycle, Rethink, Remake’. Available at: www.rx3.ie

58
2.5.2 Examples of plastics recycling market structure in some Member States
The data presented below serves as an illustration of the structure of the plastic recycling markets in various MS. However, constant market changes are reported in this sector, partly due to the variety of end products and qualities, and the variety of activities that can be carried out by each company along the recycling chain. France The waste plastic recycling sector in France in 2007 consisted of 69% reclaimers and 15% recyclers. Crushing manufacturers accounted for 11% and brokers and renovators represented only 3 and 2% respectively. Table 2.19 below presents an overview of the evolution of the recycling sector between 2000 and 2007, showing a relatively small increase of the number of reprocessors, with only 16 new recyclers in 7 years. Their number decreased from 116 in 2005 to 104 in 2007, which might result from a trend to concentration of the activity. An increase in the amount of waste plastics collected has not lead to an increase of the number of reprocessors, rather the size of the recycling companies has grown by ca. 5% per year.
Table 2.19. Evolution of the number of establishments by profession in France Year 2000 2002 2005 2007 Renovators 13 20 19 14 Reprocessors / Recyclers 88 83 116 104 Crushers 59 62 59 79 Brokers N/A N/A 17 23 Reclaimers (incl. Brokers in 2000 and 2002)
172 196 278 492
Total 332 361 489 712
N/A: Data not available The number of companies specialised in waste plastics crushing/shredding has increased from 59 to 79 between 2000 and 2007. This appears to be partly explained by the growing WEEE dismantling activity recently observed across all Europe. Consequently, the tonnage of waste treated by such establishments increased by 40% in 2 years. The recovered plastic streams produced consist in 58% of crushed waste and 35% of sorted waste. In France, 55% of the production of this branch is exported90.
Ireland Table 2.20 shows a basic breakdown of the actors operating in the Irish plastic recycling market in 2010.
Table 2.20. Number of operators by profession in the plastic waste sector in Ireland, 201092 Types of operators Number of operators
92 Pers. comm. with REPAK and Rx3

59
Recovery operators 157 Reprocessors 36 Brokers supplying the market with Irish packaging waste (incl. Irish, UK and Asian brokers)
88
Belgium There are about 45 companies operating in the field of plastic mechanical recycling in Belgium93,94. Table 2.21 below gives an overview of the types of activities performed by these companies. Some of them operate only in the sector of pre-consumer waste, some only in the field of post-consumer waste, while others do both.
Table 2.21. Number and activities of companies operating in the plastic recycling sector in Belgium, 2009
Number of companies involved
Sorting & Conditioning
Crushing & Regrinding
Reprocessing & Compounding End -Products
4 X 9 X 1 X 8 X 5 X X 14 X X 4 X X Hungary Table 2.22 provides an overview of the plastic recycling market structure and capacity in Hungary in 2010.
Table 2.22. Plastic recycling market structure and capacity in Hungary in 201095
Types of activities Number of companies involved in these activities
Total capacity in tonnes per year
Plastic waste collection companies (Average number) 125 N/A
Companies producing regrinds/agglomerates 27 122 800 Companies producing PET washed regrinds/agglomerates 3 22 500
Companies producing regranulates 25 87 000 Companies owning washing equipments 7 42 000 Companies manufacturing end-products (directly from mixed plastic waste) 2 10 800
N/A: Data not available 93 Plamerec, 2009, Guide of the Belgian Plastics Recycling Industry, available at: www.federplast.be/DOWNLOADS/RECYCLING%20GUIDE%202009.pdf 94 According to a Pers. comm. with Plarebel, the document is not completely exhaustive 95 Pers. comm. with the National Association of Recyclers in Hungaria, based on 2009 and 2010 data

60
2.5.3 Additional considerations on competitiveness of the market SMEs How the recycling industry is organised in a MS depends significantly upon government rules and regulations, and varies from an integrated system (such as that in Germany) to decentralised schemes (such as in France). Many of these firms are relatively small. Reclaimers tend to be the smallest of the enterprises involved, even though they are at the heart of the recycling process, and reprocessing firms are typically SMEs in the range of 5,000 - 20,000 tonnes per annum (2005 data).96 The size of the companies involved at different stages of the recycling chain can be partly explained by the diversity of polymers and products, especially in comparison to other products like steel and aluminium. Also, the investment necessary to launch a company in the recycling area appears relatively small. However, due to their size, SMEs can experience difficulty maintaining profitability, considering the instability and volatility of recycled plastic prices. The larger size of the enterprises involved in virgin plastic production means that they are better able to smooth out profits and losses. The costs of collecting, sorting and transporting plastic waste to reprocessors can exceed revenue generated by the sale of the resulting recovered plastic waste. This can be supported to a certain extent by some form of subsidy or other financial contributions such as the payments made by national Green Dot organisms97. Market size and concentration In Germany, some reprocessing SMEs report that their larger supplier (Green dot Sytems) have in the last years reduced the standard contract duration of supply of plastic waste from 1 to 2 years to a few months. This is probably a market strategy to adjust prices in the current market conditions of rising oil and virgin polymer prices. The consequence is that it becomes more and more difficult for these SMEs to sign long-term contracts of delivery of their product (pellets, flakes, regranulates) when there is so much uncertainty about the input. A growing number of such SMEs are closing down , and are being bought by e.g. Green dot Sytems, which then expand their activity from the collection and sorting of packaging plastics, to the manufacture of the higher value-added regranulates, and the direct supply to converters. Around 3,000 companies in Europe are active in the mechanical plastics recycling industry meaning that they use machines to shred, grind, wash, regenerate and/or compound98. About 80% of the total volumes that are mechanically recycled are, however, processed by less than 100 companies, so elements of the market are more concentrated. Most companies specialise in specific fields of the waste plastic stream, doing for example only PVC waste and others doing only PET bottles98. However, some companies have links with either larger plastic converter groups or waste collection companies.
96 Ingham A., 2005. OECD study “Improving recycling markets, chapter 3 97 Green Dot is a producer responsibility system in the field of packaging. In each of the 27 Member States, organisms are founded by the business and industry community to assume industry’s packaging waste take-back and recovery obligations. 98 Life Project APPRICOD, Guide ‘Towards Sustainable Plastic Construction and Demolition Waste Management in Europe’
61
Comparison of virgin and recovered plastic market structure Recovered plastics markets are still small and immature in comparison with the size of the market for virgin plastics. Consequently, recovered plastics prices are not determined by production costs as they would be in an efficient market. Instead, recovered plastics prices are pegged to the price of virgin plastics in the long run. The fact that the supply of recovered plastic is not directly linked to demand indicates that the recovered plastic market is not self standing, and may depend on variations in the virgin plastic market. Other factors preventing the maturation of the market are potentially the lack of sufficient supply or capacity. Plastic recyclers frequently suffer from a lack of plastic waste supply, especially since a large share of the waste plastic collected (and/or sorted) is exported to the Far East99. Only some markets are well-established. This is the case of recycled PET used in fibre (e.g. carpets, clothing and strapping) of HDPE used in various applications End-user perception100 The use of recycled plastics by consumers is restricted by a negative perception of the quality of this material, affecting the development of recycled plastics market. However, this impact is lessened when the recycled plastic enters as an intermediate good, end-users being less aware (or not at all) of its presence. Beyond their perception, buyers may also be wary of entering the market because they do not have full information about the quality of the final product manufactured from recycled materials. In efficient markets such information is diffused effectively as market participants monitor the choices of other agents. However, for new products there may be significant lags before diffusion of information is clearly established. Additionally, in the absence of market signals which reflect the benefits of recyclability, product design will be inefficient. Such problems may be particularly important in the plastic packaging area. The information chain and consumer perception play an important part in the achievement of a mature market for recycled plastics. As long as the information chain remains incomplete, and in the absence of market signals influencing consumers’ perception, the market evolution will be slowed down. To control this instability, some recyclers have called for legislative changes such as the introduction of a minimum required percentage of recycled material in PET bottles. This could help the market to grow in maturity by ensuring outlets and hence increase demand and modify consumer perception. It is worth noting that some big companies producing drinking
99 EUPR, 2010, How to increase the mechanical recycling of post-user plastics, Strategy paper, p17, available at: www.plasticsrecyclers.eu/uploads/media/eupr/HowIncreaseRecycling/1265184667EUPR_How_To_Increase_Plastics_Recycling_FINAL_low.pdf 100 Ingham A., 2005. Improving recycling markets, chapter 3, OECD

62
bottles have already started to implement this requirement and incorporate a large fraction of recycled PET in their production process101.
2.6 Economic and market aspects of plastic recycling
2.6.1 Costs of plastic recycling The main factors affecting the profitability of recycling include the price paid to the collector or intermediate processor, the processing costs, and the selling price. The price paid to the collector is dependent on the collection method used and the distance from generation to the recycler. Processing costs are determined by the quality of the material, the type of polymer, as well as by the facility and the types of technologies used. Vertical integration and economies of scale existing in virgin polymer production are not generally available to operators of the plastic recycling chain, which makes their margins very narrow. Costs of collection The costs of collection vary widely depending on the collection system. For instance, in UK collection fees of material by a business or exporter (on an ex-works basis) can range from €17 to €40 per tonne depending on material quality, volume, location and transport costs102. Separated pre-consumer waste is relatively cheap to handle, as the main cost involved relates to collection with low additional costs, and the amounts are generally large. Collection costs from households are considerably higher, but vary according to whether an urban or rural area is involved103. A 2004 study104 states that the costs of selective collection systems currently range from between €50 per tonne (for PVC windows) to €800 per tonne (for EPS). Costs differences result from differences between schemes (kerbside collection, Drop off collection points, combination of both etc.). Prices paid to intermediates Prices are paid to intermediates such as brokers. The exact terms of contracts negotiated between sellers and intermediates as well as between intermediates and buyers are at their discretion and rely on pricing references only to a certain extent, especially in the field of recycled plastics where prices and certain market are unstable and fragile.
101 Victory M., Recycled PET market hit by downturn, available at: www.icis.com/Articles/2009/06/22/9225435/recycled-pet-market-hit-by-downturn.html 102 Information available at: www.letsrecycle.com/prices/plastics/ 103 Bacon P. and associates, 2008. Examination of impact of recent price collapse in markets for recyclate materials and required intervention 104 APME, ECVM, EUPR, EUPC, 2004, Waste Plastics Recycling – A good practices guide by and for local and regional authorities

63
Costs of transport These are highly dependent on local conditions, but are estimated to be around €27 – 45 per tonne in the EU in 2004. An average of €70 per hour per truck for 1 to 5 tonnes of clean separated plastic waste is also reported105. Figure 2.24. EU costs of transport of plastic waste in € /tonneto Figure 2.26. EU transport of plastic waste, weight carried by trucks 106below depict the evolution of transport costs of plastics in the last decade:
Figure 2.24. EU costs of transport of plastic waste in € /tonne106
Figure 2.25. EU transport of plastic waste, distances covered in kilometres 106
105 Recyclage-Récupération, 19th-24th May 2010, 106 Valorplast, 2nd quarter 2010, Votre partenaire pour le recyclage des emballages plastiques

64
Figure 2.26. EU transport of plastic waste, weight carried by trucks 106 Costs of sorting In 2004, the costs of sorting ranged from €50 per tonne to around €200 per tonne (HDPE bottles). Similarly to collection costs, improvements in current technologies, and development in new automated technologies will predictably decrease costs107. Costs of disposal of rejects The cost of disposal of material rejected from waste plastic reprocessing amounts to around € 10-220 per tonne. This cost might have increased recently pursuant to the raise of landfilling taxes and levies applied in many Member States. However, as collection, sorting and processing technologies become more efficient, the quantity of reject material is predicted to decrease107. Costs of recycling and pre-treatment Recycling and pre-treatment costs vary widely depending on the type of technology used and on the polymer recycled. below gives an overview of the average costs of recycling in Scotland and highlights the margin to pay for the operations involved by recycling. The choice of higher costs leads to a higher quality product.
Table 2.23. Comparative price for plastic products and material used in Scotland108
Recovered Material Cost (€/tonne)
Sale value as product (€/tonne)
HDPE, separated, baled 85-155 2055
LDPE Silage wrap Zero or gate fee charged 720
Mixed plastic 0-40 360
107 APME, ECVM, EUPR, EUPC, 2004, Waste Plastics Recycling – A good practices guide by and for local and regional authorities 108 Pringle R.T. and Dr Barker M. B., Napier University Edinburgh, (2004). Starting a waste Plastic recycling business, p 53.

65
In France, for 1 tonne of clean separated plastic waste, free of contamination, the following average costs have been described: €150 for crushing; €152 for washing and drying; €150 for micronisation and €230 for granulation. Pre-treatment and recycling costs amount to an average of €682.
2.6.2 Costs of regulatory compliance and administrative work For the purpose of their activity, recyclers and reprocessors have to support various administrative costs arising at different steps of the recycling chain. Recycling licences / fees In England and Wales the charges in 2009/2010 for registering as a transporter or as a broker of controlled waste were: Registration: €172; renewal of registration: €118; registration of a carrier who is already registered as a broker of controlled waste: €45109. Brokers or dealers arrange the collection, recycling, recovery or disposal of controlled waste on behalf of another person, without ever taking possession of or storing the waste.110 Costs of exports In Ireland, exporters must pay a fixed annual fee on green and amber listed waste shipped111. Plastics are generally included in the green list unless it is mixed with other material or contaminated by dangerous substances. For this category of waste the fee amounts to €250 per year, plus €0.60 per tonne of waste shipped112. Similar charges are paid in other MS. There is one charge per notification which is payable when the notification is made. The charge depends on whether the waste is being imported or exported to/from the MS; the purpose of the shipment, whether it is for recovery or disposal and the band into which the number of shipments included in the notification falls. The cost for a shipment of waste from UK for non-interim recovery amounts to €1970113. In France, since 2009 the General Tax on Pollutant Activities applies also to waste exporters, except if the waste is shipped to be recycled114. In 2010, the tax was between €3.5 and €7 per tonne for waste shipped in a country to be treated in an incineration plant, and will rise every year (€8-14 per tonne in 2015). The tax aims at reducing waste disposal and transboundary shipments of waste.
109 Respectively £152, £104 and £40. The conversion is based on the exchange rate of the 15/04/2010. Available at: www.exchangerate.com/ 110 Netregs, Waste brokers and dealers: what you need to do, available at: www.netregs.gov.uk/netregs/111708.aspx 111 Pers. comm. Mrs. Connolly from the Irish organism ‘Rx3’ 112Dublin City Council, Revised Charging Structure for Amber and Green listed Waste, available at: www.dublincity.ie/WaterWasteEnvironment/Waste/WasteCollectors/National_TFS_Office/Pages/RevisedChargingStructureforAmberandGreenListedWaste.aspx 113 The Transfrontier Schipments of Waste Regulation 2007, Charges in England and Wales payable to the Environment Agency, available at: www.environment-agency.gov.uk/static/documents/Business/relevant_fees_1778235.pdf. The conversion is based on the exchange rate of 15/04/2010, available at: www.exchangerate.com/ 114 Chambre de Commerce et d’industrie de Paris, Taxe générale sur les activités polluantes (TGAP) appliquée à l’élimination et au transfert des déchets, available at: www.environnement.ccip.fr/Transversal/Aides-et-taxes/Dechets/Taxes-dans-le-domaine-des-dechets/Dechets-menagers-et-assimiles/TGAP-Elimination-et-transfert-de-dechets
66
On the other hand, two other Member States’ experts interviewed (Sweden, Belgium) declared that there was no specific fee to be paid by waste exporters in their own MS115. Request for food contact authorisation The National Authority shall give an opinion within six months of receipt of a valid application as to whether or not the recycling process complies with the conditions laid down in Article 4116 of Regulation 282/2008/EC on recycled plastic materials and articles intended to come into contact with foods. After that step, a request must be submitted to European Food Safety Agency (EFSA). France Plastique Recyclage (PET recycling company) provided an overview of the authorisation process at the French national level. The French Food Safety Agency (AFSSA) has set up a test based on strict standards assessing each step of the recycling process i.e. collection, sorting, regeneration, decontamination etc. The candidate must comply with this test and obtain a certification to go further and solicit the European authorisation. According to the certification document (‘Avis’) emitted by the Agency117, evidence has to be provided by the candidate regarding each stage of the industrial process at which a quality control is done, and particularly the regeneration phase (washing, crushing) during which possible contaminants must be removed. Costs cannot be precisely estimated since they are dependent on the purchase of high quality machines, increased quality controls, and to a certain extent on paperwork.. Costs of compliance with REACH One of the obligations under REACH that EoW material would have to fulfil is the creation of Safety Data Sheets for recyclates. This obligation is difficult to formulate in the precise form required, as recyclers do not receive the necessary REACH-related information when buying their input material, and the input stream constantly varies in composition118. The costs of compliance with REACH are mostly linked to the creation of safety data sheets and the obligation to carry out risk assessment. This administrative burden entails costs, but they are currently not considered as ‘major’ by some recyclers119.
2.6.3 Prices 2.6.3.1 General price considerations
The prices for waste plastic are largely determined by the price of finished plastic and the products. Other elements influencing waste plastic prices are: Availability - which depends on the collection scheme, and the patterns of consumption;
115 Pers. comm. with FTIAB in Sweden (Swedish Green dot organism), and Geminicorp in Belgium 116 Commission Regulation 282/2008/EC of 27 March 2008 on recycled plastic materials and articles intended to come into contact with foods and amending Regulation (EC) No 2023/2006, available at: eur-lex.europa.eu/LexUriServ/LexUriServ.do?uri=OJ:L:2008:086:0009:0018:EN:PDF 117 AFSSA, April 2009. Avis, available at: www.afssa.fr/Documents/MCDA2008sa0374.pdf 118 Recycler demand reforms to maintain the sustainability of plastic recycling, February 2010, available at: www.britishplastics.co.uk/x/guideArchiveArticle.html?id=32723 119 Pers. comm.. with Mark Burstall, from the British Plastic Federation Recycling Council Ltd
67
Quality – depends on the collection scheme and the technology for separation; International demand of plastic products; International demand of waste plastic, trade quotas, shipping costs; Price of oil; Legislation constraints – administrative burdens, pollution abatement requirements for
plastic production; Costs of alternative outlets to recycling.
Starting from collection, the purchase costs can be positive or negative (meaning the collection origin has to pay for collection and recycling), depending on the purchase contract, some including price guarantees (e.g. large commercial sources). As long as the costs of the alternatives (landfill/incineration/other) exceed the costs of waste plastic collection and reprocessing, there is an economic basis for waste plastic recycling. In most cases the profit margin and the net price (free delivered sales price minus outbound transport costs) are the main drivers for deciding where waste plastic is sold to. Like any other commodity, waste plastic is delivered to the best bidder. In some cases, specific waste plastic grades can have limited outlets because only a few plants can use it in their plastic conversion process. Basically, there is no difference between domestic and exported waste plastic quality. The demand of given qualities of waste plastic strongly depend on the targeted quality of the plastic producer's finished products, and the production techniques. Reprocessors and merchants are continuously looking for markets and good price opportunities. Other reasons for outlet management of waste plastic are e.g. risk spread, logistic optimization, or exchange rates. The price setting is usually based on standard grades (mostly based on business-to-business specifications). Experts mention that the price-setting mechanism described is not expected to change significantly for waste plastic that has ceased to be waste. 2.6.3.2 Waste plastic prices
A list of waste plastic prices in Germany is provided in Table 2.24. The list displays the prices of waste plastic material of different types before further reprocessing.
Table 2.24. Prices of some waste plastic grades– Germany, November 2009 (€/tonne) Plastic type Nov 2009 Oct 2009 Aug 2009 PE Production waste HDPE coloured HDPE clear LDPE coloured LDPE clear
300 - 450 400 - 530 250 - 400 330 - 430
300 - 450 400 - 530 250 - 400 350 - 450
300 - 450 400 - 530 250 - 400 350 - 450
PE Post user PE Film: Transparent PE Film: Transparent (coloured)
250 - 305 20 - 70
240 - 280 20 - 70
300 - 335 20 - 100

68
In the UK (Table 2.25 and Table 2.26), for the same type of plastic waste, the prices are different depending on whether the material is sold on the domestic market or exported 120.
Table 2.25. Prices of some waste plastic grades, baled, for domestic UK market 121 Waste plastic film type for recycling March 2010 (€/tonne) Printed/coloured 260 – 300 Clear/Natural 365 – 410
Table 2.26. Prices of some waste plastic grades, baled, for export from the UK 121 Waste plastic film grade for recycling (clear film/coloured film ratio)
February 2010 (€/tonne) March 2010 (€/tonne)
80/20 105 - 140 90 - 125 90/10 205 - 250 195 - 240 95/5 250 - 290 240 - 285 98/2 285 - 355 285 - 345 Ground or crushed waste plastic (PE/PP) prices range between 20 and 530 €/tonne in the EU, depending on many factors such as the polymer type, the source (pre- or post-consumer), and the degree of cleanliness of contaminants. The average price difference between sorted, waste plastic prior cleaning and flakes/pellets/aggregates is of between 100 and 200 €/tonne122, and of 200-400 €/tonne if compared to melted and filtered material, e.g. regranulates. As with any other recyclable material, purer forms of waste plastic offer greater opportunities for market development, while mixed waste plastic has higher contamination and currently offers lower potential profit for recyclers. Recycled plastics of all types and grades were hit by the 2008 crisis and consequently prices decreased substantially. However, in 2009 and 2010, prices have started to recover their initial levels, although for some polymers, prices are still below their 2007 level. Waste plastic price trends Figure 2.27 provides an illustration of the evolution of average prices for certain regrind plastic polymers between 2001 and 2007. Natural (non-returnable) PET in bales has undergone the greatest increase (approximately a €200 rise, from a starting price of just over €50 in 2002), while the other waste plastic types have increased by similar amounts (around €100 to €150). A general fall in prices is noticed between 2001 and 2002, and have also repeated in year 2008 (see Figure 2.28).
120 Information available at: www.letsrecycle.com/prices/plastics/ 121 Information available at: www.letsrecycle.com/prices/plastics/ Prices expressed in GBP have been converted in Euro according to the exchange rate of the 16th of April 2010, available at: www.exchangerate.com 122 Information available at: www.plasticsnews.com/polymer-pricing/recycled-plastics.html Prices have been converted in Euro per tonne for prime polymer, unfilled, natural color, FOB supplier. The conversion is based on the exchange rate of the 5th of February 2010, 1USD = 0,73 Euro, available at: www.exchangerate.com/)

69
Figure 2.27. Evolution of average prices for some waste plastics (grinding stock) in Germany 2001 – 2007 in €/tonne
Figure 2.28 shows the prices of clear and light blue PET bottles between 2002 and 2010. The red line corresponds to highest prices paid for one tonne of material at a given date while the blue line refers to the lowest prices.
0
50
100
150
200
250
300
Feb-
02A
ug-0
2Fe
b-03
Aug
-03
Feb-
04A
ug-0
4Fe
b-05
Aug
-05
Feb-
06
Aug
-06
Feb-
07A
ug-0
7Fe
b-08
Aug
-08
Feb-
09A
ug-0
9Ja
n-10
Mar
-10
Lowest prices
Highest prices
Figure 2.28. Evolution of prices of clear PET bottles on the UK market between 2002 and 2010, in €/tonne123
123 Prices have been extracted from the following website: letsrecycle.com. Conversion to €/tonne has been calculated using annual currency rates.

70
Figure 2.29 shows the prices of single colour/natural HDPE film between 2002 and 2010. The red line corresponds to highest prices paid for one tonne of material at a given date while the blue line refers to the lowest prices.
0
50
100
150
200
250
300
350
400
450
500Fe
b-02
Aug
-02
Feb-
03A
ug-0
3Fe
b-04
Aug
-04
Feb-
05A
ug-0
5Fe
b-06
A
ug-0
6Fe
b-07
Aug
-07
Feb-
08A
ug-0
8Fe
b-09
Aug
-09
Jan-
10*
Mar
-10*
Lowest prices
Highest prices
Figure 2.29.: Evolution of prices of single colour/natural HDPE film on the UK market between 2002 and 2010, in €/tonne 124 In 2010 : prices for the export market
Impact of the duration of contracts Some experts underline that price also depends on the kind of agreements made with buyers. If waste plastic bales are sold the framework of long term contracts covering a period of 3 to 4 years, the prices paid are rather stable, based on official market price references for virgin plastic polymers, and respect a bottom price. On the other hand, short term contracts are more subject to price variations, but seem on the increase after 2008, responding to the suppliers' pressure in order to benefit from raising oil prices. Recycled polymer prices compared to virgin polymer prices The current price of virgin plastics is around 1200 €/tonne for primary PE and PP polymers, and the price of secondary plastics is between 600 and 800 €/tonne for secondary PE and PP. Table 2.27 below provides some further examples from the US market.
Table 2.27. Polymer pricing of recycled plastics, 2010 (€/ tonne)125
Polymer/Grade Clean regrind or flake Pellets
HDPE
124 Prices have been extracted from the following website: letsrecycle.com. Conversion to EUR/tonne has been calculated using annual currency rates 125 Information available at: www.plasticsnews.com/polymer-pricing/recycled-plastics.html Prices have been converted in Euro per tonne for prime polymer, unfilled, natural color, FOB supplier. The conversion is based on the exchange rate of the 5th of February 2010, 1USD = 0,73 Euro, available at: www.exchangerate.com/)

71
Natural, post-consumer 616– 680 778 - 843
Mixed colours, post-consumer 421 - 519 583- 681
Mixed colours, industrial 438 - 551 567 - 681
HMW-HDPE film, post-consumer -- 437 - 502
LLDPE stretch film -- 437 - 502 Clear, post-consumer -- 535 - 632
Coloured, post-consumer 340 - 405 437 - 502
Figure 2.30 below shows indexed variations of prices between 2007 and 2009 compared to the base year’s prices (100 in year 2005) for virgin and recycled plastics: the two graphs can be compared to each other in terms of price variation but not in terms of prices as such. As an example, during the 4th semester 2007, virgin plastic prices had increased by 30.6% compared to their 2005 level while recycled plastic prices increased by 87% compared to their 2005 level. The figure illustrates clearly the link between virgin and recycled plastic prices. Indeed when virgin plastic have been high, recycled plastic prices have also been high. Following the financial crisis, prices of both material fell sharply.
Figure 2.30. FEDEREC Recycling Observatory, 4th quarter 2009, Price Index126. Left: virgin plastic price index, right: recycled plastic price index.
2.6.3.3 Recycled plastic price volatility
Waste plastic markets are extremely volatile, and prices have ranged from 50 to 500 euros per tonne of the most traded grades in the last 10 years, with prices as high as 700 euros per tonne being recorded at peak demand periods for the highest qualities. Updated prices of most grades are widely available in most countries, and historical records of the 5-10 main traded grades are also available.
126 FEDEREC, 4th quarter 2009, Observatoire de la récupération, du recyclage et de la valorisation. Prices are in base 100 : 2005
72
The supply markets for waste plastic are, in economic terms, inelastic. Demand and supply do not adjust quickly to price signals and to other changes in market conditions. This is a main reason for price volatility. Because much of the waste plastic collection is part of political commitments and targets, particularly in Europe, supply will continue irrespective of the price of waste plastic (i.e., the European supply is relatively price inelastic). In case of a negative demand shock it is conceivable, although unlikely, that prices of low grade waste plastic could fall to levels below the cost of collection and reprocessing, requiring intervention to ensure that the political commitments and/or recycling targets are achieved. Demand is to a lesser degree inelastic, as plastic manufacturing plants are large entities. Collection and apparent consumption of waste plastic are getting closer, and stocks of plastics are becoming increasingly tight in the EU. This "real time" operation mode is apparently in conflict with the logistics of international container shipping, contributing to price instability and encouraging broker speculation. Such speculation is fed additionally by the opportunistic behaviour repeatedly observed in some large buyers with large stock capacity, e.g. in China, which instead of supporting long-term purchase contracts prefer to follow prices and buy large amounts for storage when prices plunge. This ensures them short term production at a low price, but once operations are completed reverts in price peaks and preserved volatility for the rest of the market. On the other hand, volatility is a short-term effect that does not mask a background average prices of 100-400 EUR/tonne for the most traded grades, which together with a progressive increase in the virgin polymer price since the turn of the century, has pushed recycled plastics demand internationally and has slowly expanded the sector. This has been witnessed since the beginning of statistics collection. Another important element in the market assessment is the cost trend of the alternatives to waste plastic recycling. With the development of stricter waste management legislation, often containing economic instruments, the access to alternatives at the bottom of the waste hierarchy are being made difficult through bans (e.g. on landfilling of biodegradable, recyclable and in some countries also combustible waste) or are penalised with gradually increasing taxes and fees. This scenario adjusts environmental externalities previously non-tackled and welcomes recycling of what is feasible to recycle. There is still much to do, as only about 60% of the plastics consumed in the EU are collected as waste, and still half of the collected waste plastics are disposed of. In the presented market situation, one must not exclude that as new lower quality waste plastics arise and the technology to sort them develops, prices of some grades are very low (50-70 EUR/t), just under the threshold of collection and processing costs, and the limit of feasibility of the recycling system of these grades. Large waste plastic generators (e.g. commercial areas) may be covered from breakdown by agreements of minimum price guarantee with reprocessors, and municipal waste plastic collection is normally ensured by the administrations, which by legislation have the responsibility of providing the service. 2.6.3.4 Recycled plastics prices are linked to virgin plastics prices
In cases where waste plastics and virgin polymers are considered substitute goods, the demand for one will depend on the price of the other, which means that the two markets will need to be considered as parallel. This case will occur when the quality of recycled plastic can compete with the quality of virgin plastic and can therefore perfectly substitute it. Thus forces
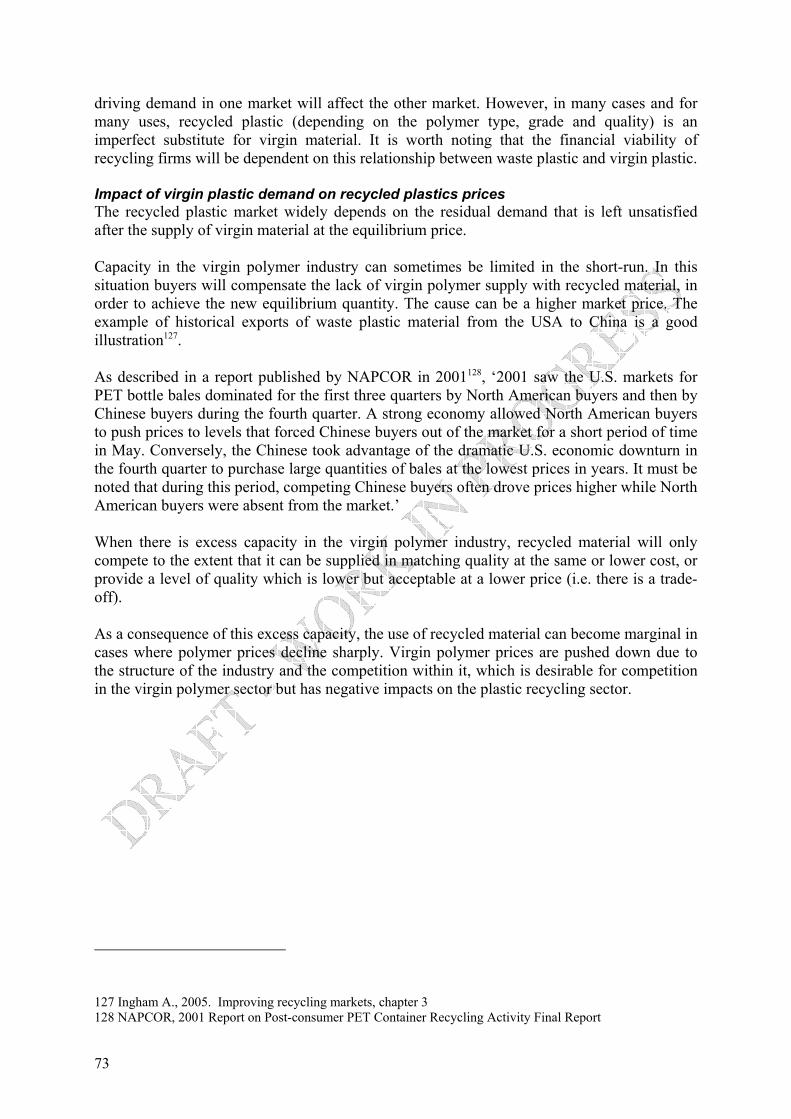
73
driving demand in one market will affect the other market. However, in many cases and for many uses, recycled plastic (depending on the polymer type, grade and quality) is an imperfect substitute for virgin material. It is worth noting that the financial viability of recycling firms will be dependent on this relationship between waste plastic and virgin plastic. Impact of virgin plastic demand on recycled plastics prices The recycled plastic market widely depends on the residual demand that is left unsatisfied after the supply of virgin material at the equilibrium price. Capacity in the virgin polymer industry can sometimes be limited in the short-run. In this situation buyers will compensate the lack of virgin polymer supply with recycled material, in order to achieve the new equilibrium quantity. The cause can be a higher market price. The example of historical exports of waste plastic material from the USA to China is a good illustration127. As described in a report published by NAPCOR in 2001128, ‘2001 saw the U.S. markets for PET bottle bales dominated for the first three quarters by North American buyers and then by Chinese buyers during the fourth quarter. A strong economy allowed North American buyers to push prices to levels that forced Chinese buyers out of the market for a short period of time in May. Conversely, the Chinese took advantage of the dramatic U.S. economic downturn in the fourth quarter to purchase large quantities of bales at the lowest prices in years. It must be noted that during this period, competing Chinese buyers often drove prices higher while North American buyers were absent from the market.’ When there is excess capacity in the virgin polymer industry, recycled material will only compete to the extent that it can be supplied in matching quality at the same or lower cost, or provide a level of quality which is lower but acceptable at a lower price (i.e. there is a trade-off). As a consequence of this excess capacity, the use of recycled material can become marginal in cases where polymer prices decline sharply. Virgin polymer prices are pushed down due to the structure of the industry and the competition within it, which is desirable for competition in the virgin polymer sector but has negative impacts on the plastic recycling sector.
127 Ingham A., 2005. Improving recycling markets, chapter 3 128 NAPCOR, 2001 Report on Post-consumer PET Container Recycling Activity Final Report
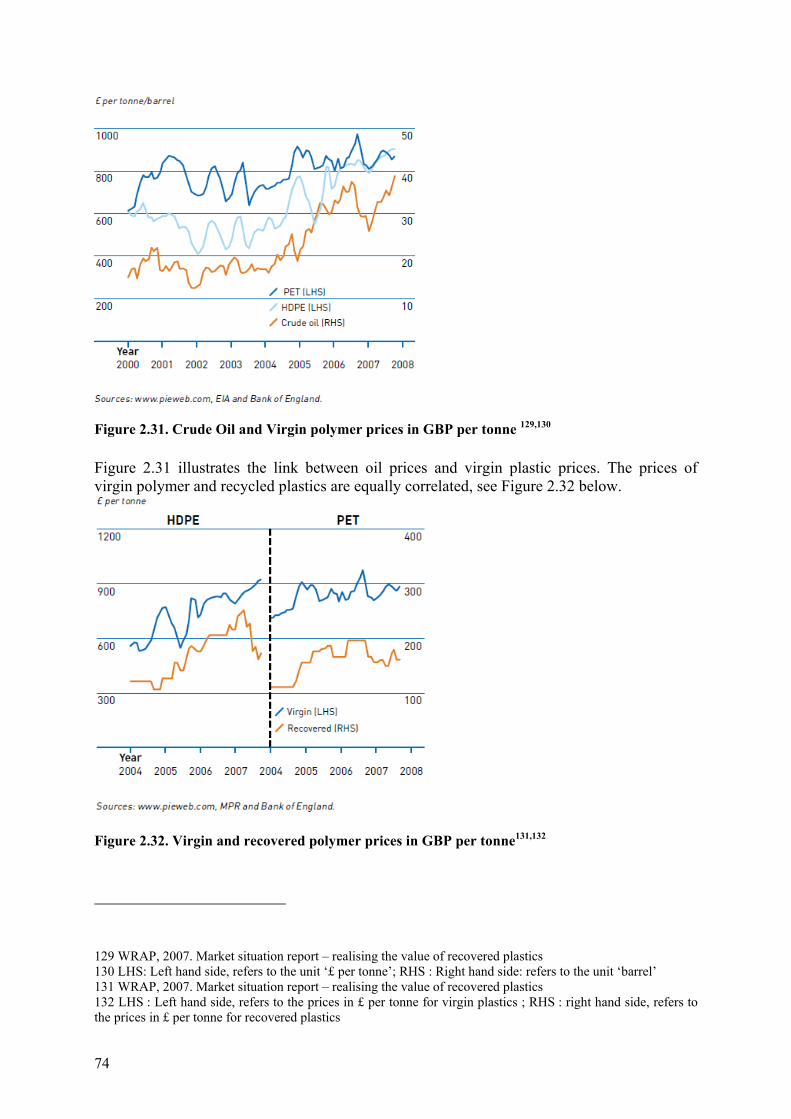
74
Figure 2.31. Crude Oil and Virgin polymer prices in GBP per tonne 129,130 Figure 2.31 illustrates the link between oil prices and virgin plastic prices. The prices of virgin polymer and recycled plastics are equally correlated, see Figure 2.32 below.
Figure 2.32. Virgin and recovered polymer prices in GBP per tonne131,132 129 WRAP, 2007. Market situation report – realising the value of recovered plastics 130 LHS: Left hand side, refers to the unit ‘£ per tonne’; RHS : Right hand side: refers to the unit ‘barrel’ 131 WRAP, 2007. Market situation report – realising the value of recovered plastics 132 LHS : Left hand side, refers to the prices in £ per tonne for virgin plastics ; RHS : right hand side, refers to the prices in £ per tonne for recovered plastics
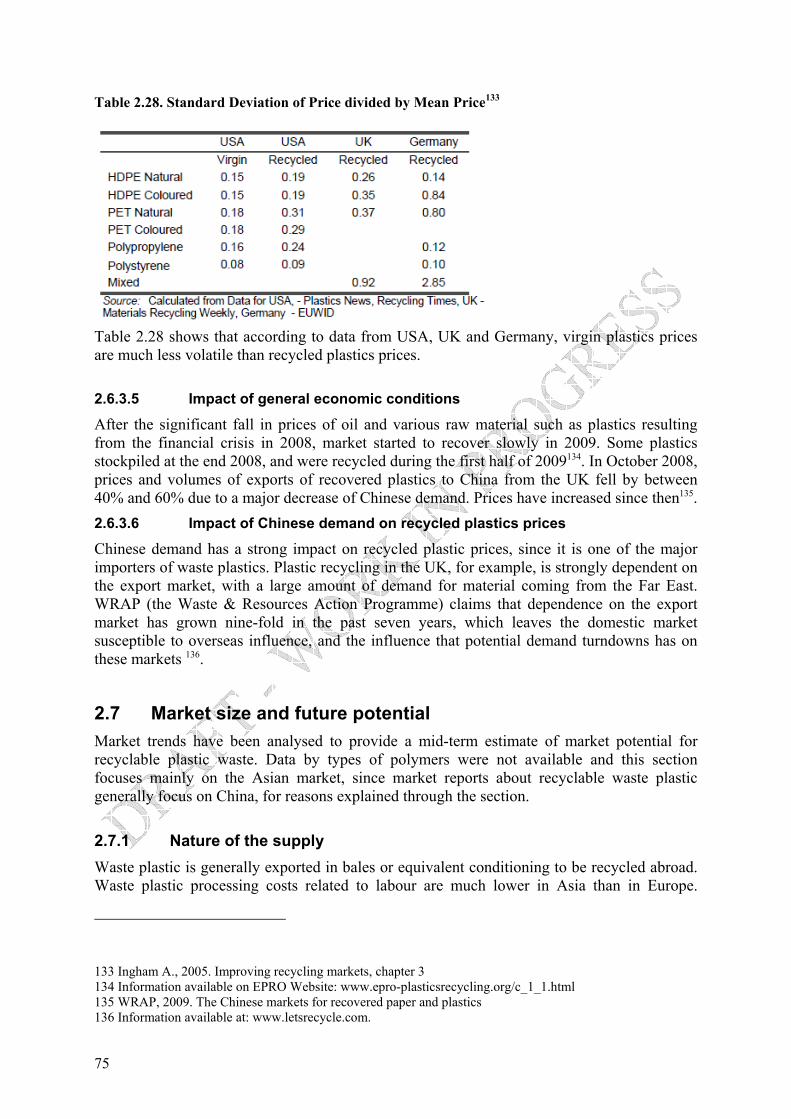
75
Table 2.28. Standard Deviation of Price divided by Mean Price133
Table 2.28 shows that according to data from USA, UK and Germany, virgin plastics prices are much less volatile than recycled plastics prices. 2.6.3.5 Impact of general economic conditions
After the significant fall in prices of oil and various raw material such as plastics resulting from the financial crisis in 2008, market started to recover slowly in 2009. Some plastics stockpiled at the end 2008, and were recycled during the first half of 2009134. In October 2008, prices and volumes of exports of recovered plastics to China from the UK fell by between 40% and 60% due to a major decrease of Chinese demand. Prices have increased since then135. 2.6.3.6 Impact of Chinese demand on recycled plastics prices
Chinese demand has a strong impact on recycled plastic prices, since it is one of the major importers of waste plastics. Plastic recycling in the UK, for example, is strongly dependent on the export market, with a large amount of demand for material coming from the Far East. WRAP (the Waste & Resources Action Programme) claims that dependence on the export market has grown nine-fold in the past seven years, which leaves the domestic market susceptible to overseas influence, and the influence that potential demand turndowns has on these markets 136.
2.7 Market size and future potential Market trends have been analysed to provide a mid-term estimate of market potential for recyclable plastic waste. Data by types of polymers were not available and this section focuses mainly on the Asian market, since market reports about recyclable waste plastic generally focus on China, for reasons explained through the section.
2.7.1 Nature of the supply Waste plastic is generally exported in bales or equivalent conditioning to be recycled abroad. Waste plastic processing costs related to labour are much lower in Asia than in Europe.
133 Ingham A., 2005. Improving recycling markets, chapter 3 134 Information available on EPRO Website: www.epro-plasticsrecycling.org/c_1_1.html 135 WRAP, 2009. The Chinese markets for recovered paper and plastics 136 Information available at: www.letsrecycle.com.
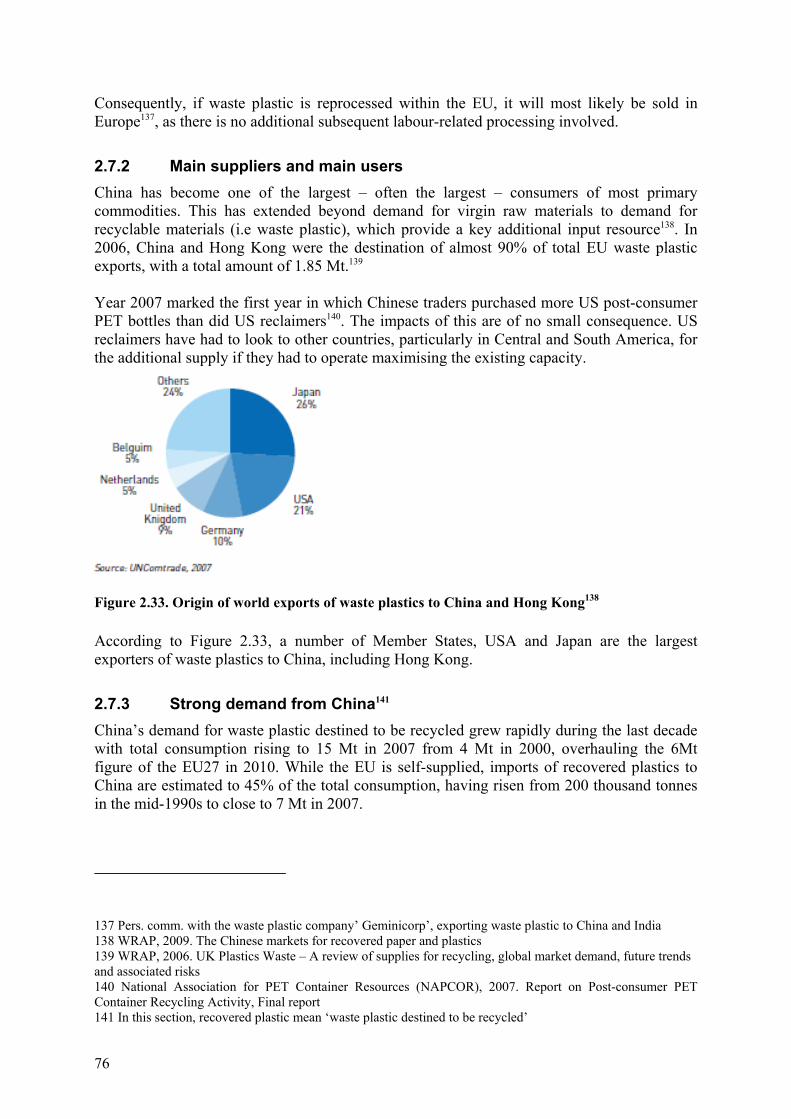
76
Consequently, if waste plastic is reprocessed within the EU, it will most likely be sold in Europe137, as there is no additional subsequent labour-related processing involved.
2.7.2 Main suppliers and main users China has become one of the largest – often the largest – consumers of most primary commodities. This has extended beyond demand for virgin raw materials to demand for recyclable materials (i.e waste plastic), which provide a key additional input resource138. In 2006, China and Hong Kong were the destination of almost 90% of total EU waste plastic exports, with a total amount of 1.85 Mt.139 Year 2007 marked the first year in which Chinese traders purchased more US post-consumer PET bottles than did US reclaimers140. The impacts of this are of no small consequence. US reclaimers have had to look to other countries, particularly in Central and South America, for the additional supply if they had to operate maximising the existing capacity.
Figure 2.33. Origin of world exports of waste plastics to China and Hong Kong138 According to Figure 2.33, a number of Member States, USA and Japan are the largest exporters of waste plastics to China, including Hong Kong.
2.7.3 Strong demand from China141 China’s demand for waste plastic destined to be recycled grew rapidly during the last decade with total consumption rising to 15 Mt in 2007 from 4 Mt in 2000, overhauling the 6Mt figure of the EU27 in 2010. While the EU is self-supplied, imports of recovered plastics to China are estimated to 45% of the total consumption, having risen from 200 thousand tonnes in the mid-1990s to close to 7 Mt in 2007.
137 Pers. comm. with the waste plastic company’ Geminicorp’, exporting waste plastic to China and India 138 WRAP, 2009. The Chinese markets for recovered paper and plastics 139 WRAP, 2006. UK Plastics Waste – A review of supplies for recycling, global market demand, future trends and associated risks 140 National Association for PET Container Resources (NAPCOR), 2007. Report on Post-consumer PET Container Recycling Activity, Final report 141 In this section, recovered plastic mean ‘waste plastic destined to be recycled’

77
A number of reasons explain this, most notably the fast pace of economic growth and industrialisation of the country, resulting in rising packaging demand, the rising prices for oils and plastic polymers leading China to use the less expensive recovered plastics, and insufficient domestic supply of virgin plastics. These factors are evidently temporary. In a stable future scenario, these effects will level out and the picture is likely to resemble that of the EU, with a much larger domestic supply of waste plastics. The question is when such stability will be reached. Pöyry has forecasted high growth in demand for recovered plastics in the long term, with demand expected to rise from 15 Mt in 2007 to around 45 Mt in 2015 and 85 Mt in 2020. On the supply side, by 2020, 37 Mt is seen as coming from imports with 48 Mt recovered from the waste stream in China.142 The positive perception of the market situation was corroborated by discussions with Chinese trade associations. Their expectation was that demand and prices would continue to strengthen in 2010, albeit perhaps more modestly, at least for prices143. China’s export regulation has become more stringent that in the past. For instance, imports of plastic films from household sources, such as post-consumer carrier bags, as well as agricultural films and fishing nets imports have been banned since March 2008. Additionally, the application of controls over the plastic recycling industry has become much tighter and many of the smaller companies have been forced to shut down as a result. The government of the Nanhai District in Fuoshan City in the Guangdong Province has closed all of the plastic recycling companies in the district. This reinforcement of controls operated by China might lead to a transfer of exports from Europe to other Asian countries or regions less stringent about controls such as Hong Kong, Indonesia, Vietnam, and India.144
2.7.4 Composition of traded plastic
Figure 2.34. Composition of UK exports of waste plastic to China in 2008 138
142 WRAP, 2009, The Chinese markets for recovered paper and plastics 143 Valpak consulting, 2010, Market sentiment survey of recovered fibre and recovered plastics reprocessors in China 144 According to a report by BCC Research

78
Figure 2.34 shows that the main type of plastic exported by the UK to China is PE. A 2008 market survey on about 100 Chinese plastic reprocessors using material from the UK145 reveals that plastic bottles and plastic films are the main types of waste plastic being reprocessed. The majority of Chinese reprocessors turn these into intermediates for further reprocessing, for a variety of sectors including non-food plastic packaging and agricultural plastic films. 80% indicated that they produced re-compounded pellets. 15% produced plastic fibre, 9% produced plastic film, 5% produced clean flake and 3% produced a product other than plastic film or fibre. The survey indicated that the plastics market had recovered relatively well from the late 2008 downturn. The survey respondents did not show a strong interest in sourcing plastic locally i.e. from the Chinese supply market, mostly due to significant differences in perception of quality by grade, with domestic film in particular being seen as low quality. To a certain extent, they reported that greater monitoring and enforcement of environmental legislation concerning factory operation and import controls had led to a need to choose suppliers with greater care to ensure quality standards were high and consistent.
2.7.5 Plastic type market differences A TNO report, commissioned by APME146, identified a number of specific plastic flows that were economically profitable or needed only partial support in the early 2000s. These included: recycling of distribution and commercial films and crates (large profits) recycling of PET bottles (some profit) recycling of HDPE bottles, EPS packaging, PVC pipes and Windows, agricultural films
and mixed plastic (little profit) recycling of automotive bumpers (small or no profit)
Decisive criteria driving the ‘score’ allocated to each flow regarding its profitability (i.e. financial balance sheet) were the price of virgin plastic, quantities available, number of disposal options, contamination level, markets, substitution threat and recycling costs. Although the development of the waste plastic markets has changed some of these parameters, this example does demonstrate the internal differences in the plastic types. Question 6: Experts are kindly requested to provide any estimates of the volumes of the markets of intermediates (flakes, regrind, aggregates, pellets), describing if these materials have stable markets as compared to (a) waste plastic and (b) regranulates, or if they are rather ruled by ad-hoc supply and demand shortages 145 Valpak consulting, 2010. Market sentiment survey of recovered fibre and recovered plastics reprocessors in China 146 TNO, 2000. Best practices for the mechanical recycling of post-users plastics

79
2.8 Technical specifications and standards The objective of this section is to identify the existing quality standards and technical requirements for waste plastic, recyclates and recycled plastic end-uses. Such information is required, as in order to comply with condition (c) of Article 6 of the Directive, the recycled plastic should meet all technical standards applicable to the material. Technical specifications and standards are needed and are widely used in the industry to create references for price-setting, for classification, and for quality control. Of particular interest for the formulation of end-of-waste criteria are technical specifications and standards referring to the following properties of the waste plastic material: Physico-chemical composition Content of impurities Physical size and shape Homogeneity, i.e. the variation within the given specification Grading and classification of consignments Safety requirements.
Two main groups of technical specifications have been detected in the waste plastic sector:
1) Specifications and standards on waste plastic, i.e. input material to reprocessing, and to some types of converting. Examples of this are EN 15347, and ISRI specifications.
2) Specifications and standards on waste-plastic-based intermediates (e.g. regranulates), which are output materials from reprocessing, and are used as input for the converting industry. Examples of this are the standards on characterisation of plastics recyclates (PE, PP, PS, PVC, PET) EN 153-42,-44,-45,-46, and -48.
As it still is to be determined which is the borderline between waste and end-of-waste, both types have been screened for information that can be used in the formulation of the end-of-waste criteria, and are described in the following.
2.8.1 Overview of existing standards 2.8.1.1 Shipping standards
Security requirements are becoming more stringent. For example, China has recently developed new quality standards for plastic waste due for shipment, and has posted monitors at foreign ports to inspect plastic waste shipments and ensure compliance with these standards before they are transported to China. Stakeholders described how some shipping firms refuse certain types of shipments when the plastic waste is expected to be treated abroad147. Brokers pass this burden on to suppliers, who therefore have the responsibility of making sure that their product will be accepted along the trade chain147.
147 Pers. comm. with GoldenRecycling.

80
2.8.1.2 Standards on plastic waste
After the plastic waste collection and sorting stages, standard EN ISO 15347 "Plastics - Recycled Plastics - Characterisation of plastics wastes laying out those properties for which the supplier of the waste shall make information available to the purchaser" covers the characterisation of waste plastic. The characteristics of a batch of waste plastic that should be provided to the purchaser by the supplier are either required or optional. Table 2.29 describes the quality parameters presented in this standard, as well as the test methods used.
Table 2.29: Required and optional characteristics of plastics wastes (EN 15347)148 Property Status (test method) Batch size Required (weight or volume) Colour Required (visual assessment) Form of waste Required (e.g. flake, film, bottle) History of waste Required (EN 15343) Main polymer present Required (percentage by weight if known) Other polymers present Required (percentages by weight if known) Type of packaging in which the waste is present
Required
Impact Strength Optional (EN ISO 179-1 and EN 179-2 or EN ISO 180)
Melt mass flow rate Optional (EN ISO 1133) Vicat softening temperature Optional (EN ISO 306 Method A) Additives, contaminants, moisture, volatile
Optional
Ash content Optional (EN ISO 3451-1) Moisture Optional (EN 12099) Tensile strain at break Optional (EN ISO 527, parts 1 to 3) Tensile strain at yield Optional (EN ISO 527, parts 1 to 3) Volatiles Optional (Weight loss at a process temperature) According to this standard, the specification and the standard deviation or range of values within and between batches of material are agreed between the supplier and the purchaser. Waste plastics arise in many different forms and may be a single polymer type or a mixture, depending on how the waste has been collected. A batch of waste material can, therefore, include wastes from a single source, such as factory scrap, or window frames from building demolition, or a mixture of types as in unsorted domestic waste. The forms in which the waste is collected can be equally varied. A batch of waste material offered for sale can be a quantity as collected, or may have been sorted by the collector to add value to it. The wide range of possible forms and compositions of waste plastics offered for sale makes it important for there to be a standardised means of characterising them so that there is a transparent transaction between seller and purchaser. 148 NOTE This standard does not cover the characterisation of plastics recyclates.- this is described in 15342-44-45-46-48

81
In other words, the quality requirements for waste plastic are chosen and defined by purchasers in their contract technical specifications, the evolution of which follows the trends in industrial and plastics applications149. Usually, tags on plastic films are accepted by purchasers as they can be easily removed during the cleaning process150. The standard is very generic, and leaves a high degree of freedom between buyer and seller to detail the quality. For instance, the content of contaminants is an optional characteristic where "any additional information of the material will be useful". Only the main polymer present, and other polymers are asked for, but not necessarily quantitatively "the percentage if known". For practical reasons, the sector has also been developing codifications at national levels, to facilitate agreements between suppliers and customers by providing standardised categorisations and/or contaminant limits (see below). The waste plastic quality controls are based on characterisation processes and are carried out by sampling151. The situation is very dependent upon the MS (and sometimes even the region) considered, upon the professionalism of the collection system and recyclers, and the end market considered. Thus, when the waste is shipped to Asia, only limited specifications exist, whereas when the waste is used within EU-27 for recycling and manufacture of new goods, the reprocessors and recyclers bear the burden of ensuring specifications for their end customers. In the UK, recyclers usually are in a weak position. The collection scheme is driven by tonnage, so that the quality of collected waste does not necessarily respect the percentages in the codification (e.g. instead of the maximum level of 10% of non-relevant material, this quantity can represent up to 20 to 30%). The main reason is the existence of the export market to Asia which is not as demanding in terms of quality and “forces” the local recyclers to accept lower quality material to run their business. At the output of the reprocessing stages, recyclers have to demonstrate the quality of their recyclate, as customers are demanding. In the particular sector of WEEE, no specifications at all are made by reprocessors for the input but every tonne at the output is sampled and analysed with the usual tests of the standards (e.g. elongation at break, impact strength, colour, x-rays to detect heavy metals), but according to personal statistical methods. In comparison with the production of virgin raw material, much more testing is required to ensure a stable output quality because of the high variations in quality and homogeneity of the input material. Attempts to set up a common way of measurement of the collected waste quality (before the reprocessing step) have failed so far152. The situation can be significantly different in other MS. In Norway, Green Dot carries out quality controls of the waste, although stakeholders claim that this is not made on a consistent basis, between the collectors and the recyclers. Third party consultancy controllers are hired (this can also be the case in Sweden, in case of disagreements between the two parties). If the 149 Pers. comm. with FEDEREC and the British Plastics Federation Recycling Council. 150 Pers. comm. with FEDEREC. 151 Pers. comm.s with PAPREC and CeDo. 152 Pers. comm. with stakeholder.
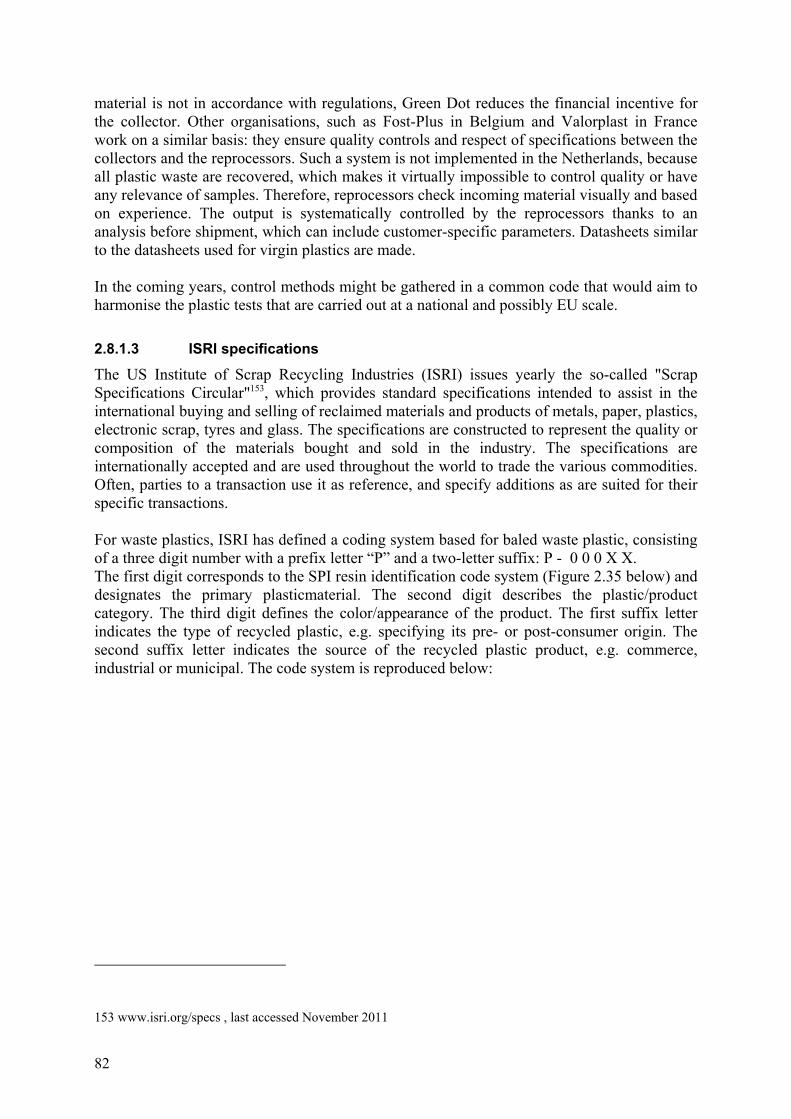
82
material is not in accordance with regulations, Green Dot reduces the financial incentive for the collector. Other organisations, such as Fost-Plus in Belgium and Valorplast in France work on a similar basis: they ensure quality controls and respect of specifications between the collectors and the reprocessors. Such a system is not implemented in the Netherlands, because all plastic waste are recovered, which makes it virtually impossible to control quality or have any relevance of samples. Therefore, reprocessors check incoming material visually and based on experience. The output is systematically controlled by the reprocessors thanks to an analysis before shipment, which can include customer-specific parameters. Datasheets similar to the datasheets used for virgin plastics are made. In the coming years, control methods might be gathered in a common code that would aim to harmonise the plastic tests that are carried out at a national and possibly EU scale. 2.8.1.3 ISRI specifications
The US Institute of Scrap Recycling Industries (ISRI) issues yearly the so-called "Scrap Specifications Circular"153, which provides standard specifications intended to assist in the international buying and selling of reclaimed materials and products of metals, paper, plastics, electronic scrap, tyres and glass. The specifications are constructed to represent the quality or composition of the materials bought and sold in the industry. The specifications are internationally accepted and are used throughout the world to trade the various commodities. Often, parties to a transaction use it as reference, and specify additions as are suited for their specific transactions. For waste plastics, ISRI has defined a coding system based for baled waste plastic, consisting of a three digit number with a prefix letter “P” and a two-letter suffix: P - 0 0 0 X X. The first digit corresponds to the SPI resin identification code system (Figure 2.35 below) and designates the primary plasticmaterial. The second digit describes the plastic/product category. The third digit defines the color/appearance of the product. The first suffix letter indicates the type of recycled plastic, e.g. specifying its pre- or post-consumer origin. The second suffix letter indicates the source of the recycled plastic product, e.g. commerce, industrial or municipal. The code system is reproduced below:
153 www.isri.org/specs , last accessed November 2011
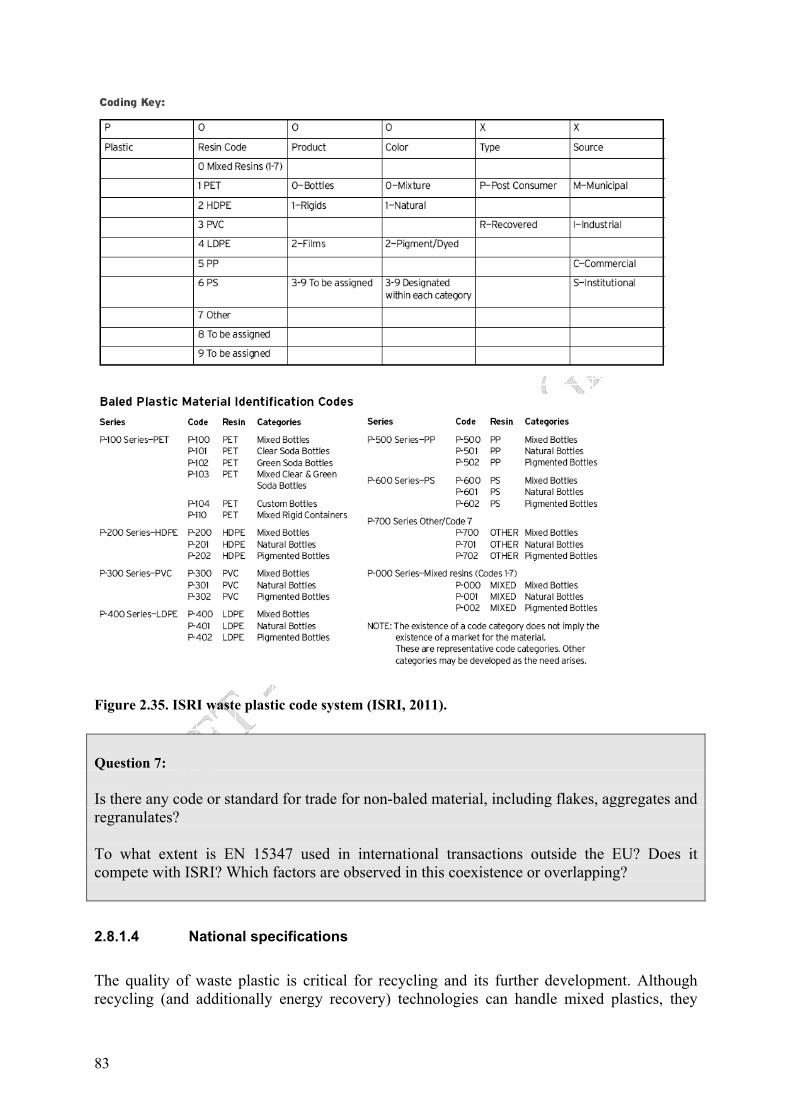
83
Figure 2.35. ISRI waste plastic code system (ISRI, 2011). Question 7: Is there any code or standard for trade for non-baled material, including flakes, aggregates and regranulates? To what extent is EN 15347 used in international transactions outside the EU? Does it compete with ISRI? Which factors are observed in this coexistence or overlapping? 2.8.1.4 National specifications
The quality of waste plastic is critical for recycling and its further development. Although recycling (and additionally energy recovery) technologies can handle mixed plastics, they

84
require maximum acceptance limits for the concentration of certain compounds, as well as a minimum conditioning of the waste to be fed into their processes154. This section describes standards applicable after collection, but before reprocessing. Being EN 15347 so general in its formulation, some codifications have been implemented in Member States at national scales to specify limits and categorise waste plastic, in order to facilitate trade between the collectors/brokers and the reprocessors. The interface of such specifications is illustrated below.
Figure 2.36. Interfacve of national waste plastic specifications155. Traders and collectors can carry out collection, transport, sorting and washing operations. Each trader will carry out one or several tasks, depending on their position in the market and the requirements of the customer: there is no fixed structure. For example, some processors do not need cleaned or highly sorted waste plastic; therefore few preliminary operations will be made by the traders and collectors. Waste plastics processors can deal with shredding and reprocessing operations: from the waste plastic of variable quality (usually in bales) provided by the brokers, they produce flakes and pellets (secondary raw material) through processes as shredding, extrusion and pelletising, and may even directly manufacture end-products. United Kingdom In the UK, hand-sorting and processing of plastic films is carried out overseas and some contaminated material is recycled. The general principle for plastic film recycling is that the material should be as clean and as contaminant-free as possible. The UK has been trying to substantially develop recycling at a national scale lately. There are no formal agreed specifications for plastic bottles or PE films but the WRAP, the British Plastics Federation Recycling Council and the British Standards Institute have developed the PAS-103 Specification156. It outlines some of the main contaminants and also the clarification and grading process for plastics. It applies at the same stage as the FEDEREC codification, i.e. between the plastics trader/collector and the reprocessor. This system is expected to
154 JRC, IPTS, “Assessment of the Environmental Advantages and Disadvantages of polymer recovery processes”, 2007 155 WRAP/BPF Recycling Council/BSI, Introduction to PAS-103: Collected waste plastic packaging. 156 A free copy can be ordered online.

85
increase the value of the materials being bought and sold, expand the markets for the waste and simplify the trading process through the adoption of a common language. However, it is not to be regarded as a British Standards. According to this document, buyers and sellers should record: the source and batch identification of waste plastics; the net weight of the batch; the form of the batch (baled or bagged); the number of units (bales or bags) in the batch; the form of the waste plastic (e.g. original product, flaked, granulate, shredded, crumbed
or reel); the weight, dimensions and density of the bales and bags; whether it is post- or pre-consumer waste; and whether it is obligated packaging.
Depending on the original application of the waste, the main polymer type present, the main colour (natural, clear tinted, single, mixed colour) and presence of any contaminant, a visual assessment of the quality of the waste is then carried out. The contamination levels are: category A: those that are not normally accepted and usually result in rejection of the
waste (e.g. hazardous or clinical waste: syringes, other sharps, radioactive waste...); category B: those that are normally permitted and can be removed from the waste by
cleaning and separation procedures. They include: paper (including labels), cardboard, ferrous and non-ferrous metals, ceramics, glass, dirt, stone, non-hazardous residues (e.g. food, drink, detergents) and other unidentified plastics.
category C: those that may be permitted to agreed levels and do not necessarily require removal from the waste plastics. They include: bio-degradable polymers (which might results in poor performance of products), halogenated fire retardants, printed plastics, fillers (e.g. clay, chalk), heavy metals, barrier layers and coatings and other polymers (e.g. extraneous packaging materials, caps, cap-liners, adhesive tape and labels).
PAS 103 also includes test methods for the verification of quality in the event of a dispute and specifies good practice in collection, storage and delivery of waste plastic packaging. Two main types of plastic film are traded within the UK and most of the film is exported for processing (especially to China). Material is usually expected to be baled in various grades (e.g. natural, jazz); weights are either light or heavy; and in various grades of contamination, from little through to heavily contaminated. In terms of plastic bottles, reprocessors normally only accept baled material. The current preferred bale form is 1.8m x 1.2m x 1m because larger bales are too big to be handled by reprocessors' bale-breaking equipment and smaller balers are more difficult to store. Bales are compacted to a density which ensures safe stacking, loading and transport and which allows for separation of the bales once the bale strapping is removed. The bale weight can vary depending on the polymer type but one bale usually weight between 200 and 325 kg. The provenance and traceability of recycled plastics are of growing importance, and being able to present evidence of such is likely to increase the value of the material. Pale colours will tend to attract a higher value than darker colours. The classification of waste plastic grades in PAS 103 is provided in Annex IV. An example of UK grades for export is presented in Table 2.30 below.

86
Table 2.30. Waste plastic grades of use in the UK for exports. (Source: WRAP, 2008)
France The company Eco-emballages is in-charge of the collection and sorting of all the household packaging waste in France (plastics, paper, metal etc. mixed). The waste is firstly pre-sorted in sorting facilities by type of material: separated streams for plastics, metals, paper and glass are obtained. Table 2.31 describes the contamination rates tolerated in the plastic packaging streams, at the output of these facilities. Some products are not tolerated at all: miscellaneous sources of pollution (rocks, wood, concrete, soil, textiles, etc.), needles, syringes and medical products, and plastic bottles from commercial or industrial sources. Plastic packaging is sorted into three different sub streams: HDPE+PP, PET (light colour) and PET (dark colour). Thus, the nature of these streams can be adapted locally depending on the market needs and the nature of the source. This collaborative process involves the local authorities, the sorting facility and the recycler.
Table 2.31: Contamination rates tolerated after the sorting process of mixed waste (France157) Tolerated products Contamination rate
tolerated by bale Plastic bottles and flasks (other than main stream) Other plastic packaging (sacks, films, pots, trays, etc.) Other household packaging (steel, aluminium, paper, cardboard, etc.) Newspaper, magazines
< 2% (weight, altogether)
Glass, porcelain, stones/gravels (in bottles or not) < 0.2% (weight altogether)
Bottles and flasks containing or having contained dangerous products regarding the different legislation considered: mineral or synthetic oil or fat paints, solvents, varnish, inks, glues and tapes pesticides
< 0.02% (weight, altogether)
At this stage, recyclers/reprocessors in France can use a codification that has been set up by FEDEREC in order to clearly express their needs and quality requirements. This national codification classifies waste plastic materials by material type and quality (see Annex III). It is used as a reference by all FEDEREC members (360 kt of post-consumer plastics recycled
157 Accreditation “Eco-emballages”

87
in 2008158) i.e. recyclers as well as traders, in order to facilitate the trade thanks to a common set of rules. To ensure consistency, the codification has been developed according to the market reality and requirements. The next step is to adopt such a classification at the EU level, and eventually at the international level. The codification is based on the SPI codes159, which classifies plastics in seven different categories (see Table 2.1). The source of the material is indicated either by ‘1’ (pre-consumer, high quality) or ‘2’ (plastics selectively collected and used packaging). Finally, the quality of plastic materials is identified by a code consisting of 2, 3 or 4 digits (the number of digits used depending on the number of quality grades for each type). An update of the current list of categories is being carried out in order to complete and develop the existing codification by adding new quality standards that have recently been put on the market. Germany In Germany, the company Duales System Deutschland, who developed the first Green Dot system (‘Grüne Punkt’) in 1991 which was later also implemented in other MS, provides product specifications for waste plastic. The detail of the waste plastic categories is described in Table 2.32, and the characteristics of each category (description, purity, impurities, conditioning) are available in Annex V.
Table 2.32: Waste plastic categories in use in Germany160 Fraction number
Name of fraction
310 Plastic Films 320 Mixed Plastic Bottles 321 Polyolefin Plastic Bottles 322 Plastic Hollow Bodies 324 Polypropylene 325 PET Bottles, transparent 328-1 Mixed-PET 90/10 328-2 Mixed-PET 70/30 328-3 Mixed-PET 50/50 329 Polyethylene 330 Cups 331 Polystyrene 340 Expanded Polystyrene (EPS) 350 Mixed Plastics
365 Preliminary Product for R.D.F (Refused Derived Fuel)
Hungary As an example, the technical acceptance conditions of waste plastics defined by Remoplast for PET waste (according to EN 15347) are presented in Table 2.33.
158 FEDEREC statistics. Available at: www.federec.org/presentation/federec/recyclage-chiffres.html 159 Society of the Plastics Industry 160 Source : http://www.gruener-punkt.de/en/waste-management-infoservice/plastics-recycling.html

88
Table 2.33: Technical acceptance conditions of PET waste in Hungary Sorted Characteristics
Class I Class II Class III
Unsorted Comments
Batch size - - - - batch size
Colour max: 0.01% max: 1% mixed mixed during sorting via sorting by
colour Shape of waste - - - - bottle, tray etc. History of waste - - - - according to the standard PET content 100% min: 90% min: 90% min: 74%
PVC content not allowed max: 2% max: 2% max: 2% during sorting
Other polyolefin content
max: 0.3% max: 5% max: 5% max: 17%
caps, labels allowed, only what is on the bottle. no surface handle or other attachment.
Foreign material content (wood, wires, paper etc.)
Not allowed
Not allowed
Not allowed max: 1%
Paper content max: 0.4%
max: 0,4%
max: 0.4% max: 0.4% labels
Mineral and glass content
Not allowed
Not allowed
Not allowed
Not allowed
Moisture content max: 1% max: 2.0 %
max: 2.0% max: 2.0% moisture in the bottle etc. not
allowed Other contamination
max: 0.3%
max: 0.6 %
max: 0.6% max: 4.0%
Packaging - - - - bale, big-bag, loose, bulk European PET Bottle Platform161 The EPBP is a voluntary initiative, aimed at the packaging industry, which has established test procedures to assess the recycling profile of new packaging technologies such as barriers, additives, closures, labels, etc. Some of the quick tests that have been finalised so far include: QT 500: Oven test QT 501: Metal separation test QT 502: Swim/sink test QT 503: Sorting test QT 504: Glue separation test QT 505: Melting test
These quick tests are rapid and low-cost techniques for the quick assessment of the recycling profile of PET bottles. They include a complete explanation of the scope, techniques, equipment and test conditions, and a ‘summary interpretation’ explaining how to use the test results. Based on their results, which are purely indicative, the EBPB is optimising further tests and establishing specific test procedures using up-to-date testing methods that produce qualitative and/or quantitative test results (this is ongoing work). Products passing these tests will be given approval for recycling.
161 More information available at: www.petbottleplatform.eu

89
The Platform has also developed PET recycling guidelines, describing the different materials allowed or not in the bottle components (body, label, cap) (see Table 2.34).
Table 2.34: Recycling guidelines for PET bottles (Source: EPBP162)
Yes Conditional163 No
Container PET PLA / PVC / PET-G
Colour clear/light-blue /green other transparent colours
opaque
Barrier clear plasma coating external coating /PA (3 layers)
EVOH / PA monolayer blends
Bod
y164
Additives O2 scavengers / UV stabilisers / AA blockers / nanocomposites/ etc.
Direct printing
production or expiry date
other direct printing
Labels HDPE/MDPE /LDPE /PP/OPP/EPS (density <1 g/cm3)/Paper
PET metallised labels
PVC / PS (density > 1 g/cm³)
Sleeves PE/PP/OPP/EPS (density <1 g/cm3)/foamed PET/foamed PET-G
PET PVC / PS (density > 1 g/cm³) / PET-G / full body sleeves
Glue165 no adhesive on body water-soluble adhesive or alkali soluble adhesives (<80°C)
adhesive not removed in water or alkali at 80°C
Labe
l Ink EuPIA Good Manufacturing Practices
bleeding / reactive / hazardous
Closure HDPE / LDPE / PP metal / aluminium / PS / PVC / thermosets
Closure liner
HDPE / PE+EVA / PP PVC / EVA with aluminium
Cap
Seals PE / PP / OPP / EPS / foamed PET
PVC / silicon / aluminium
Other components
HDPE / PP / PET PVC / RFID / non-plastic
Similar initiatives for HDPE and PP packaging are currently at a development stage. China: waste plastic shipping standards
162 www.petbottleplatform.eu/downloads.php 163 Some materials/bottle components are recyclable under certain conditions. Please check with EPBP, recyclers or recycling organisations. 164 All materials must meet the legal requirements for materials and articles intended to come into contact with food. 165 Ref. EUPR positive glue list

90
Some waste plastic is shipped abroad, mainly to China and especially Hong Kong, mostly after the collection and grinding stage, and not after the reprocessing. The tenders of specification are also becoming increasingly stringent and the Chinese standard GB 16487.12-2005 has been developed to specify the forbidden and allowed importation of waste plastic. The standard defines the waste and scrap of plastics as ‘the remnant materials, leftover materials, and inferior products produced in the manufacture and processing of plastics, and thermoplastics that has been processed and washed (in chips, blocks, granulated or powdery)’. Carried-waste consists of ‘substances mixed in imported waste and scrap of plastics during the production, collection, packing and transportation processes (exclusive of packing materials for the imported waste and scrap of plastics and other substances that need to be used during the transportation process)’. It is applicable to the materials listed in the Table 2.35.
Table 2.35: Plastics materials under the scope of Chinese standard GB 16487.12-2005 Customs commodity number
Name of solid waste
3915.1000.00 Waste and scrap ethylene polymers and remnants
3915.2000.00 Waste and scrap vinyl benzene polymers and remnants
3915.3000.00 Waste and scrap cholroethylene polymers and remnants
3915.9010.00 Waste and scrap polyethylene terephthalate remnants 3915.9090.00 Other waste and scrap plastic and remnants
The criteria and requirements for control are the following: It is forbidden to mix the following carried-wastes (exclusive of wastes listed in Article
4.4) with the waste and scrap of plastics: radioactive wastes; explosive weapons and ammunitions such as discarded bomb and shell, etc.; substances identified as hazardous wastes according to GB5085; other wastes listed in ‘National Hazardous Waste Inventory’.
α and β radioactive contamination limits on the surface of the waste and scrap of plastics: the average value of the detected maximum α level on any part of a 300 cm2 surface shall not exceed 0.04Bq/cm2 and that of β shall not exceed 0.4 Bq/cm2
The specific activity value of the radionuclide in the waste and scrap of plastics shall not exceed limits that are specified.
Following carried-wastes shall be strictly restricted and their total weight shall not exceed 0.01% of the weight of imported waste and scrap of plastics: asbestos waste or waste containing asbestos; burnt or partly burnt waste and scrap of plastics and those polluted by extinguishing agent; film containing photosensitive material; used and intact plastic container; sealed container; other hazardous wastes that cannot avoid (there are sufficient reasons) being mixed into the imported waste and scrap of plastics during the production, collection and transportation processes.
Used imported plastic containers should be broken into pieces and cleaned until they have no peculiar smell or blots.
In addition to the wastes listed above, other carried-wastes (such as waste wood, waste metal, waste glass, thermoplastic, plastic film and plastic products coated with metal, etc.) shall be restricted and their total weight shall not exceed 0.5% of the weight of the imported waste and scrap of plastics.

91
The inspections of the various requirements have to be carried out in accordance of the following provisions: GB5085, SN0570 and SN0625. ‘Used waste plastic bags, films and nets collected from household, sorted out from municipal waste, and used agricultural films’ is listed in the Catalogue of Solid Wastes forbidden to import in China and the ban has been implemented since 1 March 2008.
2.8.2 Control of quality The industries involved in the waste plastic cycle carry out many quality control checks of waste plastic throughout collection, sorting, storage, grading, transport and admittance to plastic production. Most of these controls are visual, and do not involve quantitative measurements. Currently, the quantitative controls mainly take place at plastic production sites and focus on measurements of three parameters:
1) Unusable non-plastic components (as %) 2) Plastic types detrimental to production (as %) 3) Total dry and wet weight of the consignment
Plastic producers may ask for a declaration from the supplier about the origin of the material, in relation to national regulations, standard requirements, or directly on the composition of the waste plastic transported. Knowledge of the origin of waste plastic is in general useful for risk management at plastic producers and of particular concern for some producers that manufacture products meant to be in contact with food. Additional recommendations related to quality control registered for other recyclates are: Quality controllers should be independent from the commercial department. A description of the waste plastic quality control procedures and system installed and
operating at the waste plastic plants – currently in the majority of cases only visual control and weight measurement – should be given by the supplier to the buyer before the first contract is signed between them.
Quality controls (weight and visual controls) should ideally be made at the waste plastic producer, and not only at the converter.
One delivery document has to be established by the last supplier per consignment and a copy has to be given to the plastic manufacturer.
The delivery document must at a minimum include the identification of the contract partner, the identification of the trailer, the delivered grade, the weight, the number of bales or bulk.
Plastic producers may ask for a declaration from the supplier about the origin of the material.
Results of the quality controls made at the plastic converter and at the waste plastic reprocessor should be available on a reciprocity basis.
Controls at the sorting plants: visual controls and use of a calibrated weighbridge should be considered as a minimum.
Controls at the plastic converter: non-plastic components, and plastic detrimental to production.
Information on the results of the quality controls should be given by the buyers to the suppliers through periodical reports (in case of rejects, the results of the controls have to be given immediately).
92
Conditions for reject and re-classification should be clearly established (precision has to be given regarding the threshold and the requirements).
The conditions and the limits of the ownership of the waste plastic and the responsibility for the materials delivered should be clearly established between the supplier and the buyer.
Sampling can be carried out manually or using specialised devices, and vary depending on whether the consignment is loose or baled. Quantitative (gravimetric) manual sampling of bales consist of the random selection of one or two bales of the consignment. The bale(s) is open by de-wiring and a sample is taken (often of 30 to 100 kg). The sample is manually sorted in various components (plastic types, paper, wood, glass, etc.). Each category of components is dried and weighted to quantify the amount of non-plastic components, unusable plastic, and to be measured per air dry weight. Moisture content is also measured by sampling, weighting, drying and weighting again. For the loose consignments, one of several possible procedures consists in spreading the load on the floor and sampling on e.g. 2 meter length on all the width of delivery, followed by the manual sorting of components and moisture content measurement. Sensors are evolving to also enable material distinction (image analysis, near infra-red technique and mass spectrometry). The Near Infra-Red (NIR) spectrometry has been already used since many years in other sectors such as food processing in order to study precisely and quickly sample’s chemical composition, e.g. plastic types. Using these sensor technologies, several instant measurements are possible. The simplest gravimetric procedures do no require advanced equipment, and can be undertaken with simple devices such as a sorting table, a scale and a microwave. Conversely, the design of a sampling plan that fits the quality of the waste plastic requires advanced knowledge of quality control and of statistics. Nevertheless, a statistically sound sampling plan reduces to the minimum the frequency of sampling required. In addition to the mentioned quality control guidelines, minimum quality procedures are recommended by reprocessors at two stages:
1) Inspection upon receipt. waste plastic arrives at the facilities in different transport means and sizes: by trailer (waste plastic packaged), in containers, in auto-compressors, in compressors, in trucks, etc. This depends on the origin as separate collection, from households, bins, companies, shopping centres, or from other reprocessors. Once the consignment has arrived, it is weighed on a calibrated scale, and the weight is recorded. This is followed by visual inspection, and for baled input may involve opening randomly a number of bales. Depending on the quality, waste plastic is unloaded at the relevant warehouse location, and if not meeting the contracted quality, the supplier may be contacted to renegotiate the price of the consignment, and in some cases the consignment may be rejected. Accepted waste plastic may then be sorted, shredded, graded and baled.
2) Inspection prior dispatch. Once graded, waste plastic can be baled and/or shredded.
Internal procedures may exist to ensure proper baling, should this be necessary.
93
In other recyclates, it is emphasised that experienced staff need to train novel staff into the criteria used for visual inspection. The following key requirements for the training of staff performing visual inspection are often mentioned: A sound knowledge of: Company reporting structure; waste plastic grades and associated standards; what non plastic components are; what contamination is; what to do within the process to remove and limit the above; what to do with non plastic components removed from the process stream; the health and safety requirements of the process; what to do with non conforming bales of waste plastic; the documentation requirements for processed material; and regulatory requirements for waste plastic movements.
Due to the fact that quantitative content control is most often made by plastic converters to the incoming material, each plastic producers has designed their sampling plans to fit their needs. Input materials and communication Normally, results of plastic converter's controls are communicated back to the reprocessors for checking with their own controls. In addition, some converters e.g. food packaging producers have to care about food contact with their product and demand an “origin” declaration. In such cases, apart from the grade, some special quality requirements may apply. The origin is known for most grades, and as a general rule, pre-consumer waste plastic is cleaner than post-consumer waste plastic, and it needs less sorting. Other than food contact plastic products, the origin of the material is secondary to the output quality after processing and grading. Question 8: The quality control recommendations above mentioned stem from current practice with other recyclates. To what extent are followed in current practice of waste plastic quality control? Is there any important common guideline or code of practice that provides plastic-specific guidance to reprocessors and converters? No guideline has been developed so far for the reprocessors to control quantitatively the output, including e.g. a simple spreadsheet tool based on sound statistics. In a scenario where some waste plastic streams cease to be waste, such tools could help reprocessors define a sampling plan as part of their quality management, and take better control over their output. The reprocessors of other recyclables such as glass are very familiar with these procedures, as quality control of output is commonplace in reprocessing of waste glass.
2.8.3 Standards for recycled plastics, and for end uses A large variety of plastic types is needed in society, since plastic is used in a wide range of applications which require different mechanical, thermal, electrical, and chemical properties (i.e. technical properties). CEN standards have been set and are used at the EU level to
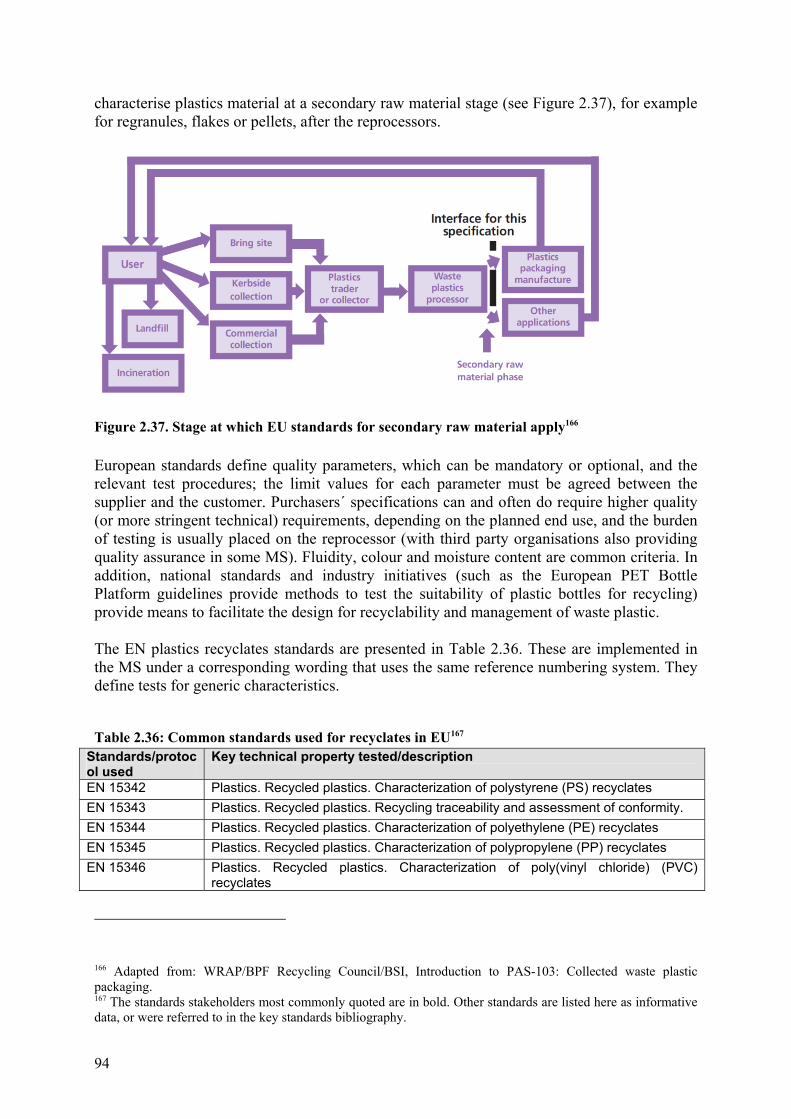
94
characterise plastics material at a secondary raw material stage (see Figure 2.37), for example for regranules, flakes or pellets, after the reprocessors.
Figure 2.37. Stage at which EU standards for secondary raw material apply166 European standards define quality parameters, which can be mandatory or optional, and the relevant test procedures; the limit values for each parameter must be agreed between the supplier and the customer. Purchasers´ specifications can and often do require higher quality (or more stringent technical) requirements, depending on the planned end use, and the burden of testing is usually placed on the reprocessor (with third party organisations also providing quality assurance in some MS). Fluidity, colour and moisture content are common criteria. In addition, national standards and industry initiatives (such as the European PET Bottle Platform guidelines provide methods to test the suitability of plastic bottles for recycling) provide means to facilitate the design for recyclability and management of waste plastic. The EN plastics recyclates standards are presented in Table 2.36. These are implemented in the MS under a corresponding wording that uses the same reference numbering system. They define tests for generic characteristics.
Table 2.36: Common standards used for recyclates in EU167 Standards/protocol used
Key technical property tested/description
EN 15342 Plastics. Recycled plastics. Characterization of polystyrene (PS) recyclates EN 15343 Plastics. Recycled plastics. Recycling traceability and assessment of conformity. EN 15344 Plastics. Recycled plastics. Characterization of polyethylene (PE) recyclates EN 15345 Plastics. Recycled plastics. Characterization of polypropylene (PP) recyclates EN 15346 Plastics. Recycled plastics. Characterization of poly(vinyl chloride) (PVC)
recyclates
166 Adapted from: WRAP/BPF Recycling Council/BSI, Introduction to PAS-103: Collected waste plastic packaging. 167 The standards stakeholders most commonly quoted are in bold. Other standards are listed here as informative data, or were referred to in the key standards bibliography.

95
EN 15347 Plastics. Recycled Plastics. Characterization of plastic waste EN 15348 Plastics. Recycled plastics. Characterization of poly(ethylene terephthalate) (PET)
recyclates prCEN/TR 15353 Guidelines for the development of standards relating to recycled plastics EN 13430 Packaging. Requirements for packaging recoverable by material recycling. EN 13437 Packaging and material recycling. Criteria for recycling methods. Description of
recycling processes and flow chart ISO 16103 Packaging. Transport packages for dangerous goods. Recycled plastics material ISO 15270 Plastics -- Guidelines for the recovery and recycling of plastic waste ASTM D 5033:2000
Standard guide for the development of standards relating to recycling and use of recycled plastics.
ASTM D 5991:1996
Standard practice for separation and identification of poly(vinyl chloride) (PVC) contamination in poly(ethylene terephthalate) (PET) flake.
ASTM D 6288 Standard practice for separation and washing of recycled plastics prior to testing. ASTM D 5814 Standard practice for determination of contamination in recycled poly(ethylene
terephthalate) (PET) flakes and chips using a plaque test. ASTM D 5577 Standard Guide for Techniques to Separate and Identify Contaminants in
Recycled Plastics ASTM D 5676 Standard Specification for Recycled Polystyrene Moulding and Extrusion Materials ASTM D 5203 Standard Specification for Polyethylene Plastics Moulding and Extrusion Materials
from Recycled Post-Consumer (HDPE) ASTM D 5491 Standard Classification for Recycled Post-Consumer Polyethylene Film Sources
for Moulding and Extrusion Materials Standards EN 15342, EN 15344, EN 15345, EN 15346 and EN 15348 define methods of specifying delivery condition characteristics for recyclates of different plastic types (PS, PE, PP, PVC and PET). They describe the most important characteristics and associated test methods to assess the recyclates intended for use in the production of semi-finished/finished products. They are intended to support parties involved in the use of recycled plastics to agree on specifications for specific and general applications. The standards also state that the supplier shall maintain records of the quality control carried out, including incoming materials, processes and finished products. These standards are very open and generic. The characteristics of the recyclates can be either mandatory (ones needed to define recyclates in general and required for all recyclates), or optional (ones needed to define recyclates but according to customer specifications). Other tests may be carried out by agreement between the purchaser and the supplier and the results reported. Their potential use in the EoW criteria is further discussed in Chapter 3. Standard EN 15343 aims at describing the necessary procedures for mechanical recycling that are required for products that have been manufactured completely (or in part) from recycled plastics, and need proof of traceability. It enables producers to use the recycled materials with confidence, and provides the end users with a basis for their acceptance. Procedures required for the traceability of recycled plastics include: Control of input material (e.g. proper design of collection and sorting schemes, batch
identification); Control of the recyclates production process (e.g. recording the process variables, quality
control testing of the products delivered by the process); Plastics recyclates characterisation (e.g. EN 15342, EN 15344, EN 15345, EN 15346 or
EN 15348); Traceability (description of origins, logistics, tests carried out before processing, process
parameters, tests carried out after processing, intended application).

96
EN 15343 also provides the basis for the calculation procedure for the recycled content of a product. Standards EN 13430 and EN 13437 deal with packaging recycling. EN 13430 specifies the requirements for packaging to be classified as recoverable (through recycling), whilst accommodating the continuing development of both packaging and recovery technologies. It also sets out procedures for assessment of conformity with those requirements, including the procedure to define the requirements and the procedure for assessing recyclability criteria. Standard EN 13437 defines the criteria for a recycling process and describes the principal existing processes for material recycling and their inter-relationship. The tests required by the standards and tender of specifications can be carried out either at the output of the reprocessing step (quality requirements of the secondary raw material above the EU standards) and also at the stage of the finished products. Reprocessors are usually responsible for ensuring the quality of the recyclate they provide to their end customers and they bear the costs of the control processes. Regarding end products, test products are produced along the normal production chain to check the compliance with possible constraints. The external colour of the PVC profiles is often specified, for instance, whereas the internal colour does not matter; some pieces in the automotive applications (e.g. interior doors) have to be very resistant, etc. Requirements can also vary from one company to another for the same product; however, this is commonly a confidential aspect of the product composition or the manufacturing process. Similarly to the stage between the collector and the reprocessor, tenders of specifications are contracted between the reprocessor and the industrial customer. Thus, in practice, more specific requirements may be added to these standards, but these have to be respected in any case. 2.8.3.1 Technical specifications for recycled plastic end-uses
Examples of key material properties required for different types of use are described in the table below.
Table 2.37: Summary of material properties required for acceptance to different uses168 Type of plastic Type of use Key requirement
Any type of plastics
Electrical and electronic equipment
Limit values: 5 mg/kg (sum of 6 PCBs) and 50 mg/kg (PCB equivalents) 1000 mg/kg for Penta/Octa PBDEs (EU 2003/11) 1000 mg/kg for PBDEs and PBBs (RoHS Directive) < 1 micro g/kg for 4 PBDD/Fs169 (German Chemical Banning Ordinance) < 5 micro g/kg for 8 PBDD/Fs (German Chemical Banning Ordinance)
Any type of plastics
Automotive; Electrical and electronic
Limit values (RoHS and ELV): 100 mg/kg for cadmium 1000mg/kg for lead, mercury and hexavalent chromium
168 Sources: BIO Intelligence Service (2008), Heavy metals in plastic crates and pallets; PlasticsEurope (2006), The characteristics of plastics-rich waste streams from end-of-life electrical and electronic equipment. 169 Dioxins and furans

97
Type of plastic Type of use Key requirement
equipment
Mainly HDPE, PE
Plastic crates and pallets
Requirement in terms of maximum limit for the heavy metals in packaging. The sum of the concentrations of four heavy metals (lead, cadmium, mercury and hexavalent chromium) is not to exceed: 600 ppm (as of July 1998); 250 ppm (July, 1999), and 100 ppm (July 2001). However, because crates and pallets have a long life span (10-15 years), a derogation has been set up in order to enable these products to progressively become compliant with the legislation. Packaging that has been manufactured under utilisation of the derogation is labelled with:
Plastic packaging made of heavy metal containing recyclates (> 100 ppm) – market with the line under the plastic type In comparison, this is heavy metal free plastic packaging label (made
of recyclate, virgin polymer possibly added).
Plastics with or without recycled content for food contact have to comply with EU 1935/2004 and most specifically with Regulation 282/2008/EC focusing on recycled plastic materials. According to the Regulation, waste plastic may be contaminated by substances from the previous use or incidental misuse of the plastics or by substances originating from non-food contact grade plastic. As it is not possible to know all possible types of contamination, and as different types of plastics have different capacities to retain and release contaminants, it is not possible to set defined characteristics for the final product applicable to all types of recycled plastics. Therefore a combination of input characterisation together with an adequate process to remove possible contamination is necessary to control the safety of the final product. Thus, source certified post-consumer plastics collected for re-use have to be washed using an additional ‘superclean’ process that has been approved to EU282/2008. Most commercial pre-form trays or sheets for form-fill-seal manufacturers are a mix of food and non-food products. Rather than have a mix-up with grades, all plastics should subscribe to one benchmark. A recent legislative proposal in France is also currently under consideration, aiming at banning the commercialization of baby bottles containing Bisphenol A (BPA). The
98
proposal was initially planning to ban BPA in all food grade plastics but this was not accepted170.
2.9 Legislation and regulation In order to clarify the legal basis for trade of waste plastic, it is necessary to analyse both the legislation currently controlling waste plastic as waste, and the legislation that would cover waste plastic if it no longer was waste. The question to be answered is: how would product legislation regulate and control the environmental risks associated with waste plastic disposal/recovery once it ceases to be waste? In the EU, the management and trade of waste plastic are currently regulated under waste law. The following pieces of legislation will be discussed below: The Packaging Directive (Packaging and Packaging Waste Directive, 94/62/EC of 20
December 1994, amended by 2004/12/EC). The EU Waste Shipment Regulation. REACH (explain what is it in words) By-product definition under the WFD. The Waste Electric and Electronic Equipment (WEEE) directive The End-of-Life Vehicles (ELV) Directive: The plastics intended for food contact Regulation Other trade regulation issues (China) VAT
2.9.1 Packaging Directive Packaging plastic is also regulated under the "Packaging Directive" (Packaging and Packaging Waste Directive, 94/62/EC171 of 20 December 1994, amended by 2004/12/EC). This Directive is intended to harmonize national legislations with the goal of preventing or reducing the environmental impact of packaging and packaging waste. Its provisions address the prevention of packaging waste, the reuse of packaging materials, and their recovery and recycling. As part of the Directive's provisions, the following commitments and targets for packaging waste recycling are set (longer deadlines apply to the new Member States): Article 6.1 (e) no later than 31 December 2008 the following minimum recycling targets for materials contained in packaging waste had to be attained: […] 170 France Info. www.france-info.com/france-politique-2010-03-24-le-senat-bannit-les-biberons-au-bisphenol-a-421843-9-10.html 171 European Parliament and Council Directive 94/62/EC of 20 December 1994 on packaging and packaging waste, amended by 2004/12/EC http://europa.eu/legislation_summaries/environment/waste_management/l21207_en.htm

99
(ii) 22,5 % by weight for plastics, counting exclusively material that is recycled back into plastics; By 2007, new targets shall have been set for the next 5 year period (2009-2014). However, in a Report of December 2006 (COM(2006) 767 final), on the implementation of Directive 94/62/EC on packaging and packaging waste, the Commission announced that the recycling and recovery targets contained on the Packaging Directive are currently optimal and proposed these should remain stable to enable all the Member States to catch-up with these targets. In addition to the product specific target set by the Packaging Directive (94/62/EC), an overall 2020 target of minimum 50% re-use or recycling rate for at least paper, metal, plastic and glass collected from households (or similar) sources is set in the Article 11(a) of the Waste Directive (2008/98/EC): “by 2020, the preparing for re-use and the recycling of waste materials such as at least paper, metal, plastic and glass from households and possibly from other origins as far as these waste streams are similar to waste from households, shall be increased to a minimum of overall 50 % by weight.” This target is not to be met by each material individually.
2.9.2 Waste shipment regulation - WSR Exports for disposal are, apart from some very restricted exception, prohibited. Under the Waste Shipments Regulation (WSR) 172, wastes can be shipped for recovery, and are divided into two different control categories known as the green and amber lists. The WSR will remain the alternative framework for the transboundary movement of waste plastic not meeting the EoW criteria and thus not falling under EoW provisions. Broadly speaking, wastes on the green lists are non-hazardous, and are subject to minimal controls when shipped between EU Member States for recovery. Wastes on the amber lists are deemed to be hazardous and are therefore subject to more stringent control regimes within the EU. waste plastic, in an uncontaminated, homogenous form with minimal non plastic components, can be shipped under green list controls as it is non hazardous. For hazardous waste, its transboundary movement is regulated by the Basel Convention173 If waste is exported to be recovered, the WSR controls ('green list' controls or notification controls) applying will depend on the type of waste shipped and the country where the recovery is to take place, as belonging to one of these groups: an EU Member State – except for the ‘new’ Member States listed below;
172 Regulation (EC) No. 1013/2006 of the European Parliament and the Council of 14 June 2006 on shipments of waste (Waste Shipment Regulation), http://eur-lex.europa.eu/LexUriServ/LexUriServ.do?uri=CELEX:32006R1013:EN:NOT 173 The Basel Convention, http://europa.eu/legislation_summaries/environment/waste_management/l28043_en.htm

100
a ‘new’ EU Member State, namely Latvia, Poland, Slovakia, Bulgaria or Romania; an OECD Member State; a non-EU Member State outside the OECD.
Where waste is to be shipped from an EU country to a non-EU country, additional controls apply. It is generally not prohibited to export waste plastic or other plastic-containing waste from a EU Member State to recovery in a third country outside the EU. If the non-EU country is a Member of the Organisation for Economic Co-operation and Development (OECD), the controls are similar to those within the EU. However, if the non-EU country of import is not a Member of the OECD, then following an amendment made to the Basel Convention in 1995, exports of amber (i.e. hazardous) wastes, even for recovery, are banned completely. For “green list” exports (recycling) to non-OECD countries, the Regulation requires the Commission to obtain a new declaration from the receiving country as to whether it will accept each kind of waste; it may also require pre-notification and consent. The country of import can choose which green list wastes it wishes to import for recovery, and which it does not. Some of the responding countries have waste plastic as green list without the need of control, including, from the top-10 importers of EU waste plastic (see Fig 2.17), Philippines, Thailand and India. waste plastic is not fully prohibited by any of the top-10 world importers, but all of them require either prior written notification, or have own additional control procedures (see dedicated section below). However, some of the non-OECD countries failed to respond and where no reply is received, those countries are to be regarded as having chosen a procedure of prior written notification and consent. Default controls of prior written notification and consent are applied, which requires administration and payment of a fee as well as the establishment of a financial guarantee, and shipments are delayed whilst this is completed In consequence, it is important that those wishing to export waste plastic for recycling outside of the EU are not only sure that their material properly falls under the green list categorisation, but also check that the importing country is prepared to accept the material without further controls. In any case, the Waste Shipment Regulation allows exports from the Community only if the facility that receives the waste (i.e. plastic producer or other) is operated in accordance with human health and environmental standards that are broadly equivalent to standards established in Community legislation (IPPC). In reprocessing and recycled plastic manufacturing, waste plastic must be dealt with in an environmentally sound manner, without causing health risks. Generally, the reprocessor should be licensed or permitted in some way by the relevant local regulatory authorities. Waste plastic under green list controls may contain the following materials174 (WSR Annex V 1B: B3010 Solid plastic waste:): The following plastic or mixed plastic materials, provided they are not mixed with other wastes and are prepared to a specification: 174 List of wastes from Annex V of 1013/2006 (Annex IX to the Basel Convention, reproduced in Annex V, Part 1, List B, of 1013/2006)

101
— Waste plastic of non-halogenated polymers and copolymers, including but not limited to the following (1): — ethylene — styrene — polypropylene — polyethylene terephthalate — acrylonitrile — butadiene — polyacetals — polyamides — polybutylene terephthalate — polycarbonates — polyethers — polyphenylene sulphides — acrylic polymers — alkanes C10-C13 (plasticiser) — polyurethane (not containing CFCs) — polysiloxanes — polymethyl methacrylate — polyvinyl alcohol — polyvinyl butyral — polyvinyl acetate — Cured waste resins or condensation products including the following: — urea formaldehyde resins — phenol formaldehyde resins — melamine formaldehyde resins — expoxy resins — alkyd resins — polyamides — The following fluorinated polymer wastes (2): — Perfluoroethylene/propylene (FEP) — Perfluoro alkoxyl alkane — Tetrafluoroethylene/per fluoro vinyl ether (PFA) — Tetrafluoroethylene/per fluoro methylvinyl ether (MFA) — Polyvinylfluoride (PVF) — Polyvinylidenefluoride (PVDF) (1) It is understood that such scraps are completely polymerised. (2) Post-consumer wastes are excluded from this entry. Wastes shall not be mixed. Problems arising from open-burning practices to be considered. "Green list' controls include: The waste can be moved legally without obtaining permission from the regulators. The waste must be accompanied by a completed and signed "Annex VII form". Specified contracts for recovering the waste between the person sending the waste and the
person receiving the waste must be in place. When the person receives the waste, he/she must sign the accompanying form. Copies of the form relating to the waste movement must be kept for three years.
The regulatory authorities can ask for copies of the documents relating to the movements already made or ask for information from those documents.
102
According to the comments received by some experts of the technical working group, some of the entries of the regulation, as quoted above, are non-exhaustive (e.g. expressions like 'including but not limited to'), and this ambiguity opens the possibility of different interpretations by the enforcement authorities. The OECD (2009) reports that traders encounter problems related to the "Annex VII form" requirements. The traders mention that the form adds administrative burden, which they do not feel is necessary, but the main concern is about providing information on the origin and the final destination of the shipment, which in some cases is perceived as confidential for commercial reasons. This confidentiality is no longer guaranteed if the buyer and seller of the traded waste plastic get this information via the Annex VII form. End-of-waste will impact trade, as waste plastic that fulfils EoW criteria will not be under the waste shipment regime. The procedures laid out in OECD Decision C(2001)107/Final concerning the control of transboundary movements of waste destined for recovery indicate that the materials may be traded for recovery using normal commercial controls within the OECD. This implies that the standard customs controls for goods are applied to these materials, without additional procedures. According to (OECD 2009: Joint Working Party on Trade and Environment: Reducing barriers to international trade in non-hazardous recyclable materials: exploring the environmental and economic benefits, Part 1: A synthesis report), the US and Japan apply the OECD Decision in this way. Conversely, the EU follows the WSR and applies the 'green list controls' to waste PAPER. The logics of end-of-waste is that waste plastic that has fulfilled the criteria and has become product is no longer under the waste shipment regime. As the scope of application of an end-of-waste regulation is the EU, nothing can be said on how a stream is classified (waste/ non-waste) at a destination out of the EU. The adoption of the EoW criteria may or not influence the criteria currently used for such decisions out of the EU, e.g. acknowledging at destination non-waste status for consignments classified as such before leaving the EU.
2.9.3 WEEE The Waste Electrical and Electronic Equipment (WEEE) Directive, 2002/96/EC is contributing to some improvements in the management of EEE equipment waste, mandates that an overall recovery rate of 70 to 80% must be reached for products produced since its introduction (50 to 70% of materials must be recycled)175. However, the primary driving forces for any WEEE treatment operation are the removal of any hazardous materials and the recycling of metals. It is thus not clear to what extent any plastics can be recovered for recycling into similar or alternative applications. As EEE is a major source of waste plastic, Directive 2002/96/EC on Waste Electrical and Electronic Equipment has some significant implications on plastics recycling. The directive sets out certain design requirements, the result of which could be a gradual reduction in the variety of plastics components in EEE products. The legislation increases the emphasis on the recyclability of EEE product components, although costs, and economic feasibility, remain a 175 European Commission, 2007, Plastics Composition of WEEE and Implications for Recovery.

103
barrier to its success. Additionally, it is worth noting that the WEEE Directive imposes the removal of plastics containing brominated flame retardants from any separately collected WEEE (although stakeholders have stated that the percentage of plastics containing BFRs actually recycled appears to be limited).
2.9.4 ELV Directive 2000/53/EC, the End-of-life Vehicle Directive, sets out targets aims to reduce the amount of waste from vehicles when they reach end-of-life. One such target is then, by 1 January 2015, reuse and recovery of vehicle material (including plastics) must be increased to a minimum of 95 % (by an average weight per vehicle and year). Vehicles form a small but significant part of the plastic waste stream; therefore this Directive provides an opportunity to develop plastic recycling. The End-of-Life Vehicles Directive (2000/53/EC) targets are not specific to material types, but increased treatment of plastics will be necessary to meet higher recycling targets of the Directive (85% reuse/recycling, and 95% recovery targets by 2015). The European Commission published a report in November 2009 regarding the implementation of the Directive for the period 2005-2008176, according to which the level of transposition of the Directive in National legal orders has substantially increased since 2006. However, in 2009, nine non-conformity cases and six cases for non-reporting were still pending; which shows that some of the provisions of the Directive have not yet been transposed fully or correctly.
2.9.5 ROHS In 2006, Directive 2002/95/EC on Restriction on Hazardous Substances (RoHS) put a ban on the use of some Brominated Flame Retardants (BFRs) in electrical and electronic applications i.e. Penta-BDE, Octa-BDE and PBB. In 2008, Deca-BDE was in turn forbidden and the current recast of the Directive177 could lead to the interdiction of other BFRs. The European Plastic Federations EuPC, PlasticsEurope and Federplast178 are opposed to this scope extension for various reasons, including the risk for recyclers processing WEEE plastics, who might rely on recycling old products (therefore potentially containing BRFs), and who might then not be able to sell their reprocessed plastics on the European market179. However, plastics 176 COM (2009) 635 final Report from the Commission to the Council, the European Parliament, the European Economic and
Social Committee and the Committee of regions on the implementation of Directive 2000/53/EC on end-of-life vehicles for the period 2005-2008
177 Electrical and electronic equipment: restriction of the use of certain hazardous substances (repeal. Directive 2002/95/EC). Recast, COD/2008/0240 178 Position de Fédérplast concernant la révision de RoHS, http://www.federplast.be/DOWNLOADS/RoHS_Position%20de%20Fédérplast%20concernant%20la%20révision%20de%20RoHS.pdf, PlasticsEurope views on the recast of the RoHS Directive, 2009, http://www.federplast.be/DOWNLOADS/RoHS_Plastics%20Europe%20RoHS%20views%20Rev%201.pdf 179 EuPC position paper on the Recast of the Rohs Directive http://www.federplast.be/DOWNLOADS/RoHS_EuPC%20position%20paper%20on%20recast%20of%20RoHS%20Directive.pdf

104
already containing recycled content are generally not recycled again, but are sent directly to landfills180.
2.9.6 REACH REACH is a European Community Regulation on chemicals and their safe use (EC 1907/2006) 181. It deals with the Registration, Evaluation, Authorisation and Restriction of Chemical substances. The Regulation entered into force on 1 June 2007. The aim of REACH is to ensure a high level of protection of human health and the environment, pomote alternative methods for assessment of hazards of substances, and facilitate the free circulation of substances on the internal market. When waste plastic ceases to be waste, it becomes subject to the provisions of REACH. Registration, Evaluation, Authorisation and restriction of Chemicals (REACH) Regulation guidelines published by European Chemicals Agency in May 2010 have clearly defined the obligations to be borne by plastic recyclers, as regard registration and production of safety data sheets. The Restriction of Hazardous Substances (RoHS) Directive recast and the ban of plastics containing brominated flame retardants from separately collected WEEE could have impacts on the activity of recyclers processing plastics from WEEE. The possible implications of this are discussed below: Under REACH, only substances are subject to registration. The REACH Regulation excludes some substances from its scope, and includes provisions to exempt some other substances from some or many of its requirements. Waste is excluded from the scope of REACH (Art.2.2), as it is covered by the waste regulatory regime, which ensures equivalent or more demanding control of health and environmental protection risks. As long as waste plastic has the status of waste it is thus not subject to most of most of the obligations under REACH. However, when waste plastic ceases to be waste according to Article 6 of the WFD, the exemption under Article 2.2 of the REACH Regulation does not apply anymore. Once waste plastic ceases to be waste, it has different obligations than as waste under REACH. As explained in detail below, for the purpose of REACH, waste plastic that has ceased to be waste is to be considered as a substance or mixture of substances such as the main polymer, and its additives, with or without impurities. The implications are discussed below. It is also relevant to note that recycled plastic products (made using some percentage of waste plastic polymers) that are put on the market are articles falling under REACH.
180 Pers. comm. with the Bureau of International Recycling and Galloo 181 REACH, http://ec.europa.eu/environment/chemicals/reach/reach_intro.htm
105
REACH includes exemptions to some of its requirements (Titles II on registration, V on downstream users, and VI on evaluation, but not on e.g. data sharing or information down the supply chain) for substances which are known to pose little or no health and environmental risk. Two exempted groups of potential relevance for waste plastic and its constituent substances are: Polymers. These are explicitly exempted from Titles II and VI through Art 2.9. (but not
from Title V on downstream users obligations) Substances, on their own, in preparations or in articles, which have been registered in
accordance with Title II and which are recovered in the Community (art. 2.7.d) if: o the substance that results from the recovery process is the same as the
substance that has been registered in accordance with Title II (e.g. the main waste plastic polymers and the additives that do not undergo chemical transformation); and
o the information required by Articles 31 or 32 relating to the substance that has been registered in accordance with Title II is available to the establishment undertaking the recovery. (e.g. main waste plastic polymers and additives that do not undergo chemical transformation, in case these are not covered by (i)).
Substances covered by Annex V, as registration is deemed inappropriate or unnecessary for these substances and their exemption from the above mentioned Titles does not prejudice the objectives of REACH Regulation, e.g. substances which are not themselves manufactured, imported or placed on the market and which result from a chemical reaction that occurs when the following substances functions as intended , and are not dangerous182: a stabiliser, colorant, flavouring agent, antioxidant, filler, solvent, carrier, surfactant, plasticiser, corrosion inhibitor, antifoamer or defoamer, dispersant, precipitation inhibitor, desiccant, binder, emulsifier, de-emulsifier, dewatering agent, agglomerating agent, adhesion promoter, flow modifier, pH neutraliser, sequesterant, coagulant, flocculant, fire retardant, lubricant, chelating agent, or quality control reagent; The simplest part of the list of substances present in waste plastics and not considered impurities are the main constituent polymers, with the list of potentially contained additives being more complex. To the extent that these are not hazardous, and do not transform chemically under recycling, they are covered by one or more of the exemptions of REACH. The classification of these substances according to REACH is described in detail below: Mixtures, substances and impurities The Commission issued in October 2008 the document “Waste and Recovered Substances” (CA/24/2008 rev.3 of April 2009), which clarifies the general principles for waste and recovered substances for REACH, and gives useful interpretation for the major recovered materials. This document has been expanded and consolidated by the ECHA in April 2010183. The CA/24/2008 rev.3 document, also quoted in ECHA (2010), specifies the considerations to be taken on recovered [sic] polymers for the purpose of REACH: 'The polymer recovery operator should also identify any intended substances in the recovered material (e.g. substances added to adjust or improve the appearance and/or the 182 That is, they do not meet the criteria for classification as dangerous according to Directive 67/548/EEC. 183 ECHA, 2010.

106
physicochemical properties of polymeric material) originally present in the polymeric material that was recovered. This may happen in case of selective recovery. Intentionally recovered substances can not be treated as impurities, but have to be considered as a substance for which one has to check whether one can rely on the exemption via Article 2(7)(d) of REACH. For this reason, it is recommended to regard the recovered material as a substance in a mixture (e.g. in the case of selective recycling of soft PVC, it may be necessary to register the relevant softeners, unless they have been registered before). The spectrum of impurities and their concentrations is relatively wide. Impurities originating from substances originally present in the polymeric material to be recovered do not need to be registered, as their presence is covered by the registration of the monomer substance(s). Any other unintentional “impurity” present in the recovered polymer substance (e.g. pigments which have not any longer the intended function in the recovered material or impurities that are introduced after polymer manufacturing) can be considered as impurities, unless present in quantities above 20%. If that is the case, the constituent should be seen as a substance in a mixture, even if its presence is non-intentional. In determining the status of the recovered polymeric material, information on the origin may be important in establishing which constituents may be present in the material and whether they should be seen as impurities or separate substances. Impurities are part of the substances and do not need to be registered. However, manufacturers of recovered polymers should have information on the identity and quantities in which hazardous minor constituents or impurities are present in the recovered polymer to the extent needed as described in the section on impurities. An analysis is not required in certain cases where no significant impurities are expected (e.g. if the recovery occurs from a polymer used in its pure form). Also in some cases it may be possible to characterise the recovered polymeric product sufficiently without considering the origin. However, in the case of polymers, and with the idea to help recovery operators in identifying the materials in various plastic items, plastic identification code numbers 1-6 have been assigned to six common kinds of recyclable plastic resins, with the number 7 indicating any other kind of plastic, whether recyclable or not. Standardized symbols are available incorporating each of these codes. As there are six commonly recycled polymers it would be helpful to give such information on which monomers have been used for the manufacturing of the polymer. There is also the option of handling recovered polymers as UVCBs, if the composition is unknown. In a first step it may be assessed whether the recovery process results directly in an article (i.e. if the first non-waste material in the recovery chain is an article and neither a substance as such nor in a mixture). There is no registration requirement under REACH with regard to the presence of a polymer substance in a recovered article. Following the approach provided, the recovery operator should then assess, whether substances in the recovered polymers are exempted under Annex IV or Annex V of REACH or whether any other exemption criteria under REACH apply. Although the registration provisions under REACH do not apply to polymers, the manufacturer or an importer of polymer is required to register the monomers and other substances used to manufacture the polymer under certain conditions in accordance with
107
Article 6(3) of REACH. Similarly, for recovered polymers, the monomers and the other substances have to be registered in order to be able to rely on the exemption of Article 2.7(d) of REACH. The impurities in the monomer need to be covered by an existing registration. In most cases the waste polymer is collected from the EU market, then the polymer recovery operators are exempted from the obligation to register the monomer(s) or any other substance(s) meeting the criteria of Article 6(3) of REACH in the recovered polymer, provided that these substance(s) from which the polymer is derived ha(s)(ve) been registered. Moreover, the recovery operator must have the safety information required by Article 31 or Article 32 of REACH concerning the monomer as the monomer is subject to registration requirements. For that purpose, all available information on the components of the recovered material needs to be taken into consideration ' Consequences for waste plastics Under REACH, only substances are subject to registration. In waste plastics, not only the main polymer but also the additives may be affected, depending on two conditions: whether their presence is intentional or not, i.e. whether thy are targeted substances, or
can be considered impurities. if they are impurities, whether their content is above or below 20% (w/w).
Being the main polymers substances of common use for many purposes, it can be expected that these conditions can normally be met without disproportionate efforts. This implies that in practice reprocessors will not have to register the polymers under REACH. The situation can be more difficult for the large amounts of additives present in waste plastics. Industry associations can contribute decisively to keep the burden low for companies that want to demonstrate compliance with these conditions. The industry associations may have a very important role in producing guidance documents and drafting safety data sheets relevant for their members. Question 9: Please provide your expert comments on the accuracy of the provided interpretation of REACH to waste plastics. Are there any important practical barriers? Which activities are going on currently in industry to tackle the requirements of REACH once a waste plastic ceases to be waste?
2.9.7 Plastics intended for food contact applications Directive 2002/72/EC, relating to plastic materials and articles intended to come into contact with food, establishes a list of monomers and other substances, such as additives, that are permitted for use in the manufacture of food packaging. It also amends existing restrictions, in particular related to epoxidised soybean oil (ESBO) migration in PVC gaskets used to seal glass jars containing foods for infants and young children.
108
Plastics Contact with Food Directive, 2002/72/EC Directive 2002/72/EC, relating to plastic materials and articles intended to come into contact with food, establishes a list of monomers and other substances, such as additives, that are permitted for use in the manufacture of food packaging. It also amends existing restrictions, in particular related to epoxidised soybean oil (ESBO) migration in PVC gaskets used to seal glass jars containing foods for infants and young children. Recycled Plastics Contact with Food Regulation, 282/2008/EC This regulation sets up a framework specific to recycled plastics and therefore amends the general Regulation 2023/2006/EC on good manufacturing practice for materials and articles intended to come into contact with food. Additionally, Regulation 1935/2004/EC on materials and articles intended to come into contact with food sets out the general principles for eliminating the differences between the laws of Member States as regards materials and articles in contact with food and provides in Article 5(1) for the adoption of specific measures for groups of materials and articles. That Regulation identifies that harmonisation of rules on recycled plastic materials and articles should be given priority which led to the adoption of Regulation 282/2008/CE presented hereafter. Under the provisions of Directive 94/62/EC, waste plastic could in theory be recycled into plastic products for the packaging of food. Regulation 282/2008/EC came into force to determine the minimum health and safety requirements for recycled plastics which may come into contact with food. It scope excludes plastics which have been obtained through chemical recycling (e.g. depolymerisation), production scrap that is subject to rigid quality control, and plastics behind a functional barrier. Recycled plastics material complying with strict quality criteria and therefore falling under the scope of this regulation must follow a strict procedure to obtain the authorization to be put on the market. The authorisation covers a recycling process in the framework of an intended contact with food and must be delivered by the competent national authority as well as by the European Commission. Application in Member States Legislation covering plastic in food contact applications (the Plastics Contact with Food Directive, 2002/72/EC, and the Recycled Plastics Contact with Food Regulation, 282/2008/EC) seem to have been well received by EU Member States since more and more companies launch into bottle to bottle recycling compliant with Food contact requirements. However the need for significant technologic investments might affect growth of recycling of this waste plastic stream. In France, in the case of plastic material, a request must be submitted to the national authority in charge of fraud monitoring and consumption184 in order to prove that the recycled material’s composition and certain technical parameters are equivalent to material they replace185. Documentation from the national Food safety Agency is also required to obtain the authorisation. As stated at section 2.8. such administrative requirements can have increase costs, and represent a significant burden for plastic recyclers. An example of this is ‘France 184 Direction générale de la consommation, de la concurrence et de la répression des fraudes 185 www.contactalimentaire.com/index.php?id=569

109
Plastics Recycling’ producing recycled plastic, part of which is used for food contact applications. The producers recently obtained the accreditation at the national level and are currently submitting a request before the European Commission186. Question 10: Which is the experience of the impact of Directive 2002/72/EC and Regulation 282/2008/EC on plastics recycling practice? How does it affect the (a) characterisation and (b) market options of recycled material?
2.9.8 By-products If a certain waste plastic generated were regarded as being a by-product, and not being waste, in the sense of Article 5 of the WFD, then a possible interpretation is that end-of-waste criteria would not apply to it, unless the by-product becomes waste at a later phase. By-product status should not be an alternative to avoid compliance with end-of-waste, but this is not likely to be the case, as by-product conditions are even more strict than end-of-waste, e.g. Art. 5 (b) and Art. 5 (c) below, both of which are not required for end-of-waste and would only be met by some high quality flows of pre-consumer waste plastic. Article 5 of the WFD on by-product reads as follows: "1. A substance or object, resulting from a production process, the primary aim of which is not the production of that item, may be regarded as not being waste referred to in point (1) of Article 3 but as being a by product only if the following conditions are met:
(a) further use of the substance or object is certain; (b) the substance or object can be used directly without any further processing other than normal industrial practice; (c) the substance or object is produced as an integral part of a production process; and (d) further use is lawful, i.e. the substance or object fulfils all relevant product, environmental and health protection requirements for the specific use and will not lead to overall adverse environmental or human health impacts.
2. On the basis of the conditions laid down in paragraph 1, measures may be adopted to determine the criteria to be met for specific substances or objects to be regarded as a by-product and not as waste referred to in point (1) of Article 3. Those measures, designed to amend non-essential elements of this Directive by supplementing it, shall be adopted in accordance with the regulatory procedure with scrutiny referred to in Article 39(2)."
186 Communication with FEDEREC
110
It is noticeable that Article 5 of the WFD says "…may be regarded…", which leaves a certain freedom of choice even if the four conditions of Article 5 are met, as long as measures under Article 5.2 have not been adopted.
2.9.9 Other regulatory elements in trade Regulatory authorities may assess exported waste to test whether or not the exporter has appropriately classified the waste. In some cases there may be differences in approach between regulators inside the EU for shipments outside the EU. For example, an official from the Dutch regulators might intercept a consignment on route from the UK to China and conclude the waste being exported should be considered differently from what the exporter declared. In such a case the view of the Dutch authorities would prevail and the exporter would have to pay to have the waste repatriated to the UK, even if the UK regulatory authorities were satisfied with the waste category declared by the exporter. Trade with China, India and Indonesia According to WRAP187, the Chinese national provisions require that a waste shipment be accompanied by three documents and these documents must be arranged prior to shipment in order to be considered legal and be allowed for import by the Chinese government. The procedure of exporting waste plastic to mainland China involves: Ensuring that the receiving facilities (destination) have the Chinese SEPA-licence; this
includes conformity with the Environmental Protection Control Standard for Imported Solid Wastes as raw materials.
Obtaining a so-called AQSIQ licence Obtaining a pre-shipment inspection certificate from CCiC188
Chinese importing restrictions for waste plastic include additionally: The amount of hazardous components (e.g. asbestos waste, burnt or partly burnt waste
plastic, etc.) not to exceed 0.01%. Impurities (such as wood, waste metal, waste glass, etc.) shall not exceed 0.5% of the
weight of the imported plastic material. All waste plastic materials must be broken into pieces (in chips, blocks, granulated or
powder) and washed – this means for instance that China may refuse shipments of plastic bottles to mainland China ports if the bottles are whole.
In the case of India and Indonesia, BIR189 reports that these two countries are implementing stricter quality controls on imported recyclables, especially paper, requiring all shipments to be pre-inspected by third parties (e.g. SGS, Bureau Veritas) to ensure the shipment is not 187 WRAP, 2008 188 China Certification & Inspection (Group) Co., Ltd (CCIC) is a transnational company and dedicated to provide “inspection, surveying, certification, and testing” services. CCIC is the first nationwide non-governmental organization in China, focusing its principal activities in the field of import & export commodity inspection, survey, and certification. 189 BIR (2009) BIR world mirror – recovered PAPER Quarterly report, April 2009 and July 2009. BIR, Belgium
111
waste. India is also introducing requirements on inspection certificates for imports, confirming the absence in the shipment of municipal waste, biomedical waste and hazardous waste, plus a chemical certificate. According to some experts of the technical working group, WSR and Asian inspections increase bureaucracy and cost of shipments, however regular changes in the Asian import requirements do hinder recycling, as changes in legislation are usually announced in the national language without prior notice. In such cases, the consequences of the legislative changes are not clear to the exporters, and often to the custom and inspection staff. According to the latest communications in relation to the WSR, other Asian countries or regions applying controls based on national law are Taiwan and Vietnam. Question 11: Are there any codes of practice in trade in EU Member States which would be appropriate to refer to in the end-of-waste criteria? Which are the latest developments for waste plastics on the new controls in Asian countries?
2.9.10 VAT Member States have the authority of deciding whether waste plastic that has ceased to be waste is subject to value-added taxation. The Commission is responsible for ensuring the correct application of Community law, which in this case is the VAT Directive. However, since this Community legislation is based on a Directive, each Member State is responsible for the transposition of these provisions into national legislation and their correct application within its territory. Therefore, the details about the taxation of waste plastic in a specific Member State are based on the national tax administration.
2.10 Environmental and health issues For the purpose of determination of end-of-waste criteria, the interest as regards environment and health is to ensure the fulfilment of condition (d) of Art. 6 in the WFD, that is, that by changing the condition of the waste plastic stream from waste to non-waste, 'the use of the substance or object will not lead to overall adverse environmental or human health impacts'. The question is therefore to analyse which are the direct and indirect environmental impacts of this change of status on waste plastic collection, treatment and recycling. It is therefore not as much relevant to characterize the environmental impacts of e.g. recycling or recycling versus not recycling, or recycling versus energy recovery, but to characterize the potential changes between current impacts when the material is waste, and future impacts when the material ceases to be waste. The types of environmental impacts of waste plastic collection, treatment and recycling, including storage and transport of recovered/recycled materials can be listed as:

112
• Energy uses • Resource uses • Air emissions: CO2, and other greenhouse gases • Other air emissions (toxic and/or environmentally harmful substances and dust) • Leaching or leakage of liquid components to the underground • Accumulation or release of toxic substances (e.g. flame retardants) • Fire hazards • Accidents at work (by e.g. glass , metals, sharps)
This section is to collect details on how the environmental impacts outlined can change when waste plastic ceases to be waste in the different stages of the chain, e.g. waste plastic collection, treatment and recycling (including storage and transport of materials) Some overall conclusions extracted from a preliminary screening of existing studies are the following: One of the main studies reviewed concluded that mechanical recycling appeared to be most beneficial, in terms of reduced environmental impact, provided that the recycled material substitutes at least some portion of virgin polymers, and losses remain low. Substitution or down-cycling appeared to have lower benefits than substitution of virgin plastic materials. The review showed that the benefits of mechanical recycling were the same whether materials are taken by consumers to a specific collection point, or mixed plastics are collected at the kerbside, being separated at the materials recovery facility, and that earlier steps of recycling (collection, sorting and pre-treatment) contribute only slightly to the environmental impact of the recycling system. However, the studies have described how transport can typically account for 10-20 % of the ecological burden, in some cases contributing to 30% of total impacts in the recycling chain. Transport impacts were however not enough to reduce the overall benefits of recycling over other waste treatment options190. Another study concluded that in the case of bottle recycling, recycling of a material for its original purpose (i.e. reuse) is often more advantageous than recycling of materials for alternative purposes. This appeared to be the case for both HDPE and PET bottle recycling. This study also demonstrated that in the case of some indicators, recycling was less beneficial when carried out abroad (in China) rather than closer to the source (in the UK)191. In some cases, plastics recycling can have a negative impact on human health. For example, in facilities where manual sorting is still in place, workers may risk injury and disease while sorting materials192. There is also a risk of plastic waste recycling having an effect on local populations. In particular, in countries with less stringent regulations, the recycling techniques used to treat plastic waste can be primitive, and in some cases there is a lack of appropriate
190 Wollny V. and Schmied M., 2000. Assessment of Plastic Recovery Options 191 WRAP, 2010, Life cycle assessment of example packaging systems for milk 192 Communication with stakeholder
113
facilities to safeguard environmental and human health. For example, chipping and melting of plastics in unventilated areas can have negative consequences on human health193. Waste plastic bales of most grades of waste plastic do not normally leach, since their main components are not soluble in water. It is common that small pieces of waste plastic and dust blow around in open-air waste plastic yards exposed to the wind. This can be solved by the covering of reprocessing plants to protect the waste plastic bales or piles. Regarding transport, the companies in charge of transport need to have a permit for waste transport and appropriate transport means. Under normal operation and cleaning practice of trucks, there should be no cross-contamination to a waste plastic load transported after other waste. At the mills, odours, noise, dust and other environmental aspects are covered by IPPC permits under the IPPC Directive. Reprocessors do not follow normally IPPC legislation, and operate under permits that include in general the exploitation conditions, but do not normally specify emission limits or types and methods of control. Plastic recycling: energy, emissions and resource use issues It is well known from LCA studies that recycling of most waste plastic types contributes to an overall energy and air emission saving compared to the use of virgin polymers. These resource savings are the very essence and driver of recycling of plastic. Together with the total monetary costs of collecting and processing waste plastic, they match the cost equation that keeps the recycling system running. The direct savings are thus a necessary, though not sufficient condition for proving the existence of a market, as the information is only complete when the total costs are incorporated, including the economic effects of legislation (subsidies, taxes, etc.), environmental protection (pollution abatement, disposal of rejects, etc), and investments in technology. Recycling avoids the disposal of used plastic, and this still takes place via landfilling in a large number of EU countries. Energy recovery of waste plastic through incineration is also an option to avoid landfilling. The waste hierarchy holds to an extent, but essentially for clean plastic fractions that can be recycled without excessive treatment. (see e.g. IPTS, 2008). Incineration can be a favourable option for e.g. waste plastic types of low recyclability because of high content of impurities (adhesives, mixed plastics, paper, metals, glass, rubber, wood, cross-contamination with food, solvents or oil), or content of inadequate plastic types that cannot be sorted or is too costly to sort. Recycling processes which use exclusively solid fuels and have old, energy-intensive technologies can also be worse performers in environmental terms than energy recovery options.
193 Wong M.H., Wu S.C., Deng W.J., Yu X.Z., Luo Q., Leung A.O.W.,Wong C.S.C., Luksemburg W.J., and Wong A.S., 2007, Export of toxic chemicals - A review of the case of uncontrolled electronic-waste recycling. Environmental Pollution, 149: 131-140
114
In any case, the overall result of life-cycle based studies will be dependent on a number of boundary conditions, including (1) the degree of substitution of virgin material (e.g. normally >70%), (2) the energy mix used for recycling and the energy sources substituted by virgin material production avoidance and incineration, and (3) the technologies and techniques for recycling and incineration, and the waste management context. Risk of inappropriate management of overseas end-of-waste shipments Should a waste plastic EoW consignment be used in the EU, it shall go for recycling, and it can be controlled that the reject with the non-plastic components is treated according to EU waste law. Should a waste plastic EoW consignment be exported out of the EU, two uncertainties arise: (1) Whether it will be recycled. The only known fact is that by meeting the EoW criteria, it has sufficient quality, a value, and a market. (2) If once recycled, the rejects will be treated appropriately, be it recovery or disposal. Should the consignment remain waste, recital 33 and Art.48(2) of the Waste Shipment Regulation requires management conditions at the destination that are broadly equivalent to those in the EU194. If the consignment is EoW, this can not be requested. Brominated flame retardants A major difficulty in plastics recycling is the presence of prohibited brominated flame retardants in old electronic equipment. Concerns have been raised recently about the possible impacts of these compounds on human health. Thus, the recent bans of some heavy metals and brominated flame retardants in the scope of the Restriction on Hazardous Substances (RoHS) Directive have been justified by their harmful potential. Mixing plastic waste containing brominated flame retardants with other waste plastic can lead to cross-contamination, and perseverance in the plastic chain, and purposeful mixing of plastic wastes in order to dilute the pollutant content is prohibited. In practice, many MS export plastic waste contaminated with flame retardants to Asia for recycling (declared as green listed waste) without considering the level of these contaminants contained in the plastic waste195. An example of efforts to limit these brominated flame retardant contaminants includes the Austrian regulation (Waste Management Plan) referring to shipment of plastic waste containing prohibited flame retardants laid down the following195:
• Plastic fractions from pre-treatment/recovery of WEEE, whose total levels (i.e. sum) of penta-, octa- and decabromodiphenyl ether exceed 0.1% and/or whose content of polybrominated biphenyls (PBB) exceeds 50 ppm (= 0005%) are subject to a
194 'The facility which receives the waste should be operated in accordance with human health and environmental protection standards that are broadly equivalent to those established in Community legislation.'EC/1013/2006 195 Communication with Bundesministerium für Land- und Forstwirtschaft, Umwelt und Wasserwirtschaft (Austria).

115
notification obligation (unlisted waste or in the case of exceeding the limit for PBB – Amber Listed waste: A3180), independently from the subsequent recovery operation.
• In case of the presence of higher contents of the above mentioned flame retardants, particularly when the content of octabromodiphenyl ether exceeds 0.5 %, a hazard characteristic (teratogenic) is triggered (a ban of export on hazardous wastes to non-OECD countries).
Pursuant to the Austrian Treatment Obligation Ordinance as amended, the recycling of plastic waste from WEEE containing halogenated flame retardants is allowed only in those production fields, where such flame retardants need to be added due to technical requirements. Question 12: This section on environmental and health impacts is to be completed. Experts are kindly requested to provide any valuable input to this section. Are there any important impacts that have not been outlined? Question 13: Aside from specific questions highlighted along Chapter 2, Experts are kindly requested to provide additional and/or updated data on any of the sections in this chapter, in view of the second version of the document.

117
3 END-OF-WASTE CRITERIA End-of-waste criteria for a material should be such that the recycled material has waste status if – and only if – regulatory controls under waste legislation are needed to protect the environment and human health. Criteria have to be developed in compliance with the legal conditions, be operational, not lead to new disproportionate burdens and undesirable side-effects, and consider that waste plastic collection and recycling is a well-functioning industrial practice today. Criteria should ideally be ambitious in providing benefits to as many waste plastic flows as possible, but shall also address with priority the main and largest represented flows in the EU. Criteria should not fail to target these priority flows by trying to encompass all existing waste plastic flows, and all national and regional singularities. It has been reported that the current waste status of waste plastic (and other recyclable waste materials) creates in some cases a variety of administrative and economic burdens, especially related to storage and shipment, and creates legal uncertainty by keeping under waste legislation a material that in practice is perceived and treated as a product. The following main benefits can be expected when EU-wide end-of-waste criteria for waste plastic are introduced: Clearer differentiation of the high-quality waste plastic, and recognisable distinction to
lower-quality waste plastic. Certainty that only high-quality waste plastic will cease to be waste. This confirms additionally the waste status for low-quality waste plastic, and the reasons for keeping it;
Improved functioning of the internal and external markets to the EU (simplified and harmonised rules across countries, increased legal certainty, increased transparency and reliability on quality assured shipments);
Reduction of administrative burdens related to shipment, transport and trade that are redundant for environmentally safe materials.
EoW criteria have to be clear, concise and enforceable. They have to be robust and controllable through spot checks, and minimise non-compliance that may undermine the credibility of end-of-waste criteria. The definition of the criteria has to be guided by the principles of simplicity and proportionality. Criteria have to be proposed in the less intrusive form possible, yet ensuring fulfilment of the conditions of Art.6 of the WFD. Proportionality shall be used in the prioritisation of the target waste plastic groups, addressing first the largest flows. In the appraisal of the need to set a criterion, criteria are introduced only where it is judged that the magnitude of the risks of unintended consequences or of impact to health and the environment requires it. Following the findings of the JRC methodology guidelines for EoW196, the ultimate aim of end-of-waste criteria is product quality. End-of-waste criteria include direct product quality
196 Can be downloaded from: http://susproc.jrc.ec.europa.eu/activities/waste/

118
requirements. In addition, a set of end-of-waste criteria may include other elements that help indirectly to ensure product quality, in particular requirements on input material, requirements on processes and techniques, and on quality assurance procedures. The criteria are a package, linked to each other. This means that e.g. stricter quality criteria may make redundant the inclusion of one or more of the input or process criteria. Following these considerations, it can be summarised that waste plastic should cease to be waste when: Waste plastic complies with industry specifications for a waste plastic grade for which
there is a market or demand for plastic conversion; Waste plastic includes precise information about the type(s) of plastic(s) contained, and
has a known maximum content of non-plastic components and unusable plastic types. Other properties of interest to the buyer such as moisture, density or melt mass flow rate may be added as non-compulsory information;
Waste plastic has not hazardous properties; Waste plastic is during processing not in contact with certain waste types that can cause
cross-contamination, e.g. biowaste, oil waste, waste solvents, health care waste or mixed municipal solid waste;
The producer of waste plastic provides documentation of the fulfilment of all conditions above, and supplementary information concerning the limitation of use to plastic manufacturing.
Furthermore, the end-of-waste criteria for waste plastic should not disrupt the existing recycling systems. They should simply identify where waste plastic has attained a quality that is sufficient to ensure that no environmental risks occur when it is transported, further processed or traded without being controlled as waste. For ensuring no disruption of existing, well-functioning systems under waste law, the end of waste is proposed and is to be understood as an option for high quality material, in no case an imposition. The main players in these systems (collection, reprocessing, conversion, administration) can opt for modifying the existing recycling systems or parts of these systems under their control, in case they see larger benefits in the new status than keeping the waste status. In the specific case of waste plastic, the additional requirement on the provision of information is necessary to limit the scope to the manufacture of plastics, and document awareness and acceptance of the producer to this intended use. Different options are possible for achieving this, including provision of a contract with a plastic producer, and compulsory labelling. The options evaluated are presented and discussed further in the section on provision of information. This approach to define a set of end-of-waste criteria combining several levers of action corresponds well to current good industrial practice of ensuring the product quality of waste plastic. Accordingly, waste plastic ceases to be waste when it is placed on a market where it has a demand because it fulfils certain product quality requirements, has a clearly identified origin and has been processed according to the required treatment processes. Compliance with all these requirements has to be ensured by applying industrial practice of quality control. The potential different elements of the end-of-waste criteria are discussed in detail in the following sections.
119
3.1.1 Outline of EoW criteria Following the JRC methodology guidelines, the following complementary elements can be combined in a set of end-of-waste criteria: Product quality requirements Requirements on input materials Requirements on treatment processes and techniques Requirements on the provision of information (e.g. documentation of end use, traceability
systems, labelling). Requirements on quality assurance procedures
The preliminary proposed end-of-waste criteria are presented individually below. These draft criteria will be extensively discussed with the technical working group in the fist workshop 22 November 2011.
3.2 Product quality requirements Product quality criteria are needed to check: For elements that can result in direct environmental and health risks, and That the product is suitable as direct input to recycled plastic production.
Product quality requires that the polymers and additives in waste plastic are adequate alternative to primary raw-materials, and that non-plastic components limiting its usefulness have been effectively separated. This refers to the usefulness both in the short term (production of recycled plastics) and in a long-term perspective that considers several cycles of collection and recycling and the progressive potential accumulation of trace elements that can not be removed from the cycle. Direct quality criteria on waste plastic should include thus quantitative limits on non-plastic components, content of unusable plastic types, and it may also include criteria on other properties, such as moisture, density, etc. Such parameters describe the completeness of treatment, ensuring that the waste plastic is fully characterised and fit for a safe direct use. Quantitative criteria may in principle be general or specific for the existing grades of waste plastic. The benefits of uniform criteria across grades are simplicity, and easier communication and implementation. Waste plastic must not present hazardous properties. In the EoW criteria, three options are possible to control the risks derived from hazardousness: (1) a direct criterion on the quality of the material, which shall not display any hazardous properties, (2) a criterion on the exclusion of the use of hazardous material as input, and (3) a criterion on the processing for the removal of hazardous material. Waste plastic shall not present visible contents of fluids like oil, solvents, paints, etc (except water) that may question the effectiveness of cleaning, result in hazardousness, or result in mould growth or odours

120
3.2.1 Content of contaminants: non-plastic components and non-targeted plastics
It is initially proposed to include a criterion on the maximum allowable content of non-plastic components in waste plastic. The criterion is connected to the fulfilment of two of the conditions of EoW, namely ensuring that the material is essentially composed of a recyclable material, in this case
plastic polymer (with known amounts of functional additives such as plasticisers, hardeners, softeners, flame retardants or UV degradation agents) with only a minor content of other non-recyclable materials, and for this reason a valuable input to plastic making, and
limiting the amount of rejects that need ulterior waste treatment, as waste treatment has
environmental impacts, and it can not be controlled once it is exported out of the EU. The definition of non-plastic components will be discussed in-depth with the technical working group. The definition is in principle based on limiting the content of any material different from the targeted plastic polymers, be it foreign or an integral part of the plastic product of origin (glass fibres, wood fibres, unwanted additives). It is expected that most currently traded waste plastic has a non- plastic component content between 0.1 and 3%, the vast majority being below 2%. Question 14: Experts (most notably converters but also reprocessors) are kindly requested to provide information and examples on the following quality material input parameters, for the different polymers: 1.a) average content of non-plastic components (specify if bound and unbound to the polymer matrix) 1.b) tolerable content of non-plastic components (specify if bound and unbound to the polymer matrix) 2.a) average content of non-targeted plastic components (specify if bound and unbound to the polymer matrix) 2. b) tolerable content of non-targeted plastic components (specify if bound and unbound to the polymer matrix) 3.a) average content of additives 3.b) tolerable content of additives (In both cases, we assume bound to the polymer matrix) It is important to indicate, to the extent possible, for each of these three groups: (a) to what shape the contaminant content refers to (washed material with the original form, flakes, pellets, aggregates, regranulates, other).

121
(b) any specification normally made of the substance or material of the non-plastic component, non-targeted plastic type, or additive type (e.g. if glass and metals content limits are not the same). (c) The technical options for separation of the non-plastic components and non-targeted plastic, e.g. by washing/cleaning/dry sorting prior melting, OR if part of the plastic matrix and can only be separated by melting/dissolution and filtering. It is assumed that all additives are part of the polymeric matrix. Once data is collected, the threshold percentage of non- plastic components that would be reasonable to set as part of the EoW criteria will be assessed. The criterion shall be as simple as possible, and do not create an additional administrative burden. The criteria should ideally be at reach for a large part of the recovered waste plastic flow currently used for recycled plastic product making, and perceived by the sector as a raw material, not waste. However, the threshold should: Be sufficiently strict to avoid that too contaminated material is classified as non-waste,
especially concerning the risk of shipment of non- plastic material out of the EU as part of a product. Only the cleanest material currently used and perceived as raw material should pass.
Not discourage technology development towards producing cleaner material that could
fulfil the threshold, to affect the efforts made in the last decades towards increasing waste plastic collection, increased quality in the collected waste plastic, the technologies for use of waste plastic for plastic making, and the demand of recycled plastic products.
Not make EoW a luxury issue only for the benefit of a marginal part of the total plastic
flows, and out of reach for the majority of the plastic flow currently perceived and used by the sector as a product.
It is in the spirit of the criteria proposed that facilities using multi-material sources should have continuous non- plastic component testing on output qualifying for EoW. It is envisaged that mono-material mixed waste plastic sources from households and commerce will require a more modest sampling effort, but regular enough to be able to detect trends and non-conformities. Conversely, the testing of high quality grades will be minimal, as their average non- plastic is in the range of e.g. 0.1-0.5% and therefore far from the likely proposed threshold. Sampling results have to be recorded, kept for the competent authorities and made available on their request. The sampling procedures and calibration methods shall be made available to auditing, e.g. by making them part of quality management procedures such as ISO 9001 that requiring auditing. Based on the discussed issues, the criteria on quality could be the following: Criteria Self-monitoring requirements 1. Quality of waste plastic resulting from the recovery operation
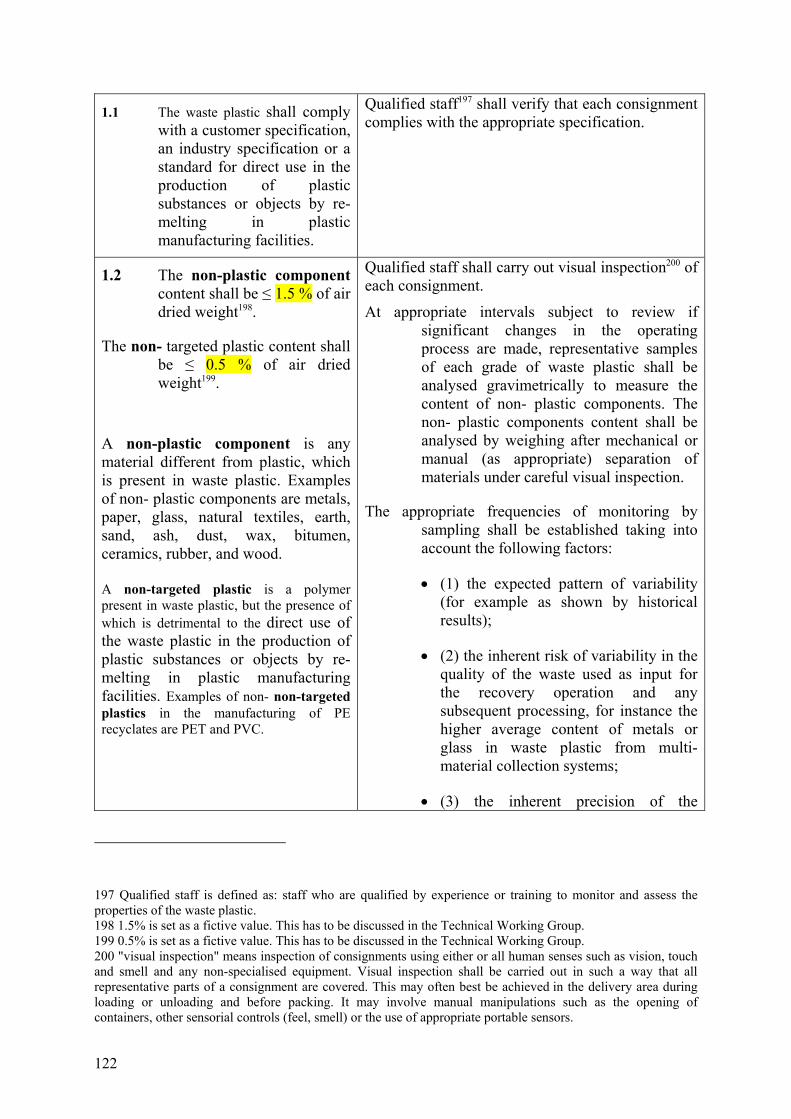
122
1.1 The waste plastic shall comply with a customer specification, an industry specification or a standard for direct use in the production of plastic substances or objects by re-melting in plastic manufacturing facilities.
Qualified staff197 shall verify that each consignment complies with the appropriate specification.
1.2 The non-plastic component content shall be ≤ 1.5 % of air dried weight198.
The non- targeted plastic content shall be ≤ 0.5 % of air dried weight199.
A non-plastic component is any material different from plastic, which is present in waste plastic. Examples of non- plastic components are metals, paper, glass, natural textiles, earth, sand, ash, dust, wax, bitumen, ceramics, rubber, and wood. A non-targeted plastic is a polymer present in waste plastic, but the presence of which is detrimental to the direct use of the waste plastic in the production of plastic substances or objects by re-melting in plastic manufacturing facilities. Examples of non- non-targeted plastics in the manufacturing of PE recyclates are PET and PVC.
Qualified staff shall carry out visual inspection200 of each consignment.
At appropriate intervals subject to review if significant changes in the operating process are made, representative samples of each grade of waste plastic shall be analysed gravimetrically to measure the content of non- plastic components. The non- plastic components content shall be analysed by weighing after mechanical or manual (as appropriate) separation of materials under careful visual inspection.
The appropriate frequencies of monitoring by sampling shall be established taking into account the following factors:
• (1) the expected pattern of variability (for example as shown by historical results);
• (2) the inherent risk of variability in the quality of the waste used as input for the recovery operation and any subsequent processing, for instance the higher average content of metals or glass in waste plastic from multi-material collection systems;
• (3) the inherent precision of the
197 Qualified staff is defined as: staff who are qualified by experience or training to monitor and assess the properties of the waste plastic. 198 1.5% is set as a fictive value. This has to be discussed in the Technical Working Group. 199 0.5% is set as a fictive value. This has to be discussed in the Technical Working Group. 200 "visual inspection" means inspection of consignments using either or all human senses such as vision, touch and smell and any non-specialised equipment. Visual inspection shall be carried out in such a way that all representative parts of a consignment are covered. This may often best be achieved in the delivery area during loading or unloading and before packing. It may involve manual manipulations such as the opening of containers, other sensorial controls (feel, smell) or the use of appropriate portable sensors.

123
monitoring method; and
• (4) the proximity of results to the limitation of the non-plastic components content to a maximum of 1.5 % of air dried weight, and of the non-targeted plastic content to a maxium of 0.5% of air dried weight.
The process of determining monitoring frequencies should be documented as part of the quality management system and should be available for auditing.
1.3 The waste plastic, including its constituents, shall not display any of the hazardous properties listed in Annex III to Directive 2008/98/EC. The waste plastic shall comply with the concentration limits laid down in Commission Decision 2000/532/EC201 , and not exceed the concentration limits laid down in Annex IV of Regulation 850/2004/EC202.
Qualified staff shall carry out a visual inspection of each consignment. Where visual inspection reveals any indications for possible hazardous properties further appropriate monitoring measures have to be taken, including, if appropriate, sampling and testing. The staff shall be trained on potential hazardous properties that may be associated with waste plastic and on material components or features that allow recognising the hazardous properties. The procedure of recognising hazardous materials shall be documented under the quality management system.
1.4 Waste plastic shall not contain oil, solvents, glues, paint, aqueous and/or fatty foodstuffs, that can be detected by visual inspection.
Qualified staff shall carry out a visual inspection of each consignment. Where visual inspection reveals the presence of signs of fluids except water, that may result in e.g. mould growth or odours, and these signs are non-negligible, the consignment shall remain waste. The staff shall be trained on potential types of contamination that may be associated with waste plastic and on material components or features that allow recognising the contaminants. The procedure of recognising contamination shall be documented under the quality management system.
201 OJ L 226, 6.9.2000, p. 3. 202 OJ L L 229, 30.4.2004, p. 1.

124
In relation to criterion 1.1: Question 15: Are there any standardised grades internationally accepted (e.g. CEN, ISRI)? Otherwise, reference will be made generically to a customer specification, or industry specification. Question 16: Are the shape and size (bales/bulk, empty clean packaging, scrap, pellets, flakes, regranulates, profiles) of waste plastic a parameters of concern in relation to the fulfilment of the conditions of Art 6 of the WFD (e.g. if it provides a guarantee of cleanliness)? If so, is it advisable to refer the quality criteria to a given shape or size (washed material with the original form, flakes, pellets, aggregates, regranulates, other)? If not, this parameter may better be dealt with through suppler/buyer specifications. In relation to criterion 1.2: Question 17: In relation to the quantitative characterisation of non-plastic components: is it possible/advisable to make reference to any particular clause of existing standards (e.g. CEN)? Specifically in relation to EN 16010:2009 (Plastics - Recycled plastics - Sampling procedures for testing plastics waste and recyclates): To what extent is the content of this standard followed in practice? Is it advisable to make reference to part or all of its content in the self monitoring requirements (right hand side column of the table)? Question 18: It is to be determined if EoW should or not include a maximum limit on the content of “non-targeted plastics” or “plastic detrimental to production”. Would it be advisable that the non-targeted plastic content be part of the criteria, as proposed? Depending on the polymer type, the technology available, and the output from reprocessing/ conversion, different producers may tolerate foreign plastics differently. If the presence of non-targeted plastics is accepted, the material has a value and an end use, and there is no significant health or environmental impact, this parameter may better be dealt with through suppler/buyer specifications. If the treatment of more than one polymer simultaneously is exceptional (e.g. polyolefins PP&PE), then the exclusion of “non-targeted plastics” can be the rule and part of EoW, and the existing exception(s) can be specifically addressed. Is it a possibility that the non-targeted plastic content be merged with non-plastic content in a single value (which could be rephrased to e.g. contaminant content)? Question 19: The current proposal would not distinguish between impurities can be separated by washing/cleaning/dry sorting prior melting, and those that are part of the plastic matrix and can only be separated in a melted/dissolved phase. Is it advisable to distinguish these two types of impurities in the criteria? In relation to criterion 1.3:

125
Question 20: Is the proposed formulation for treating hazardousness found appropriate? In relation to criterion 1.4: Question 21: Shall the presence of additives, known and unknown, be characterised and be part of the criteria? Experts are kindly asked to provide examples of how the content of additives is currently monitored. Question 22: To what extent can the presence of residual oils, solvents, paints, fatty foodstuffs or detergents be adsorbed by the plastic and be detected by odour? Can the presence of these components (oils, solvents, paints, fatty foodstuffs or detergents adsorbed by the plastic) be reduced by any known technology? To what extent can removal take place, e.g. fully, or only to residual adsorbed amounts non removable by further washing? Is the presence of these components (oils, solvents, paints, fatty foodstuffs or detergents adsorbed by the plastic) an important quality parameter? Can these adsorbed components (oils, solvents, paints, fatty foodstuffs or detergents adsorbed by the plastic) leach from the plastic e.g. if the plastic is used as recycled packaging? Question 23: Are there any other properties or characteristics of waste plastics that in your view should be part of the EoW criteria on quality? For instance, should or not EoW criteria refer to the age of waste plastic? Judging its presence in ISRI scrap specification circular (e.g. <1 or <6 months without UV protection) it seems it is a relevant quality parameter, which can affect the value of the material. Is this parameter linked to any relevant environmental concern? In any case, it is to be discussed whether this parameter is in practice controlled, and if it is not better be dealt through suppler/buyer specifications. Question 24: Is it appropriate to leave out of EoW the properties that do not relate to an environmental concern, and are tolerated differently by different repressors and converters, like moisture, density or mass flow index? Such properties can normally be dealt with through suppler/buyer specifications.
3.3 Requirements on input materials The purpose of criteria on input materials is to check indirectly the quality of the product.

126
Two main options exist: a negative list, and a positive list approach. A negative list approach for input material criteria would limit the inputs or input sources that pose a specific environmental, health or quality concern if not treated adequately. The positive list approach consists of referring to the types of input materials that are preferred because their origin ensures absence or minimisation of risks, e.g. a requirement that only selective collection sources are accepted for EoW. A positive list approach bears the risk of letting aside suitable sources of waste plastic, or sources which can become suitable as new technologies become available. Negative lists bear the concern of not excluding all potentially unsuitable materials. Both need an update mechanism, but the positive list is more sensitive to it. In the discussions held on EoW for other recyclable materials, the opinions received from the experts of the technical working groups have been different, some opting for positive lists (e.g. compost), and some for negative lists (e.g. glass, metals, paper). The end-of-waste criteria should allow as input only waste streams containing plastic that can be processed for the production of new plastic in compliance with the product quality requirements, after appropriate treatment, and without overall adverse environmental or human health impacts. For instance, concerns have been registered on the suitability of WEEE (waste of electric and electronic equipment) as input for EoW plastics. Flame retardants seem an important impediment for recyclability. In Germany203, broadly 1/3 of WEEE is reprocessed (but only the plastics in WEEE not subject to high temperatures and thus without flame retardants are recycled), 1/3 is dealt with by incineration (flame retardant –containing), and 1/3 is exported. However, in general it is acknowledged that if appropriate measures in terms of e.g. technology and man-power are taken to perform sorting and avoid cross-contamination, a high quality material can be obtained from very diverse origins.
3.3.1 Restriction of sources One may exclude certain origins of waste plastic, the presence of which can potentially represent a risk for health, safety and environment, and include: hazardous waste, including toxic materials biowaste (organic waste including food or beverage waste) mixed municipal waste health care waste WEEE
Question 25: Is it appropriate or disproportionate to exclude WEEE as input? Are there any other sources of plastic that shall clearly be restricted? 203 Probst , T (2011) Pers. comm.. Thomas Probst, BVSE
127
This has to be seen in the broader context of options of the other criteria, e.g. a quality criterion on additives that specified flame retardants. The question to ask for each case is: which is the most cost-effective means of tackling the given problem? If the presence of flame retardants is not possible by visual inspection, and costly by quantitative measurements, then input requirements are perhaps more suited, if needed with supplementary labelling. One may also limit the allowable input sources to collection systems that explicitly target waste plastic, alone or one of other recyclable materials like paper or glass, for instance: single-material collection systems for waste plastic, making use of the broad definition of
waste plastic that encompasses all plastic polymer materials. These collection systems keep waste plastic separate from other materials until delivery to recycled plastic conversion.
multi-material (e.g. comingled) collection systems of recyclable materials, e.g. mixed packaging blue bins in Belgium, yellow bins in Germany and Spain. These collection systems separate recyclables from other materials, and keep them separate until delivery to plastic making.
In both cases, waste plastic may be further sorted into different plastic polymers, but it shall be not be mixed with other materials. Depending on the strictness that one may choose for the quality criteria, most notably on grading and non- plastic content, some degree of flexibility is possible in the input criteria. The stricter and thorough the quality criteria (e.g. on maximum content of impurities) and the criteria on processing (e.g. if cleaning or filtering in melt/dissolved phase is required) the more redundant the criteria on the allowable origin become. In current industrial practice, the higher quality (e.g., 1% non-plastic content) is only achievable with input from pre-consumer sources, from relatively homogeneous post-consumer sources (e.g. agriculture film), and from separate collection systems, be these mono-material for plastics, or multi-material with other recyclables. Question 26: Shall mixed sources of all types of waste, e.g. unsorted municipal solid waste (MSW) suitable input? In other words, is the sorting and cleaning technology mature enough in terms of output quality and economic feasibility to allow such mixed inputs? In principle, for the benefit of a simpler and clearer legislative proposal, it is proposed as default not to include any limitation to the allowable collection systems. Regarding the possible question on whether waste plastic from multi-material collection systems shall or not be restricted, while taking note that on single material source collection delivers better average quality than multi-material systems, the large quality variations reported in practice between different multi-material waste treatment sites (MRFs) would not support the

128
exclusion a priori of these systems. If delivering high quality, these systems should be allowed, and given some degree of freedom to improve their sorting techniques. Unlike shipment of waste plastic from multi-material systems as waste, material from this origin that is shipped as EoW fulfils a number of additional quality, input, treatment and quality assurance criteria that ensure that the materials has high quality. In addition, there is the option of compulsory labelling of the origin: in previous EoW workshops for other recyclable materials, experts have supported the need of labelling specifically the material from mixed sources, e.g. multi-material systems. This has been requested in order to better tackle a higher risk of impurities and cross-contamination of the material as part of the quality management systems of end-product manufacturing, and better identify the nature of this contamination (e.g. an average larger content of glass/metals, if these be detrimental to production in plastic manufacturing plants, or and average larger content of adsorbable fluids like vegetable oils or detergents, if the plastic end-product is for food contact). The criteria on input materials may include the following elements: Criteria Self-monitoring requirements 2. Waste used as input for the recovery operation 2.1 Hazardous waste, bio-waste, mixed municipal waste, health care waste, and used products of personal hygiene shall not be used as input.
Acceptance control of all plastic-containing waste received by visual inspection and of the accompanying documentation shall be carried out by qualified staff which is trained on how to recognise plastic-containing input that does not fulfil the criteria set out in this section.
Question 27: Are there any other criteria for the input to plastic material that becomes EoW that in your view should be included?
3.4 Requirements on treatment processes and techniques The purpose of introducing requirements on processes and techniques is to check indirectly product quality. Apart from plastic which is reused (before collection), waste plastic is collected in varying quantities, processed and eventually converted into plastic products. Waste plastic needs often sorting and removal of non-plastic components. Some very homogeneous waste plastic fractions may just need transport and storage without contact to other waste fractions, while others may need thorough sorting after collection. Without pre-judging the point in the treatment chain where end-of-waste is reached, the purpose of the introduction of process requirements is to define minimum treatment conditions which are known to in all cases result in quality suitable for EoW. When reaching
129
end-of-waste status, the material must have those minimum necessary treatment processes that make it a suitable direct input material to the manufacture of plastic products. The treatment processes must also ensure that transporting, handling, trading and using waste plastic takes place without increased environmental and health impact or risks. The treatment processes required to achieve this sufficient quality differ depending on the waste streams from which the waste plastic has originally been obtained. The criteria on processes and techniques can include: basic general process requirements that apply in all types of waste/waste plastic streams,
such as the avoidance of cross contamination and after-mixture with waste. Specific process requirements for specific types of waste/waste plastic streams: which is
the key unit operation or operations (sorting, cleaning, etc..) that provide the essential reduction/removal of environmental and health risks for waste plastics?
Generic requirements that do not prescribe a specific collection scheme, origin, type of operator (municipal/private/local/global) or technology are preferred, since industry and authorities in the waste plastic recycling chain should not be prevented from adjusting processes to specific circumstances and from following innovation. It should be clear in any case that no dilution with other wastes (i.e. wastes that do not contain recyclable plastic) should be allowed for EoW material. As part of this principle, cross-contamination is to be avoided. As the remaining criteria do not provide the means to avoid dilution, it is proposed to maintain a criterion expressing clearly the need of avoiding mixing with other wastes. There are a range of specific processes and techniques that can be adopted by reprocessors to achieve high quality output. For example, in addition to the choice of equipment installed at sorting plants, key factors affecting the quality of the output include: Speed of throughput (e.g. at manual sorting cabins, at mechanical screens) Staffing levels within sorting cabins Quality management of the input streams (e.g. through communication with the waste
producers and collectors) The existence of a wet cleaning phase (washing) for removal or fluid residues (oils,
detergents, solvents, paints, etc..), versus dry cleaning. The existence of a filter mesh for impurity removal in the melted phase (extrusion), and if
used, its size (e.g. 150 µm). There is a range of specific processes and techniques that can be adopted by reprocessors to achieve high quality output. A better knowledge of the existing technologies in use for removal of impurities is needed in order to clarify if any of them is critical for achieving the degree of cleanliness of the waste plastic that ensures fulfilment of all 4 conditions of Art 6 of the WFD. Most important is the removal of impurities to an extent that makes the material safe for storage under any conditions, and suited input for melting and moulding into new products in replacement of either virgin polymers (normally for higher quality demands) or other materials such as wood/metal/concrete (e.g. outdoor furniture). Question 28:

130
To what extent is the existence of a wet cleaning phase (washing) critical for the removal or fluid residues (oils, detergents, solvents, paints, glues, etc..)? Can a processing in the absence of such wet phase achieve the same end quality? Please provide evidence on the extent to which the extrusion phase can be used and is used in practice for the removal of impurities of the following types: a) adsorbed fluid residues b) substances present in the polymer matrix (additives) b) in general, residues with a lower melting point than the main polymer c) in general, residues with a higher melting point than the main polymer (e.g. metals, glass) Which is the technology used in each case? Question 29: Which is the role of size reduction in relation to the removal of impurities? More specifically of: a) non-plastic materials b) differentiation of polymers (targeted vs non-targeted) To what extent does size reduction contribute to the reduction of health and environmental risks? For instance whole used packaging may still contain residuals of its former content, but is the material safer if just shredded? Or is it the subsequent washing / cycloning that removes actually the residuals? What happens if washing is not needed because of the known origin of the material (e.g. 100% post-consumer PET water bottles, free of contamination)? However, it shall be borne in mind that is the quality of the final output that is key to EoW, not the origin of the waste plastic nor how it was treated along the way. If a reprocessor is meeting the quality criteria established by EoW, to the extent possible one shall avoid to prescribe how this is achieved, as this may risk stifling innovation. The criteria on treatment processes and techniques may include the following elements:
Criteria Self-monitoring requirements
3. Treatment processes and techniques 3.1 waste plastic streams used as input shall, once received by the producer or importer, be kept permanently separate from the contact with any other waste, including other waste plastic grades. 3.2 All treatments needed to prepare the waste plastic for direct input to conversion to plastic products, such as sorting, separating, cleaning, or grading, and except de-baling, shall have been completed.

131
Question 30: Are there any other criteria on treatment processes and techniques of plastic waste that becomes EoW that in your view should be included? Are there any crucial unit operation not mentioned besides sorting, separating, cleaning, or grading, and except de-baling?
3.5 Requirements on the provision of information Requirements on the provision of information are a complementary element of end-of-waste criteria. The criteria have to minimise any onerous administrative load, recognising when current practice is competent in providing a valuable material for recycling, respecting existing legislation, and protecting health and the environment. Criteria on e.g. labelling of a consignment are only needed in specific cases. One such specific case is to support the limitation of scope of application of the criteria to a specific purpose, pursuing fulfilment of condition (a) of Art 6. in the WFD ("(a) the substance or object is commonly used for a specific purpose"). In the case of waste plastic, and as explained in detail in the scope definition in Chapter 1, the only specific purpose commonly used for waste plastic is the recycling of polymers, i.e. the manufacturing of recycled plastic. In order to ensure a correct application of the limited scope of use of waste plastic, additional requirements are necessary as part of EoW criteria. The purpose of the requirements is to minimise the risk that waste plastic that has ceased to be waste is diverted to uses different from manufacturing of plastic, be it within or outside the EU. However, there is no jurisdiction to control the uses outside the EU. In this sense, only an adequately designed constellation of criteria ensuring quality, input and treatment can warrant that end-of-waste waste plastic is only attractive for the recycling market, and in all likelihood, it will be used in plastic manufacturing. In this sense, it has similar conditions and risks as for ordinary commodities. Different options are possible for achieving this, some more explicit, some more implicit, some more burdensome and administrative, some more agile. The options are not mutually exclusive. One of the options discussed is that producers provide evidence that waste plastic is destined directly to the manufacturing of recycled plastic products, e.g. through a contract with a plastic converter. It may also be argued that such documentation makes the EoW workload equivalent to the current requirements under Green List waste shipments in the Waste Shipment Regulation. Another option discussed is that the operator in the waste plastic chain is part of a traceability register, by which the producer and subsequent holders of waste plastic that has ceased to be waste would be required to keep register of the previous and next holder of the consignment in the supply chain. As only these two steps are registered, confidentiality of operations is safeguarded. By being part of a register, operators commit to make this information available
132
to competent authorities or auditors upon request. A system of this type is currently in place in the paper industry: "Recovered PAPER Identification System" developed by CEPI, FEAD and ERPA. This system is intended for the purpose of traceability up the supply chain, but could likewise work down the supply chain. Traceability is suggested for the consignment, and not to the individual bales. Question 31: Is there any traceability system in operation in the plastic chain, similarly to the paper chain? To which extent are the (very generic) recommendations of CEN 15343:2007 used? Would requesting of traceability be advisable? Would it be a concern for e.g. confidentiality reasons? Another option concerning labelling is whether one should require compulsory labelling on the end-of-waste consignment, once it has passed all end-of-waste requirements and its exclusive intended use is the manufacture of recycled plastic. Labelling is not meant as a physical attachment to the bales, but as a visible remark in the Statement of Conformity. The labelling is meant as a supplementary highlight of the scope of the EoW criteria stated in the recitals of the Regulation204. In previous discussions with experts on other recyclable materials, the preferred solution has been introducing a requirement on labelling. This requirement does not directly ensure that waste plastic is destined to the manufacturing of plastic, but no other of the requirements proposed would provide a warranty on this, as all of them can be misused if this is the intention. However, ignoring the labelling is ignoring the scope of the Regulation. If waste plastic material labelled as EoW for recycling is not intended for plastic manufacture, it becomes waste, and the consignment becomes an illegal shipment of waste. It could be proposed that the requirement on the provision of information requires compulsory labelling on the intended exclusive use of the waste plastic. The labelling is only for the purpose of highlighting the scope of the EoW criteria Regulation, which could be included in the recitals. This labelling is the only option of the proposed that does not impose additional burden, and is deemed proportional to the risk of infringement in light of the strictness of the rest of criteria. The non-plastic component threshold to be proposed is likely only achievable for waste plastic that was directly of high quality (e.g. pre-consumer) or that has gone through sorting and cleaning, which restricts the market for the end-of-waste waste plastic to buyers willing to pay for this quality in of waste plastic because of the high content of polymer of
204 For a first estimate of the feasibility of diversion of waste plastic to energy recovery, the following information may be of use: currently, steam coal prices range 0.7-2 EUR/GJ (20-60 EUR/t), and crude oil is in the range 7-15 EUR/GJ (300-500 EUR/t). Waste mixed plastics of too low quality for recycling are paid at 25-100EUR/t. Their energy content ranges widely between 14 and 30 GJ/t, resulting in the also wide range 1-7 EUR/GJ. Assuming the high prices are for the high caloric waste and the low price for low energy plastics, this reange would be narrower, of 2-3 EUR/GJ.
133
suitable quality for plastic manufacturing. EoW plastic of this quality poses no environmental or health risk. Question 32: Would labelling of the intended use be of use in waste plastics? Please provide any supplementary data that can help estimate the risk of use of EoW plastics for non-recycling purposes, given its high value (probably >200EUR/t)? Once received the first input from the Technical Working Group, the historical series of market conditions and prognosis of future scenarios will be analysed, assessing the risk that waste plastic of this quality is diverted for other purposese. Labelling of multi-material origin It is an option to label EoW consignments from given origins, e.g. from multi-material collection systems. The argument in favour of it is that the knowledge of a multi-material origin could be found necessary by some plastic producers and reprocessors to be aware of a higher risk of non-plastic component content and cross-contamination of the material, and better handle it as part of their quality management systems. This knowledge is complementary to the total non-plastic component content, and lets the buyer know that there is a higher probability of presence of certain types of non-plastic materials, or non-targeted polymer types, which can be detrimental to production. Labelling facilitates also legal compliance in the manufacture of plastics in the cases where non-plastic component materials are not allowed, e.g. plastic products to be in contact with food. As with the intended purpose, labelling is here not meant as physical attachment of a piece of paper to the bales, but the inclusion of additional short text in the (digital) Statement of Conformity in a consignment. Labelling is seen as a soft, low burden criterion, and therefore it is proposed as a suitable proportionate instrument to tackle the risk of cross-contamination content at plastic manufacturing, as well as a means of indirectly raising awareness to the additional sampling frequency expected in these types of consignments. The labelling of the intended use is seen as an additional element to the inclusion of a statement about this scope restriction in the enacting provisions of a Regulation, that is, a legal condition. Possible criteria on requirements on the provision of information could be the following: REQUIREMENTS ON THE PROVISION OF INFORMATION205 waste plastic that has ceased to be waste is only intended for use in the manufacture of
plastic. waste plastic consignments shall be specifically labelled with a statement on this intended use.
205 NOTE: Attention shall be given in the formulation of the legal text to the language in which the labelling statements have to be included.

134
The statement of conformity of the consignment shall include a section with the
statement: "INTENDED EXCLUSIVELY FOR THE MANUFACTURE OF PLASTIC PRODUCTS."
waste plastic consignments that stem from multi-material collection systems shall bear a
label indicating the multi-material origin.
A multi-material collection system is a system for deliberate collection of two or more recyclable materials together, e.g. plastic, metal, paper and glass. Normally, materials are later sorted into mono-material streams at a dedicated sorting plant. Examples of widespread multi-material systems are separate packaging collection systems, and comingled collection systems.
The statement of conformity of a consignment that stems from a multi-material (e.g.
comingled) collection system shall include a section with the statement: "MULTI-MATERIAL ORIGIN".
Question 33: Are there any other criteria on provision of information of plastic waste that becomes EoW that in your view should be included?
3.6 Requirements on quality assurance procedures (quality management)
Quality assurance (QA) is an element of end-of-waste criteria of importance because it is needed to establish confidence in the end-of-waste status. The technical working groups of other EoW materials have expressed very strong support for making quality assurance requirements part of the end-of-waste criteria. In the case of waste plastic, this seems not a foreign concept, as many (if not most) plastic waste reprocessors and converters follow already QA procedures of both input and output of their plants. Quality assurance is also encouraged in current related EN standards, e.g. Chapter 5 in EN 15342, EN 15344, EN 15345, EN 15346, EN 15347, and EN 15348, albeit in a very generic manner. The acceptance of input materials, the required processing and the assessment of compliance with waste plastic requirements shall have been carried out according to good industrial practice regarding quality control procedures. In this context, quality assurance is needed to create confidence in the quality control on the waste plastic undertaken by its owner, and reliability on the end-of-waste criteria that distinguish consignments meeting EoW criteria from consignments that have not applied for or do not meet EoW criteria. The owner of the material applying the end-of-waste status will have to have implemented and run a quality assurance system to be able to demonstrate compliance with all the end-of-waste criteria, and use this as documentation when the material is shipped.

135
In the currently proposed structure of criteria, quantitative limits for EoW criteria are only suggested on the non-plastic components content. Should the finally adopted definition for the non-plastic components or contaminant content be aligned with any of the methods for measurement presented in CEN standards, the EoW Regulation could make explicit reference to these. However, should it not fit with standardised testing methods, a generic procedure for compliance, as simple as possible, would be made, e.g. through sampling and analysis using accessible equipment. Both in the qualitative and quantitative EoW criteria that refer to procedures and process controls, it is considered essential that there is a quality management system in place which explicitly covers the key areas of operation where compliance with end-of-waste criteria has to be demonstrated. One of the possible options to demonstrate compliance is having implemented and run an internationally recognised and externally verified quality management system such as ISO 9001, or equivalent. External verification is a compulsory element of these, and should assess if the quality management system is effective and suitable for the purpose of demonstrating compliance with the end-of-waste criteria. A suitable quality management system for waste plastic is expected to include: acceptance of input materials; monitoring of processes to ensure they are effective at all times; procedures for monitoring product quality (including sampling and analysis) that are
adjusted to the process and product specifics according to good practice; actively soliciting feedback from customers in order to confirm compliance with product
quality; record keeping of main quality control parameters; measures for review and improvement of the quality management system; training of staff.
For the competent waste authority, it must be able to commission an independent second party audit of the implemented quality management system to satisfy itself that the system is suitable for the purpose of demonstrating compliance with end-of-waste criteria. In respect of the frequency of monitoring, the appropriate frequency for each parameter should be established by consideration of the following factors: the pattern of variability, e.g. as shown by historical results; the inherent risk of variability in the quality of waste used as input to the recovery
operation and any subsequent processing; the inherent precision of the method used to monitor the parameter; and the proximity of actual results to the limit of compliance with the relevant end-of-waste
condition. Frequency of monitoring includes both the number of times a parameter is monitored over any given time period and the duration of each monitoring event so that it is a representative sample of the total. In the absence of historical results for any relevant parameter, it is good monitoring practice to carry out an intensive monitoring campaign over a short period (e.g. a

136
month or a few months) in order to characterise the material stream and provide a basis for determining an appropriate longer term monitoring frequency. The result of the monitoring frequency determination should provide a stated statistical confidence (often 95% confidence level is recommended as a minimum) in the ultimate set of monitoring results. The process of determining monitoring frequencies should be documented as part of the overall quality assurance scheme and as such should be available for auditing. The detail on the verification, auditing or inspection of the quality assurance system can follow different national approaches. The Commission adopted a reference document in July 2003 entitled "General Principles of Monitoring" which was developed under the provisions of the IPPC Directive but which remains a relevant reference for the determination of appropriate monitoring frequencies in this respect. It is available to download from the web site at: http://eippcb.jrc.es/reference/_download.cfm?technical working group=mon&file=mon_bref_0703.pdf The Bureau of International Recycling (BIR, 2011) has recently issued the guidance document "Tools for quality management for an ISO compliant Quality Management System that includes End-of-Waste procedures". It is available to download from the web site at: http://www.bir.org/assets/Documents/Public/BIR-Tools-for-Quality-Management-EN.pdf Similar sectoral recommendation guides have been issued for other recyclable chains, e.g. paper, or metals. These documents are to an extent meant to improve the mutual understanding between producers and buyers of waste plastic, and the general conditions of their contracts. These recommendations include additional elements not mentioned above such as: Special quality specifications besides reference to grades (e.g. ISRI) should be agreed
between buyer and supplier Reciprocity in communication of quality results is recommended between buyer and
supplier Quality controllers should be independent from the commercial department. Conditions of reject and limits of ownership should be agreed between buyer and supplier
Most elements of the mentioned guidelines are not included in the end-of-waste criteria. The reason is that while these elements are useful in transactions, they are to be applied under equal conditions to consignments of waste or of end-of-waste. Question 34: Is there any widely known guideline document addressing quality assurance in the plastic chain? The requirements on quality management could be:
137
138
QUALITY MANAGEMENT206
1. The producer shall implement a quality management system suitable to demonstrate compliance with the EoW criteria.
2. The quality management system shall include a set of documented procedures concerning each of the following aspects:
(a) monitoring of the quality of waste plastic resulting from the recovery operation (including sampling and analysis);
(b) monitoring of the treatment processes and techniques;
(c) acceptance control of waste used as input for the recovery operation;
(d) feedback from customers concerning the product quality;
(e) record keeping of the results of monitoring conducted under points (a) to (d);
(f) review and improvement of the quality management system;
(g) training of staff.
The quality management system shall also prescribe the specific monitoring requirements set out for each criterion.
3. Where any of the treatments is carried out by a prior holder, the producer shall ensure that the supplier implements a quality management system which complies with these quality management requirements.
4. The importer shall require his suppliers to implement a quality management system which complies with these quality management requirements.
5. A conformity assessment body as defined in Regulation (EC) No 765/2008 or an environmental verifier as defined in Regulation (EC) No 1221/2009 shall verify that the quality management system complies with these quality management requirements.
6. The verification should be renewed in the event of any change at least on a three-yearly basis.
7. The producer shall give competent authorities access to the quality management system upon request.
206 Notes: It could be discussed whether the time period of record-keeping (point 2.e) should be consistent with the auditing intervals (point 6 under Quality management) and not be shorter than the suggested audit intervals.
139
Question 35: Are there any other criteria on quality management of plastic waste that becomes EoW that in your view should be included?
3.7 Application of end-of-waste criteria For the application of end-of-waste criteria laid out above it is understood that a consignment of waste plastic ceases to be waste when the producer of the waste plastic certifies that all of the end-of-waste criteria have been met. It is proposed to formulate the restriction of the intended use to plastic production as a legal condition in the enacting provisions of a Regulation. It is understood that waste plastic that has ceased to be waste can become waste again if it is discarded and not used for the intended purpose, and therefore fall again under waste law. This interpretation does not need be specifically stated in the EoW criteria, as it applies by default. It is proposed that the application to EoW from a producer or importer refers to a statement of conformity, which the producer or the importer shall issue for each consignment of waste plastic, see draft form below. The producer or the importer shall transmit the statement of conformity to the next holder of the consignment. They shall retain a copy of the statement of conformity for at least one year after its date of issue and shall make it available to competent authorities upon request. The statement of conformity may be issued as an electronic document. Statement of Conformity with the end-of-waste criteria 1. Producer/importer of the waste plastic:
Name:
Address
Contact person
Telephone.:
For other EoW materials, some experts have proposed the possibility for making an audit on the request of a downstream user should be included.

140
Fax:
E-mail:
2. a) The name or code of the waste plastic category in accordance with an industry specification or standard:
b) The main technical provisions of the industry specification or standard, including compliance with EoW product quality requirements for non-plastic components, in percentage points of air dry weight.
c) Origin of the material (tick where appropriate) c.1) MULTI-MATERIAL ORIGIN c.2) MONO-MATERIAL ORIGIN
3. Quantity of the consignment in kg.
4. The waste plastic consignment complies with the industry specification or standard referred to in point 2.
5. This consignment meets the criteria referred to in this Regulation 6. The producer of the waste plastic applies a quality management system complying with
the requirements of this Regulation, and which has been verified by an accredited verifier or, where waste plastic which has ceased to be waste is imported into the customs territory of the Union, by an independent verifier
7. THE MATERIAL IN THIS CONSIGNMENT IS INTENDED EXCLUSIVELY FOR THE MANUFACTURE OF PLASTIC PRODUCTS.
8. Declaration of the producer of the waste plastic: I certify that the above information is complete and correct and to my best knowledge: Name: Date: Signature:
Note1: Items 2(a), 2(b), 2(c) and 4 are a highlight of key information issues already required under item 5, which refers to quality criteria no. 1.1. and 1.2, in which these items are included. They are a reiteration, but for other EoW materials, most experts have supported such reiteration in the DoC. Note 2: In other EoW materials, some experts have requested in the formulation of similar previous EoW criteria that the terms “multi-material origin” and “mono-material origin” under p.2(c) are explicitly defined in the statement of conformity, as they see the statement will have a life somehow independent from the Regulation, which would likely include these definitions in the recitals. The definitions proposed are the following: Multi-material origin means that waste plastic originates from a collection system for
deliberate collection of two or more recyclable materials together, e.g. plastic, metal, paper and glass. Materials are later sorted into mono-material streams at a dedicated sorting plant.

141
Mono-material origin means that waste plastic originates from a collection system designed for the collection separately of only one recyclable material, e.g. plastic, metal, paper or glass
Note 3: In similar formulations for other EoW materials, some experts suggest that Point 2(b) bears a clarification note where it states that it will not be possible to state the content of non-plastic components for every consignment of waste plastic. The Quality Management Systems and risk-based monitoring will provide a level of confidence that the consignment is below the agreed % threshold, but will not provide an actual measurement for every consignment. The statement of conformity would in that case clarify that the results of the risk-based monitoring demonstrate compliance with the agreed % threshold on non-plastic components. This has not been included in the current proposal, as (1) compliance with the limits is required in all cases, and (2) the self-monitoring requirements include the essential demands to sampling. Question 36: Are there any elements regarding the application of the EoW criteria of plastic waste that in your view should be included?


143
4 DESCRIPTION OF IMPACTS The introduction of end-of-waste criteria is expected to support recycling markets by creating legal certainty and a level playing field, as well as removing unnecessary administrative burden. This section is currently only in a preliminary sketch form, as the impacts will depend heavily on the final shape of the criteria. The final version of this section will outline key impacts on the environment, on markets, and on existing legislation, of the implementation of end-of-waste criteria. The description of impacts should likely include the following items:
4.1 Environmental and health impacts Air emissions, odours, dust, noise, fire risks, health impacts Risks related to transport and storage Impacts outside the EU
4.2 Market impacts The following potential economic and market impacts may be expected: Avoidance of costs related to shipment of waste; Avoidance of costs of handling the waste plastic in terms of permits and licenses; Costs of additional sorting and quality control of waste plastic; Coexistence of waste and non-waste markets, and non-plastic making markets. Impacts on MS with singular collection systems for waste plastics; Long-term availability and strategy of the European plastic industry; Price adjustments; Prospective scenario – additional EoW criteria on fuels?
4.3 Legislative impact The most important impacts related to legislation are, apart from the release from any obligation under waste legislation (e.g. Waste Shipments Regulation), the introduction of product legislation, most notably: VAT REACH by-product definitions.
From the perspective of both companies and authorities, one of the elements of concern besides compliance is the possible economic impacts of implementation of new legislation. Question 37: The listing of impacts outlined above presents the issues that will need to be analysed. Please contribute from your expertise or references that you know of to the description of these impacts for waste plastic: 1) Environmental and health aspects
144
2) Economic/Market aspects 3) Legislative aspects
145
5 REFERENCES ACC(2011) American chemistry council, 2011. www.americanchemistry.com ACRR (2004) Association of Cities and Regions for Recycling, 2004. Good Practices Guide On Waste Plastics Recycling. A Guide By And For Local And Regional Authorities; Association of Cities and Regions for Recycling BIO IS (2010)Study on recyclable waste plastic in the context of the development of end-of-waste criteria for the EU Waste Framework Directive. Final report, June 2010. BIR (2006). Global overview. Bureau of International Recycling (BIR), Brussels BIR (2011). Tools for quality management – for an ISO compliant quality management system that includes "end of waste" procedures. Bureau of International Recycling (BIR), Brussels, 2011. http://www.bir.org/assets/Documents/Public/BIR-Tools-for-Quality-Management-EN.pdf Business Week (1975) "The Office of the Future". Business Week (2387): pp 48–70, 30 June 1975, http://www.businessweek.com/technology/content/may2008/tc20080526_547942.htm DEFRA (2003). "Key Facts About: Waste & Recycling", UK Department of Environment, Food and Rural Affairs, http://www.defra.gov.uk/environment/statistics/waste/kf/wrkf01.htm ECHA (2010) Guidance on waste and recovered substances. Draft Version 3.2. European Chemicals Agency. Helsinki, 2010. EUPR, 2009. Plastics Recycling in Europe - Achievements & Threats. Compelling Facts About Plastic: www.plasticsrecyclers.eu/uploads/media/eupr/Compelling/Comp_Facts_Press_Conference_EuPR.pdf (Original data sourced from Eurostat database. This data is based on the trade of raw plastic waste, in accordance with Article 1(a) or the WFD) INFU/Prognos (2007). "Study of Waste Streams and Secondary Materials in the EU", Report to IPTS, JRC, European Commission, Seville, November 2007. IPTS (2007) “Assessment of the Environmental Advantages and Disadvantages of polymer recovery processes” EUR report 22939 EN. IPTS (2008). "End-of-waste Criteria Final Report", European Commission, Joint Research Centre, Institute for Prospective Technological Studies, http://susproc.jrc.ec.europa.eu/documents/Endofwastecriteriafinal.pdf IPTS (2009). "Study on the Selection of Waste Streams for End-of-waste Assessment – Final Report", European Commission, Joint Research Centre, Institute for Prospective Technological Studies, http://susproc.jrc.ec.europa.eu/documents/SelectionofwastestreamsforEoW-FinalReport13_02_2009.pdf ISRI (2011) www.isri.org/specs , last accessed November 2011 Plastics Europe et al. (2011). Plastics, the facts 2011. An analysis of eruropean plastics production, demand and recovery for 2010. EuPC, EuPR, EPRO, Plastics Europe, Belgium.

146
Recycle Now (2009). "Can it be recycled?". http://www.recyclenow.com/what_can_i_do_today/can_it_be_recycled/index.html WFD (2008). "Directive 2008/98/EC of the European Parliament and of the Council of 19 November 2008 on waste and repealing certain Directives", Official Journal of the European Union, 22 November 2008. WRAP(2006a) UK Plastic waste – A review of supplies for recycling, global market demand, future trends and associated risks WRAP (2006). "Environmental Benefits of Recycling – An International Review of Life Cycle Comparisons for Key Materials in the UK Recycling Sector", Waste & Resources Action Programme, UK. http://www.wrap.org.uk/downloads/Recycling_LCA_Report_Sept_2006_-_Final.43591ba0.2838.pdf WRAP, 2008, International Trade in Recovered Paper and Plastics: International Regulations and Commercial Practice . Waste & Resources Action Programme, UK. WRAP (2008a) Kerbside recycling: indicative costs and performance. Waste & Resources Action Programme, UK. WRAP (2009) MRF Output Material Quality Thresholds. Final Report. A report on materials quality standards, quality measurement techniques and their implementation by UK MRFs and materials reprocessors. Project code: MRF010, November 2009. WRAP (2009b) MRF quality assessment study. Final report. WRAP. Project code: MRF011, November 2009 WRc(2003) REFUSE DERIVED FUEL, CURRENT PRACTICE AND PERSPECTIVES (B4-3040/2000/306517/MAR/E3). WRc Swindon for the European Commission, DGEnv., 2003.
147
6 GLOSSARY Bio-waste: means biodegradable garden and park waste, food and kitchen waste from households, restaurants, caterers and retail premises and comparable waste from food processing plants. It includes beverages and foodstuffs. Chemical recycling: See feedstock recycling Collection: (Follows the definition of the Waste Framework Directive (2008/98/EC)): the gathering of waste, including the preliminary sorting and preliminary storage of waste for the purposes of transport to a waste treatment facility. NOTE: In this document, only collection for recycling is covered. Collection rate. Percentage of waste plastic collection compared to the total plastic consumption. Waste plastic collected in a country but exported for recycling in another country is included. Waste plastic imported from other countries and recycled in a country in question is not included. Comingled collection: is a multi-material collection system where two or more recyclable materials are deliberately collected together, for later sorting into individual recyclable materials at a dedicated sorting plant. The system can be for pick-up by waste trucks from door to door (also called "kerbside collection") or following a pick-up contract, or be based on regular emptying of containers or banks distributed in the collection areas, and where waste producers bring and deposit their waste (also called "bring systems"). The materials are normally paper, plastics, metals, and sometimes also glass. In some cases, the only allowed plastic, metal and glass is as packaging. Contraries: see non- plastic components. Consignment: means a batch of waste plastic for which delivery from a producer to another holder has been agreed; one consignment might be contained in several transport units, such as containers. Contaminant, see also impurity: a substance or compound present in waste plastic, together with a targeted waste plastic type, but the presence of which is undesired. It can be a not- plastic component or a non-targeted plastic type. Conversion: plastic conversion is the transformation, of raw plastic materials in granular or powder form by application of processes involving pressure, heat and/or chemistry, into finished or semi-finished products for the industry and end-users. Some usual processes are extrusion, moulding, blowing, casting, callendering or laminating. Plastics converters are sometimes called "Processors". Disposal: (Follows the definition of the Waste Framework Directive (2008/98/EC)): any operation which is not recovery even where the operation has as a secondary consequence the reclamation of substances or energy. Annex I of the Directive sets out a non-exhaustive list of disposal operations.
148
Down-cycling: Also known as down-grading, this refers to the process of converting waste materials or useless products into new materials or products of lesser quality and reduced functionality (also referred to as ‘open-loop’ recycling) Down-grading: see down-cycling Dry sorting: Sorting of waste plastic not based on the use of water. It is used in the context of separation of non- plastic components, referring to the separation waste items not originally part of plastic products, or of products which one wishes to conduct to a separate stream. Empty packaging: packaging is empty if - under normal and foreseeable circumstances - all product residues that can be removed by the emptier have been removed using practices commonly employed for that type of packaging. A non-exhaustive list of common practices includes: removing an inner liner; pouring; pumping; aspirating; shaking; scraping; squeezing ; rinsing; wiping-out. See e.g. EN 13430:2003 Energy recovery: The use of waste principally as a fuel or other means to generate energy Feedstock recycling: Also known as chemical recycling, feedstock recycling refers to techniques used to break down plastic polymers into their constituent monomers, which in turn can be used again in refineries, or petrochemical and chemical production. Health Care waste: wastes from human or animal health care and/or related research (except kitchen and restaurant wastes not arising from immediate health care), including all its subcategories as detailed in code 18 of Commission Decision 2000/352/EC of 3 May 2000 (List of Wastes). Holder: means the natural or legal person who is in possession of waste plastic. Importer: means any natural or legal person established within the Union who introduces waste plastic which has ceased to be waste into the customs territory of the Union. Impurity, see also contaminant: a substance or compound present in waste plastic, together with a targeted waste plastic type, but the presence of which is undesired. It can be a not- plastic component or a non-targeted plastic type. Material recovery: Recovery is a broader term that includes any useful use of a waste, in replacement to another material. For example, a typical form of material recovery (as opposed to energy recovery) which should not be considered as recycling, is backfilling, where waste is used to refill excavated areas for engineering purposes. Mechanical Recycling: for plastics, refers to processes which involve the reprocessing by melting, shredding or granulation. Moisture: means water diffused as vapour or condensed on or in waste plastic. Mono-material collection (system): is a system for the deliberate collection of a single recyclable material, such as paper, plastics, metals, or glass.

149
Mono-material origin means that waste plastic originates from a collection system designed for the collection separately of only one recyclable material, e.g. plastic, metal, paper or glass. Municipal solid waste. (MSW) Means non-sorted, mixed waste from households and commerce, collected together. This waste flow excludes the flows of recyclables collected and kept separately, be it one-material flows or multi-material (comingled) flows. Mt: Million tonnes. 1 tonne = 1000 kg (International System of Units) Multi-material collection (system): a system for deliberate collection of two or more recyclable materials together. Normally, Materials are later sorted into mono-material streams at a dedicated sorting plant. Examples of widespread multi-material systems are separate packaging collection systems, and comingled collection systems. The materials collected are normally paper, plastics, metals, and sometimes also glass. In some cases, the only allowed forms of plastic, metal and glass are as packaging. Multi-material origin means that waste plastic originates from a collection system designed for the deliberate collection of two or more recyclable materials together, e.g. plastic, metal, paper and glass. Normally, Materials are later sorted into mono-material streams at a dedicated sorting plant. Examples of multi-material systems are separate packaging collection, and comingled collection. Non-plastic components: also known as contraries and sometimes impurities, are materials different from plastic, which are present in waste plastic. Examples of non- plastic components are metals, paper, glass, textiles, earth, sand, dust, wax, bitumen, ceramics, burnt or fire damaged materials, textiles, leather, rubber, and wood. In addition to this definition, there is a list of materials to which there is zero tolerance e.g. health care waste, hazardous waste, foodstuffs, toxic compounds, or used personal hygiene products. Non-targeted plastic: A polymer or resin present in waste plastic, but the presence of which is detrimental to the direct use of the waste plastic in the production of plastic substances or objects by re-melting in plastic manufacturing facilities. Examples of non- non-targeted plastics in the manufacturing of PE recyclates are PET and PVC. Plastic: generic term referring to a polymer of high molecular mass. A polymer is a chain of several thousand of repeating molecular units of monomers. The monomers of plastic are either natural or synthetic organic compounds. Plastic Detrimental to Production: plastic types not matching the quality definition of a batch, bale or lot of plastic (e.g. PVC in a PP scrap load). Plastic which has been recovered or treated in such a way that it is, for a basic or standard level of equipment, unsuitable as raw material for the manufacture of plastic, or is actually damaging, or whose presence makes the whole consignment of waste plastic unusable. Plastic Consumption: Plastic that is delivered (purchased) and used within a list of countries, plus imports from countries outside the list of countries. Plastic production: plastic that is manufactured by a list of countries. Some of it is unsold, some of it is sold in the market within the list of countries, and some of it is exported.

150
Plastic manufacture: see plastic production. Pre-consumer waste: Also known as post-industrial waste, or industrial scrap, this refers to waste generated during converting or manufacturing processes. Polymer: is a chain of several thousand of repeating molecular units of monomers. The monomers of plastic are either natural or synthetic large molecular mass organic compounds. Post-consumer waste: waste products generated by a business or consumer that have served their intended end use, not involving the production of another product. Primary raw material: material which has never been processed into any form of end use product Producer: means the holder who transfers waste plastic to another holder for the first time as waste plastic which has ceased to be waste. Prohibited materials: Any materials in waste plastic which represent a risk for health, safety and environment, such as health care waste, used products of personal hygiene, hazardous waste, organic waste including foodstuffs, bitumen, toxic powders and the like. Qualified staff: means staff which is qualified by experience or training to monitor and assess the properties of waste plastic . RDF: Refuse-derived fuel. Generic term that defines a fuel obtained from waste. Normally it refers to a fraction of MSW essentially composed of plastic, paper, textiles and wood, and obtained by removal of readily biodegradable material and moisture, glass, and metals. Recovery: (Follows the definition of the Waste Framework Directive (2008/98/EC)): any operation the principal result of which is waste serving a useful purpose by replacing other materials which would otherwise have been used to fulfil a particular function, or waste being prepared to fulfil that function, in the plant or in the wider economy. Annex II of the Directive sets out a non-exhaustive list of recovery operations. Recovery Rate: See collection rate above Recycled plastic: A broad term, generally applied to any sort of plastic product containing to some degree waste plastic polymer, and not only virgin polymer. plastic can currently be labelled recycled if even only a small percentage of it is made from waste plastic. The term does not currently imply or guarantee that it is manufactured with any additional environmental consideration. Case-by case labelling will indicate the type and percentage of recycled plastic content. Recyclate: recyclable material resulting from the processing of waste (cullet, scrap, pellets, granules, flakes, etc). Recycling: (Follows the definition of the Waste Framework Directive (2008/98/EC)): any recovery operation by which waste materials are reprocessed into products, materials or substances whether for the original or other purposes. It includes the reprocessing of organic

151
material but does not include energy recovery and the reprocessing into materials that are to be used as fuels or for backfilling operations. Recycling Rate: Percentage of waste plastic utilisation (plastic which is reused for making new plastic) compared to the total plastic consumption. Reprocessing plant: broad term used to define any of the intermediate actors in the waste plastic chain between the end-users and the plastic producers. It encompasses companies or institutions undertaking activities such as collection, sorting, grading, classification, cleaning, baling, trading, storing, or transporting. The inlet material to these plants is waste or waste plastic. The outlet is waste plastic that may either be waste or non-waste. Reprocessor: operator of a reprocessing plant (see above). Separate collection: (Follows the definition of the Waste Framework Directive (2008/98/EC)): the collection where a waste stream is kept separately by type and nature so as to facilitate a specific treatment. Targeted plastic: A polymer or resin present in waste plastic, which is collected and treated for recycling, i.e. the direct use of the waste plastic in the production of plastic substances or objects by re-melting in plastic manufacturing facilities. Thermoplastic polymer: a polymer that can be repeatedly made soft through heating and that hardens when cooled. Modern thermoplastic polymers soften anywhere between 65°C and 200°C. Thermoplastics are therefore recyclable and include polyethylene, polystyrene, polypropylene. Thermoset polymer: a polymer that softens when initially heated, but hardens permanently once it has cooled. It is not re-mouldable. Thermosetting materials are made of long-chain polymers that cross-link with each other after they have been heated, rendering the substance permanently hard. They include epoxy resins and polycarbonate. Treatment: (Follows the definition of the Waste Framework Directive (2008/98/EC)): recovery or disposal operations, including preparation prior to recovery or disposal. Unusable or Unwanted Materials, also termed "Outthrows". A term encompassing both non- plastic components and plastic and cardboard detrimental to production of plastic. In general, purchaser and supplier agree to a certain proportion of unusable materials. (Waste plastic) Utilisation: Use of waste plastic as raw material at plastic producers. Utilisation Rate: Percentage of waste plastic utilisation (plastic which is reused for making new plastic) compared to total plastic production (by all means: using virgin plus waste fibres). Visual inspection: means inspection of consignments using either or all human senses such as vision, touch and smell and any non-specialised equipment. Visual inspection shall be carried out in such a way that all representative parts of a consignment are covered. This may often best be achieved in the delivery area during loading or unloading and before packing. It
152
may involve manual manipulations such as the opening of containers, other sensorial controls (feel, smell) or the use of appropriate portable sensors. Waste plastic: Refers to waste which the holder discards, intends to discard or is required to discard, and consists mainly of plastic polymers and additives such as softeners, hardeners, flame retardants, or UV protection agents. WFD: Waste Framework Directive (DIRECTIVE 2008/98/EC OF THE EUROPEAN PARLIAMENT AND OF THE COUNCIL of 19 November 2008 on waste and repealing certain Directives).

153
7 ACRONYMS
ABS Acrylonitrile Butadiene Styrene amino Any thermosetting synthetic resin formed by
copolymerisation of amines or amides with aldehydes.
ANAIP Asociacion Nacional de Industrias del Plastico A-PET Amorphous Polyethylene Therephthalate APME Association of plastics Manufacturers in Europe
(now PlasticsEurope) ASA Acrylonitrile Styrene Acrylate ASR Automotive Shredder Residue B&C Building and Construction BFR Brominated Flame Retardant BPA Bisphenol A CEN European Committee for Standardisation C-PET Crystalline Polyethylene Therephthalate DEFRA Department for the Environment, Food and Rural
Affairs EEE Electrical and electronic equipment ELV End-of-Life Vehicles EoL End-of-Life EoW End-of-waste EP Epoxy (resin) EPBP European PET Bottle Platform EPRO European Association of Plastics Recycling and
Recovery Organisations EPS Expanded Polystyrene ETP Engineering Thermo-Plastics EuPC European Plastics Converters FEDEREC Fédération des Entreprises du Recyclage (France) FR Flame Retardant HDPE High Density Polyethylene HIPS High Impact Polystyrene ISO International Standardisation Organisation kt Thousands of tonnes (kilotonne) LCA Life Cycle Assessment LDPE Low Density Polyethylene LLDPE Linear Low Density Polyethylene MR Mechanical Recycling MRF Material Recovery Facility MS Member State(s) of the European Union MSW Municipal Solid Waste Mt A million tonnes (Megatonne) NIR Near Infrared OECD Organisation for Economic Co-operation and
Development OPA Oriented Polyamide OPP Oriented Polypropylene

154
OPS Oriented Polystyrene pa. Per annum PA Polyamide PBB Polybrominated Biphenyls PBDD/F Polybrominated dibenzodioxins and dibenzofurans PBDE Polybrominated Diphenyl Ethers PBT Polybutylene Terephtalate PC Polycarbonate PCB Polychlorinated Biphenyl PE Polyethylene PEN Polyethylene Naphthalate PET Polyethylene Terephthalate PMMA Polymethyl Methacrylate POM Poly-Oxy-Methylene POPs Persistent Organic Pollutants PP Polypropylene PPE Polyphenylene Ether PPO Polyphenylene Oxide PS Polystyrene PU/PUR Polyurethane PVC Polyvinyl Chloride PVDC Polyvinylidene Chloride REACH Registration, Evaluation, Authorisation and
restriction of Chemicals RoHS Restriction of Hazardous Substances SAN Styrene Acrylonitrile Copolymer SMA Styrene Maleic Anhydride SB Styrene-Butadiene UP Unsaturated Polyester WEEE Waste Electrical and Electronic Equipment WFD Waste Framework Directive WRAP Waste & Resources Action Programme XPS Extruded Poly-Styrene
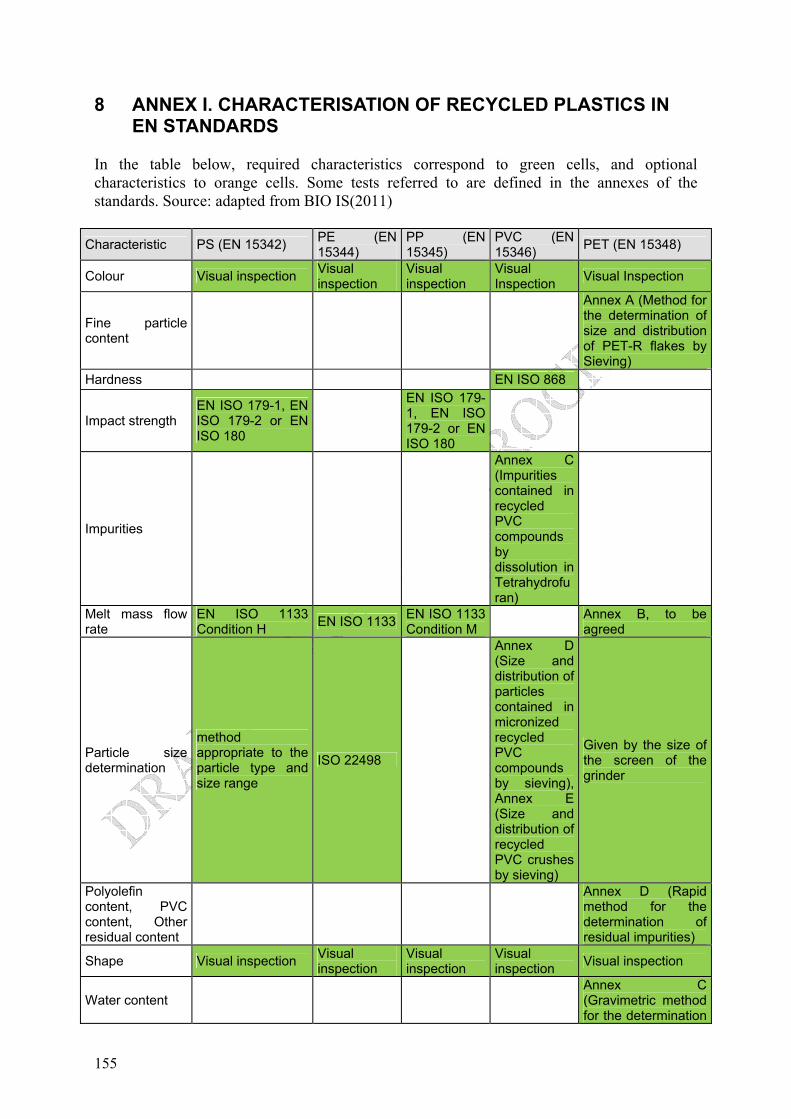
155
8 ANNEX I. CHARACTERISATION OF RECYCLED PLASTICS IN EN STANDARDS
In the table below, required characteristics correspond to green cells, and optional characteristics to orange cells. Some tests referred to are defined in the annexes of the standards. Source: adapted from BIO IS(2011)
Characteristic PS (EN 15342) PE (EN 15344)
PP (EN 15345)
PVC (EN 15346) PET (EN 15348)
Colour Visual inspection Visual inspection
Visual inspection
Visual Inspection Visual Inspection
Fine particle content
Annex A (Method for the determination of size and distribution of PET-R flakes by Sieving)
Hardness EN ISO 868
Impact strength EN ISO 179-1, EN ISO 179-2 or EN ISO 180
EN ISO 179-1, EN ISO 179-2 or EN ISO 180
Impurities
Annex C (Impurities contained in recycled PVC compounds by dissolution in Tetrahydrofuran)
Melt mass flow rate
EN ISO 1133 Condition H EN ISO 1133 EN ISO 1133
Condition M Annex B, to be agreed
Particle size determination
method appropriate to the particle type and size range
ISO 22498
Annex D (Size and distribution of particles contained in micronized recycled PVC compounds by sieving), Annex E (Size and distribution of recycled PVC crushes by sieving)
Given by the size of the screen of the grinder
Polyolefin content, PVC content, Other residual content
Annex D (Rapid method for the determination of residual impurities)
Shape Visual inspection Visual inspection
Visual inspection
Visual inspection Visual inspection
Water content Annex C (Gravimetric method for the determination

156
Characteristic PS (EN 15342) PE (EN 15344)
PP (EN 15345)
PVC (EN 15346) PET (EN 15348)
of residual humidity (water content))
Bulk density Annex A Annex B Annex A Annex B
Density EN ISO 1183-1, Method A
EN ISO 1183-1, Method A or B
EN ISO 1183-1 Method A
EN ISO 1183-1 Method A
Vicat softening temperature
EN ISO 306 Method A EN ISO 306
Method B50
Alaklinity
Annex E (Potentiometric method for the determination of the residual alkalinity)
Ash content EN ISO 3451-1 EN ISO 3451-1
EN ISO 3451-1
EN ISO 3451-5 Method A
Colour Colourimeter
Contaminants (number)
Annex A, Method A, B or C
Dry flow rate EN ISO 6186
Extraneous polymers
Thermal/Infra-red analyses
Filterability
Annex F (Method for the determination of infusible impurities by filtration)
Filtration level Mesh size Mesh size Mesh Size Fitness of processing of PVC recyclates — by calendering — by extrusion
— Annex F — Annex G
Flexural modulus EN ISO 178 EN ISO 178 Intrinsic viscosity (IV) ISO 1628-5
Izod impact strength or Charpy impact strength
EN ISO 180, EN ISO 179-1
Original application Supplier to declare
Presence of modifying additives
Supplier to declare (e.g. fire retardants, fillers and reinforcements)
Recycled content EN 15343 Residual Humidity EN 12099 EN 12099 EN 12099
Tensile stress at yield
EN ISO 527-1, EN ISO 527-2
EN ISO 527-1, EN ISO
EN ISO 527-1, EN ISO
EN ISO 527-1, EN ISO

157
Characteristic PS (EN 15342) PE (EN 15344)
PP (EN 15345)
PVC (EN 15346) PET (EN 15348)
527-2 527-2 527-2
Tensile strain at break
EN ISO 527-1, EN ISO 527-2
EN ISO 527-1, EN ISO 527-2
EN ISO 527-1, EN ISO 527-2
EN ISO 527-1, EN ISO 527-2
Thermal stability
ISO 182-1, ISO 182-2, ISO 182-3, ISO 182-4
Volatile Content Weight loss at 200 °C EN 12099 or
other ISO 1269

158
9 ANNEX II. ADDITIONAL CONSIDERATIONS ON PRODUCT QUALITY CRITERIA
Other considerations related to product quality received by experts and concluded by other material's EoW discussions are presented below. They can be useful input for the further steps of fine-tuning the criteria. Their suitability to the EoW criteria on waste plastics will be discussed with the Technical Working Group: If standardised grades exist and are internationally accepted (e.g. CEN, ISRI), it is
advisable to refer to such standards in the definition of quality. Non-plastic components shall preferably be specified and limited, as they directly relate
to the commercial value of the material, and potential environmental risks. However, not all non-plastic components are the same: some of them can be separated in a dry phase, some need washing, and some are embedded in the plastic matrix, and will only be removed by filtration in the melted phase. An additional complication relates to non-plastic materials present in the waste plastic matrix but deliberately sought for, such as glassfiber, or wood fibres, for the production of composite plastic/glass/wood materials. Should the non-plastic content be limited and include materials present in the plastic matrix, plastics with such materials in high quantities would have two alternatives: One is to remain out of the waste regime as by-products (e.g. automobile pieces of PA-GF from fault manufacturing batches, which are converted to regrind and sent back for the production of more such pieces). The other is that such materials remain waste.
The mixture of two end-of-waste waste plastic flows can only become an end-of-waste flow if a uniform non-plastic component content threshold (e.g. 1%) is agreed for all grades. In case of split of thresholds for different grades, this equation would not necessarily hold. If both original EoW flows are of the same grade, the mix of them would be EoW of that same grade.
Properties such as moisture that vary widely but are easy to remove, do not relate to an environmental concern, and are tolerated differently by different repressors and converters, in general do not need to be limited in EoW. Such properties can normally be dealt with through suppler/buyer specifications.
It is to be determined if EoW should or not include a maximum limit on the content of “non-targeted plastics” or “plastic detrimental to production”. Depending on the polymer type, the technology available, and the output from reprocessing/ conversion, different producers tolerate foreign plastics differently. If the presence of non-targeted plastics is accepted, the material has a value and an end use, and there is no significant health or environmental impact, this parameter may better be dealt with through suppler/buyer specifications. If the treatment of more than one polymer simultaneously is exceptional (e.g. polyolefins PP&PE), then the exclusion of “non-targeted plastics” can be the rule and part of EoW, and the existing exception(s) can be specifically addressed.
It is also to be determined whether the shape and size (bales/bulk, empty clean packaging, scrap, pellets, flakes, regranulates, profiles), of waste plastic are parameters of concern in relation to the fulfilment of the conditions of Art 6 of the WFD (e.g. if it provides a guarantee of cleanliness), and should be part of the quality criteria. If not, this parameter may better be dealt with through suppler/buyer specifications.
It is to be determined if EoW should or not refer to the age of waste plastic. Judging its presence in ISRI scrap specification circular (e.g. <1 or <6 months without UV protection) it seems it is a relevant quality parameter, which can affect the value of the material. It is to be discussed whether this parameter is in practice controlled, and if it may better be dealt with through suppler/buyer specifications.

159
Waste plastic must not present hazardous properties. By default, three options are possible to control the risks derived from hazardousness: (1) a direct criterion on the quality of the material, which shall not display any hazardous properties, (2) a criterion on the exclusion of the use of hazardous material as input, and (3) a criterion on the processing for the removal of hazardous material. Alternatives (2) and (3) have drawbacks as stand-alone alternatives. Alternative (2) is difficult to control by reprocessors and is currently often not controlled, because of the nature of waste plastic as originated from many different products, some of which may contain hazardous substances, or users, which accidentally may mix in the stream hazardous components (e.g. a battery). If taken, this alternative can not stand alone, because in the case an EoW consignment is judged hazardous upon control by the authorities, the reprocessor cannot be freed from responsibility by claiming that the input was controlled. The output, which is candidate to cease to be waste, has to be controlled too, and this is in line with visual inspection practices prior dispatch of consignments. Alternative (3) is not currently operational in reprocessing plants, which are designed to separate independent, foreign hazardous elements such as batteries, but some may currently be not prepared to avoid that plastic impregnated with solvents or toxic powders ends in their output. Option (1) requiring non-hazardousness of the output material, which is in all cases object of visual inspection, seems therefore necessary. In addition, the inclusion of a criterion on the input (option 2) is considered also necessary as a complement, in order to better tackle the risk of cases of dilution, i.e. hazardous elements are allowed into the reprocessing, but by dilution these are not detected in the output, which then can become EoW material. Some experts and MS have for other EoW materials pointed out the difficulty in detecting hazardousness (e.g. mineral oil aromatic hydrocarbons) with visual inspection. This is correct, but the alternative is including additional measurements, which by many is considered disproportionate given (a) the well established practice of recycling, where experienced and appropriately trained staff is able to detect most non-compliance circumstances, and (b) the fact that with the restriction of scope proposed, these substances will not be released to the environment directly, as in a reprocessing plant they will be collected in rejects, which are waste and have to be dealt with as such.
The material shall be free of visible chemical or biological contamination such as oil, solvents, paint, or biodegradable substances resulting in mould growth. Some of them may be detected by the presence of odour. This is a difficult issue, as some reprocessors and converters operate their plants without a washing step, i.e. with only dry cleaning, or a wet washing step which does not remove all of these residuals, some of which are absorbed to the plastic matrix. The mentioned residuals are thus part of the material entering the melting step, where some of it evaporates, some of it burns (and can be filtered out if sufficiently large in relation to the filter mesh size), and some of it remains in the plastic output. The presence of residual amounts of vegetable and mineral oils, solvents and detergents can indeed be detected in the end product (e.g. regranulate from MSW packaging input), so it would enter the wider definition of "visible". These elements are in very small concentrations, small enough to make the output non hazardous, and in most cases not leaching significantly, especially in the product-like storage conditions provided to this material. The presence in such small amounts has some but limited effect on the value of the material (normally 300-700 EUR/tonne), which is highly appreciated by the industry as substitute of virgin polymers.
Limit value of non-plastic components
160
The nature of non-plastic materials varies from grade to grade, with the source of the material playing the most important role. The most common non-plastic materials are paper, glass, and metals, but the list of materials found in trace amounts is long and includes also wood, textiles, earth, sand, dust, wax, bitumen, ceramics, rubber, or fabric. Wood and rubber are reported as being particularly detrimental in mechanical recycling. Such material can be separated by cleaning and washing, and has to be distinguished from additives bound to the polymer matrix during the manufacture of plastics. These structure fillers (glassfibre, wood) and additives are to be considered as part of plastic, and may be out of the scope of non-plastic components. Some of them can be separated by filtering in the fluid, melted phase, and some cannot. Some can be separated by dissolution of the polymer. Non-plastic component content is dealt with differently for different polymer recyclates, using different terminology, even within CEN standards: PE. The term "contaminant" is used in Annex A of CEN standard EN 15344:2007
(Plastics - Recycled Plastics - Characterisation of Polyethylene (PE) recyclates) to refer to "non melted particles and impurities", but this is measured as "number of contaminant pieces" trapped in a filter mesh, so it is not a gravimetric method.
PVC. In Annex C of CEN standard EN 15346:2007 (Plastics - Recycled Plastics -
Characterisation of poly(vinyl chloride) (PVC) recyclates), the determination of the amount of impurities in recycled PVC compounds is gravimetric, and is based on the dissolution of PVC in tetrahydrofuran (THF).
PET. For PET, Annexes D and F of CEN standard EN 15348:2007 (Plastics - Recycled
plastics - Characterization of poly(ethyleneterephthalate) (PET) recyclates) describe two types of "impurities", and two methods for its characterisation:
Annex D addresses the determination of impurities content in the flakes of PET-R of PVC, Polyolefins, glue, other polymers, and other impurities, by forced air circulation at 220 °C and a later separation by colour/appearance and gravimetry.
Annex F describes a method for the determination of "infusible impurities (such as Aluminium, paper, carbonized PVC, etc.)" by filtration of PET, measuring the increase of pressure observed during the extrusion of melted PET polymer through a filter, as it is a function of the quantity of solid particles present in the polymer.
PP,PS: no reference is made to impurities/contaminants in CEN standards EN 15342 and
EN 15345. Waste plastics: CEN standard EN 15347:2007 (Plastics - Recycled Plastics -
Characterisation of plastics wastes) is particularly vague on the requirements for non-plastic components, barely mentioning the percentage by weight if known of the "main polymer" and "other polymers present", and that "any additional information on the material will be useful" for additives, "contaminants", moisture, and 'volatiles.
If waste plastics before melting are eligible for EoW, the non-plastic component content in them is to be measured as dry air weight. Drying to dry air condition is undertaken customarily by plastic producers and reprocesses for sample measurement of moisture. Dry air condition can be ensured by e.g. residence at 105±5oC for 30 minutes in an oven, but can likewise be achieved by simple and affordable alternative procedures such as residence in a microwave for a few minutes.

161
The maximum content of non-plastic components allowable, yet considering the material ready for direct input to a producer, depends on the type of recycled plastic produced, and the end product in mind. Producers using high qualities will be less tolerant than producers that use mixed grades as main input. Some applications such as outdoor furniture tolerate a much more contaminated material than e.g film in waste bags. In the context of quantitative quality criteria, one of the key elements that will be investigated is the amount of waste plastic currently used in the EU for plastic making that would fulfil different non- plastic component limits in the range 0.1 -3%. The concept is illustrated in graphical form in Figure 9.1 below:
Non-plastic content percentage
20%
60%
100%
0.5% 1.0% 1.5% 2.0% 2.5%
Per
cent
age
of w
aste
pla
stic
fulfi
lling
the
EoW
non-
plas
tic c
ompo
nent
con
tent
thre
shol
d
RegranulesFlakes and shredded material
Homogeneous pre-consumer input (cut-offs, empty containers, faul batches)
Aggregates and pellets
3%
Figure 9.1. Fictive illustration of the percentage of waste plastic fulfilling the EoW non-plastic component content threshold, as a function of these thresholds.
The figure above has been prepared for the sole purpose of illustrating the concept. The values used are fictive at this stage. Many variables may play a role in moving these curves upwards, downwards or sidewards, including plastic grade, plastic collection systems, seasonal variations, etc., making a precise sketching of this curve difficult or even unfeasible. Several options of thresholds are possible: A single, cross-cutting value for any shape and polymer type Two-value, three-value or four-value sets, e.g. one for granules, one for pellets and/or aggregates, one for flakes and shredded material, and one for cleaned material preserving the original shape. This can also be a progressive threshold introduced through a mathematic formula, dependent on a given variable (e.g. average grain size). A value for each main polymer type, likely close to the 1-8 codes of the SPI resin identification coding system.

162
A single value has the advantages of ease of understanding, communicating, implementing and controlling. However, it is also acknowledged that a single value can hardly address the intrinsic differences of the streams, (e.g. shapes and sizes, polymer types). It therefore cannot deliver to all grades the same incentive to improvement of e.g. sorting, or address specifically the parameters that distinguish for each grade a product vs waste. The experience from other EoW materials is that most experts support simplicity, e.g. a single value for use in all grades and polymer types. Quantitative criteria are potentially the most burdensome in terms of monitoring costs. However, including such criteria relieves the inclusion of other alternative criteria, as it ensures that EoW waste plastic is essentially composed of plastic polymers and very little else. This information, together with knowledge of the existing collection and reprocessing systems in use in the plastic sector in the EU, ensures that the material is of adequate quality for use as direct input for recycled plastic making. A low content of non- plastic components limits the amount of non- plastic transported out of the EU, and limits the amount of rejects, which need treatment for recovery or disposal. The use of a quantitative criterion is in line with recent studies on the quality of output of MRFs (WRAP, 2009) and the use of this parameter as benchmark in waste plastic grading specifications such as ISRI and a number of CEN standards (15344, 15346, 15347, 15348:2007). Setting single threshold has benefits and limitations. On the negative side, it discriminates waste plastic containing e.g. an average content slightly over the threshold (e.g. t+0.05 %), as it is still a valuable raw material for plastic production. However, it is beneficial as conveying a simple and clear message that sets the benchmark of what is considered high quality, and a low risk for health or the environment. It has to be understood that what the key issue is the distance to the threshold. If a material is still waste, as a driver for improvement, and if it has ceased to be waste, as a mechanism to manage and reduce the frequency of sampling. The non- plastic component content has to be ensured for each consignment as part of a quality assurance programme, but this does not mean that each consignment has been tested. If the producer can ensure through a statistically sound sampling plan available to auditing that the average value of deliverables of the same grade and origin, including the confidence intervals, is below the threshold, this should be accepted. A risk-based sampling approach is thus suggested. Compared to random sampling, risk-based sampling can reduce both the sample size and the frequency of sampling in continuous survey plans, e.g. in consignments part of long-term delivery contracts. In the risk-based approach, information from previous surveys can reduce the sample size and frequency of sampling of the new surveys, while maintaining the overall level of confidence. Normally a confidence level of 95% is used, indicating that the probability that the mean value of the content of non- plastic components in a sample is below the legal limit is 95%, or conversely, that the probability of the mean value of the sample being above the threshold is 2.5%. This implies that the mean concentration of the whole consignment plus the confidence interval needs to be below the threshold. Usually, it is impractical to sample from the total consignment and a subset of it that can be considered representative will have to be defined as part of the quality assurance process. The scale of sampling needs to be chosen depending on the sales/dispatch structure of a
163
reprocessor. The scale should correspond to the minimum quantity of material below which variations are judged to be unimportant. The better the precision of the testing programme (the smaller the standard deviation and the narrower the confidence interval), the closer the mean concentrations may be allowed to be to the legal limit values. Once the confidence level is fixed, the two variables available for improving the behaviour of the material in relation to the threshold are (a) increasing the sample size (which is costly), or (b) reducing the standard deviation (which implies improving the homogeneity of the material and reducing the uncertainty about its content). The costs of a testing programme of waste plastic with very good quality (parameter values far from the limits) can therefore be held lower than for waste plastic with values that are closer to the limit. More statistics details on sampling plans are available in standard EN 16010:2009 (Plastics - Recycled plastics - Sampling procedures for testing plastics waste and recyclates). When a new reprocessing line or plant is licensed there is usually an initial phase of intensive testing to achieve a basic characterisation (for example one year) of the waste plastic generated. If this proves satisfactory, the further testing requirements are then usually reduced. Visual inspection will be required in all cases, regardless of the frequency of the quantitative control done in parallel. Recent conclusions of a study comparing visual vs. quantitative inspection of MFR output (WRAP, 2009) indicate that large discrepancies are observed between these two methods of inspection. Large discrepancies are also observed within the methods, especially in visual inspection (e.g. plastic producer vs. reprocessor of the same consignment). Visual inspection is thus to be regarded as a complement and never a full substitute of quantitative control

164
10 ANNEX III: NATIONAL CLASSIFICATION FOR RECOVERED PLASTICS IN FRANCE
CODE Plastics type
01 PET
01-2-10 Film, sheet – colour
01-2-11 Collected bottles – colour
01-2-12 Collected bottles – natural
01-2-13 Collected bottles – azure
01-2-15 Collected bottles – all colours
01-1-10 Film – colour
01-1-11 Film – natural
01-1-12 Fibers –natural
01-1-13 Mixed injection/thermoforming – colour
01-1-14 Bottles – colour
01-1-15 Bottles – natural
01-1-16 Preform – opaque colour
01-1-17 Preform – translucent colour
01-1-18 Preform – natural
01-1-19 Thermoforming – colour
01-1-20 Thermoforming – natural
01-1-21 Purging – all colours
02 HDPE
02-2-20 Injection and extrusion (pipes, crates, pallets, containers, etc.)
02-2-21 From selective collection
02-1-20 Films – mixed or printed colour
02-1-21 Films – natural
02-1-22 Extrusion/injection – colour
02-1-23 Extrusion/injection – natural
02-1-24 Rotational moulding – colour and natural
03 PVC
03-2-29 Bottles – from collection
03-2-30 Colour items (pipes, drainpipes, crates, profiles, plates)
03-1-30 Crystal flexible
03-1-31 Flexible expanded/non-expanded – colour
03-1-32 Thermoforming – colour
03-1-33 Thermoforming – crystal
CODE Plastics type
03-1-34 Woodwork with/without seal – colour
03-1-35 Woodwork with seal - white
03-1-36 Woodwork without seal - white
03-1-37 Mixed all colours (purging, pipes, plates)
03-1-38 Films – colour and printed
03-1-39 Films - crystal
04 LDPE
04-2-40 Mixed films (colour and natural, thick and thin)
04-2-41 Thick film cover – colour
04-2-42 Thick film cover – natural
04-2-43 Cling film – natural
04-2-44 Agriculture film
04-2-49 Construction site films
04-1-40 Films – all colour and/or printed
04-1-41 Films – natural
04-1-42 Injection/extrusion – colour
04-1-43 Injection/extrusion – natural
05 PP
05-2-50 Mixed films (bags, big-bags, cordage)
05-2-51 Mixed – colour and natural (plates, pipes, crates, bumpers, buckets, strips, jars)
05-1-50 Films – colour
05-1-51 Films – printed
05-1-52 Films – natural
05-1-53 PP/PE – white or non-talc
05-1-54 PP/PE colour
05-1-55 Non-woven - natural
05-1-56 Non-woven – white
05-1-57 Non-woven – colour
05-1-58 Extrusion and injection – colour
05-1-59 Extrusion and injection - natural
05-1-60 Expanded
06 PS
06-2-60 Injection and extrusion – colour (jars, hangers, inserts, reels)

165
CODE Plastics type
06-1-60 Expanded
06-1-61 Extrusion – natural and white
06-1-62 Extrusion – colour
06-1-63 Injection – colour
06-1-64 Injection – natural and white
07 Others
CODE Plastics type
08 ABS
08-2-80 Injection and extrusion – colour (dismantling)
08-1-80 Injection and extrusion – colour (AE or not)
08-1-81 Injection and extrusion – white (AE or not)
09 Technical plastics

166
11 ANNEX IV: ORIGINAL APPLICATION CATEGORIES USED FOR THE CLASSIFICATION IN PAS-103
General application category
Specific application category
A1 Any pre-use applications, unfilled, without caps and labels (> 100 mL and < 5 L capacity)
A2 Any pre-use applications, unfilled, without caps and labels (unspecified sizes) A3 Any post-use applications, excluding hazardous chemical and motor oil
bottles, with associated labels and caps (> 100 mL and < 5 L) A4 Any post-use applications, excluding hazardous chemical and motor oil
bottles, with associated labels and caps (unspecified size) A5 Any post-use applications, with associated caps and labels (> 100 mL and < 5
L capacity) A6 Any post-use applications, with associated caps and labels (unspecified sizes) A7 Any post-use application, excluding hazardous chemical and motor oil bottles,
no caps (> 100 mL and < 5 L) A8 Any post-use application, excluding hazardous chemical and motor oil bottles,
no caps (unspecified sizes) A9 Any post-use applications, no caps (> 100 mL and < 5 L) A10 Any post-use application , no caps (unspecified sizes) A11 Beer bottles A12 Post-use food oil bottles A13 Post-use motor oil bottles A14 Post-use pesticide bottles A15 Post-use toner bottles A20 Mixed applications in this category (assessor to specify) A30 Other specific application in this category (assessor to specify)
A Bottles
A40 Unspecified bottles B1 Carrier bags B2 Polymer bags B3 Woven big bags and sacks B4 Fertiliser sacks B5 Other bags B6 Carton and box liners B20 Mixed application in this category (assessor to specify) B30 Other specific applications in this category (assessor to specify)
B Bags
B40 Unspecified bags C1 Pallet stretch wrap C2 Pallet shrink wrap C3 Agricultural film C4 Food and cigarette packets (PP film only) C20 Mixed application in this category (assessor to specify) C30 Other specific applications in this category (assessor to specify)
C Films and sheets
C40 Unspecified films and sheets D1 Spreads containers D2 Yoghurt containers D3 Jars
D Tubs, pots and small trays
D4 Buckets

167
General application category
Specific application category
D5 Plant pots D6 Paint pots D7 Disposable cups (non-foamed) D8 Small food trays D20 Mixed application in this category (assessor to specify) D30 Other specific applications in this category (assessor to specify) D40 Unspecified tubs, pots and small trays E1 Pallets E2 Bottle crates E3 Food trays (e.g. bread trays) E4 Fish boxes (non-foamed) E5 Drums E6 Clear plastic boxes (e.g. CD cases) E20 Mixed application in this category (assessor to specify) E30 Other specific applications in this category (assessor to specify)
E Crates, containers and large trays
E40 Unspecified crates, containers and large trays F1 Block packaging F2 Loose fill F3 Food trays F4 Fish boxes F5 Flower pots trays F6 Disposable foam cups F20 Mixed application in this category (assessor to specify) F30 Other specific applications in this category (assessor to specify)
F Expanded foam
F40 Unspecified expanded foam G1 Rope, string and strapping G Rope,
string and strapping
G40 Unspecified rope, string and strapping
Y20 Mixed plastics packaging applications (assessor to specify) Y30 Other specific plastics packaging applications (assessor to specify)
Y Mixed and other plastics packaging applications Y40 Unspecified plastics packaging applications
Z20 Mixed waste (assessor to specify) Z Mixed waste (i.e. includes other than plastics packaging waste)
Z40 Unspecified mixed waste
Colour categories used in PAS-103 Colour code Colour description P1 Natural (i.e. no visible pigmentation present)
P2 Natural with tint (e.g. clear tinted water bottles)
P3 Single colour (i.e. no visible colour variation in the batch)
P4 Single colour, mixed shades (i.e. various shades of the same colour) P5 Mixed colours (commonly referred to as ‘jazz’)
168
12 ANNEX V: TYPOLOGIES OF PLASTIC WASTE IN GERMANY
Sorting fraction Characteristics Supplementary sheet
The supplementary sheet is part of all the other specifications included in this table Description: The system compatibility of a piece of packaging, also in respect of the product filled into it, is the prerequisite for licensing and will be checked by an expert as required. Basically, only unground products from the sorting process of light weight packaging arising from household collection systems that are operated by contract partners of the Duales System Deutschland GmbH will be accepted. Purity: The purity of the sorting fraction will be determined by sampling in accordance with LAGA PN 2/98 (status: December 2001) and subsequent analysis (e.g. manual sorting and weighing or chemical analysis). Impurities: Impurities are substances with technically complicate or impede the recycling of the sorting fraction, without specifying complication or prevention in the individual case. Impurities are all materials and articles that are not described under Point A (specification/description). These include for instance: Packaging made of other sorting fractions which do not comply with the specification. Materials not covered by the system which have been incorrectly placed in the collection system. etc. The fractions of individual impurities or groups of impurities are limited separately as far as this is technically necessary. The maximum total amount of impurities is the percentage of all impurities in the fraction and must not be exceeded in any case.

169
Sorting fraction Characteristics
Plastic films Fraction-No. 310
Description: Used, completely emptied, system-compatible articles made of plastic film, surface > DIN A4, e.g. bags, carrier bags and shrink-wrapping film, including packaging parts such as labels etc. Purity: At least 92 mass %207 in accordance with the Specification/Description. Impurities: Max. total amount of impurities: 8 mass % Metallic and mineral impurities with an item weight of > 100 g are not permitted. Other metal articles: < 0.5 mass % Other plastic articles: < 4 mass % Other residual materials: < 4 mass % Examples of impurities: glass, paper, cardboard, composite paper/cardboard materials (e.g. beverage cartons), aluminised plastics, other materials (e.g. rubber, stones, wood, textiles, nappies), compostable waste (e.g. food, garden waste) Delivery form: Transportable bales Dimension and density of the bales must be chosen so as to ensure that a tarpaulin truck (loading area 12.60 m x 2.40 m; lateral loading height min. 2.60 m) can be loaded with a minimum loading of 23 t Dry-stored Produced with conventional bale presses Identified with Duales System Deutschland (DSD) bale label stating the sorting plant No., fraction No. and production date
Mixed plastic bottles Fraction-No. 320
Description: Used, completely emptied, rigid, system-compatible packaging made of plastic, volume ≤ 5 litres, e.g. detergent and household cleaner bottles, including packaging parts such as caps, labels etc. Purity: At least 94 mass % in accordance with the Specification/Description Impurities: Max. total amount of impurities: 6 mass % Metallic and mineral impurities with an item weight of > 100 g and cartridges for sealants are not permitted Other metal articles: < 0.5 mass % Other plastic articles: < 3 mass % Other residual materials: < 3 mass % Delivery form: Transportable bales Dimension and density of the bales must be chosen so as to ensure that a tarpaulin truck (loading area 12.60 m x 2.40 m; lateral loading height min. 2.60 m) can be loaded with a minimum loading of 14 t Dry-stored Produced with conventional bale presses Identified with DSD bale label stating the sorting plant No., fraction No. and production date
Polyolefin plastic bottles Fraction-No. 321
Description: Used, completely emptied, rigid, system-compatible sales packaging made of plastic, excluding PET-bottles (transparent), volume ≤ 5 liter, e.g. detergent- and household cleaner bottles including packaging parts like caps,
207 In percentage of weight

170
Sorting fraction Characteristics labels etc. Purity: At least 94 mass % in accordance with the Specification/Description. Impurities: Maximum total amount of impurities: 6 mass % Metallic and mineral impurities with an item weight of > 100 g and cartridges for sealants are not permitted! Other metal articles < 0.5 mass % Other plastic articles < 3 mass % Other residual materials < 3 mass % Delivery form: Transportable bales Dimension and density of the bales must be chosen so as to ensure that a tarpaulin truck (loading area 12.60 m x 2.40 m; lateral loading height min. 2.60 m) can be loaded with a minimum loading of 15 t Dry-stored Produced with conventional bale presses Identified with DSD bale label stating the sorting plant No., fraction No. and production date
Plastic hollow bodies Fractions-No. 322
Description: Used, completely emptied, rigid, system-compatible sales articles made of plastic, bottles > 5 litres, buckets, cans, large containers ≤ 200 litres, incl. packaging parts such as lids, labels etc. Purity: At least 94 mass % in accordance with the Specification/Description. Impurities: Max. total amount of impurities: 6 mass % Metallic and mineral impurities with an item weight of > 100 g are not permitted! Other metal articles < 0.5 mass % Other plastic articles < 3 mass % Other residual materials < 3 mass % Delivery form: Transportable bales Dimension and density of the bales must be chosen so as to ensure that a tarpaulin truck (loading area 12.60 m x 2.40 m; lateral loading height min. 2.60 m) can be loaded with a minimum loading of 14 t Dry-stored Produced with conventional bale presses Identified with DSD bale label stating the sorting plant No., fraction No. and production date
Polypropylene Fraction-No. 324
Description: Used, completely emptied, rigid, system-compatible articles made of polypropylene, volume ≤ 5 litres, e.g. bottles, dishes and tubs, incl. packaging parts such as caps, lids, labels etc. Purity: At least 94 mass % in accordance with the Specification/Description. Impurities: Max. total amount of impurities: 6 mass % Metallic and mineral impurities with an item weight of > 100 g and cartridges for sealants are not permitted! Other metal articles < 0.5 mass % Rigid PE articles < 1 mass % Expanded plastics incl. EPS articles < 0.5 mass % Plastic films < 2 mass %

171
Sorting fraction Characteristics Other residual materials < 3 mass % Delivery form: Transportable bales Dimension and density of the bales must be chosen so as to ensure that a tarpaulin truck (loading area 12.60 m x 2.40 m; lateral loading height min. 2.60 m) can be loaded with a minimum loading of 17 t Dry-stored Produced with conventional bale presses Identified with DSD bale label stating the sorting plant No., fraction No. and production date
PET bottles, transparent Fraction-No. 325
Description: Used, completely emptied, rigid, system-compatible packaging made of polyethylene terephthalate, volume ≤ 5 litres, e.g. soft drink and mineral water bottles, incl. packaging parts such as caps, labels etc. Purity: At least 98 mass % in accordance with the Specification/Description. Impurities: Max. total amount of impurities: 2 mass % Metallic and mineral impurities with an item weight of > 100 g are not permitted! Other metal articles < 0.5 mass % Opaque PET bottles, other PET packaging and other plastic articles < 2 mass % EPS articles < 0.5 mass % PVC articles < 0.1 mass % Other residual materials < 2 mass % Delivery form: Transportable bales Dimension and density of the bales must be chosen so as to ensure that a tarpaulin truck (loading area 12.60 m x 2.40 m; lateral loading height min. 2.60 m) can be loaded with a minimum loading of 14 t Dry-stored Produced with conventional bale presses Identified with DSD bale label stating the sorting plant No., fraction No. and production date
Mixed PET 90 / 10 Fraction-No. 328-1
Description: Used, residue-drained dimensionally stable, system-compatible packages made of polyethylene terephthalate (PET), volume ≤ 5 litres in the following composition: 1. transparent bottles, e.g. washing-up-liquid bottles, beverage bottles 2. other dimensionally stable PET packages, e.g. beakers, bowls Clear, coloured, opaque, including ancillary constituents such as closures, labels, etc. Purity: At least 90 % PET bottles, transparent Maximally 10 % other dimensionally stable packages made of PET Impurities: Maximum total content of impurities: 2 mass % Metallic and mineral impurities with a unit weight of > 100 g must not be contained! Other metal articles < 0.5 mass % Other plastic articles < 2 mass % PVC articles < 0.1 mass % Other residual materials < 2 mass %

172
Sorting fraction Characteristics Delivery form: Transportable bales Dimensions and density of the bales must be chosen so as to ensure that a tarpaulin truck (loading area 12.60 m x 2.40 m; lateral loading height min. 2.60 m) can be loaded with a minimum loading of 14 t stored in a dry place produced using commercially available bale presses identified by bale tags provided with Sorting Line Number, Fraction Number and production date
Mixed PET 70 / 30 Fraction-No. 328-2
Description: Used, residue-drained dimensionally stable, system-compatible packages made of polyethylene terephthalate (PET), volume ≤ 5 litres in the following composition: 1. transparent bottles, e.g. washing-up-liquid bottles, beverage bottles 2. other dimensionally stable PET packages, e.g. beakers, bowls Clear, coloured, opaque, including ancillary constituents such as closures, labels, etc. Purity: At least 70 % PET bottles, transparent Maximally 30 % other dimensionally stable packages made of PET Impurities: Maximum total content of impurities: 2 mass % Metallic and mineral impurities with a unit weight of > 100 g must not be contained! Other metal articles < 0.5 mass % Other plastic articles < 2 mass % PVC articles < 0.1 mass % Other residual materials < 2 mass % Delivery form: Transportable bales Dimensions and density of the bales must be chosen so as to ensure that a tarpaulin truck (loading area 12.60 m x 2.40 m; lateral loading height min. 2.60 m) can be loaded with a minimum loading of 14 t stored in a dry place produced using commercially available bale presses identified by bale tags provided with Sorting Line Number, Fraction Number and production date
Mixed PET 50 / 50 Fraction-No. 328-3
Description: Used, residue-drained dimensionally stable, system-compatible packages made of polyethylene terephthalate (PET), volume ≤ 5 litres in the following composition: 1. transparent bottles, e.g. washing-up-liquid bottles, beverage bottles 2. other dimensionally stable PET packages, e.g. beakers, bowls Clear, coloured, opaque, including ancillary constituents such as closures, labels, etc. Purity: At least 50 % PET bottles, transparent Maximally 50 % other dimensionally stable packages made of PET Impurities: Maximum total content of impurities: 2 mass % Metallic and mineral impurities with a unit weight of > 100 g must not be contained! Other metal articles < 0.5 mass % Other plastic articles < 2 mass %

173
Sorting fraction Characteristics PVC articles < 0.1 mass % Other residual materials < 2 mass % Delivery form: Transportable bales Dimensions and density of the bales must be chosen so as to ensure that a tarpaulin truck (loading area 12.60 m x 2.40 m; lateral loading height min. 2.60 m) can be loaded with a minimum loading of 14 t stored in a dry place produced using commercially available bale presses identified by bale tags provided with Sorting Line Number, Fraction Number and production date
Polyethylene Fraction-No. 329
Description: Used, completely emptied, rigid, system-compatible articles made of polyethylene, volume ≤ 5 litres, e.g. bottles and dishes, incl. packaging parts such as caps, lids, labels etc. Purity: At least 94 mass % in accordance with the Specification/Description. Impurities: Max. total amount of impurities: 6 mass % Metallic and mineral impurities with an item weight of > 100 g and cartridges for sealants are not permitted! Other metal articles < 0.5 mass % Dimensionally stable PP articles < 3 mass % Foamed plastics incl. EPS articles < 0.5 mass % Plastic films < 5 mass % Other residual materials < 3 mass % Delivery form: Transportable bales Dimension and density of the bales must be chosen so as to ensure that a tarpaulin truck (loading area 12.60 m x 2.40 m; lateral loading height min. 2.60 m) can be loaded with a minimum loading of 17 t Dry-stored Produced with conventional bale presses Identified with DSD bale label stating the sorting plant No., fraction No. and production date
Cups Fraction-No. 330
Description: Used, completely emptied, rigid, system-compatible sales packaging made of plastic, volume ≤ 1 litre, e.g. yoghurt and margarine tubs, incl. packaging parts such as lids, labels etc. Purity: At least 94 mass % in accordance with the Specification/Description. Impurities: Max. total amount of impurities: 6 mass % Metallic and mineral impurities with an item weight of > 100 g are not permitted! Other metal articles < 0.5 mass % Other plastic articles < 3 mass % Other residual materials < 3 mass % Delivery form: Transportable bales Dimension and density of the bales must be chosen so as to ensure that a tarpaulin truck (loading area 12.60 m x 2.40 m; lateral loading height min. 2.60 m) can be loaded with a minimum loading of 17 t Dry-stored Produced with conventional bale presses
174
Sorting fraction Characteristics Identified with DSD bale label stating the sorting plant No., fraction No. and production date
Polystyrene Fraction-No. 331
Description: Used, completely emptied, rigid, system-compatible articles made of polystyrene, volume ≤ 1 litre, e.g. tubs and dishes, incl. packaging parts such as lids, labels etc. Purity: At least 94 mass % in accordance with the Specification/Description. Impurities: Max. total amount of impurities: 6 mass % Metallic and mineral impurities with an item weight of > 100 g are not permitted! Other metal articles < 0.5 mass % Expanded plastics incl. EPS articles < 1 mass % Other plastic articles < 4 mass % Other residual materials < 2 mass % Delivery form: Transportable bales Dimension and density of the bales must be chosen so as to ensure that a tarpaulin truck (loading area 12.60 m x 2.40 m; lateral loading height min. 2.60 m) can be loaded with a minimum loading of 19 t Dry-stored Produced with conventional bale presses Identified with DSD bale label stating the sorting plant No., fraction No. and production date
Expanded polystyrene Fraction-No. 340
Description: Used, completely emptied, system-compatible packaging made of coarse-grained, white expanded polystyrene, incl. packaging parts such as labels etc. Purity: At least 97 mass % in accordance with the Specification/Description. Impurities: Max. total amount of impurities: 3 mass % Metallic and mineral impurities with an item weight of > 100 g and packaging chips are not permitted! Other metal articles < 0.5 mass % Delivery form: in 1 m³ or 2.5 m³ big bags or Transportable bales Dimension and density of the bales must be chosen so as to ensure that a tarpaulin truck (loading area 12.60 m x 2.40 m; lateral loading height min. 2.60 m) can be loaded with a minimum loading of 0,7 t Dry-stored Produced with conventional bale presses Identified with DSD bale label stating the sorting plant No., fraction No. and production date
Mixed plastics Fraction-No. 350
Description: Used, completely emptied, system-compatible articles made of plastics that are typical for packaging (PE, PP, PS, PET) incl. packaging parts such as caps, lids, labels etc. Purity: At least 90 mass % in accordance with the Specification/Description. Impurities: Max. total amount of impurities: 10 mass % Metallic and mineral impurities with an item weight of > 100 g are not permitted!

175
Sorting fraction Characteristics Paper, cardboard < 5 mass % Other metal articles < 2 mass % PET bottles, transparent < 4 mass % PVC articles other than packaging < 0.5 mass % Other residual materials < 3 mass % Delivery form: Transportable bales Dimension and density of the bales must be chosen so as to ensure that a tarpaulin truck (loading area 12.60 m x 2.40 m; lateral loading height min. 2.60 m) can be loaded with a minimum loading of 21 t Dry-stored Produced with conventional bale presses Identified with DSD bale label stating the sorting plant No., fraction No. and production date
Preliminary Product for RDF (Refused Derived Fuel) Fraction-No. 365
Description: A1. Used, completely emptied system-compatible articles made from plastics used for packaging (PE, PP, PS, PET) as well as paper, cardboard, paper board containers and paper composites, including packaging parts such as labels etc. A2. Other chemical-physical parameters208. Purity: At least 90 mass % in accordance with the Material description (A1.) Impurities: Maximum total amount of impurities: 10 mass % Massive impurities with an item weight of > 100 g are not permitted. Metal < 2 mass % Textiles and shoes (clothing- and homebound textiles, other textiles) < 2 mass % Electric powered and electronic articles < 0.5 mass-% PVC-articles < 0.5 mass % Other impurities < 7 mass % Delivery form: Transportable bales Dimension and density of the bales must be chosen so as to ensure that a tarpaulin truck (loading area 12.60 m x 2.40 m; lateral loading height min. 2.60 m) can be loaded with a minimum loading of 23 t Dry-stored Produced with conventional bale presses Identified with DSD bale label stating the sorting plant No., fraction No. and production date
208 Details available here : http://www.gruener-punkt.de/fileadmin/user_upload/Seiteninhalt/Dateien/DKR_Kunststoffverwertung/pdf_eng/365_Preliminary_Product_for_RDF_Refused_Derived_Fuel.pdf