end-to-end lung cancer diagnosis on computed tomography
TRANSCRIPT
International Journal of Computer Applications (0975 - 8887)Volume 176 - No.15, April 2020
End-to-End Lung Cancer Diagnosis on ComputedTomography Scans using 3D CNN and Explainable AI
Chaitanya RahalkarSavitribai Phule Pune University
Anushka VirgaonkarSavitribai Phule Pune University
Dhaval GujarSavitribai Phule Pune University
Sumedh PatkarSavitribai Phule Pune University
ABSTRACTLung cancer is one of the most common malignant neoplasmsall over the world. It accounts for more cancer deaths than anyother cancer. It is increasingly being recognized in hospitals allacross the globe. With the increasing prevalence of smoking,Lung cancer has reached epidemic proportions. Thus, we pro-pose a 3D-CNN-based model [6] that uses a patient’s Com-puted Tomography scans to detect nodules and check for ma-lignancy. We intend to add an explainable aspect to the resultsince the central problem of such models is that they are re-garded as black-box models, and they lack an explicit declara-tive knowledge representation [9]. This calls for systems enablingto make decisions transparent, understandable and explainable.
General TermsDeep Learning, Neural Networks, Machine Learning, Consumer Health
KeywordsSupervised Learning, Convolutional Neural Networks
1. INTRODUCTIONIn India, millions of people are diagnosed with Lung diseases. Inthe diagnosis of the Lung disease, assessing the pattern, locatingthe pattern, and studying the regional distribution of involvement,is the domain of radiology[4]. However, there is a dearth of trainedRadiologists that can accurately diagnose the likelihood of the dis-ease. Furthermore, many of the current attempts at automating theprocess have not been intuitive enough for actual use by Radiol-ogists in clinics. The application which we have proposed wouldallow Radiologists to perform seamless diagnosis and assessment.
This tool takes images of CT scans of a patient, which are stored inDigital Imaging and Communications in Medicine (DICOM) for-mat [11], as input. It detects the nodules in the images. These nod-ules are a group of abnormal tissues that develop in the Lung. Thenodules are classified as malignant or benign using a Deep Learn-ing model. 3D Convolutional Neural Networks (CNNs) [7]are usedfor classifying the images as they have proven to show supremacyover the traditional neural network models. The output is a stan-dardized report which presents a detailed diagnosis of the malig-
nant nodules. This system is specifically designed to be used byRadiologists, who use medical imaging to diagnose diseases likeLung cancer. This tool provides a way for Radiologists to inter-act with the simple and easy to use web-based interface, allowingthem to inspect the Lung nodules. The application generates outputreports represented in Portable Document Format (PDF)[10][1].
2. MOTIVATIONWith an estimated 160,000 deaths in 2018, Lung cancer is the mostcommon cause of cancer death in the United States. Lung cancerscreening using low-dose Computed Tomography has been shownto reduce mortality by 2043% and is now included in US screen-ing guidelines. The CT scans show the presence of Lung nodulesbetter than regular chest X-Rays. The CT scans represent a two-dimensional view of a section or slice of the organ being examined.The three-dimensional shape can be constructed by arranging theCT scans according to their slice index. Applying 3D CNNs to theconstructed three-dimensional medical image of the Lung resultsin the diagnosis of Lung nodules. Moreover, characteristics such assphericity, spiculation, and texture of the detected nodules are alsopredicted to supplement the results.
3. PREVIOUS WORKSThere were different scenarios where detection of Lung cancer wasdone on Computed Tomography scans.
(1) One use case involved studying an individual patient’s previ-ous and current CT scans to predict the risk of Lung cancerusing deep learning techniques. This model achieved state-of-the-art performance. It shows a high potential for the use ofdeep learning models in predicting Lung cancer.
(2) Another use case for using Deep Learning to examine CT scanswas initiated by the United States Preventive Services TaskForce, which recommended continuous analysis of CT scansof the people with smoking history. This involved people whocurrently smoke or have quit within the past 15 years. The ini-tiative was taken to educate the population about the need forregular screening to promote informed decision making.
(3) Lung-RADS is a classification system that is used for manag-ing Lung cancer screening results. The classification systemgenerates various categories corresponding to the probability
1
International Journal of Computer Applications (0975 - 8887)Volume 176 - No.15, April 2020
of Lung cancer. A study was conducted to quantify the accu-racy of assigning the Lung-RADS categories to screening CTscans. A high interobserver agreement was observed.
4. RESEARCH ASSUMPTIONSThe following assumptions were made based on our observationsin collecting the data and training the model for classification:
(1) All the CT scan images are in the standardized DICOM [3][2]format. It is a structured file format to store raw medical scansalong with their metadata. Any scan not conforming to thisformat is likely to be predicted incorrectly by the algorithm.
(2) The resolution of the CT scans conforms to the scans takenfrom the LUNA 16 dataset [3]. The accuracy is considerablyaffected if the scan does not comply with the specified dimen-sion details.
5. APPLICATION SCOPEThe scope of the decision-support system is to aid Radiologists intesting CT scans to diagnose Lung cancer. The system aims to ex-pedite the screening process while providing a seamless experiencefor any Radiologist. A facility to systematically store detailed pa-tient records and fetch them as required.
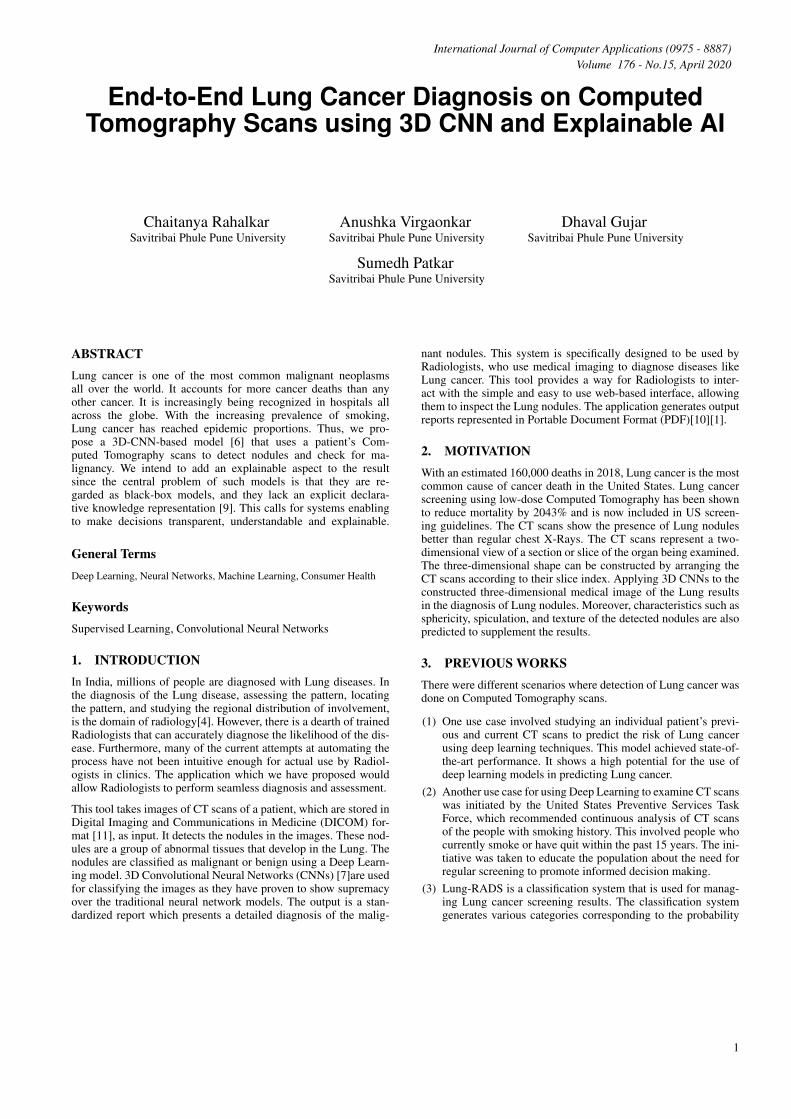
6. DETECTION FRAMEWORKThe fully automated Lung cancer diagnosis system consists mainlyof two parts: nodule detection and classification. We designed a 3DFaster R-CNN for nodule detection, as shown in Fig.1.
Fig. 1. Neural Network Architecture
Fig. 2. End-to-end Pipeline
As shown in Fig. 2, the nodule detection module and the classi-fication module are pipelined, making the entire diagnosis systemcompletely streamlined.
6.1 DatasetThe Lung Nodule Analysis 2016 (LUNA 2016) dataset consists of888 annotated CT scans. The dataset is used to train the convo-lutional neural network, which can then identify cancerous cellsfrom normal cells, which is the main task of our decision-supportsystem. A web-based system is added on top of this prediction APIto detect nodules, classify them as malignant or benign, and applyExplainable-AI [8], to explain the reasons for the classified out-comes in a human-understandable manner. Existing challenges inthe dataset include inter-grader variability and high false-positiveand false-negative rates.
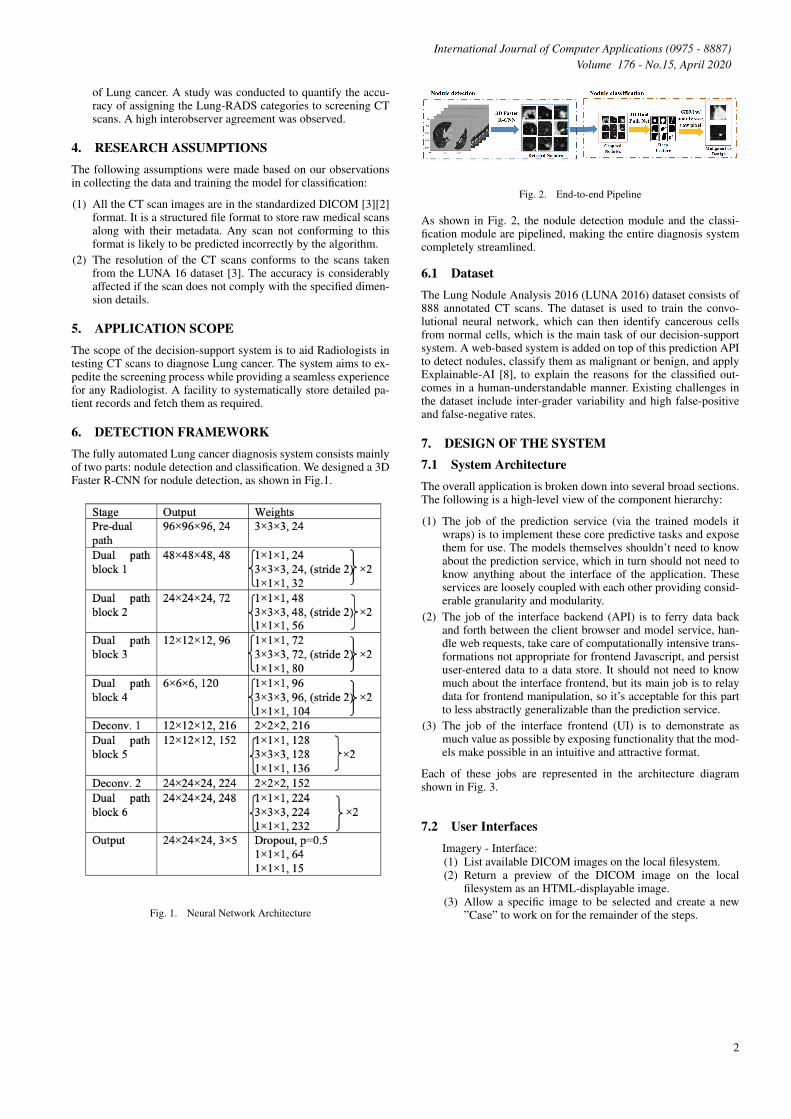
7. DESIGN OF THE SYSTEM7.1 System ArchitectureThe overall application is broken down into several broad sections.The following is a high-level view of the component hierarchy:
(1) The job of the prediction service (via the trained models itwraps) is to implement these core predictive tasks and exposethem for use. The models themselves shouldn’t need to knowabout the prediction service, which in turn should not need toknow anything about the interface of the application. Theseservices are loosely coupled with each other providing consid-erable granularity and modularity.
(2) The job of the interface backend (API) is to ferry data backand forth between the client browser and model service, han-dle web requests, take care of computationally intensive trans-formations not appropriate for frontend Javascript, and persistuser-entered data to a data store. It should not need to knowmuch about the interface frontend, but its main job is to relaydata for frontend manipulation, so it’s acceptable for this partto less abstractly generalizable than the prediction service.
(3) The job of the interface frontend (UI) is to demonstrate asmuch value as possible by exposing functionality that the mod-els make possible in an intuitive and attractive format.
Each of these jobs are represented in the architecture diagramshown in Fig. 3.
7.2 User InterfacesImagery - Interface:(1) List available DICOM images on the local filesystem.(2) Return a preview of the DICOM image on the local
filesystem as an HTML-displayable image.(3) Allow a specific image to be selected and create a new
”Case” to work on for the remainder of the steps.
2
International Journal of Computer Applications (0975 - 8887)Volume 176 - No.15, April 2020
Fig. 3. System Architecture
(4) This image will be used in the identification step next.
Detect - Interface:(1) Act as the data broker for the image being worked on (se-
lected in our current session), requesting predictions fromthe Prediction service along with filtering or other passedparameters and relay them back to the frontend.
(2) Provide an endpoint that can receive a payload of all nod-ule locations, (1) nodule centroid location tuple (X # vox-els from left, Y # voxels from the top, Z as slice number),(2) whether the nodule was predicted or manually added,and (3) whether the nodule was marked for further anal-ysis or not (those manually identified by the user are pre-sumably concerning)[5].
(3) List all available predicted candidate sites. Allow each tobe selected to view details.
(4) When a candidate is selected, show a detail view in an im-age viewer control. By default, show the slice containingthe predicted centroid and a marker indicating where thepredicted centroid occurs.
(5) Allow the user to navigate through the imagery freestyleand mark other locations that the models missed.
(6) When the user has finished marking candidates, send allof this labelled data to the backend in the format specifiedabove.
Annotate - Interface:(1) List nodules identified as part of the current case for de-
tailed view.(2) Receive and persist to the database a Radiologist-supplied
label for how concerning each nodule is.(3) Receive and persist to the database the other fields ex-
pected for each case in the RSNA Radiology ReportingTemplate for CT Lung Cancer Screening.
Segment - Prediction:(1) Given a nodule centroid location tuple (X No. of voxels
from left, Y No. of voxels from the top, Z as slice num-ber), return a 3D boolean mask with true values for voxelsassociated with that nodule and false values for other tis-sue or voids.
(2) For any given slice of any given nodule, transform the truevalues in the binary mask from the Prediction service intoa series of vertices defining an irregular polygon that canbe displayed on the image. In the transformation to ver-tices, take a precision parameter which causes the trans-formation to use more or fewer vertices to make the poly-gon fit the binary mask more precisely.
(3) Given a stack of such irregular polygons, calculate severalsummary statistics of interest, to include: a new estimatedcentroid location tuple (X No. of voxels from left, Y No.of voxels from the top, Z as slice number); a volume incubic millimetres; a longest axial diameter.
(4) Provide an endpoint that allows the current vertices to bepersisted to the database attached to the current case andnodule.
Results - Interface:(1) Summarize all of the data from the case, including the gen-
eral notes and details for each nodule, into a single JSONreport.
(2) Allow export of the whole report in different formats.
7.3 Functional Requirements
(1) Identification: The ”Region of Interest” to be identified is thenodule, whose presence is an indication of Lung cancer. Thesystem can successfully differentiate the nodule from the tissuein the background and pinpoints its location in the image.
(2) Classification: The classification model will classify the nod-ule’s type: Malignant or Benign. It performs analysis on thepast labelled data to predict the label of the present data. Therisk factor associated with the prediction is calculated.
(3) Segmentation: The system must find the boundaries of nod-ules in the image. Accurate representation of the same will bedisplayed on the frontend web application. The system helpsRadiologists refine and build out the computer-aided diagnosiswith the help of automatic measures.
(4) Data Preprocessing: The data preprocessing module will applyfilters to the input DICOM images. Resizing algorithms areapplied for further processing. The slicing factor of frames isselected and fixed.
(5) Query Response: The response to the client’s queries will beshown by a direct action on a rendered DICOM image havingbounding boxes that indicate the presence of nodules. Meta-data is displayed for each image.
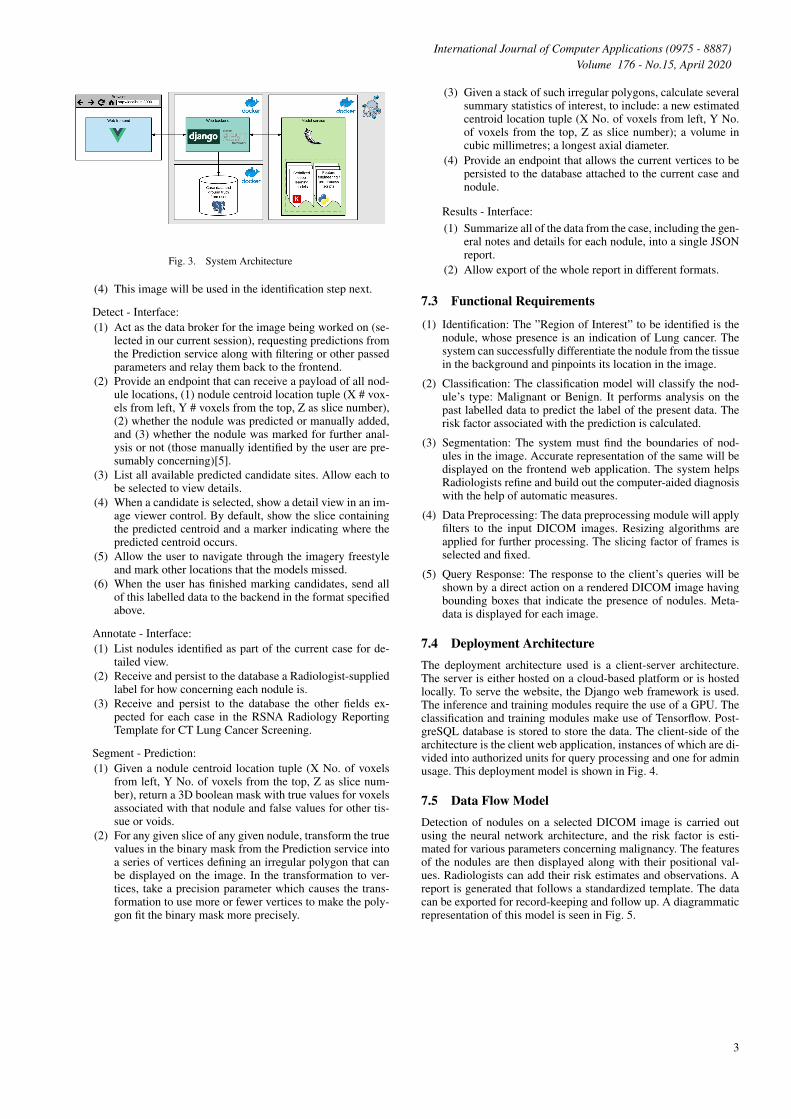
7.4 Deployment ArchitectureThe deployment architecture used is a client-server architecture.The server is either hosted on a cloud-based platform or is hostedlocally. To serve the website, the Django web framework is used.The inference and training modules require the use of a GPU. Theclassification and training modules make use of Tensorflow. Post-greSQL database is stored to store the data. The client-side of thearchitecture is the client web application, instances of which are di-vided into authorized units for query processing and one for adminusage. This deployment model is shown in Fig. 4.
7.5 Data Flow ModelDetection of nodules on a selected DICOM image is carried outusing the neural network architecture, and the risk factor is esti-mated for various parameters concerning malignancy. The featuresof the nodules are then displayed along with their positional val-ues. Radiologists can add their risk estimates and observations. Areport is generated that follows a standardized template. The datacan be exported for record-keeping and follow up. A diagrammaticrepresentation of this model is seen in Fig. 5.
3
International Journal of Computer Applications (0975 - 8887)Volume 176 - No.15, April 2020
Fig. 4. Deployment Diagram
Fig. 5. Data Flow
8. IMPLEMENTATION DETAILSThe project design is broadly divided into the following modules,each responsible for handling different tasks :
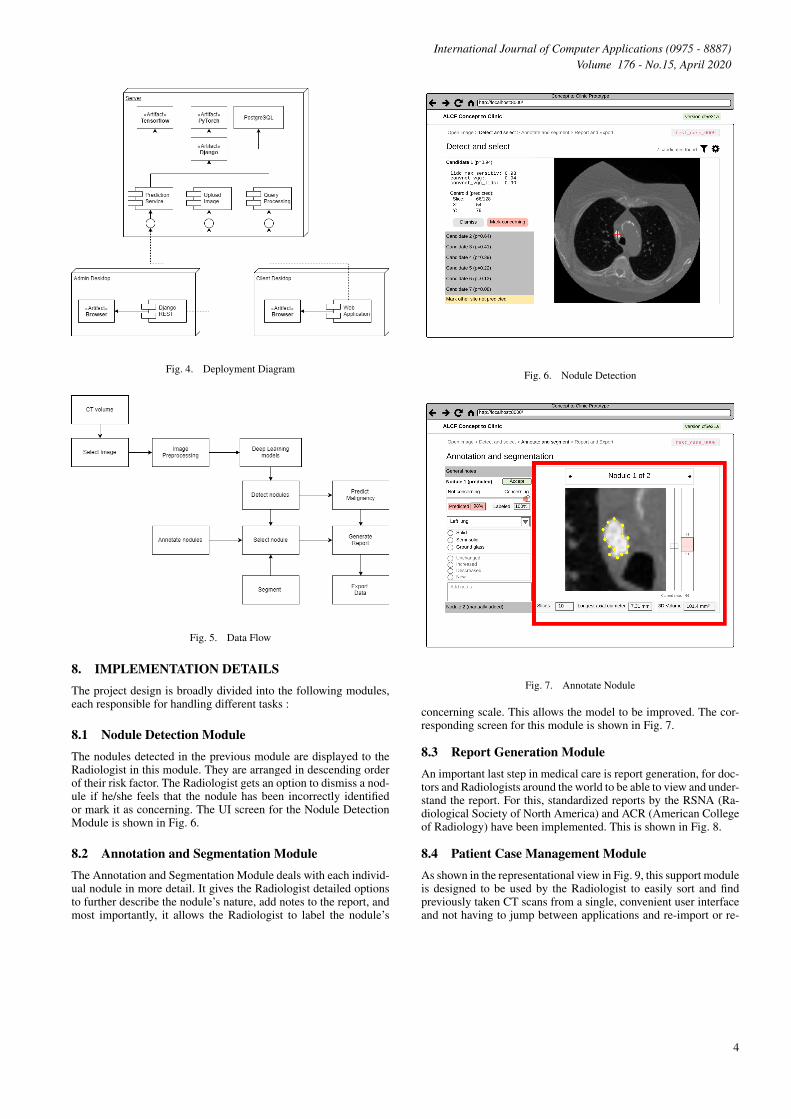
8.1 Nodule Detection ModuleThe nodules detected in the previous module are displayed to theRadiologist in this module. They are arranged in descending orderof their risk factor. The Radiologist gets an option to dismiss a nod-ule if he/she feels that the nodule has been incorrectly identifiedor mark it as concerning. The UI screen for the Nodule DetectionModule is shown in Fig. 6.
8.2 Annotation and Segmentation ModuleThe Annotation and Segmentation Module deals with each individ-ual nodule in more detail. It gives the Radiologist detailed optionsto further describe the nodule’s nature, add notes to the report, andmost importantly, it allows the Radiologist to label the nodule’s
Fig. 6. Nodule Detection
Fig. 7. Annotate Nodule
concerning scale. This allows the model to be improved. The cor-responding screen for this module is shown in Fig. 7.
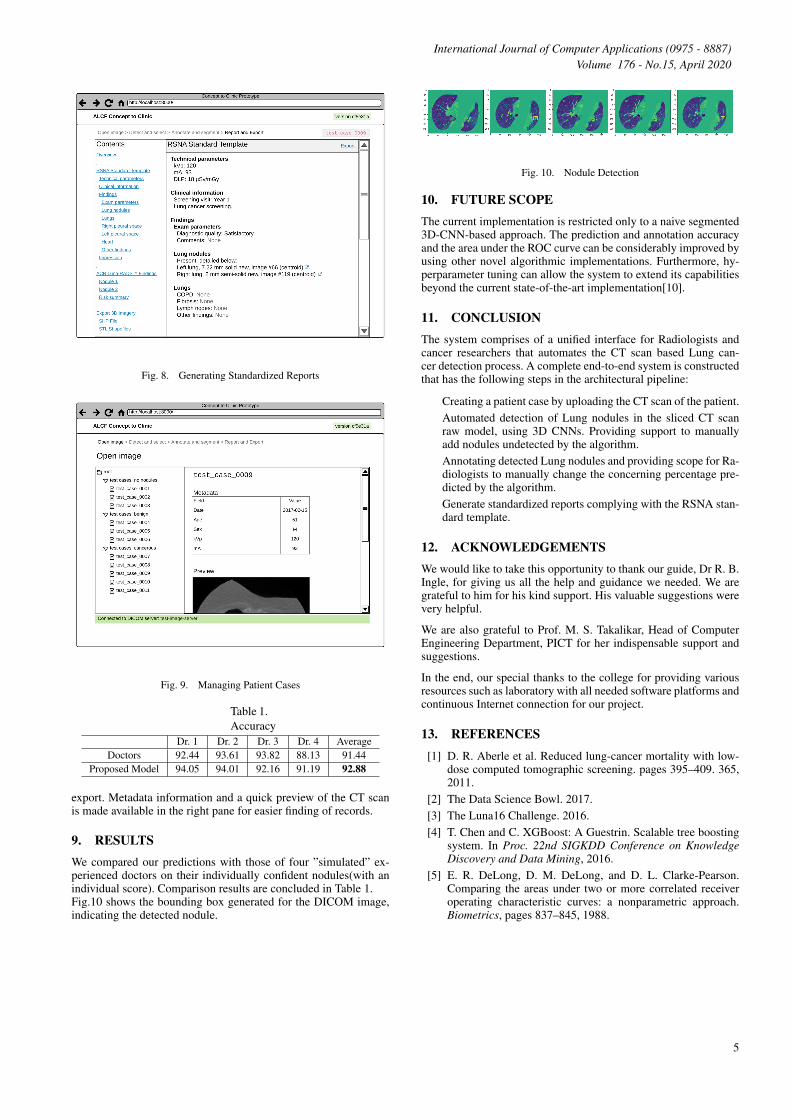
8.3 Report Generation ModuleAn important last step in medical care is report generation, for doc-tors and Radiologists around the world to be able to view and under-stand the report. For this, standardized reports by the RSNA (Ra-diological Society of North America) and ACR (American Collegeof Radiology) have been implemented. This is shown in Fig. 8.
8.4 Patient Case Management ModuleAs shown in the representational view in Fig. 9, this support moduleis designed to be used by the Radiologist to easily sort and findpreviously taken CT scans from a single, convenient user interfaceand not having to jump between applications and re-import or re-
4
International Journal of Computer Applications (0975 - 8887)Volume 176 - No.15, April 2020
Fig. 8. Generating Standardized Reports
Fig. 9. Managing Patient Cases
Table 1.Accuracy
Dr. 1 Dr. 2 Dr. 3 Dr. 4 AverageDoctors 92.44 93.61 93.82 88.13 91.44
Proposed Model 94.05 94.01 92.16 91.19 92.88
export. Metadata information and a quick preview of the CT scanis made available in the right pane for easier finding of records.
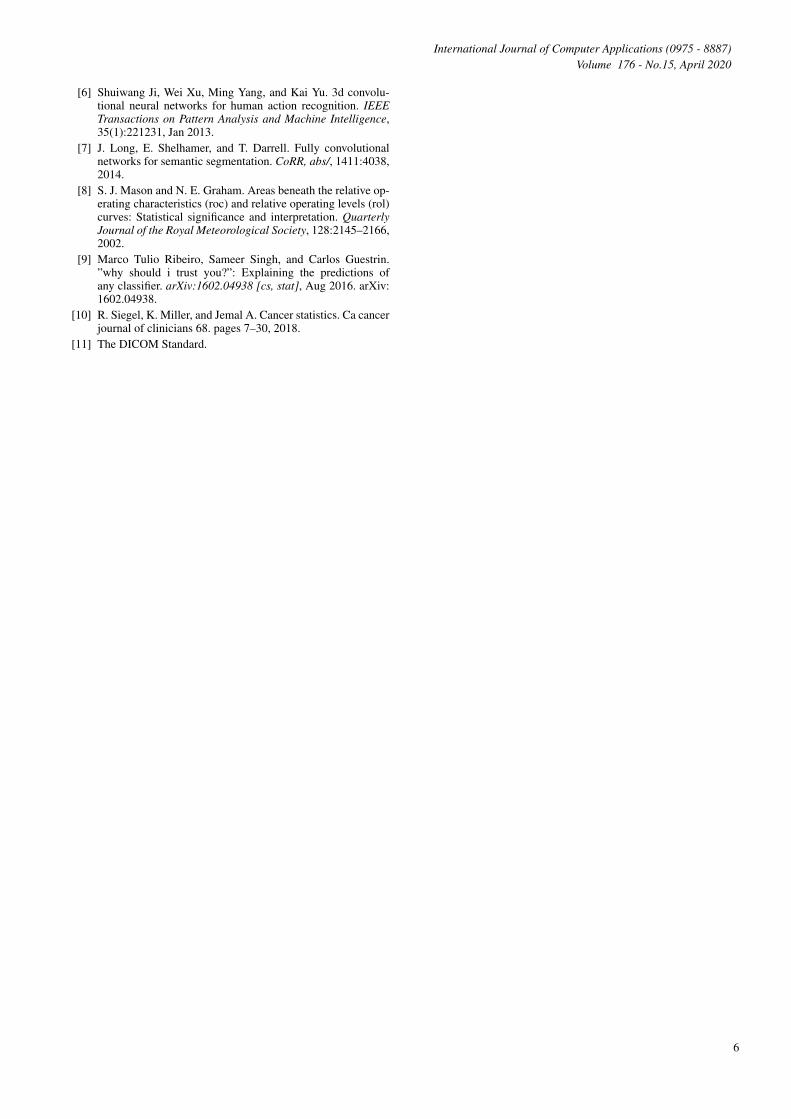
9. RESULTSWe compared our predictions with those of four ”simulated” ex-perienced doctors on their individually confident nodules(with anindividual score). Comparison results are concluded in Table 1.Fig.10 shows the bounding box generated for the DICOM image,indicating the detected nodule.
Fig. 10. Nodule Detection
10. FUTURE SCOPEThe current implementation is restricted only to a naive segmented3D-CNN-based approach. The prediction and annotation accuracyand the area under the ROC curve can be considerably improved byusing other novel algorithmic implementations. Furthermore, hy-perparameter tuning can allow the system to extend its capabilitiesbeyond the current state-of-the-art implementation[10].
11. CONCLUSIONThe system comprises of a unified interface for Radiologists andcancer researchers that automates the CT scan based Lung can-cer detection process. A complete end-to-end system is constructedthat has the following steps in the architectural pipeline:
Creating a patient case by uploading the CT scan of the patient.Automated detection of Lung nodules in the sliced CT scanraw model, using 3D CNNs. Providing support to manuallyadd nodules undetected by the algorithm.Annotating detected Lung nodules and providing scope for Ra-diologists to manually change the concerning percentage pre-dicted by the algorithm.Generate standardized reports complying with the RSNA stan-dard template.
12. ACKNOWLEDGEMENTSWe would like to take this opportunity to thank our guide, Dr R. B.Ingle, for giving us all the help and guidance we needed. We aregrateful to him for his kind support. His valuable suggestions werevery helpful.
We are also grateful to Prof. M. S. Takalikar, Head of ComputerEngineering Department, PICT for her indispensable support andsuggestions.
In the end, our special thanks to the college for providing variousresources such as laboratory with all needed software platforms andcontinuous Internet connection for our project.
13. REFERENCES[1] D. R. Aberle et al. Reduced lung-cancer mortality with low-
dose computed tomographic screening. pages 395–409. 365,2011.
[2] The Data Science Bowl. 2017.[3] The Luna16 Challenge. 2016.[4] T. Chen and C. XGBoost: A Guestrin. Scalable tree boosting
system. In Proc. 22nd SIGKDD Conference on KnowledgeDiscovery and Data Mining, 2016.
[5] E. R. DeLong, D. M. DeLong, and D. L. Clarke-Pearson.Comparing the areas under two or more correlated receiveroperating characteristic curves: a nonparametric approach.Biometrics, pages 837–845, 1988.
5
International Journal of Computer Applications (0975 - 8887)Volume 176 - No.15, April 2020
[6] Shuiwang Ji, Wei Xu, Ming Yang, and Kai Yu. 3d convolu-tional neural networks for human action recognition. IEEETransactions on Pattern Analysis and Machine Intelligence,35(1):221231, Jan 2013.
[7] J. Long, E. Shelhamer, and T. Darrell. Fully convolutionalnetworks for semantic segmentation. CoRR, abs/, 1411:4038,2014.
[8] S. J. Mason and N. E. Graham. Areas beneath the relative op-erating characteristics (roc) and relative operating levels (rol)curves: Statistical significance and interpretation. QuarterlyJournal of the Royal Meteorological Society, 128:2145–2166,2002.
[9] Marco Tulio Ribeiro, Sameer Singh, and Carlos Guestrin.”why should i trust you?”: Explaining the predictions ofany classifier. arXiv:1602.04938 [cs, stat], Aug 2016. arXiv:1602.04938.
[10] R. Siegel, K. Miller, and Jemal A. Cancer statistics. Ca cancerjournal of clinicians 68. pages 7–30, 2018.
[11] The DICOM Standard.
6