end-to-end qos computation for vertical...
TRANSCRIPT
END-TO-END QOS COMPUTATION FOR VERTICAL SERVICE
COMPOSITION IN THE CLOUD
By
Raed Karim
B.Sc. Computer Science, Ryerson University, Toronto, 2009
M.Sc. Computer Science, Ryerson University, Toronto, 2011
A dissertation
presented to Ryerson University
in partial fulfillment of the
requirements for the degree of
Doctor of Philosophy
in the Program of
Computer Science
Toronto, Ontario, Canada, 2015
© Raed Karim, 2015

ii
AUTHOR'S DECLARATION FOR ELECTRONIC SUBMISSION OF A DISSERTATION
I hereby declare that I am the sole author of this dissertation. This is a true copy of the
dissertation, including any required final revisions, as accepted by my examiners.
I authorize Ryerson University to lend this dissertation to other institutions or individuals for the
purpose of scholarly research.
I further authorize Ryerson University to reproduce this dissertation by photocopying or by other
means, in total or in part, at the request of other institutions or individuals for the purpose of
scholarly research.
I understand that my dissertation may be made electronically available to the public.

iii
Abstract
End-to-End QoS Computation for Vertical Service Composition in the Cloud
© Raed Karim, 2015
Doctor of Philosophy
Computer Science
Ryerson University
Cloud services are designed to provide users with different computing models such as software-as-a-
Services (SaaS), Infrastructure-as-a-Service (IaaS), Data-as-a-Service (DaaS), and other IT related
services (denoted as XaaS). Easy, scalable and on-demand cloud services are offered by cloud providers
to users. With the prevalence of different types of cloud services, the task of selecting the best cloud
service solution has become more and more challenging. Cloud service solutions are offered through a
collaboration of different cloud services at different cloud layers. This type of collaborations is denoted
as vertical service composition. Quality of Service (QoS) properties are used as differentiating factors for
selecting the best services among functionally equivalent services. In this thesis, we introduce a new
service selection framework for the cloud which vertically matches services offered by different cloud
providers based on users’ end-to-end QoS requirements. Functional requirements can be satisfied by the
required cloud service (software service, platform service, etc) alone. However, users’ QoS requirements
must be satisfied using all involved cloud services in a service composition. Therefore, in order to select
the best cloud service compositions for users, QoS values of these compositions must be end-to-end. To
tackle the problem of computing unknown end-to-end QoS values of vertical cloud service compositions
for target users (for whom these values are computed), we propose two strategies: QoS mapping and
aggregation and QoS prediction. The former deals with new cloud service compositions with no prior
history. Using this strategy, we can map users’ QoS requirements onto different cloud layers and then we
aggregate QoS values guaranteed by cloud providers to estimate end-to-end QoS values. The latter deals

iv
with cloud service compositions for which QoS data have been recorded in an active system. Using the
QoS prediction strategy, we utilize historical QoS data of previously invoked service compositions and
other service and user information to predict end-to-end QoS values. The presented experimental results
demonstrate the importance of considering vertically composed cloud services when computing end-to-
end QoS values as opposed to traditional prediction approaches. Our QoS prediction approach
outperforms other prediction approaches in terms of the prediction accuracy by at least 20%.

v
Acknowledgements
I would like to express my sincere gratitude to my Supervisors: Professor Ali Miri and Professor
Chen (Cherie) Ding for their continuous support and encouragement during my Ph.D study and research,
for their great efforts explaining things and answering my questions simply and clearly, for their
motivation and inspiration, for their immense knowledge and for their patience. Their continued and
thoughtful guidance helped me during all the time of research and writing my thesis. I could not think of
better supervisors and mentors for my Ph.D study and research.
I would like to thank the Ph.D examining committee: Professor I. Woungang, Professor A. Ferworn,
Professor E. Bagheri and Professor S. Shirmohammadi for thoughtful comments and encouragement.
I would like to thank Professor Ali Miri, and Professor I. Woungang for giving me the opportunity to
join their labs during my Ph.D study.
I would like to deeply thank my parents for their prayers, emotional support and continued
encouragement.
I would like to specially thank my beloved wife and children for their endless support and for their
enormous patience. Without their support and understanding I would not accomplish this success.

vi
Dedication
I dedicate this thesis to my wife (Sally Jabbar) who provided all support and loving environment
during all the time of my Ph.D study. Without her, this accomplishment would not happen.

vii
TABLE OF CONTENTS
AUTHOR’S DECLARATION……...…………………………………………………………………ii
ABSTRACT .................................................................................................................................... iii
ACKNOWLEDGEMENTS ............................................................................................................... v
DEDICATION………...…………………….………………………………………………………...vi
LIST OF TABLES……………………………………………………………………………………..x
LIST FIGURES………………………………………………………………………………………..xi
LIST OF ABBREVIATIONS………………………………………………………………………..xiii
1 INTRODUCTION 1
1.1 Motivation ............................................................................................................................ 1
1.2 Contributions ......................................................................................................................... 4
1.3 Thesis Assumptions ............................................................................................................... 6
1.4 Thesis Organization ............................................................................................................... 7
2 LITERATURE REVIEW 9
2.1 QoS-based Cloud Service Selection and Ranking .................................................................. 9
2.2 Cloud Service Recommandation ......................................................................................... 12
2.3 Cloud Service Composition ..................................................................................... 14
2.4 QoS Modeling and Mapping ............................................................................................... 17
2.4.1 QoS Modeling ........................................................................................................... 17
2.4.2 QoS Mapping ............................................................................................................. 20
2.5 QoS Prediction ................................................................................................................... 21

viii
2.5.1 QoS Prediction using Collaborative Recommendation Techniques .............................. 22
2.5.2 QoS Prediction using Optimization and Model-based Techniques ............................... 25
3 A FRAMEWORK FOR COMPUTING END-TO-END QOS VALUES
OF VERTICAL CLOUD COMPOSITE SERVICES 28
3.1 QoS Properties for Cloud Services ....................................................................................... 28
3.2 A New Cloud Service Selection Process .............................................................................. 31
3.3 Cloud Service Selection Architecture .................................................................................. 33
3.4 Chapter Summary ................................................................................................................ 35
4 CLOUD SERVICE QOS MAPPING AND AGGREGATION 36
4.1 An Overview of the QoS Mapping and the QoS Aggregation Process ................................. 36
4.2 QoS Mapping Rules ............................................................................................................ 38
4.3 QoS Aggregation ................................................................................................................ 41
4.4 An Illustrating Example ...................................................................................................... 44
4.5 Experiments ........................................................................................................................ 47
4.5.1 Description of the QoS Datasets .................................................................................. 47
4.5.2 Experiments Setup and Details .................................................................................... 48
4.6 Chapter Summary ................................................................................................................ 49
5 END-TO-END QOS PREDICTION 50
5.1 Overview of Cloud Composite Services Similarity Calculation and
QoS Prediction…………………………………………..………………………………….... 51
5.2 Architecture for End-to-End QoS Prediction Model .............................................................. 53
5.3 A New Multi-Dimensional Model for Predicting End-to-End QoS Values . ............. 55
5.4 Constructing Local Regularization Term ............................................................................... 58
5.4.1 Internal Feature-based Similarity Computation ............................................................ 59

ix
5.4.2 Historical QoS Data-based Similarity Computation ..................................................... 64
5.4.3 Selecting Nearest Neighbors for the Prediction Process ............................................... 66
5.4.4 User Similarity Computation for Prediction Personalization ....................................... 66
5.5 Computing Predicted End-to-End QoS Values ....................................................................... 68
5.5.1 End-to-End QoS Prediction for Cloud Composite Services
with Two Component Services…………………………………….………………..…..68
5.5.2 End-to-End QoS Prediction for Cloud Composite Services
with Three Component Services…………………….……..………………………..…..70
5.6 Computational Complexity Analysis ..................................................................................... 71
5.6.1 Complexity of Similarity Computation ....................................................................... 71
5.6.2 Complexity of Prediction Computation ...................................................................... 72
5.7 Experiments ......................................................................................................................... 73
5.7.1 Experiments for the Three-Dimensional End-to-End QoS Prediction………….………74
5.7.1.1 Experimental Setup ......................................................................................... 74
5.7.1.2 Evaluation ........................................................................................................ 77
5.7.2 Experiments for the Two-Dimensional End-to-End QoS Prediction…………………...93
5.7.2.1 Experimental Setup ......................................................................................... 93
5.7.2.2 Evaluation ....................................................................................................... 94
5.8 Chapter Summary ................................................................................................................. 97
6 CONCLUSIONS AND FUTURE WORK 99
6.1 Conclusions.………………………………………………………………………………....…99
6.2 Future Work…………………………………………………………………………………..102
BIBLIOGRAPHY……………………………………………..………….………………………103

x
List of Tables
Table 4.1- The Aggregated Availability Values of Cloud Component Services and. ............................... 45
the Obtained End-to-End Availability Value
Table 4.2- The Aggregated Availability Values of Cloud Component Services and. ............................... 45
the Obtained En-to-End Response Time Value
Table 5.1- Data Mining SaaS Services ................................................................................................... 76
Table 5.2- Configration of Hosting IaaS Services................................................................................... 76
Table 5.3- Data Sets Accessed through Data Services. ........................................................................... 77
Table 5.4- Comparison of Differnet Approaches for Three-Dimensional QoS Prediction........................ 80
(Lower MAE Values Indicates Better Prediction Accuracy)
Table 5.5- Composed SaaS Services (Two-Dimensional Model). ........................................................... 94
Table 5.6- Comparison of Differnet Approaches for Two-Dimensional QoS Prediction ......................... 96
(Lower MAE Values Indicates Better Prediction Accuracy)

xi
List of Figures
Figure 3.1- Cloud Service Selection Process .......................................................................................... 34
Figure 4.1- Mapping Users’ QoS Requirements onto Multiple Cloud Layers ......................................... 38
Figure 4.2- Computing End-to-End QoS Values of Cloud Composite Services…………………………40
through our Mapping and Aggregation Process
Figure 4.3- Cloud Service Selection Example ........................................................................................ 44
Figure 4.4- QoS Mapping Efficiency Test .............................................................................................. 48
Figure 5.1- Architecture Model for Predicting Unknown End-to-End QoS……………………………...54
Values of Cloud Composite Services
Figure 5.2- QoS Tensor of Three Cloud Component Services (SaaS-IaaS-DaaS) .................................... 56
Figure 5.3- Experimental Environment .................................................................................................. 75
Figure 5.4- Impact of Tensor Density (Response Time) ......................................................................... 81
Figure 5.5- Impact of Tensor Density (Throughput) ............................................................................... 81
Figure 5.6- Impact of Number of latent Features (Response Time) ......................................................... 82
Figure 5.7- Impact of Number of Latent Features (Throughput) ............................................................. 83
Figure 5.8- Impact of K Value (Response Time) .................................................................................... 84
Figure 5.9- Impact of K Value (Response Time) .................................................................................... 84
Figure 5.10- Impact of IaaS Configuration on Response Time ............................................................... 85
Figure 5.11- Impact of IaaS Configuration on Throughput ..................................................................... 86
Figure 5.12- Impact of IaaS Location on Response Time ....................................................................... 87
Figure 5.13- Impact of IaaS Location on Throughput ............................................................................. 87
Figure 5.14- Impact of SaaS Function and Algorithm on Response Time ............................................... 88
Figure 5.15- Impact of SaaS Function and Algorithm on Throughput ..................................................... 89
Figure 5.16- Impact of User Location on Response Time ....................................................................... 90
Figure 5.17- Impact of User Location on Throughput............................................................................. 90

xii
Figure 5.18- Impact of data Size on Response Time ............................................................................... 91
Figure 5.19- Impact of data Size on Throughput .................................................................................... 91
Figure 5.20- Impact of Data Service Location on Response Time........................................................... 92
Figure 5.21- Impact of Data Service Location on Throughput ................................................................ 93

xiii
List of Abbreviations
QoS Quality of Service
SaaS Software-as-a-Service
IaaS Infrastructure-as-a-Service
DaaS Data-as-a-Service
DBaaS Data Base-as-a-Service
XaaS Anything-as-a-Service
SMI Service Measurement Index
AHP Analytical Hierarchy Process
COP Constraint Optimization Problem
OWL-S Web Ontology Language for Describing Semantic Web Services
MCDM Multi-Criteria Decision Making
TOPSIS Technique for Order of Preference by Similarity to Ideal Solution
SOA Service Oriented Architecture
SLA Service Level Agreement
PCC Pearson Correlation Coefficient
VM Virtual Machine
CSMIC Cloud Service Measurement Index Consortium
CSMI Cloud Service Measurement Index
MTTF Mean Time To Fail
MTTR Mean Time To Repair

xiv
MTBF Mean Time Between Fail
DPM Defects Per Million
TF Tensor Factorization
MF Matrix Factorization
MCSSTF Multi-dimensional Cloud Service Similarity Tensor Factorization
WSDL Web Service Description Language
PCC Pearson Correlation Coefficient
CSSMF Cloud Service Similarity Matrix Factorization
MAE Mean Absolute Error

1
Chapter 1
Introduction
Cloud computing has changed the way that software, development platforms and other hardware
resources are provisioned to end users over the Internet. Nowadays, they are provisioned in “as-a-service”
models wherever and whenever consumers want. Cloud-based services can be used by enterprises as well
as individuals as an agile solution to their operational and business problems. Cloud services provide
easy, on-demand and scalable access to software, development platforms, hardware resources which are
fully managed by cloud providers [1]. The leading cloud service providers (Amazon1, Microsoft
2, IBM
3,
etc) have built publicly accessible online marketplaces to facilitate the publication and searching of
different types of cloud services in a more convenient way which includes accessing services on demand,
paying per usage and managing automatic service elasticity to meet users’ requirements. With high
proliferation of cloud services (i.e. SaaS, IaaS and all other XaaS), the task of selecting the best of these
services that match users’ requirements has become more and more challenging. Cloud service selection
is the process of selecting the best cloud services based on a collection of Quality of Service (QoS)
properties (e.g. service response time, throughput, reliability, availability, cost, security) as the main
selection criteria. The selected services should satisfy users’ requirements with respect to these criteria.
1.1 Motivation
Nowadays, more and more enterprises have started to consider cloud-based IT solutions. Many
different types of cloud services such as IaaS (Infrastructure- as-a-Service), SaaS (Software-as-a-Service),
DaaS (Data-as-a-Service) and PaaS (Platform-as-a-Service) are being offered by the IT companies.
1 https://aws.amazon.com/marketplace
2 https://azure.microsoft.com/en-us/
3 http://www.ibm.com/marketplace/cloud/us/en-us/

2
Gartner estimates that the total spending on cloud services will rise to 250 billion dollars by 2017 [2].
Forbes estimates that SaaS service revenue alone will increase to $106B by 2016. It also estimates that by
2016, 80% of global enterprises will be using IaaS services [3]. ICD expects data service market to grow
at 26.24% annual growth rate to reach 41.52 billion by 2018 [4]. The high demand on cloud-based
services encourages the increasing growth of published cloud services by IT enterprises and individual
developers. Cloud-based marketplaces have witnessed exponential growth in the number and types of
services offered [5].
Cloud services implement what Service Computing community has long advocated since a decade
ago – separation of concerns. Every service provider only needs to focus on its own services, and rely on
other parties to provide other services which can collaborate with its services to deliver the end-to-end
solution to users. For instance, machine learning software services are offered through many
infrastructure services (e.g. Amazon EC2, Microsoft Azure, etc.), which may also be bundled with storage
services to store the input data and the results. In this kind of cloud environment, a typical cloud service
(e.g. software service) searching scenario would be like this: a user specifies her functional (what services
do) and non-functional (e.g. QoS) requirements on target service. QoS properties such as response time,
throughput, availability and reliability are a collection of services’ attributes and they are well known for
representing users’ non-functional requirements [6]. The selection system finds all functionally matching
services. If these services require the collaboration of other types of services (e.g., infrastructure,
platform, database, storage, etc.), the selection system should further find the collaborating services which
can work together with the candidate required services (e.g. software service). Eventually, the user needs
to do the mix-and-match job to select the complete solutions. Functional matching can be done based on
required services’ descriptions. Then these functionally matching services should be selected based on
their QoS properties. QoS-based matching should be done based on end-to-end QoS values, which when
multiple cloud providers work together to offer an IT solution, cannot be guaranteed by one single
provider itself. Despite this change in the service selection process, most of the service selection research
work still treats cloud-based services as traditional on-premise services whose QoS values are mainly

3
decided by one service provider [7], or some researchers study the selection problem mainly for
infrastructure services [8] or platform services [9]. The QoS matching process is a crucial process in
several operations such as service selection [10][11][12][13], ranking [14][15][16], composition
[17][18][19] and recommendation [20][21]. In the service selection domain, researchers rely on claimed
QoS values by providers or on monitoring tools to obtain the values.
We give an example that illustrates a cloud service selection scenario. Suppose an end user searches a
cloud system for a particular cloud service such as a data mining clustering service that should have a
response time of less than 2 seconds. The cloud system finds several services (likely from different cloud
providers) that provide clustering functionality which matches what the end user wants. However, the
discovered clustering services need to be hosted on infrastructure services (other type of cloud services)
to be made available to the end user. Some popular examples of infrastructure service providers are
Amazon EC2 and Microsoft Azure. The clustering services may also need to collaborate with other cloud
services to provide a complete solution based on the end user’s needs. For example, they might need to be
bundled with data services to access data stored in the cloud. The collaboration of different types of cloud
services (in this example, the collaboration happened between SaaS, IaaS and DaaS services) is often
required in order to offer a complete solution to the end user. The collaboration of different types of cloud
services in the cloud is referred to as vertical cloud service composition since these services implement
different computing models at different cloud layers [22]. In the example above, the problem of selecting
best cloud services remains unsolved. It is highly likely that the cloud system returns a large number of
cloud service compositions that match end users’ functional requirements. For example, the following
four cloud service compositions, which are vertically composed, are functionally equivalent: K-Means
clustering service from Weka+ Amazon EC2 + DaaS a1, hierarchical clustering service from Weka +
Amazon EC2 + DaaS a2, hierarchical clustering service from R + Amazon EC2 + DaaS a2 and K-
Means clustering service from R + Amazon EC2 + DaaS a1. In order to select and rank these four service
compositions, we need to get their QoS values. Our task is to process the selection and ranking of the four
service compositions based on users’ requirement on response time which is the only QoS requirements

4
in this example. Suppose for some of these service compositions, the response time values of only one or
two services are available but not for the whole composition. In this case, these response time values
cannot be considered as end-to-end values since one or two service providers cannot guarantee the
response time value of the whole service composition. In another case, no response time values are
available since service compositions are new. Therefore, we have to find a mechanism for computing
end-to-end response time values of vertically composed cloud services in order to be considered as valid
candidates during the service selection process. Since these four service compositions, which match end
user’s functional requirements, do not have end-to-end response time values, they are not considered
during the selection process. The question is: shall we exclude these unused or new service compositions
from the returned results? Our answer is no.
Based on the above analysis, in this thesis, we address the problem of services selection in the cloud.
We compute unknown end-to-end QoS values of vertically composed cloud services which functionally
match end users’ requirements. With the computed values, all cloud service compositions could
potentially be ranked and selected based on users’ QoS requirements, which in a way promotes a healthier
cloud service environment.
1.3 Contributions
The main contributions of this thesis can be described as follows:
1) We propose a new framework for computing end-to-end QoS values of vertical cloud service
compositions. Functionally matching cloud services need to collaborate with other services of
different types (services published at different cloud layers) in order to offer complete cloud service
solution to end users. In our framework, we emphasize that a QoS value should be end-to-end since
one service of a cloud service composition cannot guarantee the QoS value of the whole composition.
We use these end-to-end values during the cloud service selection process in the cloud. Our
framework is flexible so that any end-to-end computation component can be integrated to it. In our
framework, we propose a new process for cloud service selection; the process has three main steps:

5
i. Searching for the required cloud service (e.g. software, platform, etc) based on user’s functional
requirements.
ii. Vertically composing the discovered services with other available cloud services so that vertically
composed cloud services match end user’s functional requirements.
iii. Selecting and ranking the best of these functionally equivalent cloud service compositions using
their end-to-end QoS values. The selected compositions should satisfy users’ QoS requirements.
Our thesis considers the third step in the process. It provides a systematic method of computing
unknown end-to-end QoS values of vertically composed cloud services for the service selection in the
cloud.
2) We propose the first model for computing end-to-end QoS values for new and unused cloud service
compositions which are offered in a new cloud system. We map users’ QoS requirements to the
required cloud service and other collaborating services in a cloud service composition. QoS values
guaranteed by cloud providers at multiple cloud layers are then aggregated to obtain the end-to-end
QoS value of that cloud service composition. We designed three mapping rules that determine the
way that particular user’s QoS requirements are mapped to the required cloud services and other
cloud services in cloud service compositions. The mapping becomes necessary in this context because
one provider alone cannot guarantee the end-to-end QoS values.
3) We propose the second model for computing end-to-end QoS values for new and unused cloud
service compositions which are offered in an active cloud system. The proposed model predicts
unknown end-to-end QoS values of cloud service compositions which are offered in an active cloud
system where a history of QoS data is available. We identify similar cloud service compositions to the
target ones through our similarity computation model which utilizes historical QoS data and other
associated information of cloud services and users for computing the cloud service similarity. To
improve the accuracy of the QoS prediction results and to make the predicated values personalized to
target users, we also measure users’ similarity. Only QoS values of similar users are used during the
prediction process. In order to verify our proposed model for predicting unknown end-to-end QoS

6
values, we used historical end-to-end QoS data (response time and throughput) of cloud service
compositions collected from a cloud-based QoS data collecting and monitoring tool.
These contributions have been published in the following:
1. R. Karim, C. Ding and A. Miri, “An End-to-End QoS Mapping Approach for Cloud Service
Selection”, in Proceedings of the IEEE World Congress on Services, (Santa Clara, CA, USA), pp.
341-348, June 27-July 2, 2013.
2. R. Karim, C. Ding, A. Miri and X. Liu, “End-to-End QoS Mapping and Aggregation for
Selecting Cloud Services”, in Proceedings of the International Conference on
Collaborative Technologies and Systems, (Minneapolis, MN, USA ), pp. 515-522,
May 19-23, 2014.
3. R. Karim, C. Ding and A. Miri, “End-to-End performance Prediction for Selecting Cloud
Service Solutions”, in Proceedings of the IEEE Symposium on Service-Oriented System
Engineering, (San Francisco Bay, USA), pp. 69-77, March 30- April 3, 2015.
4. R. Karim, C. Ding and A. Miri, “End-to-End QoS Prediction of Vertical Service
Composition in the Cloud”, in Proceedings of the IEEE International Conference on
Cloud Computing (IEEE CLOUD), (New York, USA), June 27-July 2, 2015.
5. R. Karim, C. Ding and A. Miri,” End-to-End QoS Prediction Model of Vertically Composed
Cloud Services via Tensor Factorization”, in Proceedings of the IEEE International
Conference on Cloud and Autonomic Computing, (Cambridge, MA, USA), September 21-
24, 2015.
6. R. Karim, C. Ding and A. Miri, “Hybrid Model for Predicting End-to-End QoS Values of
Vertically Composed Cloud Services”, IEEE Transactions on Service Computing, 2015
(under review).
1.4 Thesis Assumptions
In this section, we state the assumptions we made in this thesis as follows:

7
Any other types of service feature interactions rather than the proposed service features in the
thesis are not considered during the prediction process.
Throughout the thesis, we use the term “end users” to refer to individual users but not the
following: enterprises, computer programs or services.
In user profiles, we only consider user locations but not other types of information.
All discovered cloud component services functionally match users’ functional requirements.
However, the process of service discovery is out of the scope of this thesis.
Horizontal service composition occurs when multiple services published at the same cloud layer
(usually software services) are composed together following a business process or workflow.
Horizontal service composition is out of the scope of this thesis.
1.5 Thesis organization
The rest of the thesis is organized as follows:
Chapter 2
In this chapter, we review background information and related work on QoS mapping and QoS
prediction in cloud environments.
Chapter 3
In this chapter, we introduce our framework for computing end-to-end QoS values of cloud service
compositions. We discuss the core components of the framework: QoS modeling and mapping and
QoS prediction models. We define QoS properties of cloud services and then we discuss in details the
steps required to perform the QoS-based service selection process in the cloud.
Chapter 4
In this chapter, we present a new model for mapping users’ QoS requirements to required cloud
services and other collaborating services at different cloud layers. We propose rules for mapping QoS

8
requirements, and QoS values of the involved services are aggregated across cloud layers to obtain
end-to-end QoS values of cloud service compositions.
Chapter 5
In this chapter, we propose a model for predicting end-to-end QoS values of vertical cloud service
compositions. We consider n cloud component services that are vertically composed to provide
complete cloud solutions to end users. Some services that very well match users’ requirement have no
end-to-end QoS values, so they cannot be considered in the selection process and they would be
excluded. To overcome this problem, we use historical QoS data and other information of similar
cloud service compositions in order to predict unknown end-to-end QoS values of target service
compositions. The experimental study shows that our proposed model outperforms other well-known
approaches in predicting unknown QoS values of cloud service compositions. We analyze the
accuracy of the QoS prediction of the proposed model in various settings.
Chapter 6
In this chapter, we conclude the thesis and provide some future directions that can be investigated to
complement the work presented in this thesis.

9
Chapter 2
Literature Review
In this chapter, we review work related to the scope of our thesis. QoS is the key feature of cloud services
that are often used to perform different operations such as service selection, ranking and composition.
Since our work span multiple fields of cloud service operations, this chapter is divided into multiple
sections that correspond to these fields:
QoS-based Cloud Service Selection and Ranking
QoS-based Cloud Service Recommendation
QoS-based Cloud Service Composition
QoS Mapping and Modeling
Cloud-based QoS Prediction
2.1 QoS-based Cloud Service Selection and Ranking
The advent of cloud computing has attracted enterprises to develop and publish their different types
of services in cloud environment such as cloud marketplaces. Cloud services have been published to offer
different functionalities to suit end users’ needs. QoS- based cloud service selection is the process of
selecting the best cloud services that satisfy end users’ QoS requirements among functionally matching
cloud services.
He et al. [23] proposed an optimization model of service selection for multi-tenant SaaS. SaaS
developers compose appropriate services based on different QoS constraints of multiple users. It also
considers achieving SaaS optimization goal (less price and high performance). This is performed by
modeling the problem as constraint optimization problem (COP). A cloud service selection framework is
10
introduced in [24] that consists of three parties: a cloud provider, a cloud user and a broker. The latter
extracts the QoS properties from the providers and QoS requirements from users. An indexing technique
was developed using tree to index the providers according to their similarities. The designed cloud
broker task is to search the index and select providers that match users’ requirements. However, the
indexing process does not consider the different types of services and computing models that these
providers provision and how they impact on the indexing results. Li et al. [25] proposed a QoS-based
model for cloud service selection. The objective of their work is to select a set of optimal services with
minimal response time values for wide area users. Two cases were considered during the selection
process. The first one is when a task is represented with one service, and the second case is when the task
is represented with multiple services. In the proposed model, the distances between services’ locations
and users’ locations are calculated. Two algorithms were proposed for the two cases. For the first case the
algorithm selects the optimal service using a greedy technique. The second algorithm selects the set of
optimal services based on the satisfaction of majority of users. In [26], Beran et al. discussed and
implemented multiple versions of genetic programming and blackboard algorithms for QoS-based
optimization and selection. These algorithms have been deployed in cloud framework for a comparison
purpose. Google App PaaS model was chosen for the selection framework. In their work, a single
computing model (PaaS) was considered for deployment, and it was not clear what QoS attributes that
have been considered for the optimization and selection process.
Multi-Criteria Decision Making was often used as an optimization method for the selection process.
Rehman et al. [27] proposed an approach for IaaS service selection that utilizes QoS history over different
time slots. IaaS services are ranked using a MCDM method called TOPSIS. IaaS services are ranked at
different time slots and then the ranking results are combined to get the overall service ranking. Although,
the proposed approach uses historical data for the selection process, it does not utilize data based on
composition of other services with IaaS, which could have an impact on the type of the collected data. In
[28], a comparative study was introduced to select the best cloud service based on performance. The work
considers a single layer (i.e. IaaS service) in the proposed selection framework. Two Multi-Criteria

11
Decision Making approaches have been employed for the selection process, Multi-Attribute Utility
Theory and outranking methods. The work showed a case study of the selection results using these
approaches. However, the accuracy of their results was not verified. In [29], Zhanlin and Lingchang
proposed a SaaS service selection model with interval numbers for group user. In the proposed model,
users’ preferences, and QoS expressed by interval numbers are considered. The SaaS alternative services
are selected and ranked using a MCDM-based TOPSIS ranking method.
QoS-aware cloud service ranking approach also attracted some researchers in the field. In [14], Greg
et al. used optimization to model QoS constraints and eventually select the cloud services. The model is
designed using the CSMI QoS properties which calculate QoS values based on services’ offers. A
framework is proposed to handle the QoS management, monitoring and services ranking. The AHP
method is used for optimizing the QoS criteria and rank cloud services. In [30], Zheng et al. introduced a
component ranking framework for building fault tolerance cloud applications. Two algorithms have been
proposed. The first algorithm identifies and ranks significant components from a large number of
components available in the cloud. The ranking is calculated based on how frequently the components are
invoked. The second algorithm selects the optimal fault tolerance strategy for each significant component.
Two criteria are employed for strategy selection: response time and cost. The ranked components with
their fault tolerance strategies are returned to a cloud designer for building cloud applications.
In all above discussed work, the proposed approaches deal with a single cloud layer to select and rank
services. In cloud environments, services usually are composed with other services often from different
cloud layers so that whole cloud solutions offered to end users; therefore, the traditional way of service
selection is not suitable for cloud services. In our work, we consider multi-layer cloud service
provisioning approach where we vertically composed cloud services in order to perform the selection in
the cloud.

12
2.2 Cloud Service Recommendation
Recommender systems provide users with suggestion about items they are likely to be interested in
such as what book to read and what movie to watch next. Recommender systems are classified into three
main groups: collaborative recommendation, content-based recommendation and knowledge-based
recommendation. The idea of collaborative filtering is that if users shared the same interest in the past for
common items, it is highly likely they share the same interest in the future. So, if their histories are
strongly correlated, and one user is interested in purchasing an item, it is wise to suggest that item to the
other user. The idea of content-based recommendation is to exploit item descriptions and user profiles to
recommend items to users. For example, extracting movie information such as movie genre and actors
and matching them with users’ feedback or explicit questionnaire results can lead to recommending
movies to users. The idea of knowledge-based recommendation is to use technical and quality features of
items by exploiting additional knowledge for recommendation. The main difference from the above two
recommendation groups is that the historical data are not required to make recommendation [31].
In cloud service recommendation domain, the same concept is used. For example, if user1 and user2
observed similar QoS values (service performance values) when they have invoked common cloud
services (e.g. Amazon EC2 IaaS service), they are considered similar to each other with respect to their
QoS observation. This mechanism is important since it can be used to predict a user’s future QoS values
using the history record of a similar user. However, in cloud-based recommender system, instead of
traditional rating structures used for recommending items to users, cloud services’ QoS properties are
employed to recommend and select services to users based on their requirements of QoS. The main
difference between the QoS-based recommendation and the QoS-based selection processes is that the
former highly relies on historical information from past experiences and how items or users behave in the
past. Recommender techniques are used to analyze this type of behavior in order to perform the
recommendations. However, the selection mainly relies on the item (e.g. cloud service) itself by
13
evaluating its QoS properties. An item is selected based on how well it performs in terms of these
properties using optimization techniques.
In [32], Pereira et al. introduced a recommender system that computes online similarity of items and
users. The system makes use of cloud resources to scale up and down with different scales of input data.
The objective of running the systems on real scenario is to demonstrate its efficiency. The system has
been deployed in Amazon EC2 platform and it was evaluated against two criteria: performance and cost.
Although, the proposed system was deployed in a cloud environment, the similarity calculation process
which represents the core function of a recommendation system does not consider the tested video
application (SaaS) and the Amazon EC2 servers as two cloud computing models and the similarity was
only calculated for the video application. In [33], Zheng et al. proposed a service recommender system
that uses a collaborative filtering method to recommend and select services. Historical QoS data of similar
users to an active user, who have similar QoS experiences when they invoked common services in the
past, are employed to predict QoS performance of a service for the active user. In the propose system,
both users and services information are employed in collaborative filtering method. The prediction is
performed based on the similarity measurements of users and services, and then missing QoS
performance values are predicted using information of both similar users and similar services. The final
prediction was computed by combining both predictions.
Some of current estimation approaches mainly rely on whatever QoS values cloud providers claim to
have. Other approaches use monitoring tool to collect QoS data and then averaged values are computed,
thus estimated QoS values could be largely different from what expected by the users. In [34], Yu et al.
proposed a framework that takes into account users’ experiences on QoS to achieve a personalized QoS
estimation. The user centric approach is based on the fact that users with similar historical experiences
have also similar features such as physical distance to servers. This implies that these users have similar
behaviors in future. Similar users and similar cloud services are grouped together in forms of
communities. To create these communities, the adopted approach builds upon the matrix factorization

14
model. The latter has the capability to capture latent features such as users and cloud services locations
which can be used to refine these communities.
In [35], Zhang et al. proposed a real time QoS-based cloud service selection using MCDM method,
specifically the AHP algorithm. The work is designed to help users choose IaaS services that suite their
defined requirements. Using AHP algorithm facilitates the selection process using multiple criteria related
to IaaS resources such as CPU, memory, operating systems. The optimization problem addressed in this
work includes defining cost estimation and estimation function using resource utilization estimations, and
a benefit-cost ratio-based evaluation function which considers weights. Then a pair-wise comparison is
presented to normalize weight. In [36], Han et al. proposed a cloud- based service selection model. In
their model, a recommendation system is used to recommend to the user the best service from different
cloud providers who registered in the cloud market. The recommender system will measure how user
requirements are met by cloud service providers and then rank cloud services to the end users to select the
appropriate one. The underlying selection mechanism is based on assessing QoS attributes that are chosen
by the authors such as execution time, reliability, availability, throughput, user feedback and cost.
One of the key features of our proposed model is the vertical composition of cloud services when
computing the similarity. The rationale is that if two cloud services are similar to each other with respect
to some QoS attributes they can no longer be considered similar after they have been combined with
other cloud services from different types unless a new similarity process is performed. In this work, we
demonstrate the impact of considering the multi-layer cloud architecture on the similarity results. Our
model computes the similarity for multiple cloud services which are combined together as a complete
solution.
2.3 Cloud Service Composition
A basic definition of service composition is: the process of determining the collection of atomic web
services that should be selected such that service combination satisfies both user’s functional and non-
functional requirements [37]. The prerequisite processes to the service composition are service discovery

15
and service selection. Therefore atomic services have to be discovered based on users’ functional
requirement then selected based on users’ non-functional requirements. For example, a user requests a
travel service online. It should offer a combination of flight booking, hotel reservation, car rental, map
services and any other related services. Each of these services is discovered based on users’ functional
requirements and then selected among a large pool of similar services based on users’ non-functional
requirements (e.g. service response time, availability, cost, security, etc). When combined as a service
composition, users’ functional and non-functional requirements still have to be met by the composite
service [38].
In the literature, two classifications of service compositions in the cloud have been introduced. They
are a Dimensional and a vertical modality-based composition. The dimensional-based classification refers
two different paradigms. A composition of heterogeneous services such as storage, compute unite, and a
composition of homogenous services such as multiple storage services to increase the storage capacity.
The modality classification refers to the way that a user consumes a service composition system, a one
time or persistent composition. In the one-time composition, a service composition system receives a
request from a user and returns the result. No more communication between the user and the system
happens after that. An example of this case is when a user requests travel services. In the persistent
composition, a user needs to use the composition system for long time such as using IaaS services to
provide access to cloud applications [39]. The modality classification is also supported by [40]; however,
they argued that cloud-based service composition should only be for long term and economically driven.
For example which service composition to use in the next few years depends on which one performs the
best, despite the fact that it may not perform well at a certain time.
Recently, several work have been introduced that tackle the problem of service composition in cloud
environments. In [40], Bao et al. proposed a web service composition tree-based approach for web service
composition in cloud environment. Their work considers composing web services, which provide
required tasks by users, within the Software-as-a-Service (SaaS) layer. The assumption made in this paper
is that a SaaS service provider publishes a group of dependent application services with a restriction on

16
invocation sequences. The Finite State Machine based model aims at composing optimal services from
communities of services using aggregated QoS properties. A typical example is listed in which a user
requests multiple service applications booking for flight, train, hotel and renting a vehicle. In [41], Pham
et al. proposed an agent-based High Performance Computing service compositions framework. Ontology
is used as a knowledge base for discovering cloud services and their dependencies. The agent parses
requests using the knowledge base to resolve the dependencies and retrieve relevant services for the
composition stage. The result of composition is a new service specification which has information of the
required components and their dependencies. The specifications are used by the agent to update the
knowledge base for later uses. Then the specifications are forwarded to a specific engine to pack all
required software services as a new composition. In [42], Wu et al. proposed a Hidden Markov Model
(HMM) based prediction model for cloud service compositions. The main idea is that if existing services
do not match users’ requirements, compositions of services are considered for QoS matching process. The
paper proposed to predict QoS using HMM. This work has been designed specifically to simulate and test
cloud storage services. The model neither considers the complexity of QoS prediction process nor the
multilayered cloud architecture when composing cloud services. In [43], a game theory model was
proposed to regulate the service offering and consuming between users and cloud providers. The
regulation is set up using SLA which must be signed by both parties. The paper mainly focused on IaaS
layer as users request computing components (e.g. CPU, memory, storages, etc). A composition of this
type of services is needed for applications at the top layer. In [44] a cloud-based semantic based service
composition model was proposed. It uses Bayesian decision to analyze cloud-oriented semantic web
service compositions. The model has been analyzed on Amazon EC2 infrastructures for effectiveness and
feasibility. The proposed approach mainly consider service discovery as a prerequisite step for cloud
service composition.
The above work tackle the service composition problem in cloud environments. They consider a
single cloud layer where multiple services are published. The surveyed cloud composition models
completely ignored the important fact that a requested service by a user need to be composed with other

17
cloud services, often from different layers so that end-to-end solutions are provisioned to end users based
on their requirements. This common scenario requires a new way of computing QoS values which are
offered by matching cloud services since one provider cannot guarantee a solution’ overall QoS value.
Examples of cloud-based service compositions are composing multiple SaaS applications or composing
different computing units of IaaS services. Our proposed QoS prediction model is designed based on
composing cloud services from multiple cloud layers. A realistic scenario would be when an end user
submits her requirement to a cloud service selection system, the required cloud service (e.g. SaaS service)
needs to be composed with an IaaS (a different cloud layer) in order for the SaaS service to be accessed
by the end user. Furthermore, the SaaS service might need to be bundled with a different service such
DaaS service. The composition of the three service types represents an end-to-end solution.
2.4 QoS Modeling and Mapping
In the recent years, a few researchers have proposed QoS models and mapping in cloud environments.
They considered using semantic-based approaches to define concepts related to cloud service models,
cloud deployment models, cloud service functionalities and resources. The proposed models attempt to
facilitate a variety of service related activities such as service discovery, ranking and selection process,
service performance measurement and multi-tenancy workload balancing. This section surveys work
related to semantic-based QoS modeling and QoS mapping.
2.4.1 QoS Modeling
Cloud-based QoS modeling has attracted some researchers to propose QoS models in the cloud which
define QoS properties, cloud resources and facilitate different operations such as cloud service discovery
and composition at a single cloud layer. In [46], Zhang et al. proposed ontology that defines functional
cloud service descriptions and non-functional service configurations of IaaS services. It is built upon
standard semantic technology (OWL-S). The ontology has two parts: functional service configuration and
non-functional service configuration. It defines detailed concepts of IaaS properties and their
18
measurement units such as compute, storage and network. The aim is to select an appropriate IaaS service
for users. In [47], Chen et al. proposed a QoS model that considers software services deployed in the
cloud. It has two aspects of the QoS in the cloud: QoS concerns and QoS properties. The latter describes
the cloud resources performance and price. The former describes the QoS constraints, influence and QoS
weights. They further evaluate the model from the user’s perspective by calculating weighted sum of
users’ satisfaction with respect to the QoS concerns using the Analytical Hierarchy Process (AHP)
method. In [53], Ngan et al. proposed a cloud service selection brokering system which is based on OWL-
S. The system semantically represents the service constraints using SWRL rules and supports the dynamic
matching of services described with these constraints. The brokering system facilitates the service
discovery process through semantic definitions of advertised cloud services. In [49], Fortis et al. proposed
architecture for cloud management that supports different concerns of cloud services such as service
definition, characterization and service lifecycle which facilitate easy service discovery and composition.
The proposed architecture has four subsystems: management, security, services and audit. As a way to
facilitate service discovery automation, service lifecycle ontology is proposed that defines different
concepts like semantic descriptor, offer, contract, instantiation and running. In [50], Han et al. proposed a
cloud service discovery system that finds cloud services based on users’ requests. Ontology-based
solution was adopted that determines the similarities between advertised services. It represents relations
among cloud services to facilitate the discovery process. A cloud service reasoning agent consults with
the cloud ontology to reason about services relations. The services similarity is calculated through the
agent that uses three reasoning methods: similarity reasoning, equivalent reasoning and numerical
reasoning. In [51], Moscato et al. presented ontology that facilitates creating, promoting and exploiting an
open-source cloud application programming interface. The objective is to gain easy access to
heterogeneous cloud resources. Common user interfaces are developed to enable intelligent service
discovery and composition and to allow management of SLA among cloud services. Several independent
ontologies are presented which represent different cloud computing interfaces: language, deployment
models, actors, and functional and non-functional properties. In [52], Martino et al. presented an attempt

19
to develop a functional ontology for defining characteristics of cloud services and virtual machines. The
authors chose specific vendors for their proposed ontology (i.e. Amazon EC2 VMs). The goal of the
ontology is to help customers select the best services that suite their needs. Some of the defined properties
are images, operating systems and vendors. Their purpose was to define relations between cloud services
and virtual appliances as individuals for these specific functionalities they provide. In [53], Modica et al.
presented several ontologies that semantically describe and capture vendors’ offers and users’ demands
from business perspectives. They mainly focus on the functional aspect of cloud services’ offers in open
markets. The ontologies provided in this work are: application ontology which represents different cloud
applications, support ontology which represents supports that customers need to use offered services,
SLA ontology which describes functional and non-functional requirements, market ontology which
describes different market concepts such as participants, market types and resource allocations, and offer
and request ontologies which build up vendor and customer domains respectively. In [54], Rodriguez et
al. proposed a dynamic semantic service composition solution. It considers multiple QoS attributes and
minimizes the number of services produced by the service composition system. A multi objective
Dijkstra-based algorithm was proposed that finds the optimal composition.
The above QoS models attempted to provide definitions for cloud services and associated QoS and
functional concepts; however, they have the following drawbacks: 1) the proposed QoS models consider
only a single cloud layer and one service type (e.g. IaaS), 2) most of the existing models consider the
functional aspect of advertised services in order to facilitate the service discovery process through
reasoning. With respect to the first limitation, the proposed QoS model failed to represent the
collaboration required between cloud services to provide end-to-end solutions to end users as they only
consider one service layer. As a consequence, end-to-end QoS value of a whole cloud service
composition cannot be obtained. With respect to the second limitation, since the proposed semantic-based
QoS models are to discover cloud services based on users’ demands, the QoS information are not the
main consideration which makes these models not very suitable for QoS-based service matchmaking. Our
proposed model in [55] defines different types of cloud service and an end user entity. It establishes

20
relations between QoS requirements and QoS guarantees at multiple cloud layers. An agent can use our
defined rules to map and aggregate QoS values guaranteed by cloud services at different cloud layers.
2.4.2 QoS Mapping
Researchers in other research domains (e.g., multimedia and network systems) proposed to use QoS
mapping to deal with the problem of provisioning different QoS across multiple system components.
They believed that user requirements should be understood over different components and the mapping
should be performed through a controlled process so that requirements could be properly mapped to the
right network components. In [56], Marchese et al. proposed a model for vertically mapping QoS between
upper and lower layers of a wireless network. In order to provide an end-to-end QoS guarantee over the
heterogeneous networks to users, the concept of abstract queue is used to model the QoS mapping by
decomposing it into different problems at each network layer. In [57], Rakas et al. proposed a QoS
mapping model for multi-user sessions in network systems. The model considers multiple users who
submit their requirements, and maps them onto the most suitable network service class. A QoS adaption
mechanism is also used to overcome the problem of QoS derogation due to network problems. In [58],
Battisti et al. discussed mapping service providers’ QoS to users’ quality of experience in multimedia
services. The proposed model is based on the argument that QoS of service providers not necessarily
represents users’ opinions and overall experiences. Also, QoS experienced by users is costly and complex
to measure and obtain. The paper compares the performance of some well-known mapping models and
recommends optimal model based on different parameters such as delay, jitter and packet loss rate and
throughput limitation. In [59], Gao et al. proposed a QoS mapping mechanism in an integrated
UMTS/WLAN networks. Both networks are different in geographical coverage and computational
complexity, so their QoS provisioning levels are also different. Therefore, in order to guarantee users’
QoS, QoS mapping in integrated networks is required. The proposed mapping mechanism is applied
horizontally on the application level in order to support end to end QoS and minimize the service quality
degradations. In [60], Hsu et al. proposed to map network QoS parameters into users’ quality of

21
experience in cloud-based multimedia infrastructure systems. The model has three components: QoS
function, practical measurement and statistical analysis, and a simulated streaming video platform. The
practical measurement component collects scores assigned by users to a number of videos and then it
analyzes the scores to find optimum values to the quality of experience parameters. The proposed model
can monitor and adjust users’ quality of experience if its value degrades. This enables video providers to
respond quickly to poor quality of experience perceived by users.
The above mapping models deal with the QoS mapping process in different environments (e.g.
network and multimedia systems). These systems are not cloud-based and thus their associated QoS
properties are mapped and aggregated differently. The mapping process proposed in these work is based
on propagating (transferring) QoS information from one layer (e.g. a network layer) to a lower layer (e.g.
a physical layer). Therefore, QoS data need not to be aggregated across layers or components. For this
reason, in the surveyed work, no aggregation models have been used or proposed.
Our approach provides concrete definition for mapping relationships between user’s QoS requirements
and QoS guarantees of multiple cloud services which participate in composing service solutions for end
users. Our goal is to compute the end-to-end QoS values of cloud service compositions. In our approach,
we consider the collaboration between multiple cloud services at multiple cloud layers. Then we map
user’s QoS requirements onto a required cloud service (e.g. SaaS service) and other collaborating cloud
services. We use aggregation models that aggregate QoS values at multiple cloud layers and calculate
end-to-end QoS values of cloud service composition which can be used for the cloud service selection
process.
2.5 QoS Prediction
Using prediction approaches for computing QoS values have been proved to be robust and reliable
approach [61][62]. They are widely accepted among cloud service research community to predict various
types of service metrics such as performance, reliability, workload and cost. These metrics are important
for estimating cloud resources required to run applications and for satisfying users’ requirements in terms

22
of scalability and workloads. The surveyed work used two different approaches to process the prediction:
collaborative recommendation techniques and optimization and model- based techniques.
2.5.1 QoS Prediction using Collaborative Recommendation Techniques
The collaborative recommendation techniques have been broadly used in the literature to solve the
problem of predicting services’ QoS values. In [21], [62] and [34], a collaborative filtering approach was
employed for predicting QoS values. Users’ contributions of their past usage information are considered
for the prediction process. The Pearson Correlation Coefficient (PCC) is used to measure users’
similarities as well as services’ similarity. The prediction is done using information of neighbor users of
an active user for whom the QoS is calculated. Although the paper claimed the efficiency of their
approach, the prediction model only fits on-premise services in a two dimensional similarity and
prediction process. Similarly, in [63], Sun et al. proposed a model for predicting QoS values of web
services for an active user. The values are computed by employing QoS information of other similar users
who have similar QoS experiences from previous service invocations. Their work is extended from a
previous one [64], so that the similarity between users takes into consideration the range of QoS values
experienced by different users. In [61], Zhang et al. proposed a model to generate recommended services
to end users. The similarity between users is computed using the PCC technique combined with a fuzzy
clustering algorithm since users may have different properties. In [65], Zheng at al. introduced a
collaborative service reliability prediction model. The information obtained from similar users who
observed past failure data when invoked common services are employed to predict reliability values for a
current user. The PCC method is used to compute users’ similarities. Then a missing reliability value is
predicted using average failure probabilities of different services invoked by a current user and its similar
users. In [7], a QoS ranking framework for cloud services is proposed. The purpose is to make optimal
service ranking among functionally matching services. The Kendall Rank Correlation Coefficient is used
to measure users’ similarity. A greedy-based algorithm is proposed to generate a ranked list of cloud
software applications. The work only considers ranking SaaS applications using their QoS values. It does

23
not provide a mechanism to compute QoS that span all involved cloud services for ranking SaaS
applications. In [66], Wu et al. proposed a QoS model that employs an adjusted cosine similarity
technique to measure users’ similarity. This technique minimizes the impact of different QoS scales
among similar users to an active user. A data smoothing process is adopted by calculating the average
QoS within a cluster of similar users.
The above work can only handle the similarity and the prediction processes for on-premise services (a
one component service) in a two dimensional model (services vs. users). Therefore the similarity
calculation is always a two-dimensional process. In our work, we consider multiple cloud component
services which collaborate with each other to offer a complete solution (cloud service compositions). We
designed our prediction model to handle the similarity and the prediction computations of cloud
composite services (a composition of multiple component services) taking into consideration users’
similarities as well.
Exploiting information related to services and their users for predicting services’ QoS values has
become a common research trend. However, besides considering single layered cloud architecture, most
of the existing research work solely concentrate on using services’ or users’ locations as the only feature
to help predicting QoS values. The work in [62], [67], [68], [69] and [70] used geographical locations of
on-premise services or locations of users to calculate services’ and users’ similarities for the prediction
process. Some common techniques to calculate geographical distances are using longitudes and latitudes,
Autonomous Systems and IP addresses. The idea is that users or services located in the same region or
within short distances have similar QoS experience.
Another collaborative recommendation technique that has been recently adopted to solve the
prediction problem is Matrix Factorization techniques (MF). It has been considered by researchers as an
improved collaborative filtering method for its latent features. In [71], both user neighborhood and service
neighborhood were computed using the PCC technique. Then a MF-based model is used to minimize the
difference of latent features among users in the same neighborhood. In [72], a QoS prediction framework
was proposed in which shared QoS information by different users are employed to find users’

24
neighborhoods. The neighborhood is obtained via the PCC technique which represents a set of similar
users with similar QoS experiences. In [73], in order to perform an efficient QoS prediction, domain
knowledge was combined with a MF model. A local neighborhood of users is defined to create a latent
factor space of low dimensionality based on user information. The local information is formulated as two-
level selection process in a MF model. In [34], a user-centric framework was proposed that takes into
account users’ experiences on QoS to achieve a personalized QoS estimation. The user centric approach is
based on the fact that users with similar historical experiences have also similar features such as physical
distance to servers. This implies that these users have similar behaviors in future. However, to make the
prediction more accurate the services’ information has to be taken into account. Hybrid collaborative
approach can enhance the recommendation result and overcome the disadvantages of the recommendation
approaches. On the other hand, the work (similar to most of cloud-based recommendation work) does not
consider the multiple cloud layers architecture of the provisioned solutions. In [74], a probabilistic MF
model is proposed for predicting on-premise services’ QoS values. First, latent features of users and
services are learned within a basic model. Then, location-based model in which QoS values of a user and
their neighbors is incorporated in the basic matrix factorization model. In [75], a QoS prediction model
for cloud applications is proposed. In this work, latent features of users and cloud applications are
explored and employed via MF to produce QoS prediction matrix.
In other work, temporal dimension is considered during the prediction process. For this, tensor
factorization models are proposed. Tensor factorization is a generalized form that includes matrix
factorization as a specific case of two dimensions. In [76], Zhang et al. proposed to use tensor
factorization to predict missing QoS values. Three aspects are considered for collecting QoS data; user
information, service information and time-aware information. The tensor factorization was used to learn
users’, services’ and time features. By learning the three aspects, missing QoS values are predicted for a
specific service observed by a specific user during certain time intervals. Similarly, in [77], a tensor
factorization model is proposed to predict on-premise services’ QoS values. The model is based on an
extension of a user-service model by adding temporal dimension into it and presenting it as a tensor

25
factorization. Three components are included: users, services and time of services invocations. Initially,
the tensor has sparse QoS data. By employing users’ collaborative QoS information from past
invocations, the temporal QoS prediction is performed to predict missing QoS values. The tensor
factorization models in both [76] and [77] were designed to factorize two matrices (on-premise services
and users matrices), so the learning process is based on information of two dimensional models. The
designed structures of the proposed models cannot capture information of multiple cloud component
services collaborating with each other as an end-to-end solution.
The above work (the collaborative recommendation including the MF-based work) can only consider
two dimensional setting of on-premise services and users. The main hypothesis is that an on-premise
service is provisioned as one component service which could match user’s functional requirements.
Therefore, the matrix factorization-based models proposed in all above work cannot handle cloud
composite services where multiple services from different computing models collaborate with each other.
The similarity and prediction processes, in this case, need to consider the new structure of cloud service
provisioning environments which existing collaborative models do not.
In our work [78], we have designed a QoS prediction model using tensor factorization that can
handle multiple cloud component services which constitute cloud composite services. In our model, the
learning process is based on observed QoS data and other information associated with multiple cloud
services. In order to improve the accuracy of the predicted QoS values, the learning process includes
integrated data and information of similar cloud composite services to a target cloud composite service as
well as data and information of similar users.
2.5.2 QoS Prediction using Optimization and Model-based Techniques
This section reviews related work which exploit the advantages of optimization and model-based
technique to make different types of predcitions (e.g. performance, workload, cost and relaibility). Our
main observation is that existing predcition approaches mainly consider a single cloud layer that is IaaS
layer. The reason is that IaaS providers primarly are responsible for cloud resource management which

26
includes important task such as load balancing, resource allocation, scheduling, fault tolerence, etc. In [8],
Rehman et al. proposed a methodology for selecting cloud services using MCDM techniques. The
proposed framework uses the QoS history data of IaaS services and ranks these services. The work refers
to historical QoS data to assist users making appropriate decision for selecting the best services. However,
the proposed method ignores the fact that a selected cloud service should consider cloud multiple layers in
order to respect users’ end-to-end QoS requirements. In [79], Qazi et al. proposed a workload prediction
method for VMs that exploits past behaviors including geographical location information. The goal is to
predict VMs’ workload. In [80], Imai et al. proposed a computing resource prediction model for hybrid
cloud that estimates the resources based on a specific workload. The paper introduces the notion of
workload –tailored Elastic Compute unit to measure the predictability power and present a dynamic
programming-based scheduling algorithm to select resources that satisfy the desired throughput. In [81],
Zhang et al. proposed a performance prediction framework to accurately predict computing resources for
cloud computing-intensive applications. The proposed prediction model is based on measuring the
computation time and the communication time. However, their prediction mechanism involves high
computational and time complexity. This is due to the need for looking up scaling blocks in client’s
application, creating a prototype version of it and then replaying it in the cloud for the purpose of
performance prediction. In [82], Fan et al. proposed an execution time prediction model for job scheduler
by utilizing the Rough Set Theory (RST). RST uses historical data to perform the prediction so the job
scheduler informs the user the time that the job starts and terminates. The proposed model ignores the
execution time of the job processing and only focuses on the VMs’ time. In [83], Tsai et al. proposed a
cloud utility service prediction algorithm that estimates the number of services needed to serve service
requests (throughput) from users. Different parameters are considered in the proposal: service requests
rate, the number of services and the number of requests served at a given time. The Poison probability is
used to estimate the number of requests arriving at a particular time and to assign the required number of
services. The goal is to use a minimum number of services that handle a certain number of requests.
Although the authors consider SaaS services, the proposed model only considers IaaS service prediction

27
to estimate the number of services needed based on users’ requests. In [84], Bankole et al. presented a
predictive approach to cloud resources (CPU, Storage, memory, etc) that helps scaling decisions ahead of
time to predict future demands on resources and compensate for the delay in starting up VMs. However,
the scope of this work concentrates on the IaaS cloud model. The general theme of cloud-based QoS
prediction approaches is that single services are considered for predicting missing QoS values. The multi-
layers cloud architecture is completely ignored in the proposed models so the computed QoS values do
not reflect end users’ requirements which can only be satisfied by using end-to-end values.
In this thesis, we propose an end-to-end QoS computation model for cloud service compositions of
vertically composed cloud component services. We consider a vertical composition since a required cloud
service by an end user needs to be composed with other services published at different layers in order to
provision end-to-end solutions to end users. Therefore, from an end user’s perspective, QoS matching
between her requirements and cloud services’ QoS guarantees must be end-to-end process. Different from
the existing approaches which only deal with single component in the cloud to compute QoS values , our
work considers multiple cloud component services of cloud service compositions during the similarity
computation and the prediction processes in order to compute end-to-end QoS values of the compositions.
We provided two solutions to the problem of end-to-end QoS computation. The first solution deals with a
scenario in which cloud service compositions have not been invoked before, thus no prior history is
recorded. In this case, we map users’ QoS requirements to multiple cloud layers where QoS values of
atomic component services are guaranteed. The second solution deals with a scenario in which historical
QoS data are available based on past invocations. In this case, we predict QoS values of cloud service
compositions based on end-to-end QoS matching in which we compute the similarity between the
compositions with respect to their multiple component services.

28
Chapter 3
A Framework for Computing End-to-End QoS Values of
Vertical Cloud Composite Services
In this chapter, we introduce our proposed framework for computing end-to-end QoS values of vertical
cloud service compositions. In the first part of the chapter, we provide detailed descriptions of cloud
services’ QoS properties, their classifications and characteristics. We adopt QoS properties in this
framework as differentiating criteria to select the best cloud service compositions. In the second part, we
introduce a new process of cloud service selection. The major task of the framework is to compute the
end-to-end values of QoS associated with cloud service compositions to select the best of these
compositions that match both functional and QoS requirements of end users. The framework uses our
proposed two models which effectively deal with two different environments in the cloud, and utilize the
available information in order to compute the values.
3.1 QoS Properties for Cloud Services
In this section, we define QoS properties of cloud services which we use in our proposed models of
QoS mapping and aggregation and QoS predictions. In this work, we only use some of the QoS properties
to illustrate and verify our approach. Our proposed end-to-end QoS mapping and QoS prediction models
are both extensible to cover more properties. QoS properties are used as discrimination criteria to select
the best services which optimize the total of QoS values and satisfy users’ non-functional requirements.
Kritikos et al. [85] define QoS as “a set of non-functional attributes of the entities used in the path from
services to the client that bear on the services’ ability to satisfy stated or implied needs in an end-to-end
fashion”. QoS properties can change without impacting services’ functionality. QoS properties can be

29
quantitatively or qualitatively measured. The quantitative QoS properties usually have value types (e.g.
integer, float, string, etc.), and they are associated with measuring units. Some examples of this type of
QoS properties are response time which is measured by milliseconds or seconds, cost which is measured
in currencies (e.g. US$, EU, etc.) and throughput which is measured in number of requests per second.
Qualitative QoS properties are not directly associated with values rather they are associated with
linguistic descriptions that tell how a service performs. Some examples of this type of properties are
security which is measured by different security levels (high, medium and low), and usability which can
be described as (high, medium and low). Each of these levels can be mapped to an integer value to be
mathematically processed and optimized. Moreover, QoS properties can also have tendencies which can
be either high or low [86]. High tendency means that the higher the value of a QoS the better the service is
with respect to a measured QoS property. Low tendency means that the lower the value of a QoS the
better the service is with respect to a measured QoS property. For example, response time and cost are
two properties with low tendency; availability and security are two properties with high tendency.
The Cloud Service Measurement Index Consortium (CSMIC) introduced a set of key business
attributes for cloud service business and technical measurements in a form of Service Measurement Index
(SMI) [87]. The collection of the QoS properties can be used to evaluate and compare cloud services by
users. SMI is designed to provide standards for organizations to measure cloud services based on their
requirements. It covers a wide range of properties to suit the different cloud models (i.e. IaaS, SaaS, PaaS,
Big Data, etc.). They are organized in seven main categories, and each category has several attributes.
This initiative has attracted researchers in the field to investigate the SMI attributes in order to improve
QoS modeling in the cloud [14].
In this thesis, we use some of QoS properties defined in SMI for our proposed end-to-end QoS
computation method. Below, we provide definitions of some commonly used QoS properties. Some are
specific to a certain cloud model (cloud layer) while other can apply to all layers (SaaS, IaaS, PaaS,
DBaaS, etc). We have used them to illustrate the concepts we introduce in our first proposed model. We

30
have used response time and throughput for the experiments of our second proposed model. The
definitions below are based on [87].
Availability ( AV): it measures the degree of service accessibility by end users. Cloud service providers
usually declare their services availability using a percentage value (e.g. 99.1%). Tendency of availability
is typically high. It applies to IaaS layer.
Reliability (RL): it is defined as “the ability of an item (which it can refer to a service, in our work) to
perform a required function under stated conditions for a stated time period”. Cloud service providers
usually declare their services reliability using a percentage value (e.g. 99.8%). Tendency of reliability is
typically high. It applies to all layers.
Response Time (RT): it measures the time between sending a request to a service and successfully
receiving a response. It is measured in milliseconds or seconds. Tendency of response time is typically
low. It applies to all layers.
Throughput (TP): it measures the number of requests (r) successfully processed and served in a period of
time (t). It is measured using (r/t). Tendency of throughput is typically high. It applies to all layers.
Cost (CO): it measures the amount of money a user pays for acquiring and using a service. It is measured
using a currency (e.g. US$). Tendency of cost is typically low. It applies to all layers.
Data Ownership (DO): it refers to provider’s mechanisms that guarantee a certain level of control for
users over their data stored and processed in the cloud. A cloud service provider declares its data control
policy for accessing and storing data in the cloud. Data ownership is a qualitative property that we
measure using linguistic values (high, medium, low). Tendency of data ownership is typically high. It
applies to IaaS layer.
Security (SE):refers to the degree of security that a service offers. We use three parameters for measuring
service security: access control, privacy and encryption algorithm. It is a qualitative property that we
31
measure using linguistic values. Tendency of security is typically high. It applies to all layers.
Stability (ST): it refers to the service ability to remain unchanged in terms of its performance. We measure
stability as an aggregation of QoS properties which describe service performance such as response time,
availability and reliability. It is measured using a percentage of full stability in a perfect condition.
Tendency of stability is typically high. It applies to all layers.
Accuracy (AC): it measures the degree of the service’s functional conformance to the Service Level
Agreement (SLA). We measure the accuracy as an aggregation of QoS properties which describe features
that users are usually interested in such as cost, security, data ownership and usability. It is measured in a
percentage of full service accuracy in a perfect condition. Tendency of accuracy is typically high. It
applies to all layers.
3.2 A New Cloud Service Selection Process
In this chapter, we introduce a concrete framework for computing unknown end-to-end QoS values of
new and un-invoked cloud service compositions for users who initially submit their requirements to a
cloud service selection system looking for a service solution. We consider the cloud-based service
selection as a three-step process: 1) Searching for the required cloud service (e.g. software, platform, etc.)
based on user’s functional requirements. 2) Vertically composing the discovered services with other
available cloud services so that vertically composed cloud services match end user’s functional
requirements. 3) Selecting and ranking the best of these functionally equivalent cloud service
compositions using their end-to-end QoS values. The selected compositions should satisfy users’ QoS
requirements.
We denote the service composition in the cloud as a cloud composite service. A single service which
is part of a composite service is called component service. The vertical cloud composition can include
component services from multiple cloud layers. In this research, we consider that a cloud composite
service has multiple component services from S layers. We define an end-

32
to-end QoS value as a QoS value of a cloud composite service that is observed by an end user which is
different from individual QoS values of cloud component services at multiple cloud layers. The cloud
composite services that have end-to-end QoS values recorded from previous invocation history can be
considered in the selection candidacy list (a set of all cloud composite services associated with their end-
to-end QoS values). However, it is very likely that some of the very well matching composite services
may not have end-to-end QoS values recorded or published. As a consequence, this kind of composite
services cannot be included in the selection candidacy list. There are two reasons for this: 1) cloud
composite services are new and they have never been invoked before by users, and thus no historical QoS
data are available for the selection process, 2) a user may have invoked one or two components of a cloud
composite service but not all of them, thus end-to-end QoS values are missing. We call this kind of
composite services, target composite services, and we call users for whom we want to compute end-to-
end QoS values of target composite services, target users.
In this thesis, our primary task is to consider all functionally matching cloud composite services in the
cloud service selection process so the services with unknown end-to-end QoS values can also be good
candidates for the selection process. We propose a new QoS computation mechanism that deals with two
common scenarios related to the availability of historical QoS data of previously invoked cloud composite
services. The first scenario happens when a new cloud service selection system is launched and newly
published cloud services are bound to be provisioned to end users. The selection system has no log files
which record the historical QoS data of the registered services. Therefore, these new services cannot be
considered as the potential service candidates since composite services with these new services as
components have no end-to-end QoS values. The second scenario happens when some composite services
have been invoked in the course of time by end users. So, log files exist which contain historical end-to-
end QoS values of the invoked cloud service compositions. We have designed two models that handle the
two scenarios: QoS mapping and aggregation for the first scenario, and QoS prediction for the second
one. Our framework is designed so that the end-to-end QoS computation process is personalized for target

33
users since the exploited historical data may have been recorded based on invocations made by other
users in a cloud environment.
3.3 Cloud Service Selection Architecture
Figure 3.1 shows the process model of a cloud service selection system. Our end-to-end QoS
computation model is a core part of this system, which includes two main modules: QoS mapping and
aggregation, and QoS prediction components. The workflow of the cloud service selection process is as
follows:
1. A target user submits functional and non-functional requirements to a service selection system to
select the best cloud services that satisfy the user requirements.
2. The system finds functionally matching services and composes them with available collaborating
services according to the user’s needs.
3. The system computes unknown end-to-end QoS values of target cloud composite services for
target users. There are two main scenarios:
a. The service selection system is newly developed. The cloud component services are newly
published. Thus, no historical end-to-end QoS data are available.
i. QoS mapping and aggregation process is executed.
ii. End-to-end QoS values of composite services are computed.
b. The service selection system has been active for a while. It keeps logs for historical end-to-
end QoS data of cloud composite services which have been invoked by different end users in
the past.
i. QoS prediction process is executed
ii. End-to-end QoS values of composite services are computed.
4. Using the computed end-to-end QoS values, a QoS matchmaking process can be triggered to
select and rank the best cloud composite services that satisfy the target user’s non-functional
requirement.

34
Functional and QoS requirements
Ver
tica
l clo
ud
se
rvic
e co
mp
osi
tio
n
End-to-End QoS Values
Cloud Service Selection
Cloud Composite ServicesCloud Composite Services
SaaS layer
DaaS layer
IaaS layer
XaaS
QoS Mapping and Aggregation
QoS Prediction
Figure 3.1: Cloud Service Selection Process.

35
3.4 Chapter Summary
In this chapter, we proposed a framework for cloud service selection in cloud environment such as
cloud service marketplaces. The core functionality of our cloud service selection framework is the QoS
computation process. QoS properties of cloud services are often used to determine the best of the
functionally equivalent cloud services. We defined and listed some of the important properties that we
used in our research. In the second part of the chapter, we defined and gave an overview of our proposed
cloud service selection process. We emphasized that service selection in the cloud is performed based on
vertical composition of different types of services from multiple cloud layers. Two main scenarios are
considered in the framework for computing end-to-end QoS values of cloud composite services: a cold
start scenario in which a cloud service selection system is newly launched, and no invocations were made
to cloud composite services, 2) a cloud service selection has been active for a while and cloud composite
services were invoked in the past, thus historical QoS data are available. We have proposed two models
that correspond to these two scenarios: QoS Mapping and Aggregation, and QoS Prediction.

36
Chapter 4
Cloud Service QoS Mapping and Aggregation
In a situation where a new service selection system is launched with newly registered cloud services and
no historical QoS records are available, selecting the best services based on QoS requirements becomes a
challenging task. These services have no invocation history that can be employed towards computing end-
to-end QoS values for the selection process. To overcome this “cold start” problem, we propose a novel
QoS mapping scheme that can be used as a mapping tool to perform the mapping between the user’s QoS
requirements and cloud services’ QoS requirements and guarantees at multiple cloud levels. We define
three rules for the mapping scheme. The QoS values at different cloud layers are aggregated according to
the defined rules to compute end-to-end QoS values of cloud composite services. Then the calculated
values are used during the cloud service selection process to select the best composite services based on
users’ QoS requirements. The experimental results will show that the mapping computation process is
linear with respect to the number of SaaS services composed with IaaS services and bundles with a
selected DBaaS service.
4.1 An Overview of the QoS Mapping and the Aggregation
In this chapter, we propose a method for mapping and aggregating users’ QoS requirements to a
required cloud service (e.g. SaaS, PaaS, DBaaS, etc) in order to compute end-to-end QoS values of cloud
composite services. The required cloud service has QoS guarantees which must satisfy their users’ QoS
requirements. It also has QoS requirements which must be satisfied by QoS guarantees from other
collaborating cloud component services from different computing models at different layers. Thus
mapping users’ QoS requirements to the required cloud services and then to other cloud services at

37
different layers is required to compute unknown end-to-end QoS values. The computed end-to-end values
are used during the cloud service selection process. In our work [88], we hierarchically modeled QoS
properties of cloud services and user QoS requirements using the Analytic Hierarchy Process (AHP)
method [89]. Using this approach, we modeled QoS properties of cloud services at different layers with
different categories such as customer related QoS and performance related QoS properties.
With the cloud computing evolution and proliferation of cloud services, some work have focused on
semantically modeling concepts related to cloud services such as cloud service discovery (functional
requirements) [90], life cycle and deployment [46] and cloud infrastructure [49] and cloud service
characteristics and development [51]. However, these approaches suffer from the following: 1) they do
not consider cloud component services at multiple cloud layers, 2) they do not have well defined
representation of QoS requirements and guarantees of services and users and relationships among them.
Any requirements from a required cloud service on other collaborating services should always be rooted
from their end users’ demands. The mapping becomes necessary in this context because one service
provider cannot guarantee the end-to-end QoS values in this collaboration. To map users’ QoS
requirements onto a required service and then to other services at multiple cloud layers, we define three
mapping rules.
The main purpose of these rules is to determine the way (path) that a particular QoS requirement is
mapped onto different cloud layers which represent the multiple component services of a target cloud
composite service. After applying the rules, all QoS requirements submitted by the end user are mapped.
In the last step, we use the adopted aggregation models that calculate the end-to-end value for each QoS
requirement. With these values, target cloud composite services are now valid candidates for the cloud
service selection process. Figure 4.1 shows our concept of the QoS mapping in the cloud. In this figure,
user QoS requirements are mapped to a required cloud service (SaaS) and other two cloud services at IaaS
and DBaaS layers. To the best of our knowledge, our proposed QoS mapping and aggregation model is
the first attempt to model and map QoS requirements and guarantees of cloud component services at
multiple cloud layers in order to compute end-to-end QoS value for the cloud service selection process.

38
4.2 QoS Mapping Rules
The focus of our mapping mechanism is to map the user’s QoS requirements to required cloud
component services at multiple layers. The mapping process facilitates the aggregation process required
to compute the end-to-end QoS values. We have analyzed the characteristics of QoS properties of cloud
services based on definitions provided by CSMI [87], Choi et al. [91] and Greg et al. [14]. We have
found that QoS properties defined in CSMI, including the ones we have used in our research, can have
three ways of mapping them across cloud layers. Mapping of a QoS requirement occurs only to the layer
at which a service provider (which corresponds to that layer) can guarantee this specific requirement.
Using QoS property definitions, if a cloud provider cannot guarantee a particular QoS requirement, our
IaaS’s QoS Guarantees DBaaS’s QoS Guarantees SaaS’s QoS specifications
(requirements and guarantees)
I a a S
VM1
VM2
VMn
SaaS
SaaS1
SaaS2
SaaSn
QoS Mapping
DBaaS
User’s QoS
Requirements
AV RL RT DO US SE CO RP
99.9% 10000 hrs < 2 sec. Very High 95.0% excellent < 20 $/month 80%
99.9 10^4 < 2 veryHigh 95.0 excellent < 20 80%
Figure 4.1: Mapping Users’ QoS Requirements onto Multiple Cloud Layers.

39
mapping model will not map this requirement to that layer. For example, our mapping model maps
availability to hosting services which means the IaaS layer but not to other service types. So, if the target
cloud composite service is composed of three service types (e.g. SaaS, IaaS and DBaaS) in which SaaS
and DBaaS services are hosted on different IaaS services then the QoS mapping occurs only at the IaaS
layer. This is because based on the definition of availability, both SaaS and DBaaS providers have no
control on the accessibility of their services since both services are hosted and accessed via IaaS provider
which has a full control on them.
We designed three rules to perform the mapping process:
QoS Mapping Rule #1. Based on this rule, user’s QoS requirements are mapped to all component services
at all cloud layers.
Example: users’ requirements on response time, cost and security are mapped to a required service (e.g.
clustering service from Weka-SaaS), to the IaaS layer (e.g. an Amazon EC2 VM) and the DBaaS layer
(Oracle DBaaS).
QoS Mapping Rule #2. Based on this rule, user’s QoS requirements are mapped only to the hosting
service (i.e. IaaS layer) but not to the hosted services (e.g. SaaS or DBaaS layer). In this rule, we assume
that hosted services are hosted in different IaaS services so QoS requirements are mapped to IaaS services
which host the other components.
Example: users’ requirements on availability and data ownership are mapped only to the IaaS layer (e.g.
an Amazon EC2).
QoS Mapping Rule #3. Based on this rule, user’s QoS requirement is an aggregation of different QoS
properties. Each property may span all or some cloud layers (according to Rule#1 and Rule#2). Therefore,
this type of property is complex since it spans different QoS properties at different cloud layers.
Example: users’ requirements on stability and accuracy. The stability is the aggregation of performance-
oriented properties such as response time, availability and reliability. Following Rule#1 and Rule#2, we

40
map the three properties and we aggregate the values at cloud layers for each. Then we linearly aggregate
the obtained values to get the final stability value. We follow the same steps for the accuracy; however, it
is mapped to user-oriented properties such as cost, security and data ownership.
At this point, all user requirements are mapped according to the defined rules. The final step is to
aggregate QoS guarantees (values) at different cloud layers according to the mapping outcome (scheme).
The obtained values represent the end-to-end QoS values of target cloud composite services. We adopt
the aggregation functions used in the sequential service composition system in order to aggregate the QoS
values [92]. The choice of this type of aggregation is natural since the required service by the end user
(e.g. SaaS service) is first composed with the hosting service (i.e. IaaS) so it becomes accessible by end
users, and then based on users’ requirements, it may collaborate with other service type (e.g. DBaaS) and
provisioned as a complete cloud solution.
1
SaaS IaaS DBaaS
User Submits QoS Requirements QoS Mapping
Set of QoS Requirements QoS Mapping
Schemes
1 QoS Aggregation Matchmaking Process
End-to-End QoS values
Process
Output
Legend
Figure 4.2: Computing End-To-End QoS Values of Cloud Composite Services through our Mapping and Aggregation Process.

41
Figure 4.2 illustrates the workflow of our proposed mapping and aggregation process of users’ QoS
requirements in cloud environments.
4.3 QoS Aggregation
In this section, we present the aggregation computation of QoS values in order to obtain the end-to-
end values. The presented process is based on the aggregation at three cloud layers (SaaS, IaaS and
DBaaS). The aggregation process is based on the aggregation models for the sequential service
composition [92]. In order to facilitate the designing of our mapping rules, we classify the available QoS
properties of cloud services into three categories: Performance QoS, Customer QoS, and Derived QoS.
The first category includes properties that are more oriented towards the service performance. In our
research, we select properties such as response time, throughput, reliability and availability. The second
category includes properties that are more oriented towards the user (consumer) side. In our research, we
select properties such as cost, security and data ownership. The third category includes properties that are
more generic than the ones in the first two categories. Therefore, we can derive them by combining other
properties from the other categories. In our research, we select properties such as stability and accuracy to
represent the third category.
End-to-End Availability (AV):
SaaS DaaSAV = (IaaS ( ) AV, IaaS ( ) AV) (4.1)
IaaS AV = MTTF / (MTTF + MTTR) (4.2)
We compute end-to-end availability value by aggregating values at the hosting IaaS services where SaaS
and DaaS services are hosted. We use two metrics to calculate the availability value: the Mean Time To
Fail (MTTF) and the Mean Time To Repair (MTTR).

42
End-to-End Response Time (RT):
RT = SaaS RT + IaaS RT + DaaS RT (4.3)
We compute the end-to-end response time value by aggregating the values at all layers. We calculate the
response time at each layer using two metrics: processing time and transmission time. The former
measures the time it takes a service to process a user’s request. The latter measures the total round trip
time of a user’s request not including processing time.
End-to-End Data Ownership (DO):
SaaS DaaSDO = (IaaS ( ) DC, IaaS ( ) DC)∏ (4.4)
We compute end-to-end data ownership values by aggregating values at the hosting IaaS services where
SaaS and DaaS are hosted. It is calculated using one metric: data ownership policy. The value of data
ownership is obtained by measuring the similarity between the claimed policies of a cloud provider (e.g.
IaaS and DBaaS) and the predefined data ownership policies. The latter represents the standard policies
for maintaining the data control in the cloud. We use Jaccard Similarity Coefficient [93] to calculate the
matching percentage between the two policies of two services. The Jaccard similarity value represents the
number of common words found in two service description documents divided by the total number of
words in two documents.
End-to-End Security (SU):
SU = (SaaS SU, IaaS SU, DaaS SU)∏ (4.5)
We compute end-to-end security values by aggregating values at all three layers. We calculate the
security value using three metrics: access control, privacy and encryption algorithm. We assume that the
values of the security metrics are predefined in cloud environment. To compute the security value of
SaaS, we measure the similarity between the offered access control mechanisms (e.g. authorization,
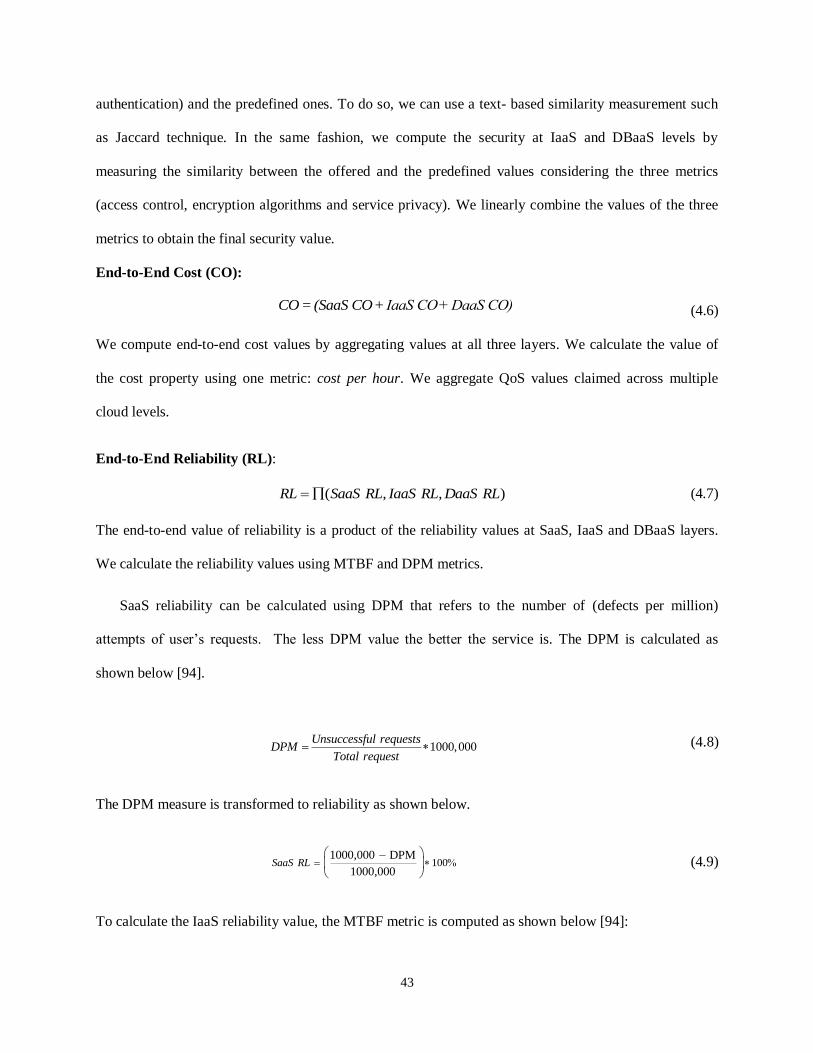
43
authentication) and the predefined ones. To do so, we can use a text- based similarity measurement such
as Jaccard technique. In the same fashion, we compute the security at IaaS and DBaaS levels by
measuring the similarity between the offered and the predefined values considering the three metrics
(access control, encryption algorithms and service privacy). We linearly combine the values of the three
metrics to obtain the final security value.
End-to-End Cost (CO):
CO = (SaaS CO+ ΙaaS CO+DaaS CO) (4.6)
We compute end-to-end cost values by aggregating values at all three layers. We calculate the value of
the cost property using one metric: cost per hour. We aggregate QoS values claimed across multiple
cloud levels.
End-to-End Reliability (RL):
( , , )RL SaaS RL IaaS RL DaaS RL (4.7)
The end-to-end value of reliability is a product of the reliability values at SaaS, IaaS and DBaaS layers.
We calculate the reliability values using MTBF and DPM metrics.
SaaS reliability can be calculated using DPM that refers to the number of (defects per million)
attempts of user’s requests. The less DPM value the better the service is. The DPM is calculated as
shown below [94].
1000,000
Unsuccessful requestsDPM
Total request (4.8)
The DPM measure is transformed to reliability as shown below.
1001000,000 DPM
1000,000SaaS RL
(4.9)
To calculate the IaaS reliability value, the MTBF metric is computed as shown below [94]:

44
time between failure100
of failures
TotalMTBF
Number (4.10)
The MTBF stands for Mean Time Between Failures which refers to the average time between failures.
The reliability unit is percentage and tendency is high.
4.3 An Illustrating Example
A small software company ‘TinySoft’ just developed new and easy to use project management (PM)
software service to plan schedule and execute projects for SMEs. Since TinySoft does not have enough
resources to provide an all-in-one solution, it has to use other utility services such as infrastructure,
database and security to work collaboratively.
TinySoft plans to use two cloud services, infrastructure and database services. Figure 4.3 shows a service
flow and an execution plan for TinySoft. There are multiple tasks (t1…t5) in the service flow which
represent TinySoft’s tasks for searching for and selecting cloud services to collaborate with in order to
offer cloud composite services (denoted as Sp) that match end users’ functional requirements. The service
t5 t3
Search sn Search sm Select sn Select sm Compose sp
t2 t4 t1
Service Flow
Candidate
services
{s1…sn}
Candidate
services
{s1…sm}
Candidate
solutions
{s1…sp}
sn sm sp
Execution Plan
Users
Users
TinySoft
TinySoft
Figure 4.3: Cloud Service Selection Example.

45
flow follows a specific work flow process (i.e. sequence flow). An execution plan is formed by
composing the TinySoft SaaS service (PM) with an infrastructure service (denoted as Sn) and database
service (denoted as Sm) that are selected through the service flow. The execution plan collectively
achieves TinySoft’s goal of finding the best cloud composite services that satisfy their users’
requirements.
Potential
Cloud Solution
Availability (AV) End-to-End AV
TinySoft IaaS1 DBaaS1
0.999 TinySoft + IaaS1+
DBaaS1 N/A
MTTF
at IaaS
(SaaS)
MTTR
at IaaS
(SaaS)
MTTF
at IaaS
(DBaaS)
MTTF
at IaaS
(DBaaS)
10000
hrs 1.5 hrs 10000 hrs
6hrs
Potential
Cloud Solution
Response Time (RT)
End-to-
End RT
TinySoft IaaS1 DBaaS1
4 sec.
TinySoft + IaaS1+ DBaaS1
SaaS-
PROC
IaaS-
PROC
IaaS-
TRANS
DBaaS-
PROC
DBaaS-
TRANS
0.5 0.5 1 1 1
Table 4.1: The Aggregated Availability Values of Cloud Component Services and
the Obtained End-To-End Value of the Availability.
Table 4.2: Aggregated Response Time Values of Cloud Composite Services and Obtained End-To-End
Value of the Response Time.
46
Following TinySoft’s execution plan, suppose there are 8 IaaS offers and 3 DBaaS offers. When they
collaborate with TinySoft’s PM service, there are altogether 24 candidate composite services which could
meet its users’ functional needs. The best of the 24 services will be selected and offered to a potential end
user. After the market analyses, TinySoft has had a basic understanding of the typical QoS requirements
from end users. Some important services’ QoS properties that end users concern about are availability,
reliability, response time, data ownership, cost, and security. The question now for TinySoft is that given
the end-to-end user’s QoS requirements, what QoS requirements it should have on potential IaaS and
DaaS offers. For instance, QoS requirements from a user on cost, response time and availability could be
“< $15 month”, “<= 4 seconds” and “> 99.5%”, respectively. Our mapping tool could help TinySoft map
each of these requirements to the required cloud layers (i.e. TinySoft service- SaaS, DBaaS and IaaS
levels) using the proposed rules. First, the mapping tool will determine which mapping rule is applied on
each requirement (i.e. cost, availability and response time). The Rule#1 is used for the cost and response
time requirements. The Rule#2 is used for the availability requirement. The availability guaranteed by
IaaS services hosting TinySoft’s PM service and the DBaaS service is calculated by adding the measured
(claimed) values of MTTF and MTTR of the service and dividing the result by MTTF. Then the two values
are aggregated using the product operation to get the end-to-end availability value of a target cloud
composite service. For the response time requirement, the end-to-end value is obtained by summing up
the values guaranteed by SaaS, IaaS and DBaaS providers at three cloud layers. Table 4.1 and Table 4.2
show an example for a cloud composite service (i.e. TinySoft + IaaS1+ DBaaS1) from the set of the 24
available solutions. The calculated availability value is in percentage and the response time value is
calculated in seconds.
By applying the mapping rules, the end-to-end QoS values of the 24 composite services could be
calculated. Then the cloud composite services can be ranked and the best one is selected. Without our
mapping tool, it would be difficult for TinySoft to select the best utility services that can collaborate so
that together they can satisfy users QoS requirements. Now both the selection accuracy and efficiency
could be largely improved because of the mapping tool.

47
4.4 Experiments
The purpose of conducting our experiment is to answer the following question: does the QoS mapping
and aggregation process proposed in this paper incur much computational overhead when integrated to
any service selection system? We perform an efficiency test to answer the question.
4.4.1 Description of the QoS Datasets
In our experiments, we have used three types of cloud services (SaaS, IaaS and DBaaS).We have used
two data sets that represent SaaS layers. They are collection of different applications which implement
different functions. Besides, we used QoS values from Amazon EC2 North Virginia (IaaS layer) which
we collected using a network monitoring tool4. The response time value of a DBaaS service was available
by its provider (Clustrix5) so we used it in this experiment. Using our mapping tool, response time values
of SaaS service from the first data set were aggregated with the values of Amazon EC2 service and the
DBaaS service. We repeated the same process for the second set of SaaS services by aggregating their
response time values with the values of Amazon EC2 and the DBaaS. We measured the time it took our
mapping tool to map QoS values across the three cloud layers with respect to the two SaaS data sets. The
first dataset was collected by Zheng et al. [95] which is part of their WS-DREAM project. It is generated
from 4532 web services when invoked by 142 users and both response time and throughput values have
been collected by the provider. The dataset can be found in [96]. The second SaaS dataset was collected
by E. Almasry et al. [97]. The dataset contains 2507 web services with a set of 9 QoS properties. The
dataset can be found in [97].
4 https://prtg.paessler.com/
5 http://www.clustrix.com/

48
4.4.2 Experiment Setup and Details
In the experiment, we evaluate the performance of the QoS mapping and aggregation process using the
collected QoS datasets. In our implementation, we ran our tests on a machine running under Windows 7
with 64 bit, 3.16GHz Intel Duo2 CPU and 4 GB RAM.
0
1
2
3
4
5
6
25 50 75 100 125 150 175 200 225 250 275 300 325 350 375 400 425 450 475 500
QoS mapping execution time based on the first dataset
pro
cess
ing
tim
e (m
s)
Number of services (in tens)
0
1
2
3
4
5
6
250 500 750 1000 1250 1500 1750 2000 2250 2500
QoS mapping execution time based on the second dataset
pro
cess
ing
tim
e (m
s)
Number of services
Figure 4.4: QoS mapping Efficiency Test.
(a) using SaaS [96]+Amazon EC2+ Clusterix. (b) using SaaS [97]+Amazon EC2+ Clusterix.
(a)
(b)

49
In the first part of the experiment, we used the first SaaS dataset, and values of the response time and
throughput were aggregated with the values of Amazon EC2 and Clusterix to resemble end-to-end
response time values of the compositions of three services at the three cloud layers. We increased the
number of services by 250 and we measured the time it took to map and calculate the end-to-end QoS
values. In the second part of the experiment, the values of 9 properties from the second SaaS data set were
aggregated with the same Amazon EC2 and Clusterix services. We increased the number of services by
250. Figure 4.4 shows the result of the two parts of our experiment. From the results, we observed that the
execution time of the QoS mapping and aggregation process is linear with the increasing of the service
numbers (i.e. from 0 to 2500 services in the first part, and from 0 to 4500 services in the second part).
This indicated that our mapping and aggregation has a minimal effect on the whole process of the service
selection and ranking.
4.5 Chapter Summary
In this chapter, we propose a novel QoS mapping and aggregation process for mapping users’ QoS
requirements onto QoS guarantees from different cloud services at multiple cloud layers. Mapping users’
QoS requirements become necessary because end-to-end QoS values are needed to select the best
composite services for end users. Based on their definitions and characteristics, QoS properties can be
mapped in different ways across multiple cloud layers. For this reason, we have proposed mapping rules
which determine the way that a certain QoS property is mapped across different cloud services. To
facilitate the mapping process, we classified QoS properties of cloud services into three categories. We
defined metrics associated with each property to calculate QoS values guaranteed at each layer.
According to the mapping process, we aggregated these values to obtain end-to-end QoS values using
some well-known aggregation models. We have also conducted an efficiency test of our mapping process.
This test demonstrates that our proposed QoS mapping and aggregation process has linear computational
complexity which indicated that the process is efficient and can be integrated into a service selection
system.

50
Chapter 5
End-to-End QoS Prediction
After following the cloud service selection steps mentioned in Chapter 3, a set of functionally matching
cloud composite services are returned to end users. It is highly likely that some well matching services do
not have end-to-end QoS values; we referred to this kind of services as target cloud composite services.
As a consequence, these services are excluded from the service selection process which results in an
unhealthy cloud service market environment. In Chapter 4, we introduced our proposed approach to
compute end-to-end QoS values of target cloud composite services taking into consideration a cold start
scenario in which a cloud service selection system is newly launched and cloud composite services are
newly published and thus no historical QoS data are available. In this chapter, we consider a different
scenario in which historical QoS data of previously invoked cloud composite services by end users are
recorded and accessible by a cloud service selection system. We propose a novel method to predict
unknown end-to-end QoS values of target cloud composite services for target users by exploiting
available historical QoS data and information associated with cloud services and users. Only QoS data
from similar cloud composite services are used to predict the unknown end-to-end QoS values. The
reason for considering only similar composite services in the prediction process is that these specific
services share similar behaviors in terms of QoS experiences when they have been invoked in the past.
So, if the end-to-end QoS values of the similar cloud composite services are known (they are recorded in
QoS logs), they can be used (during the prediction process) to predict end-to-end QoS values of the target
composite services. Therefore, we compute the similarities between cloud composite services to find a set
of similar composite services to the target one. To make the predicted QoS values more accurate and
personalized to a target user for whom we want to predict its end-to-end QoS value, we consider only

51
QoS values of similar users to the target user in the prediction process. Therefore, in this thesis, we also
compute users’ similarities to find similar users to the target one to personalize the prediction results.
5.1 Overview of Cloud Composite Service Similarity Calculation and
QoS Prediction
In our prediction model, we estimate unknown end-to-end QoS values of vertical composite services
for the selection process in a two-phase process. In the first phase, we compute the similarities between
cloud composite services to find those similar to the target cloud composite service. Two composite
services are considered similar to each other if their component services are similar. Suppose, two cloud
composite services ( and ) that each has multiple component services of different types; so that
= { , , , …, and = { , , , …, }. To compute the
similarity between and , we compute the similarities between their component services. So, if
every pair of services from these two composite services ( and ), ( and ), (
and ), …,( and ) has a high similarity level, we can decide that ( and ) are
similar to each other. As a result, their QoS values are similar. We determine the component services’
similarity of two cloud composite services using two types of information:
Historical QoS data: we use the available data of previously invoked cloud composite services to
calculate the correlation score between corresponding component services in two cloud composite
services. We only consider component services with positive correlation which means that both have
similar QoS values in the past when they were combined with the same set of other type of
component services. More details are provided in Section 5.4.4.
Services’ and users’ internal features: we propose to use the available information associated with the
measured component services to calculate their similarity scores. We denote this information as
“internal features”. Two component services are similar to each other if both services have similar

52
values in terms of the internal features (e.g. they provision the same function, have similar
configuration or are located in a close distance). More details are provided in Section 5.4.2.
In the second phase, we propose a Multi-dimensional Cloud Service Similarity Tensor Factorization
model (MCSSTF) to make the prediction. The idea is that we use historical QoS data and other associated
information of similar cloud composite services to predict unknown end-to-end QoS values of a target
composite service in a multi-dimensional tensor. In MCSSTF, we consider that a cloud composite service
has multiple component services and the number of cloud component services is n. First, we fit a
factorization model in the tensor of multiple cloud component services. In this format, multiple matrices,
each is specific to a component service, are utilized to make the prediction of unknown end-to-end QoS
values. The original regularization term in the MCSSTF model learns the latent features of all multiple
component services through a basic factorization model. The premise is that there are only a few factors
that affect the observed QoS values of the compositions of the multiple component services, and that QoS
values are determined by how these latent factors apply on the multi-component services tensor. Second,
we extend the MCSSTF model to improve the prediction results by incorporating the local information of
the similar composite services with global learning process of all component services’ information for
fitting the factorization model. The MCSSTF predicts unknown QoS values by balancing the overall
information of all cloud composite services and QoS data of the similar composite services. The
prediction is further improved by calculating the composite services’ similarity scores as weights of the
employed composite services in the learning process. Hence, unknown QoS values are obtained based on
learning relationships of the multiple component services. The latent features are different from our
proposed internal features. They are defined as hidden features in the matrices that correspond to the
involved component services , , and that compose the tensor,
where S, I, D and X denote specific matrices of cloud component services (e.g. SaaS specific matrix, IaaS
specific matrix, DaaS specific matrix and XaaS specific matrices, respectively) and l refers to latent
features. In general, tensors can be naturally extended to higher dimension which makes tensors very well
fit our problem domain, since MCSSTF is designed to include z cloud component services. It is also

53
important to mention that the known sparse QoS values in the z component services tensor (i.e. the values
that MCSSTF uses to predict unknown QoS values) are recorded based on multiple invocations made by
different users. To make the prediction of MCSSTF more accurate and personalized to a target user for
whom we want to predict end-to-end QoS value, we also compute users’ similarities. Only QoS values of
similar users to the target user are considered in the prediction computation process. The result of users’
similarities is integrated in the similar composite services term which we incorporate in the MCSSTF
prediction model.
5.2 Architecture of the End-to-End QoS Prediction Model
Figure 5.1 shows the architecture of the proposed MCSSTF prediction model. The system workflow is
as follows: a user submits her request that includes functional and non-functional (QoS) requirements.
The system searches for matching cloud services (SaaS) based on user’s functional requirements. In order
to return a complete solution to the user, the required cloud services (e.g. SaaS services) collaborate with
other available cloud services which are denoted as XaaS. The collaboration result is multiple
combinations of cloud composite services, , where i = {1… z}. A few of them have end-to-end QoS
values and can be directly considered in the selection process. For the rest, their unknown end-to-end QoS
values are computed using our MCSSTF model. Then they could be considered in the service selection
process.
As illustrated in Figure 5.1, there are multiple inputs to our proposed end-to-end QoS prediction
model (MCSSTF): the functionally matching cloud composite services whose end-to-end QoS values are
unknown, their historical QoS data, and service descriptions/information which are used to extract
internal features for the similarity calculation. First, MCSSTF computes required cloud services’ and
users’ similarities for the prediction process. It uses the Similarity Model component which computes all
similarities required during the prediction process. Cloud composite service similarities are calculated
using Cloud Service Similarity component, and users’ similarities are calculated using User Similarity
component. The former can be used to identify similar composite services to the target composite service.

54
The latter can identify similar users to the target user in order to personalize the prediction results. The
similarity results obtained from the Similarity Model are injected into the prediction process which is the
second part of our proposed MCSSTF model. The MCSSTF combines the global information of all cloud
composite services represented by the original Global Regularization Term and the local information of
similar cloud composite services represented by the Local Regularization Term. The MCSSTF makes the
prediction by minimizing the difference (error) between the global predicted values and the QoS values
from similar composite services through a learning process.
Figure 5.1: Architectural Model for Predicting Unknown End-To-End QoS Values of Cloud Composite Services.
Cloud Service and User
InformationHistorical QoS
Data
Functional and QoS requirements
Vertical cloud composition(n component services)
SaaS layer
DaaS layer
IaaS layer
Cloud composite Service selection
XaaS
DaaS services
XaaS services
SaaS services
IaaS services
Cloud Service Similarity
User Similarity
Similarity Model
Global Regularization Term
Local Regularization Term
MCSSTF
Predicted End-to-End QoS values
MCSSTF prediction model

55
5.3 A New Multi-Dimensional Model for Predicting End-to-End QoS Values
Tensor Factorization (TF) is a powerful tool for presenting multi-way matrices and predicting missing
entries [98]. TF is a multi-dimensional form of Matrix Factorization model which is a very well known
method for recommendation and prediction. In this thesis, we propose a novel end-to-end QoS prediction
model to fit multiple dimensions considering n cloud component services using tensor techniques. In [78],
we presented an instance of our work which represents three-dimensional end-to-end QoS prediction
model, considering three types of services (SaaS, IaaS and DaaS).
In our work, a QoS tensor m n c … x is constructed to represent multiple services of different
types. For instance, the tensor could represent m SaaS services, n IaaS services, c DaaS services and x
XaaS services. The goal is to approximate the low-rank tensor R , where the
subscripts s, i, d and x denote SaaS, IaaS, DaaS and any cloud service XaaS, C is a diagonal
tensor and C = 1 if s = i = d =…= x , otherwise it is equal to 0; S , I , D X
denote latent feature matrices in which each column represents a component service, and l is the
number of latent features. Since in real scenarios, only a few composite services have their end-to-end
QoS values recorded due to few users’ invocations, latent features l ; the symbol
denotes tensor-matrix multiplication operator. Figure 5.2 illustrates the decomposition of our QoS tensor
of three component services, SaaS-IaaS-DaaS. QoS values in the tensor are recorded based on invocations
of combinations of SaaS and IaaS when bundled with DaaS services.
The QoS tensor R can be mathematically written as follows:
R = (5.1)
The QoS tensor is predicted by minimizing the objective function as follows:
, (5.2)

56
ˆ 2( )... ... ... ...
1 1 1 1
1( , , , , ..., )min
2, , , ...
m n c zA Refg v efg v efg v
e f g vRR S I D X
S I D X
(5.4)
where R denotes the original QoS tensor, and denotes the predicted QoS tensor; denotes the
Frobenius form which is calculated as the square root of the sum of the absolute squares of
.
Since R is very sparse, only composite services that observe QoS values are factorized. The tensor
factorization term is minimized by applying the following function:
ˆ 2( )... ... ... ...
1 1 1 1
1( , , , , ..., )min
2, , , ...
m n c zA Refg v efg v efg v
e f g vRR S I D X
S I D X
(5.3)
where is an indicator function that is equal to 1 if a composite service is invoked, and a QoS value is
available; otherwise it is equal to 0.
To avoid overfitting problem, three terms are added as follows:
꞊
Figure 5.2: QoS Tensor of Three Cloud Component Services SaaS-IaaS-DaaS. On the Right: QoS Matrices
of SaaS- IaaS per Slices of DaaS Services. The Shaded Area Indicates Observed QoS Values.
IaaS
SaaS SaaS SaaS
3
Ia
aS
DaaS
+ +
SaaS
DaaS1 DaaS3 DaaS2
+ +
+ ………………………………………………. +
DaaSn

57
ˆ 2( )... ... ... ...
1 1 1 1
1( , , , , ..., )min
2, , , ...
m n c zA Refg v efg v efg v
e f g vRR S I D X
S I D X
(5.6)
where , and are learning rate, and they are all greater than 0.
Considering the original tensor factorization term, unknown end-to-end QoS values are predicted by
learning the latent features of all known QoS values through factorizing the three matrices. There are two
drawbacks for using only this term: 1) the prediction accuracy is low because information from all
composite services of the tensor (including dissimilar services) are included in the prediction process
which could degrade the prediction accuracy; 2) considering all composite services in the latent features
learning can add high computational overhead which degrades the prediction efficiency. To overcome
these drawbacks, we propose to add an additional regularization term to the tensor factorization model
(i.e. Local Regularization Term). It considers information of similar composite services in the prediction
of unknown end-to-end QoS values of target composite services. The new term is shown in Formula
(5.5).
(5.5)
With the new term, the MCSSTF aims at minimizing the predicted QoS observations of a target
composite service/component service i and its similar composite services/component services j within the
global information and builds the following objective function:
where denotes a similar composite service to ; is a parameter which
determines the degree of similar cloud composite services engagement in the prediction result. The has
no direct impact on the prediction performance rather it balances the impact of both the global

58
information of the whole structure of the tensor and the local information of similar composite services.
In the experiments (Section 5.7), we set the range of to [0.001 – 0.1], and iterate the learning algorithm
in a step of 0.001; K(i) is a set of top k similar cloud composite services to a target composite service i.
Later, we will explain how to compute the top k similar composite services in Section 5.4.4.
is the similarity weight of a similar composite service, and it is calculated as follows:
, (5.7)
In Section 5.5, we will explain how to compute the similarity of cloud composite services
( ).
A local minimum of the objective function in formula (5.6) can be found by performing the gradient
descent algorithm in . This is done by computing
on the
objective function. By performing the gradient descent the latent feature vectors are learned and the
distance (error) between the actual QoS tensor and the predicted tensor is minimized. The parameter
has an important role in the convergence of the objective function to a local minimum. It represents the
significance of the contributed similar composite services during the iterative learning process which
helps reaching a better local minimum. It prevents the predicted value from deviation against values of
the similar composite services.
In Section 5.5, we present the similarity calculation process required to construct the incorporated
Local Regularization Term of the tensor R as part of the MCSSTF model.
5.4 Constructing the Local Regularization Term
The objective of this section is to construct the Similarity Model which represents the Local
Regularization Term in our MCSSTF. The Similarity Model computes the similarity between available
cloud composite services and the target cloud composite service. As explained in Section 5.1, we use two

59
types of information to compute the similarity, historical QoS data and services’ internal features. We
consider only similar cloud composite services which have high similarity levels during the prediction
process. In Section 5.4.1, we present our similarity computation process based on internal features. In
Section 5.4.2, we present our similarity computation process based on QoS historical data of previously
invoked cloud composite services.
5.4.1 Internal Features-based Similarity
In this section, we define the proposed internal features and the premise of using them to compute the
similarities of cloud composite services. Then, we present the internal features-based similarity
computation process between two cloud composite services ( and ). We have proposed to use a set
of internal features extracted from each service type that a component service belongs to. We define the
services’ and users’ internal features as services’ and users’ characteristics and specifications that can be
extracted from providers’ documentations, services’ WSDL files and user profiles. The premise for using
services’ internal features is that: 1) they can have impacts on the similarity and prediction results, 2) the
amount of the recorded historical QoS data are low. Therefore, a similarity measurement based on service
correlation will not be accurate since correlation measurement techniques such as Pearson Correlation
Coefficient (PCC) heavily relies on available QoS data. Consequently, using the internal features is
important since no new invocations and testing are required to obtain the QoS values for computing the
similarity between cloud composite services.
Some of the available internal features of three cloud services and users are listed below. More
internal features can be added as information become available. Internal features of other cloud service
type can also be considered when measuring the similarity between cloud composite services.
SaaS internal features: service functions (functions offered by a service such as clustering,
classification or association rules) and implementation algorithms (for example, clustering services
can be implemented using K-Means or Hierarchical algorithms).

60
IaaS internal features: service configuration (technical specifications of IaaS computing units which
include memory, CPU, storage and other specifications) and service geographical location (where a
service is physically located).
DaaS internal features: size of accessed data (the size of the data accessed through a data service) and
service geographical location (where a DaaS service is physically located).
Cloud user internal features: user’s geographical location (where a user is physically located).
For the sake of simplicity, we assume that cloud composite services are composed of three types of
services (SaaS, IaaS and DaaS) which correspond to three cloud layers. Therefore, in order to compute
the similarity between two composite services we need to compute the similarities between their
component services (of same types) and then we aggregate the similarity values to obtain the final
similarity between the two composite services. The SaaS similarity is computed as an aggregation of
software functionality and implemented algorithms similarities. The IaaS similarity is computed as an
aggregation of IaaS instance configuration and its geographical locations similarities. We consider two
internal features for IaaS: location and configuration of the IaaS instance. The DaaS similarity is
computed as an aggregation of data service locations and sizes of accessed data similarities.
IaaS Similarity Computation
There are some research work [68], [69], [70] on geographical location-based similarity calculation.
Our work is in the similar line as theirs in terms of calculating location-based similarity between IaaS
services. Since IaaS providers such as Amazon and Microsoft provision their services on regional basis
around the world (e.g., USA west, central and east, Europe, Pacific, etc.), to avoid discrepancies among
different providers in defining regions, we calculate the geographical distances between IaaS instances.
Services located in a short distance most likely have similar performance when they are invoked by a user
[33]. In the similarity calculation process, we measure the pair-wise distances of all IaaS service
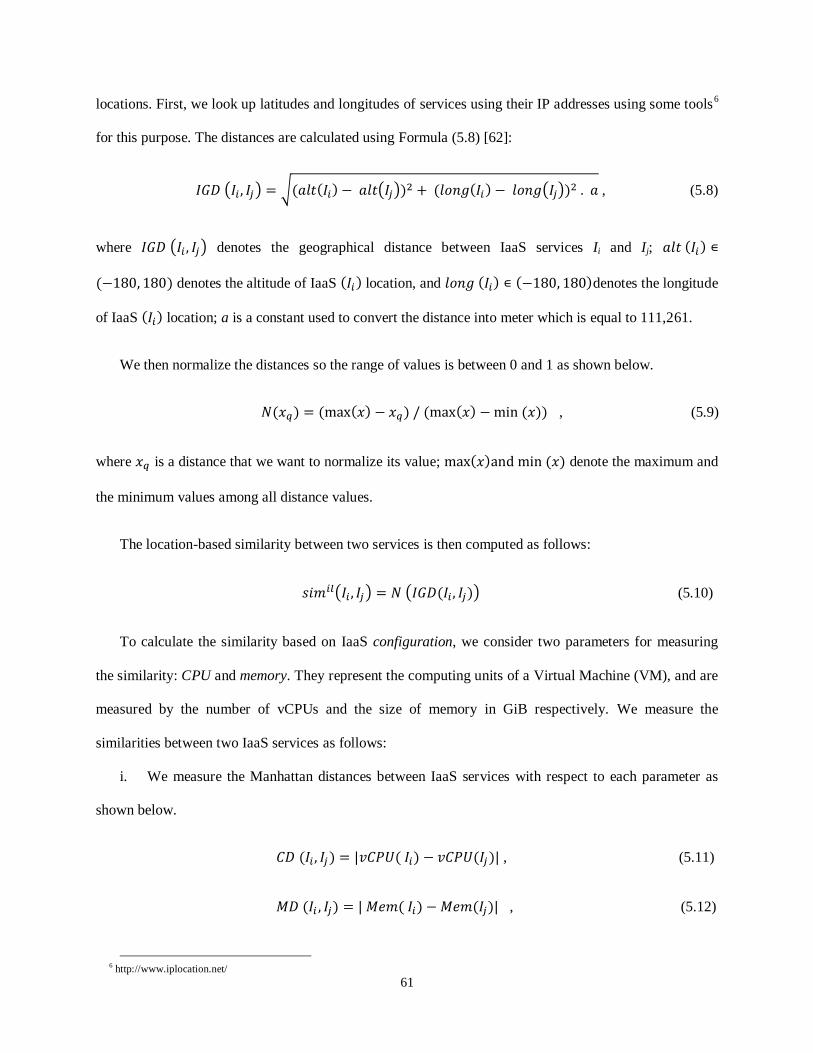
61
locations. First, we look up latitudes and longitudes of services using their IP addresses using some tools6
for this purpose. The distances are calculated using Formula (5.8) [62]:
, (5.8)
where denotes the geographical distance between IaaS services Ii and Ij;
denotes the altitude of IaaS location, and denotes the longitude
of IaaS location; a is a constant used to convert the distance into meter which is equal to 111,261.
We then normalize the distances so the range of values is between 0 and 1 as shown below.
, (5.9)
where is a distance that we want to normalize its value; denote the maximum and
the minimum values among all distance values.
The location-based similarity between two services is then computed as follows:
(5.10)
To calculate the similarity based on IaaS configuration, we consider two parameters for measuring
the similarity: CPU and memory. They represent the computing units of a Virtual Machine (VM), and are
measured by the number of vCPUs and the size of memory in GiB respectively. We measure the
similarities between two IaaS services as follows:
i. We measure the Manhattan distances between IaaS services with respect to each parameter as
shown below.
, (5.11)
, (5.12)
6 http://www.iplocation.net/

62
where and denote the distance between vCPUs and memory units of two IaaS
services Ii and Ij.
ii. We normalize the distance values to the range of [0, 1] with respect to each parameter using 5.11 and
5.12.
iii. We linearly combine the normalized values based on these two configuration parameters to get the
configuration-based similarity value as shown in Formula (5.13).
), (5.13)
where is a coefficient that determines weights of the two similarity terms and . A
decision maker can use them to emphasize on one parameter which has a higher impact on the similarity
calculation.
In the last step, we aggregate the two similarity values ( to obtain the final
configuration-based similarity value as shown in Formula (5.14).
, (5.14)
where represents a weight of the two IaaS features and .
SaaS Similarity Computation
We use two internal features for calculating SaaS similarity including service functions and
algorithms. We compute the functionality-based similarity between SaaS services by comparing their
description documents (i.e., WSDL) in which service functions are defined. We use the Jaccard Similarity
Coefficient technique (Jaccard) [93] to calculate the words matching percentage between WSDL
documents of two SaaS services. The Jaccard similarity value represents the number of common words
found in two service description documents divided by the total number of words in two documents. To
further improve the accuracy of the similarity score, other techniques can also be used such as semantic-
based technologies. We calculate the similarity based on service functions using Formula (5.15).

63
, (5.15)
where
represents a set of words which can be used to describe the functionality of service .
Since one function can have multiple implementations, each of them may have different accuracy,
efficiency levels, or even produce different results, to more accurately measure the similarity between two
SaaS services with same functionality, we also consider their implementation algorithms. For instance, a
clustering service can be implemented using many different algorithms such as K-means, hierarchical,
EM, etc. Every implementation is considered as a different SaaS service which could have different QoS
values (e.g., execution time). Services using same algorithms usually have similar performances. The
algorithm-based similarity is dependent on the functionality-based similarity. If two SaaS services are
functionally dissimilar then the algorithm-based similarity value is 0; otherwise, it is evaluated using
Jaccard Coefficient measurement. We compute the SaaS similarity based on algorithms using Formula
(5.16).
, (5.16)
where represents a set of words which can be used to describe the implementation algorithm of
service and is the Jaccard coefficient of and
.
In the last step, we aggregate the two SaaS similarity values ( to obtain the final
similarity value of SaaS services using Formula (5.17).
, (5.17)
where is a coefficient used as a weight for the two SaaS internal features and .
DaaS Similarity Computation
We compute the similarity of DaaS service (DaaS) using service location and size of accessed data.
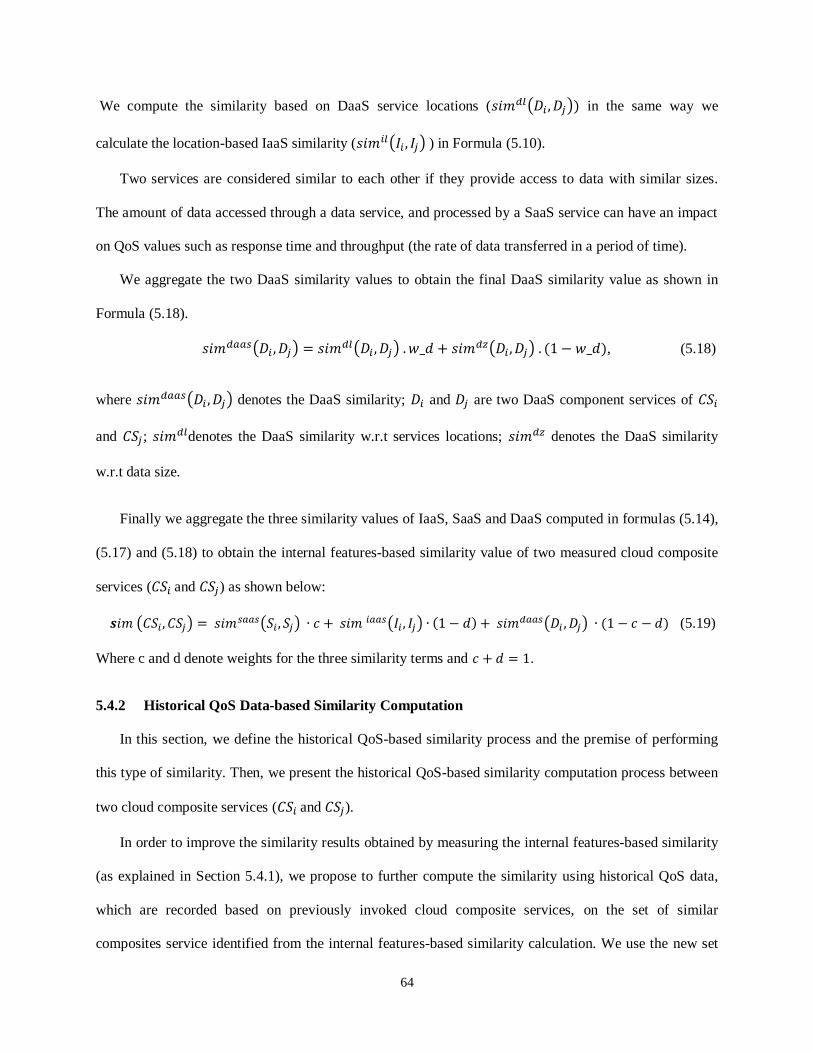
64
We compute the similarity based on DaaS service locations ( in the same way we
calculate the location-based IaaS similarity ( ) in Formula (5.10).
Two services are considered similar to each other if they provide access to data with similar sizes.
The amount of data accessed through a data service, and processed by a SaaS service can have an impact
on QoS values such as response time and throughput (the rate of data transferred in a period of time).
We aggregate the two DaaS similarity values to obtain the final DaaS similarity value as shown in
Formula (5.18).
, (5.18)
where denotes the DaaS similarity; and are two DaaS component services of
and ; denotes the DaaS similarity w.r.t services locations; denotes the DaaS similarity
w.r.t data size.
Finally we aggregate the three similarity values of IaaS, SaaS and DaaS computed in formulas (5.14),
(5.17) and (5.18) to obtain the internal features-based similarity value of two measured cloud composite
services ( and ) as shown below:
(5.19)
Where c and d denote weights for the three similarity terms and .
5.4.2 Historical QoS Data-based Similarity Computation
In this section, we define the historical QoS-based similarity process and the premise of performing
this type of similarity. Then, we present the historical QoS-based similarity computation process between
two cloud composite services ( and ).
In order to improve the similarity results obtained by measuring the internal features-based similarity
(as explained in Section 5.4.1), we propose to further compute the similarity using historical QoS data,
which are recorded based on previously invoked cloud composite services, on the set of similar
composites service identified from the internal features-based similarity calculation. We use the new set
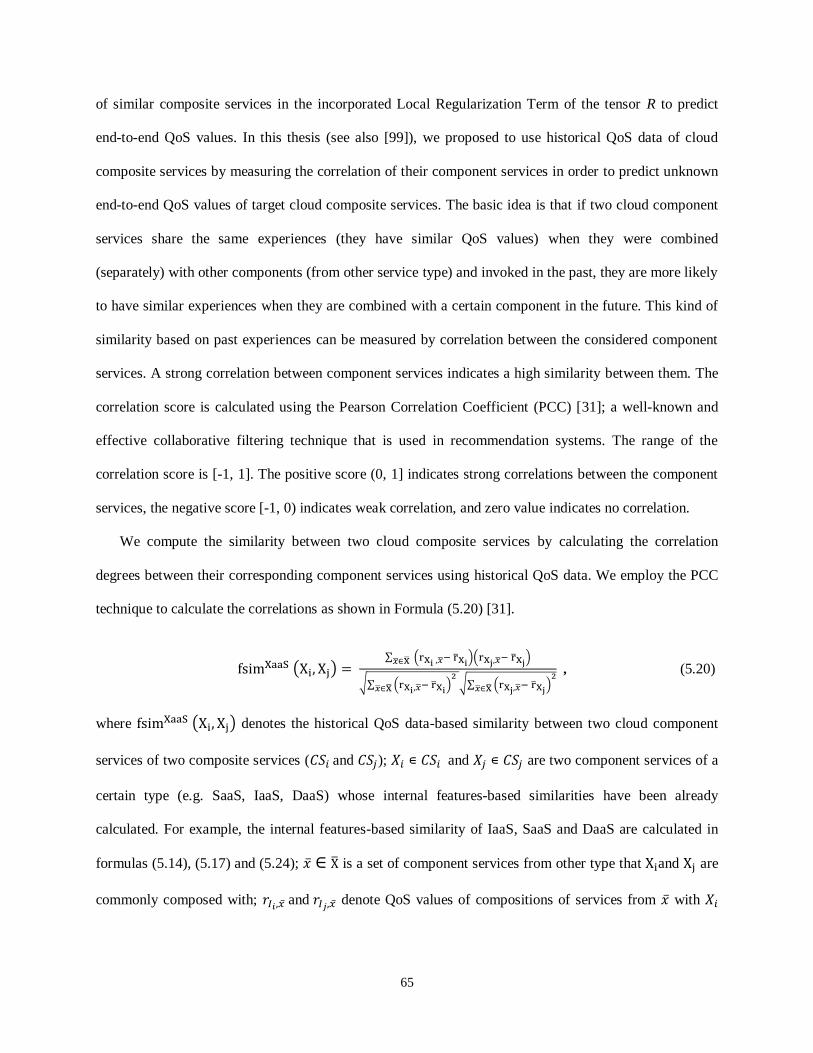
65
of similar composite services in the incorporated Local Regularization Term of the tensor R to predict
end-to-end QoS values. In this thesis (see also [99]), we proposed to use historical QoS data of cloud
composite services by measuring the correlation of their component services in order to predict unknown
end-to-end QoS values of target cloud composite services. The basic idea is that if two cloud component
services share the same experiences (they have similar QoS values) when they were combined
(separately) with other components (from other service type) and invoked in the past, they are more likely
to have similar experiences when they are combined with a certain component in the future. This kind of
similarity based on past experiences can be measured by correlation between the considered component
services. A strong correlation between component services indicates a high similarity between them. The
correlation score is calculated using the Pearson Correlation Coefficient (PCC) [31]; a well-known and
effective collaborative filtering technique that is used in recommendation systems. The range of the
correlation score is [-1, 1]. The positive score (0, 1] indicates strong correlations between the component
services, the negative score [-1, 0) indicates weak correlation, and zero value indicates no correlation.
We compute the similarity between two cloud composite services by calculating the correlation
degrees between their corresponding component services using historical QoS data. We employ the PCC
technique to calculate the correlations as shown in Formula (5.20) [31].
, (5.20)
where denotes the historical QoS data-based similarity between two cloud component
services of two composite services ( and ); and are two component services of a
certain type (e.g. SaaS, IaaS, DaaS) whose internal features-based similarities have been already
calculated. For example, the internal features-based similarity of IaaS, SaaS and DaaS are calculated in
formulas (5.14), (5.17) and (5.24); is a set of component services from other type that and are
commonly composed with; and denote QoS values of compositions of services from with

66
and , respectively; and
denote the average QoS values of and when composed with ,
respectively.
5.4.3 Selecting Nearest Neighbors for the Prediction Process
The internal feature-based similarity values calculated using formulas (5.14), (5.17) and (5.18) are in
the range of [0, 1]. The historical QoS-based similarities (Formula 5.20), which are computed based on
the results of the internal features-based similarities, are in the range of [-1, +1], where -1 means a
negative correlation, +1 means positive correlation and 0 means no correlation. We only consider values
that are greater than 0 during the prediction process where a bigger value means a higher similarity
degree. Determining the accepted range of similarity degree is important since the similarity value of 0
means that two composite services are dissimilar (in the case of internal features-based similarity) and the
value range of [-1, 0] means that composite services are not correlated with each other. Consequently, the
new sets of similar cloud composite services are smaller than the initial one containing less number of
similar composite services. We use the new set to predict end-to-end QoS values of a target composition
for a target user. We denote the set as top K similar cloud composite services. Selecting a proper value of
K is important for computing an accurate prediction. On one hand, including a large pool of similar
component services in the prediction can cause noise to the prediction computation. Composite services
with low similarity values can degrade the prediction accuracy. On the other hand, including a small set
of similar services can eliminate important information which could help in the learning process to predict
missing QoS values.
5.4.4 User Similarity Computation for Prediction Personalization
Since there could be multiple invocations from different users on one composite service, instead of
one recorded QoS value per invocation of a cloud composite service, there could be multiple values for
each composite service based on invocations from these users. The obvious challenge is to personalize the
prediction process so that the predicted end-to-end QoS values of target composite services are computed

67
for target users. To predict end-to-end QoS values for target users, the composite service similarity
calculation should be based on only QoS data recorded from similar users to the target users. To achieve
this goal, we compute users’ similarity. The premise for computing users’ similarities has two folds. First,
similar users in some respect (e.g. from close-by-locations) tend to observe similar QoS values when
invoking the same services. Second, if a target user has not invoked a composite service in the past, end-
to-end QoS values of similar users can be used to predict end-to-end QoS value of that user. We compute
users’ similarity using their geographical locations. To do so, we follow the same steps of the location-
based IaaS similarity calculation. We compute the similarity between two users using their calculated
geographical distances ( ), and then we normalize the distances to compute the similarity
values as shown below.
, (5.21)
n , (5.22)
where denotes the location-based similarity between users and ;
denotes the normalized geographical distance between and ; alt refers to altitude and long refers to
longitude.
Then, we use the historical QoS data-based method to compute the correlation degrees between the
similar users. A new set of similar users is obtained. The similarity calculation based on the historical
QoS data is shown in Formula (5.23) [31].
, (5.23)
where denotes the historical QoS data-based similarity between users and ; is
a set of cloud composite services that are commonly invoked by and ; and are two vectors

68
of QoS values experienced by and when invoked c; and
denote the average QoS values
experienced by and .
Similarly, we identify the top K similar users whose similarity values are greater than 0. We use the
recorded historical QoS values of only top K similar users to predict QoS values of cloud composite
services which have been invoked by multiple users in the past. For this type of composite services, we
predict their QoS values using Formula (5.24).
, (5.24)
where is the predicted QoS value of a composite service c for a target user tu; tu denotes the
average QoS value of multiple composite services invoked by tu; is the average QoS value a composite
service experienced by similar users who are identified using Formula (5.23); denotes the QoS
value of c observed by users .
We performed the prediction process presented above for all composite services which have been
invoked by different users with recorded QoS values. The computed QoS values in this process are used
during the similarity process of cloud composite services as it is explained in the previous sections.
5.5 Computing Predicted End-to-End QoS Values
In Section 5.4.4, we have personalized all recorded QoS values (historical data) to target users. In the
next step, we predict end-to-end QoS values for target cloud composite services. In this section, we
present two case studies of the prediction process. Both represent specialized prediction models of the
generalized prediction model presented in Section 5.3. The first case study shows the prediction model for
cloud composite services with two cloud component services. The second case study shows the prediction
model for cloud composite services with three cloud component services.

69
5.5.1 End-to-End QoS Prediction for Cloud Composite Services with Two Component
Services
In this section, we present a case study where we apply our prediction model MCSSTF on cloud
composite services with two component services. We consider SaaS and IaaS component services. The
generalized form of the objective function we presented in Section 5.3 can be written for two component
services as shown in Formula (5.25) below:
1 2( )ˆ ( , , )min2 1 1,
m nRR S I efV Refef
e fS I
(5.25)
To further improve the accuracy of the predicted values, we apply the incorporated local term twice
with respect to the SaaS component and IaaS component. In the first step, we need to identify two
neighborhoods for SaaS services and IaaS services, respectively, which include similar SaaS and IaaS
component services to the target ones. To do so, we apply the proposed internal features-based similarity
process on the available SaaS services and IaaS services in the tensor R and then we apply the proposed
historical QoS data-based similarity process on the two sets obtained from the internal features-based
process, respectively. Then we combine the SaaS-based local term and IaaS-based local term so that the
information of similar SaaS component services and similar IaaS component services are utilized within
the MCSSTF to predict the end-to-end QoS values of the target cloud composite services.
We compute a local minimum of the objective function in Formula (5.25) using the gradient descent
algorithm in as follows:
(5.26)
(5.27)

70
1( , , , )min
2, ,
R S I D
S I D
𝑽𝒆𝒇𝒈𝒄𝒈=𝟏 (𝑹𝒆𝒇𝒈 𝒏
𝒇=𝟏 𝑹 𝒆𝒇𝒈) 𝒎𝒆=𝟏
(9)
The gradient function in Formula (5.26) uses similar SaaS component services so K (i), in this case,
refers to the top K similar SaaS services. And, the gradient function in Formula (5.27) uses similar IaaS
component services so K (i), in this case, refers to the top K similar IaaS services. The gradient descent
algorithm can handle any number of dimensions which very well suit our objective. It also provides the
required accuracy with a lower iteration cost compared to the other methods such as conjugate algorithm.
The predicted QoS values, which are obtained by calculating the errors through gradient decent algorithm,
are used in the evaluation process (Section 5.7.1.2 and Section 5.7.2.2) to compare our prediction
approach against other approaches in terms of the accuracy of the predicted QoS values.
5.5.2 End-to-End QoS Prediction for Cloud Composite Services with Three Component
Services
In the second case study, we apply our MCSSTF model on cloud composite services with three
component services (SaaS, IaaS and DaaS). The objective function we build to minimize the error can be
applied on three matrices of SaaS, IaaS and DaaS. It can be written with respect to the three components
as shown below:
A local minimum of the objective function in (9) can be found by performing the gradient descent in
as follows:
(5.28)
(5.29)
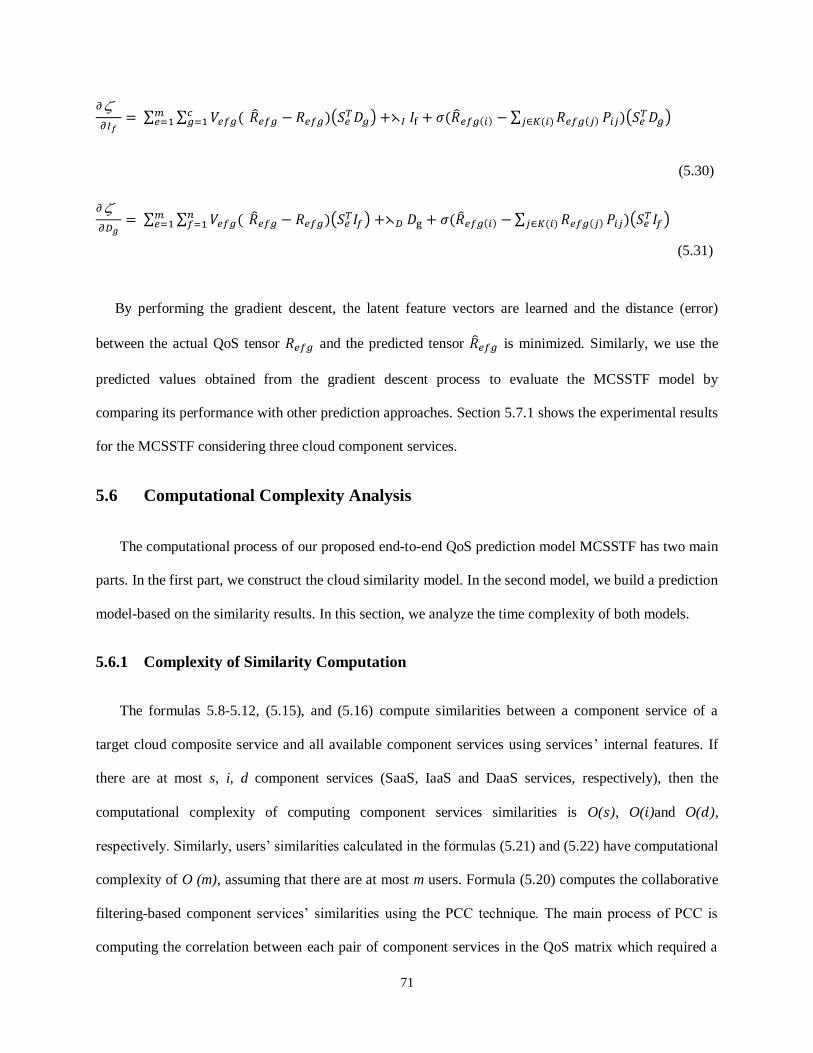
71
By performing the gradient descent, the latent feature vectors are learned and the distance (error)
between the actual QoS tensor and the predicted tensor is minimized. Similarly, we use the
predicted values obtained from the gradient descent process to evaluate the MCSSTF model by
comparing its performance with other prediction approaches. Section 5.7.1 shows the experimental results
for the MCSSTF considering three cloud component services.
5.6 Computational Complexity Analysis
The computational process of our proposed end-to-end QoS prediction model MCSSTF has two main
parts. In the first part, we construct the cloud similarity model. In the second model, we build a prediction
model-based on the similarity results. In this section, we analyze the time complexity of both models.
5.6.1 Complexity of Similarity Computation
The formulas 5.8-5.12, (5.15), and (5.16) compute similarities between a component service of a
target cloud composite service and all available component services using services’ internal features. If
there are at most s, i, d component services (SaaS, IaaS and DaaS services, respectively), then the
computational complexity of computing component services similarities is O( ), O( )and O( ),
respectively. Similarly, users’ similarities calculated in the formulas (5.21) and (5.22) have computational
complexity of O (m), assuming that there are at most m users. Formula (5.20) computes the collaborative
filtering-based component services’ similarities using the PCC technique. The main process of PCC is
computing the correlation between each pair of component services in the QoS matrix which required a
(5.30)
(5.31)

72
nested loop. Therefore, the computational complexities of the PCC is O ( ) where se denotes a number
of component services in a cloud composite service such as SaaS, IaaS and DaaS. Similarly, the
computational complexity of the PCC applied on user similarities calculated in Formula (5.23) is O ( ).
As we discussed before, the PCC technique is applied on initial set of similar composite services after
computing the internal features-based similarity. It means that there are only a small number of services
involved in the PCC-based similarity computation process. Besides, all similarity computations are done
offline, before launching the prediction model in real time. As a consequence, the similarity computation
has no influence on the real time prediction performance. When required, we aggregate similarity results
using a linear combination approach to get the final similarity results. Therefore, the computational
complexities of IaaS, SaaS and DaaS similarity aggregations calculated in formulas 5.14, 5.17 and 5.18
are O( + ), O( + ) and O( + ), respectively. The computational complexity of the aggregation of
the three similarities is O( ).
5.6.2 Complexity of Prediction Computation
The main computation of the prediction model is computing the objective function in Formula 5.6
and their gradient descent algorithms (formulas 5.26, 5.27, 5.29, 5.30 and 5.31). The computational
complexity of the objective function is O (pl + plK |cs|), where p is the number of non-zero entries of the
tensor R, l is the dimensionality which refers to the number of latent features, K is the nearest neighbor
cloud composite services to a target composite service, and |cs| is the total population of cloud composite
services that has end-to-end QoS values recorded in the tensor. Since tensor R is sparse, we can assume
that |cs| is very small, so it is reasonable to assume that K is far less than p (k << p), since K represents
the number of similar composite services. Therefore, the total computation of a single iteration of the
learning process in the tensor R factorization is O (pl).
A special case of our model is the one that deals with cloud composite services with two components,
as we discussed in Section 5.5.1. The computational complexity of its gradients
and
are O (pl +

73
pl |S|) and O (pl + pl |I|), respectively, where S is the number of SaaS services population and I is
the number of IaaS services population, and are nearest SaaS and IaaS neighbors to SaaS and IaaS
components of target cloud composite services. Both and are very small numbers since including a
large pool of service could introduce noise to the learning process; thus, the two values have no influence
on the computational complexity. Therefore, the total computational complexity in the case of the two-
component-based prediction process is O (pl).
The computational complexity analysis indicates that our end-to-end QoS prediction process is linear
with the growing numbers of R’s entries. As a result, our proposed model can scale up to a large dataset
efficiently. It also indicates that our model can scale out to a multi-dimensional model (i.e. including
more cloud component services in a composite service) without affecting the total complexity since the
total computational complexity relies on p and l. The number of entries, in general, is small since our
realistic scenario assumes that R is sparse. On the other hand, l cannot be set to a large number regardless
of the number of component services in R and the size of their populations. The experimental results have
shown the negative impact of setting l to a large number on the prediction accuracy.
5.7 Experiments
These series of experiments validated our end-to-end QoS prediction model. We chose to conduct the
experiments for two dimensional and three dimensional QoS prediction models. The first part of the
experiments validates the three-dimensional prediction model, and it is presented in Section 5.7.1. The
second part of the experiments validated the three-dimensional prediction model, and it is presented in
Section 5.7.2. In the experiments, we had several objectives: 1) we evaluated the performance of our
proposed QoS prediction model by comparing it with other well-known prediction models; 2) we studied
the impact of QoS data sparseness on prediction accuracy of all prediction models including ours; 3) we
demonstrated the impact of considering vertical service composition on the prediction accuracy; 4) we
studied the impacts of important parameters used in the proposed model.

74
We conducted the experiments using real end-to-end QoS data of cloud composite services. To
monitor and collect end-to-end QoS data, we have used a cloud-based QoS service monitoring and
collecting system which has been developed in our department at Ryerson University [100]. The system
was developed using Apache platform and Java language. The collected data is stored in MySQL
database. The system has a client application through which a user can submit her request for a cloud-
based service solution. We have conducted experiments to validate the two and the three dimensional
QoS prediction process. In the two-dimensional-based process, each cloud composite service is composed
of two component services: SaaS and IaaS. In the three-dimensional-based process, each cloud composite
service is composed of three component services- SaaS, IaaS and DaaS. Accordingly, we have set two
environments for the two cases.
5.7.1 Experiments for the Three-Dimensional End-to-End QoS Prediction
5.7.1.1 Experimental Setup
Based on user’s request, a composite service was created from the three component services which
represent three layers in cloud computing architecture (i.e. SaaS, IaaS and DaaS). The software services
were developed based on data mining algorithms provided by Weka. The data services were developed to
provide on demand access to different types of data which are downloaded from Weka. In our work, the
main task of data services was to provide on demand access point to the data through local search process.
The main task of SaaS services was to invoke the data services in order to access and process the data
based on users’ functional requirements. In the proposed model, the cloud service composition is made of
SaaS services, data services and infrastructure services. Figure 5.3 illustrates the experimental
environment that we used to conduct the required experiments for our proposed model. In the
experiments, the infrastructure services were represented by Amazon EC2 instances. They host the
software and data services, and they were selected with different configurations and at different locations.
To mimic real world scenarios, software and data services within a certain composite service were not

75
necessarily hosted in the same location. The system was designed to monitor and record data of five QoS
properties: response time, throughput, latency, reliability and availability.
In the experiments, for simplicity, we chose response time and throughput to evaluate our model and
demonstrate its effectiveness. The response time measures the round trip time of a request sent by a user,
who submits her information using the client application, plus the time it takes to receive the results. It
includes transmission and service communication and processing time. The measurement unit is in
seconds, and the tendency is low meaning the lower the value the better the service performance is. The
throughput measures the number of requests (requests) transferred in a period of time (seconds). The
measuring unit is r/sec, and the tendency is high meaning the higher the value the better the service
performance is. We have selected 9 SaaS services for the experiment that offer three different functions.
Each service function was implemented using different algorithms as shown in Table 5.1. We also used 9
different virtual machines from 7 Amazon EC2 instances which represent IaaS services; their
configurations are shown in Table 5.2. We used 9 developed DaaS services that provide access to 9 data
files from Weka with different ranges of sizes, as shown in Table 5.3. The selected locations of IaaS
which was composed with SaaS and DaaS services are (US east N.Virginia, US west N. California, US
west Oregon, EU Ireland, EU Frankfurt, Asia Pacific Singapore, Asia pacific Tokyo, Asia Pacific Sydney,
and South America Sao Paulo). To add some complexity, we assumed that SaaS and DaaS services of a
Figure 5.3: Experimental Environment.

76
composite service were not hosted in the same location. SaaS services (data mining services, in this
experiment) invoked data services to access and process the required data according to users’
requirements. The response time and throughput values of 9 SaaS services composed with 9 IaaS services
and 9 DaaS services were recorded in a 9 x 9 x 9 tensor. In the experiments, 100000 requests were sent by
10 users from 10 different locations so that each user sent 10000 requests to each composite service. In
order to simulate users’ locations, we used the virtual private network (VPN) technology. By configuring
the VPN service, multiple VPN servers were created in different locations. So, using our client
application, requests were sent from different locations around the world to be processed by different
composite services. The users’ locations were selected in three regions (USA west, central Europe and
Asia Pacific). In real world, users only invoke a few services. To make the service’s QoS tensor sparser,
we only recorded a few response time and throughput values.
SaaS service Functionality
Weka EM Clustering
Weka Hierarchical Clustering
Weka FarthestFirst Clustering
Weka SimpleKMean Clustering
Weka BFTree classification
Weka LMTree classification
Weka RandomForest classification
Weka Apriori Associative rules
Weka Tertius Associative rules
Table 5.1: Data Mining SaaS Services.
IaaS service Compute Configuration
(CPU cores; Memory GiB;
Storage GB)
Amazon t2.micro 1; 1; 15
Amazon t2.small 1; 2; 15
Amazon t2.medium 2; 4;15
Amazon m3.large 2; 7.5; 32
Amazon m3.xlarge 4; 15; 80
Amazon c4.2xlarge 8; 15; 15
Amazon c4.4xlarge 16; 30; 30
Table 5.2: Configurations of Hosting IaaS Services.
.

77
5.7.1.2 Evaluation
To evaluate the accuracy of the proposed MCSSTF prediction model, we compared its accuracy in
predicting unknown end-to-end response time and throughput values with other well-known prediction
models. We carefully selected the compared methods to reflect different prediction approaches from basic
to advanced algorithms. Below is a list of the selected prediction methods. All these methods can be used
to predict unknown end-to-end QoS values of target composite services:
MEAN: this method calculated the average QoS value of composite services. In this experiment, R is a
three dimensional tensor of IaaS, SaaS and DaaS. MEAN does not handle multi-dimensional structure.
Therefore, we computed the QoS average value of compositions of all SaaS and IaaS services with
respect to one DaaS service.
PCC: this method was used to calculate the similarity using the PCC technique on a two-dimensional
matrix of users and services [64]. The PCC technique is not capable of predicting QoS values of cloud
composite services of multiple components. Therefore, we used PCC on compositions of SaaS and IaaS
services with respect to one DaaS service.
Data files Size in KB
Hayes-roth_test.arff 7222
Iris.arff 7486
Lung-cancer.arff 7734
glass.arff 17823
hepatitis.arff 17135
Spectf_train.arff 17169
cmc.arff 33589
Primary-tumor.arff 34090
Credit-a.arff 34315
Table 5.3: Data Set Accessed through Data Services.

78
IF (Internal Features-based Model): we proposed this method to predict end-to-end QoS values of cloud
composite services by employing internal features in the similarity and the prediction computation
processes [101]. In the experiments of this thesis, we used it to compute the similarity of cloud composite
services and then we calculated the average values of QoS data of similar composite services to predict
QoS values of target composite services.
MF (Matrix Factorization-based Model): it is a common method for recommendation systems which is
used to predict future values [62][67][71]. It is composed of a traditional regularization term of a matrix
factorization model to compute predicted values through a learning process. The MF can only factorize a
matrix of two parameters. Therefore, in the experiments, we applied it on matrices of SaaS and IaaS with
respect to one DaaS service to learn the latent features in order to predict end-to-end QoS values.
IF-MF (Internal Feature Incorporated Matrix Factorization Model): we developed this method that
calculates the internal features-based similarity of a matrix of SaaS and IaaS services. In this experiment,
we computed the matrix factorization on a two- dimensional matrix of SaaS and IaaS service with respect
to one DaaS. We built a local regularization term with internal features-based similar cloud composite
services. The similarity regularization term is incorporated in the traditional matrix factorization model.
PCC-MF (PCC Incorporated Matrix Factorization Model): this method was used to compute predicted
values by integrating the similarity model using PCC into a matrix factorization model [69]. This method
cannot handle the similarity and the prediction computation processes for our multi-dimensional
prediction model. In our experiments, we applied it on matrices of SaaS and IaaS services with respect to
one DaaS service.
MCSSTF: we proposed our multi-dimensional cloud service similarity tensor factorization model and
used it in this thesis to predict end-to-end QoS values of cloud composite services with multiple
component services. It factorizes latent features of multiple matrices. It incorporates a new regularization
term in the global learning process. The new term computes cloud composite service similarity using

79
services’ internal features and historical QoS data. In the experiments and for the sake of simplicity, we
considered a tensor of three component services (SaaS, IaaS and DaaS).
The above methods are evaluated by comparing The Mean Absolute Error (MAE) values. The MAE
method is adopted to measure the prediction accuracy by computing the average absolute deviation of the
predicted values from the actual data. The smaller MAE values indicate higher prediction accuracy. MAE
is defined using the following Formula (5.32):
𝑹 𝒆𝒇𝒈 𝑹𝒆𝒇𝒈
, (5.32)
where m, n, c denote the number of the SaaS, IaaS and DaaS components; denotes the actual
QoS value of a composite service; denotes the predicted QoS value; L is the number of the predicted
values.
To mimic real world scenarios where only a few services are invoked, we randomly removed values
from the tensor . The remaining values are used for the learning purpose to predict the removed ones. In
the experiment, we created four tensor densities as follows: 10%, 30%, 50% and 90%. The percentages
represent the amount of QoS values we keep for learning purpose, and the removed parts are used for
testing. We used multi-fold cross validation method on the observed QoS data to study the impact of the
parameters used in our method. The following setting was used for the parameters: = = = = 0.01,
l = 12, K = 20. Table 5.4 shows the MAE values of the compared prediction methods on response time
and throughput. The observation is that our MCSSFT model outperforms all other models in terms of the
accuracy of end-to-end QoS prediction results as it produces the lowest MAE values. This observation
applies to all tensor density settings.

80
Impact of Tensor Density
To study the impact of tensor density on the prediction accuracy of the selected prediction models, we
used four density settings (10%, 30%, 50% and 90%). We observed that all models had lower MAE
values as tensor density increases. This indicates that the sparse tensor provides more accurate results
when more information is injected into them for the learning process. We observed that the MCSSTF
model has a better performance than other models for all densities as more QoS data are provided along
with the internal features information. With regard to the response time, Figure 5.4 shows that as the
tensor density increases from 10% to 90%, our model has improved by 20% in terms of the prediction
accuracy. Other models have improved by 4%, 5.5 %, 7%, 7.8 %, 8% and 10% respectively. With regard
to the throughput, Figure 5.5 shows that our model has made an improvement of 11% compared to the
other models which have made the improvements of 1.8%, 2.4 %, 2.8%, 3.4 %,3.8%, 5.5%, , respectively.
Furthermore, we observed that our model’s improvement has doubled when the density increased from
10% to 90% compared to the increase from 50% to 90% for other models. This indicates that accuracy
result of a sparser tensor can improve significantly using our model when more information is provided.
Prediction
Approach
Density=10% Density=30% Density=50% Density=90%
RT TP RT TP RT TP RT TP
MEAN 2.103 11.125 2.084 11.118 2.062 11.103 2.029 10.933
IF 2.004 11.108 1.977 11.088 1.947 11.037 1.892 10.850
PCC 1.817 11.031 1.790 11.022 1.759 11.004 1.691 10.722
MF 1.801 11.015 1.771 11.004 1.721 10.992 1.659 10.638
IF-MF 1.769 11.002 1.740 10.989 1.702 10.967 1.631 10,593
PCC-MF 1.742 10.980 1.711 10.959 1.666 10.928 1.581 10.487
MCSSTF 1.579 10.871 1.521 10.825 1.411 10.727 1.269 9.701
Table 5.4: Comparison of Different Prediction Approaches for the Three-
dimensional Prediction Model (Lower MAE Values Indicate Better Prediction Accuracy)

81
Impact of Latent Features
Our prediction model has the capability to discover latent features that underlines the interactions
between different types of cloud services. Latent features are very small number compared to the number
of services involved in the prediction process. The parameter l determines the number of latent features
used to factorize the tensor into SaaS specific, IaaS specific and DaaS specific matrices. In the
9.8
10
10.2
10.4
10.6
10.8
11
11.2
MEAN IF PCC MF IF-MF PCC-MF MCSSTF
Density 10%
Density 30%
Density 50%
Density 90%
M
AE
Figure 5.5: Impact of Tensor Density (Throughput).
1.2
1.3
1.4
1.5
1.6
1.7
1.8
1 3 5 7 9 11 13 15 17 19
Density 30%
Density 90%
M
AE
number of latent features
0.4
0.6
0.8
1
1.2
1.4
1.6
1.8
2
2.2
MEAN IF PCC MF IF-MF PCC-MF MCSSTF
Density 10%
Density 30%
Density 50%
Density 90%
M
AE
Figure 5.4: Impact of Tensor Density (Response Time).

82
experiment, we vary the value of l from 1 to 20 with a step of 1 to study the number of latent features
needed in the learning process of the proposed MCSSTF model. We used the following settings: top k
composite services = 20, tensor density= 30% and 90%. Figure 5.6 shows the response time results, and
Figure 5.7 shows the throughput results. The MAE value decreases when the number of latent features
(the value of l) increases. This indicates that including more latent data helps improve the prediction
accuracy. We also observed that after a certain point the accuracy does not improve and remains stable
around an average value of MAE. Increasing the latent features after a certain point not only has no effect
on the prediction result but also creates computational overhead which affect the efficiency of the
prediction process. Furthermore, we set l to a larger number and we found that the prediction accuracy
degrades. This is due to overfitting problem which usually hurts the prediction quality. The tensor density
plays an important role in determining the value of l needed to achieve a better prediction result. When
the tensor is very sparse (density = 30%), a small number of latent features is enough for the factorization
model of SaaS, IaaS and DaaS. In this experiment, the number of latent features required to obtain the
lowest MAE value is 10. However, when enough data from the QoS tensor are available (density = 90%),
more latent feature are required (i.e. the required number of latent features in the experiment is 12) to
factorize the three cloud components.
Figure 5.6: Impact of Number of Latent Features (Response Time).
9.6
9.8
10
10.2
10.4
10.6
10.8
11
11.2
1 3 5 7 9 11 13 15 17 19
Density 30%
Density 90%
M
AE
number of latent f eatures

83
Impact of K value
The K value determines the number of similar cloud composite services that are employed in the
MCSSTF model to predict end-to-end QoS of a target composite service. We investigated the impact of K
using the following settings in the experiment: l = 10 and 12, tensor density = 30% and 90%. We vary the
value of K from 1 to 30 with a step of 1. We observed that regardless of the tensor density, the MAE
value decreases as the value of K increases until it reaches a certain point where the MAE value starts to
increase indicating a degrading of the prediction accuracy. This behavior can be explained as follows: on
one hand, when K value is small a small number of composite services do not provide valuable
information for the learning process. On the other hand, when K value is set too high, a large pool of data
may introduce unwanted noise (dissimilar composite services) to the learning process. Figure 5.8 and
Figure 5.9 show the impact of K value for the response time and throughput, respectively. For both
density settings, the highest prediction accuracy is obtained when K is 20.
Figure 5.19: Impact of Number of Latent Features (Throughput).
9.6
9.8
10
10.2
10.4
10.6
10.8
11
11.2
1 3 5 7 9 11 13 15 17 19
Density 30%
Density 90%
MA
E
number of latent f eatures
Figure 5.7: Impact of Number of Latent Features (Throughput).
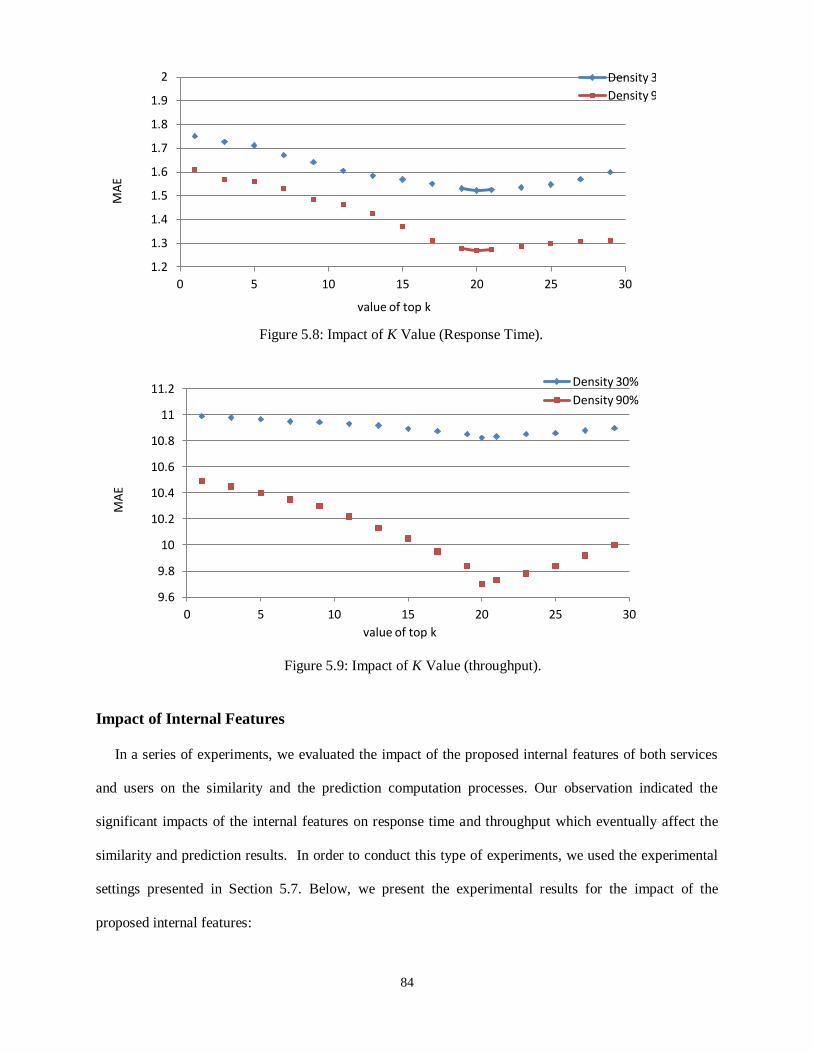
84
Impact of Internal Features
In a series of experiments, we evaluated the impact of the proposed internal features of both services
and users on the similarity and the prediction computation processes. Our observation indicated the
significant impacts of the internal features on response time and throughput which eventually affect the
similarity and prediction results. In order to conduct this type of experiments, we used the experimental
settings presented in Section 5.7. Below, we present the experimental results for the impact of the
proposed internal features:
1.2
1.3
1.4
1.5
1.6
1.7
1.8
1.9
2
0 5 10 15 20 25 30
Density 30%
Density 90%
M
AE
value of top k
Figure 5.8: Impact of K Value (Response Time).
9.6
9.8
10
10.2
10.4
10.6
10.8
11
11.2
0 5 10 15 20 25 30
Density 30%
Density 90%
M
AE
value of top k
Figure 5.9: Impact of K Value (throughput).

85
1) IaaS configuration: to evaluate the impact of IaaS service configurations, we created 7 Amazon EC2
instances which represent different IaaS services. Their different configurations are shown in Table 5.2.
They all were created in the same location (US east- N. Virginia). The same SaaS service (i.e. EM
clustering) was composed with the seven IaaS services to create seven composite services. A user located
in (US east) sent 10000 requests to each composite service to process the same data file
(weathernominal.arff). The latter was accessed using a developed data service which was hosted in the
same locations of IaaS services. The response time and throughput values were calculated, and their
average values were recorded. We observed that the composite services that have instances with advanced
configurations (i.e. higher CPU core, memory size and storage and network) have much better
performance than those that have instances with basic configurations. Figure 5.10 and Figure 5.11 show
that the composite service with (c4.4xlarge) instance has the best response time (the lowest value) and
throughput (the highest value), respectively, whereas the composite service with (t2.micro) has the worst
response time (the highest value) and throughput (the lowest value). The other composite services were
ranked in the order and they are listed in the two figures according to their instance configurations. This
indicates that IaaS configurations with specifications of the memory, the CPU and other units such as
network bandwidths have great impacts on their performance (response time and throughput). The impact
of IaaS configurations on composite services’ performance eventually affects the similarity and the
prediction results.
2
2.2
2.4
2.6
2.8
3
3.2
3.4
t2.micro t2.small t2.medium m3.large m3.xlarge c4.2xlarge c4.4xlarge
response time
RT
(sec
)
IaaS configurations
Figure 5.10: Impact of IaaS Configuration on Response Time.

86
2) IaaS location: to evaluate the impact of the hosting service’s locations, we used 7 instances in 7
locations (one in US east, two in US west, two in Europe, and two in Asia Pacific). All instances have the
same configuration (t2.micro). Then 7 composite services were created which include farthestFirst data
mining algorithm as SaaS services. The SaaS services processed a data file (weathernominal.arff) which
is accessed through a data service. A user located in Toronto sent 10000 requests to each composite
service. The average values of the recorded response time and throughput values are recorded for each
composite service. We observed that the response time and throughput of composite services located
closer to the user are better than those located farther. The response time values of close-by services are
lower compared to services hosted far from the user who sent requests, and the throughput values are
higher. Figure 5.12 shows that the composite service located in US east N. Carolina responded to the user
request (located in Toronto) faster than any other services, and Figure 5.13 shows that the composite
service has also a higher throughput rate than the other composite services. Other observations from the
two figures are as follows: i) services located in Asia Pacific responded slower than any other services
and have lower throughput rate; ii) composite services of same location (or located within short distances)
have similar response time values; iii) composite services located in Europe (CS4 and CS5) are similar in
their response time and throughput with respect to requests sent from a user located in Toronto.
0.2
0.25
0.3
0.35
0.4
0.45
0.5
t2.micro t2.small t2.medium m3.large m3.xlarge c4.2xlarge c4.4xlarge
throughput
IaaS configurations
Figure 5.11: Impact of IaaS Configuration on Throughput.
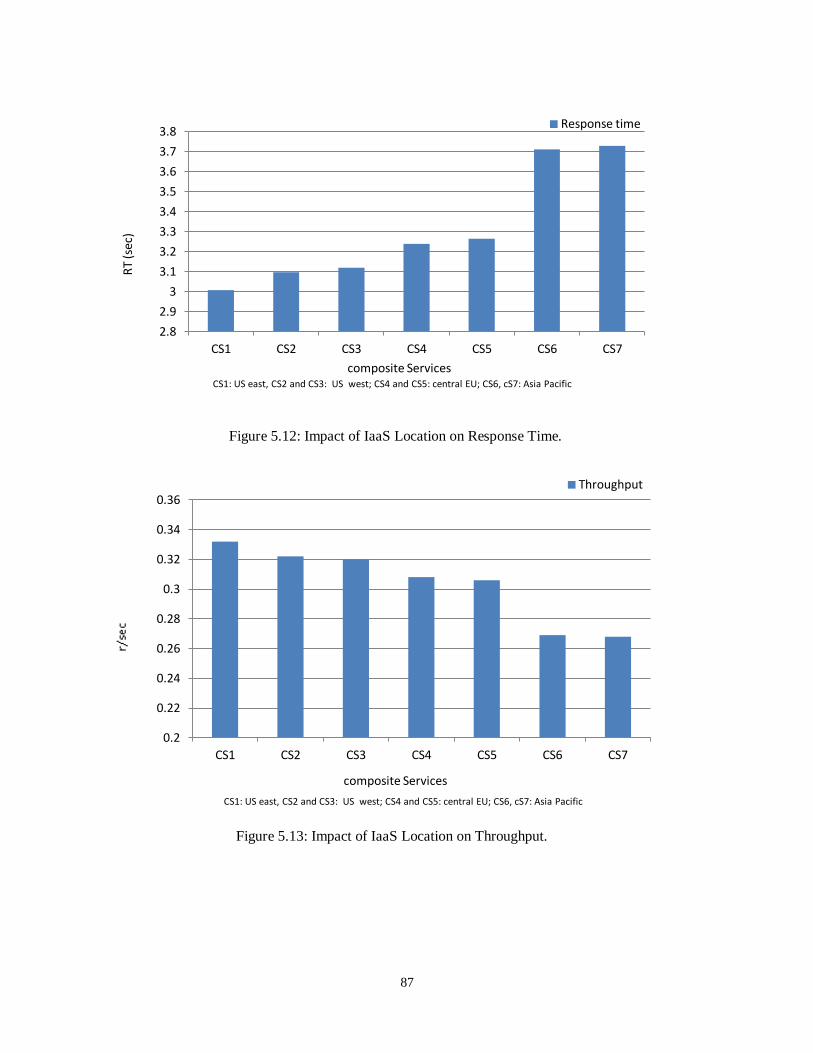
87
2.8
2.9
3
3.1
3.2
3.3
3.4
3.5
3.6
3.7
3.8
CS1 CS2 CS3 CS4 CS5 CS6 CS7
Response time R
T (s
ec)
composite Services CS1: US east, CS2 and CS3: US west; CS4 and CS5: central EU; CS6, cS7: Asia Pacific
Figure 5.12: Impact of IaaS Location on Response Time.
0.2
0.22
0.24
0.26
0.28
0.3
0.32
0.34
0.36
CS1 CS2 CS3 CS4 CS5 CS6 CS7
Throughput
composite Services
CS1: US east, CS2 and CS3: US west; CS4 and CS5: central EU; CS6, cS7: Asia Pacific
Figure 5.13: Impact of IaaS Location on Throughput.

88
3) SaaS functions and algorithms: the experiment demonstrated the impact of SaaS functionality on
services similarity and eventually the predicted response time and throughput values. We selected an
Amazon EC2 instance (t2.micro) located in US west. There were eight composite services; each has
different SaaS service processing the same data file (weathernominal.arff). The data file is accessed
through a data service and it was processed by the eight SaaS services. The SaaS services represent three
different data mining algorithms (clustering, classification and association rules). A user located in
Toronto sent 10000 requests to each of the 8 composite services. We observed that composite services
that offer the same functionality have similar response time and throughput levels. Figure 5.14 and Figure
5.15 show three different levels of response time and throughput values, respectively, that correspond to
the three different SaaS functionalities. Also, in the two figures, we observed the different response time
and throughput values of different implemented algorithms within a particular service functionality (e.g.
EM, Hierarchical and FartherFirst clustering services).
3
3.05
3.1
3.15
3.2
3.25
SaaS1 SaaS2 SaaS3 SaaS4 SaaS5 SaaS6 SaaS7 SaaS8
response time
SaaS services with different functions
RT
(sec
)
Figure 5.14: Impact of SaaS Functionality and Algorithms on Response Time.

89
4) User location: The experiment objective was to demonstrate the impact of users’ locations on the
similarity measurements. Using the VPN service, we simulated 9 users’ locations in the three selected
regions as follows: US west (San Francisco, Las Vegas and Los Angeles), central Europe (Munich,
Zurich and Zlin), Asia Pacific (Tokyo, Hong Kong and Singapore) so there are 3 users within each
defined region. In the experiment, we selected an IaaS instance (t2.micro) located in US west. A
composition of Weka EM (SaaS) and Amazon EC2 t2.micro (IaaS) was created. A data file
(weathernumeric.arff) was accessed using a developed DaaS service and it was processed by the
composite service (WekaEM, t2.micro) for all users. This ensures that all users have the same workload.
As shown in Figure 5.16 and Figure 5.17, users in the same region observed similar response time and
throughput levels, respectively, when invoking the composite service. However, users located across the
regions observed different response time and throughput levels when invoking the composite service.
Furthermore, users who are located in regions close to the hosting IaaS service observed better response
time (lower values) and throughput (higher value) than those located farther. For example, the users (U1,
U2 and U3) who are located in US west observed better response time and throughput rates than other
users since the composite service is hosted in US west.
0.3
0.31
0.32
0.33
0.34
SaaS1 SaaS2 SaaS3 SaaS4 SaaS5 SaaS6 SaaS7 SaaS8
Throughput
SaaS services with different functions
Figure 5.15: Impact of SaaS Functionality and Algorithms on Throughput.

90
5) Data size of DaaS services: In the experiment, we selected 9 composite services that have the same
software service (i.e. EM clustering algorithm) and the same infrastructure service (i.e. Amazon EC2
t2.micro instance). They are all located in US west region. To investigate the impact of the size of the data
processed by the EM service, we chose 9 data services to access 9 data files which have different sizes
and they all are located in the same location (i.e. US east). The 9 data services are clustered based on the
Figure 5.16: Impact of User Location on Response Time.
0.24
0.26
0.28
0.3
0.32
0.34
0.36
U1 U2 U3 U4 U5 U6 U7 U8 U9
Troughput
U1, U2 and U3: US west; U1, U5 and U6: central EU; U6, U7, U8: Asia Pacific
Figure 5.17: Impact of User Location on Throughput.
2.5
2.7
2.9
3.1
3.3
3.5
3.7
3.9
U1 U2 U3 U4 U5 U6 U7 U8 U9
response time
RT(
ms)
U1, U2 and U3: US west; U1, U5 and U6: central EU; U6, U7, U8: Asia Pacific

91
sizes of the data they provide access to. A user located in Toronto region sent 10000 requests to each of
the 9 composite services, and their end-to-end response time and throughput values are recorded in our
database. Figure 5.18 and Figure 5.19 show the response time and throughput, respectively, of the three
clusters with three ranges of data sizes. We observed that composite services that process data with very
close sizes have similar end-to-end QoS values. However, the values across different clusters vary a lot.
This clearly indicates that sizes of the data, processed by composite services which have similar setup
(e.g. location and configuration), have a great impact on the QoS similarity of cloud composite services
which eventually affect the prediction results.
1.5
2.5
3.5
4.5
5.5
6.5
7.5
8.5
Data1 Data2 Data3 Data4 Data5 Data6 Data7 Data8 Data9
Response time
resp
on
se t
ime
(sec
)
0.05
0.1
0.15
0.2
0.25
0.3
Data1 Data2 Data3 Data4 Data5 Data6 Data7 Data8 Data9
Throughput
r
e/se
c
Figure 5.18: Impact of Data Size on Response Time.
Figure 5.19: Impact of Data Size on Throughput.
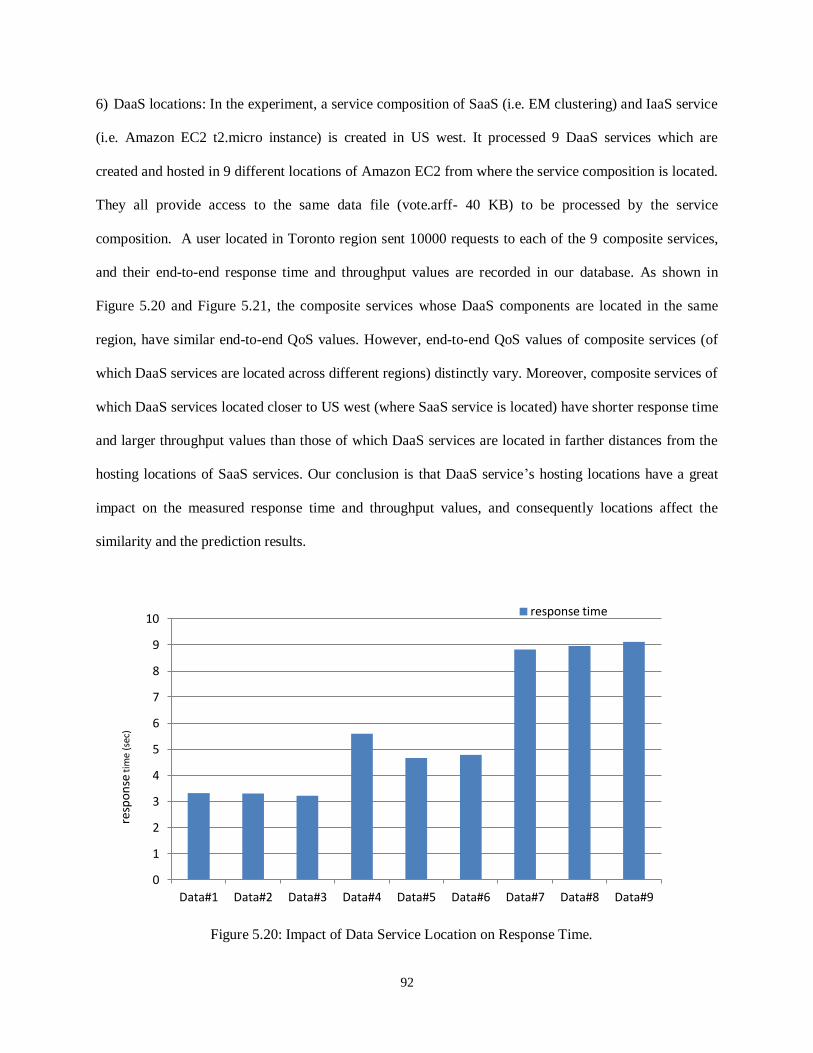
92
6) DaaS locations: In the experiment, a service composition of SaaS (i.e. EM clustering) and IaaS service
(i.e. Amazon EC2 t2.micro instance) is created in US west. It processed 9 DaaS services which are
created and hosted in 9 different locations of Amazon EC2 from where the service composition is located.
They all provide access to the same data file (vote.arff- 40 KB) to be processed by the service
composition. A user located in Toronto region sent 10000 requests to each of the 9 composite services,
and their end-to-end response time and throughput values are recorded in our database. As shown in
Figure 5.20 and Figure 5.21, the composite services whose DaaS components are located in the same
region, have similar end-to-end QoS values. However, end-to-end QoS values of composite services (of
which DaaS services are located across different regions) distinctly vary. Moreover, composite services of
which DaaS services located closer to US west (where SaaS service is located) have shorter response time
and larger throughput values than those of which DaaS services are located in farther distances from the
hosting locations of SaaS services. Our conclusion is that DaaS service’s hosting locations have a great
impact on the measured response time and throughput values, and consequently locations affect the
similarity and the prediction results.
0
1
2
3
4
5
6
7
8
9
10
Data#1 Data#2 Data#3 Data#4 Data#5 Data#6 Data#7 Data#8 Data#9
response time
resp
on
se t
ime
(sec
)
Figure 5.20: Impact of Data Service Location on Response Time.

93
5.7.2 Experiments of the Two-Dimensional End-to-End QoS Prediction
5.7.2.1 Experimental Setup
The experiment environment of the two dimensional QoS prediction is similar to the one of the three
dimensional model. However, cloud composite services are composed of only two component services
(i.e. SaaS and IaaS). The data files are not provided as services; rather, they are uploaded to IaaS services
to be processed by SaaS services at the same locations. This is a simple form of provisioning the data
compared to a more realistic process which we presented in the three dimensional QoS prediction model.
The response time and throughput values of 14 SaaS services composed with 14 IaaS are recorded in a 14
x 14 matrix. Table 5.5 shows SaaS services (Weka-based data mining algorithms). The IaaS service
instances shown in Table 5.2 are used for both two dimensional and three dimensional models. Similarly,
100000 requests were sent by 10 users from 10 different locations so that each user sent 10000 requests to
each composite service. VPN servers are created to simulate users’ locations in three different regions
(USA west, central Europe and Asia Pacific). To make the service’s QoS tensor sparser, we only record a
few response time and throughput values by adjusting the level of the matrix density.
0
0.05
0.1
0.15
0.2
0.25
0.3
0.35
Data1 Data2 Data3 Data4 Data5 Data6 Data7 Data8 Data9
throughput
re/
sec
Figure 5.21: Impact of Data Service Location on Throughput.

94
5.7.2.2 Evaluation
We evaluate the accuracy of our proposed model by comparing its prediction results with other well-
known prediction approaches. Below is a list of the compared models:
MEAN: this method calculates the overall average QoS values of invoked cloud composite services in a
matrix of SaaS and IaaS services to predict unknown end-to-end QoS values.
MF-Basic: this method is commonly used in the recommendation system to predict future values
[62][67][71]. It applies a factorization technique on QoS values of invoked cloud composite services to
predict unknown end-to-end QoS values. It factorizes two specific matrices (SaaS and IaaS) to learn latent
features. Only a basic factorization term that learns global information is included for learning process.
MF-IInt: (IaaS Internal Features Incorporated MF Model): we developed this method which is based on
incorporating IaaS internal features-based similarity model in a matrix factorization process. The local
information of similar composite services are generated based on only IaaS internal features, and they are
SaaS service Functionality
Weka EM Clustering
Weka Hierarchical Clustering
Weka FarthestFirst Clustering
Weka SimpleKMean Clustering
Weka Cobweb Clustering
Weka Filter Clustering
Weka DBScan Clustering
Weka ADTree classification
Weka BFTree classification
Weka LMTree classification
Weka REPTree classification
Weka RandomForest classification
Weka Apriori Associative rules
Weka Tertius Associative rules
Table 5.5: Composed SaaS Services (for Two-Dimensional Model).

95
incorporated in a global learning process to predict unknown end-to-end QoS values of cloud composite
services.
MF-SInt (SaaS Internal Features Incorporated MF Model): we developed this method is based on
incorporating SaaS internal features-based similarity model in a matrix factorization process. The local
information of similar composite services are generated based on only SaaS internal features, and they are
incorporated in a global learning process to predict unknown end-to-end QoS values of cloud composite
services.
MF-Int: we developed this method which combines the two prediction approaches: MF-IInt and MF-SInt.
The incorporated local factorization term is based on internal feature information of both SaaS and IaaS
component services.
MF-IPCC (IaaS PCC Incorporated MF Model): we developed this method which is based on
incorporating IaaS correlation- based similarity model (using PCC technique) in a matrix factorization
process. The local information of similar composite services are generated based on only QoS data of
IaaS services, and they are incorporated in a global learning process to predict unknown end-to-end QoS
values of cloud composite services.
MF-SPCC (SaaS PCC Incorporated MF Model): we developed this method which is based on
incorporating SaaS correlation- based similarity model (using PCC technique) in a matrix factorization
process. The local information of similar composite services are generated based on only QoS data of
SaaS services, and they are incorporated in a global learning process to predict unknown end-to-end QoS
values of cloud composite services.
MF-PCC: we developed this method which combines the two prediction approaches MF-IPCC and MF-
SPCC. The incorporated factorization term is based on QoS information of both SaaS and IaaS
component services.
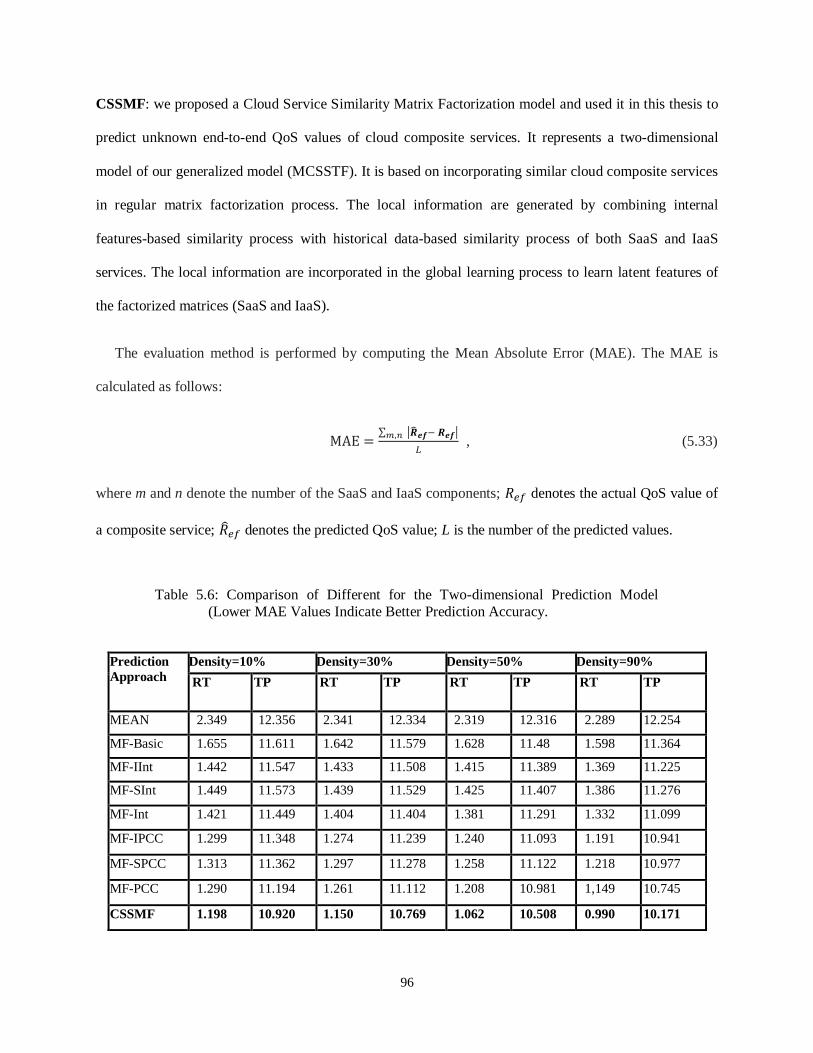
96
CSSMF: we proposed a Cloud Service Similarity Matrix Factorization model and used it in this thesis to
predict unknown end-to-end QoS values of cloud composite services. It represents a two-dimensional
model of our generalized model (MCSSTF). It is based on incorporating similar cloud composite services
in regular matrix factorization process. The local information are generated by combining internal
features-based similarity process with historical data-based similarity process of both SaaS and IaaS
services. The local information are incorporated in the global learning process to learn latent features of
the factorized matrices (SaaS and IaaS).
The evaluation method is performed by computing the Mean Absolute Error (MAE). The MAE is
calculated as follows:
𝑹 𝒆𝒇 𝑹𝒆𝒇
, (5.33)
where m and n denote the number of the SaaS and IaaS components; denotes the actual QoS value of
a composite service; denotes the predicted QoS value; L is the number of the predicted values.
Prediction
Approach
Density=10% Density=30% Density=50% Density=90%
RT TP RT TP RT TP RT TP
MEAN 2.349 12.356 2.341 12.334 2.319 12.316 2.289 12.254
MF-Basic 1.655 11.611 1.642 11.579 1.628 11.48 1.598 11.364
MF-IInt 1.442 11.547 1.433 11.508 1.415 11.389 1.369 11.225
MF-SInt 1.449 11.573 1.439 11.529 1.425 11.407 1.386 11.276
MF-Int 1.421 11.449 1.404 11.404 1.381 11.291 1.332 11.099
MF-IPCC 1.299 11.348 1.274 11.239 1.240 11.093 1.191 10.941
MF-SPCC 1.313 11.362 1.297 11.278 1.258 11.122 1.218 10.977
MF-PCC 1.290 11.194 1.261 11.112 1.208 10.981 1,149 10.745
CSSMF 1.198 10.920 1.150 10.769 1.062 10.508 0.990 10.171
Table 5.6: Comparison of Different for the Two-dimensional Prediction Model
(Lower MAE Values Indicate Better Prediction Accuracy.
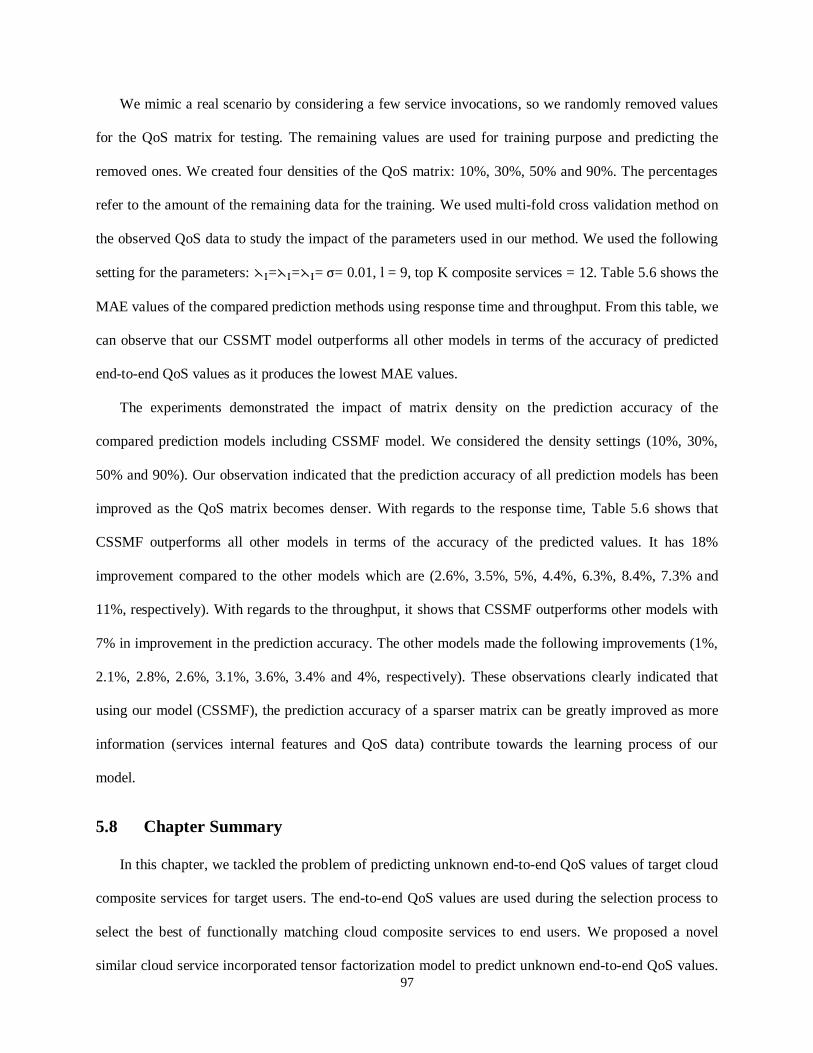
97
We mimic a real scenario by considering a few service invocations, so we randomly removed values
for the QoS matrix for testing. The remaining values are used for training purpose and predicting the
removed ones. We created four densities of the QoS matrix: 10%, 30%, 50% and 90%. The percentages
refer to the amount of the remaining data for the training. We used multi-fold cross validation method on
the observed QoS data to study the impact of the parameters used in our method. We used the following
setting for the parameters: = = = = 0.01, l = 9, top K composite services = 12. Table 5.6 shows the
MAE values of the compared prediction methods using response time and throughput. From this table, we
can observe that our CSSMT model outperforms all other models in terms of the accuracy of predicted
end-to-end QoS values as it produces the lowest MAE values.
The experiments demonstrated the impact of matrix density on the prediction accuracy of the
compared prediction models including CSSMF model. We considered the density settings (10%, 30%,
50% and 90%). Our observation indicated that the prediction accuracy of all prediction models has been
improved as the QoS matrix becomes denser. With regards to the response time, Table 5.6 shows that
CSSMF outperforms all other models in terms of the accuracy of the predicted values. It has 18%
improvement compared to the other models which are (2.6%, 3.5%, 5%, 4.4%, 6.3%, 8.4%, 7.3% and
11%, respectively). With regards to the throughput, it shows that CSSMF outperforms other models with
7% in improvement in the prediction accuracy. The other models made the following improvements (1%,
2.1%, 2.8%, 2.6%, 3.1%, 3.6%, 3.4% and 4%, respectively). These observations clearly indicated that
using our model (CSSMF), the prediction accuracy of a sparser matrix can be greatly improved as more
information (services internal features and QoS data) contribute towards the learning process of our
model.
5.8 Chapter Summary
In this chapter, we tackled the problem of predicting unknown end-to-end QoS values of target cloud
composite services for target users. The end-to-end QoS values are used during the selection process to
select the best of functionally matching cloud composite services to end users. We proposed a novel
similar cloud service incorporated tensor factorization model to predict unknown end-to-end QoS values.

98
The tensor factorizes the QoS data into three specific SaaS, IaaS and DaaS matrices and captures the
relationships through latent features learning process. The global-based prediction process is improved by
incorporating local QoS data from similar cloud composite services. We considered two types of
information during the prediction process: historical QoS data and internal features of cloud component
services and uses. We used these information to compute the similarities between the component services.
We identified the nearest neighbors to a target cloud composite service using the similarity results. The
neighbor component services represent similar cloud composite services. Then, we used QoS data of
similar candidates along with global information in the tensor factorization process. Our tensor-based
prediction model is extensible to consider n component services. We have conducted comprehensive
experiments to validate our prediction approach. We evaluated the accuracy of our proposed model by
comparing its performance with other well-known prediction model. We studied the impact of services’
and users’ internal features on the similarity and prediction computation processes. We also demonstrated
the impact of considering vertical service composition (multi-layer cloud architecture) on the prediction
accuracy of our model. Our model can easily accommodate different number of QoS properties and
internal features.

99
Chapter 6
Conclusions and Future Works
6.1 Conclusions
With the advent of cloud computing and the rapid growth of different service models provisioned by
different cloud service providers, it has become highly challenging to select the best of functionally
matching cloud services for end users. When end users query about particular services (e.g. a business
software service) from a cloud service environment, a huge variety of functionally similar cloud services
are available on the internet. We consider composing the discovered (functionally matching) cloud
services with other collaborating cloud services (services which implement different computing models
and are published at different cloud layers) in order to provision complete cloud service solutions to end
users based on their requirements.
In this thesis, we first proposed a framework for cloud service selection. We consider a three-step
service selection process in the cloud. Upon receiving a request from an end user, the first step is to
discover the required cloud services based on user’s functional requirements. Second, the discovered
cloud services are vertically composed with other available cloud services (e.g. infrastructure, data, and
database services) to be offered as complete solutions to the user. Third, the best cloud service
composition candidates, among a large number of functionally matching service compositions obtained
from the previous step, are selected which satisfy user’s QoS requirements. In vertical cloud service
compositions, functional requirements can be satisfied by the required cloud services alone. However,
QoS requirements must be satisfied using all involved component services in a cloud composite service.
Therefore, in order to select and recommend the best composite services to end users, their QoS values
must be end-to-end.

100
It is highly likely that end-to-end QoS values of many of functionally matching cloud service
compositions are unknown. We believe that even cloud service compositions without known end-to-end
QoS should be included in the selection process, and our objective was to offer more cloud-based service
solution alternatives to end users that satisfy both their functional and QoS requirements. This approach
can also provide equal opportunities of selection to all different cloud providers with published similar
services. In this thesis, we addressed the problem of computing unknown end-to-end QoS values of
vertically composed cloud services which functionally match users’ requirements. The computed values
can then be used for the cloud service selection process based on how these values satisfy users’ QoS
requirements. For our framework, we have proposed two models to solve the problem of computing the
end-to-end QoS values.
Our first proposed model deals with a cloud environment in which cloud service compositions are
new, since no invocations have been made by end users and no prior history exists. To compute end-to-
end QoS values of cloud composite services in such environments, we proposed to map users’ QoS
requirements to the required cloud services and then to other cloud services involved in the candidate
cloud composite services. Then, QoS values offered by these mapped services are aggregated using some
aggregation models to obtain end-to-end QoS values. We have designed three mapping rules that
determine the way a specific QoS requirement (submitted by an end user) should be mapped across
multiple cloud layers. We have conducted an experiment to evaluate the efficiency of our proposed
mapping model. The experimental results showed that the time required to do the mapping is linearly
increasing with the growth of the number of SaaS services we employed in the experiment.
Our second proposed model deals with cloud environments in which registered cloud composite
services have been invoked in the past by end users and thus historical QoS data are available. We have
proposed to predict end-to-end QoS values of cloud composite services using two types of information: 1)
historical QoS data which were recorded based on cloud composite services’ past invocations, 2) internal
features associated with cloud services and end users which can be extracted from services’ WSDL files

101
and users’ profiles such as service location, configuration, functionality, data size and user location. We
used the two types of information to measure the similarity between cloud composite services in order to
obtain the similarity between two cloud composite services. By measuring the similarity, we were able to
identify similar cloud composite services. We predicted the unknown end-to-end QoS values using a
tensor factorization technique. We applied the factorization model on multi-component service tensor to
learn latent features of multiple specific matrices which correspond to multiple component services of
cloud composite services. The tensor factorization model aims at estimating the unknown end-to-end QoS
values (a sparse tensor) through a learning process. We incorporated in the tensor factorization process,
the similar cloud composite services which we have computed in a previous step. Incorporating local data
of similar cloud composite services in the global learning of the tensor factorization process has improved
the accuracy of the predicted values. Our QoS prediction model was generalized to consider n cloud
component services in the tensor factorization process (a two-dimensional model is a special case of
tensors which is called matrix factorization).
We have conducted several experiments to validate our approach. In the experiments, we have
considered two cases of our proposed QoS prediction model: 1) a two-dimensional tensor (matrix
factorization) of two matrices of SaaS and IaaS component services; 2) a three-dimensional tensor of
three cloud component services of SaaS, IaaS and DaaS. The objectives were to evaluate the prediction
accuracy of our model compared to well-known prediction approaches, to study the impact of different
settings and important parameters on the prediction results, to demonstrate the significance of considering
vertical service compositions and to analyze the impact of our proposed internal features on the similarity
and the prediction results. The experimental results showed that our QoS prediction model has
outperformed the other prediction approaches considered in the evaluation process. These approaches
could not handle multi-dimensional-based prediction process, so in order to evaluate their prediction
performance we had to always deal with our problem as a two dimensional prediction problem and then
we applied these approached multiple times. This way of processing the prediction was time consuming
and not accurate enough compared to our approach. Our proposed multi-dimensional tensor factorization

102
model was capable of efficiently and accurately computing the predicted end-to-end QoS values. This
clearly demonstrated the significance of considering vertical service composition process during the
similarity and the prediction processes.
6.2 Future Work
There are several research directions we plan to investigate as future work.
A more important research direction is to build a QoS-based cloud service selection system as a core
component of a cloud marketplace. Our framework and its two components (QoS mapping and
aggregation, QoS prediction) can be integrated in the system. The role of our framework is to provide
estimated en-to-end QoS values of those cloud composite service that have not been invoked before or
they are new to users. With the end-to-end values, these services could be included during the selection
process in the cloud marketplace.
For the QoS mapping, we would like to investigate about using AI-based models to automatically
map users’ QoS requirements across multiple cloud layers, and to handle our defined mapping rules
intelligently. One promising approach is using semantic technology, specifically, OWL-based ontology
which could be designed to facilitate the mapping process automatically.
Another direction is to study other machine learning algorithms such as Gaussian Process Model and
Convex methods in order to learn latent features of the tensor factorization process and find the local
minimum for the objective function. The study objective is to investigate the efficiency and accuracy
levels of these approaches.
Further, other techniques can be evaluated for measuring the similarity based on the availability of
services’ and users’ information. The recommendation methods such as content-based recommendation
and knowledge-based recommendation techniques can be investigated for this purpose.

103
Bibliography
[1] Cloud services, http://www.webopedia.com/TERM/C/cloud_services.html, Last accessed in August
14th, 2015.
[2] Gartner, 2015, https://www.gartner.com/doc/2642020/forecast-public-cloud-services-worldwide,
Last sccessed in August 14th, 2015.
[3] L. Colombus, Roundup of Cloud Computing Forecast And market Estimates, 2015,
http://www.forbes.com/, Last accessed in Aigust 14th, 2015.
[4] IDC Big Data & Analytics, https://www.idc.com/prodserv/4Pillars/bigdata, Last accessed in August
14th, 2015.
[5] A. Menychtas, A. Gatzioura and T. Varvarigou, “A Business Resolution Engine for Cloud
Marketplaces”, in Proceedingss of the IEEE International Conference on Cloud Computing
Technology and Science, pp. 462-469, 2011.
[6] K. Kritikos and D. Plexousakis, “Mixed-Integer Programming for QoS-based Web Service
matchmaking”, IEEE Transaction on Services Computing, vol.2, no.2, pp.122-139, 2009.
[7] Z. Zheng, X.Wu, Y. Zhang, M. Lyu and J. Wang, “QoS Ranking Prediction for Cloud Services”,
IEEE Transactions on Parallel and Distributed Systems , vol.24, no.6, pp.1213-1222, June 2013.
[8] Z. Rehhman, O. K. Hussain and F. K. Hussain, “Parallel Cloud Service Selection and Ranking Based
on QoS History”, International Journal of Parallel Programming, vol. 42, no.5, pp. 820-852, 2014.
[9] L. Braubach, K. Jandar and A. Pokhar, “A Middleware for Managing Non-Functional Requirements
in Cloud PaaS”, in Proceedings of IEEE International Conference on Cloud and Autonomic
Computing, pp. 83-92, 2014.
[10] D. Lin, C. Shi and T. Ishida, “Dynamic Service Selection Based on Context-Aware QoS”, in
Proceedings of 2012 IEEE Ninth International Conference on Service Computing, 2012, pp. 641-648.
[11] M. Mehdi, N. Bouguila and J. Bentahar, “A QoS-Based Trust Approach for Servie Selection and
Composition via Bayesian networks”, in Proceedings of of the IEEE International Conference on
Web Services, pp. 211-218, 2013.
[12] R. Karim and C. Ding, “An Enhanced PROMETHEE model for QoS-based Web Service Selection”,
in Proceedings of the IEEE Inter. Conf. on Service Computing, pp. 537-543, 2011.
[13] S. Hwang, C. Hsu and C. Lee, “ Service Selection for Web Services with Probabilistics QoS”, IEEE
Transactions on Service Computing, vol. 8, no. 3, pp. 467-480, 2015.

104
[14] S. K. Greg, R. Versteeg and R. Buyya, “SMICloud: a Framework for Computing and Ranking Cloud
Services”, in Proceedings of the IEEE International Confererence on Utility and Cloud Computing,
pp. 529-534, 2011.
[15] S. S. Yaun and Y. Yin, “ QoS-based Service Ranking and Selection for Service-based Systems”, in
Proceedings of the IEEE Intetrnational Conference on Services Computing”, pp. 56-63, 2011.
[16] S. Rlfirdoussi, Z. Jarir and M. Quafafou, “ Ranking Web Services using Web Service Popularity
Score”, ACM International Journal of Information Technology and Web Engineering, vol. 9, no. 2,
pp. 78-89 , 2014.
[17] M. Alrifai, D. Skoutas and T. Risse, “Selecting Skyline Services for QpS-based Web Service
Composition”, in Proceedings of ACM International Conference on World wide web, pp. 11-20,
2010.
[18] L. Zeng, B. Benatallah, A. H. H. Ngu, M. Dumas, J. Kalagnanam and H. Chang, “QoS-Aware
Middleware for Web Services Composition”, IEEE Transactions on Software Engineering, vol. 30,
no. 5, 2004.
[19] Y. Feng, L.D.Ngan and R. Kanagasabai, “Dynamic Service Composition with Service-Dependent
QoS Attributes”, in Proceedings of the IEEE International Conference on Web Services pp. 10-17,
2013.
[20] L. Kuang, Y. Xia and Y. Mao, “ Personalized Services Recommendation based on Context-Aware
QoS Prediction”, in Proceedings of the International Conference on Web Services, pp. 400-406 ,
2012.
[21] Z. Zheng, H. Ma and M. R. Lyu,“QoS-Aware Web Service Recommendation by Collaborative
Filtering”, IEEE Transactions on Services Computing, vol.4, no. 2, pp. 140- 152, 2011.
[22] R. Retter, C. Fehling, D. Karastoyanova, F. Leymann, and D. Schleicher, “Combining Horizontal
and Vertical Composition of Services”, Service Oriented Computing and Application, vol.6, no.2,
pp.117-130, June 2012.
[23] Q. He, J. Han, Yang Y., J. Grundy and H. Jin, “QoS-Driven Service Selection for Multi-tenant
SaaS”, in Proceedings of the IEEE International Conference on Cloud Computing (IEEE CLOUD),
pp. 566-573, 2012.
[24] S. Sundareswaren, A. Squicciarini and D. Lin, “A Brokerage-Based Approach for Cloud Service
Selection”, in Proceedings of the IEEE International Conference on Cloud Computing (IEEE
CLOUD),pp. 558-565 , 2012.

105
[25] X. Li, J. Wu and S. Lu, “QoS-Aware Service Selection in Geographically Distributed Clouds”, in
Proceedings of the IEEE International Conference on Computer Communications and Networks, pp.
1- 5, 2013.
[26] P.P. Beran, E. Vinek and E. Schikuta, “A Cloud-based Framework for QoS-Aware Service Selection
Optimization”, in Proceedings of the International Conference on Information Integration and Web-
based Application and Services, pp. 248-287 , 2011.
[27] Z. Rehman, O.K.Hussain and F.K.Hussain, “Multi-Criteria IaaS Servcie Selection based on QoS
History”, in Proceedings of the IEEE International Conference on Advanced Inforamtion networking
and Applications, pp. 1129-1135 , 2013.
[28] Z. Rehman, O.K.Hussain and F.K.Hussain, “IaaS Cloud Selection using MCDM Methods”, in
Proceedings of the IEEE International Conference on e-Business Engineering (ICEBE), pp. 246-251,
2012.
[29] Y. Zhanlin and Z. Lingchang, “ QoS-aware SaaS Service Selection with Interval Numbers for Group
user”, Journal of Software, vol. 9, no. 3, pp. 553-559, 2014.
[30] Z.Zheng, T.C.Zhou, M.R.Lyu and I.King, “Component Ranking for Fault-Tolerant Cloud
Applications”, IEEE Transactions on Services Computing, vol. 5, no. 4, pp. 540-549, 2012.
[31] D. Jannach, M. Zanker, A. Felfering, G.,Friedrich, Recommender Systems, 1st ed. ,
Cambridge University Press, New york, USA, 2011.
[32] R. Pereira, H. Lopes, B. Karin, M. Vicente and P. Wandenberg, “Cloud-based Real-Time
Collaborative Filtering for Item-Item Recommendation”, Computers in Industry, vol. 65, no. 2, pp.
279-290, 2014.
[33] Z. Zheng, H. Ma, M. R. Lyn and I. King, “WSRec: A Collaborative Filtering based Web Service
Recommendation System”, in Proceedings of the IEEE International Conference on Web Services,
pp. 437-444, 2009.
[34] Q. Yu, “CloudRec: a Framework for Personalized Service Recommendation in the Cloud”,
Knowledge and Inforrmation Systems, vol. 43, no. 2, pp. 417-443, 2015.
[35] M.Zhang, R.Ranjan, M. Menzel, S.Nepal, P.Strazdins and L.Wang, “A Cloud Infrastructure Service
Recommendation System for Optimization Real-time QoS Provisioning Constraints”, IEEE Systems
Journal, pp. 1-11, 2015.
[36] S. M. Han, M. M. Hassan, C. W .Yoon and E.N. Huh,” Efficient Service Recommendation System
for Cloud Computing Market”, in Proceeding of International Conference on Information Systems,
pp. 839-845, 2009.

106
[37] A.Jula, E.Sundararajan and Z.Othman, “Cloud computing composition: A systematic literature
review”, Expert Systems with Applications, vol.41, pp. 3809-3824 , 2014.
[38] D.B.Claro, P.Alhers and J.Hao, “Web Services Composition”, in Semantic Web Services, Processes
and Applications, vol. 3, J.Cardos and A.P.A Sheth, Springer US, pp. 206-234, 2006.
[39] J.O.Gutierrez-Garcis and K.M.Sim, “Agent-based Cloud Service Composition”, Applied
Intelligence, vol. 38, no. 3, pp. 436-464, 2013.
[40] H. Bao and W. Dou, “A QoS-aware Service Selection Method for Cloud Service Composition”, in
Proceedings of the IEEE International Parallel and Distributed Processing Symposium Workshops &
PhD Forum, pp. 2254-2261, 2012.
[41] T.V, Pham, H. Jamjoom, K. Jordan and Z. Shae, “A Service Composition Framework for Market-
Oriented High Performance Computing Cloud”, in Proceedings of the 19th ACM International
Symposium on High performance Distributed Computing”, pp. 284-287, 2010.
[42] Q. Wu, M. Zhang, R. Zheng, Y. Lou and W. Wei, “A QoS-Satisfied Prediction Model for Cloud-
Service Composition Based on a Hidden Markov Model”, Mathematical Problems in Engineering,
vol. 2013, 2013.
[43] Y. Yang, Z. Mi and J. Sun,” Game Theory Based IaaS Services Composition in Cloud Computing
Environment”, Advances in Information Sciences and Service Sciences, vol. 4, no. 22, pp. 238-246,
2012.
[44] X. Zhou and F. Mao, “A Semantics Web Service Composition Approach Based on Cloud
Computing”, in Proceedings of the 4th International Conference on Computational and Information
Sciences, pp. 807-810, 2012.
[45] Z. Ye, A. Bouguettaya and X. Zhou, “ QoS-Aware Cloud Service Composition Using Time Series”,
in Proceedings of International Conference Service-Oriented Computing ICSOC, pp. 9-22, 2013.
[46] M. Zhang, R. Ranjan, A. Haller, D. Georgakopoulos, M. Menzel and S. Nepal, “An Ontology-based
System for Cloud Infrastructure Services’ Discovery”, in Proceedings of the International Conference
on Collaborative Computing: Networking, Applications and Worksharing, pp. 524-530 , 2012
[47] G. Chen, X. Bai, X. Huang, M. Li and L. Zhou, “Evaluating Services On The Cloud Using Ontology
QoS Model”, in Proceedings of the IEEE International Symposium on Service Oriented System
Engineering, pp.312-317, 2011.
[48] L.D. Ngan and R. Kanagasabai, “ OWL-S Based Semantic Cloud Service Broker”, in Proceedings
of the IEEE International Conference on Web Services, pp. 560-567, 2012.

107
[49] 44T. Fortis, V.I. Munteanu and V. Negru, “Towards an Ontology Servcies”, in Proceedings of the
International Conference on Complex, Intelligent, and Software Intensive Systems, pp. 787-792 ,
2012.
[50] T. Han and K.M. Sim, “An Ontology-enhanced Cloud Servcie Discovery System”, Web Inforamtion
Systems Engineering, vol. 6724, pp. 416-427, 2010.
[51] F. Moscato, R. Aversa and B.D. Martino, “An Analysis of mSAIC Ontology for Cloud Resources
annotation”, in Proceedings of Federated Conference on Conputer Science and Information Systems,
pp. 973-980, 2011.
[52] B.D. Martino, G. Cretella and A. Esposito, “Towards a Unified OWL Ontology of Cloud Vendors’
Appliances and Services at PaaS and SaaS Level”, in Proceedings of the International Conference on
Complex, Intelligence and Software Intensive Systems, pp. 570-575, 2014.
[53] G. D. Modica, G. Petralia and O. Tomarchio, “A Business Ontology to Enable Semantic
Matchmaking in Open Cloud Markets”, in Proceedings of the International Conference on
Semantics, Knowledge, and Grids, pp. 96-103, 2012.
[54] P. Rodriguez-Mier, M. Mucientes and M. Lama, “A Dynamic QoS-Aware Semantic Web Service
Composition Algorithm”, in Proceedings of the International Conference Service-Oriented
Computing, pp. 623-630, 2012.
[55] R. Karim, C. Ding, A. Miri and X. Liu, “End-to-End QoS Mapping and Aggregation for Selecting
Cloud Services”, in Proceedings of the International Conference on Collaborative Technologies and
Systems, pp. 515-522, 2015.
[56] M. Marchese and M. Mongeli, “Vertical QoS Mapping over Wireless interface” , IEEE Wireless
Communications, vol. 16, no.2, 2009.
[57] S. B. Rakas and M. D. Stojanovic, “An Efficient QoS Mapping Algorithm in Multi-provider
Networks”, in Proceedings of the International Conferefnce on Telecommunications and Signal
Processing, pp. 74-78, 2011.
[58] F. Battisti, M. Carli and P. Paudyal, “QoS to QoE mapping Modle for Wired/Wireless Video
Communication”, Euro Med Telco Conference, pp. 1-6, 2014.
[59] W. Gao, J. Cao and Y. Xiong, “A Novel QoS Mapping Mechanism in Integrated UMTS/WLANs”,
Wireless Personal Communications, vol. 81, no. 3, pp. 1101-1116, 2015.
[60] W. Hsu and C. Lo, “QoS/QoE Mapping and Adjustment Model in the Cloud-based Multimedia
Infrastructure”, IEEE Systems Journal, vol. 8, no. 1, pp. 247-255, 2014.

108
[61] M. Zhang, X. Liu, R. Zhang and H. Sun, “A Web Service Recommendation Approach Based on
QoS Prediction Using Fuzzy Clustering”, in Proceedings of the IEEE International Conference on
Services Computing, pp. 138-145, 2012.
[62] W. Lo, J. Yin, S. Deng, Y. Li and Z. Wu, “Collaborative Web Service QoS Prediction with
Location-Based Regularization”, in Proceedings of the IEEE International Conference. on Web
Services, pp. 464-471, 2012.
[63] H. Sun, Z. Zheng, J. Chen and M. R. Lyu, “Personalized Web Service Recommendation via Normal
Recovery Collaborative Filtering”, IEEE Transactions on Services Computing, vol.6, no.4, pp. 573-
579, 2013.
[64] H. Sun, Z. Zheng, J, Chen and M. R. Lyu, “NRCF: A Novel Collaborative Filtering Method for
Service Recommendation”, in Proceedings of the IEEE International Conference on Web Services,
pp. 702-703 , 2011.
[65] Z. Zheng and M. R. Lyu, “Collaboation Reliability Prediction for Service-Oriented Systems”, in
Proceedings of the ACM/IEEE 32nd
International Conference on Software Engineering, pp. 35-44,
2010.
[66] J. Wu, L. Chen, Y. Feng, Z. Zheng, M. C. Zhou and Z. Wu, “Predicting Qiality of Service for
Selection by Neighborhood-Based Collaborative Filtering”, IEEE Transactions on System, Man, and
Cybernetics: Systems, vol. 43, no. 2, pp. 428-439 , 2013.
[67] Y. Xu, J. Yin, W. Lo and Z. Wu, “Personalized Location-Aware QoS Prediction for Web Services
Using Probablistics Matrix Factorization”, Web Information Systems Engineering, vol. 8180, pp.
229-242, 2013.
[68] M. Tang, Y. Jiang, J. Liu and X. Liu, “Location-Aware Collaborative Filtering for QoS-based
Service Recommendation”, in Proceedings of the IEEE International Conference on Web Services,
pp. 202-209 , 2012.
[69] P. He, J. Zhu, Z. Zheng, J. Xu and M. R. Lyu, “Location-based Hierarchical Matrix Factorization for
Web Service Recommendation”, in Proceedings of the IEEE International Conference on Web
Services, pp. 297-304, 2014.
[70] Y. Shen, J. Zhu, X. Wang, L. Cai, X. Yang and B. Zhou, “Geographical Location-Based Network-
aware QoS Prediction for Service Composition”, in Proceedings of the IEEE International
Conference on Web Services, pp. 66-74, 2013.
[71] W. Lo, J. Yin, S. Deng, Y. Li and Z. Wu, “An Extended Matrix Factorization Approach for QoS
Prediction in Service Selection”, in Proceedings of the IEEE International Conference on Services
Computing, pp. 162-169 , 2012.

109
[72] Z. Zheng, H. Ma and M. R. Lyu, “Collaborative Web Services QoS Prediction via Neighborhood
Integrated Matrix Factorization”, IEEE Transactions On Services Computing, vol 6, no. 3, pp. 289-
299, 2013.
[73] W. Lo, J. Yin and Z. Wu,“Efficient Web Service QoS Prediction using Neighborhood Matrix
Factorization”, Engineering Applications of Artificial Intelligence, vol. 38, pp. 14-23, 2015.
[74] Y. Xu, J. Yin, W. Lo and Z. Wu, “Personalized Location-Aware QoS Prediction for Web Services
Using Probablistics Matrix Factorization”, Web Information Systems Engineering, vol. 8180, pp.
229-242, 2013.
[75] Y. Zhang, Z. Zheng and M. R. Lyu, “Exploring Latent Features for Memeory-based QoS
Prediction in Cloud Computing”,in Proceedings of the IEEE International Symposium on Reliable
Distributed Systems, pp. 1-10, 2011.
[76] Y. Zhang, Z. Zheng and M. R. Lyn, “WSPred: A Time-Aware Personalized QoS Prediction
Framework for Web Services”, in Proceedings of the IEEE International Symposium on Software
Reliability Engneering, pp. 210-219, 2011.
[77] W. Zhang, H. Sun, X. Liu and X. Guo, “Incorporating Invocation Time in Predicting Web Service
QoS via Triadic Farcorization”, in Proceedings of the IEEE International Conference on Web
Services, pp. 145-152, 2014.
[78] R. Karim, C. Ding and A. Miri, “End-to-End QoS Prediction Model of Vertically Composed Cloud
Services via Tensor Factorization”, in Proceedings of the IEEE International Conference on Cloud
and Autonomic Computing, 2015, (Accepted).
[79] K. Qazi, Y. Li and A. Sohn, “Workload Prediction of Virtual Machines for Harnessing Data Center
Resources”, in Proceedings of the IEEE International Conference on Cloud Computing (IEEE
CLUD), pp. 522-529 , 2014.
[80] S. Imai, T. Chestna and C. Varela, “Accurate Resource Prediction for Hybrid IaaS Clouds Using
Workload-Tailored Elastic Compute Units”, in Proceedings of the IEEE/ACM Utility and Cloud
Computing, pp. 171-178, 2013.
[81] H. Zhang, P. Li, Z. Zhou, X. Du and W. Zhang, “A Perforamnce Prediction Scheme for
Computation-Intensive Application on Cloud”, in Proceedings of the IEEE Communication and
Information Systems Security Symposium, pp. 1957-1961, 2013.
[82] C. Fan, Y. Chang, W. Wang and S. Yuan, “Execution Time Predcition Using Rough Set Theory in
Hybrid Cloud”, in Proceedings of the International Conference on Ubiquitous Intelligence and
Computing. pp. 729-734, 2012.

110
[83] W. Tsai, P. Zhong, J. Balasooriya, Y. Chen and X. Bai, “Services Utility Prediction on a Cloud”, in
Proceedings of the IEEE International Conference on Service-Oriented Computing and Applications,
pp. 1-4, 2011.
[84] A. Bankole and S. Ajila, “Cloud Client Prediction Models for Cloud Resource Provisioning in a
Multitier Web Application Environment”, in Proceedings of the IEEE International Symposium on
Service Oriented System Engineering, pp.156-161, 2013.
[85] K. Kritikos and D. Plexousakis, “Requirements for QoS-based Web Service Description and
Discovery”, IEEE Transactions on Services Computing, vol. 2, pp. 320-337, 2009.
[86] V.X. Tran, H. Tsuji and R. Masuda, “A New QoS Ontology and its QoS-based Ranking Algorithm
for Web services”, Simulation Modelling Practice and Theory, vol.17, no. 8, pp. 1378–1398, 2009.
[87] Service Management Index Version.1.0 , 2013,
http://www.cloudcommons.com/documents/10508/186d5f13- f40e-47ad-b9a6-4f246cf7e34f, Last
accessed, August 14th, 2015.
[88] R. Karim, C. Ding and A. Miri, “An End-to-End QoS Mapping Approach for Cloud Service
Selection”, in Proceedings of the IEEE World Congress on Services, pp. 341-348, 2013.
[89] T.L. Saaty, “The Analytic Hierarchy and Analytic Network Processes for the Measurement of
Intangible Criteria and for Decision-Making”, in Multiple Criteria Decision Analysis: State of the Art
Surveys, J. Figueira, S. Greco, and M. Ehrgott, Ed., Springer Verlag, Boston, pp. 345-405, 2005.
[90] J. Kang and K.M. Sim, “Towards Agents and Ontology for Cloud Service Discovery”, in
Proceedings of the International Conference on Cyber-Enabled Distributed Computing and
Knowledge Discovery, pp. 483-490, 2011.
[91] S. W. Choi, J. S. Her and S. D. Kim, “QoS Metrics for Evaluating Services from the Perspective of
Service Providers”, in Proceedings of the IEEE International Conference on e-Business Engineering,
pp. 622-625, 2007.
[92] F. Wagner, F. Ishikawa and S. Honiden, “Applying QoS-aware Service Selection on Functionally
Diverse Services”, in Proceedings of the International Conference Service-Oriented Computing
ICSOC, pp. 100-113, 2011.
[93] P. Jaccard, “The distribution of the flora in the alpine zone”, New Phytologist, vol 11, no. 2 , pp.
37-55, 1912.
[94] E. Bauer and R. Adams,”Service Reliability and Service Availability”, in Reliability and Availability
of Cloud Computing, John Wiley & Sons, Inc., Hoboken, NJ, USA, 2009.
[95] Z. Zheng, Y. Zhang, and M. R. Lyu, “Distributed QoS Evaluation for Real-World Web Services”, in
Proceedings of IEEE International Conference on Web Services, pp.83-90, 2010.

111
[96] Z. Zhang, WS-Dream, http://www.wsdream.net:8080/wsdream/
[97] E. Almasry and Q. Mahmoud, “Discovering the Best Web Service: a Neural Network-based
Solution”, in Proceedings of the IEEE. Conference of Systems, Man, and Cybernetics, pp.4220-
4255, 2009.
[98] E. Acar and B. Yener, “Unsupervised Multiway Data Analysis: A Literature Survey”, IEEE
Transactions on Knowledge and Data Engineering, vol. 21, no. 1, pp. 6-20, 2009.
[99] R. Karim, C. Ding and A. Miri, “End-to-End Performance Prediction for Selecting Cloud Service
Solutions”, in Proceedings of IEEE Symposium on Service-Oriented System Engineering, pp. 69-77,
2015.
[100] S. Rahman, “A Testbed for Qos-Based Data Analytic Service Selection in the Cloud”, M.S. thesis,
Dep. Computer Science, Ryerson Univ., Toronto, Canada, 2015.
[101] R. Karim, C. Ding, A. Miri, “End-to-End QoS Prediction of Vertical Service Composition in the
Cloud”, in Proceedings of IEEE CLOUD, 2015 (Accepted).