endogenous social preferences -...
TRANSCRIPT

Endogenous Social Preferences
by
Jeffrey Carpenter
June, 2002
MIDDLEBURY COLLEGE ECONOMICS DISCUSSION PAPER NO. 02-09
DEPARTMENT OF ECONOMICSMIDDLEBURY COLLEGE
MIDDLEBURY, VERMONT 05753
http://www.middlebury.edu/~econ

* The author thanks Sam Bowles for help with an earlier draft and the National Science Foundation(SES-CAREER 0092953) for financial support.
ENDOGENOUS SOCIAL PREFERENCES*
June 4, 2002
Jeffrey P. CarpenterDepartment of Economics
Middlebury CollegeMiddlebury, VT 05753([email protected])
ABSTRACT: A long-standing discussion in economics has developed around the issue of whetherinstitutions (specifically markets) affect peoples’ social preferences. One theory posits thatmarkets force people to interact repeatedly, and in so doing reduce anonymity, curtailopportunistic behavior, and make agents more socially minded. The opposing view contends thatmarkets are alienating because they make interactions more (not less) anonymous and competitionerodes peoples’ preferences to engage in selfless, group-beneficial acts. This paper presents theresults of an experiment designed to quantify the extent to which different aspects of marketsaffect peoples’ social preferences by varying the level of anonymity, the incentive to reciprocatefriendly acts, and the degree of competition. We find that reducing anonymity does make peoplemore social, but mostly because reducing anonymity reduces peoples’ ability to engage inopportunistic acts. More importantly, we find that market competition erodes social preferencesthrough two mechanisms. First, market competition encourages opportunistic behavior whichcreates a less friendly atmosphere and second, controlling for the first effect, the market institutionitself decreases the other-regardingness of our participants.
KEYWORDS: endogenous preferences, experiment, value orientation, ultimatum game, best shotgame, market competition
JEL CLASSIFICATION NUMBERS: C72, C91, C92, D64
Endogenous Social Preferences 1
It is almost a general rule that wherever manners are gentle there is commerce; andwherever there is commerce, manners are gentle. [The Spirit of Laws, Montesquieu 1749,1961, vol.2, p.8]
The bourgeoisie...has left no other nexus between man and man than naked self-interest,than “callous payment”. It has drowned out the most heavenly ecstasies of religiousfervour, of chivalrous enthusiasm, of philistine sentimentalism, in the icy water ofegotistical calculation. [The Communist Manifesto, Marx & Engels 1847, 1955, p.12]
1. Introduction
The idea that economic institutions shape the preferences of individual agents hasa long history in economic thought (Bowles [1998]), even if it has not had muchimpact on economic theory. Concerning one institution in particular, Hirschman[1982] documents two competing theories of the role of markets in the formationof individual social preferences (i.e. people’s other-regardingness). One theory,originating in the mid-eighteenth century and exemplified by the first quoteabove, asserts that markets exert a civilizing influence over individuals makingthem, for lack of a better term, nicer. Although the mechanisms by whichmarkets civilize society often look suspiciously functionalist, the basic idea isthat, in a society dominated by well-functioning markets and specialization,people are forced to interact because they can no longer individually produce allof what is needed to subsist. Therefore, a sort of folk theorem result arises -because individuals are forced to interact repeatedly an equilibrium arises inwhich people need to be nice to each other to maintain trade relationships.
On the other hand, a second theory, often associated with Marx (thesecond quote), states that markets corrode societal values rather than instill them.Here people become nastier because, “individual behavior...[is]...increasinglydirected to individual advantage, habits and instincts based on communal attitudesand objectives have lost out” (Hirsch [1976], p.117-18). Implicitly, this viewcontends that markets make interactions more anonymous not more personal andthis anonymity fosters the competitive behavior necessary for markets to work.The end result is that anonymity and competition drive wedges betweenindividuals diminishing their preferences to engage in collectively beneficial acts.
In trying to reconcile these points of view, one notices that there are twoissues at stake, the effect of markets on the anonymity of interactions which, inturn, affects people’s attitudes towards each other, and the effect of market-induced competition on people’s attitudes toward each other. In this paper wemeasure the effects of economic institutions on people’s social preferences.Specifically, with the long standing debate about the effects of markets in mind, I
Endogenous Social Preferences 2
1 The ultimatum game (Gueth, Schmittberger and Schwarz [1982]) is a two person bargaining gamein which the first mover has the advantage of making any offer to distribute a pie, which the secondmover can only accept or reject. Because rejections lead to the pie being forfeited by the two, thesecond mover should accept any offer. This gives the first mover the power to ask for (nearly) theentire pie.
conducted an experiment to assess the impacts of anonymity and competition onindividuals’ preferences for other people’s well-being.
Before we proceed, it is worth noting two previous experiments thatpartially provide a foundation for the current experiment in the existing literature.Hoffman et al. [1994] examine the effect of framing interactions as markets onultimatum bargaining outcomes.1 Specifically, the experimenters changed thewording of the instructions from the standard persons A and B, Forsythe et al.[1994], protocol to one that labeled the first-mover as a seller and the second-mover as a buyer. The results show that simply framing an interaction as amarket has a significant effect on the distribution of the surplus. Sellers offermuch less of the surplus to buyers than when the bargainers are called persons Aand B. In this case it appears that markets trigger more egoistic behavior inpeople which might also suggest that social preferences deteriorate in markets.Considering the effect of competition, Schotter, Weiss and Zapater [1996] showthat introducing competition also reduces offers in the ultimatum game. In thisexperiment first-movers had to compete to survive to a second round of play.Comparing the first round offers of the survival treatment with a control and firstround offers with second round offers of those who survived, the authors providemarginally significant evidence that competition also appears to make participantsmore egoistic.
One is tempted to conclude that these two studies illustrate how marketserode participants’ other-regardingness, however we need to be careful here.Actually, these studies only show that offers fall when interactions are framed asmarkets or when competition is allowed; we do not know, however, whetherparticipants’ preferences have changed. In fact, offers in the ultimatum gamemaybe particularly bad measures of social preferences because it is well knownthat egoistic first-movers tend to balance payoffs against the subjectiveprobability of rejection (Forsythe et al. [1994], Hoffman, McCabe and Smith[1996], Carpenter [2000b]). That is, the same egoistic first-mover in the standardgame who offers half because she thinks low offers will be rejected may offer alower amount when the interaction is framed as a market or when competitionworks if her favor because her estimate of the likelihood of being rejected is

Endogenous Social Preferences 3
2 A pertinent example of this comes from Barr [1999] who, in a field experiment, shows that resettledvillagers in Zimbabwe with much more access to markets make higher offers in the ultimatum gamethan villagers who have not been resettled. One might take this as evidence of the socializing effectof markets, but Barr shows the appropriate reason for this behavior is that offers increase insettlements because players are much more uncertain about what will be an acceptable offer to theircounterparts.3 Note, to their credit Schotter, Weiss and Zapater [1996] also run dictator games (the same as theultimatum game except that second movers can not reject an offer - they just get whatever they aregiven) using the same setup and find that transfers to a second party drop significantly whencompetition is introduced. However, without pre-testing subjects social preferences, these results onlyprovide between-subject comparisons. One important strength of the current experiment, discussedbelow, is that it provides much stronger within-subject comparisons.4 The experimental instructions are available from the author upon request ([email protected]).
lower.2 The point is that ultimatum offers may change without social preferenceschanging.3
To directly answer whether social preferences are affected by factorsassociated with markets, we will discuss an experiment that measures participantssocial preferences both before and after interacting with other participants using amethod that is incentive compatible and provides a measure of preferencestrength. Briefly, the results suggest that reducing anonymity does make peoplemore social, but mostly because reducing anonymity reduces peoples’ ability toengage in opportunistic acts. More importantly, we find that market competitionerodes social preferences through two mechanisms. First, market competitionencourages opportunistic behavior creating a less friendly atmosphere andsecondly, controlling for the first effect, the market institution, perhaps because ofits framing effects, itself decreases the other-regardingness of our participants.
2. The Experiment4
The experiment was designed to test, first, the endogenous preferenceshypothesis, in general. That is, do economic institutions affect people’s socialpreferences? Secondly, if the endogenous preferences hypothesis holds, wewould like to know whether specific aspects traditionally associated with markets- repeated interaction, anonymity and competition - erode or instill goodwillamong individuals. We proceed by discussing the exercises I used to elicitpeople’s social preferences, and then we describe five treatments which I used toassess the impact of anonymity, the incentive to treat one’s partner nicely, andcompetition on peoples’ social orientations.
The same two preference revelation mechanisms were used for eachtreatment and they were always presented in the same order. The first mechanism
Endogenous Social Preferences 4
5 I felt it was also important to not use the same mechanism to both pre- and post-test preferencesbecause it would be too obvious to participants what was happening. Further, both exercises are basedon a series dictator choices which provides the basis for a natural interpretation of any differencesbetween the pre- and post-tests.
pre-tested players’ social orientations and the second tested for changes inplayer’s social preferences during each of the five treatments. Both measures arebased on a series of dictator choices over the division of a monetary pie. In thestandard dictator game (Forsythe et al. [1994]), one player, the dictator, is giventhe choice of how to divide a sum of money between herself and anotheranonymous participant. This choice is made with impunity because players areanonymous and the recipient has no “veto” power over the dictator’s choice.Given this structure, the amount the dictator transfers to the recipient is a measureof her social preferences or other-regardingness.
Because it is important to be careful when measuring preferences, thesimple dictator game was not used because it provides only one observation perparticipant. Instead, both measures we discuss categorize participants by howother-regarding their responses to a series of dictator choices were. Using thismethod we not only get more than one observation per participant, we can alsoconstruct a measure of how consistent participants’ social preferences are. Thesocial orientation exercise developed in Griesinger and Livingston [1973] wasused as a pre-test and the post-test was the dictator ‘GARP’ exercise developed inAndreoni and Miller [1998].5
The social value orientation exercise was first used extensively in socialpsychological research (Shure and Meeker [1967], Liebrand [1984], McClintockand Liebrand [1988], Kramer and Goldman [1995]), but it has now also beenadopted by economists (Offerman, Sonnemans and Schram [1996], Carpenter[2000b], Buckley et al. [2001]). In the value orientation exercise, participantsmake binary dictator choices over combinations of own and other monetarypayoffs. Own amounts are kept by the dictator and other amounts are given toanother anonymous participant. Because we need measures of social preferencesfor everyone, the participants were matched in groups of three for this exercise.The reason for this triadic design was to eliminate any strategic thinking amongthe participants. That is, one dictator’s transfers were sent to another dictator whosent her transfers to a third dictator and the third dictator completed the circuit bysending to the first. This way there was no reason for individuals to think about,or anticipate, reciprocity between themselves and another participant to whomthey sent money and from whom they received money.
Endogenous Social Preferences 5
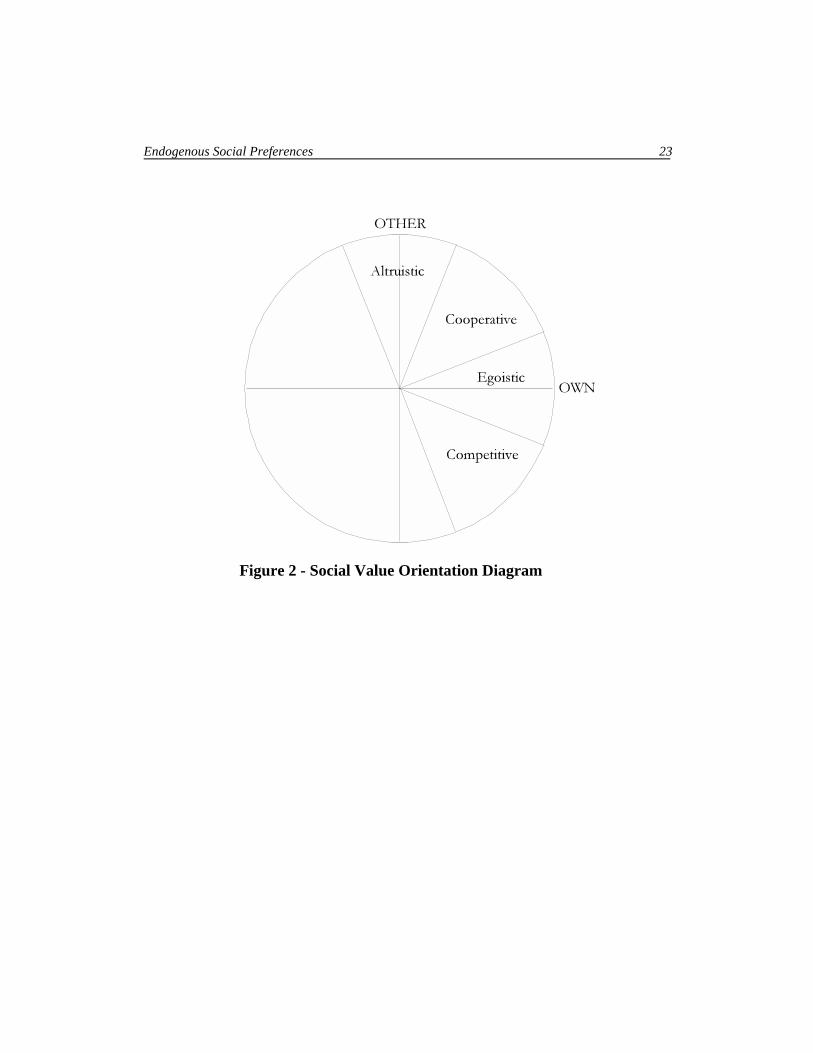
6 More specifically, motivational vectors that fall in the range 112.5-67.5 degrees are classified asaltruistic, between 67.5 and 22.5 as cooperative, between 22.5 and -22.5 as egoistic, and between -22.5and -67.5 as competitive.
The participants received no feedback about how much they were sentuntil the end of the entire experiment. In total participants made twenty-fourdecisions and their payoffs were the sum of the twenty-four amounts kept plus thesum of the twenty-four amounts sent by another dictator. This is obviously anincentive compatible way of eliciting social preferences because it is alwayscostly for the dictator to transfer money to the recipient and, given the anonymityof interactions, there is no possible material benefit from doing so.
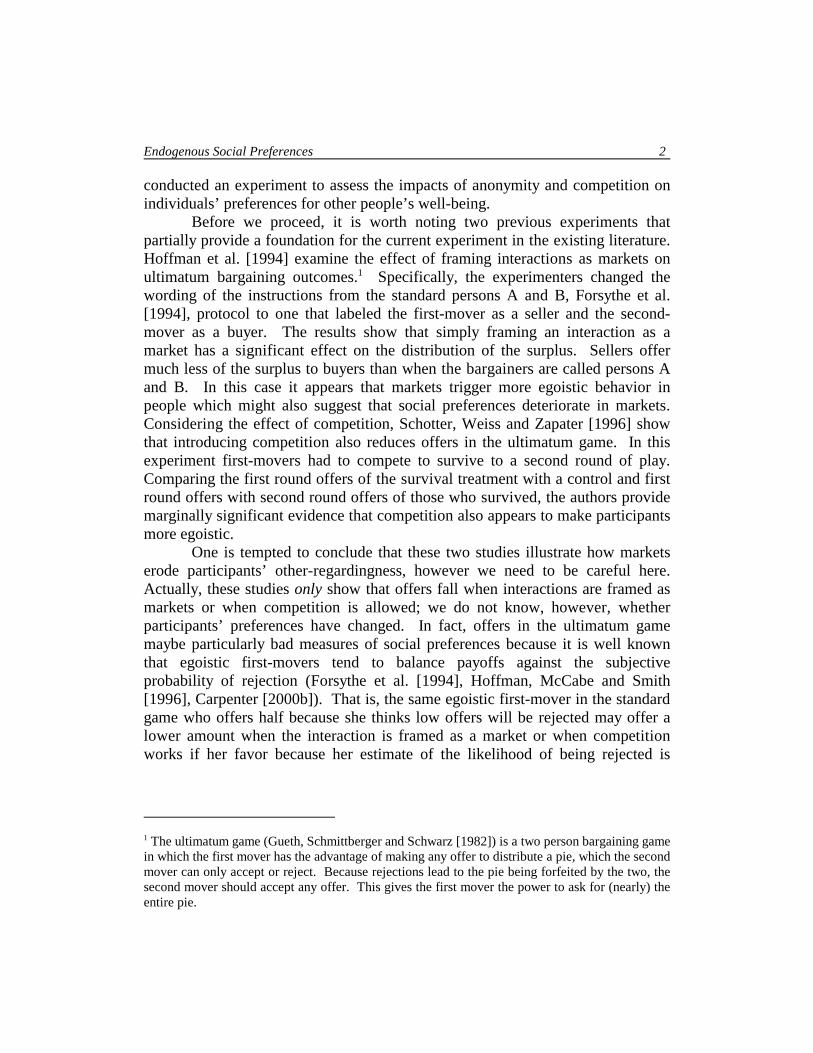
An example of the choice problem is illustrative. Figure 1 presents one ofthe twenty-four choices each participant made. They chose either of two optionsA or B and the order in which the payoffs were presented was randomized eachtime (i.e. it was either own, other or other, own) so players could not just focus ontheir own payoff, at a minimum they needed to look at the consequences for therecipient. Payoffs were listed in terms of experimental francs and then translatedinto dollars (the exchange rate was $1=5F) at the end of the experiment.
Figure One Here
The sum of the payoffs is not constant across options. This is an asset ofthe value orientation because it implies that the cost of giving is not constant.Specifically, the twenty-four outcome pairs lie evenly spaced on a circle withradius 15 experimental francs and each choice was between two contiguousoptions on this circle. The center of the circle is the origin of the 2-dimensionalspace where the horizontal axis measures own francs and the vertical axismeasures other francs.
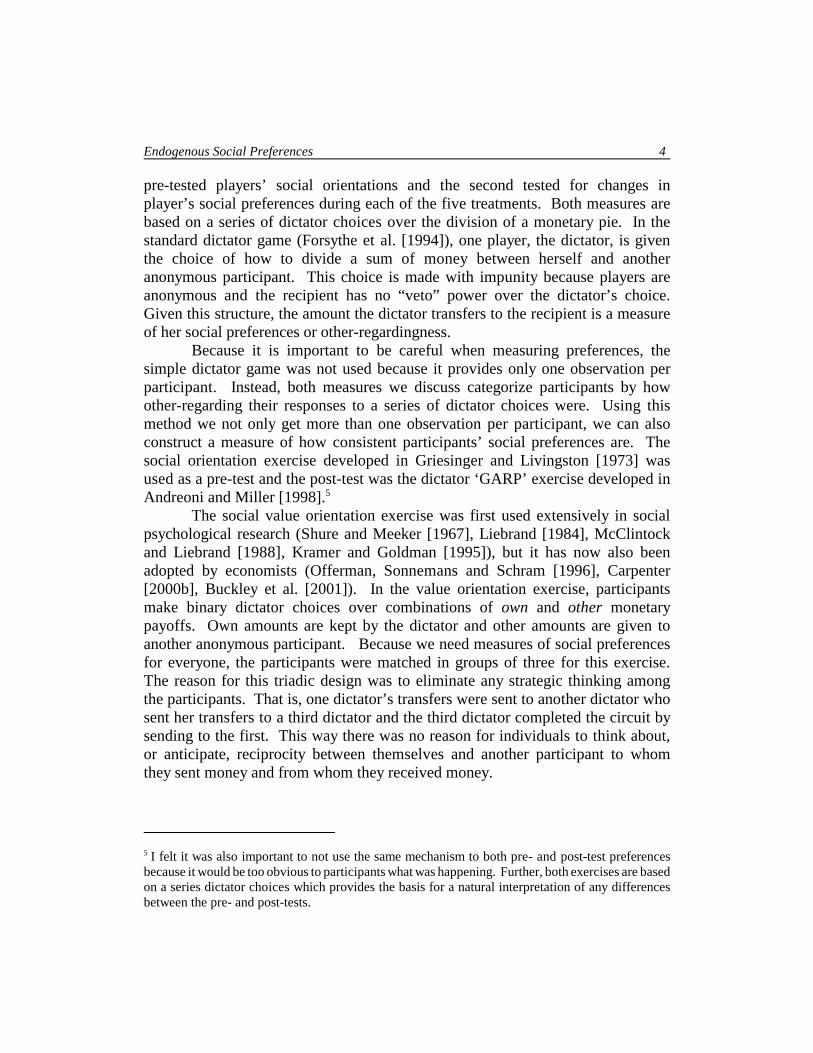
The motivational vector for the value orientation exercise is calculated byadding all the participant’s responses. This vector is then mapped back onto theoriginal circle and is used to characterize the subject into one of four categoriesbased on how much she kept and how much she transferred to the recipient.Figure 2 shows the value orientation circle divided into four classifications, frommost social to least: Altruistic, Cooperative, Egoistic and Competitive.6
Figure 2 Here
Another benefit of the value orientation is that the length of the motivationvector measures the consistency of each subject’s choice pattern. If, for example,

Endogenous Social Preferences 6
7 Notice that in the lower left of the screen is a simple calculator that was provided for the participantsto use. This matches the protocol of Andreoni and Miller [1998].
an individual’s motivation vector were calculated to be (15,0) and the individualchose (7.5,13) over (3.9,14.5), then the individual would have made a consistentchoice because she picked the choice closest to her final vector. Subjects whochoose randomly will have very short motivation vectors and subjects whosebehavior is completely consistent will have vectors twice as long as the circleradius. Our measure of consistency will be each subject’s vector length as afraction of the maximal length.
We call the second preference mechanism, completed after participatingin one of the treatments described below, the GARP mechanism because it wasdeveloped by Andreoni and Miller [1998] to test the extent to which socialpreferences adhere to revealed preference axioms. In the GARP exerciseparticipants make eight dictator choices about how to divide a variable number oftokens that have differing values to the dictator and the recipient. Therefore, aswith the value orientation exercise, the GARP mechanism alters the relative priceof giving. Figure 3 shows the screen used to collect participant responses in theGARP phase of the experiment. As one can see there were four possible ‘pie’sizes, 40, 60, 75 and 100 tokens for each decision and the relative price of givingwas one of the following 1/3, 1/2, 1, 2, 3. Eight budget constraints were formedby different combinations of pie sizes and relative prices from which participantsmade their choices.7
Like the value orientation, players in the GARP exercise are randomlyorganized in triads to eliminate any strategic thinking. Further, the exercise wasnot completed until participants had filled in each of the Hold and Pass inputboxes, but they could change any decision before finally submitting the entireseries.
By simply minimizing the distance between player choices and threemodels of play in this exercise we can categorize players as Altruistic,Cooperative, or Egoistic as in the value orientation exercise. Model altruists arethose who’s preferences most resemble perfect substitutes because, for a givenprice ratio, they assign all the tokens to whomever benefits the most. Modelcooperative players are those who exhibit Leontief preferences in that theyequalize payoffs regardless of the pie size or relative price (i.e. they value fairoutcomes). Finally, model egoists keep all of the pie for themselves and alsodon’t react to the relative cost of giving or the size of the pie. Notice, themapping from behavior to preference categories is identical to the valueorientation - those with high other scores will also exhibit substitutes as

Endogenous Social Preferences 7
8 However, the mapping between the value orientation and GARP is not perfect because there is noequivalent of a competitor in the GARP framework. The simple reason is that while the valueorientation asks players to make decisions in both gain space and loss space, GARP only asks aboutallocating gains. However, this problem is small because few players end up being categorized ascompetitors.9 Three of the four games were the same games used by Prasnikar and Roth [1992] to understand howoff-equilibrium incentives affect the expression of fairness in games.
preferences, those who are cooperative in the value orientation will have Leontiefpreferences in the GARP exercise and so on.8
We summarize our discussion of the preference revelation mechanisms byreiterating the similarities between the two exercises. First, both mechanisms arebased on the dictator game which economists have now come to understand as away to elicit social preferences (Carpenter [forthcoming], Camerer and Fehr[2001], Henrich et al. [2001]). Second, both games involve a series of dictatorchoices rather than a single choice which means we can assess the consistency ofpreferences. Third, both measures test the robustness of social preferences tochanges in the size of the pie and the relative price of giving. Finally, there is aclear relationship between value orientation categories and GARP categorieswhich makes their comparison meaningful.
We now redirect attention to the five treatments that participants took partin. The first treatment was a control to calibrate the relationship between valueorientation categories and GARP categories. In this treatment thirty-six subjectsparticipated in only the value orientation and GARP exercises, with the valueorientation immediately preceding the GARP exercise. The four other treatmentswere composed of inserting a specific game that varied the anonymity ofinteractions, the off-equilibrium incentives, or the level of competition betweenthe value orientation and the GARP exercises.9 In the Same Bargainingtreatment, twenty-four participants were assigned to an unchanging role andplayed the ultimatum game for ten periods with the same partner. In the RandomBargaining treatment thirty-two participants played the ultimatum game for tenperiods, but they were randomly repaired at the beginning of each round. In theBest Shot treatment twenty-four participants played the best shot game for tenrounds and at the beginning of each round they were randomly repaired. Finally,in the Market treatment, twenty-four subjects participated in a ten period market.
Although the ultimatum game is well know, the best shot game (Harrisonand Hirshleifer [1989]) and the specific market mechanism I used (Prasnikar andRoth [1992]) need to be explained in further detail. Players of the best shot gameare assigned to be either the first-mover or the second-mover and are thenpresented with Table 1. The best shot game concerns providing a public good

Endogenous Social Preferences 8
10 I used the ‘full information’ best shot game in which players know they are all using the same payofftable because relative comparisons may be an essential trigger of preference changes and because theother games are full information.11 Each market consists of five participants. Participants keep the same role, but, like the best shottreatment and the random bargaining treatment, players are reshuffled into new markets at thebeginning of each round.
where the provision level is determined by the highest individual contribution (i.e.the best shot). If the first mover provides a project level of q1 and the secondmover a project level of q2 the benefits of the project are determined by max{q1,q2}. Providing for the public good is costly. Specifically, the cost of providing issymmetric and linear, 0.82qi for i=1,2 where the costs are measured inexperimental francs.
The first-mover has the advantage in this game because identical or lowercontributions are wasted which means she can force the second-mover tocontribute by giving nothing. The subgame perfect equilibrium occurs when thefirst-mover provides a project level, q1=0 and the second-mover maximizes herpayoff by providing q2=4. This results in a payoff of 3.70F for the first-moverand 0.42F for the second mover.10 There is an interesting difference between thebest shot game and the ultimatum game which is the reason for including it as atreatment in the experiment. Notice, as first-movers in the ultimatum gamebecome more social (i.e. offer more), second-movers respond by being morelikely to accept offers (Camerer and Thaler [1995], Roth [1995]). However,because contributions below the maximum are redundant in the best shot game, asfirst movers become more social and increase their level of provision, second-movers have a strong incentive to free ride (Harrison and Hirshleifer [1989],Prasnikar and Roth [1992]). Therefore, off the equilibrium path, first-movers arerewarded for being generous in the ultimatum game, but penalized in the best shotgame. We are interested in whether this structural change affects participants’social preferences.
To induce strong competition, I also implemented the ultimatum game asa market. In each market there is one seller and four buyers who bid for anindivisible good.11 The good costs nothing for the seller to provide and eachbuyer is allocated a maximum willingness to pay of ten experimental francs. Ineach period, the four buyers submit bids simultaneously and then the highest bidis presented to the seller who accepts or rejects the offer (this is similar toPrasnikar and Roth [1992] and Schotter, Weiss and Zapater [1996]). If there aretwo equally high bids, the good goes to one buyer randomly. Because of theexcess demand in the market, the equilibrium is the same as the ultimatum game,one player (in this case the seller) receives most of the pie.

Endogenous Social Preferences 9
Notice that the four games have very similar perfect equilibriumpredictions (i.e. one person earns much more than the other), but the games differalong the dimensions of interest. The same bargaining treatment makesinteractions less anonymous compared to the other three games, the best shotgame changes the incentive to reward social behavior when compared to theultimatum game, and the market rachets up the level of competition.
It is useful to conclude this section by making our priors clear about theeffect of game structure on preferences. Returning to the ‘markets make nicerpeople’ hypothesis, we expect repeated interactions to foster more friendlypreferences, and in accordance with the ‘markets make nastier people’ hypothesis,we expect random (seemingly one-shot) interactions will make people moreegoistic. Further, we expect that the smaller the incentive to be social in the bestshot game will affect peoples’ social preferences when compared to the randomultimatum game - i.e. people will become more egoistic in the best shot game.Finally, we expect competition will make people more egoistic when compared torandom bilateral negotiations.
3. The Results
We will discuss the results of the experiment in the following order. We firstpresent tabulations of the two preference elicitation mechanisms withoutdiscussing the relationship between the two measures. Next, we briefly discussthe results of the four games participants played. Lastly, we present our main,endogenous preferences, results by analyzing the relationship between thetreatments and our participants’ sociality.
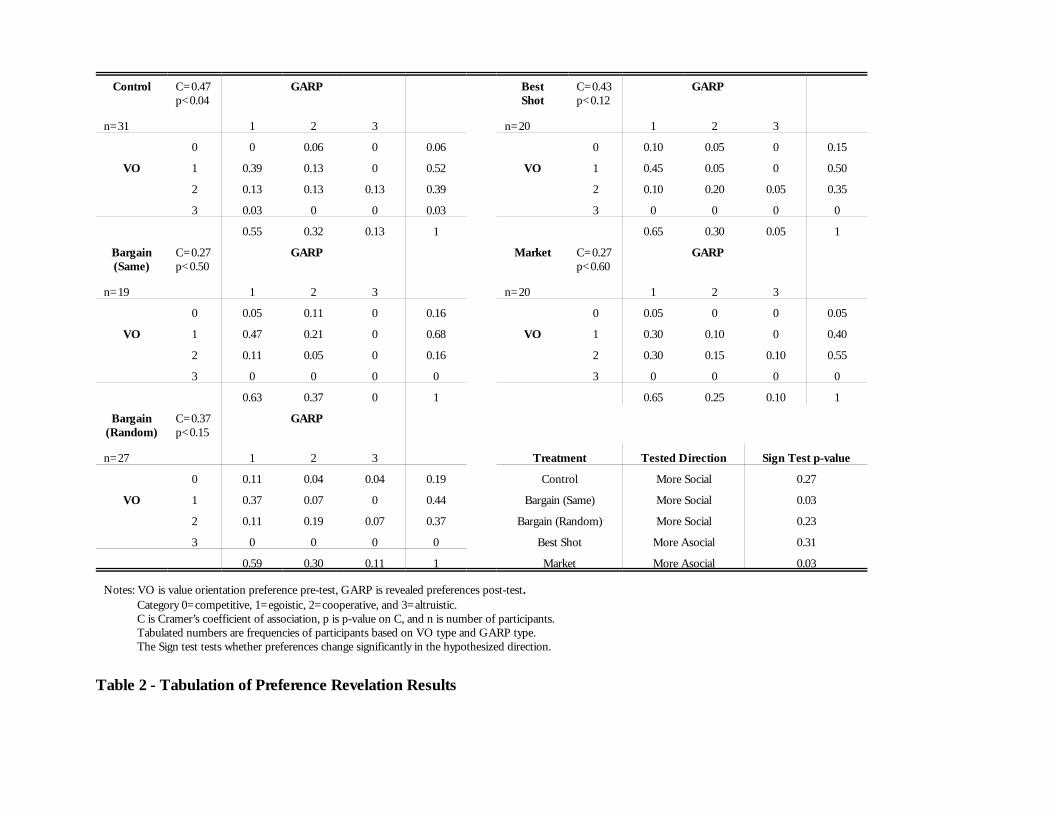
Table 2 summarizes our social preferences data. There are five tabulationtables (one for each treatment) in which we calculate the fraction of participantswho fall into a paired (VO, GARP) category. The various categories aresummarized as follows: 0=competitive, 1=egoistic, 2=cooperative, 3=altruistic.For example, in the control treatment 39% of the participants were categorized asegoistic by both the value orientation and GARP exercises. The rightmostcolumn in each tabulation reports the distribution of value orientation types andthe bottommost column lists the distribution of types in the GARP exercise.Using pair-wise Kolmogorov-Smirnov tests we found no statistical differencebetween any of the five value orientation distributions at the 5% level indicatingeach treatment was started with a similar distribution of types. In general, mostparticipants were classified as egoistic by both preference measures, but there area significant number of “social” types (cooperators and altruists) in eachtreatment. Further, judging by the fraction of participants who are categorized

Endogenous Social Preferences 10
12 Eight percent of the sample was culled. The 60% cutoff rule in the value orientation was chosenbased on the bimodal nature of the data - i.e. almost all players either recorded levels below 60% orwell above the 84% overall average. Further, the average consistency of random choice in the valueorientation (based on a simulation run 100 times) is 53 % which suggests that using the natural breakpoint of 60% is reasonable. Admittedly, the results of the uncontrolled statistical tests done in table2 are less impressive when done on the un-culled sample, but the more important hypothesis testsusing regressions in table 5 are largely unaffected by culling.
off-diagonally, it appears that our treatments affected participants’ preferences;however we postpone the analysis of preference endogeneity until after discussingthe possible causes of change - behavior in the treatments.
Table 2 Here
Before moving on, the reader should notice differences in the number ofsubjects reported per treatment in table 2 and the numbers mentioned in section 2.In each case the number of observations is lower in table 2. As stated above, oneof the strengths of using the value orientation and GARP methods is that we canassess the consistency of each player’s choices. I culled observations in eachtreatment when a players demonstrated choice consistency in the valueorientation lower than 60% of the maximum.12 As in many experiments, despitebeing paid, some subjects do not pay attention to the experiment or are confused.Culling based on choice consistency allows us to evaluate and eliminate this noisefrom the data.
A summary of behavior in the four games is presented in table 3.Columns two and three report the mean offers to the second-mover in the twoultimatum bargaining treatments, column four lists the mean project level chosenby the first-mover in the best shot game (q1), and column five lists the mean buyerbid in the market treatment. As one can see the two bargaining treatments elicitsimilar behavior - on average and across periods the first-mover offers betweenforty-two and forty-six percent of the pie to the second-mover. However, pooledmean offers are statistically lower in the random treatment (z=2.17 , p<0.03) andthe rejection rate is much higher. These differences account for the difference inaverage payoffs between treatments and suggest that, as anticipated, increasedanonymity in the random treatment creates a less friendly bargainingenvironment.
Table 3 Here

Endogenous Social Preferences 11
13 As hoped, the best shot and random results more or less replicate Prasnikar and Roth [1992].14 The high rejection rate is also reflected in the low average payoff listed in table 3.
The best shot results largely replicate Carpenter [2000a] in that, over timefirst-movers reduce their contributions, but they never quite reduce theircontributions to zero. However, the important comparison is between first-moverbehavior in the best shot game and the random bargaining game. Because first-movers in the best shot game reduce their contributions over time, while first-movers in random bargaining increase their offers over time, two very differentatmospheres develop in these games. Although both games maintain the samedegree of anonymity, differences in the off-equilibrium incentives of the twogames affect reactions to friendly acts. Proposers in the bargaining treatment arerewarded for increasing offers while first-movers in the best shot game are takenadvantage of when increasing their contributions.13 To illustrate this point withthe data, the first rejection rate reported for the best shot game (19%) records thefrequency at which first movers who contribute positive amounts and are matchedwith second-movers who contribute nothing. The second rejection rate indicatesthat in 32% of the interactions in which the first-mover choose zero, the second-mover also choose zero. This statistic indicates that, compared to the randombargaining treatment, the number of interactions in which both players receivedzero payoffs is much higher in the best shot game.14
The market data illustrate the fairness-dampening effect of competition.The average first period bid is well above the five franc bid that equalizes thesurplus between the winning buyer and the seller, and by the last period, bids areclose to the perfect equilibrium prediction, but never quite reach it (one-tailed,z=3.64, p<0.01). The rejection rate reported here is the average likelihood that abuyer’s bid was not the winning bid. As one can see, buyers must have beenfrustrated by competition because the average bid leaves them with a smallfraction of the surplus and there was a 64% chance that they would not even getthis amount. Compared to the random bargaining treatment, market outcomes aremuch closer to the theoretical prediction, and much less fair. We now turn ourattention toward analyzing how anonymity, off-equilibrium incentives, andcompetition affect social preferences.
Returning to table 2, we can assess the degree to which the differenttreatments affect people’s social preferences. We begin with our reference point -i.e. the relationship between the value orientation and the GARP exercise in thecontrol treatment. In the upper left of each treatment cell, we report Cramer’scoefficient of association for categorical data and the significance level of the

Endogenous Social Preferences 12
15 Effectively, Cramer’s coefficient is a measure of correlation for categorical data.
association (see chapter 9 of Siegel and Castellan [1988]).15 As we would hope,the control treatment elicits the highest degree of association between the twopreference measures (C=0.47) and is the only treatment in which the associationis significant (p<0.04).
To be conservative, for the remainder of the analysis based on table 2 wetreat paired value orientation scores of 0 and GARP scores of 1 as unchangedpreferences because there is no competitive category in the GARP exercise.Although the control condition exhibits a high and significant association betweenthe two measures, nearly half the participants change their social orientation.This either indicates that people’s preferences are highly volatile or the framingof the two exercises affects preferences. Regardless, what is important for thecurrent discussion is how the other treatment tabulations compare to the controland to the random bargaining treatments.
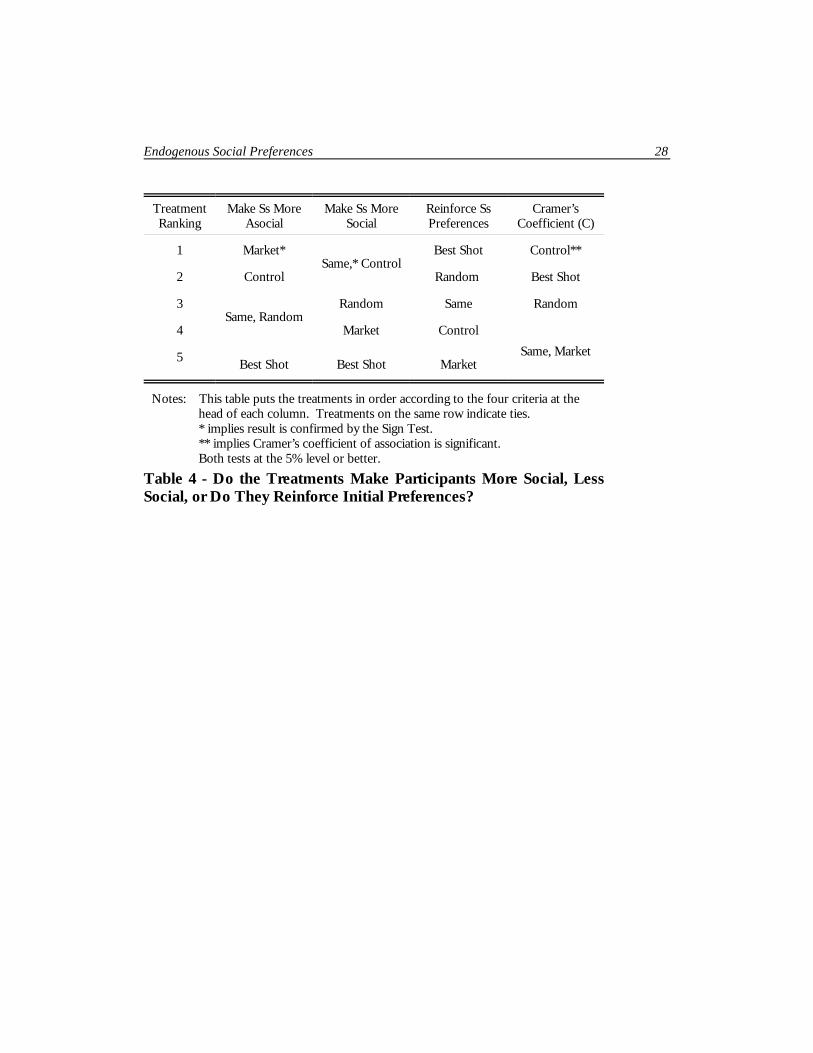
Table 4 summarizes our endogenous preferences results. As a first passwe will just calculate the frequency with which players became more social (i.e.more other-regarding), more asocial (less other-regarding) or had their valueorientation preferences reinforced. The second column of table 4 shows that themarket institution which generates competition and the resulting payoffasymmetries creates more asocial players compared to the random treatment. Thethird column illustrates that the evolution of a strong sharing rule (recall table 3)in the less anonymous same treatment extends past the bargaining stage of theexperiment and makes players more other-regarding. Another interesting result isthat the best shot game, despite reducing the incentive to be social as a firstmover, largely reinforces players’ value orientation preferences (column four).That is, much more than any other treatment, players in the best shot game reportthe same preferences in both preference exercises.
Our main results are also confirmed by statistical tests. Column five oftable 4 lists the treatments in decreasing order of the association between the twopreference mechanisms. Notice, the best shot treatment generates the highestassociation (second only to the control) reinforcing the stability of preferences inthis treatment and the same and market treatments exhibit equally low measuresof association because less anonymous bargaining generates more social playersand competitive markets generate more asocial players. Additionally, using thesign test for matched samples (Siegel and Castellan [1988], chapter 5) we can testwhether any of the treatments cause significant changes in players’ social

Endogenous Social Preferences 13
16 To conduct the sign test we pool competitive and egoistic players as asocial and cooperative andaltruistic players as social to test whether players in a treatment are equally likely to become more orless social.17 Another interesting exercise would be to analyze the degree to which value orientations predictbehavior in the treatments. However, such an analysis would obscure the purpose of this paper. Theinterested reader should see Carpenter [2000b] for such an analysis of a similar bargainingenvironment.18 Rather than dropping these observations, treating them as having preferences that don’t change doesnot substantially change the results. To save space, we present the most conservative results only.19 Another way of defining non homo economicus is as not choosing one’s component of the perfectequilibrium prediction and not being close enough to have just made a small error.
preferences.16 The lower right corner of table 2 reports the hypothesized directionof change and the significance of change in the five treatments. As the reader cansee, our two major results are corroborated by sign tests - repeated, lessanonymous bargaining makes players more social while competitive marketsmake players more asocial.
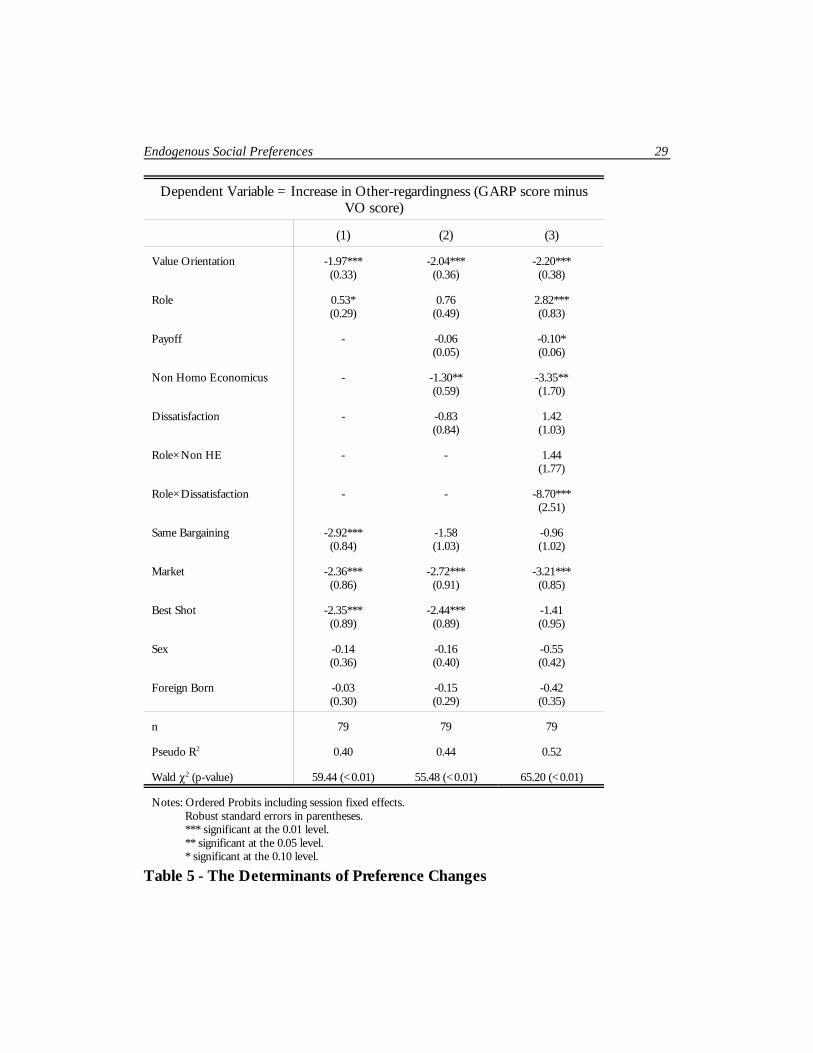
To supplement our treatment-level analysis we dig deeper bydecomposing the treatment differences into the individual determinants ofpreference changes.17 Table 5 reports ordered probit results where the dependentvariable is the difference between player GARP scores and value orientationscores. Here positive dependent variables indicate players became more socialand negative values indicate players became more asocial. Also, to beconservative, the seven players who were categorized as competitive in the valueorientation and egoistic in the GARP exercise have been dropped because theywould show up as becoming more social in this analysis.18
We will now define our regressors. Value Orientation is a participant’scategorization (0, 1, 2, or 3) from the preference pre-test. Role divides playersbetween those who have power (i.e. first-movers and seller=1) and those whodon’t (second-movers and buyers=0). Payoff is the final payoff a participantreceived in the experiment. Non Homo Economicus is an index of the frequencyof participants acting against their myopic self interest.19 Specifically, a nonhomo economicus act in bargaining occurs when proposers offer an equal split orwhen responders reject positive offers. For the best shot game players act againsttheir self interest by contributing positive amounts as a first-mover and byresponding to zero contributions with zero contributions as a second-mover. Inthe market, sellers who reject high offers act against self interest as do buyerswho refuse to compete and make bids of zero. Dissatisfaction is an index of thefrequency with which players were not treated kindly. Proposers who have theiroffers rejected or responders who receive offers less than half qualify as beingdissatisfied with the interaction. In either role of the best shot game, when one’s
Endogenous Social Preferences 14
partner contributes nothing, that person is dissatisfied and when sellers receivebids that are less than five francs or buyers have their bids rejected, they aredissatisfied. We also include three treatment dummies (making randombargaining the reference treatment), the Sex of each player (1 for female), and as acultural catch-all, whether each player was born outside the U.S, Foreign Born.
All of the regressions we will discuss were run with robust standard errorsand use session fixed effects to control for any un-modeled heterogeneity amongplayers that may have been generated by idiosyncratic occurrences during anexperimental session. Overall, we see that the Wald P2 statistic on each equationis highly significant and we explain a substantial amount of the variation inpreferences changes, especially for a cross-section. Our regressors are split intotwo categories, exogenous effects and endogenous effects. Included in theexogenous effects are the different treatments, players’ roles, initial socialorientations, and other personal characteristics. The endogenous effects arevariables that depend on how an individual and her co-participants interact.These effects include player payoffs, how frequently she acted contrary to selfinterest, and how often she was treated badly by the other participants.
In equation (1) we consider only the exogenous effects. As one wouldexpect, players’ value orientations are strong predictors (p<0.01) of howpreferences will change (i.e. competitive types can only become more social andaltruists can only become more asocial), but neither a player’s sex nor ethnicityseem to matter. However, first-movers and sellers (who tend to earn more)become slightly more generous (p<0.10) and, controlling for one’s initial socialorientation, we also see strong effects of our institutional dummies. Specifically,less anonymity causes players to be more likely to become egoistic (p<0.01) asdoes being exposed to market competition (p<0.01) and having less motivation toreciprocate friendly acts (p<0.01). Notice, these individual-level resultscorroborate and reinforce the treatment-level analysis (table 2) in two of the threecases: market competition and reductions in the incentive to reciprocate socialacts generate more asocial preferences compared to random bargaining, but in thethird case we appear to have a contradiction. The sign test on the treatment-leveldata indicated participants became significantly more social in the samebargaining treatment, but equation (1) shows the opposite result. As we will see,adding the endogenous effects and a few interactions in equations (2) and (3) helpresolve this puzzle.
In equation (2) we add the endogenous effects. First, interestingly, wefind that a player’s payoff, by itself, has no influence on her social orientation.But, we do find that the more a player engages in non self-interested play and themore dissatisfied she is with the way she has been treated by others, the more

Endogenous Social Preferences 15
20 This claim is based on adding the two variables one at a time and noting the difference in the sizeand significance of the same bargaining regressor, and testing the difference in the mean levels of NonHomo Economicus in the two treatments.
asocial she becomes; however only the first effect is significant (p<0.05). As inequation (1), in equation (2) controlling for other factors, women and foreign bornplayers are not more (or less) likely to change preferences and now a player’s rolehas dropped off the list of significant determinants. Second, notice that addingthe endogenous factors increases the magnitudes of the market and best shotcoefficients, but reduces the same bargaining coefficient by almost half andlowers its significance substantially.
What explains the changes in the treatment regressors? It appears thatmarket competition and best shot inefficiencies synergistically erode socialpreferences independently of making interactions less friendly (i.e. the effect ofthe endogenous variables). The same bargaining coefficient, however, is reducedby the addition of the Non Homo Economicus variable which is, on average,significantly greater in the same bargaining treatment than in the randomtreatment.20 This implies that the same bargaining treatment elicits more fairoffers and more rejections (controlling for the offer). Hence, the main effect ofreducing anonymity in the same bargaining treatment is to elicit higher offers. Inother words, the primary difference between the same and random bargainingtreatments is that reducing anonymity decreases the amount of opportunisticbehavior by first-movers.
To reinforce and expand on this explanation, in equation (3) we examinethe differential effect of making fair offers and having offers rejected on first-movers. To do so, we interact Role with the frequency of non-self interested actsand with players’ dissatisfaction and get the effects we would expect - makingfair offers makes first-movers more social (n.s.) and having one’s offer rejectedmakes first-movers less social (p<0.01). Notice, by adding these two interactionswe again halve the coefficient on the same bargaining dummy, significantlyreduce the best shot coefficient, and further increase the coefficient on the marketdummy. Now the story becomes clearer; being exposed to market competitiondrastically erodes social preferences independently of how one is treated by one’speers but, the effects of less anonymous settings reduce to the differential abilityof the same bargaining treatment to elicit higher offers and the reactions ofproposers who have their offers rejected.
We end this section by summarizing our main results. First, the controlstudy shows that there is a positive and significant association betweenpreferences measured using the value orientation and the GARP exercises.
Endogenous Social Preferences 16
Compared to the control, we see that each of the treatments generatesinsignificant and lower levels of association indicating that economic institutionsaffect social preferences. As hypothesized, we find that markets cause players tobecome less other-regarding and that this effect is independent of the effects ofpayoff disparities, and other endogenous determinants of preferences. We alsodiscovered a puzzle concerning the effect of reducing anonymity and changingthe incentives to reciprocate kind acts. To reconcile our results we demonstratedthat the treatment effects of reducing the anonymity in bargaining revolve aroundthe behavior and treatment of first-movers. Less anonymity matters only becauserepeated interactions allow second-movers to discipline unfair first-movers. Inturn, having offers rejected makes first-movers much more egoistic, but makingfair offers and being in the more powerful role make first-movers more altruistic.Combining these effects we end up with few very unhappy first-movers whobecome more self-centered in the same bargaining treatment, but many otherfirst-movers who make fair offers and become more charitable.
4. Discussion
We began this paper by reviewing two contradictory theories about howeconomic institutions affect agents’ social preferences. Specifically, the twotheories differ on whether or not markets alienate people because they makeinteractions more or less anonymous and competitive. The results of theexperiment suggest that, if markets are more like large anonymous supermarketsthan small intimate farmers markets, peoples’ social preferences (i.e. their regardfor other people’s well-being) will diminish over time. Further, an even strongerdiminution of social preferences takes place when markets are highly competitive.In this case, those participants who are on the long side of the market (i.e. thosewho can not make as many transactions as they would like) end up resenting themarket structure and their competitors which, over time leads them to care lessabout the well-being of others. Perhaps most interesting, our results also showthat the negative effects of competition and anonymity on social preferences arenot reducible to individual experiences alone. That is, controlling for how badlyindividuals are treated, settings that don’t reward friendly acts and competitivemarkets create atmospheres that themselves erode social preferences, a sort offraming effect.
The current results fit well with other, mostly psychological, studies whichshed light on the relationship between markets, institutions and the endogenousnature of social preferences. For example, Messick and Sentis [1985] show thatsocial preferences in a hypothetical work situation are affected by perceived

Endogenous Social Preferences 17
differences in work achievement. Specifically, this experiment (a within-subjectdesign), though not about markets, illustrates (like the endogenous factors in table5) that individual social preferences are determined by the nature of interactionsbetween people. Further, Breer and Locke [1965], who both pre- and post-testtheir subjects social preferences, show that, controlling for initial preferences,those participants who participated in a work treatment that rewarded individualeffort became more egoistic while those who were rewarded for collective effortdid not. The current results nicely dovetail this study to the extent that marketsreward individual over collective effort.
Additionally, Loewenstein, Thompson and Bazerman [1989] do focus onthe framing effects of market interactions. In this experiment participants werepresented with three different hypothetical scenarios and were asked to rate anumber of monetary outcomes for themselves and another person. The importantfactor that changed among scenarios (for our purposes) was the relationshipbetween the two people interacting in each scenario. In one scenario a disputetook place between two neighbors and in the other the dispute was framed as amarket interaction (between a customer and a sales manager). The data revealedthat players were generally inequality averse in the neighbor treatment, but likedto be better off than the other in the market scenario. While this experiment doesnot measure differences attributable to actual behavior in markets, it does providecorroboration that just framing an interaction as a market significantlydeteriorates social preferences (i.e. this data validates the significant coefficienton our market regressor in table 5 even when controlling for how well anindividual is treated).
While these results are important for moral, theoretical, and institutionaldesign reasons, we postpone such discussions until more, similar results arerecorded. However, there are three directly related issues that arise concerningour results. First, in the face of mounting evidence from economic experiments,new theories have been developed that organize the behavioral results from manygames based on social preferences for reciprocity, fairness and inequalityaversion (e.g. Falk and Fischbacher [1998], Fehr and Schmidt [1999], Bolton andOckenfels [1999]). A key feature of these models is to posit the kind ofheterogeneity of social preferences we see in our preference data presented aboveand to show how, under certain institutional rules, all players appear to behaveegoistically. For example, even cooperative or altruistic individuals behavecompetitively when they are on the long side of a market (we see this in thecurrent data). Or, cooperative players may withhold contributions in public goodsgames when egoists take advantage of their kindness. One contribution of our

Endogenous Social Preferences 18
current results is to show that, with enough exposure, these players not onlymimic egoists, they become egoists.
Second, these results are amazing given the time scale of the interactions.That is, we see significant changes in players’ social orientations after exposure todifferent economic institutions for only an hour. A critical reader should besuspicious of player motivations that are so malleable. However, preferencechanges based on such short exposures are far from an anomalous result in thepsychological literature. For example, Breer and Locke [1965] note that withinfour hours they were able to change seemingly robust attitudes towardsindividuals and society by repeated exposure to a task. Hence, while it isimportant to know how adaptive social preferences are, it is not unreasonable toexpect then to change quickly. In fact, there are situations in which it isreasonable for people to change their attitude towards others instantaneously. Forexample, blue collar workers who are promoted to managers often appear tochange their perceptions of workplace fairness overnight or graduate studentsview comprehensive exams much differently almost immediately after they findout they have passed.
Finally, this experiment presents an apparent contradiction with otherexperimental results. Henrich et al. [2001] in their cross-cultural analysis ofultimatum bargaining behavior among members of non-industrialized societiesfind two robust predictors of proposer behavior, the social returns to cooperationand the degree of market integration. Both coefficients are positive and togetherthey explain 68% of the variance in group average proposals. Notice, theseresults suggest that markets correlate with more social individuals rather than lessas our results indicate. However, an explanation of this apparent contradictionlies in the type of markets these people participate in. People in non-industrialized societies participate in the idealized, intimate, markets ofMontesquieu who wrote based on his experience in largely pre-industrializedEurope. As our experiment shows, markets are not the sole ingredient ofalienation, institutions must also foster anonymity and competition before we canexpect a degradation of social preferences.
5. Bibliography
Andreoni, J., and J. Miller [1998], “Giving According to GARP: An ExperimentalStudy of Rationality and Altruism,” Econometrica forthcoming.
Barr, Abigail [1999], “The Effects of Social Disruption on Bargaining andInvestment Behavior: an Experimental Study from Zimbabwe,” mimeo.

Endogenous Social Preferences 19
Bolton, Gary, and Axel Ockenfels [1999], “ERC: A Theory of Equity,Reciprocity and Competition,” American Economic Review 90,166-93.
Bowles, Samuel [1998], “Endogenous Preferences: the cultural consequences ofmarkets and other economic institutions,” Journal of Economic Literature36,75-111.
Breer, Paul, and Edwin Locke [1965], Task Experience as a Source of Attitudes,The Dorsey Press: Homewood.
Buckley, Neil, Kenneth Chan, James Chowhan, Stuart Mestelman, and MohamedShehata [2001], “Value Orientations, Income and Displacement Effects,and Voluntary Contributions,” Experimental Economics 4,183-95.
Camerer, Colin, and Ernst Fehr [2001], “Measuring Social Norms andPreferences Using Experimental Games: A Guide for Social Scientists,”mimeo.
Camerer, Colin, and Richard Thaler [1995], “Anomalies: ultimatums, dictatorsand manners,” Journal of Economic Perspectives 9,209-219.
Carpenter, Jeffrey [2000a], “Information, Fairness, and Reciprocity in the BestShot Game,” mimeo.
Carpenter, Jeffrey [2000b], “Is Fairness Used Instrumentally? Evidence fromSequential Bargaining,” mimeo.
Carpenter, Jeffrey [forthcoming], “Measuring Social Capital: Adding FieldExperimental Methods to the Analytical Toolbox,” in Social Capital,Economic Development and the Environment, edited by SunderRamaswamy, Jonathan Isham, and Thomas Kelly, Edward Elgar:Northampton.
Falk, A., and U. Fischbacher [1998], “A Theory of Reciprocity,” mimeo.Fehr, Ernst, and Klaus Schmidt [1999], “A Theory of Fairness, Competition, and
Cooperation,” Quarterly Journal of Economics 114,769-816.Forsythe, R., J. Horowitz, N. Savin, and M. Sefton [1994], “Fairness in Simple
Bargaining Experiments,” Games and Economic Behavior 6,347-369.Griesinger, Donald, and James Livingston [1973], “Toward a Model of
Interpersonal Motivation in Experimental Games,” Behavioral Science18,173-188.
Gueth, Werner, Rolf Schmittberger, and Bernd Schwarz [1982], “AnExperimental Analysis of Ultimatum Bargaining,” Journal of EconomicBehavior and Organization 3,367-88.
Harrison, Glenn, and Jack Hirshleifer [1989], “An Experimental Evaluation ofWeakest Link/Best Shot models of Public Goods,” Journal of PoliticalEconomy 97,201-25.

Endogenous Social Preferences 20
Henrich, Joseph, Robert Boyd, Samuel Bowles, Colin Camerer, Ernst Fehr,Herbert Gintis, and Richard McElreath [2001], “In Search of HomoEconomics: Behavioral Experiments in 15 Small-Scale Societies,”American Economic Review 91,73-78.
Hirsch, Fred [1976], Social Limits to Growth, Harvard University Press:Cambridge.
Hirschman, Albert [1982], “Rival Interpretations of Market Society: civilizing,destructive, or feeble?,” Journal of Economic Literature 20,1463-84.
Hoffman, E., K. McCabe, J. Shachat, and V. Smith [1994], “Preferences, PropertyRights, and Anonymity in Bargaining Games,” Games and EconomicBehavior 7,346-380.
Hoffman, Elizabeth, Kevin McCabe, and Vernon Smith [1996], “On Expectationsand the Monetary Stakes in Ultimatum Games,” International Journal ofGame Theory 25,289-301.
Kramer, R., and L. Goldman [1995], “Helping the Group or Helping Yourself?Social motives and group identity in resource dilemmas,” Pp, 49-67 inSocial Dilemmas: Perspectives on individuals and groups, edited by D.Schroeder, Praeger: Westport.
Liebrand, Wim [1984], “The Effect of Social Motives, Communication andGroup Size on Behavior in an N-Person Multi-Stage Mixed-MotiveGame,” European Journal of Social Psychology 14,239-264.
Loewenstein, George, Leigh Thompson, and Max Bazerman [1989], “SocialUtility and Decision Making in Interpersonal Contexts,” Journal ofPersonality and Social Psychology 57,426-41.
McClintock, Charles, and Wim Liebrand [1988], “Role of InterdependenceStructure, Individual Value Orientation, and Another's Strategy in SocialDecision Making: a transformational analysis,” Journal of Personality andSocial Psychology 55,396-409.
Messick, David, and Keith Sentis [1985], “Estimating Social and NonsocialUtility Functions from Ordinal Data,” European Journal of SocialPsychology 15,389-99.
Offerman, Theo, Joep Sonnemans, and Arthur Schram [1996], “ValueOrientations, Expectations and Voluntary Contributions in Public Goods,”The Economic Journal 106,817-845.
Prasnikar, V., and A. Roth [1992], “Considerations of Fairness and Strategy:Experimental Data From Sequential Games,” Quarterly Journal ofEconomics ,865-888.
Endogenous Social Preferences 21
Roth, Alvin [1995], “Bargaining Experiments,” Pp, 253-348 in The Handbook ofExperimental Economics, edited by John Kagel and Alvin Roth, PrincetonUniversity Press: Princeton.
Schotter, Andrew, Avi Weiss, and Inigo Zapater [1996], “Fairness and Survival inUltimatum and Dictatorship Games,” Journal of Economic Behavior andOrganization 31,37-56.
Shure, G., and R. Meeker [1967], “A Personality Attitude Schedule for use inExperimental Bargaining Studies,” The Journal of Psychology 65,233-52.
Siegel, Sidney, and N.John Castellan [1988], Nonparametric Statistics for theBehavioral Sciences, McGraw Hill: Boston.

Endogenous Social Preferences 22
Figure 1 - Screen Shot of Value Orientation Exercise
Endogenous Social Preferences 23
Figure 2 - Social Value Orientation Diagram

Endogenous Social Preferences 24
Figure 3 - The GARP Decision Screen

Endogenous Social Preferences 25
Redemption Values Expenditure Values
Project Level(units)
RedemptionValue of
Specific Units
TotalRedemptionValues of All
Units
Number ofUnits YouProvide
Cost of the Units YouProvide
0123456789
10
0.001.000.950.900.850.800.750.700.650.600.55
0.001.001.952.853.704.505.255.956.607.207.75
0123456789
10
0.000.821.642.463.284.104.925.746.567.388.20
Table 1 - Best Shot Game Payoff Table
Control C=0.47p<0.04
GARP BestShot
C=0.43p<0.12
GARP
n=31 1 2 3 n=20 1 2 3
0 0 0.06 0 0.06 0 0.10 0.05 0 0.15
VO 1 0.39 0.13 0 0.52 VO 1 0.45 0.05 0 0.50
2 0.13 0.13 0.13 0.39 2 0.10 0.20 0.05 0.35
3 0.03 0 0 0.03 3 0 0 0 0
0.55 0.32 0.13 1 0.65 0.30 0.05 1
Bargain(Same)
C=0.27p<0.50
GARP Market C=0.27p<0.60
GARP
n=19 1 2 3 n=20 1 2 3
0 0.05 0.11 0 0.16 0 0.05 0 0 0.05
VO 1 0.47 0.21 0 0.68 VO 1 0.30 0.10 0 0.40
2 0.11 0.05 0 0.16 2 0.30 0.15 0.10 0.55
3 0 0 0 0 3 0 0 0 0
0.63 0.37 0 1 0.65 0.25 0.10 1
Bargain(Random)
C=0.37p<0.15
GARP
n=27 1 2 3 Treatment Tested Direction Sign Test p-value
0 0.11 0.04 0.04 0.19 Control More Social 0.27
VO 1 0.37 0.07 0 0.44 Bargain (Same) More Social 0.03
2 0.11 0.19 0.07 0.37 Bargain (Random) More Social 0.23
3 0 0 0 0 Best Shot More Asocial 0.31
0.59 0.30 0.11 1 Market More Asocial 0.03
Notes: VO is value orientation preference pre-test, GARP is revealed preferences post-test. Category 0=competitive, 1=egoistic, 2=cooperative, and 3=altruistic. C is Cramer’s coefficient of association, p is p-value on C, and n is number of participants. Tabulated numbers are frequencies of participants based on VO type and GARP type. The Sign test tests whether preferences change significantly in the hypothesized direction.
Table 2 - Tabulation of Preference Revelation Results

Endogenous Social Preferences 27
Mean First Mover Choices
Period SameBargaining
(0#offer#10)
RandomBargaining
(0#offer#10)
Best ShotGame
(0#contribution#10)
Market
(0#bid#10)
1 4.83(1.40)
4.02(1.09)
4.56(2.88)
7.58(1.47)
2 4.79(0.33)
4.21(1.10)
2.78(1.39)
7.73(2.05)
3 4.55(0.97)
4.29(0.84)
2.44(1.88)
8.47(1.08)
4 4.69(0.72)
4.28(0.82)
3.33(2.65)
8.22(1.98)
5 4.55(0.89)
4.18(0.94)
1.22(1.39)
8.25(2.39)
6 4.80(0.34)
4.36(0.81)
2.11(2.26)
9.07(1.22)
7 4.46(0.89)
4.18(1.07)
1.22(1.48)
9.09(1.25)
8 4.80(0.40)
4.22(0.78)
1.89(2.71)
9.40(0.79)
9 4.64(0.90)
4.38(1.02)
1.44(3.24)
9.23(1.66)
10 4.06(1.11)
4.54(0.57)
2.11(2.93)
9.65(0.54)
Overall Mean 4.62(0.87)
4.27(0.89)
2.31(2.46)
8.67(1.65)
Rejection Rate 0.09 0.20 0.19/0.32 0.64
Mean Payoff $14.34(2.71)
$13.24(2.53)
$10.45(3.22)
$11.40(4.54)
Table 3 - Mean First Mover Choice (Standard Deviations)
Endogenous Social Preferences 28
TreatmentRanking
Make Ss MoreAsocial
Make Ss MoreSocial
Reinforce SsPreferences
Cramer’sCoefficient (C)
1 Market*Same,* Control
Best Shot Control**
2 Control Random Best Shot
3Same, Random
Random Same Random
4 Market ControlSame, Market5 Best Shot Best Shot Market
Notes: This table puts the treatments in order according to the four criteria at the head of each column. Treatments on the same row indicate ties. * implies result is confirmed by the Sign Test. ** implies Cramer’s coefficient of association is significant. Both tests at the 5% level or better.
Table 4 - Do the Treatments Make Participants More Social, LessSocial, or Do They Reinforce Initial Preferences?
Endogenous Social Preferences 29
Dependent Variable = Increase in Other-regardingness (GARP score minusVO score)
(1) (2) (3)
Value Orientation -1.97***(0.33)
-2.04***(0.36)
-2.20***(0.38)
Role 0.53*(0.29)
0.76(0.49)
2.82***(0.83)
Payoff - -0.06(0.05)
-0.10*(0.06)
Non Homo Economicus - -1.30**(0.59)
-3.35**(1.70)
Dissatisfaction - -0.83(0.84)
1.42(1.03)
Role×Non HE - - 1.44(1.77)
Role×Dissatisfaction - - -8.70***(2.51)
Same Bargaining -2.92***(0.84)
-1.58(1.03)
-0.96(1.02)
Market -2.36***(0.86)
-2.72***(0.91)
-3.21***(0.85)
Best Shot -2.35***(0.89)
-2.44***(0.89)
-1.41(0.95)
Sex -0.14(0.36)
-0.16(0.40)
-0.55(0.42)
Foreign Born -0.03(0.30)
-0.15(0.29)
-0.42(0.35)
n 79 79 79
Pseudo R2 0.40 0.44 0.52
Wald P2 (p-value) 59.44 (<0.01) 55.48 (<0.01) 65.20 (<0.01)
Notes: Ordered Probits including session fixed effects. Robust standard errors in parentheses. *** significant at the 0.01 level. ** significant at the 0.05 level. * significant at the 0.10 level.
Table 5 - The Determinants of Preference Changes