endogenous tick sizes, bid-ask spreads, depth, and trading volumes
TRANSCRIPT
Endogenous Tick Sizes, Bid-Ask Spreads, Depth, and Trading Volumes: The Evidence on the Stock Exchange of Thailand
Kulpatra Sirodom
Department of Finance, Thammasat Business School, Thammasat University, Bangkok, Thailand
Charlie Charoenwong
Division of Banking and Finance, Nanyang Business School, Nanyang Technological University, Singapore
Tanachote Boonvorachote*
Division of Agro-Industry Technology Management,
Faculty of Agro-Industry, Kasetsart University, Bangkok, Thailand
Abstract
This paper shows that multiple tick sizes implemented by purely order-driven markets may not be optimal. Evidence from the Stock Exchange of Thailand (SET) suggests that tick sizes are strong binding constraints on the quoted bid-ask spreads. More than 90% of the investors quote in one-tick spread, implying that tick sizes may be too large. The findings also indicate that tick sizes between Baht 0.01 and Baht 1.00 would, in general, enhance market liquidity by improving market depths and keeping trading costs low. It can be concluded that the SET could have implemented smaller ticks and fewer pricing grids. A reduction in tick size by half for the higher-priced range between Baht 200-400 causes minimal change in quoted depths and trading volume, while significantly decreasing quoted bid-ask spreads. *Corresponding author Tel.: +662-562-5000 ext. 5367; fax: +662-562-5000 ext. 5369
Email address: [email protected].
1 Introduction
Although most global pure order-driven markets (e.g., the Thai, Kuala Lumpur, Paris,
Swiss, Stockholm and Tokyo bourses) implement multiple tick size regimes, there are very few
studies of the effectiveness of such practice. Market regulators in order-driven markets design
their markets via a fix incremental tick sizes in line with price ranges.1 Most literature dealing
with changing in tick sizes focus on exogenous change in tick sizes, e.g. stock splits, order
handling rule changes, or dating the announcement of tick size changes, including
decimalization.2
Exchange regulators agree in theory that the optimal tick should not be zero, and put this
in practice by designing different nominal tick sizes for different price ranges. Angel (1997)
reports that although tick rules vary from country to country, tick size as a percentage of stock
price is remarkably consistent across countries and more than stock price ranges. The median
relative tick size in his study is 25.9 basis points. The average bid-ask spread for major stocks is
1 See Angel (1997) for detail. 2 Evidence from a large number of studies focusing on the exogenous effect of tick size on market quality (bid-ask spreads, liquidity and volatility) shows that smaller tick sizes lead to narrower spreads and smaller depths (Lau and McInish (1995); Van Ness, Van Ness, and Pruit (2000); Goldstein and Kavajecz (2000); Chung and Chuwonganant (2004); and Chung, Chuwonganant, and McCormick (2004)). These findings support Harris (1991, 1994) noting that minimum tick size is a binding constraint on bid-ask spread and that a lower spread decreases the role of the time precedence rule, causing liquidity providers to display less depth. However, researchers did not agree that smaller tick sizes always lead to narrower depth (Ahn, Cao and Choe (1996); MacKinnon and Nemiroff (1999); and Chung, Kim, and Kitsabunnarat (2004)). There appear to be at least two possible explanations for the narrower spread engendered by smaller tick size without a concurrent decrease in depth. Firstly, the US stock markets implemented a new order handling rule that forces dealers to compete with limit orders and this brings higher competition, hence, resulting in narrower spread but not necessarily smaller depths (Chung and Chuwonganant (2004)). Secondly, only displayed depths decrease after spread is narrower, while there are hidden depths from investors hiding orders and preparing to submit liquidity (Harris (1996); and Bourghelle and Declerck (2004)). At the same time, one can still conclude that the optimal tick size is one that is not too small and that it has some effect on quoted spreads and depths. In view of this, exchange regulators must trade off between the costs and the benefits that minimum tick size imposes. Although many papers study the impact of exogenous tick size changes to measure the effectiveness of the multiple tick size system, these studies suffer from bias generated by external factors such as the economic environment, for example the internet-business IPO (Initial Public Offering) bubble that was concurrent with a period when ticks were changed. Researchers have ample room to engage in further study to generate a clearer understanding of the effectiveness of implementation of a pure order auction system by screening out such types of biases.
2
a small number of ticks in each country, averaging 3.7 ticks. Evidence in Table 1, shows that
relative tick sizes in the Stock Exchange of Thailand (SET), supports the idea that Thai
regulators may design tick sizes in the Thai equity market by implementing some “optimal”
relative tick size as a percentage to price ranges. The median relative tick size in SET is 66.7
basis points, very close to Malaysia’s 62.9 and Singapore’s 59.9 basis points3. This suggests that
all three Southeast Asian countries adopt similar tick-to-price ratio in their equity markets.4
The effect of minimum tick sizes on spread, depth, and trading volume in markets with
multiple tick sizes can be observed through a stock traded at different price ranges and compare
differences in market quality arising out of changes in tick size.5
Niemeyer and Sandas (1994) found evidence that the regulated tick size in the Stockholm
Stock Exchange (SSE) is positively related to the bid-ask spread and market depth, while
negatively related to trading volume. Their results are similar to those of Harris (1994), using
data from the NYSE, despite the fact that trading systems are different: the trading system at SSE
is a fully order-driven market without any designated market makers or specialists as at the
NYSE.6
3 See Angel (1997) for details. 4 Angel (1997) uses data in 1994 from Morgan Stanley Capital International Stocks while we use tick information from the SET for 1997 and 2003. 5 When stock prices move to new price ranges, it forces investors to quote in new tick sizes that might be higher or lower than the old tick sizes in the previous price ranges. Most of the literature in this group report that quotes and relative spreads are smaller when stocks are traded on a smaller tick (Harris (1996); Bessembinder (2000); and Ke, Jiang and Huang (2004)). Nevertheless, although smaller tick sizes lead to narrow spreads, this does not always come with smaller depths; put differently, both depth and volume may increase, e.g. (Bessembinder (2000); Chan and Hwang (2001); and Chung, Kim, and Kitsabunnarat (2004)). This means that the relation between minimum tick size and market liquidity, depth, is more complex than simply assuming a minimum tick size is a binding constraint on bid-ask spread. 6 Moreover, the SSE has a very high degree of transparency, which means that everybody can see all pertinent information, including order volume and identity of the dealers, while Harris (1994) assumes anonymity. Both papers support the conclusion that larger tick size increases depth by strengthening the role of time precedence and price priority regardless of the market systems. However, tick size can be seen as trading costs. Both papers report that tick size is negatively correlated to traded volume.
3
The Stock Exchange of Thailand (SET) is operated as a pure order-driven market, similar
to the SSE. However, the trading on the SET is displayed anonymously, unlike the transparency
of order origination displayed in the SSE. Concluding that the various mandatory tick size rule
used by SET could affect spread, depth, and trading volume, our objective is to study whether
tick sizes used in general are too large and if SET is using too many ticks, by observing effects
on spread, depth, and trading volume in the SET from changes in endogenous tick sizes. We
contribute to the understanding of the effectiveness of incremental tick sizes on spread, depth,
and trading volume in an emerging stock market, operating at fully order-driven system with
anonymous order origination as seen in the SET. Uniqueness of this study arises from the
investigation of the effect of endogenous tick size changes on spread, depth, and trading volume
by observing intraday transactions. When stocks move across (up or down) the threshold prices,
market participants are forced to immediately submit their quotes in the changed tick sizes. Our
technique screens out economic factors on spread, depth, and trading volume and is able to limit
other biases from stock attributes or time effect to be at least equitable. Exchange regulators
could use our technique to fine-tune the setting of optimum sizes and to set appropriate numbers
of tick sizes to achieve an optimum market quality target.
Our result shows that most bid-ask spreads in the SET (93.29 %) are quoted at 1 tick
level at the best bid and ask offers, suggesting that minimum tick sizes are strong binding
constraints on bid-ask spread quotes. When stock prices move upward, investors will be forced
into quoting higher spreads by market design. However, when stock prices move downward,
investors continue to quote mainly in one-tick spreads. This evidence implies that tick sizes in
SET might be too large. Since existing tick sizes affect sizes of quoted spreads directly, wider
(narrower) spreads lead to higher (lower) depths because larger (smaller) tick size and time
4
priority encourage (discourage) liquidity providers to display more (less) depth. An overly large
tick size imposes a transaction cost on trading volume. Our results are similar to previous
findings that spread increases with higher volatility while decreases with higher volume and
larger company size, and depths decrease with higher volatility and larger price. Trading volume
increases in line with firm size, while it decreases when spread and volatility are higher.
The evidences found suggest that tick size for the SET should be set at Baht 1.00.
Nominal tick sizes varying from 0.01 baht to 1.00 baht encourages depths in SET and are not
considered as overly high trading costs. Our MLE bid-ask spread model also predicts that
investors still largely quote one-tick and two-tick spreads in the price range between 200 baht
and 400 baht after a 50% reduction in tick size. This means that the SET can set the maximum
price range starting at baht 100 with the largest tick size at baht 1.00. This study shows that a
decrease from baht 2 tick size to baht 1 tick size in the baht 200 - 400 price range can reduce a
spread quote by 27.65%, while there is a trivial effect on the increase in trading volume of 2.85
% within that price range. Moreover, our model predicts a decrease of 4.63% in quoted depths if
the SET reduces tick size from 2 baht to 1 baht in the 200 baht to 400 baht price range. Hence,
setting the largest tick size at 1 baht for stocks priced above 200 baht will reduce bid-ask quote
spreads substantially, with minimal effect on quoted depths and trading volumes. Evidence that
investors always quote bid-ask spread at 1 tick recommends that SET can reduce its tick to price
ratio from the current median of 66.67 basis points. Collectively, reduction in tick sizes should
improve the market quality in SET.
The remainder of the paper is organized as follows. In Section 2, we present our data set.
Section 3 presents regression models, while Section 4 presents preliminary results. Section 5
5
reports regression results and Section 6 presents our projections of the effect of a tick decrease.
Summary and conclusions are found in Section 7.
2 The Data Set
This study analyzed the stocks in the SET50 Index from the 2003 limit order books7. The
SET50 Index is updated twice a year to include 50 most active stocks. Thus, some stocks have
been removed and replaced by more active ones. Our data includes 57 stocks from the first-half
and second-half of the SET50 year list, representing most active stocks in 2003.
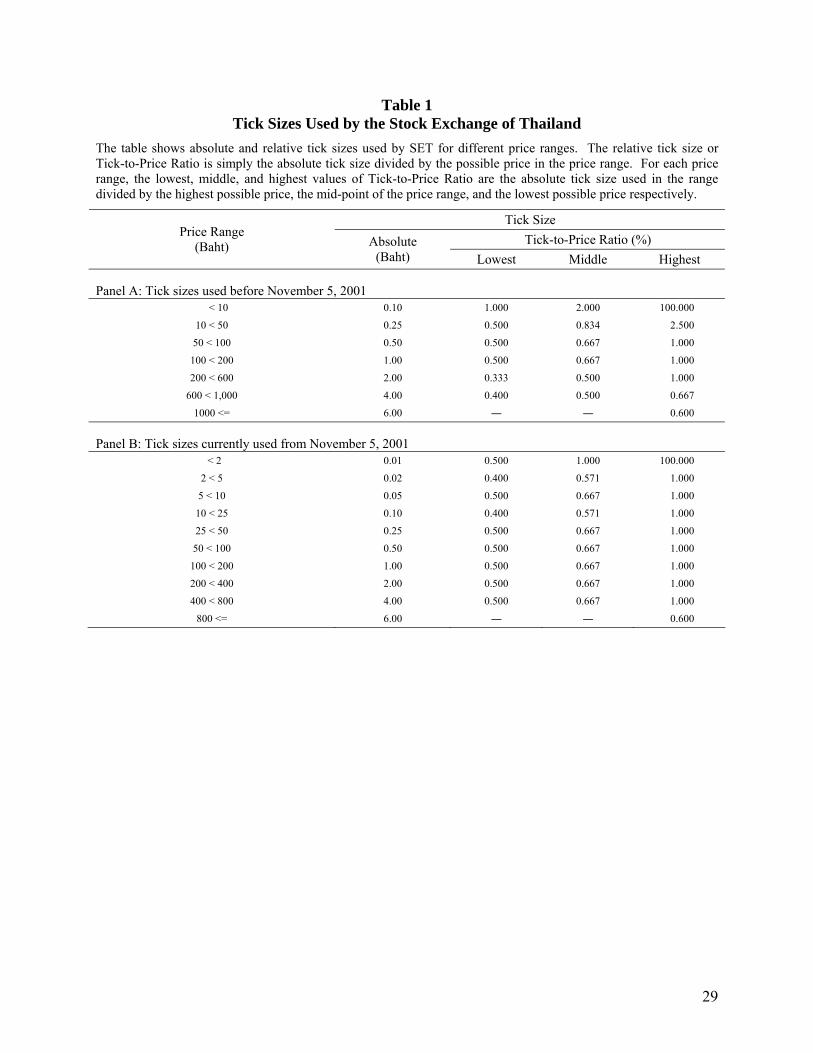
SET50 comprises of stocks that are most liquid in the Thai equity market. Table 1 shows,
in local currency, SET tick sizes for different price groups (in Thai baht). Also shown are relative
tick sizes, i.e., the ratio of the tick size to share price. The table shows the median, minimum, and
maximum tick-to-price ratios. It becomes evident that the SET expanded the number of price
ranges from seven to ten after November 5, 2001. In 1997, the SET put the lowest tick size at
baht 0.10 for stock prices traded under baht 10. The change was prompted by the economic crisis
in 1997, which resulted in severe drop in prices. Several stocks were traded at below baht 10,
with a large number were traded at less than baht 5. In order to promote liquidity, the SET
implemented smaller price grids by dividing price ranges under baht 10 into three sub-price
ranges, shown in Table 1. The SET also inserted one more price boundary at baht 25 and
replaced the baht 600 price boundary with the baht 400. The ten price ranges in the SET made it
the bourse with the highest number of price ranges, with the Hong Kong exchange next at eight 7 Our limit order is an instruction to trade at the best price available, but only if it is no worse than the limit price specified by the trader. Our market order means a marketable limit order, an order a broker can execute immediately after it is submitted by the investor. Because we focus on the best bid and offer price, our market order refers to an order at best bid or offer price; put differently, a zero-spread quote order.
6
price ranges, followed by seven price ranges in Malaysia’s stock exchange, as shown in Angel
(1997).
Tick-to-price ratios (%) in SET are designed to lie between a minimum value at 50 basis
points and a maximum value at 100 basis points. We observe that the median tick-to-price ratio
(%) in SET is 66.67 basis points. It can be concluded that the SET has designed the tick-to-price
ratios between 50 and 100 basis points with the median of 66.67 basis points. It can be assumed
that average trading costs calculated by relative bid-ask spread, spread/mid-quote, will be close
to the median, 66.67 basis points, assuming average stock price is around the median for each
price range.8 With a relative spread of 66.67 basis points, the SET has the highest trading cost
among all equity markets, higher than the stock exchanges in neighboring Malaysia and
Singapore, for which the median in bid-ask spread is 62.9 and 59.9 basis points, respectively.
Most stocks in the SET50 are traded between Baht 5-50, suggesting that the SET may not
need large ticks for high price stocks. Focusing on continuous trading periods (10:00 a.m. –
12:30 p.m. and 14:30 p.m. – 16:30 p.m.) on the main board and only the best bid and ask offers,
it is observed that some stocks moved across many thresholds in 2003. On average, each stock
traded in at least two price ranges in the sample period.
3 Regression models
This study analyses spread, depth and trading volume from endogenous tick changes in
order to determine effect from tick sizes. The regression models as in Harris (1994) and
8 We found that the mean of the relative bid-ask spread is 69 basis points for the entire SET50 list. This confirms that trading costs in the SET because the relative bid-ask spreads are by design. Please see Table 3 for details.
7
Niemeyer and Sandas (1994) have been applied to determine the effects of tick size to spread,
depth and trading volume by controlling for other stock’s attributes.
3.1 Bid-ask spread
We use relative tick size (tick size divided by mid-quote price) to explain binding
constraint instead of inverse mid-quote as in Harris (1994). Relative tick should be able to
capture the effect of nominal tick sizes to stock prices. This technique is also used by Niemeyer
and Sandas (1994).
Model specifications according to Harris (1994), Niemeyer and Sandas (1994), Stoll
(2000), Chung, Van Ness, and Van Ness (1999) and Chung et al. (2004) are as follows:.
RelSpread i,t = Desired i,t + εi,t,
Desired i,t = β0 + β1 RelTickSizei,t + β2 Volatilityi,t
+ β3 LogVolumei,t + β4 InvSqrtN i,t
+ β5 LogMktCap i,t; (1)
Where RelSpread i,t is the relative bid-ask spread defined as: (Best ask price – Best bid
price)/[MidQuote]. Desired i,t is conditional mean relative spread (“Desired” reflects its
interpretation in the switching model presented next. Investors will quote at nearest tick
numbers.) RelTickSize i,t is a nominal tick size divided by mid-quote in each price range.
Volatility i,t is the standard deviation of intraday return, log (MidQuotei ,t / MidQuote i ,t-1), in a
30-minute period. LogVolume i,t is the logarithm of trading volume (baht). InvSqrtN i,t is the
inverse squared root of the number of transactions (limit order submissions). LogMktCap i,t is the
8
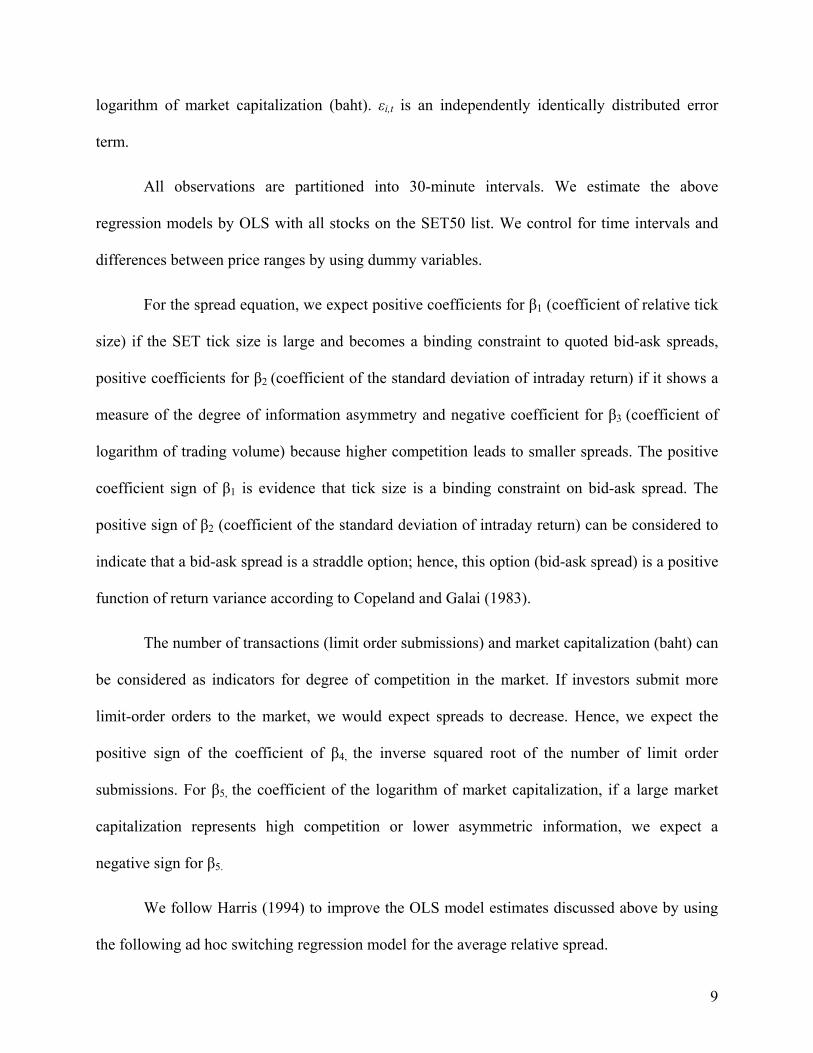
logarithm of market capitalization (baht). εi,t is an independently identically distributed error
term.
All observations are partitioned into 30-minute intervals. We estimate the above
regression models by OLS with all stocks on the SET50 list. We control for time intervals and
differences between price ranges by using dummy variables.
For the spread equation, we expect positive coefficients for β1 (coefficient of relative tick
size) if the SET tick size is large and becomes a binding constraint to quoted bid-ask spreads,
positive coefficients for β2 (coefficient of the standard deviation of intraday return) if it shows a
measure of the degree of information asymmetry and negative coefficient for β3 (coefficient of
logarithm of trading volume) because higher competition leads to smaller spreads. The positive
coefficient sign of β1 is evidence that tick size is a binding constraint on bid-ask spread. The
positive sign of β2 (coefficient of the standard deviation of intraday return) can be considered to
indicate that a bid-ask spread is a straddle option; hence, this option (bid-ask spread) is a positive
function of return variance according to Copeland and Galai (1983).
The number of transactions (limit order submissions) and market capitalization (baht) can
be considered as indicators for degree of competition in the market. If investors submit more
limit-order orders to the market, we would expect spreads to decrease. Hence, we expect the
positive sign of the coefficient of β4, the inverse squared root of the number of limit order
submissions. For β5, the coefficient of the logarithm of market capitalization, if a large market
capitalization represents high competition or lower asymmetric information, we expect a
negative sign for β5.
We follow Harris (1994) to improve the OLS model estimates discussed above by using
the following ad hoc switching regression model for the average relative spread.
9
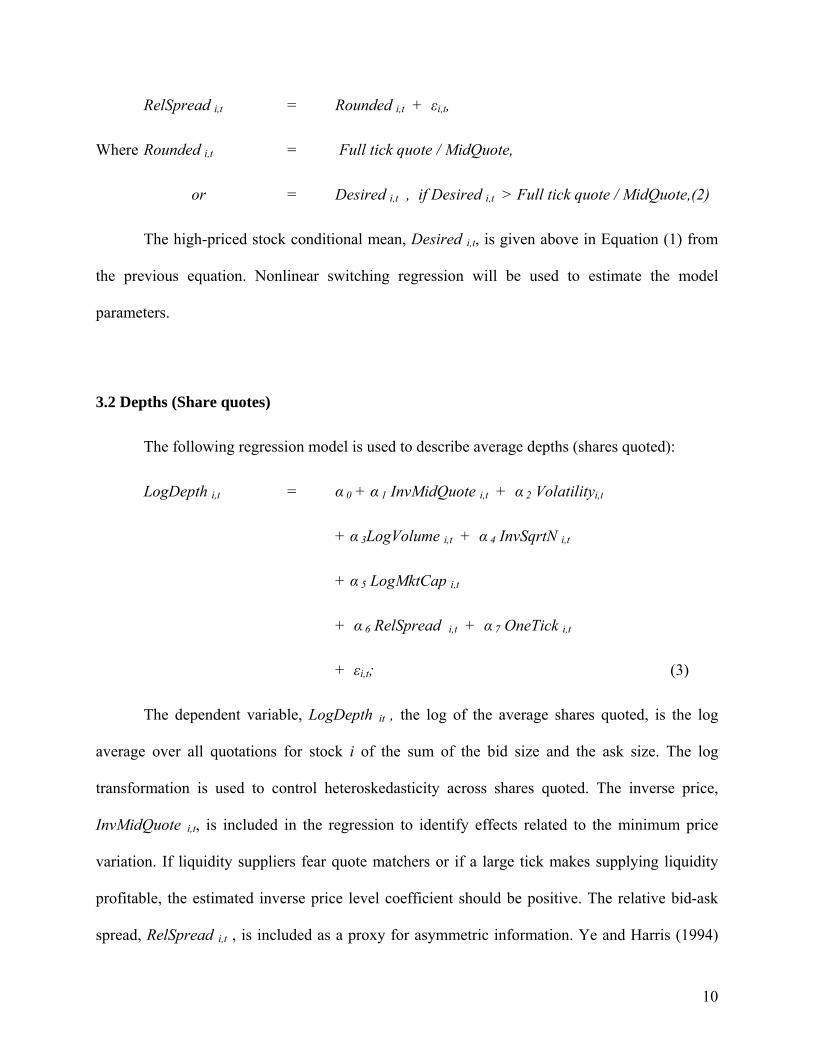
RelSpread i,t = Rounded i,t + εi,t,
Where Rounded i,t = Full tick quote / MidQuote,
or = Desired i,t , if Desired i,t > Full tick quote / MidQuote,(2)
The high-priced stock conditional mean, Desired i,t, is given above in Equation (1) from
the previous equation. Nonlinear switching regression will be used to estimate the model
parameters.
3.2 Depths (Share quotes)
The following regression model is used to describe average depths (shares quoted):
LogDepth i,t = α 0 + α 1 InvMidQuote i,t + α 2 Volatilityi,t
+ α 3LogVolume i,t + α 4 InvSqrtN i,t
+ α 5 LogMktCap i,t
+ α 6 RelSpread i,t + α 7 OneTick i,t
+ εi,t; (3)
The dependent variable, LogDepth it , the log of the average shares quoted, is the log
average over all quotations for stock i of the sum of the bid size and the ask size. The log
transformation is used to control heteroskedasticity across shares quoted. The inverse price,
InvMidQuote i,t, is included in the regression to identify effects related to the minimum price
variation. If liquidity suppliers fear quote matchers or if a large tick makes supplying liquidity
profitable, the estimated inverse price level coefficient should be positive. The relative bid-ask
spread, RelSpread i,t , is included as a proxy for asymmetric information. Ye and Harris (1994)
10
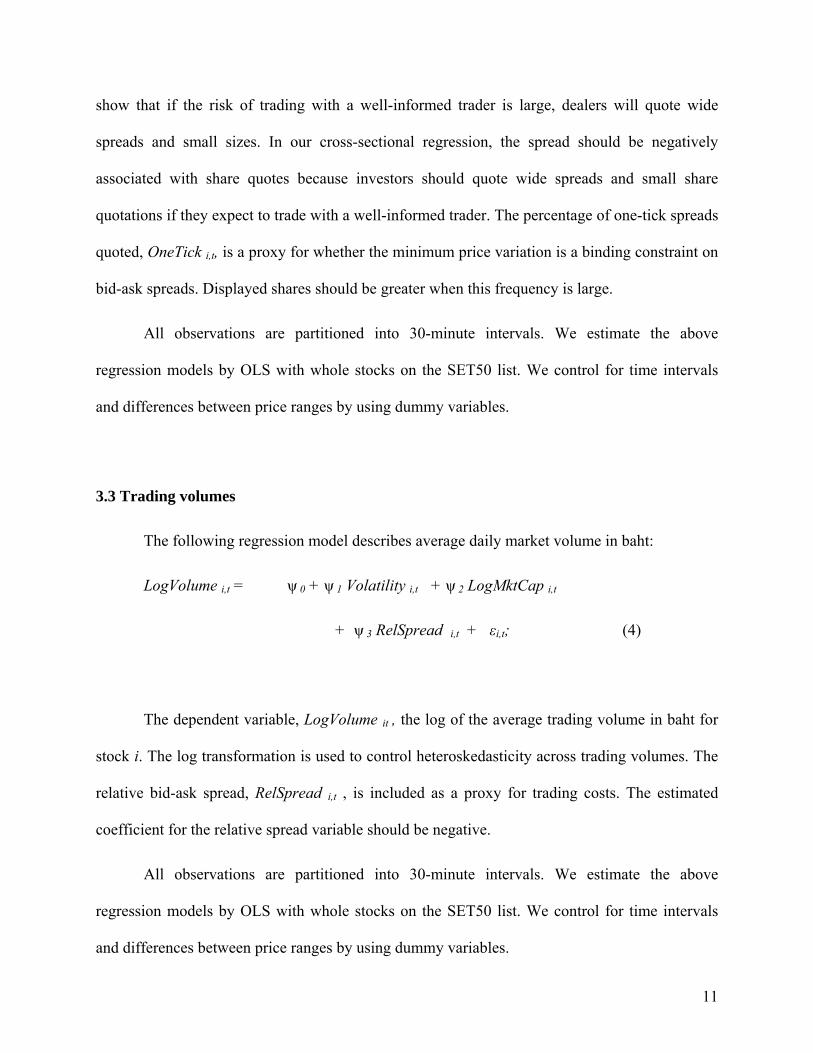
show that if the risk of trading with a well-informed trader is large, dealers will quote wide
spreads and small sizes. In our cross-sectional regression, the spread should be negatively
associated with share quotes because investors should quote wide spreads and small share
quotations if they expect to trade with a well-informed trader. The percentage of one-tick spreads
quoted, OneTick i,t, is a proxy for whether the minimum price variation is a binding constraint on
bid-ask spreads. Displayed shares should be greater when this frequency is large.
All observations are partitioned into 30-minute intervals. We estimate the above
regression models by OLS with whole stocks on the SET50 list. We control for time intervals
and differences between price ranges by using dummy variables.
3.3 Trading volumes
The following regression model describes average daily market volume in baht:
LogVolume i,t = ψ 0 + ψ 1 Volatility i,t + ψ 2 LogMktCap i,t
+ ψ 3 RelSpread i,t + εi,t; (4)
The dependent variable, LogVolume it , the log of the average trading volume in baht for
stock i. The log transformation is used to control heteroskedasticity across trading volumes. The
relative bid-ask spread, RelSpread i,t , is included as a proxy for trading costs. The estimated
coefficient for the relative spread variable should be negative.
All observations are partitioned into 30-minute intervals. We estimate the above
regression models by OLS with whole stocks on the SET50 list. We control for time intervals
and differences between price ranges by using dummy variables.
11
3.4 Simultaneous equations
To examine whether there are simultaneous biases in OLS estimation, we estimated the
system of three equations by using the instrumental three-stage least squares method for models
(1), (3), and (4). The instrumental variables used were all explanatory (exogenous) variables. All
observations are partitioned into 30-minute intervals. We estimate the above regression models
by three-stage least squared regression on all stocks in the SET50 list. We control for time
intervals and differences between price ranges by using dummy variables.
3.5 A multinomial model for bid-ask spreads
In order to estimate the spreads that would be quoted if investors could use one baht as
the largest tick size for stock prices above 100 baht, one needs a multinomial model for bid-ask
spreads. This section specifies and estimates models designed to represent the statistical
properties of discrete spreads. This multinomial bid-ask spreads model is analytically similar to
the discrete data model used in Harris (1994) for analyzing spread distribution frequencies and to
obtain projections for the sixteen usage frequencies that would be observed if traders could use
sixteenths in the US stock market.
The MLE Multinomial bid-ask spread model
The discrete quote generation process is represented by the rounding of random draws
from a continuous distribution. The process for generating a quote at time t for stock i is as
follows: First, an unobserved, underlying, unrounded relative spread, RelSpread i,t , is drawn
12
from a continuous distribution F(RelSpread i,t ; mi , ν) where mi is the mean unrounded relative
spread, ν is a distributional shape parameter, and F denotes the cumulative distribution function.
The unrounded relative spread is then multiplied by the price level to obtain the
unrounded absolute spread. The result is finally rounded to the nearest number of ticks quoted to
obtain the observed absolute discrete spread, where nearest is defined relative to a logarithmic
metric (geometric midpoint). The mean unrounded relative spread, m i,t, is specified as in the
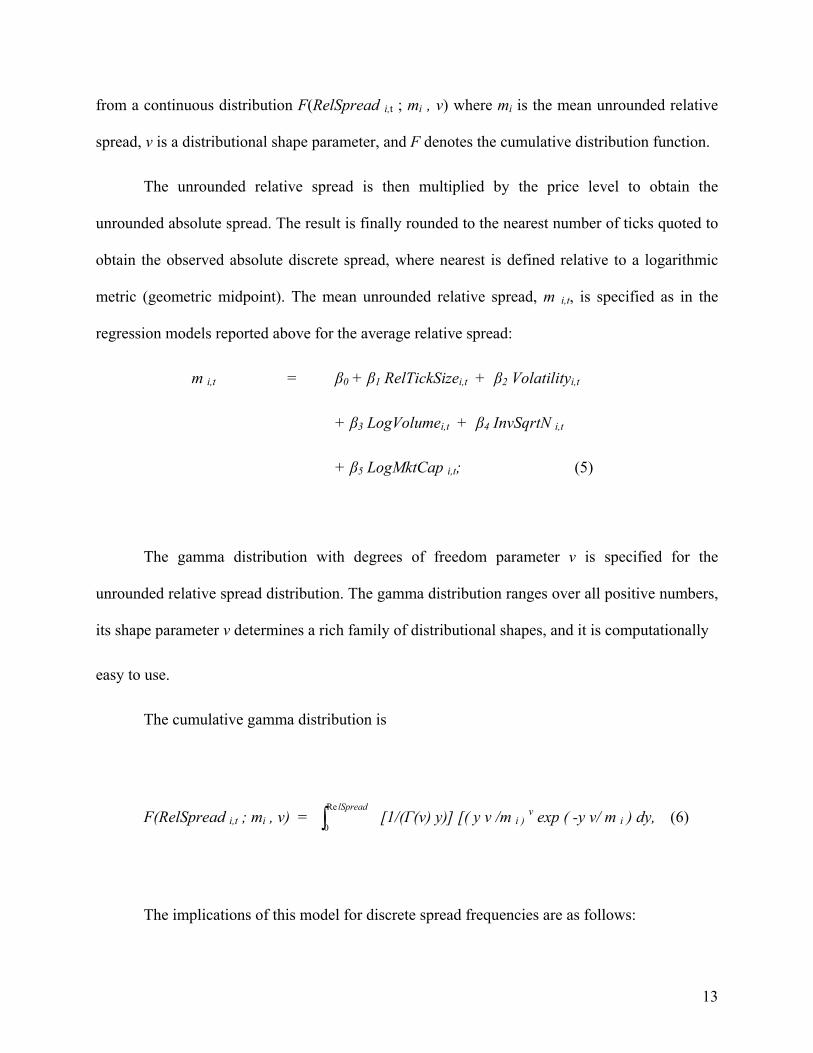
regression models reported above for the average relative spread:
m i,t = β0 + β1 RelTickSizei,t + β2 Volatilityi,t
+ β3 LogVolumei,t + β4 InvSqrtN i,t
+ β5 LogMktCap i,t; (5)
The gamma distribution with degrees of freedom parameter ν is specified for the
unrounded relative spread distribution. The gamma distribution ranges over all positive numbers,
its shape parameter ν determines a rich family of distributional shapes, and it is computationally
easy to use.
The cumulative gamma distribution is
F(RelSpread i,t ; mi , ν) = [1/(Γ(ν) y)] [( y ν /m ∫lSpreadRe
0i ) ν exp ( -y ν/ m i ) dy, (6)
The implications of this model for discrete spread frequencies are as follows:
13
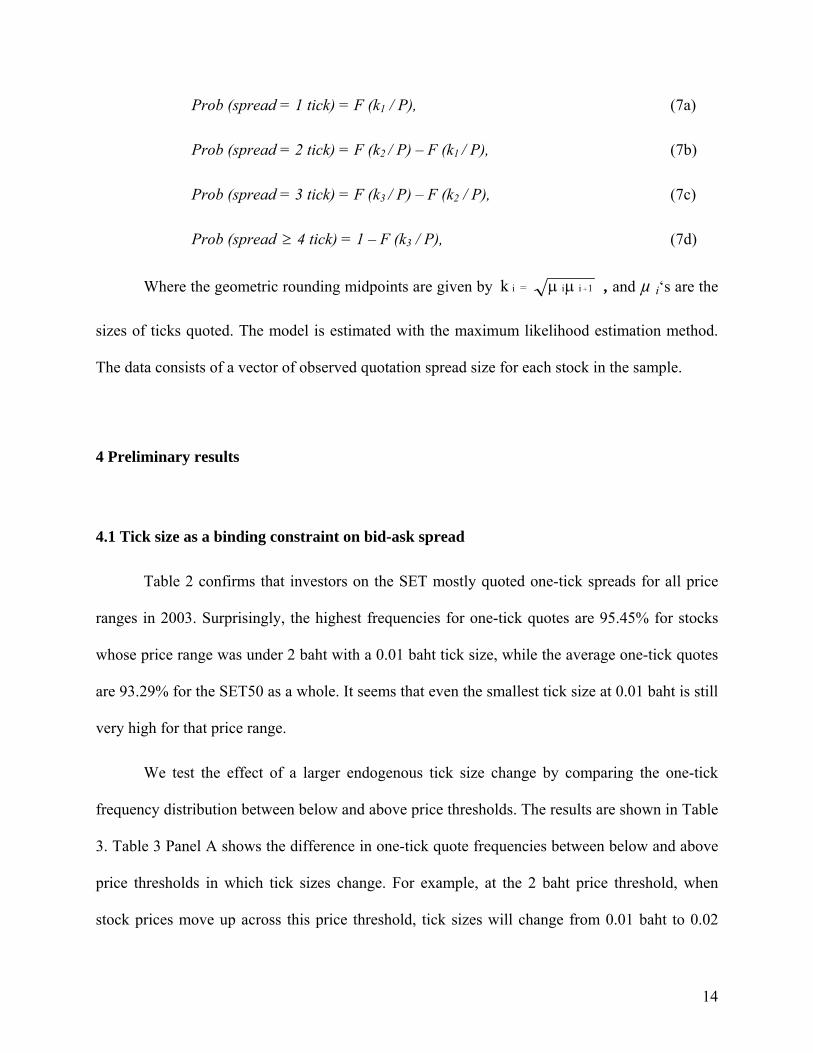
Prob (spread = 1 tick) = F (k1 / P), (7a)
Prob (spread = 2 tick) = F (k2 / P) – F (k1 / P), (7b)
Prob (spread = 3 tick) = F (k3 / P) – F (k2 / P), (7c)
Prob (spread 4 tick) = 1 – F (k≥ 3 / P), (7d)
Where the geometric rounding midpoints are given by 1iiik += μμ , and µ i‘s are the
sizes of ticks quoted. The model is estimated with the maximum likelihood estimation method.
The data consists of a vector of observed quotation spread size for each stock in the sample.
4 Preliminary results
4.1 Tick size as a binding constraint on bid-ask spread
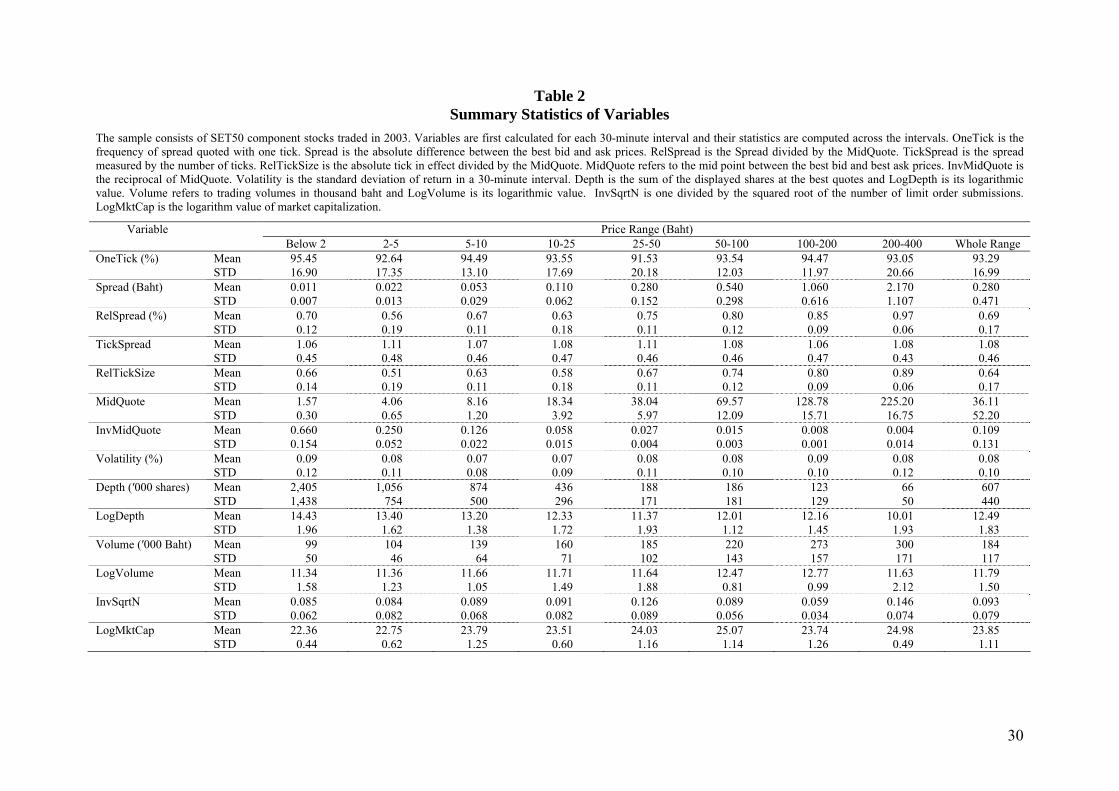
Table 2 confirms that investors on the SET mostly quoted one-tick spreads for all price
ranges in 2003. Surprisingly, the highest frequencies for one-tick quotes are 95.45% for stocks
whose price range was under 2 baht with a 0.01 baht tick size, while the average one-tick quotes
are 93.29% for the SET50 as a whole. It seems that even the smallest tick size at 0.01 baht is still
very high for that price range.
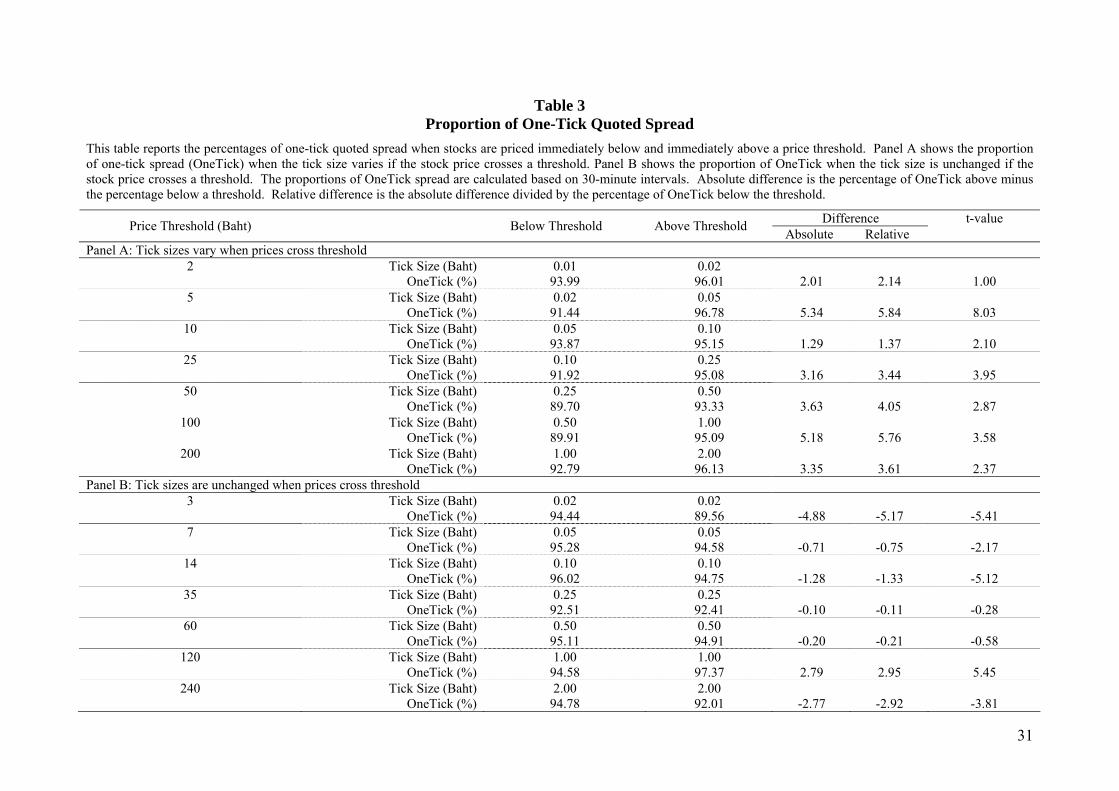
We test the effect of a larger endogenous tick size change by comparing the one-tick
frequency distribution between below and above price thresholds. The results are shown in Table
3. Table 3 Panel A shows the difference in one-tick quote frequencies between below and above
price thresholds in which tick sizes change. For example, at the 2 baht price threshold, when
stock prices move up across this price threshold, tick sizes will change from 0.01 baht to 0.02
14
baht. This illustrates very clearly that tick sizes increase by 100% on the absolute term. Because
we believe that tick sizes in the SET form a binding constraint to quoted bid-ask spread, we
expect higher frequencies in one-tick quote frequencies for stocks priced right above but not too
far from the 2 baht price threshold. As expected, although there is a very high percentage of one-
tick spread quotes for both below and above the 2 baht price threshold, as a general rule,
investors in the SET are more likely to quote one-tick quotes in the above-threshold price region.
The significant positive t-statistic confirms that one-tick quote frequencies in above-threshold
price region are more numerous than those in the below-threshold price region. Results in other
price thresholds confirm this phenomenon: that there are always more one-tick quote frequencies
in the higher-tick price ranges.
One can suspect that an increase in one-tick quote frequencies between price thresholds
might originate from other factors, e.g. market sentiment. Table 3 Panel B shows the difference
of one-tick quote frequencies between below and above price thresholds including comparison
between some price ranges in which tick sizes do not change. The difference in one-tick quote
frequencies shows no pattern in one-tick quote frequency changes with mixed positive or
negative signs in one-tick quote frequency differences, including some insignificant t-statistics.
However, most signs of one-tick quote frequency change are negative, indicating that tick sizes
are less of a binding constraint to quoted bid-ask spreads when prices increase. The indications
that increases in tick size induces higher one-tick quote frequencies supports the assumption that
the SET uses overly large tick sizes in each price range. The SET could reduce tick sizes by
expanding some price ranges and filling these in with smaller numbers than current tick sizes.
Table 2 demonstrates descriptive statistics in each price range for our all data set. We
partition the trading period into 30-minute intervals. This grouping separates each trading day
15
into nine 30-minute intervals.9 Table 2 shows that the mean of spread in baht terms is slightly
bigger than the tick size in every price range. It also shows that the ratio between spread and tick
size varies between 1.06 and 1.11 with a mode of 1.08. This small ratio confirms that tick size in
the SET is a very strong binding constraint on spread quotes. The relative spread starts from
0.56-0.97% with a mean of 0.69%, which is very close to the median of 66.67 basis points that
the SET uses when designing the tick-to-price ratio.
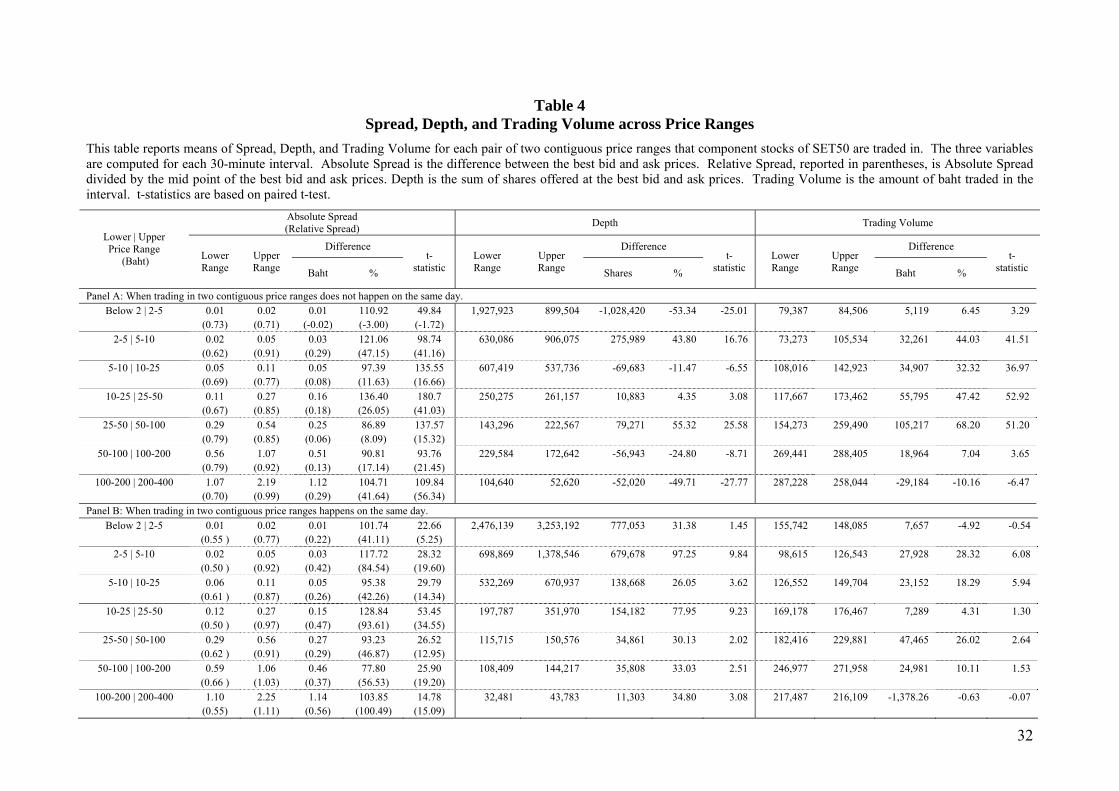
Table 4 Panel A represents spreads, depths, and trading volume in mean comparison
between two consecutive price ranges by comparing identical stocks trading in consecutive price
ranges. Table 4 Panel B shows spreads, depths, and trading volume in mean comparison on
trading days that stock prices moved across price thresholds with changed tick sizes. Table 4
supports the theory that larger tick sizes directly force larger spreads regardless of observation
technique.10 Larger ticks always induce higher relative bid-ask spreads, considered as higher
trading costs. In other words, bid-ask spread quotes increase by design because of larger
endogenous tick size change. Relative spread is then automatically increased when tick size is
increased. When we control for no change in tick size by comparing quoted spread and relative
spread below and above the price threshold in which a tick does not change (no report here),
results confirm that relative spread will decrease when the stock price is higher. Tick size is a
smaller binding constraint to bid-ask spread quotes when price increases if a tick is constant.
At this point, we can conclude that all ticks in the SET are a strong binding constraint in
quoted bid-ask spread by design. Investors in the SET might quote a lower spread if the SET
9 The first interval is 10:00a.m-10:30a.m., the second is 10:30 a.m.-11.00a.m., the third is 11:00 a.m.-11.30a.m., the fourth is 11:30 a.m.-12.00a.m., the fifth is 12:00 a.m.-12.30p.m., the sixth is 14:30 p.m.-15.00p.m., the seventh is 15:00 p.m.-15.30p.m., the eighth is 15:30 p.m.-16.00p.m., and the ninth is 16:00 p.m.-16.30p.m. 10 Table 4 Panel A compares spreads, depths, and trading volume between consecutive price ranges by excluding trading days in which stock prices moved across thresholds, while Table 5 Panel A focuses only days when stocks did pass the threshold.
16
provides tick sizes smaller than current nominal tick sizes in each price range. The magnitudes of
quoted spreads over tick size in Table 3 are between 1.06 and 1.11 ticks, much lower than
average of 3.7 ticks reported by Angel (1997). This finding confirms that nominal tick sizes in
the SET are very large.
4.2 Endogenous tick size change on market depth
Table 4 shows the mean of displayed depths in each price range. It comes as no surprise
that displayed depths decrease gradually when the mid-quotes (baht) increase. Table 4 Panel A
shows descriptive statistics including mean comparison for the same stocks traded between
consecutive price ranges. Although investors have to quote a wider spread because of the
increasing tick sizes in the upper price ranges, depths do not always increase by the same amount
as the spread increase. This means that there are other factors beyond tick size change that affect
changes in displayed depths in each price range.
The effect from endogenous tick change can be seen in Table 4 Panel B. This table shows
descriptive statistics including mean comparison between below and above price thresholds on
trading days in which stock prices passed thresholds in 2003. We can see that a larger tick size
that caused a larger spread induced a larger depth due to the time priority rule. Our observations
readily serve to investigate endogenous tick size effect on depth because stock prices will vary in
a specific range (-10% and 10% from the previous price). Hence, our analysis will be only
minimally affected by other factors. We also find that an increase in depth brought by an
increase in endogenous tick size comes from both sides of bid and ask quotes (no report here).
We found that an increase on both sides of bid and ask quotes go in the same direction as
17
approximately related increasing percentages. Both buyers and sellers benefit from an increase in
depth.
Overall, our results indicate that larger tick size as a binding constraint on bid-ask spreads
leads to larger displayed depth because both time precedence and price priority encourage
investors to expose their orders to get higher priority in trading.
4.3 Endogenous tick size change on trading volume
Table 2 shows that trading volume (baht) gradually increases when stock price increases
or when mid-quotes (baht) increase. However, the number of shares traded (not reported)
decreases with an increase in price. We can observe that investors in the SET have average
investment budgets ranging from 184,000 baht in SET50 stocks, as shown in the trading volume
row (thousand baht).
Tables 4 shows that increases in tick sizes lead to higher relative spreads; put differently,
bring higher transaction costs for stock trading. The results in Table 4 show that trading volume
(baht) generally increases when tick sizes increase. However, Table 4 Panel A reveals that
trading volume (baht) decreases when we compare trading volume between the last pair of two
consecutive price ranges: 100-200 baht (1 baht tick size) and 200-400 baht (2 baht tick size).
This is confirmed by Table 4 Panel B, which shows insignificance in mean comparison of
trading volume (baht) between trading volume below and above the 200 baht price threshold.
This indicates that an overly large tick size inhibits trading volume because of a large spread,
much as a high transaction cost might preclude trades, especially for stocks priced above 200
baht or a tick size above 1 baht.
18
5 Regression results
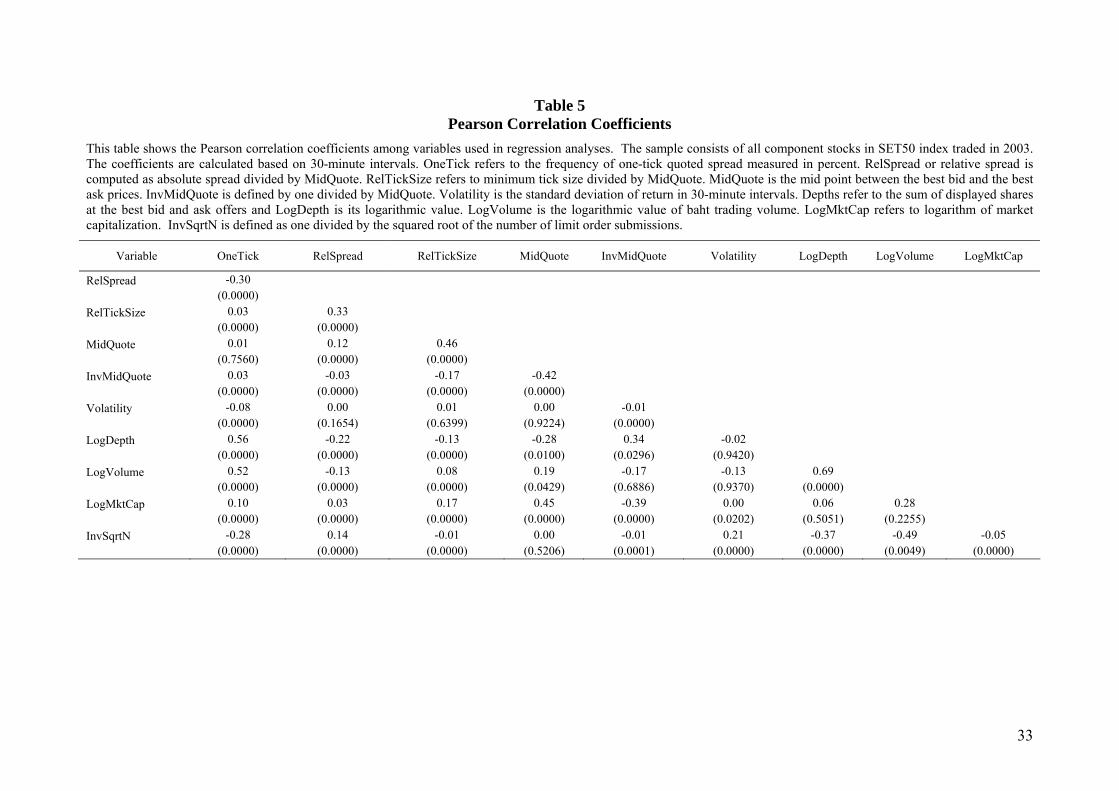
Cross-sectional summary of means and correlations for the various variables of interest
appear in Tables 2 and 5. The minimum price variation constraint on bid-ask spreads appears to
be highly binding. On average, 93.29% of the spreads quoted were one tick quotes. Many of
these spreads, of course, may be the result of rounding down to the one-tick spread rather than
rounding up to the higher spread. Surprisingly, the spread frequency is approximately identical in
low-priced stocks and in high-priced stocks, suggesting that the minimum price variation must be
an empirically significant determinant of market quality for stocks of all price levels. This
evidence supports the contention that tick size in the SET is very large for each price range. If
the SET implements a smaller number of price ranges with lower tick-to-price ratio than now in
place, we would expect a lower one-tick frequency observation.
The high correlation between the log of depth and the log of trading volume, 0.69, is
notable. The correlation is high because high depths can be considered as indicating that high
market liquidity gives higher chance of executing orders. The mid-quote and log of market
capitalization also show high correlation, 0.45, implying that high-priced stocks have large
market capitalization. Also note that the various measures of economic scale such as firm size
(log of market capitalization) and baht volume are not highly correlated. This low correlation
suggests that multicollinearity problems will be not severely present in regression models in
which both variables appear.
19
5.1 Bid-ask spreads
Table 6 shows regression results for estimated bid-ask spread models. Ordinary least-
squares estimates of this regression model appear in Table 6, column 2. The estimated variable
coefficients for the volatility and trading volume variables have their expected signs and are
significantly different from zero. The log market capitalization variable coefficient estimate is
negative. If large market capitalization is a proxy for low of asymmetric information, this result
would confirm that large firms have lower asymmetric information. The negative inverse
squared root of the number of limit order submission variable coefficient is surprising. The
positive relative tick size coefficient is consistent with a binding constraint placed on the
absolute bid-ask spread by the minimum price variation for all SET50 stocks.
Non-linear switching regression model is estimated and shown in Table 6, column 3. We
obtained all expected signs and highly significant coefficients for all exogenous variables.
However, we observed an unexpected positive sign for the log market capitalization variable
coefficient estimate.
In sum, a larger tick size is a strong binding constraint on bid-ask spread as evidenced by
highly positive significance in relative tick size coefficient. Spread is a positive function to return
volatility and a negative function to high competition. Asymmetric information is lower in stocks
with high market capitalization.
5.2 Depths (Quotation shares)
Table 7 column 2 presents primarily the expected signs for the OLS regression
coefficient estimates. The significantly positive inverse price coefficient identifies effects related
20
to the minimum price variation. When the minimum price variation constraint on bid-ask spreads
is binding, traders are willing to display more shares, especially for low-priced stocks. As
expected, we get a negative volatility coefficient estimate because traders are risk-averse.
We know that LogVolume, inverse squared root of number of limit order submissions,
and log of market capitalization are all measures of firm size and trading activity. We obtain
significantly positive signs of LogVolume and log of market capitalization coefficient estimates.
In line with this, the inverse squared root of number of limit order submissions coefficient
estimate is significantly negative, as expected.
Because the relative bid-ask spread is included as a proxy for asymmetric information.
Ye and Harris (1994) show that if the risk of trading with a well-informed trader is large, dealers
will quote wide spreads and small sizes. Our findings support the asymmetric information
hypothesis that when asymmetric information is high, investors will quote high spreads with
lower depths. Hence, we get the significantly negative sigh of a relative bid-ask spread
coefficient estimate.
Because the volatility variable in the OLS depth model captures the effect of asymmetric
information as well, hence, to have two variables capture same effect might cause each variable
to be less effective in observing the asymmetric information factor. We run the OLS regression
again by excluding the relative spread variable. We received all the expected signs of the OLS
regression model with high confidence level for regression coefficient estimates as shown in
Table 7 column 4. The adjusted R-squared for these three OLS depth models (Table 7 columns 2
to 4) show a small difference: 0.680, 0.657, and 0.649, with the root mean squared error (RMSE)
of 0.632, 0.655, and 0.662, respectively. We will use the third OLS model in Table 7 column 4 to
predict the tick size reduction effect for depth in Chapter Six.
21
In sum, larger tick size and time priority encourage investors to display more depth.
When the minimum price variation constraint on bid-ask spreads is binding, traders are willing to
display more shares, especially for low-priced stocks. Other factors are the same as reported in
much of the earlier literature. Depth is negatively related to market volatility because investors
avoid undesirable order execution and positively related to market trading activity and firm size.
5.3 Trading volume
Evidence in Table 7 column 6 also confirms that investors consider an increase in relative
spreads as a higher trading cost, as seen by highly negative significance in relative spread
coefficient in the OLS model. Surprisingly, contradictory to many previous papers in which high
volatility is said to attract investors, an increase in market volatility discourages trading volume
(baht) because limit order submitters may try to avoid having their orders executed in a volatile
market like the SET. Log of market capitalization helps scale of regression. We obtain a
significant positive for this variable coefficient estimate, as expected.
Given the evidence that an overly large tick size imposes a very high transaction cost on
trading volumes when stock prices pass the 200 baht threshold in Table 4, we can conclude at
this point that maximum tick size of 1 baht may be suitable for the SET as a way to encourage
higher depths and not preclude trading volume. This means the highest price range should start at
100 baht with a 1 baht tick size.
22
5.4 Simultaneous equations
Since the bid-ask spread model includes trading volume as a regressor, the depth model
includes spread and trading volume as regressors, and the trading volume model includes spread
as a regressor. The use of endogenous variables as regressors may cause OLS estimate biases. To
examine whether these biases are significant, we run the three-stage least squared (3SLS) system
equations and report the results in column 1 of Table 6 and columns 1 and 5 of Table 7 for the
spread model, the depth model, and the trading volume model, respectively.
The results show that the spread model, the depth model, and the trading volume model
as estimated by the 3SLS have nearly all the significant expected signs of regression coefficient
as the OLS models do, except the wrong signs for some variables. Unfortunately, both adjusted
R-square for spread and depth regression models of 3SLS estimate are negative. Hence, we
should go on with our work by developing using the OLS estimate because simultaneous bias
does not occur in our study.
5.5 A multinomial MLE model for bid-ask spreads
The MLE bid-ask spread model
This model is estimated using the maximum likelihood estimation method. The data
consists of observed spread size quotation frequencies for the SET50 stocks in the sample. The
first through third observed quotation spread size frequencies contains 1, 2, and 3 tick-size
spread quotes. The fourth observed spread quote size frequencies contain the cumulative
observed quotation spread size frequencies of all spread quotes of 4 ticks or more.
23
The signs of the estimated parameters (Table 6 column 4) all appear as expected and are
the same as those of the OLS model, with all the coefficients significantly different from zero.
We also run the MLE bid-ask spread model on stock prices in different price ranges and get most
expected signs and highly significant coefficients for all exogenous variables.
6 Projections
Our aim in this chapter is to project the usage frequency of given current minimum price
variations and halved current ones in the MLE bid-ask spread models in order to compare to the
observed usage frequency in each number of ticks quoted. For example, a 2 baht tick (full tick)
and a half tick (1 baht) are used to forecast the usage frequency in the 200-400 baht price range
in order to be comparable to the observed numbers of ticks quoted in that price range. Results are
shown in Table 8. We can see that the MLE bid-ask spread model provides us with a powerful
tool for forecasting the usage frequencies of number of ticks quoted in each price range. The
one-tick quote in the prediction model dominates all usage frequencies, similar to observed usage
frequency in numbers of tick quotes.
The projected usage frequency of a halved spread with a given minimum price variation
is computed from the estimated MLE bid-ask spread models by evaluating 1iiik +''=' μμ ,
and µ` i‘s are the sizes of halved ticks quoted.
The greatest frequency in stock trading is seen in those stocks priced between 10 and 25
baht using data for 28 of the SET50 stocks. The observed usage frequency in this price range
with a 0.10 baht tick is 93.55%, 5.23%, 0.81%, and 0.40% for the number of ticks quoted at 1, 2,
3, and 4 ticks or more. The usage frequency forecasted by the MLE bid-ask spread model with
24
0.10 baht tick is 94.15%, 5.68%, 0.02%, and 0.15% respectively. If the SET expects to
implement a half tick (0.05 baht) in the 10-25 baht price range instead of the current 0.10 baht
tick size, it is easy to predict the usage frequency of each number of halved tick quotes by simply
halving the relative tick size coefficient estimate in the MLE bid-ask spread model. We assume
that all other trading conditions remain unchanged except for a 50% decrease in tick size (from
0.10 baht to 0.05 baht).
The forecasted usage frequency by the MLE bid-ask spread model with a 0.05 baht tick is
90.00%, 9.81%, 0.04%, and 0.15% respectively. We run an accuracy check by using the
coefficients of exogenous variables from the lower price range (5-10 baht) to fit the data in the
10-25 baht price range. This shows that investors still generally quote in one-tick bid-ask
spreads. Results in other price ranges show the same pattern, again confirming that the SET uses
large tick sizes.
Our focus is to predict the usage frequency when using a one-baht tick instead of a two-
baht tick for price ranges above 200 baht. Although the number of stocks are small for predicting
usage frequency of tick quotes in the high-priced regions, we find that investors will quote in
both one-tick and two-tick spreads in the 200-400 baht price range at a frequency of 44.79% and
54.38% respectively when we use a half tick (1 baht) to forecast using the MLE bid-ask spread
model. This confirms that tick sizes at one baht can be used for all price ranges above 200 baht
because a one-baht tick is still large enough to serve as a binding constraint in the high price
ranges. Hence, the recommended highest price is 100 baht with the largest tick size at 1 baht.
If the SET implements a 1 baht tick size for stocks priced above 100 baht, Thai regulators
may be concerned about the effect on quoted depths and trading volume. We also thus explore
25
the effect on quoted depths and trading volumes in the 200-400 baht price range using the OLS
models as below:
First, we predict the fitted spreads from the MLE model when we use half tick sizes in
every price range. The results are shown in Table 9. Our model appears accurate when we
compare the observed spreads with the fitted spreads. We predict the half-tick spread quote by
halving the coefficient of the relative tick size in the MLE model. Our model predicts a reduction
in quoted bid-ask spread of between 9.43% and 54.55% when we use half tick sizes in all price
ranges. Our intention is to predict the spread quotes in the 200-400 baht price range when the
tick is reduced from 2 baht to 1 baht. Our model reports a decrease in spread quotes of 27.65%
when a tick is decreased by 50% from 2 baht to 1 baht for 200 Baht-to-400 Baht price range.
The relative tick size coefficient estimate of the MLE bid-ask spread model from Table 6
and the average mid-quote for the 200-400 baht price range from Table 2 are 1.1109 and 225.20
baht. Multiplying this change by the estimated relative spread coefficient of -0.057 from the OLS
trading volume model in Table 7 column 6 yields a projected change in LogVolume of 0.0281,
which implies an increase in trading volume of 2.85%.
In the same way, Table 9 presents the decrease in quoted depths by halving the
coefficient of inverse price as suggested by Harris (1994). This yields a decrease in depth of
between 4.63% and 22.49% in every price range if we cut all tick sizes by 50%, driven by our
focus to predict the quoted depths in the 200-400 baht price range when a tick decreases from 2
baht to 1 baht. Our model reports a decrease in quoted depths by 4.63% when a tick is decreased
by 50% from 2 baht to 1 baht in the 200-400 baht price range. However, our model cannot
include the effect on the hidden depths that might change when a tick size is decreased from 2
baht to 1 baht in 200-400 baht price range.
26
7 Summary and conclusion
We found that minimum tick sizes in SET are strong binding constraints on bid-ask
spread quotes because most bid-ask spreads in the SET are quoted at the 1 tick level. When stock
prices move upwards, investors will be forced, by market design, to get higher spreads.
However, when stock prices move downwards, investors continue to quote largely in one-tick
spreads. This evidence confirms the overly large tick size phenomena in the SET.
Because minimum tick sizes affect sizes of spread quotes directly, wider (narrower)
spreads lead to higher (lower) depths because large tick size and time priority encourage liquidity
providers to display more depths. Larger tick size is considered as a transaction cost if traders
have the choice of quoting in smaller spreads. An optimal tick size will encourage depth while
not hindering trading volume.
Our findings support conclusions in previous literature that spread increases with higher
volatility while it decreases with higher volume and larger firm size (smaller asymmetric
information). Depths decrease with higher volatility (higher asymmetric information) and larger
price. Trading volume increases with larger firm sizes (smaller asymmetric information), then
decreases upon larger spread and higher volatility (higher asymmetric information). Overall, our
evidence suggests that maximum tick size might well be at 1 baht. Nominal tick sizes varying
from 0.01 baht to 1.00 baht will encourage depth in SET and do not present overly high trading
costs. Our MLE bid-ask spread model also predicts that investors still mainly quote in one-tick
spreads for stocks ranging from 200-400 baht after a 50% reduction in tick size. This means that
the SET could set the maximum price range starting from 100 baht with the largest tick size at 1
baht. Our findings show that a decrease from a 2 baht tick size to a 1 baht tick size in the 200-
400 baht price range can reduce a spread quote by 27.65%, while there is negligible impact on
27
change in quoted depths and trading volume (a decrease of 4.63% and an increase of 1.09%
respectively). We believe more research should be done on the effect on hidden depths in this
price range. Our results are confirmed by Harris (1994), who found that the effect of a tick
decrease has a minimal effect on quoted depths and trading volume for high-priced stocks
although the SET implements multiple tick sizes rather than a 1/8 US$ for stock prices above
US$1 on the NYSE. However, evidence that investors always quote bid-ask spread at 1 tick
suggests that SET can reduce its tick-to-price ratio from the current median of 66.67 basis points.
28
29
Table 1 Tick Sizes Used by the Stock Exchange of Thailand
The table shows absolute and relative tick sizes used by SET for different price ranges. The relative tick size or Tick-to-Price Ratio is simply the absolute tick size divided by the possible price in the price range. For each price range, the lowest, middle, and highest values of Tick-to-Price Ratio are the absolute tick size used in the range divided by the highest possible price, the mid-point of the price range, and the lowest possible price respectively.
Tick Size Tick-to-Price Ratio (%) Price Range
(Baht) Absolute (Baht) Lowest Middle Highest
Panel A: Tick sizes used before November 5, 2001 < 10 0.10 1.000 2.000 100.000
10 < 50 0.25 0.500 0.834 2.500
50 < 100 0.50 0.500 0.667 1.000
100 < 200 1.00 0.500 0.667 1.000
200 < 600 2.00 0.333 0.500 1.000
600 < 1,000 4.00 0.400 0.500 0.667
1000 <= 6.00 ― ― 0.600
Panel B: Tick sizes currently used from November 5, 2001 < 2 0.01 0.500 1.000 100.000
2 < 5 0.02 0.400 0.571 1.000
5 < 10 0.05 0.500 0.667 1.000
10 < 25 0.10 0.400 0.571 1.000
25 < 50 0.25 0.500 0.667 1.000
50 < 100 0.50 0.500 0.667 1.000
100 < 200 1.00 0.500 0.667 1.000
200 < 400 2.00 0.500 0.667 1.000
400 < 800 4.00 0.500 0.667 1.000
800 <= 6.00 ― ― 0.600
30
Table 2 Summary Statistics of Variables
The sample consists of SET50 component stocks traded in 2003. Variables are first calculated for each 30-minute interval and their statistics are computed across the intervals. OneTick is the frequency of spread quoted with one tick. Spread is the absolute difference between the best bid and ask prices. RelSpread is the Spread divided by the MidQuote. TickSpread is the spread measured by the number of ticks. RelTickSize is the absolute tick in effect divided by the MidQuote. MidQuote refers to the mid point between the best bid and best ask prices. InvMidQuote is the reciprocal of MidQuote. Volatility is the standard deviation of return in a 30-minute interval. Depth is the sum of the displayed shares at the best quotes and LogDepth is its logarithmic value. Volume refers to trading volumes in thousand baht and LogVolume is its logarithmic value. InvSqrtN is one divided by the squared root of the number of limit order submissions. LogMktCap is the logarithm value of market capitalization.
Variable Price Range (Baht)
Below 2 2-5 5-10 10-25 25-50 50-100 100-200 200-400 Whole Range
OneTick (%) Mean 95.45 92.64 94.49 93.55 91.53 93.54 94.47 93.05 93.29 STD 16.90 17.35 13.10 17.69 20.18 12.03 11.97 20.66 16.99 Spread (Baht) Mean 0.011 0.022 0.053 0.110 0.280 0.540 1.060 2.170 0.280 STD 0.007 0.013 0.029 0.062 0.152 0.298 0.616 1.107 0.471 RelSpread (%) Mean 0.70 0.56 0.67 0.63 0.75 0.80 0.85 0.97 0.69 STD 0.12 0.19 0.11 0.18 0.11 0.12 0.09 0.06 0.17 TickSpread Mean 1.06 1.11 1.07 1.08 1.11 1.08 1.06 1.08 1.08 STD 0.45 0.48 0.46 0.47 0.46 0.46 0.47 0.43 0.46 RelTickSize Mean 0.66 0.51 0.63 0.58 0.67 0.74 0.80 0.89 0.64 STD 0.14 0.19 0.11 0.18 0.11 0.12 0.09 0.06 0.17 MidQuote Mean 1.57 4.06 8.16 18.34 38.04 69.57 128.78 225.20 36.11 STD 0.30 0.65 1.20 3.92 5.97 12.09 15.71 16.75 52.20 InvMidQuote Mean 0.660 0.250 0.126 0.058 0.027 0.015 0.008 0.004 0.109 STD 0.154 0.052 0.022 0.015 0.004 0.003 0.001 0.014 0.131 Volatility (%) Mean 0.09 0.08 0.07 0.07 0.08 0.08 0.09 0.08 0.08 STD 0.12 0.11 0.08 0.09 0.11 0.10 0.10 0.12 0.10 Depth (′000 shares) Mean 2,405 1,056 874 436 188 186 123 66 607 STD 1,438 754 500 296 171 181 129 50 440 LogDepth Mean 14.43 13.40 13.20 12.33 11.37 12.01 12.16 10.01 12.49 STD 1.96 1.62 1.38 1.72 1.93 1.12 1.45 1.93 1.83 Volume (′000 Baht) Mean 99 104 139 160 185 220 273 300 184 STD 50 46 64 71 102 143 157 171 117 LogVolume Mean 11.34 11.36 11.66 11.71 11.64 12.47 12.77 11.63 11.79 STD 1.58 1.23 1.05 1.49 1.88 0.81 0.99 2.12 1.50 InvSqrtN Mean 0.085 0.084 0.089 0.091 0.126 0.089 0.059 0.146 0.093 STD 0.062 0.082 0.068 0.082 0.089 0.056 0.034 0.074 0.079 LogMktCap Mean 22.36 22.75 23.79 23.51 24.03 25.07 23.74 24.98 23.85
STD 0.44 0.62 1.25 0.60 1.16 1.14 1.26 0.49 1.11
31
Table 3 Proportion of One-Tick Quoted Spread
This table reports the percentages of one-tick quoted spread when stocks are priced immediately below and immediately above a price threshold. Panel A shows the proportion of one-tick spread (OneTick) when the tick size varies if the stock price crosses a threshold. Panel B shows the proportion of OneTick when the tick size is unchanged if the stock price crosses a threshold. The proportions of OneTick spread are calculated based on 30-minute intervals. Absolute difference is the percentage of OneTick above minus the percentage below a threshold. Relative difference is the absolute difference divided by the percentage of OneTick below the threshold.
Difference Price Threshold (Baht) Below Threshold Above Threshold Absolute Relative t-value
Panel A: Tick sizes vary when prices cross threshold
2 Tick Size (Baht) 0.01 0.02 OneTick (%) 93.99 96.01 2.01 2.14 1.00
5 Tick Size (Baht) 0.02 0.05 OneTick (%) 91.44 96.78 5.34 5.84 8.03
10 Tick Size (Baht) 0.05 0.10 OneTick (%) 93.87 95.15 1.29 1.37 2.10
25 Tick Size (Baht) 0.10 0.25 OneTick (%) 91.92 95.08 3.16 3.44 3.95
50 Tick Size (Baht) 0.25 0.50 OneTick (%) 89.70 93.33 3.63 4.05 2.87
100 Tick Size (Baht) 0.50 1.00 OneTick (%) 89.91 95.09 5.18 5.76 3.58
200 Tick Size (Baht) 1.00 2.00 OneTick (%) 92.79 96.13 3.35 3.61 2.37
Panel B: Tick sizes are unchanged when prices cross threshold 3 Tick Size (Baht) 0.02 0.02 OneTick (%) 94.44 89.56 -4.88 -5.17 -5.41
7 Tick Size (Baht) 0.05 0.05 OneTick (%) 95.28 94.58 -0.71 -0.75 -2.17
14 Tick Size (Baht) 0.10 0.10 OneTick (%) 96.02 94.75 -1.28 -1.33 -5.12
35 Tick Size (Baht) 0.25 0.25 OneTick (%) 92.51 92.41 -0.10 -0.11 -0.28
60 Tick Size (Baht) 0.50 0.50 OneTick (%) 95.11 94.91 -0.20 -0.21 -0.58
120 Tick Size (Baht) 1.00 1.00 OneTick (%) 94.58 97.37 2.79 2.95 5.45
240 Tick Size (Baht) 2.00 2.00 OneTick (%) 94.78 92.01 -2.77 -2.92 -3.81
32
Table 4 Spread, Depth, and Trading Volume across Price Ranges
This table reports means of Spread, Depth, and Trading Volume for each pair of two contiguous price ranges that component stocks of SET50 are traded in. The three variables are computed for each 30-minute interval. Absolute Spread is the difference between the best bid and ask prices. Relative Spread, reported in parentheses, is Absolute Spread divided by the mid point of the best bid and ask prices. Depth is the sum of shares offered at the best bid and ask prices. Trading Volume is the amount of baht traded in the interval. t-statistics are based on paired t-test.
Absolute Spread (Relative Spread) Depth Trading Volume
Difference Difference Difference Lower | Upper Price Range
(Baht) Lower Range
Upper Range Baht %
t-statistic
Lower Range
Upper Range Shares %
t- statistic
Lower Range
Upper Range Baht %
t- statistic
Panel A: When trading in two contiguous price ranges does not happen on the same day. Below 2 | 2-5 0.01 0.02 0.01 110.92 49.84 1,927,923 899,504 -1,028,420 -53.34 -25.01 79,387 84,506 5,119 6.45 3.29
(0.73) (0.71) (-0.02) (-3.00) (-1.72) 2-5 | 5-10 0.02 0.05 0.03 121.06 98.74 630,086 906,075 275,989 43.80 16.76 73,273 105,534 32,261 44.03 41.51
(0.62) (0.91) (0.29) (47.15) (41.16) 5-10 | 10-25 0.05 0.11 0.05 97.39 135.55 607,419 537,736 -69,683 -11.47 -6.55 108,016 142,923 34,907 32.32 36.97
(0.69) (0.77) (0.08) (11.63) (16.66) 10-25 | 25-50 0.11 0.27 0.16 136.40 180.7 250,275 261,157 10,883 4.35 3.08 117,667 173,462 55,795 47.42 52.92
(0.67) (0.85) (0.18) (26.05) (41.03) 25-50 | 50-100 0.29 0.54 0.25 86.89 137.57 143,296 222,567 79,271 55.32 25.58 154,273 259,490 105,217 68.20 51.20
(0.79) (0.85) (0.06) (8.09) (15.32) 50-100 | 100-200 0.56 1.07 0.51 90.81 93.76 229,584 172,642 -56,943 -24.80 -8.71 269,441 288,405 18,964 7.04 3.65
(0.79) (0.92) (0.13) (17.14) (21.45) 100-200 | 200-400 1.07 2.19 1.12 104.71 109.84 104,640 52,620 -52,020 -49.71 -27.77 287,228 258,044 -29,184 -10.16 -6.47
(0.70) (0.99) (0.29) (41.64) (56.34) Panel B: When trading in two contiguous price ranges happens on the same day.
Below 2 | 2-5 0.01 0.02 0.01 101.74 22.66 2,476,139 3,253,192 777,053 31.38 1.45 155,742 148,085 7,657 -4.92 -0.54 (0.55 ) (0.77) (0.22) (41.11) (5.25)
2-5 | 5-10 0.02 0.05 0.03 117.72 28.32 698,869 1,378,546 679,678 97.25 9.84 98,615 126,543 27,928 28.32 6.08 (0.50 ) (0.92) (0.42) (84.54) (19.60)
5-10 | 10-25 0.06 0.11 0.05 95.38 29.79 532,269 670,937 138,668 26.05 3.62 126,552 149,704 23,152 18.29 5.94 (0.61 ) (0.87) (0.26) (42.26) (14.34)
10-25 | 25-50 0.12 0.27 0.15 128.84 53.45 197,787 351,970 154,182 77.95 9.23 169,178 176,467 7,289 4.31 1.30 (0.50 ) (0.97) (0.47) (93.61) (34.55)
25-50 | 50-100 0.29 0.56 0.27 93.23 26.52 115,715 150,576 34,861 30.13 2.02 182,416 229,881 47,465 26.02 2.64 (0.62 ) (0.91) (0.29) (46.87) (12.95)
50-100 | 100-200 0.59 1.06 0.46 77.80 25.90 108,409 144,217 35,808 33.03 2.51 246,977 271,958 24,981 10.11 1.53 (0.66 ) (1.03) (0.37) (56.53) (19.20)
100-200 | 200-400 1.10 2.25 1.14 103.85 14.78 32,481 43,783 11,303 34.80 3.08 217,487 216,109 -1,378.26 -0.63 -0.07 (0.55) (1.11) (0.56) (100.49) (15.09)
Variable OneTick RelSpread RelTickSize MidQuote InvMidQuote Volatility LogDepth LogVolume LogMktCap
RelSpread -0.30 (0.0000) RelTickSize 0.03 0.33 (0.0000) (0.0000) MidQuote 0.01 0.12 0.46 (0.7560) (0.0000) (0.0000) InvMidQuote 0.03 -0.03 -0.17 -0.42 (0.0000) (0.0000) (0.0000) (0.0000) Volatility -0.08 0.00 0.01 0.00 -0.01 (0.0000) (0.1654) (0.6399) (0.9224) (0.0000) LogDepth 0.56 -0.22 -0.13 -0.28 0.34 -0.02 (0.0000) (0.0000) (0.0000) (0.0100) (0.0296) (0.9420) LogVolume 0.52 -0.13 0.08 0.19 -0.17 -0.13 0.69 (0.0000) (0.0000) (0.0000) (0.0429) (0.6886) (0.9370) (0.0000) LogMktCap 0.10 0.03 0.17 0.45 -0.39 0.00 0.06 0.28 (0.0000) (0.0000) (0.0000) (0.0000) (0.0000) (0.0202) (0.5051) (0.2255) InvSqrtN -0.28 0.14 -0.01 0.00 -0.01 0.21 -0.37 -0.49 -0.05 (0.0000) (0.0000) (0.0000) (0.5206) (0.0001) (0.0000) (0.0000) (0.0049) (0.0000)
This table shows the Pearson correlation coefficients among variables used in regression analyses. The sample consists of all component stocks in SET50 index traded in 2003. The coefficients are calculated based on 30-minute intervals. OneTick refers to the frequency of one-tick quoted spread measured in percent. RelSpread or relative spread is computed as absolute spread divided by MidQuote. RelTickSize refers to minimum tick size divided by MidQuote. MidQuote is the mid point between the best bid and the best ask prices. InvMidQuote is defined by one divided by MidQuote. Volatility is the standard deviation of return in 30-minute intervals. Depths refer to the sum of displayed shares at the best bid and ask offers and LogDepth is its logarithmic value. LogVolume is the logarithmic value of baht trading volume. LogMktCap refers to logarithm of market capitalization. InvSqrtN is defined as one divided by the squared root of the number of limit order submissions.
33
Table 5 Pearson Correlation Coefficients
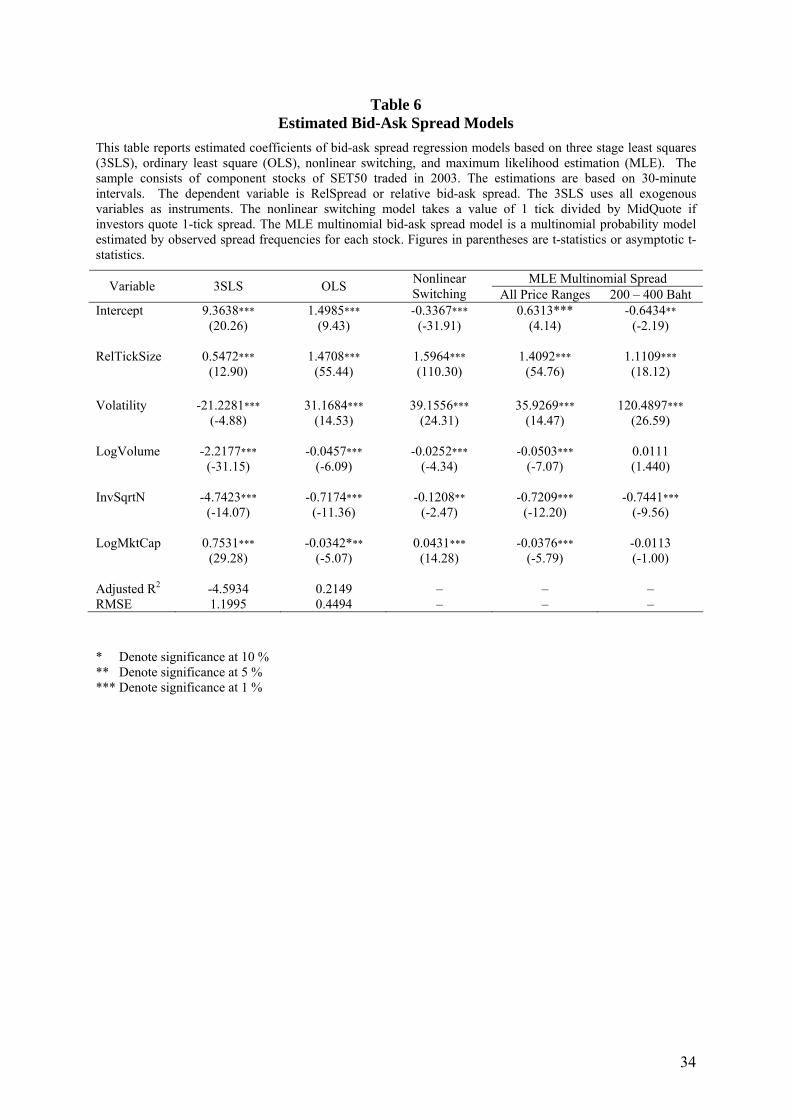
Table 6 Estimated Bid-Ask Spread Models
This table reports estimated coefficients of bid-ask spread regression models based on three stage least squares (3SLS), ordinary least square (OLS), nonlinear switching, and maximum likelihood estimation (MLE). The sample consists of component stocks of SET50 traded in 2003. The estimations are based on 30-minute intervals. The dependent variable is RelSpread or relative bid-ask spread. The 3SLS uses all exogenous variables as instruments. The nonlinear switching model takes a value of 1 tick divided by MidQuote if investors quote 1-tick spread. The MLE multinomial bid-ask spread model is a multinomial probability model estimated by observed spread frequencies for each stock. Figures in parentheses are t-statistics or asymptotic t-statistics.
MLE Multinomial Spread Variable 3SLS OLS Nonlinear Switching All Price Ranges 200 – 400 Baht
Intercept 9.3638*** 1.4985*** -0.3367*** 0.6313*** -0.6434** (20.26) (9.43) (-31.91) (4.14) (-2.19)
RelTickSize 0.5472*** 1.4708*** 1.5964*** 1.4092*** 1.1109*** (12.90) (55.44) (110.30) (54.76) (18.12)
Volatility -21.2281*** 31.1684*** 39.1556*** 35.9269*** 120.4897*** (-4.88) (14.53) (24.31) (14.47) (26.59)
LogVolume -2.2177*** -0.0457*** -0.0252*** -0.0503*** 0.0111 (-31.15) (-6.09) (-4.34) (-7.07) (1.440)
InvSqrtN -4.7423*** -0.7174*** -0.1208** -0.7209*** -0.7441*** (-14.07) (-11.36) (-2.47) (-12.20) (-9.56)
LogMktCap 0.7531*** -0.0342*** 0.0431*** -0.0376*** -0.0113 (29.28) (-5.07) (14.28) (-5.79) (-1.00) Adjusted R2 -4.5934 0.2149 – – – RMSE 1.1995 0.4494 – – – * Denote significance at 10 % ** Denote significance at 5 % *** Denote significance at 1 %
34
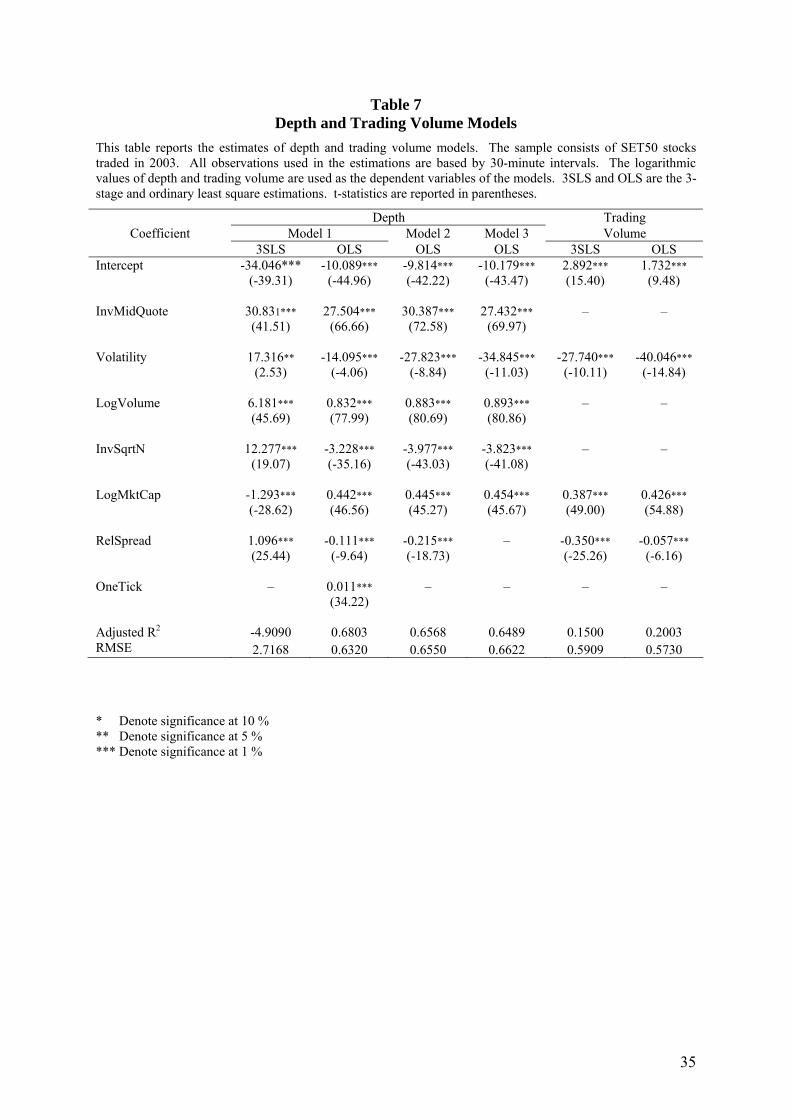
Table 7 Depth and Trading Volume Models
This table reports the estimates of depth and trading volume models. The sample consists of SET50 stocks traded in 2003. All observations used in the estimations are based by 30-minute intervals. The logarithmic values of depth and trading volume are used as the dependent variables of the models. 3SLS and OLS are the 3-stage and ordinary least square estimations. t-statistics are reported in parentheses.
Depth Trading Coefficient Model 1 Model 2 Model 3 Volume
3SLS OLS OLS OLS 3SLS OLS Intercept -34.046*** -10.089*** -9.814*** -10.179*** 2.892*** 1.732*** (-39.31) (-44.96) (-42.22) (-43.47) (15.40) (9.48) InvMidQuote 30.831*** 27.504*** 30.387*** 27.432*** – – (41.51) (66.66) (72.58) (69.97) Volatility 17.316** -14.095*** -27.823*** -34.845*** -27.740*** -40.046*** (2.53) (-4.06) (-8.84) (-11.03) (-10.11) (-14.84) LogVolume 6.181*** 0.832*** 0.883*** 0.893*** – – (45.69) (77.99) (80.69) (80.86) InvSqrtN 12.277*** -3.228*** -3.977*** -3.823*** – – (19.07) (-35.16) (-43.03) (-41.08) LogMktCap -1.293*** 0.442*** 0.445*** 0.454*** 0.387*** 0.426*** (-28.62) (46.56) (45.27) (45.67) (49.00) (54.88) RelSpread 1.096*** -0.111*** -0.215*** – -0.350*** -0.057*** (25.44) (-9.64) (-18.73) (-25.26) (-6.16) OneTick – 0.011*** – – – – (34.22) Adjusted R2 -4.9090 0.6803 0.6568 0.6489 0.1500 0.2003 RMSE 2.7168 0.6320 0.6550 0.6622 0.5909 0.5730 * Denote significance at 10 % ** Denote significance at 5 % *** Denote significance at 1 %
35
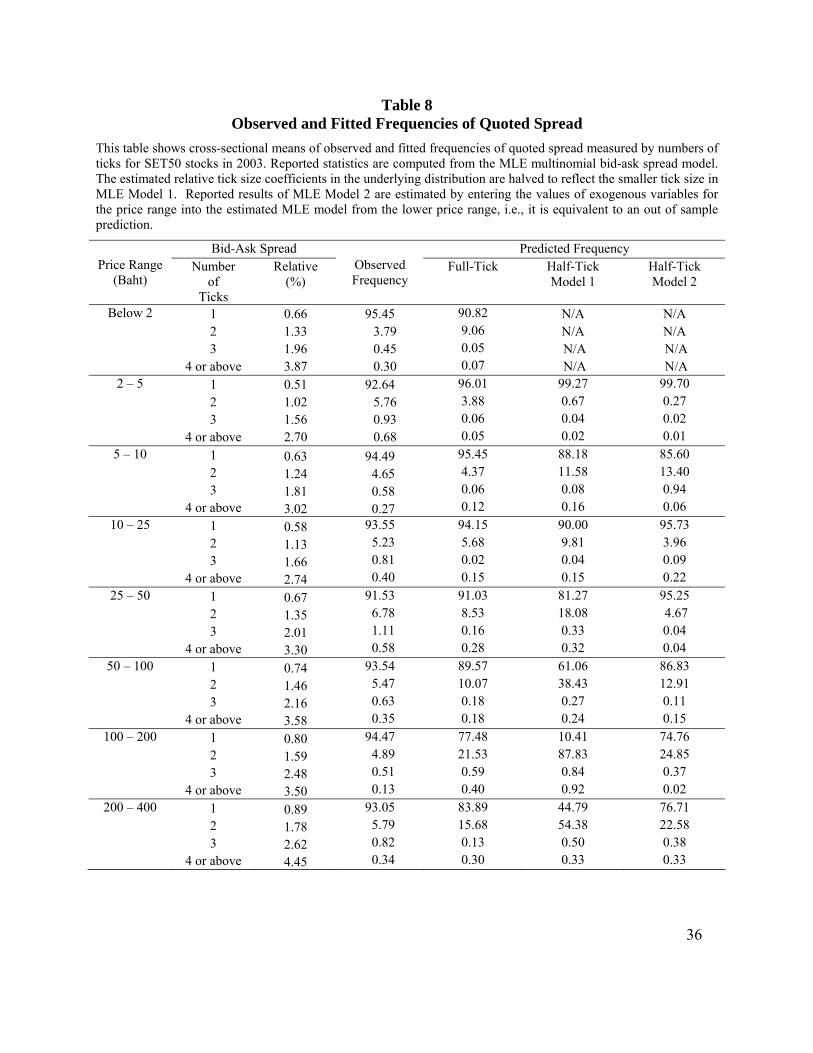
Table 8 Observed and Fitted Frequencies of Quoted Spread
This table shows cross-sectional means of observed and fitted frequencies of quoted spread measured by numbers of ticks for SET50 stocks in 2003. Reported statistics are computed from the MLE multinomial bid-ask spread model. The estimated relative tick size coefficients in the underlying distribution are halved to reflect the smaller tick size in MLE Model 1. Reported results of MLE Model 2 are estimated by entering the values of exogenous variables for the price range into the estimated MLE model from the lower price range, i.e., it is equivalent to an out of sample prediction.
Bid-Ask Spread Predicted Frequency Price Range
(Baht) Number
of Ticks
Relative (%)
Observed Frequency
Full-Tick Half-Tick Model 1
Half-Tick Model 2
Below 2 1 0.66 95.45 90.82 N/A N/A 2 1.33 3.79 9.06 N/A N/A 3 1.96 0.45 0.05 N/A N/A 4 or above 3.87 0.30 0.07 N/A N/A
2 – 5 1 0.51 92.64 96.01 99.27 99.70 2 1.02 5.76 3.88 0.67 0.27 3 1.56 0.93 0.06 0.04 0.02 4 or above 2.70 0.68 0.05 0.02 0.01
5 – 10 1 0.63 94.49 95.45 88.18 85.60 2 1.24 4.65 4.37 11.58 13.40 3 1.81 0.58 0.06 0.08 0.94 4 or above 3.02 0.27 0.12 0.16 0.06
10 – 25 1 0.58 93.55 94.15 90.00 95.73 2 1.13 5.23 5.68 9.81 3.96 3 1.66 0.81 0.02 0.04 0.09 4 or above 2.74 0.40 0.15 0.15 0.22
25 – 50 1 0.67 91.53 91.03 81.27 95.25 2 1.35 6.78 8.53 18.08 4.67 3 2.01 1.11 0.16 0.33 0.04 4 or above 3.30 0.58 0.28 0.32 0.04
50 – 100 1 0.74 93.54 89.57 61.06 86.83 2 1.46 5.47 10.07 38.43 12.91 3 2.16 0.63 0.18 0.27 0.11 4 or above 3.58 0.35 0.18 0.24 0.15
100 – 200 1 0.80 94.47 77.48 10.41 74.76 2 1.59 4.89 21.53 87.83 24.85 3 2.48 0.51 0.59 0.84 0.37 4 or above 3.50 0.13 0.40 0.92 0.02
200 – 400 1 0.89 93.05 83.89 44.79 76.71 2 1.78 5.79 15.68 54.38 22.58 3 2.62 0.82 0.13 0.50 0.38 4 or above 4.45 0.34 0.30 0.33 0.33
36
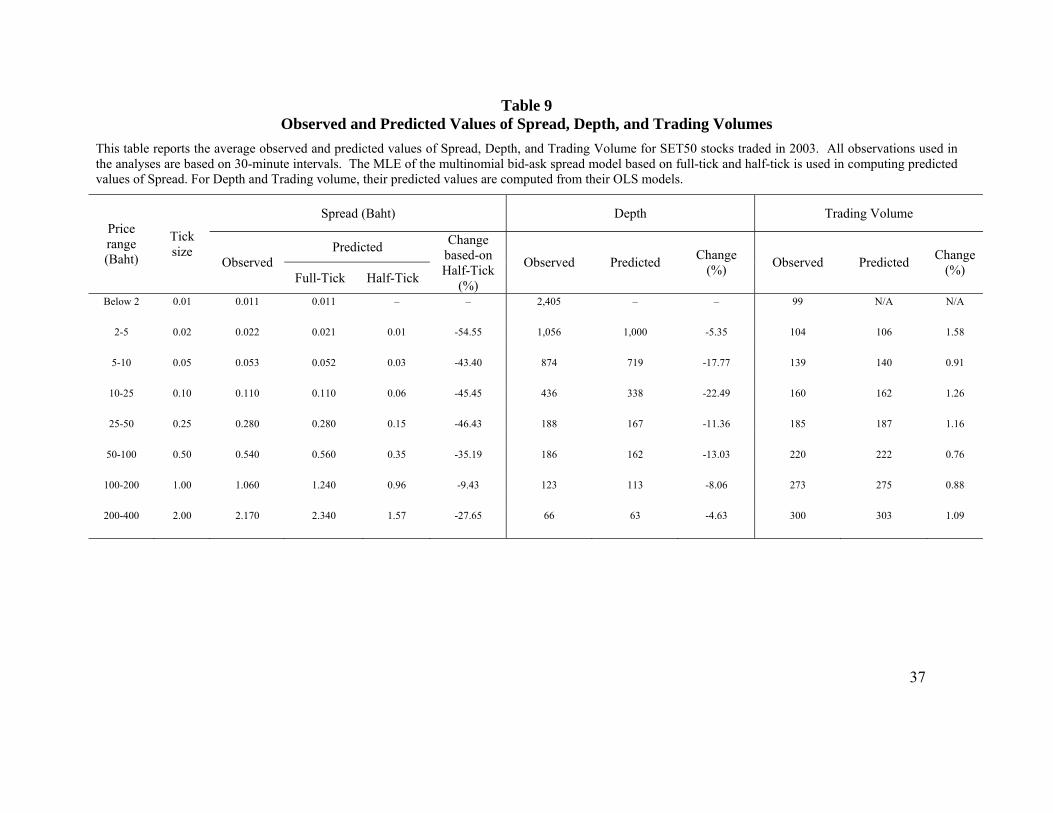
Table 9 Observed and Predicted Values of Spread, Depth, and Trading Volumes
This table reports the average observed and predicted values of Spread, Depth, and Trading Volume for SET50 stocks traded in 2003. All observations used in the analyses are based on 30-minute intervals. The MLE of the multinomial bid-ask spread model based on full-tick and half-tick is used in computing predicted values of Spread. For Depth and Trading volume, their predicted values are computed from their OLS models.
Spread (Baht) Depth Trading Volume
Predicted Price range (Baht)
Tick size
Observed Full-Tick Half-Tick
Change based-on Half-Tick
(%)
Observed Predicted Change (%) Observed Predicted Change
(%)
Below 2 0.01 0.011 0.011 – – 2,405 – – 99 N/A N/A
2-5 0.02 0.022 0.021 0.01 -54.55 1,056 1,000 -5.35 104 106 1.58
5-10 0.05 0.053 0.052 0.03 -43.40 874 719 -17.77 139 140 0.91
10-25 0.10 0.110 0.110 0.06 -45.45 436 338 -22.49 160 162 1.26
25-50 0.25 0.280 0.280 0.15 -46.43 188 167 -11.36 185 187 1.16
50-100 0.50 0.540 0.560 0.35 -35.19 186 162 -13.03 220 222 0.76
100-200 1.00 1.060 1.240 0.96 -9.43 123 113 -8.06 273 275 0.88
200-400 2.00 2.170 2.340 1.57 -27.65 66 63 -4.63 300 303 1.09
37
REFERENCES Angel, James J. "Tick Size, Share Prices, And Stock Splits," Journal of Finance, 1997, v52 (2,Jun), 655-681. Ahn, Hee-Joon, Charles Q. Cao and Hyuk Choe. "Tick Size, Spread And Volume," Journal of Financial Intermediation, 1996, v5(1,Jan), 2-22. Bessembinder (2000), “Tick Size, Spreads, and Liquidity: An Analysis of NASDAQ Securities Trading near Ten Dollars,” Journal of Financial Intermediation 9, pp. 213–239. Bourghelle, David and Fany Declerck. "Why Markets Should Not Necessarily Reduce The Tick Size," Journal of Banking and Finance," 2004, v28(2,Feb), 373-398. Chan, K. and C. Hwang, 2001, The impact of tick size on the quality of a pure order-driven market: evidence from the Stock Exchange of Hong Kong, Working Paper. Hong Kong University of Science and Technology. Chordia, T., Roll, R., Subrahmanyam, A., 2001. Market liquidity and trading activity. Journal of Finance 56, 501–530.
Chordia, Tarun and Avanidhar Subrahmanyam. "Market Making, The Tick Size, And Payment-For-Order Flow: Theory And Evidence," Journal of Business, 1995, v68(4), 543-575.
Chung, Kee H. and Chairat Chuwonganant. "Tick Size, Order Handling Rules, And Trading Costs," Financial Management, 2004, v33(1,Spring), 47-62. Chung K. H., Kim K. A., and Kitsabunnarat P (2004). “Liquidity and Quote Clustering in a Market with Multiple Tick Sizes,” Journal of Financial Research, Forthcoming. Chung, Kee H. and Robert A. Van Ness, 2001 "Order Handling Rules, Tick Size, And The Intraday Pattern Of Bid-Ask Spreads," Journal of Financial Markets, 2001, v4 (2,Apr), 143-161. Chung, K.H., B. Van Ness, and R. Van Ness, 1999, Limit orders and the bid-ask spread, Journal of Financial Economics 53, 255-287. Copeland, T., 1979, Liquidity changes following stock splits, Journal of Finance 34, 115-141. Copeland E. Thomas and Galai Dan, 1983, Information Effects on the Bid-Ask Spread, Journal of Finance 38, no. 5, December 1983, 1457-1469. Cordella, T., Foucault, T., 1999. Minimum price variations, time priority and quotes dynamics. Journal of Financial Intermediation 8, 141–173. 38
Demsetz (1968), “The Cost of Transacting,” Quarterly Journal of Economics (February), pp. 33-53. Foucault, T., 1999, Order flow composition and trading costs in a dynamic limit order market, Journal of Financial Markets 2, 193-226. Goldstein, Michael A. and Kenneth A. Kavajecz. "Eighths, Sixteenths, And Market Depth: Changes In Tick Size And Liquidity Provision On The NYSE," Journal of Financial Economics, 2000, v56(1,Apr), 125-149. Harris, L., 1991, Stock price clustering and discreteness, Review of Financial Studies 4, 389-416. Harris, L., 1994, Minimum price variations, discrete bid-ask spreads, and quotation sizes, Review of Financial Studies 7, 149-178. Harris, L., 1996, Does a large minimum price variation encourage order display? Working Paper. University of Southern California. Harris, L., 2003, Trading and exchanges: Market microstructure for practitioners, Oxford university press, Inc. Jones, C.M., Lipson, M.L., 2001. Sixteenths, direct evidence on institutional execution costs. Journal of Financial Economics 59, 253–278. Ke, Mei-Chu, Ching-Hai Jiang and Yen-Sheng Huang. "The Impact Of Tick Size On Intraday Stock Price Behavior: Evidence From The Taiwan Stock Exchange," Pacific Basin Finance Journal, 2004, v12(1,Jan), 19-39. Lau, Sie Ting and Thomas H. McInish. "Reducing Tick Size On The Stock Exchange Of Singapore," Pacific Basin Finance Journal, 1995, v3(4,Dec), 485-496. MacKinnon, Greg and Howard Nemiroff. "Liquidity And Tick Size: Does Decimalization Matter?," Journal of Financial Research, 1999, v22(3,Fall), 287-299. Niemeyer, Jonas, and Patrick Sandas, 1994, “Tick size, market liquidity, and trading volume: Evidence from the Stockholm Stick Exchange, Working paper, Carnegie Mellon University. Porter, David C. and Daniel G. Weaver. "Tick Size And Market Quality," Financial Management, 1997, v26(4,Winter), 5-26. Stoll, H., 2000, Friction, Journal of Finance 55, 1479-1514. Van Ness, R., B. Van Ness, and S. Pruitt, 2000, The impact of the reduction in tick increments in major U.S. markets on spreads, depth, and volatility, Review of Quantitative Finance and Accounting 15, 153-167. 39