energy analysis of binder-jetting additive manufacturing
TRANSCRIPT
HAL Id: hal-01170919https://hal.archives-ouvertes.fr/hal-01170919
Submitted on 2 Jul 2015
HAL is a multi-disciplinary open accessarchive for the deposit and dissemination of sci-entific research documents, whether they are pub-lished or not. The documents may come fromteaching and research institutions in France orabroad, or from public or private research centers.
L’archive ouverte pluridisciplinaire HAL, estdestinée au dépôt et à la diffusion de documentsscientifiques de niveau recherche, publiés ou non,émanant des établissements d’enseignement et derecherche français ou étrangers, des laboratoirespublics ou privés.
Energy analysis of Binder-jetting AdditiveManufacturing Processes
Xin Xu, Simon Meteyer, Nicolas Perry, Yaoyao Fiona Zhao
To cite this version:Xin Xu, Simon Meteyer, Nicolas Perry, Yaoyao Fiona Zhao. Energy analysis of Binder-jetting AdditiveManufacturing Processes. International Journal of Production Research, Taylor & Francis, 2014, pp.1-11. �10.1080/00207543.2014.937013�. �hal-01170919�

Science Arts & Métiers (SAM)is an open access repository that collects the work of Arts et Métiers ParisTech
researchers and makes it freely available over the web where possible.
This is an author-deposited version published in: http://sam.ensam.euHandle ID: .http://hdl.handle.net/10985/9694
To cite this version :
Xin XU, Simon METEYER, Nicolas PERRY, Yaoyao Fiona ZHAO - Energy analysis of Binder-jetting Additive Manufacturing Processes - International Journal of Production Research p.1-11 -2014
Any correspondence concerning this service should be sent to the repository
Administrator : [email protected]
Energy analysis of Binder-jetting Additive Manufacturing Processes
Xin Xua, Simon Meteyer
b, Nicolas Perry
c, Yaoyao Fiona Zhao
a*
a McGill University, Montreal, H3A 0C3, Canada
b Arts et Métiers ParisTech, Paris, France
c Arts et Métiers ParisTech, I2M Université de Bordeaux - UMR 5295, Talence, France
* Corresponding author. Tel.: +1-514-398-2523; fax: +1-514-398-7365. E-mail address:
Energy analysis of Binder-jetting Additive Manufacturing Processes
Considering the potential for new product design possibilities and the reduction
of environmental impacts, Additive Manufacturing (AM) processes are
considered to possess significant advantages for automotive, aerospace and
medical equipment industries. One of the commercial AM techniques is Binder-
Jetting (BJ). This technique can be used to process a variety of materials
including stainless steel, ceramic, polymer and glass. However, there is very
limited research about this AM technology on sustainability aspect. This paper
presents a method to build an energy consumption model for printing stage of BJ
process. Mathematical analyses are performed to find out the correlation between
the energy consumption and geometry of the manufactured part. Based on the
analyses, total energy consumption is calculated as a function of part geometry
and printing parameters. Finally, test printing is performed to check the accuracy
of the model. This process model provides a tool to optimize part geometry
design with respect to energy consumption.
Additive manufacturing; Binder-jetting; energy analysis; part geometry
Subject classification codes: include these here if the journal requires them
Abbreviation List
DTO: Define & transmit orders to subsystems.
PP: Part Printing.
PC: Part Curing.
PS: Part Sintering.
DPL: Dry printed layer.
SNL: Spread new layer.
PNL: Print new layer.
I1: Print powder
I2: Binder
I3: Cleaner
O1: Printed part
O2: Waste of binder
O3: Waste of cleaner
1. Introduction
In the past few decades, Additive Manufacturing (AM), also known as 3D printing
technology, has drawn more and more attention from the industrial world. Many case
studies have showed AM technologies’ advantage in manufacturing of short series of
customised products [1]. Compared with traditional subtractive manufacturing, AM has
three main advantages:
(1) Freeform fabrication: AM remove the traditional manufacturing restrictions
and provides the design freedom for innovative product [2].
(2) Short supply chain: AM can reduce the supply chain of fabrication and
enhance profit space for manufacturers [3].
(3) Sustainable manufacturing: AM has a huge potential to reduce he
environmental impact that normal manufacturing has [4].
Because of these promising characteristics, AM has been employed in industry
for some time and plenty of researches have been conducted on the aspect of process
control and product quality. However, while claiming the advantage on the
environmental aspect, there is still very limit research on the sustainability aspect of this
technology. Another issue is because of the lack of well documented life-cycle data, it is
difficult to conduct an exact Life-Cycle Assessment (LCA) or sustainability analysis for
AM technologies. To take a step forward in the sustainability area, this paper provides a
method to calculate energy consumption of printing process for Binder-Jetting (BJ) [5]
technology and based on part design and printing parameters. This research contributes
to a better understanding on the sustainability aspect of the BJ process. Furthermore,
this research also develops an approach to calculate energy data by virtual
manufacturing. Thus, similar models for other AM technologies can also be derived
from this method.
This paper is organized as follows: first the background of BJ technology is
introduced. Previous works relevant to process energy calculation, virtual
manufacturing and part slicing techniques are summarized to illustrate the context and
meaning of this research. Secondly, a method to calculate printing energy in BJ process
correlating to part geometry and printing parameters is presented. The workflow of this
model is described step by step. Sub-processes of printing are introduced and analysed
as well. Test printings are conducted to check the accuracy of the model. Finally,
conclusions are drawn, results are documented and future outlooks are discussed.
1.1. BJ AM technology
In order to abstract the process flow from the actual BJ technology, the first task is to
understand how this technology fabricates functional parts from raw materials.
Binder-jetting is one of commercial 3D printing technologies. This technology
was originally developed at MIT in the 1990s [6] and commercialized in 2010. It can
handle materials including sand, polymer, glass and metal. Printing process of BJ
technology can be divided into the following steps: printing, curing, de-powdering,
sintering, infiltration, annealing and finishing.
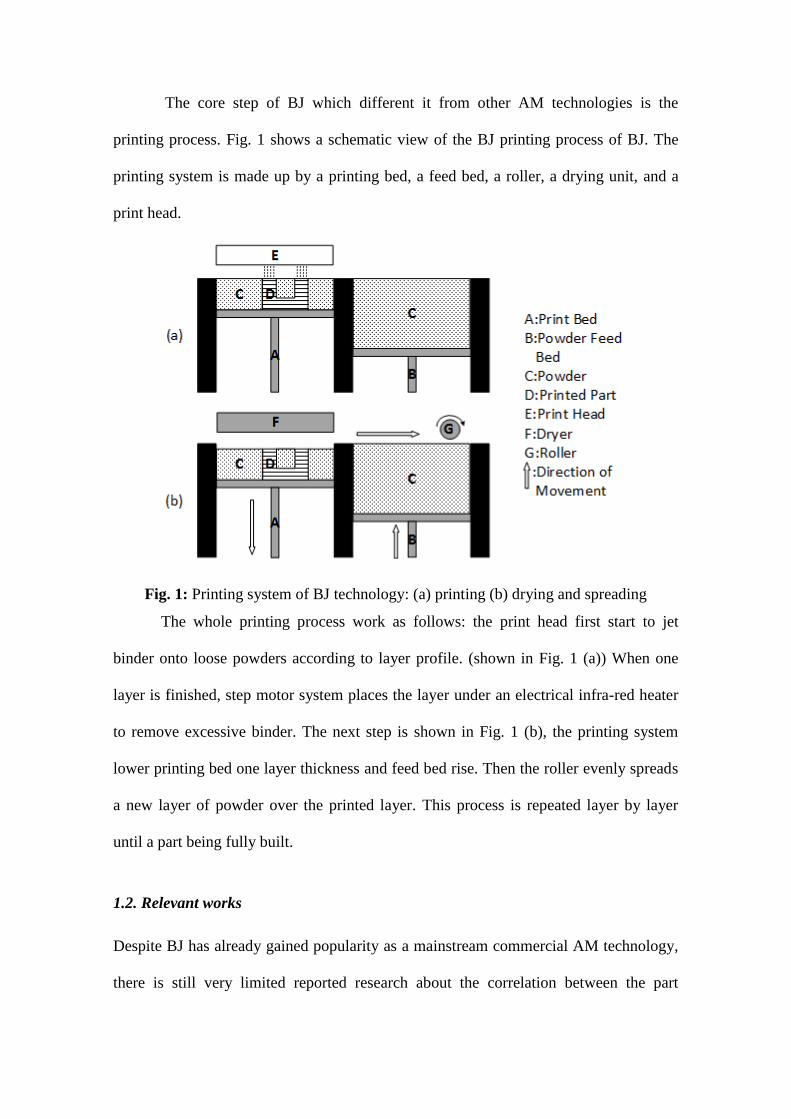
The core step of BJ which different it from other AM technologies is the
printing process. Fig. 1 shows a schematic view of the BJ printing process of BJ. The
printing system is made up by a printing bed, a feed bed, a roller, a drying unit, and a
print head.
Fig. 1: Printing system of BJ technology: (a) printing (b) drying and spreading
The whole printing process work as follows: the print head first start to jet
binder onto loose powders according to layer profile. (shown in Fig. 1 (a)) When one
layer is finished, step motor system places the layer under an electrical infra-red heater
to remove excessive binder. The next step is shown in Fig. 1 (b), the printing system
lower printing bed one layer thickness and feed bed rise. Then the roller evenly spreads
a new layer of powder over the printed layer. This process is repeated layer by layer
until a part being fully built.
1.2. Relevant works
Despite BJ has already gained popularity as a mainstream commercial AM technology,
there is still very limited reported research about the correlation between the part
geometry, process parameters and energy consumption. Researches about energy
consumption of other AM technologies offer valued experience to conduct research in
this field. Quite a few researches are performed on this topic. A few of them which are
closely related to this research are reviewed here.
Kellens et al. [7] developed a method under the framework of CO2PE! to obtain
Life-Cycle Inventory (LCI) data for the use phase of manufacturing unit processes. A
method called in-depth approach is presented in their research to calculate LCI data.
In the in-depth approach, the total process energy consumption is calculated based on a
time study and a power study, which is used as the principle of energy calculation in
this research. Paul and Anand [8] analysed energy consumption of Selective Laser
Sintering (SLS) by modelling a virtual manufacturing of a part and correlating the laser
energy to part geometry, slice thickness and part orientation. The laser energy is
calculated from the total sintering area. However, this paper only concentrates on laser
energy. And this method cannot be used to calculate the whole energy consumption of
SLS. Singhal et al. [9] performed a research on the optimum part deposition orientation
for Stereolithography (SLA) and SLS process to achieve the best surface quality of part.
In their research, the build time of part is determined by the deposition orientation and
part geometry. Mognol et al. [10] tested the manufacturing parameters’ influence on
energy consumption of three Rapid Prototyping (RP) system: Thermojet (3DS), FDM
3000 (Stratasys) and EOSINT M250 Xtended (EOS). Their research showed the height
of the part has significant effects on the total energy consumption. Choi and Chan [11]
studied a virtual prototype system with RP technology. A layer-based simulation
methodology was developed in this paper to conduct virtual manufacturing and to
investigate the relation between process parameters and surface quality. Kulkarni and
Dutta [12] investigated the slicing procedure of layer manufacturing and suggested a
solution to improve geometric accuracy. The uniform external slicing approach
represented in their paper is adapted in this research.
The researches reviewed above only analysed the printing process from the layer
slicing point of view for a few AM technologies. Their research did not pay attention to
the correlation between total printing time, energy consumption, part geometry and
process parameters. In this research, the total printing time is calculated through virtual
manufacturing process. It is modelled as a function of part shape, print orientation, slice
thickness and process parameters. Based on the time study and power data of sub
processes, the total energy consumption is calculated.
2. Method
This section describes the method to calculate the energy consumption in printing
process of BJ by modelling the virtual manufacturing of a part and estimating the
energy consumption with part shape and printing parameters. The overall workflow of
the proposed method for calculating printing process energy is shown in Fig. 2.
As shown in Fig. 2, a part is firstly created by a CAD system and exported as an
STL file which is a standard CAD exchange file format. Then, part orientation and slice
layer thickness are defined to slice the STL file. The intersection contour of each layer
is calculated. Based on the contour information, an operation list containing execution
order of sub-processes for the corresponding layer printing is generated. By adding up
all slices, the operation list for the whole printing process is achieved. With the energy
and power data of the sub processes, the total printing energy is calculated from the
printing operation list which correlates to the part geometry, printing orientation and
layer thickness. The steps of the method are illustrated in detail in the following
sections.

Fig. 2: Workflow of Energy simulation
2.1. Energy of printing process
The total energy consumption can be obtained by calculating energy consumption of
each sub-process and summing them together. From this point, the required energy
input of printing process of BJ is given as Eq.1:
(1)
Where is the total process energy consumption, is the energy consumption
of sub-process , and is the number of sub-processes.
The sub-processes are a set of independent operations which fulfil the following
requirement: by combining in a specific sequence, they can represent every printing
process of the BJ machine. IDEF0 methodology is applied to identify the sub-processes.
The printing process is analysed by decomposing the operations into sub operations.
When the above requirement is fulfilled, the decomposition stops. The IDEF0 [13]
diagrams of printing are shown in Fig. 3 below.
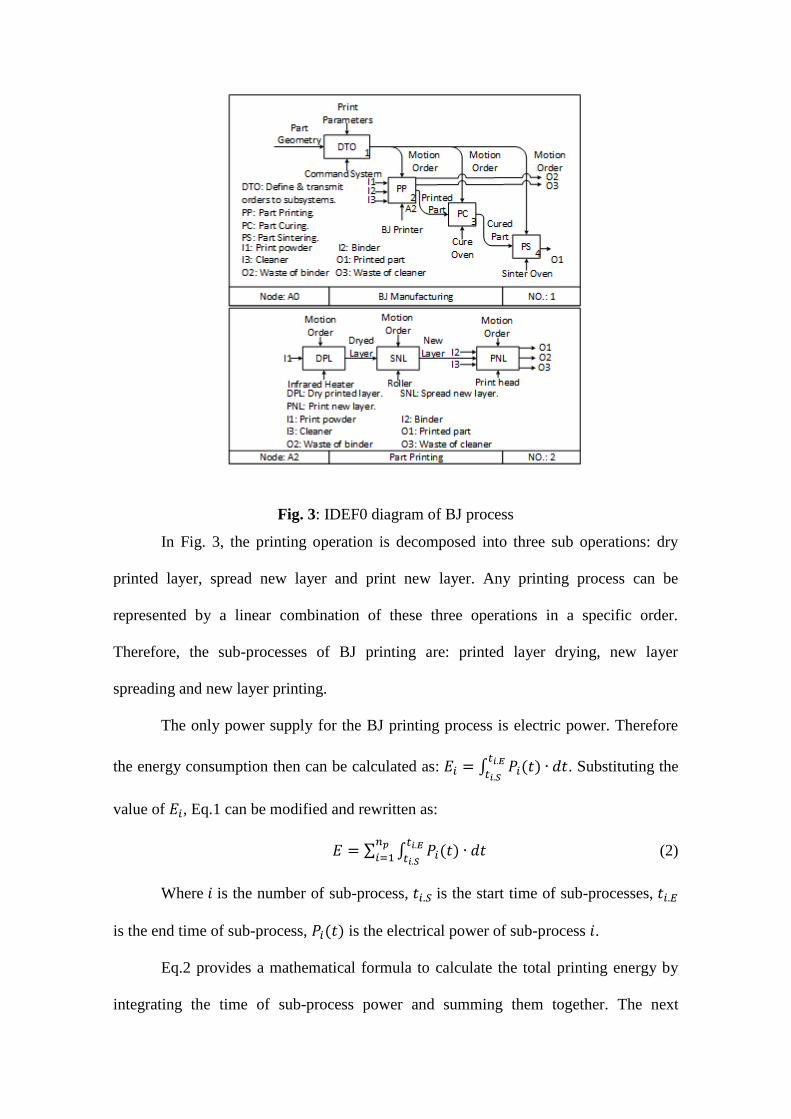
Fig. 3: IDEF0 diagram of BJ process
In Fig. 3, the printing operation is decomposed into three sub operations: dry
printed layer, spread new layer and print new layer. Any printing process can be
represented by a linear combination of these three operations in a specific order.
Therefore, the sub-processes of BJ printing are: printed layer drying, new layer
spreading and new layer printing.
The only power supply for the BJ printing process is electric power. Therefore
the energy consumption then can be calculated as:
. Substituting the
value of , Eq.1 can be modified and rewritten as:
(2)
Where is the number of sub-process, is the start time of sub-processes,
is the end time of sub-process, is the electrical power of sub-process .
Eq.2 provides a mathematical formula to calculate the total printing energy by
integrating the time of sub-process power and summing them together. The next
sections describe the proposed method to calculate the operation list and determine the
time distribution of sub-process for a given part geometry, printing orientation and layer
thickness.
2.2. Slicing of STL file
AM produces part layer by layer. Hence, before printing, part is sliced to obtain the
information of each layer contour. In BJ process, the slicing of part can be achieved in
two ways[12]: externally and internally. The external slicing is used in this research
because the extra material can be removed by finishing operation to get an accurate part,
which is impossible for the internal slicing.
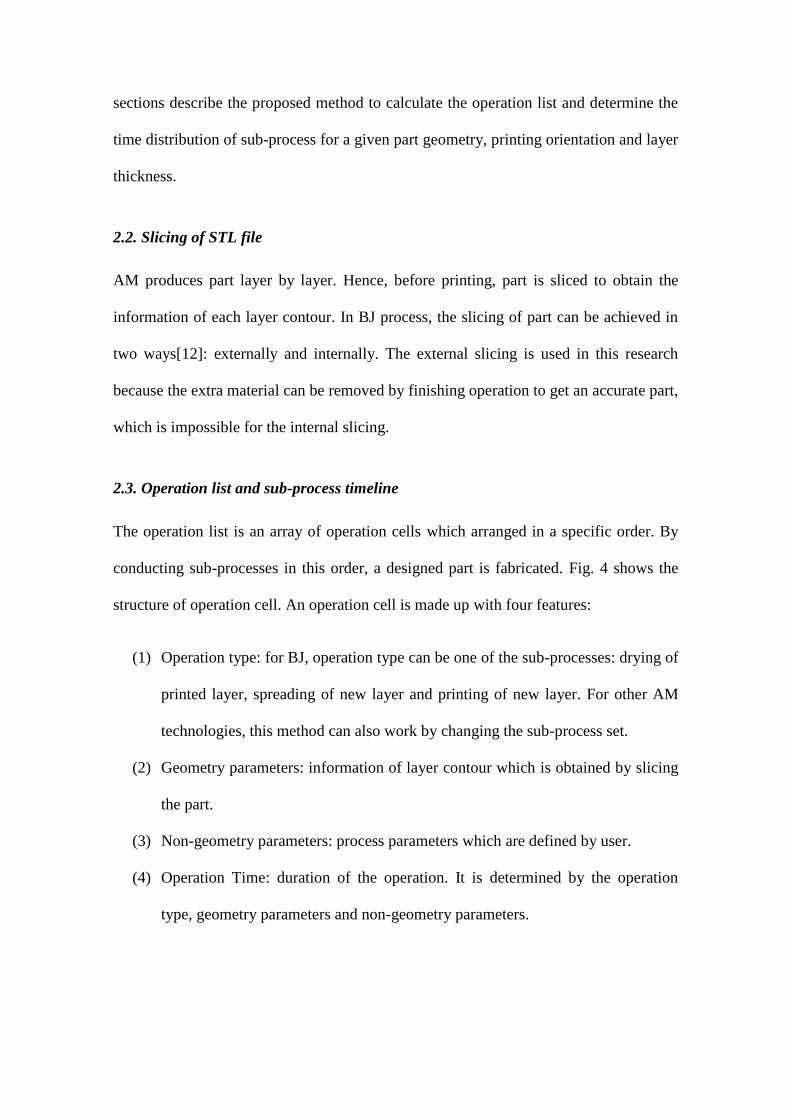
2.3. Operation list and sub-process timeline
The operation list is an array of operation cells which arranged in a specific order. By
conducting sub-processes in this order, a designed part is fabricated. Fig. 4 shows the
structure of operation cell. An operation cell is made up with four features:
(1) Operation type: for BJ, operation type can be one of the sub-processes: drying of
printed layer, spreading of new layer and printing of new layer. For other AM
technologies, this method can also work by changing the sub-process set.
(2) Geometry parameters: information of layer contour which is obtained by slicing
the part.
(3) Non-geometry parameters: process parameters which are defined by user.
(4) Operation Time: duration of the operation. It is determined by the operation
type, geometry parameters and non-geometry parameters.
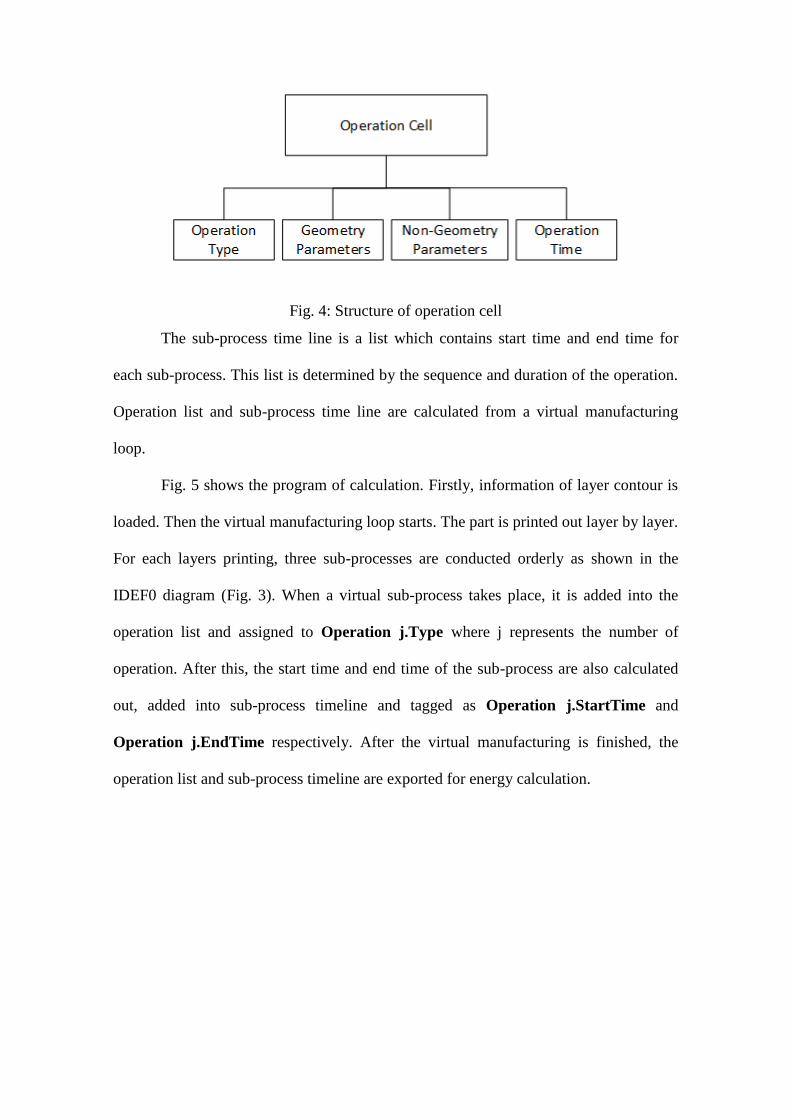
Fig. 4: Structure of operation cell
The sub-process time line is a list which contains start time and end time for
each sub-process. This list is determined by the sequence and duration of the operation.
Operation list and sub-process time line are calculated from a virtual manufacturing
loop.
Fig. 5 shows the program of calculation. Firstly, information of layer contour is
loaded. Then the virtual manufacturing loop starts. The part is printed out layer by layer.
For each layers printing, three sub-processes are conducted orderly as shown in the
IDEF0 diagram (Fig. 3). When a virtual sub-process takes place, it is added into the
operation list and assigned to Operation j.Type where j represents the number of
operation. After this, the start time and end time of the sub-process are also calculated
out, added into sub-process timeline and tagged as Operation j.StartTime and
Operation j.EndTime respectively. After the virtual manufacturing is finished, the
operation list and sub-process timeline are exported for energy calculation.
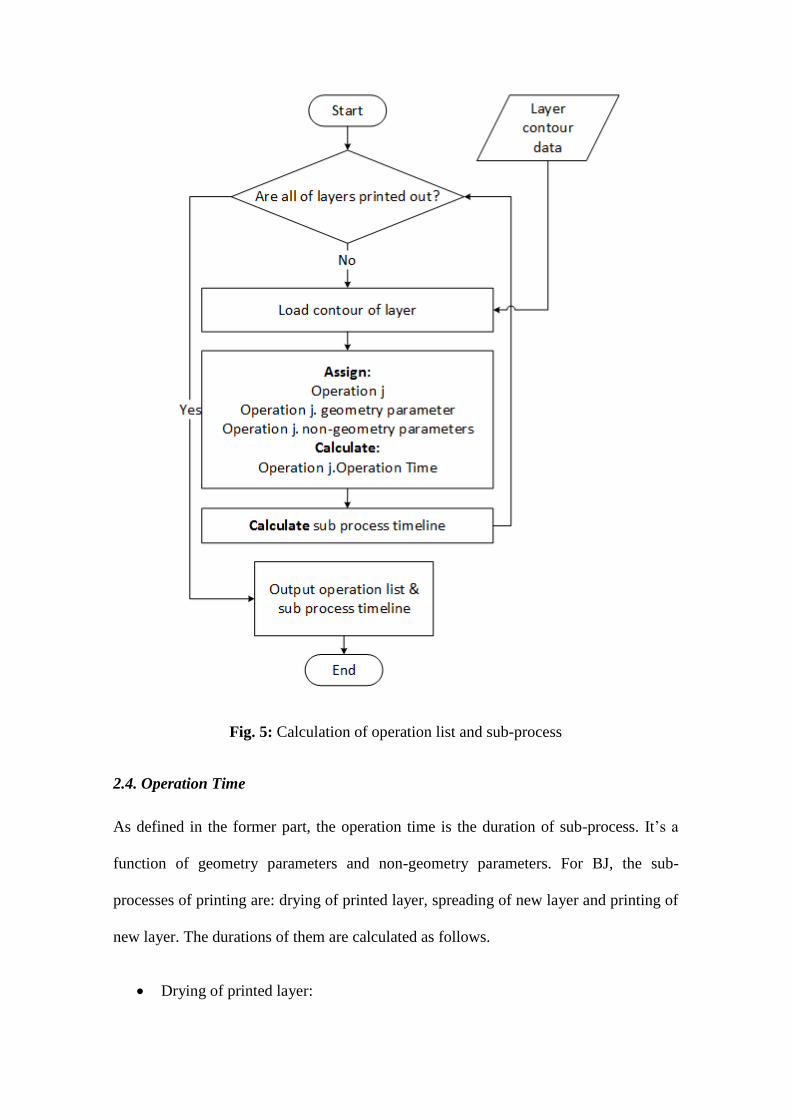
Fig. 5: Calculation of operation list and sub-process
2.4. Operation Time
As defined in the former part, the operation time is the duration of sub-process. It’s a
function of geometry parameters and non-geometry parameters. For BJ, the sub-
processes of printing are: drying of printed layer, spreading of new layer and printing of
new layer. The durations of them are calculated as follows.
Drying of printed layer:
In order to remove excessive binder, after each layer being printed out, the
printing bed moves to under beneath the dryer to evaporate the undesired binder. The
duration can be different for different layers. The operation time of drying of new layer
is determined by the non-geometry parameter which is defined by the user of printer.
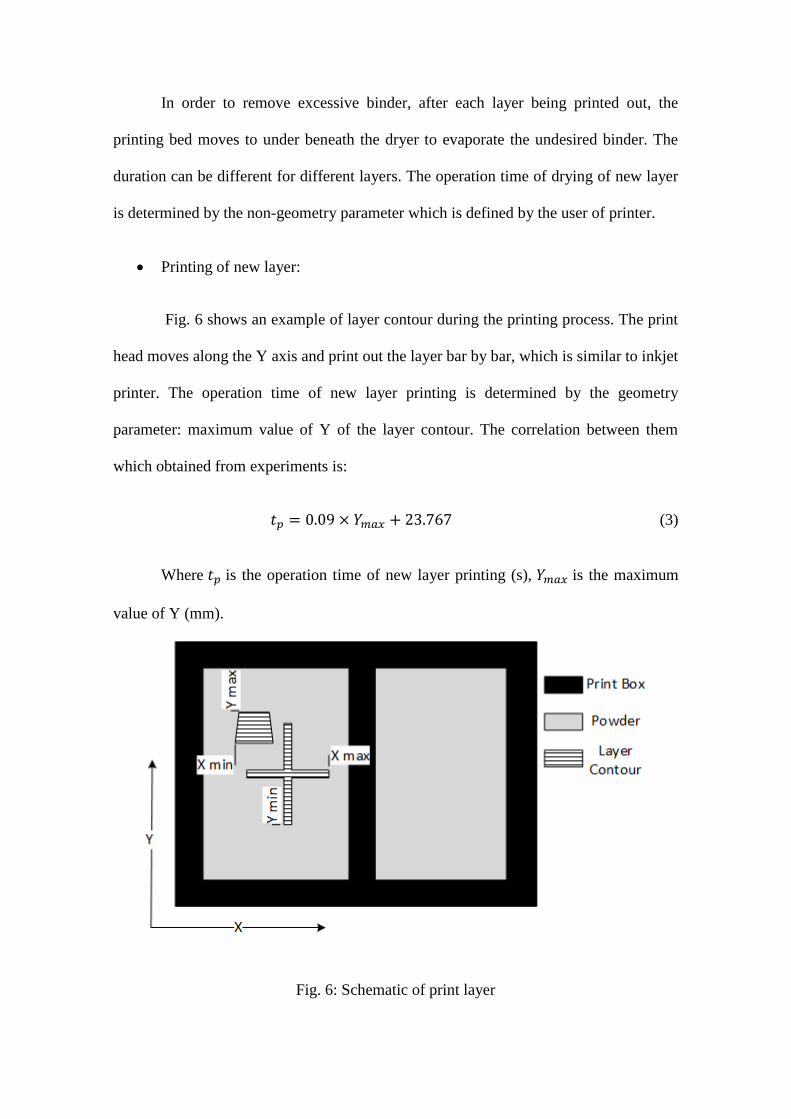
Printing of new layer:
Fig. 6 shows an example of layer contour during the printing process. The print
head moves along the Y axis and print out the layer bar by bar, which is similar to inkjet
printer. The operation time of new layer printing is determined by the geometry
parameter: maximum value of Y of the layer contour. The correlation between them
which obtained from experiments is:
(3)
Where is the operation time of new layer printing (s), is the maximum
value of Y (mm).
Fig. 6: Schematic of print layer
Spreading of new layer:
Spreading is conducted by moving printing bed along X axis (shown in Fig.6).
The operation time of new layer spreading is calculated as:
(4)
Both geometry parameters and non-geometry parameters have influence on the
spreading time. The geometry parameters are the minimum value and maximum value
of X of the layer contour and respectively. The non-geometry parameters
are the spread speed , spreader rapid traverse speed , left spreader rapid traverse
border and right spreader rapid traverse border .
The spreading is conducted under rapid traverse speed from the right end. When
the roller arrives , it switches to slow spreading mode until roller
arrives at . Then it switches back to fast spreading mode and traverse
to the left end of the printing bed.
2.5. Power of sub-processes
Powers of sub-processes are measured by experiments. Table 1 shows the average
values of each sub-process. As both process time and power are obtained, the energy
consumption of printing can be computed now.
Table 1: Power of sub-processes
Sub-process Power (W)
Spreading 163.26
Drying 159.61
3. Case study and Result
This section discusses the case studies conducted to validate the proposed energy
consumption estimate method. A cylinder is used as the case study design. The result of
power and energy simulation from the proposed model is compared to the experimental
data to check the accuracy of the model. The cylinder part is generated by SolidWorks
2013 and exported as a STL binary file. The process parameters are chosen as follows:
Layer thickness: 100 =1e-4 m.
Spread speed and drying time: This spread speed ( ) and drying time are shown
as the following Table 2:
Table 2: Spread speed and drying time
Layer 1-10 11-15 16-20 21-25 26-35 >35
Spread speed(mm/s) 1 3 5 10 15 20
Drying time (s) 50 40 40 30 30 30
Spreader rapid traverse speed ( ): 25 mm/s.
Left spreader rapid traverse border : 5mm; right spreader rapid traverse
border : 5mm.
3.1. Case study of Cylinder
The energy and power simulation are performed on a test of cylinder of radius 1.5 mm
and height 4 mm. Two values of printing orientation are considered: 0.00 and 90.00 .
For a cylinder, the printing orientation refers to the angle between the build
orientation vector and the normal vector of the top surface as shown in Fig. 7 (a)
and Fig. 7 (b). The Printing height is longest projection length of part on build
orientation. The Fig. 7 (c) and Fig. 7 (d) show the comparisons between simulated
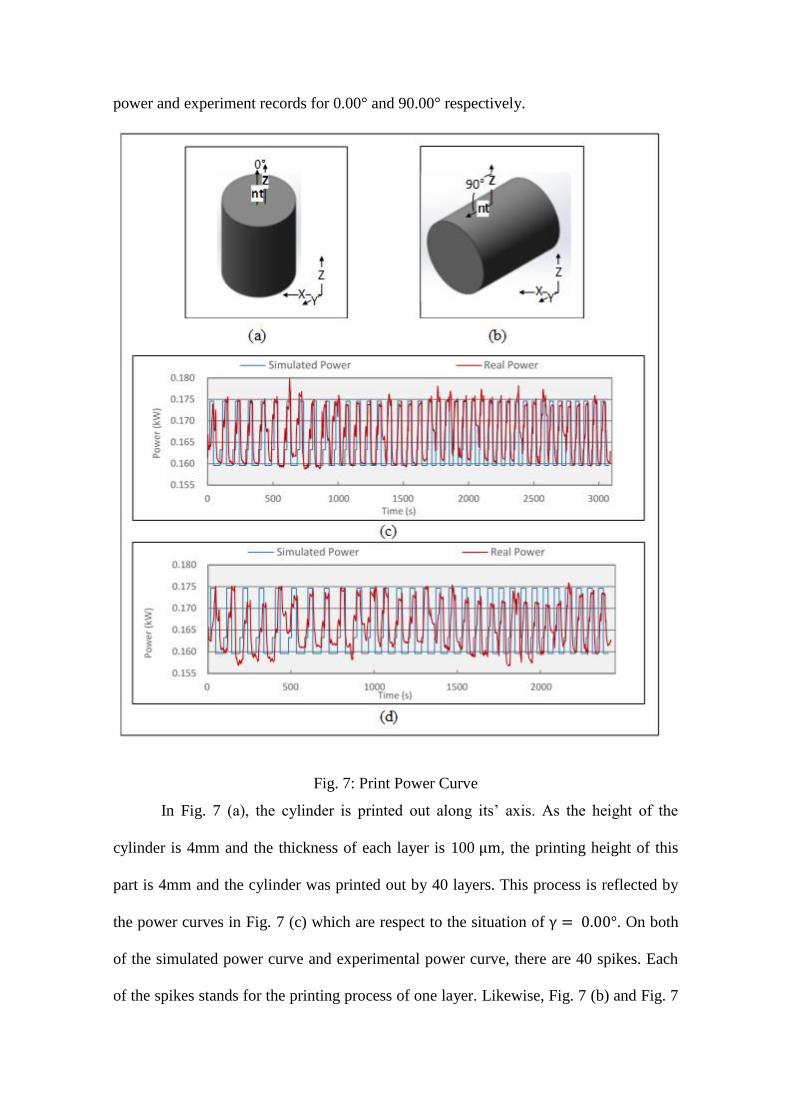
power and experiment records for 0.00 and 90.00 respectively.
Fig. 7: Print Power Curve
In Fig. 7 (a), the cylinder is printed out along its’ axis. As the height of the
cylinder is 4mm and the thickness of each layer is 100 , the printing height of this
part is 4mm and the cylinder was printed out by 40 layers. This process is reflected by
the power curves in Fig. 7 (c) which are respect to the situation of . On both
of the simulated power curve and experimental power curve, there are 40 spikes. Each
of the spikes stands for the printing process of one layer. Likewise, Fig. 7 (b) and Fig. 7
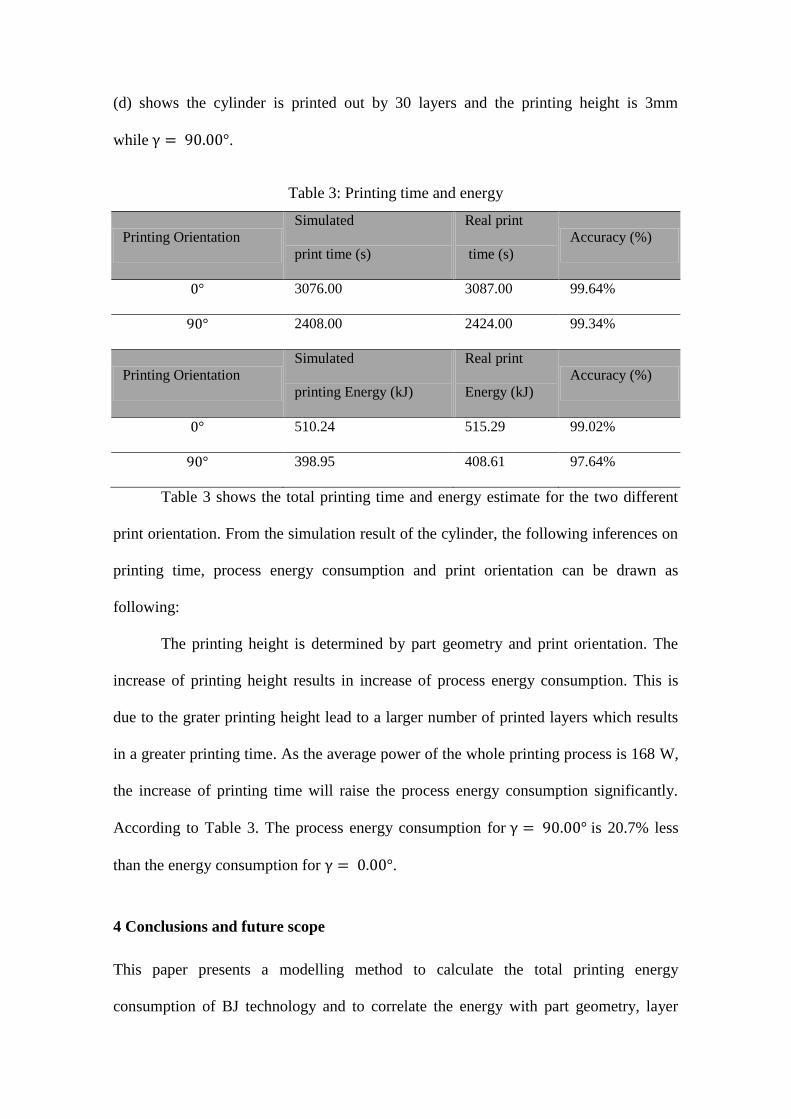
(d) shows the cylinder is printed out by 30 layers and the printing height is 3mm
while .
Table 3: Printing time and energy
Printing Orientation
Simulated
print time (s)
Real print
time (s)
Accuracy (%)
3076.00 3087.00 99.64%
2408.00 2424.00 99.34%
Printing Orientation
Simulated
printing Energy (kJ)
Real print
Energy (kJ)
Accuracy (%)
510.24 515.29 99.02%
398.95 408.61 97.64%
Table 3 shows the total printing time and energy estimate for the two different
print orientation. From the simulation result of the cylinder, the following inferences on
printing time, process energy consumption and print orientation can be drawn as
following:
The printing height is determined by part geometry and print orientation. The
increase of printing height results in increase of process energy consumption. This is
due to the grater printing height lead to a larger number of printed layers which results
in a greater printing time. As the average power of the whole printing process is 168 W,
the increase of printing time will raise the process energy consumption significantly.
According to Table 3. The process energy consumption for is 20.7% less
than the energy consumption for .
4 Conclusions and future scope
This paper presents a modelling method to calculate the total printing energy
consumption of BJ technology and to correlate the energy with part geometry, layer
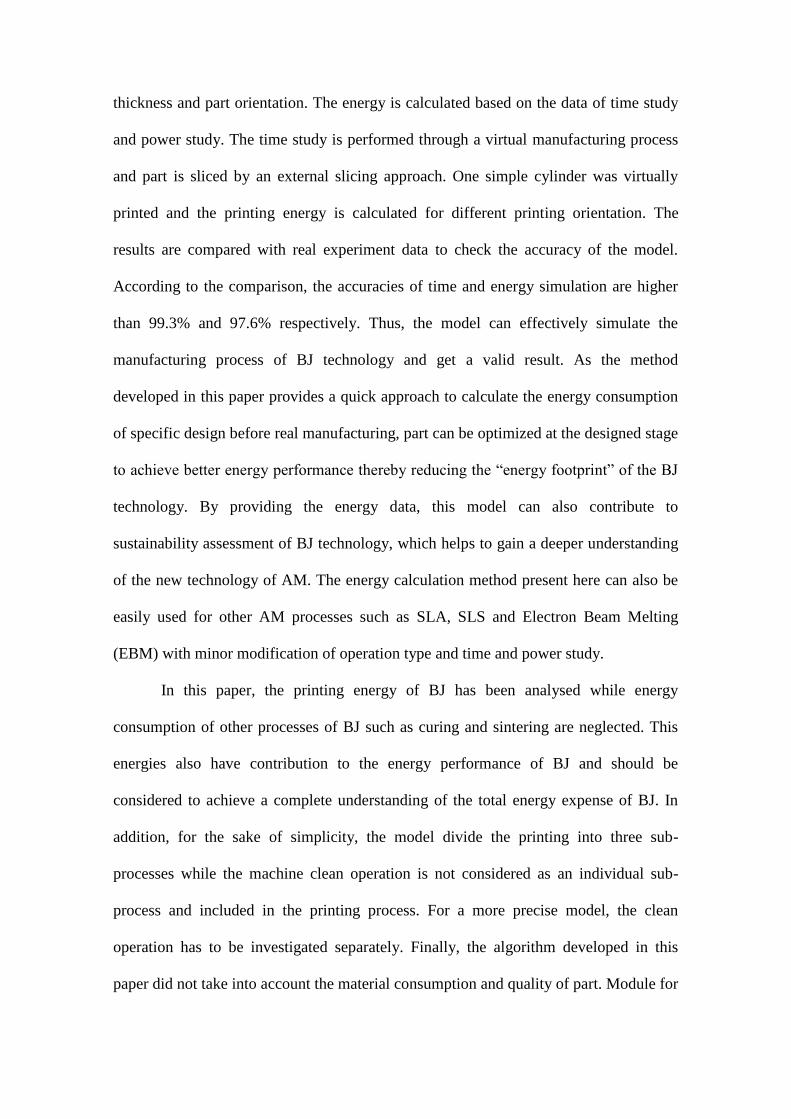
thickness and part orientation. The energy is calculated based on the data of time study
and power study. The time study is performed through a virtual manufacturing process
and part is sliced by an external slicing approach. One simple cylinder was virtually
printed and the printing energy is calculated for different printing orientation. The
results are compared with real experiment data to check the accuracy of the model.
According to the comparison, the accuracies of time and energy simulation are higher
than 99.3% and 97.6% respectively. Thus, the model can effectively simulate the
manufacturing process of BJ technology and get a valid result. As the method
developed in this paper provides a quick approach to calculate the energy consumption
of specific design before real manufacturing, part can be optimized at the designed stage
to achieve better energy performance thereby reducing the “energy footprint” of the BJ
technology. By providing the energy data, this model can also contribute to
sustainability assessment of BJ technology, which helps to gain a deeper understanding
of the new technology of AM. The energy calculation method present here can also be
easily used for other AM processes such as SLA, SLS and Electron Beam Melting
(EBM) with minor modification of operation type and time and power study.
In this paper, the printing energy of BJ has been analysed while energy
consumption of other processes of BJ such as curing and sintering are neglected. This
energies also have contribution to the energy performance of BJ and should be
considered to achieve a complete understanding of the total energy expense of BJ. In
addition, for the sake of simplicity, the model divide the printing into three sub-
processes while the machine clean operation is not considered as an individual sub-
process and included in the printing process. For a more precise model, the clean
operation has to be investigated separately. Finally, the algorithm developed in this
paper did not take into account the material consumption and quality of part. Module for
material consumption and part quality controlling has to be developed. With these
function, this model could be used to compare classic manufacturing process with BJ
technology.
References
[1] Petrovic, V., 2011, Additive layered manufacturing : sectors of industrial application
shown through case studies.
[2] Beaman, J. J., Marcus, H. L., Bourell, D. L., Barlow, J. W., Crawford, R. H., and
McAlea, K. P., 1997, Solid Freeform Fabrication: A New Direction in
Manufacturing, Kluwer Academic Publishers.
[3] Morrow, W. R., Qi, H., Kim, I., Mazumder, J., and Skerlos, S. J., 2007,
"Environmental aspects of laser-based and conventional tool and die
manufacturing," Journal of Cleaner Production, 15(10), pp. 932-943.
[4] Yanchun, L., Zhiming, J., Leu, M. C., and Caudill, R., "Environmental performance
analysis of solid freedom fabrication processes," Proc. Electronics and the
Environment, 1999. ISEE -1999. Proceedings of the 1999 IEEE International
Symposium on, pp. 1-6.
[5] Bjorke, O., and Myklebust, O., 1992, " IMPPACT-Integrated Modelling of Products
and Processes Using Advanced Computer Technologies."
[6] Sachs, E., Cima, M., and Cornie, J., 1990, "Three-Dimensional Printing: Rapid
Tooling and Prototypes Directly from a CAD Model," CIRP Annals -
Manufacturing Technology, 39(1), pp. 201-204.
[7] Kellens, K., Dewulf, W., Overcash, M., Hauschild, M., and Duflou, J., 2012,
"Methodology for systematic analysis and improvement of manufacturing unit
process life-cycle inventory (UPLCI)—CO2PE! initiative (cooperative effort on
process emissions in manufacturing). Part 1: Methodology description," Int. J.
LCA, 17(1), pp. 69-78.
[8] Paul, R., and Anand, S., 2012, "Process energy analysis and optimization in
selective laser sintering," Journal of Manufacturing Systems, 31(4), pp. 429-437.
[9] Singhal, S. K., Jain, P. K., Pandey, P. M., and Nagpal, A. K., 2009, "Optimum part
deposition orientation for multiple objectives in SL and SLS prototyping,"
International Journal of Production Research, 47(22), pp. 6375-6396.

[10] Mognol, P., Lepicart, D., and Perry, N., 2006, "Rapid prototyping: energy and
environment in the spotlight," Rapid Prototyping J., 12(1), pp. 26-34.
[11] Choi, S. H., and Chan, A. M. M., 2004, "A virtual prototyping system for rapid
product development," Computer-Aided Design, 36(5), pp. 401-412.
[12] Kulkarni, P., and Dutta, D., 1996, "An accurate slicing procedure for layered
manufacturing," Computer-Aided Design, 28(9), pp. 683-697.
[13] 1993, " FIPS Publication 183," Computer Systems Laboratory of the National
Institute of Standards and Technology (NIST).
Tables
Table 1: Power of sub-processes
Sub-process Power (W)
Spreading 163.26
Drying 159.61
Table 2: Spread speed and drying time
Layer 1-10 11-15 16-20 21-25 26-35 >35
Spread speed(mm/s) 1 3 5 10 15 20
Drying time (s) 50 40 40 30 30 30
Table 3: Printing time and energy
Printing Orientation
Simulated
print time (s)
Real print
time (s)
Accuracy (%)
3076.00 3087.00 99.64%
2408.00 2424.00 99.34%
Printing Orientation
Simulated
printing Energy (kJ)
Real print
Energy (kJ)
Accuracy (%)
510.24 515.29 99.02%
398.95 408.61 97.64%

Figure captions
Fig. 1: Printing system of BJ technology: (a) printing (b) drying and spreading
Fig. 2: Workflow of Energy simulation
Fig. 3: IDEF0 diagram of BJ process
Fig. 4: Structure of operation cell
Fig. 5: Calculation of operation list and sub-process
Fig. 6: Schematic of print layer
Fig. 7: Print Power Curve