energy analysis of the drying hood in paper machine 1 at...
TRANSCRIPT

Postal address Visiting address Telephone
P.O. Box 124 Getingevägen 60 +46 46-222 82 85
SE-221 00 Lund, Sweden +46 46-222 00 00
Web address Telefax
www.chemeng.lth.se +46 46-222 45 26
Energy Analysis of the Drying Hood in
Paper Machine 1 at Stora Enso,
Nymölla Mill
by
Emmy Lam
Department of Chemical Engineering
Lund University
June 2016
Supervisor: Professor Stig Stenström
Co-supervisor: Per-Arne Olsson
Examiner: Lecturer Mats Galbe
Picture on front page: EMMI Adminstrator. Photo by Petri Juntunen

Preface This report is the result of my Master Thesis that has been carried out from January to June
2016 at Stora Enso, Nymölla, Sweden. It is also the end of my education to Master of Science
in Engineering, chemical, with specialization process design, at Lund’s university.
First of all I would like to express my gratitude to my supervisor Professor Stig Stenström at
Lund University (department of chemical engineering) for your great advices and your
support during the Master Thesis. I would also like to thank my supervisor at the company,
Per-Arne Olsson, for giving me the opportunity to perform my Master Thesis at Stora Enso
and for sharing your knowledge. It has both been an instructively and an exciting work.
Thanks to Malin Öberg and Linnea Eriksson for taking your time for discussions as a help to
solving my problems.
Last but not least, a big gratitude to everyone at the mill who has been helping me during the
Master Thesis and contributes to knowledge or a helping hand for the experimental
measurements.
Emmy Lam
Nymölla, June 2016


Sammanfattning
Den 1 juni 2014 trädde lagen om energikartläggning i stora företag (2014:266) i kraft från
energimyndigheten. Lagen innebär att alla företag har en skyldighet att göra en
energikartläggning för deras årliga energianvändning. Detta för att få ökad kunskap om vad
energin används till i företaget. Med stora företag menas att man anställer minst 250 personer
eller har en årsomsättning över 50 miljoner EUR eller en balansomslutning som överstiger 43
miljoner EUR per år.
Detta examensarbete har haft i syfte att göra en detaljerad energikartläggning för torkpartiet
av pappersmaskin 1 på Stora Enso, Nymölla bruk. Bruket har 520 anställda och omfattas
därmed av den nya lagen om energikartläggning i stora företag. Med den detaljerade
energikartläggningen av torkpartiet tas förslag av kostnadseffektiva åtgärder fram för att spara
energi eller för att öka energieffektiviseringen.
Pappersmaskinen på Nymölla bruk består utav 8 olika processteg som är; inloppslåda,
viraparti, pressparti, förtorkning, limning, eftertorkning, kalandrering och upprullning.
Torkpartiet (både förtorken och eftertorken) studeras i detalj, där in- och utströmmar
definieras. De definierade in och utströmmarna i för- och eftertorken utgörs utav:
Papper
Vatten
Ånga
Luft
Med dessa in- och utströmmar beräknas mass- och energibalanser för både förtorken och
eftertorken och illustreras till sist i ett Sankeydiagram.
Den totala massan in och ut från förtorken är 126 kg/s och motsvarar ett energiflöde in och ut
från förtorken på 40 MW. Vilket ger en årlig energianvändning på 310 GWh i förtorken. För
eftertorken erhölls den totala massan in och ut till 76 kg/s med ett totalt energiflöde in och ut
på 14 MW. Detta är räknat på en produktionstid på 7500 h/år. Den specifika
ångförbrukningen i förtorken beräknas till och för eftertorken
beräknas den till . Detta värde jämförs med det teoretiska värdet för
förångningsentalpin vid 70 °C som är . Vilket visar på det finns
energibesparingsmöjligheter.
Åtgärdsförslagen för att bli energieffektivare är att installera en extra tilluftsfläkt i förtorken
och nollnivåreglering i eftertorken. Detta reducerar ner läckluftsmängden. Kostnaden för
tilluftsfläkten är 600 000 SEK. Detta ger en årlig besparing på 2 miljoner SEK samtidigt som
det tillkommer en årlig driftskostnad på 40 000 SEK. Detta skulle ge en återbetalningstid på 4
månader för tilluftsfläkten. Installation av nollnivåreglering kostar 80 000 SEK och skulle ge
en årlig besparing på 1,8 miljoner SEK. Återbetalningstiden för denna installation är 0,5
månader.
Båda installationerna anses som en lönsam investering då återbetalningstiden är mindre än 1
år.


Abstract The new law about energy mapping in large companies (2014:266) from energy agency was
valid from 1 June 2014. The law requires that every large company has a responsibility to
make an energy mapping for their yearly energy usage. This is to get an increased knowledge
of what the energy is used for in the company. Definition of a large company is if the
company employs least 250 persons and have yearly revenue over 50 million EUR or a
balance sheet total over 43 million per year.
This master thesis has an aim to do a detailed energy napping for the drying section of paper
machine 1 at Stora Enso, Nymölla mill. The mill employs 520 persons and is enforced to
follow the new regulation about energy mapping in large companies. The cost-effective
suggestions for energy savings or increasing the energy efficiency are presented in the
detailed energy mapping for the drying section.
The paper machine at Nymölla mill contains 8 different stages; head box section, forming
section, pressing section, pre-drying section, sizing section, after-drying section, calendaring
and wind up. The drying section (both pre-drying- and after-drying section) is studied in
detail, where the inlet- and outlet streams are defined. The defined inlet- and outlet streams in
drying section are:
Paper
Water
Steam
Air
With these inlet- and outlet streams the mass- and energy balances are calculated in both the
pre-drying section and the after-drying section. They are illustrated in a Sankey diagram.
The total mass in- and out from the pre-dryer is 126 kg/s and correspond to an energy flow of
40 MW. This gives a yearly energy usage of 310 GWh in the pre-dryer. For the after-dryer the
total mass in- and out are 76 kg/s with a total energy flow of 14 MW. This is calculated with a
production time of 7500 h/year. The specific heat consumption for the pre-dryer is calculated
to and to for the after-dryer. Comparing
these values with the theoretical value for the latent heat of evaporation at 70 °C which is
indicates there is potential of energy savings.
The suggestions for increasing energy efficiency are to install an extra supply air fan in the
pre-dryer and a zero level control in the after-dryer. This will reduce the leakage air. The cost
for the supply air fan is 600 000 SEK. This gives a yearly saving of 2 million SEK and resides
an operating cost of 40 000 SEK. The pay-back time is 4 months for the supply air.
Installation for the zero level control is 80 000 SEK and would give a yearly saving of 1.8
million SEK. The pay-back time is 0.5 months.
Both installations are seemed as a profitable investment since the pay-back time is less than a
year.

Table of contents
1. Introduction ....................................................................................................................... 1
1.1 The company .................................................................................................................... 1
1.2 Aim of the master thesis ................................................................................................... 1
1.3 Limitation for the master thesis ........................................................................................ 2
1.4 Outline ......................................................................................................................... 2
2. The process ........................................................................................................................ 3
2.1 Head box section .............................................................................................................. 3
2.2 Forming section ................................................................................................................ 3
2.3 Pressing section ................................................................................................................ 4
2.4 Pre-drying section ............................................................................................................. 4
2.5 Sizing ................................................................................................................................ 7
2.6 After-drying section .......................................................................................................... 8
2.7 Calendaring ....................................................................................................................... 9
2.8 Wind-up ............................................................................................................................ 9
2.9 Controlling of the process ................................................................................................. 9
3. Theoretical frameworks ................................................................................................. 10
3.1 Energy agency ................................................................................................................ 10
3.2 The law of conservation of energy ................................................................................. 10
3.3 Literature search ............................................................................................................. 11
4. Method ............................................................................................................................. 17
4.1 Energy mapping .............................................................................................................. 17
4.2 Detailed energy mapping ................................................................................................ 18
4.3 Measurements of airflows............................................................................................... 19
4.4 Measurement of air humidity.......................................................................................... 20
4.5 Measurement of condensate flow and condensate temperature ..................................... 20
4.6 Measurement of blow through steam flow ..................................................................... 22
5. Results .............................................................................................................................. 24
5.1 Pre-drying section ........................................................................................................... 24
5.2 Sizer ................................................................................................................................ 25
5.3 After-drying .................................................................................................................... 26
5.4 Measurements airflows and air humidity ....................................................................... 26

5.5 Mass balances for the drying section .............................................................................. 33
5.6 Energy balances for the drying section ........................................................................... 46
5.7 Total balance for the drying section ............................................................................... 53
5.8 Economical analysis ....................................................................................................... 57
6. Discussion and conclusion .............................................................................................. 60
6.1 Measurement uncertainty................................................................................................ 60
6.2 Conclusions .................................................................................................................... 62
7. Future work ..................................................................................................................... 64
8. Table of abbreviations .................................................................................................... 65
Appendix A – Heat transferring from steam to paper web ......................................................... i
Appendix B - Derivation for the wet-bulb temperature ............................................................. ii
Appendix C – Shrinkage of paper ............................................................................................. iii
Appendix D – Mollier chart for deciding air humidity ............................................................. iv
Appendix E – Steam flows for drying section ........................................................................... v
Appendix F – Pumpcurves ........................................................................................................ vi
Appendix G - Pressures in the condensate tanks for drying section .......................................... x

1
1. Introduction
1.1 The company
Nymölla Mill is a part of the Swedish-Finish concern Stora Enso and had its opening during
1962 [1] . The company is a leading provider for a sustainable wood industry, which means
that the company refines the woods raw material in a sustainable way for the environment.
Their aim is to replace the fossil based materials with renewable materials [2]. In Nymölla lies
the production of paper for office use and for print media, for example the well-known
MultiCopy is one of their products, but beside this also more special kind of papers for
photography, calendars and envelopes are produced [3, 4]. The amount employees at Nymölla
Mill are around 520. The production process at Nymölla Mill is a TCF (totally chlorine free)
process, which means that there’s no use of chlorine in the bleaching of pulp instead hydrogen
peroxide, oxygen, sodium hydroxide and per-acetic acid is used for the bleaching [4]. Stora
Enso has an amount of 6 mills in Sweden where each mill produces different kind of products
from the wood, everything from packaging to biomaterials for hygiene [3].
For the paper production in Nymölla the pulp is produced in a pulpmill beside the paper
factory and therefore the mill is an integrated pulp- and paper mill [5]. With this in advantage,
the produced pulp could be used directly in the paper factory and avoid emissions caused by
the transport of the pulp to the paper factory. The delivered wood is transported from south
Sweden where it comes from beech or birch, but also some wood is imported, like eucalyptus
or birch. The pulp also contains recycled paper that would make the paper more solid and also
to utilize the raw materials [1].
1.2 Aim of the master thesis
The production of paper is an energy intensive process and with rising energy prices the
energy question about reducing the energy usage becomes more serious and there is a large
demand of increasing energy efficiencies. The purpose of this master thesis is to do a detailed
energy mapping for one of the process at Nymölla Mill and put up a Sankey diagram for the
energy usage. This will give knowledge of where energy efficiencies can be made and then
come up with suggestions to save more energy. With this also comes an economic analysis for
the suggested solutions for reducing the use of energy.
The measurement uncertainty for the mill is also discussed and what conclusion could be
decided from this.
Nymölla mill has an aim to do energy savings and find energy efficiencies according to
following cases:
Save 5 MW electricity as an average over the year compared to the case in 2008
No use of fossil fuels
To yearly decrease the specific energy use (kWh/ton paper) by 7.5 % compared to the
case in 2010 [4]

2
1.3 Limitation for the master thesis
The company contains lots of energy consuming processes that could be surveyed, and the
time for the master thesis is 20 weeks. Because of the time limit it is here chosen to put focus
on the drying section in paper machine 1 and make a detailed energy survey for this process.
The functions of paper machine 1 are also briefly studied from when the pulp comes to the
head box section till the paper is rolled on tambours. The hall where the paper machine stands
in is excluded from this study.
1.4 Outline
This report starts with a description for the process of paper making together with how this
process is controlled. In this chapter the different steps in the paper process are briefly
described. The general demands and the new law from the energy agency are presented in
chapter 3 together with a theoretical description of the thermodynamics first law. What has
been found in the literature, and what has been done earlier is also presented here. The
equations for the mass- and energy balances and the mathematical formulas used in this work
are also included. How an energy survey should be made is presented in chapter 4 together
with the experimental set up to find the parameters needed for the mass- and energy balances.
In chapter 5 the results of the experimental measurements that have been obtained are
presented with flow sheets for the measured points. Calculations for the mass- and energy
balances are also done here with values from the experimental measurements and are finally
presented in a Sankey diagram. The report is then round off with chapter 6 with a discussion
for the measurements uncertainty and what can be concluded. To the last, in chapter 7 the
futures work are presented.

3
2. The process
The process of making paper, from pulp to fine paper contains of 8 different stages; head box
section, forming section, pressing section, pre-drying section, sizing section, after-drying
section, calendaring and wind up. The different stages in the paper making process are briefly
presented in this chapter together with how the process is controlled. Figure 1 below gives an
overview of the paper making process.
Figure 1 - Overview for the process of papermaking [6]
2.1 Head box section
The first stage in this process is the head box that contains the mixture of chemicals and the
pulp of soft- and hardwoods that is diluted with water. The task that the box has is to spread
this mixture out to the fine forming fabric where the most of the water from the mixture is
rinsed of [7]. The moisture content in this step is 99 % [6]. When the pulp is at the forming
fabric the process is called forming section.
There are different kinds of boxes that the mixture of pulp flows in. Dependent on the quality
of the paper the mixture is spread out with different velocities. The velocity can be 100 m/min
or 400 m/min and is adjusted on the forming fabrics velocity so there is an even turbulence in
the box during the flow out of mixture [7]. The box used at Nymölla Mill is a lip box where
the opening of the box could be regulated dependent on the decided basis weight of the paper
[8].
2.2 Forming section
The pulp mixture is now on the forming fabric and the most of the water (free water) is
dripping of with the gravity. After the box there is a shaker that will help the pulp mixture to
draw by dewatering. This water is then reused as white water for the head box [8]. Among the
paper web in the beginning at the sides, there is water that is sprayed out to form the paper
sheet so that it wouldn’t spread out from the fabric.
The shakers task is also to give an even distribution of the pulp for the paper sheet, this will
give a more homogeneous surface of the paper or else there will be dark spots. There are also
splines that will prevent this dark spots because of uneven distribution [9]. Later the forming
fabric meets an over fabric that will help to press the paper web free from water and give a
symmetrically paper [9]. For the dewatering there are also 6 vacuum pumps that will
Moisture content ~99 % 80 % ~55 % ~2 % 30 % 5 %
Head box Forming Pressing Pre-drying Sizing After-drying Calendaring Wind-up
Starch Fabric Furnish

4
contribute to higher dryness in the paper web by absorbing the water [8]. The aim of the
forming part is to give enough dryness for the paper so it can handle the press part where
larger forces are performed at the sensitive web [7]. Before the paper web goes to next part of
the process, it passes a press clothed with a fabric with high absorption capacity. This will
give an effective dewatering of the paper web [7, 8].
Because of the high absorption capacity this could later give a decrease of the under pressure
from the vacuum boxes in the pressing section since less water needs to be dewatered. This
will contribute to a lower use of electricity and less wear at the forming fabric [7]. This press
will give the paper web an increased dryness of 3-4 %-units before it comes to the pressing
section [7] and the moisture content is 80 % when the paper web comes to the pressing
section [6].
2.3 Pressing section
The transferring from the forming section to the pressing section is done with a pick-up roll
that takes up the paper web with vacuum to a new sheet in to the pressing section. This
phenomenon is seen in Figure 2 below. At the same time the paper web is picked up the sides
are also cutted [10].
Figure 2 - The pick-up that transfer the paper web to the press section [10]
The paper web is then transferred through 3 big clothed pressing rolls to increase the dryness
of the paper web and the first free draw occurs during this part. The clothing of the rolls
absorbs the water from the web and the water in the cloths is then absorbed with vacuum [7,
10] .
When the clothing is absorbing water also other chemicals than water is absorbed and this will
cause stowing for the clothing and give bad absorption capacity. The cloth is therefore
cleaned with high pressure water in the process [7]. Before the paper web goes to next part of
the process it passes a shoe press with longer contact area between the rolls and the paper web
than the previous rolls. This enlarged contact area will increase the dewatering and less water
needs to be evaporated in the pre-drying section [9].
2.4 Pre-drying section
When the paper web comes out from the pressing section the dryness is about 45 % [6] and
the dewatering of the paper web takes place on multi-cylinder section alternated with steam
and vacuum. The vacuum cylinders are placed in the lower row and the steam cylinders are

5
place at the upper row in the beginning. This is seen in Figure 3 [11]. It is the steam heated
cylinders that gives the paper web a higher dryness while the vacuum cylinders is just there to
keep the paper web on place because of the high velocity of the sheet [12]. Beside this, there
is also an air-system in the hood that helps the paper web to increase it dryness by taking in
heated air to the hood, that aims to take up the evaporated water from the paper web [13] .
The design of an upper row of steam filled cylinders and vacuum cylinders at the lower row
allow the paper web to be drawn freely. This occurs when the paper web alternately pass the
steam cylinders and vacuum cylinders. In the free draw the drying rate is higher because the
paper web is allowed to be evaporated from both sides with the ingoing drying air.
2.4.1 Steam-condensate
The paper web passes cylinders with different steam groups (different steam pressures e.g
different temperatures) where the steam condenses inside the cylinders. This condensing
steam will transfer heat to the paper web to evaporate the water. The dryness in the paper will
increase and the evaporated water is then ventilated away with supply air [14].
Before the heat from the condensing steam reaches the paper it is transferred through a
condensate layer inside the cylinder, the wall of the cylinder and the air film between the
paper and the cylinder [15, 14]. To set up the heat transferring through every layer, the total
heat flux to the paper web can be decided, see Appendix A. The Figure 4 below shows how
the heat flux is transferred through the different layers before it comes to the paper web.
Figure 3 - Alternated steam- and vacuum cylinders in the drying section [9]
Vacuum cylinder
Steam cylinder
Paper web

6
The steam that doesn’t condense comes out from the cylinder on the other side and is around
10-15 %, so called the blow-through steam. The blow-through steam brings out the
condensate inside the cylinder and has a lower pressure than the ingoing fresh steam [15].
The mixture of blow-through steam and condensate is pumped to a flash drum. The flash
drum has a lower pressure than the blow-through steam and will separate the secondary steam
from the condensate. This will create flash steam. The flash steam is sent to a cylinder group
with a lower steam pressure together with a little fresh steam and the condensate is sent to a
condensate tank. This phenomenon will cause a cascade system and the blow-through steam
out from the last cylinder group is too low to fit a cylinder group. The blow-through steam
from the last group is therefore sent to a surface condenser. All the condensate from all the
cylinder groups is then sent back to the boiler house to be heated up to steam [15, 14]. An
illustration of the cascade system is shown in Figure 5.
Figure 4 - The heat flux from the steam transferred to the paper web
Figure 5-Illustration of the cascade system [14], pink=flash steam, purple=blow through steam, red=fresh
steam, blue=condensate.
Condensate Cylinder wall Air film Paper
Ts
Tcyl,in
Tcyl,out
Tp

7
The pre-drying section at Nymölla Mill contains 30 steam filled cylinders and they are
divided into 6 different steam groups with different numbers of cylinders. Each steam groups
then works with their steam pressure dependent on which kind of paper that is produced. In
the beginning the cylinders are alternated with steam and vacuum cylinders; later on in the
drying process when the paper is dry enough only steam cylinders are used in the upper and
lower row [16].
The amount of steam cylinders in each steam group for the pre drying section are presented in
Table 1 below:
Table 1 – The steam groups in the pre-dryer section at Nymölla Mill [16]
Steam group Amount cylinders
01 1 1A 2 1B 1 2 3
3A 13 3B 10
2.4.2 Air-system
The air condition in the drying hood is important for the paper drying process, since taking
out the humid air enable the evaporation of water in the paper web [15]. The exhaust air from
the drying hood is used as heat recovering since almost all of the added energy comes out
with the exhaust air [17]. This recovered heat contents large amounts of energy and this
energy are reused for preheating the ingoing fresh air from the machine room, heating water
for ventilation and processing stuff which would give savings for steam usage [18]. After the
fresh air is preheated with the exhaust air it is heated with steam in an air-preheater till it
reach the required temperature of the supply air. Then it is blown to the paper web and gives
an increase of the dryness [13].
The preheated supply air in to the drying hood that is added for command is 80 % of the total
outgoing air from the drying hood. The remaining 20 % of the outgoing air make up the
leakage air. This leakage air is not preheated before it goes in to the drying hood [13].
2.5 Sizing
When the paper web comes out from the pre-drying section it passes the sizing step with a
dryness of 98 % [6]. The sizing aims to give the paper strength by applying starch to the
surface of the paper web. This starch will give the paper better surface strength, reduced
dusted and better rigidity [19]. It is important that the paper have right dryness before the
sizing takes place or else the sizing would give the paper an uneven surface. Therefore the
sizing have to be placed in a sufficiently distance from the pre-drying section to make sure the
paper web is dry [7].
The sizing contains two rubber clothed rolls that is cooled with water inside to give the paper
web correct temperature when applying the hot starch. On these two rubber-clothed rolls there
8
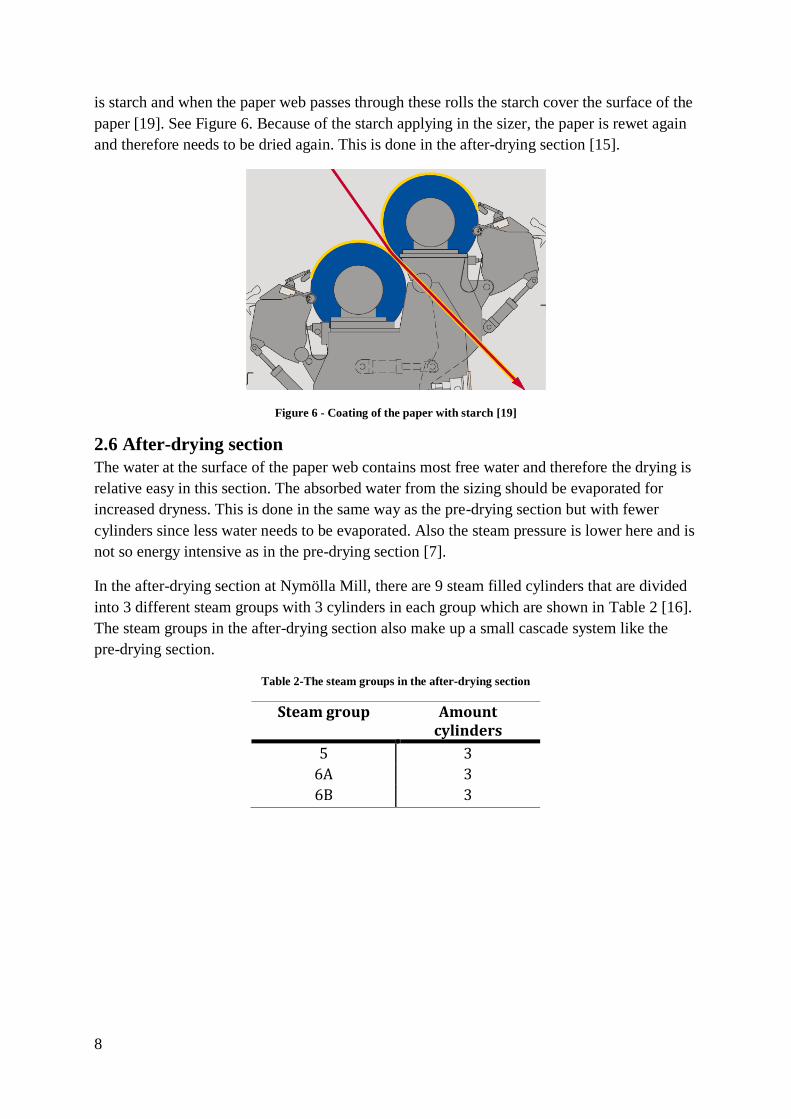
is starch and when the paper web passes through these rolls the starch cover the surface of the
paper [19]. See Figure 6. Because of the starch applying in the sizer, the paper is rewet again
and therefore needs to be dried again. This is done in the after-drying section [15].
Figure 6 - Coating of the paper with starch [19]
2.6 After-drying section
The water at the surface of the paper web contains most free water and therefore the drying is
relative easy in this section. The absorbed water from the sizing should be evaporated for
increased dryness. This is done in the same way as the pre-drying section but with fewer
cylinders since less water needs to be evaporated. Also the steam pressure is lower here and is
not so energy intensive as in the pre-drying section [7].
In the after-drying section at Nymölla Mill, there are 9 steam filled cylinders that are divided
into 3 different steam groups with 3 cylinders in each group which are shown in Table 2 [16].
The steam groups in the after-drying section also make up a small cascade system like the
pre-drying section.
Table 2-The steam groups in the after-drying section
Steam group Amount cylinders
5 3
6A 3
6B 3

9
2.7 Calendaring
When the paper is dry enough it passes a surface processing step for increased shine and
better sleekness for the surfaces of the paper. The paper web passes two pinches alternated
with a soft clothed roll made of cast iron and a hot thermos-cylinder with hot water inside the
roll. It is the hot roll that gives the paper its shine. The soft clothed roll is sensitive against
heat that comes from the hot thermo-cylinder and therefore needs to be cooled [20]. But
before the paper web passes these two pinches it is humidified with steam that condense at the
paper web. The heat from the condensed water steam is then transported to the paper and also
gives the paper web increased humidity before passing the rolls. This humidifying of the
paper would give the paper less different sided paper, better shine and sleekness [7].
2.8 Wind-up
The last step in the paper making process is the rolling of the paper web on large tambours for
later converting to correct sizes for paper sheets. Each roll of paper gives 5 million sheets A4
and it takes around 1 h to finish a paper roll [21].
2.9 Controlling of the process
The process is regulated with computers in the control hall where parameter settings are set
from the operators. In the process there are indicators that measure the temperature, velocity,
moisture content, steam pressures and other parameters. All the instantaneous parameters are
observed in the software “Metso DNA” and it is also here the settings for the process are
controlled. Also in the control hall there are screens on parts of the process that is used for
observing defects on the paper, like paper break and holes. Some parts of the process are
controlled manually from the operators in the fabric where the operators can go out and
change the flow path by closing a port or by changing the opening grade of the port to change
the velocity of the flow.

10
3. Theoretical frameworks
This chapter presents the theory that are found for the master thesis, like journal articles of
what has been done before and literature that are used. The chapter includes the general
demands from energy agency, the thermodynamics first law and formulas that are used for
the energy survey in the drying section of the paper machine.
3.1 Energy agency
Due to the new law (2014:266) about energy mapping in large companies from the energy
agency that was valid from 1 June 2014. Every large company should make an energy survey
for their yearly use of energy to get knowledge about the use of energy in the company. With
the increasing knowledge of the energy usage efficiencies can be made [22]. Definition of a
large company is if the company employ least 250 persons and have a yearly revenue over 50
million EUR or a balance sheet total that is over 43 million EUR each year [23].
The energy mapping should be updated every 4th
year [23] and should be done within a
certified framework. A certified framework systemically describes how the energy usage can
be provided in a company. A standard certified framework is ISO 50 0001 [24]. The energy
mapping should contain a describing yearly overview of the company’s total use of energy
and a detailed mapping for the processes that consume energy. Suggestions of how to use the
energy in a more efficient way for both decreasing the costs and energy usage should also be
included in the energy mapping [23]. The aim for the suggestions is to produce more products
per energy unit [22] and the energy added to the company should be in MWh and in SEK per
kind of energy used per year [25].
3.2 The law of conservation of energy
According to the first law of thermodynamic, the total energy in an isolated system is
constant. The energy can’t disappear or be produced, it is only transformed to another form of
energy but the total amount of energy in the system still remains [26]. This means that what
goes in to a system comes out again and mass- and energy balances can be set up. The general
formula for the balances is set up as following [27] :
(3.1)
For the paper machine, there is no reaction and only mass- and energy in different kinds is
added. The production and consumption terms in equation 3.1 are therefore not included in
the paper machine. When the accumulation term is zero all the inlet streams are equal to the
outlet streams. A boundary line describes what makes up what’s inside and outside the
system. The streams that cross the boundary line for the system decide which mass- and
energy balances that should be set up and from here it is known what kind of data that is
needed to be collected [27].

11
3.3 Literature search
Journal articles
Database: Engineering village
Keywords: Energy saving, paper machine, energy analysis, energy survey
3.3.1 The paper industry
The papermaking process is an energy intense process and because of increasing threats
against the environment it is crucial to improve the usage of energy in these industries [28]. It
is known that the pulp- and paper industry are the fourth largest industry in the world because
of its high usage of electricity and heat. By doing an energy survey of the pulp and paper
industry, where the energy flows are analyzed, potential of energy savings can be identified
[29]. The largest costs in a paper mill are the raw material and the energy. It is estimated that
20-30 % of the total operation costs is constituted of the energy usage in form of steam and
electricity [30]. Also with the rising prices and environmental issues many paper mills are
motivated to reduce their energy usage by finding energy efficient solutions. Except that the
paper making process is an energy intense process it is also a huge user of fossil fuels which
contribute to the emissions of greenhouse gases [29].
The general principles for a pulp- and paper production consist of five steps as following [29]:
Raw material production
Pulping
Bleaching
Chemical recovery
Papermaking
By improving the energy usage of the paper industries it will contribute to minimizing the
output of greenhouse gases, e.g., the fossil fuel. The analyzation of the energy flow
consumption includes the energy supply, energy distribution, energy conversion and energy-
end use in the pulp- and paper industry [31]. As a result when the energy flow for a pulp and
paper industry in Taiwan was studied, there were large potentials for energy conservation,
most in the energy-end use where energy could be used in other manufacturing [31].
3.3.2 Drying theory
The primary task in the paper making process is dewatering from the paper web. The different
dewatering step consists of forming section, pressing section and drying section. The drying
section that is the most energy intensive step [32]. The drying of water in the drying section is
done by evaporation and the high energy usage in this step is because of the waters high
vaporization heat [13].
When the paper web is transferred from the pressing section to the drying section, the
moisture content in the paper web is in general around 35-55 %. This water is evaporated in
the drying section till the paper web reach a general final moisture content of 6-9 %. Even if
the drying section takes away the least portion of water in absolute terms, it is still the most
energy consuming step and the step with highest costs in the paper making process [28]. The
drying section removes 1 % of the original water and the energy required for this is more than

12
65 % of the total energy required for the whole paper making process [32]. The cost for the
drying section is 40 % of the total capital investment [30]. Therefore an optimization of the
drying section in the paper machine could decrease the energy usage of the paper machine
significantly since the drying section is the largest energy user. There is a high priority of
finding efficiencies for the drying section [30].
The process parameters are the one that affects the energy usage in the paper machine. With
different settings on the process parameters for the same drying section, the energy usage for
the drying section is varied. There are therefore optimal settings for the energy usage in the
drying section [30].
The driving force for the water evaporation is the difference of the partial pressure for the
steam at the paper web and the partial pressure for the water in the surrounding air. It is
desirable to have a high driving force to evaporate as much water as possible. The supply air
in to the hood shouldn’t be too moisture because this will give a small driving force for the
evaporation and decrease the airs ability of taking up water. As a result, more air is needed.
The dryer air the air is, with higher temperature gives higher drying rate for the paper [13].
It is an advantage to use low air flows in to the drying hood because less energy is needed to
heat this air. Low air flows will also decrease the drying capacity since more humid air is
stack up in the drying hood. If this humid air is not ventilated away it will be saturated and the
drying stops to occur [13]. The high humid air will give a higher dew point and the advantage
is that it contains more energy. This energy is used for heat recovering to preheat the ingoing
fresh air from the halls. The warmer the preheated fresh air is the less steam is needed to heat
the supply air and will give energy savings, both for the fans and the steam usage [18].
Therefore there should be a balance of the air flows that will give a high dew point at the
same time as the drying of paper is not reduced.
The paper that should be dried is seemed like a solid material with an overall wet surface. The
drying process of paper with air is treated in the same way as the system for air-water at
evaporating. Since the heated air evaporates the water from the paper, the condition of the air
is going to change. The airs condition changes along the adiabatic line, which is the same as
the wet-bulb temperature in the Mollier chart for humid air. The air flow and water content in
an air stream is constant during cooling or heating. The changing parameters in the air stream
are the relative humidity and the enthalpy. When heating the air stream the enthalpy is
increased and when cooling the enthalpy is decreased. If the air is cool down below the dew
point the water in the stream condense and therefore this will decrease the humidity of the air
[33].
3.3.3 Different methods of paper drying
The whole paper drying process is accomplished with a steam-and condensate system, air
system and heat recovery system [30]. Today there are different methods for drying paper
where all methods have the same basic task to transfer heat to the paper web. The different
methods that are used for the drying section are cylinder drying, infrared drying and
convection drying. [28]. The multi-cylinder drying is today the most used method for paper
drying where it’s dominating in the industries [15] and stands for a part of 85-90 % [28].

13
The multi-cylinders that are used in the paper machine consist of a number of hollow cast iron
cylinders where the paper web is passing on the surface. Inside the cylinders steams is going
through and evaporate water from the paper web by condensing. Except the steam that
evaporates the water there is an air-system that heat the supply air that will give the paper web
increased dryness and ventilate away the humid air [28]. The whole drying section takes place
in a drying hood. The drying hood is designed to ventilate away the humid air. This allows the
drying of the paper web to continue and also to recover as much heat as possible from the
humid air [15].
3.3.4 Mathematical formulas
The elements that are included in the drying section are fiber, steam, water and air [32]. Mass-
and energy balances are set up for these elements with respect to the thermodynamics first law
where the energy is conserved in the drying section.
The mass balances for the elements are [32]:
(3.2)
(3.3)
(3.4)
(3.5)
And the energy balances for the same elements are set up in to: [28, 32]
(3.6)
(3.7)
(3.8)
(3.9)
(3.10)
(3.11)
(3.12)
The energy content for the humid air is dependent on the humidity and the enthalpy is defined
at the 0-point as follows [34]:
14
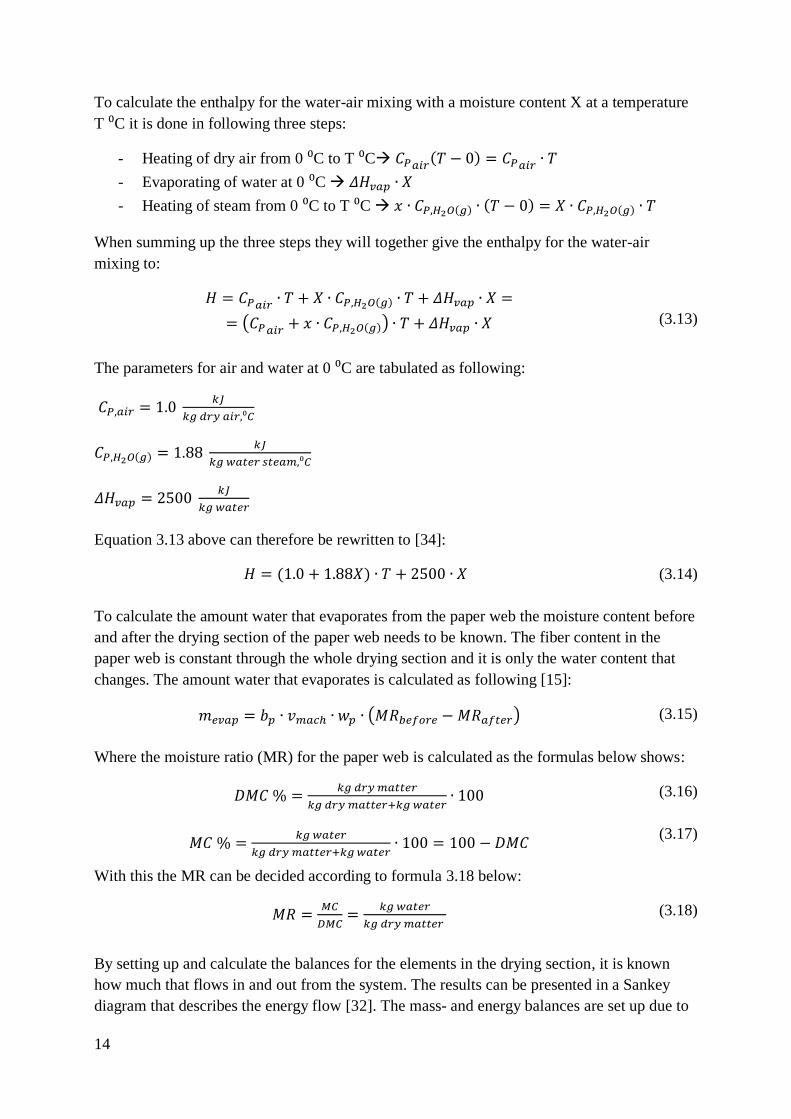
To calculate the enthalpy for the water-air mixing with a moisture content X at a temperature
T C it is done in following three steps:
- Heating of dry air from 0 C to T C
- Evaporating of water at 0 C
- Heating of steam from 0 C to T C
When summing up the three steps they will together give the enthalpy for the water-air
mixing to:
(3.13)
The parameters for air and water at 0 C are tabulated as following:
Equation 3.13 above can therefore be rewritten to [34]:
(3.14)
To calculate the amount water that evaporates from the paper web the moisture content before
and after the drying section of the paper web needs to be known. The fiber content in the
paper web is constant through the whole drying section and it is only the water content that
changes. The amount water that evaporates is calculated as following [15]:
(3.15)
Where the moisture ratio (MR) for the paper web is calculated as the formulas below shows:
(3.16)
(3.17)
With this the MR can be decided according to formula 3.18 below:
(3.18)
By setting up and calculate the balances for the elements in the drying section, it is known
how much that flows in and out from the system. The results can be presented in a Sankey
diagram that describes the energy flow [32]. The mass- and energy balances are set up due to

15
the instantaneous settings for the parameters. When values for the mass-and energy balances
are received a new mass-and energy balance could be set up for new parameter settings to see
how the values for the balances change.
The air condition, especially the condition for the supply air and exhaust air affect the air
consumption significantly. With higher air humidity for the supply air, the more air is needed
to evaporate right amount water. If the exhaust air is too humid more supply air is needed to
ventilate away the humid air [30].
3.3.4 What has been observed in earlier studies
In an earlier study of the paper machine it was observed that the steam- and electricity
consumption were reduced without compromising the quality of the paper [28]. This was
done by decreasing the velocity of the air fans and gave a decreasing of energy usage of 8 %
in the drying section. The same results were observed in another study where the steam flow
to the air-preheater in the drying section was decreased. This gave a temperature of the supply
air in to the drying hood decreasing to 100 ºC from 112 ºC [32]. This means that there were
no obvious increased evaporation rate with higher supply air temperature and would therefore
only be waste of energy. The supply air temperature can’t be too low either because this
would give condensation of the water vapor in the drying hood. There exists an optimum
temperature of how low the temperature of the supply air can be before it affects the heat
transfer from the surrounding air to the paper web. This would increase the energy
consumption in the cylinders instead [32]. With high temperature of the supply air more heat
can be transferred to the paper web and more water is allowed to evaporate. If the heat
transferring is to low then the steam in the cylinder has to evaporate more water, which leads
to higher steam consumption. By comparing the specific heat consumption per kg evaporated
water for different temperature of the supply air it could be seen how much steam that could
be saved [32].
The air humidity in the exhaust air is also an important factor that affects the energy usage.
The air humidity is adjusted by changing the velocity of the air fans with dew point
controlling [35]. This means that if the velocity of the air fans is decreased this will give an
increase of the humidity for the exhaust air and a lower air flow.
To fulfill the mass balance of air a decrease of the exhaust air will also give a decrease of the
supply air flow [32]. By decreasing the air flow this will decrease the energy usage for the air
fans. Except this electricity saving, more heat can be recovered from the exhaust air, which
then would lead to less steam usage for air heating and an energy saving is also done for the
steam. But there is a limit of how high the humidity for the exhaust air is allowed to be before
the steam usage is increased. This is because too high air humidity decreases the driving force
of mass transferring from the paper web to the surrounding air and would require more heat in
form of steam in the cylinders to evaporate water from the paper web. By comparing the
specific steam consumption for water with different air humidity for the exhaust air it shows
how the air humidity affects the steam usage [32]. A study of how the air humidity for the
exhaust air affects the steam consumption, showed that by increasing the humidity of the
exhaust air from 0.10 kg water/ kg dry air to 0.14 kg water/kg dry air, gave a lower specific

16
heat consumption of 4.6 %. This also gave a power decreasing for the air fans of 32 % [32]. It
is desirable to have a low value of the specific heat consumption per kg water, near the value
of ΔHvap=3000 kJ/kg.
Another way to reduce the steam consumption is with controlling of the zero level. The zero
level is the point where the pressure inside and outside the drying hood is equal to each other
[35]. Dependent on where the zero level is set different amount leakage air in to the drying
hood is received. By controlling the zero level the amount leakage air in could be minimized
and also leakage of humid air out from the system is reduced and would result in more heat
recovering according to [35].
Above the zero level there is overpressure and below the zero level there is under pressure.
With too high zero level, an overpressure is observed and this overpressure means that the
supply air is too low and would lead to the amount leakage air in to the system is increased
[17]. This leakage air takes power from the system for heating and would therefore give
higher steam consumption. If the zero level is too low an under pressure is observed. This will
give high supply air flow and humid air is leaked out from the system and less heat is
recovered [35].
When the drying section is run with dew- point and zero level controlling, a higher dew point
without risk for condensation can be set for the drying section. This could be compared to the
case when no controlling was included [35]. When no controlling is included a lower dew
point needs to be set with respect to condensation and dripping of water on the paper web due
to variations of the running. A controlled running would therefore give a lower power
consumption [35].
In this master thesis the drying section (pre-dryer and after dryer) is evaluated where mass-
and energy balances are set up according to the literature researching. To fulfill the balances
values need to be found or measured. To the last, the flows are presented in a Sankey diagram
and then analyzed to find energy efficiencies or see if there is potential for energy savings.
The key numbers for the specific heat consumption per kg evaporated water are calculated to
see if it’s able to decrease the steam consumption for the drying section. This could be done
with dew-point and zero level controlling and recover more heat or decrease the leakage air.
17
4. Method
In this chapter it is described how the measurements are made to fulfill the mass and energy
balances and how to do the energy mapping and the detailed energy mapping
4.1 Energy mapping
The first step in an energy mapping is to identify the energy use units in the company and
make a limitation of what should be included in the mapping. This could be done by studying
flow sheets for the company that will give an overview of how the buildings and processes are
located. This will also show the streams of what flows in and out from each section [24].
The next step of the energy mapping is to make an overview mapping of how much energy
each unit consumes and with which kind of energy carrier. This could be done by collecting
historical energy data, studying old invoice or by calculations for the latest year of how much
energy each section consumes [24]. The data for usage of energy should be the actual values,
measured and historical sampled for tracking in the future and give a reliable knowledge for
the energy usage [36].
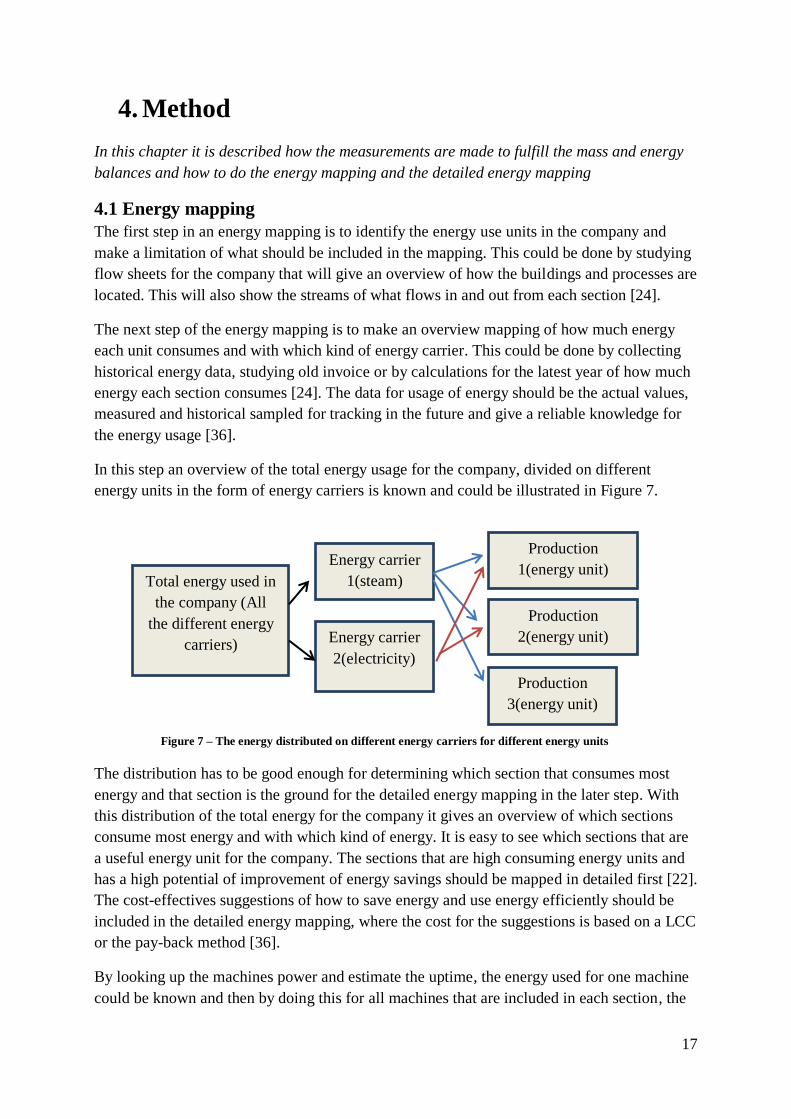
In this step an overview of the total energy usage for the company, divided on different
energy units in the form of energy carriers is known and could be illustrated in Figure 7.
The distribution has to be good enough for determining which section that consumes most
energy and that section is the ground for the detailed energy mapping in the later step. With
this distribution of the total energy for the company it gives an overview of which sections
consume most energy and with which kind of energy. It is easy to see which sections that are
a useful energy unit for the company. The sections that are high consuming energy units and
has a high potential of improvement of energy savings should be mapped in detailed first [22].
The cost-effectives suggestions of how to save energy and use energy efficiently should be
included in the detailed energy mapping, where the cost for the suggestions is based on a LCC
or the pay-back method [36].
By looking up the machines power and estimate the uptime, the energy used for one machine
could be known and then by doing this for all machines that are included in each section, the
Energy carrier
1(steam)
Energy carrier
2(electricity)
Production
1(energy unit)
Production
2(energy unit)
Production
3(energy unit)
Total energy used in
the company (All
the different energy
carriers)
Figure 7 – The energy distributed on different energy carriers for different energy units

18
total energy use for the machines are known [37]. Also by inventing the power for a stream
and estimate the uptime for this stream, the yearly energy use for can also be calculated in the
same way as for the machines. The yearly energy use for a specific machine or a stream could
be calculated with following formula [37]:
(4.1)
4.2 Detailed energy mapping
In the detailed energy mapping it could be seen how the energy carriers is used for that
section it goes into. In the over viewing energy mapping it is only seen how the total energy
of the company is distributed for the different sections. For the section that should be energy
mapped in detail the flow sheet should be studied and from the flow sheet the different flows
in the process could be defined. The flows could be material flows, product flows, byproducts
and energy related flows like steam or fuels. By identifying these flows, mass- and energy
balances could be set up with the thermodynamics first law and this will give knowledge of
how the energy carriers are distributed in the section [38].
When the mass- and energy balances are set up it is known which kind of data that is needed
to calculate this set up of balances. These data could be historical sampled or collected from
measurements and calculations as complements. The mapping should be done at the place for
the section that should be mapped. A visit should also be included to give a representative
picture of the energy using. When all the balances are calculated the energy flows are known
and they could be presented in a flow sheet that will give a good illustrative picture of how
the energy is used [38].
In this master thesis a detailed energy mapping of the drying hood in the paper machine 1
should be done and the different sections for the paper machine are:
Forming section
Pressing section
Pre-dryer section
Sizing
After-dryer section
For the drying section that is studied in detailed following balances is set up according to the
energy usage:
Water balance
Steam balance
Paper balance
Air balance
19
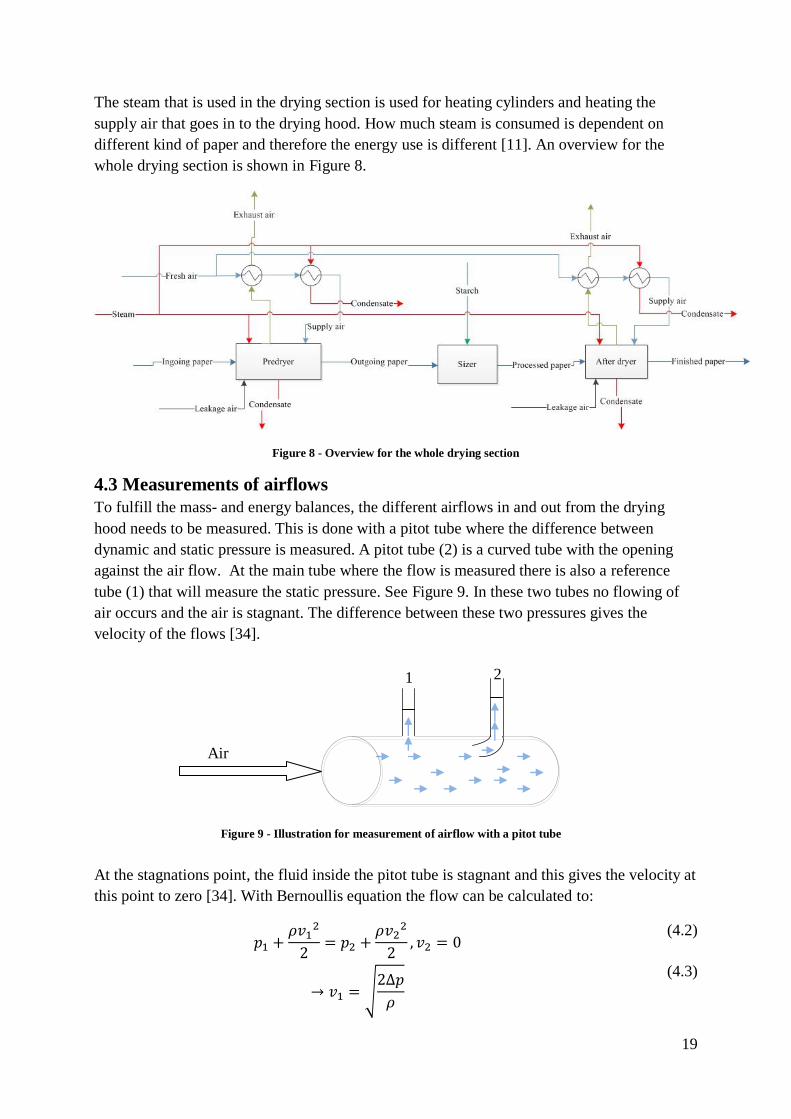
The steam that is used in the drying section is used for heating cylinders and heating the
supply air that goes in to the drying hood. How much steam is consumed is dependent on
different kind of paper and therefore the energy use is different [11]. An overview for the
whole drying section is shown in Figure 8.
Figure 8 - Overview for the whole drying section
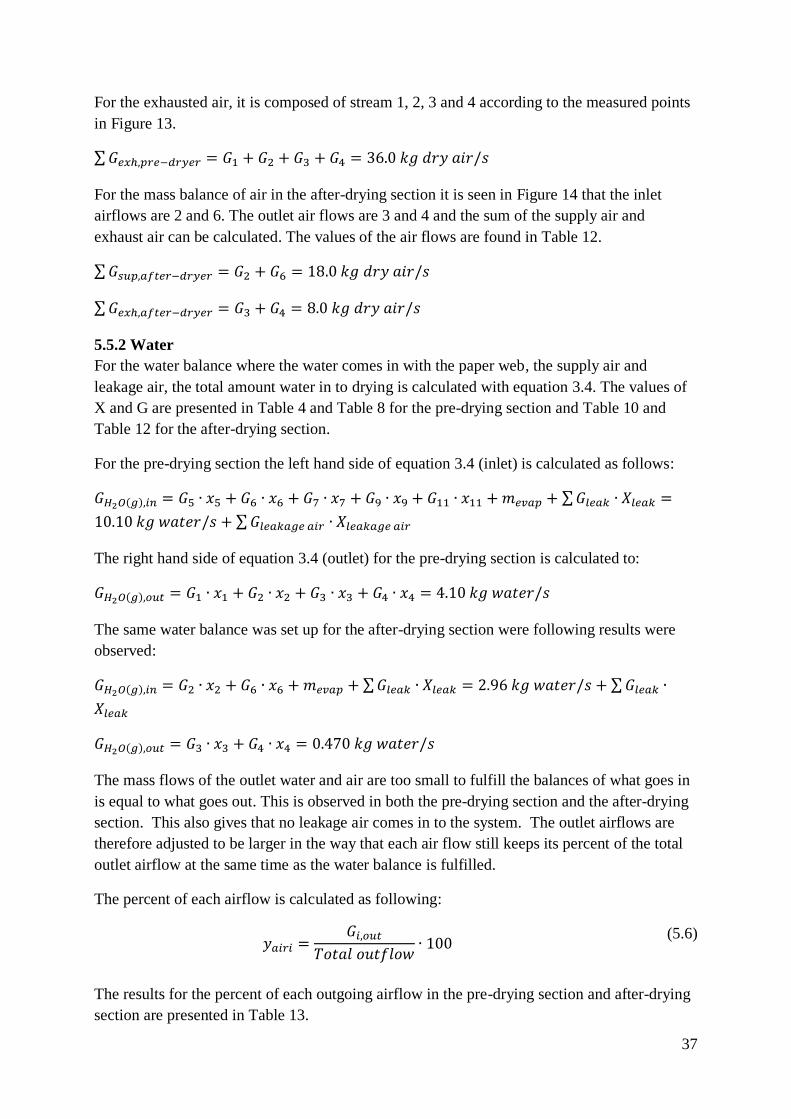
4.3 Measurements of airflows
To fulfill the mass- and energy balances, the different airflows in and out from the drying
hood needs to be measured. This is done with a pitot tube where the difference between
dynamic and static pressure is measured. A pitot tube (2) is a curved tube with the opening
against the air flow. At the main tube where the flow is measured there is also a reference
tube (1) that will measure the static pressure. See Figure 9. In these two tubes no flowing of
air occurs and the air is stagnant. The difference between these two pressures gives the
velocity of the flows [34].
At the stagnations point, the fluid inside the pitot tube is stagnant and this gives the velocity at
this point to zero [34]. With Bernoullis equation the flow can be calculated to:
(4.2)
(4.3)
Figure 9 - Illustration for measurement of airflow with a pitot tube
Air
flow
1 2

20
The density ρ is for the humid air and is calculated as follows [34]:
(4.4)
The density for the humid air can also be decided from the Mollier chart if the relative air
humidity and the wet bulb temperature are known.
To get the volume flow the velocity is multiplied with the cross-sectional area where the flow
is going through.
(4.5)
From this the mass flow of air can be calculated if the density for the dry air is known as
following:
(4.6)
Putting formula 4.5 and 4.6 together gives directly the mass flow of dry air according to
(4.7)
Where ρt is decided with formula 4.4 above or with Mollier chart.
4.4 Measurement of air humidity
With a wet thermometer and a dry thermometer the air humidity and relative humidity can be
determined. The wet thermometer is surrounded with a wet cloth and since the air flow isn’t
saturated there is a concentration gradient of water vapor in the air and the wet cloth. This
driving force is determined with the partial pressure of the water vapor in the surface of the
wet cloth and the air. The air isn’t saturated water will evaporate from the wet cloth. For
evaporating the water from the wet cloth energy is needed and this energy is taken from the
water and little from the air and the temperature from the water will decrease. This decreasing
temperature of water will continue till the temperature difference between air and water is
large. The energy for evaporating water is then only taken from the air. Thermal equilibrium
is reached, which means that the heat transferring from air to the wet cloth is equal to the
energy that is needed for evaporating water from the cloth and this gives the wet-bulb
temperature [34]. This is described in detail in Appendix B! In the Mollier chart there are
constant lines for the wet bulb temperature Tv and by measuring the dry temperature and the
wet temperature the air humidity and relative air humidity could be determined [34].
4.5 Measurement of condensate flow and condensate temperature
To fulfill the mass balance for the steam-and condensate according to equation 3.2, the
condensate flow out from condensate tanks and the steam flow in drying section need to be
decided. The condensate is taken out with pumps and the pumps are used as help for
determine the condensate flow. For each pump there is a characteristic pump curve that
describes how the increased pressure from the pump varies with different volume flows for

21
different diameters of the pump wheel. The increased pressure from the pump is calculated as
following [34]:
(4.8)
The increased pressure from the pump gives a head that is calculated as [34]:
(4.9)
This means that each volume flow of liquid will give a head dependent on which pump that is
used. When measuring the increased pressure from the pump and transforming this pressure
to a head with equation 4.9 the volume flow could be decided from the pump curve.
The axial power for the pump varies dependent on the volume flow and there is a relation
between the axial power and the volume flow. These two properties are also presented in the
pump curve and therefore by measuring the axial power for the pump, the volume flow can be
determined. The theoretical axial power for the pump is calculated as follows [34]:
(4.10)
But because of frictions and losses in the pump more power is required to fulfill the needed
power for the pump and by taking the pumps efficiency in consideration the real power can be
calculated to [34]:
(4.11)
For the engine that runs the pump; its power is dependent on the work from the pump. With
an efficiency ηengine for the engine the electrical power that the engine needs to run the pump
is [34]:
(4.12)
For a three-phase engine the electrical power is calculated as follows [39]:
(4.13)
The current is measured with an ammeter. The voltage and power factor is constant and is
looked up in the data sheet for the pump and with this the electrical power for the engine is
determined.
By rewriting formulas 4.11-4.13 a relation between the axial power and the electrical power
for the motor is observed as follows:

22
(4.14)
In the condensate tank the steam and condensate is in equilibrium, which means that the
temperature and pressure of the steam are the same as for the condensate [33]. They are in
equilibrium since some steam from the condensate is used as flash steam and some is sent out
from the condensate tank as condensate, both phases (liquid and steam) has the same pressure
and temperature. Figure 10 shows the equilibrium between the steam and condensate phase.
Antione’s equation describes how the steam-pressure for only one component in a liquid
correlates with the temperature. If the steam-pressure in the condensate tank is known the
condensate temperature can be calculated with Antoine’s equation [40]:
(4.15)
Where the parameters for water is:
4.6 Measurement of blow through steam flow
The blow through steam that goes to the surface condenser is the blow through steam that
leaves the drying section. To measure the blow through steam flow to the surface condenser,
the cold water flow in to the surface condenser and temperature difference for the cold water
flow is measured. This will give the amount of energy provided by the steam for water
heating when the steam condenses. With the thermodynamic first law an energy balance could
be set up to calculate the steam flow.
Steam-phase
Liquid-phase
ps=pliq
Ts=Tliq
Steam
Condensate
Figure 10– Condensate tank with both steam and liquid phase

23
The cold water flow is measured with an ultrasonic flow meter that measures the velocity of a
fluid with ultrasound and will give the volume flow since the area for the pipe is known.
There are two sensors at this instrument, one transmitter and one receiver. The transmitter
sends out a signal through the fluid and the signal are then detected at the receiver where the
time is registered and the volume flow is then calculated. The Figure 11 below illustrates the
phenomena for this instrument.
The temperature for the cold water flow in and out from the surface condenser is measured
with a contact thermometer outside of the pipes.
Transmitter Receiver
Flow Flow
Figure 11-Measuring of water flow with an ultrasonic flow meter

24
5. Results
This chapter presents the calculations for the amount evaporated water from estimated
values, the results from the experimental measurements. The flow sheets for the processes
where the measurements have been made are also included. The measured values are then
used for calculating the mass-and energy balances which are also are presented in this
chapter with Sankey diagrams.
5.1 Pre-drying section
The estimated moisture content for the paper web before it goes in to the pre-drying section is
MCbefore pre-drying=53 % and the moisture content for the paper web out from the pre-drying
section is MCafter pre-drying=2 % [6]. It is here chosen to make calculations for paper with a
produced grammage of 80 g/m2 since it is the most common paper. With the given moisture
content the amount evaporated water from the paper web is calculated with formula 3.15
where following the parameters is used:
The variations for the paper web width in the drying section can be seen in Appendix C and it
is here chosen to use the web width that the paper has at the inlet of drying section.
Before using equation 3.15 the dry material content that goes in to the pre-dryer section needs
to be determined first were only the fiber that is seemed as the dry material inlet. With
estimated moisture content of MCafter after-drying section=4.1 % [6] for the finished paper the
amount dry material in the paper is:
(5.1)
The amount dry starch that is added is 2.5 g/m2 [41]
and the fiber content for the paper is
calculated to:
(5.2)
Inserted in equation 3.15 gives the amount evaporated water from the paper web in the pre-
drying section to:

25
5.2 Sizer
In the sizer the paper is rewetted again with starch. The total water in to the sizer is composed
of water from the paper web and the starch. The total inlet water to the sizer is equal to the
total amount of water out from the sizer. This is also the amount of water in to the after-dryer
and can be illustrated in Figure 12.
A water balance over the sizer according to Figure 12 gives following mass balance:
(5.3)
Data for starch:
– correspond to a dry concentration of 12.4 % of the starch [41].
- The starch that is added to the paper web.
The paper web that comes in to the sizer got a new width because of the shrinkage in the pre-
drying and is now estimated to see Appendix C. The amount
water that is added from the starch to the paper in stream 3 according to Figure 12 above is
calculated to:
(5.4)
The amount water that comes in to the sizer with the paper in stream 2 is calculated to:
And the total amount water in the paper out from the sizer is calculated with equation 5.3 to:
The fiber content in the paper is constant through the pre-drying section and when it comes to
the sizer a dry layer of starch is added and the total dry material content increases. The
Figure 12-Paper (stream 2) and starch (stream 3) in to the sizer

26
moisture content for the finished paper is estimated to MC=4.1 % [6] . With this value the
total dry material content in the paper web (fiber+starch) out from the sizer can be determined
for the grammage of 80 g/m2.
This would give moisture content in the paper out from the sizer calculated with equation 3.17
to:
5.3 After-drying
The inlet moisture content for the paper web is based on the calculated value of 20 % and the
paper web is dried to the estimated moisture content of 4.1 % [6]. The evaporated water in the
after drying section is calculated in the same way as for the pre-drying section but with
different moisture ratio and paper web width. The paper web width is the same as in the sizer,
see Appendix C for the shrinkage of the paper.
5.4 Measurements airflows and air humidity
The measured points for the different inlet and outlet airflows in the pre-drying section are
shown below in Figure 13. Where the dry temperature, wet bulb temperature, area and
pressure difference is measured. The mean values for these measured parameters are
presented in Table 3.

27
Figure 13- Air system in the pre-drying section

28
Table 3 – Measured values of the wet bulb temperature, the dry temperature and the pressure
Measure point T [ C] Tv [ C] Δp [Pa] Area A [m2]
1 87.7 65.3 1.4 1.25 2 74.0 56.2 25.0 0.50 3 61.9 61.7 15.0 3.12 4 46.8 46.2 67.0 1.23 5 108.2 48.3 142.0 0.80 6 88.2 40.2 23.0 0.46 7 88.2 40.2 23.0 0.39 8 92.7 51.5 23.0 0.50 9 100.2 44.3 46.0 0.50
10 96.7 39.5 126.0 0.17 11 102.3 41.9 130.0 0.90
The wet-bulb temperature and the dry temperature in Table 3 are used the Mollier chart for
humid air for deciding the air humidity, the relative air humidity and the wet density (see
Appendix D). The results are presented in Table 4 below.
Table 4- The air humidity, relative air humidity and wet density decided from the measured values
Measure point X [kg H2O/kg dry air]
Relative air humidity ϕ
Wet density ρ [kg humid air /m3
humid air]
1 0.19 0.35 1.05 2 0.11 0.40 1.05 3 0.17 1.0 0.92 4 0.06 1.0 1.60 5 0.05 0.06 1.10 6 0.03 0.07 1.10 7 0.03 0.07 1.10 8 0.07 0.15 1.05 9 0.06 0.06 1.15
10 0.02 0.04 1.10 11 0.03 0.04 1.10
Streams 12, 13 and 15 (Figure 13) are airflows that are taken from the hall and the
temperature for these air flows are therefore the temperature for respective hall seen in Table
5. The air humidity for the air stream before and after heating is the same [33] and therefore
the air humidity for these streams is the same as the values in Table 4.
Table 5-The temperature of the halls
Air flow [pre-dryer]
Thall [ C]
12 38.4 13 41.3 15 36.0

29
With formula 4.3 the velocity for the air flows is calculated with the pressure Δp and the wet
density shown in Table 3 respectively Table 4. The results for the velocity of the air flows are
presented in Table 6 for all the measured points in pre-drying section.
Table 6-The velocity for the air flows
Measure point Velocity vi [m/s]
1 1.63 2 6.90 3 5.71 4 9.15 5 16.10 6 6.47 7 6.47 8 6.62 9 8.94
10 15.10 11 15.40
To calculate the dry mass air flow G, the dry density is needed. The wet density ρ and the air
humidity X is known the dry density can be rewritten with formula 4.4 to:
(5.5)
For measure point 1 this gives the dry density to:
For the rest of the measure points the dry density is presented in Table 7.
Table 7-The dry density for the air flows
Measure point Dry density ρt
[kg dry air /m3 humid air]
1 0.88 2 0.95 3 0.80 4 0.15 5 1.05 6 1.07 7 1.07 8 0.98 9 1.08
10 1.08 11 1.07

30
The dry mass air flow is calculated with formula 4.7 and for measure point 1 the mass flow of
dry air is:
For the rest of the measure points the mass flow of air are presented below in Table 8.
Table 8- The mass flow of air
Measure point Mass flow of air Gi [kg dry air/s]
1 1.80 2 3.28 3 14.25 4 17.11 5 13.47 6 3.19 7 2.73 8 3.26 9 4.88
10 2.83 11 14.78

31
The same measurements and calculations were done for the after-drying section. The
measured points for the airflows for the after-drying section are shown in Figure 14.
Figure 14- Air system in the after-drying section
Table 9 presents the mean values of the measured parameters in the after-drying section.
Table 9- Measured values of the wet bulb temperature, the dry temperature and the pressure
Measure point T [ C] Tv [ C] Δp [Pa] Area A [m2]
1 76.5 38.0 47.3 0.12 2 78.9 41.0 27.7 1.16 3 67.7 49.5 2.0 2.0 4 37.8 37.2 7.0 1.13 5 72.9 53.3 17.0 0.10 6 79.5 57.7 5.2 3.0
In the same way as for the pre-drying section, the air humidity, the relative air humidity, the
wet density is decided from the Mollier chart found in Appendix D and the results are
presented in Table 10.

32
Table 10- Values from Mollier chart from the measured values of wet bulb temperature and dry temperature
Measure point X [kg H2O/kg dry air] Relative air humidity ϕ
Wet density ρ [kg humid air /m3
humid air]
1 0.025 0.10 1.15 2 0.040 0.15 1.15 3 0.078 0.40 1.05 4 0.040 1.00 1.10 5 0.092 0.47 1.10 6 0.030 0.40 1.05
Stream 7 /Figure 14) is an airflow that is taken from the hall and the temperature in this hall is
T7=35.3 ºC. The air humidity for this air stream is the same as the air humidity for measure
point 2 since the air humidity before and after heating should be the same [33].
The velocity and dry density calculated with equation 4.3 respectively 5.5 of the airflows in
the after-drying section are presented in Table 11.
Table 11- The velocity of the measured airflows and the dry density
Measure point Velocity vi [m/s] Dry density ρt
[kg dry air /m3 humid air]
1 9.07 1.12 2 6.94 1.10 3 1.95 0.97 4 3.57 1.06 5 5.56 1.00 6 3.15 0.95
The dry density is known and the mass flow of air can be calculated and are presented in
Table 12.
Table 12-The dry mass air flow in the after-drying section
Measure point Mass flow of air G [kg dry air/s]
1 1.22 2 9.22 3 3.82 4 4.27 5 0.54 6 8.93

33
5.5 Mass balances for the drying section
To set up the mass balances for the pre-drying section and after-drying section every inlet and
outlet streams need to be defined. Besides the airflows that make up the air-system there is
also a steam-condensate system. This is illustrated in Figure 15 for the pre-drying section and
Figure 16 for the after-drying section, and these makes up a cascade-system.
Figure 15- Cascade system for the pre-drying section with the different steam-groups

34
Figure 16- Cascade system for the after-drying section with the different steam-groups
Both the pre-drying section and after-drying section is composed of the cascade system and
the air system. Putting together the air-system and the cascade system a flow chart for the
whole pre-drying section and after-drying section are observed as Figure 17 respectively
Figure 18 shows.

35
Figure 17-The pre-drying section with air-system and cascade system

36
In Figure 17 and Figure 18 where boundary lines are drawn it is seen that the streams that
cross the boundary line are:
Condensate from condensate tanks
Condensate from steam battery
Low- and middle pressure steam
Flash steam/blow through steam
Supply air flow
Exhaust air flow
Paper in and out
Air from pre-dryer section
Leakage air
5.5.1 Air
The mass balance of air for the drying section is calculated with formula 3.3. The inlet
airflows in the pre-drying section according to the flow chart in Figure 13 are 5, 6, 7, 8, 9, 10,
and 11. The values for the mass flows are found in Table 8. As been seen in Figure 13, stream
9 is divided into 2 streams (8 and 10) and therefore the sum of the supply air is composed of:
Figure 18 The after-drying section with air-system and cascade system
37
For the exhausted air, it is composed of stream 1, 2, 3 and 4 according to the measured points
in Figure 13.
For the mass balance of air in the after-drying section it is seen in Figure 14 that the inlet
airflows are 2 and 6. The outlet air flows are 3 and 4 and the sum of the supply air and
exhaust air can be calculated. The values of the air flows are found in Table 12.
5.5.2 Water
For the water balance where the water comes in with the paper web, the supply air and
leakage air, the total amount water in to drying is calculated with equation 3.4. The values of
X and G are presented in Table 4 and Table 8 for the pre-drying section and Table 10 and
Table 12 for the after-drying section.
For the pre-drying section the left hand side of equation 3.4 (inlet) is calculated as follows:
The right hand side of equation 3.4 (outlet) for the pre-drying section is calculated to:
The same water balance was set up for the after-drying section were following results were
observed:
The mass flows of the outlet water and air are too small to fulfill the balances of what goes in
is equal to what goes out. This is observed in both the pre-drying section and the after-drying
section. This also gives that no leakage air comes in to the system. The outlet airflows are
therefore adjusted to be larger in the way that each air flow still keeps its percent of the total
outlet airflow at the same time as the water balance is fulfilled.
The percent of each airflow is calculated as following:
(5.6)
The results for the percent of each outgoing airflow in the pre-drying section and after-drying
section are presented in Table 13.

38
Table 13-The part that each outgoing airflow corresponds to in the pre-drying section and after-drying section
Air flow Pre-dryer[%] After-dryer[%]
1 5.0 - 2 9.1 - 3 38.9 47.3 4 47.0 52.7
With the mass balances for air-and water an equation system is set up as a help to calculate
how much the total exhaust air flow should be to fulfill the water balance. By explicating
these two balances and putting in the percent of the outgoing airflow following equation
system is observed for the pre-drying section:
(water balance)
(air balance)
Putting in all the known numbers and an assumption for the humidity of the leakage air is
[15] the equation system now looks like:
There are two equations and two unknowns, and , which gives a soluble system.
This equation system is solved in the program Matlab and following results were observed for
the pre-dryer:
The same equation system was solved for the after-drying section but with corresponding
numbers for the after-dryer and the observed airflows are:
The new outgoing airflows based on the adjusted total outgoing air flow are calculated with
equation 5.6 and the results are presented in Table 14.

39
Table 14-The new adjusted outgoing airflows
Air flow Pre-dryer [kg/s] After-dryer [kg/s]
1 4.8 - 2 8.8 - 3 37.4 29.6 4 45.3 33.0
With these outgoing airflows the water balance in the pre-drying section is now calculated to:
The water balance for the after-drying section with the new outgoing air-flows is:
It is the adjusted outgoing airflows in Table 14 and the new water balance that are used in the
future calculations.
5.5.3 Paper
The fiber content in the paper is the same through the whole drying section which was
mentioned before. It is the moisture content that changes and the inlet fiber content in the pre-
drying section is calculated as follow:
This is also the same value for the outlet fiber content.
For the after-drying section a dry layer of starch has been added and therefore gives a higher
mass of dry material. The amount dry material in to the after drying is calculated before to:
5.5.4 Steam-Condensate
The steam that comes in to the cylinders in the pre-dryer and after dryer section is both a
middle-pressure steam and low-pressure steam. The low pressure steam is divided to the air-
preheater and the steam cylinders in both the pre-dryer and after-drying section. From the
software Metso DNA that controls the different parameters, the total flow for the steams (see
Appendix E) in to the pre-drying section is observed as the values below shows:

40
The steam flows in to the after-drying section (see Appendix E) is also observed from the
software Metso DNA as following values:
To calculate the amount steam that is needed for the air-preheaters, the temperature for the air
streams before and after the air-preheater is measured. These temperatures are then used for
calculating the enthalpy for the air caused from the increased temperature. Figure 19 shows
the measured air flows (S1-S6) before and after the air-preheater for each air-preheater in the
pre-drying section. The temperature of the air-flows before and after the air-preheaters is
presented below in Table 15.
Figure 19-The measured points in and out for each air-preheater in the pre-drying section
Table 15-The measured parameters for the air-preheaters in the pre-drying section
Air-preheater Dry temperature [ C]
X [kg H2O/kg dry air]
Air flow[kg/s]
Before After
1 57 104 0.0275 14.78 2 58 98 0.0275 19.39 3 60 99 0.0275 4.88
With values from Table 15, the enthalpy for the air stream can be determined with formula
3.14 and are presented below in Table 16.

41
Table 16-Enthalpies for the air streams before and after the air-preheater
Air-preheater Enthalpy for air stream [kJ/kg]
Before After 1 128.9 178.6 2 130.5 171.6 3 132.3 173.0
The steam that goes in to the air-preheater is of a superheated low-pressure steam of 4 bar and
the latent heat of evaporation for this steam is:
[42]
No blow through steam comes out from the air-preheater it means that all ingoing steam to the
air-preheater comes out as condensate according equation 3.2. The blow-through term
therefore disappears. The amount steam that is needed for each air-preheater is calculated
with an energy balance as formula 5.7 below shows. The up-taken energy for the air is the
same amount energy that leaves the steam for condensing.
(5.7)
The results for the amount steam that is needed for the air-preheaters in the pre-drying section
are presented in Table 17.
Table 17-Steam flow to each air-preheater in the pre-drying section
Air-preheater Steam flow Gsteam,aph [kg/s]
1 0.34 2 0.37 3 0.09
For the air-preheater in the after-drying section it is assumed that 50 % of the total steam in to
the air-preheater is made up of flash steam [43]. There are no sensors that measure this flow.
To calculate the total steam that goes in to the steam battery the condensate flow out is
decided by measure the temperature of the air flow before and after the air-preheater. The
observed results are presented in Table 18:

42
Table 18- The measured parameters for the air-preheater in the after-drying section
Air-preheater Dry temperature [ C]
X [kg H2O/kg dry air]
Air flow[kg/s]
Before After 1 53.4 75.2 0.013 9.2
The enthalpy before and after the air-preheater for the airflow is:
Table 19- The enthalpy for the air stream before and after the air-preheater in the after-drying section
Air-preheater Enthalpy for air stream [kJ/kg]
Before After 1 87.2 109.6
The condensate/steam flow for the air-preheater can now be calculated as following:
This would give the flow for the flash steam to:
The amount steam that goes to the cylinders in the pre-drying section can now be calculated
as following:
The amount steam that goes to the cylinders in the after-drying section is:
The condensate leaves the system from condensate tank 1 and 2 for the pre-dryer as can be
seen in Figure 16. For the after-dryer the condensate leaves from condensate tank 5 and 6
shown in Figure 17. The condensate flow out from condensate tank 1 is calculated by
measuring the pressure before and after the pump. Following pressures where observed:
This gives a pressure increase calculated with equation 4.8 to:
With formula 4.9 the head can be calculated to:

43
With this value read in the pump curve for the pump at condensate tank 1with a wheel-
diameter of 145 mm (see appendix F) the volume flow of the condensate is decided to:
Calculated to the mass flow with the density for water at 75 ºC ρH2O=975 kg/m3 [40] the mass
flow for the condensate is:
For the pump at condensate tank 2 there were no openings to measure the pressures before
and after the pump. Instead the power for the pump was measured and then this value was
used in the pump curve to decide the volume flow.
The power for the engine is calculated with equation 4.13 and the current and voltage is
measured to:
The power factor is and gives the power for the engine to:
With equation 4.14 this value can be transformed to the axial power for the pump with an
efficiency of 0.85 for the engine.
For the pump at condensate tank 2 with a wheel-diameter of 200 mm the volume flow for the
condensate can be decided in the pump curve (see appendix F) to:
With the density ρH2O=958 kg/m3 for water at 100 ºC gives a mass flow of:
Both of the condensate flow from condensate tank 5 and 6 were measured in the same way as
for pump the pump at condensate tank 1.Where the pressures before and after the pump was
measured. For the pump at condensate tank 5 following pressures where observed:
And this gives a pressure increase calculated with equation 4.8 to:

44
With formula 4.9 the head can be calculated to:
With this value read in the pump curve for condensate tank 5 (Appendix F) with a wheel-
diameter of 145 mm this gives the mass flow of the condensate to:
For the pump at condensate tank 6 following pressures where observed:
This gives a pressure increase calculated with equation 4.8 to:
With formula 4.9 the head can be calculated to:
With this value read in the pump curve for condensate tank 6 with a wheel-diameter of 145
mm this gives the mass flow of the condensate to:
As can be seen the condensate flow out in both the pre-drying and after-drying section is
much larger than the ingoing steam flow in to the systems. The steam-condensate balance is
not fulfilled according to equation 3.2. The steam flows in to the cylinders are more reliable
and therefore used in the future calculations instead of the condensate flows out from the
condensate tanks. Therefore the condensate flow is adjusted in a way so they are not higher
than the ingoing steam flows and still keeps the same percent of the total condensate flow.
The percent of each condensate flow is calculated as following:
(5.8)
The percent of the condensate flow out from tank 1 in the pre-drying section is:
The percent for the rest of the condensate flow are presented in Table 20.

45
Table 20-The percent for the condensate flows from the condensate tanks
Condensate flow-tanks Pre-dryer[%] After-dryer[%]
1 16.7 - 2 83.3 - 5 - 37.6 6 - 62.4
The blow through steam out from condensate tank 1 and 5 cross the boundary line in Figure
17 respectively Figure 18. These blow-through steams are calculated by measuring the cold
water flow and temperature difference for the cold water in to the surface condenser. The
results for the pre-drying section and after drying section are presented in Table 21.
Table 21-The measured parameters for the cold water flow in the surface condenser
Surface condenser
Cold water flow [m3/s]
Temperature in [ C]
Temperature out [ C]
Pre-dryer 3.3·10-3 30 30 After-dryer 4.6·10-3 33 46
With the values in Table 21 the flow for the blow through steam is calculated with an energy
balance according to equation 5.9.
(5.9)
The cold water flow has a pressure temperature of 30 ºC and this gives a density of:
[40]
The power that is provided from the blow through steam to the cold water can now be
calculated with equation 5.9 as following:
(Pre-dryer)
(After-dryer)
The provided power from the blow through steam to the cold water flow in the pre-drying
section is zero. This means that there is no blow through steam in to the surface condenser.
This is because during normal operations there is no excess of heat, all heat is used for the
system but during a paper break there is a lot of excess heat. To utilize this heat, the steam
goes to the surface condenser to warm water that can be used for other purposes. But for the
surface condenser in the after-drying section, the cold water flow is heated from the blow
through steam.
The steam-pressure for the blow through steam read in Metso DNA is 59 kPa. This steam-
pressure gives the latent heat of evaporation to ΔHvap, bt=2293 kJ/kg [42]. The mass flow for

46
the blow through steam in the after-drying section can now be calculated with equation 5.9
since the power provided from the steam to the cold water flow is known.
Now when the blow through steam is known the steam and condensate balance according to
equation 3.2 can be fulfilled. The condensate is distributed percental on the steam that
doesn’t condense. This give the condensate flow out form condensate tank 1 to:
The rest of the new condensate flows from the condensate tanks are calculated in the same
way and are presented in Table 22.
Table 22-The adjusted condensate flows for the condensate tanks
Condensate flow-tanks Pre-dryer[kg/s] After-dryer[kg/s]
1 1.69 - 2 8.45 - 5 - 0.58 6 - 0.97
It is the condensate flows presented in Table 22 that is used in the future calculations.
5.6 Energy balances for the drying section
The masses for the different subjects that cross the boundary line are now known and energy
balances can be set up. The process is shown in Figure 17 for the pre-dryer and Figure 18 for
the after-dryer.
5.6.1 Air
Equation 3.7 is used for calculating the power for the ingoing air in to the system while
equation 3.8 is used to calculate the power for the outgoing air from the system. The
enthalpies for the airflows are calculated with equation 3.14.
For the measured point 1 in the pre-drying section with values from Table 3 and Table 4 the
enthalpy is calculated as follows:
With mass flow of air in Table 14 this would give a power for point 1 to:
The enthalpies and the power for the rest of the air-streams are calculated in the same way as
for point 1 and the results are presented in Table 23.

47
Table 23-The enthalpies and the powers for the air flows in the pre-dryer
Measure point Enthalpy Hi [kJ/kg] Power Qi [kW]
1 594.07 2857.1 2 364.38 3192.6 3 503.68 18955.0 4 202.08 9147.3 5 243.37 3277.4 6 168.14 536.47 7 168.14 459.74 9 261.46 1594.1
11 183.03 2704.7 12 115.56 1707.7 13 118.63 2300.0 15 190.06 1158.8
The power for air stream 14 that leaves the system after it has been heat exchanging with air
stream 13 (See Figure 13) is unknown. The temperature for stream 14 that comes in to the
heat exchanger needs to be calculated first before the power that leaves the system with air
stream 14 can be decided. This is calculated with mass- and energy balances that are set up
according to Figure 20.
Figure 20- Air stream 1 and 2 mixed together to one new stream
The mass- and energy balances are as follows:
(5.10)
(5.11)
(5.12)
G14
G2 G1

48
With equation 5.10 and mass flows from Table 14 the new mass flow of air is calculated.
And with equation 5.11 the air humidity for the mixed stream is calculated to:
The enthalpies for air stream 1 and 2 are calculated with equation 3.14 and are presented in
Table 23. The enthalpy for air stream 14 can now be calculated with the energy balance
equation 5.12
With the enthalpy and air humidity for air stream 14 inserted in equation 3.14 the temperature
is calculated as followed:
To calculate the outgoing temperature of stream 14 from the heat exchanger a new energy
balance for stream 13 and 14 over the heat exchanger is set up according to Figure 21:
The power that leaves stream 14 is equal to the up-taken energy to stream 13 and the energy
balance can therefore be set up as follows:
(5.13)
With mass flows from Table 8 and Table 14 and enthalpies from Table 23 and Table 16 the
up taken power and the power that leaves can be calculated as follows:
The ingoing power to the heat exchanger from stream 14 is calculated as follows
T14,2
T14,1
T13,2 T13,1
Figure 21- Heat exchanger for air stream 13 and 14 in the pre-drying section

49
The power for the streams involved in the heat exchanger are known except Q14,2 this power
can be calculated with the known values inserted in equation 5.13 which gives following:
This power out for stream 14 corresponds to a temperature calculated to:
The enthalpies and the power for the air flows in the after-drying section are set up and
calculated in the same way as for the pre-drying section were the results are presented in
Table 24.
Table 24-The enthalpies and power for the air flows in the after dryer
Measure point Enthalpy H [kJ/kg] Power Q [kW]
3 272.66 8071.2 4 140.64 4648.0 6 370.94 3312.9 7 137.95 1271.7
The power for the leakage air is calculated with equation 3.9 and the enthalpy is calculated in
same way as before with equation 3.13. It is assumed that the air humidity of the leakage air is
and the temperature is assumed to be in both the pre-
drying section and after-drying section. This would give the enthalpy of the leakage air to:
The power the leakage air in the pre-drying section is now calculated to:
The total inlet power from the air in the pre-drying section is calculated to:
The power for the leakage air in the after-drying section is calculated to:
This would give the total power from the air in to the after-drying section to:
The total power for the outlet airstreams in the pre-drying section is calculated to:

50
The total power for the outlet airstreams in the after-drying section is calculated to:
5.6.2 Paper
The power for the paper web in and out is calculated with formulas 3.10 and 3.11 and the inlet
water and outlet water in the paper web for the pre-drying section needs to be known before
the power can be determined.
The amount inlet and outlet water in the paper web in pre-drying section is calculated as
follows:
The measured mean temperature for the paper web before it goes in to the pre-dryer is 41.5 C
and the outlet temperature for the paper web out from the pre-dryer is 92.4 C. This was
measured with an IR-camera.
The temperature and amount inlet water inserted in equation 3.10 gives the inlet power for the
paper web to:
The same calculation was done for the outlet power of the paper web with equation 3.11 and
this gives the power to:
For the after-drying section the inlet water and outlet water for the paper web are:
The measured mean temperature for the paper web in the after-drying section was measured
in the same way as for the pre-drying section and following temperatures were observed:

51
The power for the paper web in to the after-dryer is calculated with formula 3.10 and gives
following:
The power that comes out with the paper web is calculated with equation 3.11 to:
5.6.3 Steam-Condensate
The steam used in the cylinders is an overheated middle- and low pressure steam of 13 bar
and 200 C respective 4 bar and 150 C [8]. The power for the condensate is calculated with
equation 3.12. With a pressure of 4 bar for the low pressure steam the condensation
temperature is [42]. This low pressure steam goes in to the air-preheater and
with values of the condensate flow in Table 17; the power for the condensate out from air-
preheater 1 in the pre-drying section is calculated as follows:
The power for the rest of the condensate flow out from the air-preheaters in the pre-drying
section is presented in Table 25.
Table 25-The power for the condensate flows out from air preheater in the pre-dryer
Air-preheater Power for condensate Qc,aph,i [kJ/s]
1 207.34 2 224.73 3 55.95
The same calculation was done for the condensate flow out from the air-preheater in the after-
drying section was following power was calculated for the condensate:
The condensate that comes from the steam-cylinders leaves the system from condensate tanks
and the power for these condensates is also calculated with equation 3.12. Since there is a
given steam-pressure in the condensate tanks from the software Metso DNA (see appendix G)
and the condensate temperature is calculated with Antoine’s equation 4.15. The results are
presented in Table 26.

52
Table 26-The steam pressures and condensation temperatures for the condensate tanks
Condensate tank Steam-pressure [mbar] Condensation temperature [ C]
1 370 74 2 1350 108 5 690 89.6 6 1740 115.8
The energy flows for the condensates are calculated with equation 3.12 with values from
Table 22. For condensate tank 1 where the condensate flow is 1.69 kg/s the power is:
The same calculation was made for the rest of the condensate flows from the condensate tanks
and the results are seen in Table 27.
Table 27-The power for the condensate flows from the condensate tanks
Condensate tank Power for condensate Qctj [kW]
1 522.8 2 3 814.7 5 218.9 6 468.8
It is assumed that all blow-through steam is condensed in the surface condenser. The
condensate flow in to condensate tank 5 is therefore equal to the flow of the blow through
steam. The temperature for blow-through steam is calculated with Antoine’s equation 4.15
and gives a temperature of T=85.6 ºC where the steam-pressure is 59kPa. This is also the
temperature for the condensate flow that goes in to condensate tank 5. The power for the
condensate flow from the surface condenser in to condensate tank 5 is calculated with
equation 3.12 to:
The flash steam that goes in to the air-preheater in the after-drying section is assumed to have
a pressure of 20 kPa and a temperature of 100 ºC and are therefore an overheated steam [43].
The enthalpies for the overheated steams are found from the Mollier chart for steam [44] and
are presented in Table 28.
Table 28-The enthalpies for the different steams
Steam Enthalpy [kJ/kg]
Low-pressure 2775 Middle-pressure 2810
Flash 2690

53
With the enthalpies that are presented in Table 28 together with equation 3.6, the inlet power
from the steams in to the pre-drying section and after-drying section can be calculated.
- Pre-dryer
– Pre-dryer
–After- dryer
– After-dryer
–After-dryer
The power for the steam in the pre-drying section and after-drying section is known and the
amount evaporated water. The specific heat consumption (ΔHvap) could be calculated. The
specific heat consumption for the pre-drying section is:
For the after-drying section the specific heat consumption is calculated to:
Comparing these two values to the specific heat consumption
[42] shows that there is potential to decrease the steam usage. This is due to the specific heat
consumption for both the pre-dryer and the after-dryer is higher than the theoretical value.
5.7 Total balance for the drying section
The total mass balance with all components for the pre-drying section according to Figure 17
is set up to:
(5.14)
The sum of the inlet masses (left hand side of equation 5.14) is:
The sum of the outgoing masses (right hand side of equation 5.14) is:
The inlet- and outlet masses in the pre-drying section are almost equal to each other. If equal
to each other it means that everything that goes in is utilized and no losses of mass are
observed. Here the outlet mass is 0.1 kg less than the inlet mass and therefore 0.1 kg is seen
like a loss.

54
The total mass balance with all components for the after-drying section according to Figure
18 is set up in the same way as equation 5.14. The sum of the inlet masses is:
The sum of the outlet masses is:
For the inlet masses and outlet masses in the after-drying section it is seen that the outlet
masses is 0.1 kg less than the inlet masses. This means that 0.1 kg is not utilized and is seen
like a loss.
The inlet and outgoing masses for the pre-drying section and after-drying section are sum up
and presented in a mass flow diagram. This would give an overview of how every stream are
related to each other. For the mass flows in the pre-drying section the diagram is shown in
Figure 22 and the mass flows for the after-drying section is presented in Figure 23.
Figure 22-The mass flows in the pre-drying section

55
Figure 23-The mass flows in the after-drying section
The total energy balance for the system is set up as equation 5.15.
(5.15)
The left hand side of equation 5.15 makes up the inlet power and for the pre-drying section
they are calculated to:
The right hand side of the equation makes up the outlet power and for the pre-drying section
the outlet power is calculated to:
The outlet power in the pre-drying section is 1185 kW less than the inlet power. This means
that not all the ingoing power is utilized and disappears in form of heat or other losses.
The total inlet power for the after-drying section is calculated in the same way as for the pre-
drying section. The total inlet power is:
The total power out is:
The outlet power in the after-drying section is 1385 kW higher than the inlet power. This
phenomenon is not possible since energy can’t be created according to first law of
thermodynamic [26].

56
The calculated energy flow for each component in the pre-drying section and the after-drying
section are presented in a Sankey diagram. It is seen how large the energy flows are related to
each other.
Figure 25-The Sankey diagram for the after-drying section
The yearly power consumption for the pre-dryer and after dryer calculated is calculated with
equation 4.1 where it is approximated that the operation time is 7560 h/year [8]. This will give
the yearly energy usage in the drying sections to:
Figure 24-The Sankey diagram for the pre-drying section

57
5.8 Economical analysis
The prices for producing the steam in the drying section are presented in Table 29 [8].
Table 29-Producing prices for the steam
Steam SEK/MWh SEK/ton
Low-pressure 195 115 Middle-pressure 205 125
The leakage air in to the drying hood takes needs to be heated up. This energy is then added in
form of steam. The leakage air provides to a cost since more steam needs to be added and this
cost is calculated for both the pre-drying section and the after-drying section.
The leakage air in the pre-drying section is heated to 80 ºC, which is the mean temperature of
the outgoing exhaust air streams 1 and 2. The power needed for the leakage air-heating
section is dependent on the enthalpy difference caused by the heating. The enthalpy is
calculated with equation 3.9.
The enthalpy for the leakage air at 20 ºC is calculated before to 58.0 kJ/kg and the power for
leakage air heating is now calculated to:
The leakage air in to the pre-drying section is approximately 60 % of the total ingoing air.
Reducing the leakage air to 30 % (half of the leakage air) the power for heating the leakage
air is reduced to the half and is . This is equal to the power that
comes from both the middle-pressure steam and the low-pressure steam and can be written to:
(5.16)
Where the percentage for each steam is calculated with equation 5.17-5.18
(5.17)
(5.18)
The percentage of each steam in the pre-drying section is calculated to:
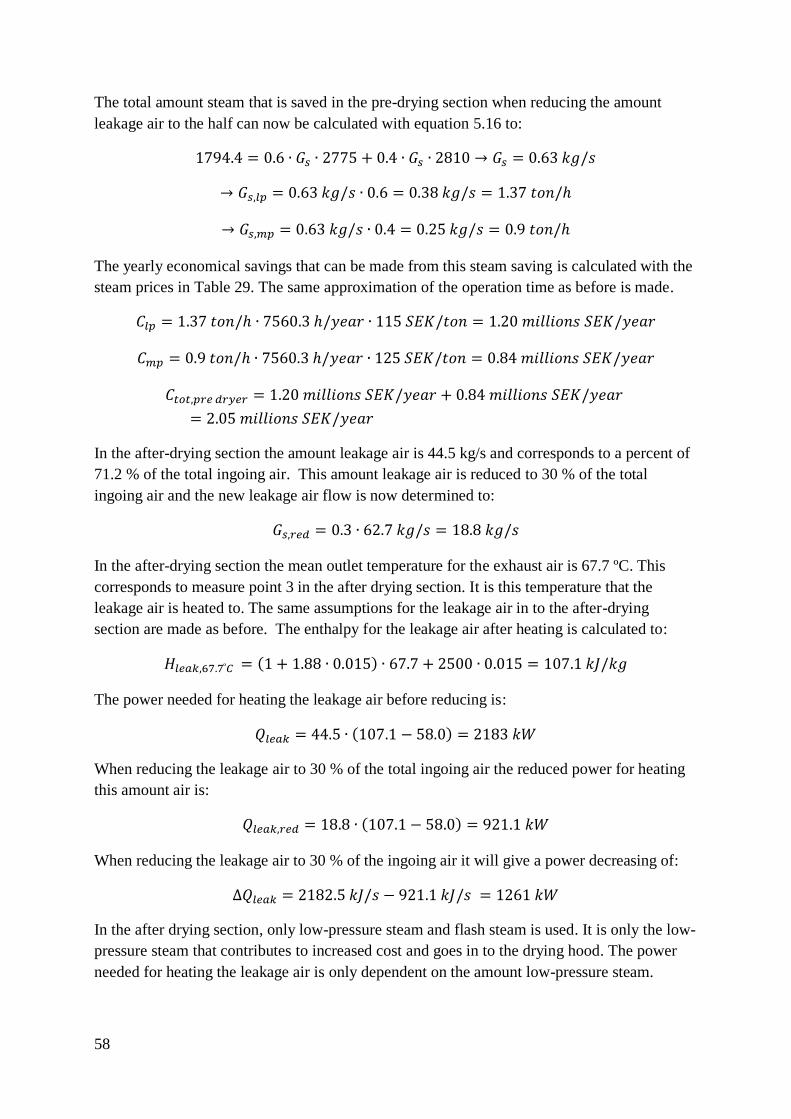
58
The total amount steam that is saved in the pre-drying section when reducing the amount
leakage air to the half can now be calculated with equation 5.16 to:
The yearly economical savings that can be made from this steam saving is calculated with the
steam prices in Table 29. The same approximation of the operation time as before is made.
In the after-drying section the amount leakage air is 44.5 kg/s and corresponds to a percent of
71.2 % of the total ingoing air. This amount leakage air is reduced to 30 % of the total
ingoing air and the new leakage air flow is now determined to:
In the after-drying section the mean outlet temperature for the exhaust air is 67.7 ºC. This
corresponds to measure point 3 in the after drying section. It is this temperature that the
leakage air is heated to. The same assumptions for the leakage air in to the after-drying
section are made as before. The enthalpy for the leakage air after heating is calculated to:
The power needed for heating the leakage air before reducing is:
When reducing the leakage air to 30 % of the total ingoing air the reduced power for heating
this amount air is:
When reducing the leakage air to 30 % of the ingoing air it will give a power decreasing of:
In the after drying section, only low-pressure steam and flash steam is used. It is only the low-
pressure steam that contributes to increased cost and goes in to the drying hood. The power
needed for heating the leakage air is only dependent on the amount low-pressure steam.
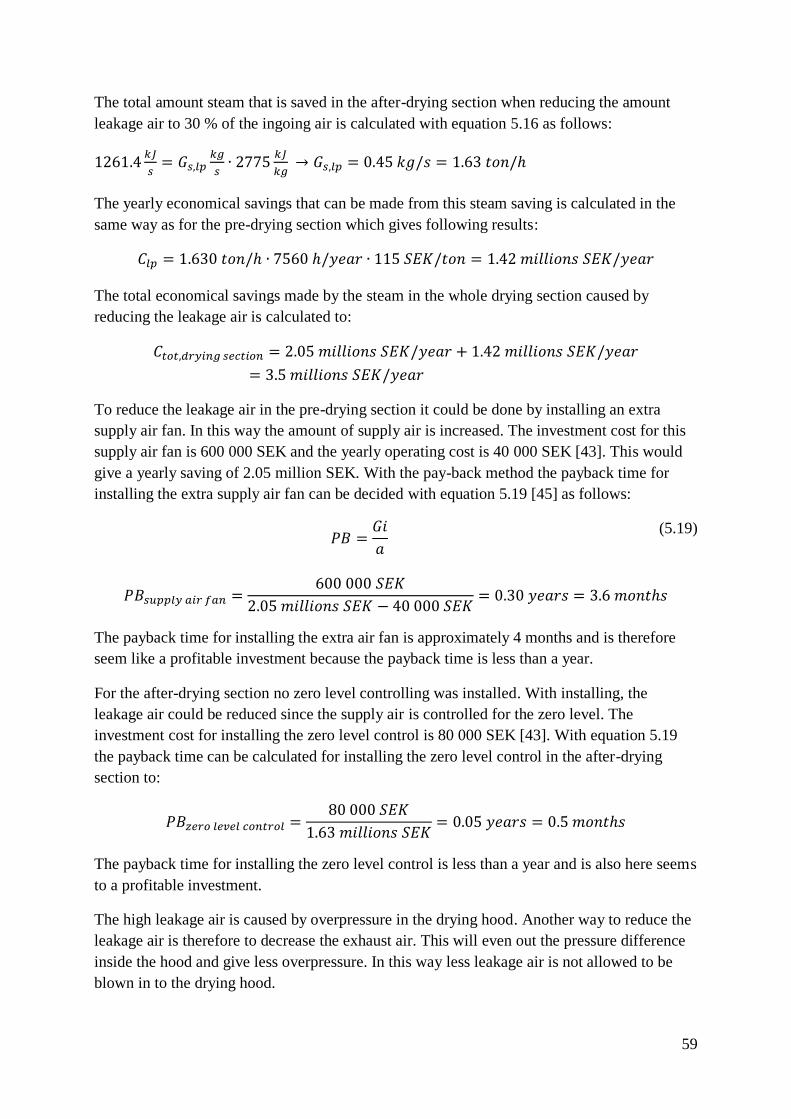
59
The total amount steam that is saved in the after-drying section when reducing the amount
leakage air to 30 % of the ingoing air is calculated with equation 5.16 as follows:
The yearly economical savings that can be made from this steam saving is calculated in the
same way as for the pre-drying section which gives following results:
The total economical savings made by the steam in the whole drying section caused by
reducing the leakage air is calculated to:
To reduce the leakage air in the pre-drying section it could be done by installing an extra
supply air fan. In this way the amount of supply air is increased. The investment cost for this
supply air fan is 600 000 SEK and the yearly operating cost is 40 000 SEK [43]. This would
give a yearly saving of 2.05 million SEK. With the pay-back method the payback time for
installing the extra supply air fan can be decided with equation 5.19 [45] as follows:
(5.19)
The payback time for installing the extra air fan is approximately 4 months and is therefore
seem like a profitable investment because the payback time is less than a year.
For the after-drying section no zero level controlling was installed. With installing, the
leakage air could be reduced since the supply air is controlled for the zero level. The
investment cost for installing the zero level control is 80 000 SEK [43]. With equation 5.19
the payback time can be calculated for installing the zero level control in the after-drying
section to:
The payback time for installing the zero level control is less than a year and is also here seems
to a profitable investment.
The high leakage air is caused by overpressure in the drying hood. Another way to reduce the
leakage air is therefore to decrease the exhaust air. This will even out the pressure difference
inside the hood and give less overpressure. In this way less leakage air is not allowed to be
blown in to the drying hood.
60
6. Discussion and conclusion
In this chapter the observed results are discussed together with the measurements uncertainty
that predict how reliable the results are and what conclusions could be made from the results
in this master thesis.
6.1 Measurement uncertainty
As can be seen from the measurement of airflows it gives a high mass flow of leakage air in
both the pre-drying section and the after-drying section. This result is based on the adjusted
values from the measured values. Only the measured values gave that the amount air in to the
system was higher than the amount out from the system. This is not correct for the air balance,
since what comes in has to come out. The same result was observed for the water balance; the
amount water in to the system was higher than the amount water out from the system. The
quality of the paper is affected by the amount water that evaporates from the paper web.
Therefore the amount water in to the system seemed more reliable because this parameter is
controlled to give the paper its right properties. This was the reason why the outlet airflows
were adjusted in a way that they will be equal to the inlet water.
Source of errors that has affected the results for the measurements of air-flows is the openings
for the flow channels, which is regulated with damper, haven’t been taken in consideration in
the calculations. In the calculations the area for the different channels was used which
correspond to full opening of the damper. The cross-sectional area for the air could have been
less. Also when measuring the pressure in the flow channels with the Prandtl tube it is seen
that the air is pulsing, this gave varying pressures all the time. This phenomenon makes it
hard to determine the pressure and also the pressure in the channels were measured in the
middle. The air pressure is varying in the whole channel and therefore the mean value when
measuring at different places in the channel would give a better accuracy. Another source of
error is that some measurements were made close to the air fan, or close to a curvature, which
is not recommended since this will disturb the measuring by giving higher or lower values.
There are recommended places to measure but sometimes the distances are too short to
measure at these places.
Finding the air channels to be measured was done from the flow sheet and if the flow sheet is
not correctly drawn, like missing of air channels, made that air channels aren’t included in the
calculations. If it is correct that there were missing of air channels this will affects the air- and
water balance and could be a reason why they weren’t equal to each other before adjusting the
values. In this case it seemed like exhaust air fan/fans was missing and a quick tour in the mill
was done to see if any channels were missing without any results. To be sure that there
weren’t any missing of air channels more knowledge and time is needed. Since this master
thesis was carried out during 20 weeks there wasn’t time to just spend on fulfilling the
balances, other calculations were also needed.
Further measurements need to be made to be for sure if the results are reliable and to validate
that the leakage air is too high. From this more accurate evaluations can be made if
interventions are necessary for the leakage air. Hopefully the results of mass- and energy

61
balances will fulfills each other better without adjusting the values as much as has been done
now.
Andritz which is a company that designed the drying hood used at Nymölla Mill were at visit
where the air balance was discussed. After discussion with personnel at the mill and with
Andritz [46] about the high leakage air and comparing the results with earlier studies, it is
indicated that the zero level is too high and need to be adjusted for decreasing the leakage air.
Which means that the observed results about the high leakage air is pointed in correct
direction, but still further accurate measurements need to be made that take the openings of
the damper in consideration and make sure of that no air channels are missed.
Even when measuring the air humidity with a wet and a dry thermometer there are some
factors that could have caused some errors in the results. Like the thermometers are not
calibrated which could give wrong values of the temperatures when measuring and also
reading of the temperatures when they are not stable. The measured dry- and wet temperature
are then used for deciding the air humidity in the Mollier chart for humid air which will give a
reading error of the humidity. This would then more or less affect the water balance since the
humidity of the air could be higher or lower. To sum up, one error during measuring will give
more error when deciding the air humidity in the Mollier chart. To be more accurate about the
calibration of the thermometers, at least two thermometers could have been used to compare
the measured temperatures.
For the steam- and condensate balance it is seen that the condensate flow from the condensate
tanks is much higher than the inlet steams which is not correct for the balance according to
equation 3.2. The steam flows are read from a steam indicator and for the condensate flows,
the pressures and power are measured and the condensate flow is then decided from a pump
curve. It is more reliable to use the steam flows therefore the condensate flows has been
adjusted from the steam flow in a way that they keep the same percent of the total condensate
flow. A factor of why the condensate flow is incorrect is because the information about the
pump wheel is false. It is assumed here that the given information was correct; therefore the
given diameter for the pump wheel was used for deciding the volume flow in the pump curve
and this would then affect the results. Also if uncalibrated instruments are used when
measuring the current or the pressure would give errors for the results. Further measurements
for the condensate flows need to be made since they are now adjusted from the steam flows.
When calculating the specific steam consumption it is seen that the value is higher than the
theoretical value for evaporation of 1 kg water at 70 ºC (ΔHvap=2333 kJ/kg). It is seemed that
there is potential for energy savings since this value could be lowered. This value is based on
estimated moisture content for the paper web and read values from the steam indicators. To be
really sure that the calculated specific steam consumption is correct it is need to be sure that
the steam indicators are calibrated and shows correct values and that the estimated moisture
content for the paper web is correct.
What also needs to be taken in consideration is that the steam flows varies over the time for
different parameters which will give varying specific steam consumption. Overall what has

62
affected the results is that there are many parameters that are dependent on each other, like the
paper quality and the actual grammage for the paper.
In this master thesis the measurements has been done on paper with a weight basis of 80 g/m2
but with different qualities since it was hard to limit to only one quality because of the time.
The different qualities require different processing and would therefore give different results
when measuring. Also during calculation the actual weight of the paper hasn’t been taken in
consideration were the set point for paper is used which then give some errors when
calculating the amount evaporated water. Because of the different qualities of the paper
during measuring the results are not completely correct and would give some errors since the
measured parameters (air humidity, air flow, moisture content etc.) should be used for the
same quality.
6.2 Conclusions
The set up mass- and energy balances fulfills each other pretty well of what goes in comes out
after the outgoing air flow has been adjusted. The power that goes in to the pre-drying section
is 40 119 kW and what comes out is 39 955 kW, this give a difference of 0.4 %. For the after-
drying the inlet power is 13 291 kW and the outlet power is 14 676 kW. This corresponds to a
different of 9.4 % for the energy balance in the after drying section. Since the energy balances
differ less than 10 % it is seemed that there are no losses and all the inlet power is utilized.
This is observed when the adjusted exhaust air flows were used to fulfill the water balance.
The observed air balances from the measurements were compared to earlier reports for the air
balances. Both the measured results and the results in earlier reports showed that the hood air
balance wasn’t optimal in relation to the supply- and exhaust air.
From the Sankey diagrams it is seen that the leakage air make up the highest mass flow in to
the drying sections. This leakage air don’t necessary need to be this high and by reducing the
air from 57.2 kg/s to 28.6 kg/s in the pre-drying section and from 44.5 kg/s to 18.8 kg/s in the
after-drying section, an economical saving of total 3.8 million SEK/year could be made. This
economical saving is observed if a supply air fan is installed or by increasing the engine speed
for the supply air fans that already exists in the pre-drying section, since this will reduce the
amount of leakage air by decreasing the zero level. If the amount leakage air is reduced then
the amount steam can also be decreased.
The mass- and energy balances are calculated from a script built in the software MATLAB,
where the measured parameters are filled in and the answers from one section is dependent on
the previous answer. Therefore changes of parameters would easy give new values for the
mass- and energy balances. This script can be used when changing parameters to see if the
changing gave better results for mass- and energy balances. Like investigate if an extra air fan
would decrease the leakage air.
The drying hood is a complex process where the mass- and energy balances are dependent on
every little tiny change. This makes it hard to come up with a clear solution of what can be
done for minimizing the power consumption. However, according to the mass- and energy
balances that were set up instantaneous it shows that reducing leakage air would give energy

63
savings but further and more measurements over a longer period needs to be made for better
accuracy.
But the observed results are still usable to give an insight of what suggestions could be done
for energy savings, in this case, reduce the leakage air flow. But exactly how much this should
be reduced need more evaluations.

64
7. Future work The suggestions of how the work done in this master thesis can be continued are presented in
this chapter, where focus has been on how to find more energy savings opportunities.
In order to find more energy saving opportunities further evaluations can be made for the air
humidity of the exhaust air. There are set points for the air humidity’s but if they are the
optimal values need to be evaluated, since higher air humidity’s allowed more heat to be
recovered and less steam is needed. But there’s a limit of how high this humidity is allowed
to be before it turns and more steam is instead needed. To evaluate the optimal exhaust air
humidity changes of the set point for the air humidity could be done and then see how much
steam that is needed for different values.
Evaluation of need of isolation for the air channels is a way of finding energy savings, where
it is seen that some air channels were only isolated half ways and some channels didn’t have
any isolation. By isolation the air channels, the air is prevented from condensing or cooling.
When the supply air keeps its higher temperature less steam is needed for heating the supply
air since isolation gives less loss of heat. Also the humid air condenses easier since the more
water in the air gives less range down to the saturated line in the Mollier chart for humid air.
At this point dew is observed. The benefit of using isolation in this process should be
investigated and if it is really necessary.
More time can be spent on the mass- and energy balances, especially the air-, water, and
steam- condensate balances and try to fulfill these better which would give less adjustments,
where the balances differed a lot in these measurements.
The drying hood is dependent on the steps before the paper comes to the dryer. By optimizing
the pressing section that would give lower moisture content before the paper web goes in to
the pre-drying section. This would give an energy saving in the pre-drying section. A thumb
of rule is that 1 % increase in the dry matter content would give an energy saving of 4-5 % in
the pre-drying section [7, 23]. Also investigation can be made for the air in the hall since the
supply air in to the drying hood is taken from the hall. Therefore it is important that the
ventilation in the hall is optimal because this would affect the drying.
Since everything is dependent on each other it is important to evaluate the different steps in
the process to get the optimal condition.

65
8. Table of abbreviations Table 30-Symbols
Symbol Description Unit
T Temperature °C G Mass flow rate kg/s X Air moisture content kg water/kg dry air Q Power W Cp Specific heat kJ/kg °C ΔHvap Latent heat of evaporation kJ/kg b Paper web width m v Velocity m/s W Basis weight paper – Dry
material g/m2
m Mass flow rate kg/s MR Moisture ratio - DMC Dry matter content - MC Moisture content - p Pressure Pa Δp Pressure difference Pa A Area m2
F Volume flow m3
ρ Density humid air kg humid air/m3 humid air ρt Dry density kg dry air/m3 humid air Tv Wet bulb temperature °C pt Pressure after the pump Pa ps Pressure before the pump Pa Hpump Head m g Gravity constant 9.82 m/s2 Paxial Axial power W ŋ Efficiency - I Current Ampere U Voltage Volt cos φ Power factor - Pengine Electrical power W Pi0 Steam pressure component i mbar DS Dry substance - S Concentration starch g/m2
yair Percent air flow % ρH2O Density liquid water kg/m3
ycond Percent condensate flow % ΔT Temperature difference °C x Percentage steam - C Cost SEK/year ΔQ Power difference W Gi Investment cost SEK a Cash surplus SEK/year

66
Table 31-Subscripts
Symbol Description
s Steam
cyl Cylinder
in Inlet
out Outlet
p Paper
c Condensate
bt Blow through steam
sup Supply air
leak Leakage air
exh Exhaust air
evap Evaporation
fib Fiber
i Measure point index
H2O(l) Liquid water
air Air
H2O(g) Water vapor
mach Machine
pump Pump
engine Engine
liq Liquid
starch Starch
hall Hall paper machine
ctj Condensate tank number j
1 Before
2 After
lp Low-pressure steam
mp Middle-pressure steam
flash Flash steam
tot Total
red Reduced
aph Air-preheater surf Surface condenser
67
Bibliography
[1] Stora Enso, Guidetur- Massafabriken. [Internal material], Nymölla: Stora Enso.
[2] Stora Enso, "Ledning och organisation," 2016. [Online]. Available:
http://www.storaenso.com/lang/sweden/About/Pages/management-and-organisation.aspx.
[Accessed 23 February 2016].
[3] Stora Enso, Vad gör vi i Sverige? [Brochure], Stora Enso.
[4] Stora Enso, Miljöredovisning [Brochure], Nymölla: Stora Enso, 2014.
[5] Stora Enso, Guidetur-Pappersbruket [Internal material], Nymölla: Stora Enso.
[6] Stora Enso, Flödesschema pappersmaskin [Internal material], Nymölla: Stora Enso, 2016.
[7] G. G. (red.), Finpapper Y304, Markaryd: Sveriges Skogsindustriförbund.
[8] P.-A. Olsson, Interviewee, Manager energy technology, Stora Enso, Nymölla. [Interview]. May
2016.
[9] L. Eriksson, Development engineer, Nymölla: Stora Enso, 2016.
[10] Stora Enso, 1.0 Pressparti [Internal material], Nymölla: Stora Enso, 2013.
[11] Stora Enso, 2.0 Torkparti. [Internal material], Nymölla: Stora Enso, 2013.
[12] M. Karlsson, Papermaking Part2, Drying, 9 ed., Helsinki: Fapet Oy, 2001.
[13] N. J. (red.), Energikompendium för massa- och pappersindustrin X-721, Markaryd: Sveriges
Skogsindustriförbund, 1986.
[14] Stora Enso, 2.1 Ång- och kondensatsystem. [Internal material], Nymölla: Stora Enso, 2013.
[15] S. Stenström, Drying of paper, Lund: Department of Chemical Engineering.
[16] Stora Enso, Ånggrupptillhörighet PM1. [Internal material], Nymölla: Stora Enso, 2006.
[17] Stora Enso, 2.2 Ventilation och värmeåtervinning. [Internal material], Nymölla: Stora Enso,
2013.
[18] I. Rydell, Värmeåtervinning vid pappers- och massatorkning.
[19] Stora Enso, 3.0 Sizer. [Internal material], Nymölla: Stora Enso, 2013.
[20] Stora Enso, 4.0 Kalendrering. [Internal material], Nymölla: Stora Enso, 2013.

68
[21] Stora Enso, 5.0 Upprullning. [Internal material], Nymölla: Stora Enso, 2013.
[22] Energimyndigheten, ”Vägledning för energikartläggning i stora företag,” Energimyndigheten,
Bromma, 2015.
[23] SFS 2014:266, Energikartläggning i stora företag, Stockholm: Miljö- och energidepartementet,
2014.
[24] E. Andersson, A. Åsblad, P.-Å. Franck och D. Olsson, ”Vägledning för Energikartläggning i
tillverkande industri,” CIT Industriell Energi AB, 2016.
[25] Energimyndigheten, "Energikartläggning," 2016. [Online]. Available:
http://www.energimyndigheten.se/energieffektivisering/foretag-och-
organisationer/energikartlaggning/. [Accessed 11 February 2016].
[26] P. Atkins and P. Julio de, Physical Chemistry, 9 ed., Oxford: W.H Freeman and Company, 2010.
[27] R. M. Murphy, Introduction to Chemical Processes: Principles, Analysis, Synthesis, New York:
McGraw-Hill, 2007.
[28] L. Yugang, L. Huanbin and T. Jinsong, "Process Parameters Optimization for Energy Saving in
Paper Machine Dryer Section," Drying Technology , pp. 910-917, 2011.
[29] C. Hua-Wei, H. Chung-Hsuan och H. Gui-Bing, ”The case study of energy flow analysis and
strategy in pulp and paper industry,” Energy policy, vol. 43, pp. 448-455, 2012.
[30] L. Jigeng, K. Lingbo and L. Huanbin, "Dryer Section Energy System Measurement and Energy-
Saving Potential Analysis for a Paper Machine," State Key Laboratory of Pulp and Paper
Engineering.
[31] H. Gui-Bing, M. Chih-Ming , C. Hua-Wei , C. Kai-Jen, C. Chang-Tang och S. Te-Li, ”Energy
flow analysis in pulp and paper industry,” Energy , vol. 36, pp. 3063-3068, 2011.
[32] K. Lingbo and L. Huanbin, "A Static Energy Model of Concentional Paper Drying for
Multicylinder Paper Machines," Drying Technology , pp. 276-296, 2012.
[33] Separationsprocesser, ”Kompletterande kompendium om separationsprocesser,” Department of
Chemical Engineering, Lund, 2013.
[34] B. Nilsson, Transportprocesser, Lund: Department of Chemical Engineering, 2012.
[35] I. Rydell, Pappersmaskinens torkluftsystem samt metoder att öka torkkapaciteten.
[36] SFS 2014:347, Förordning om energikartläggning i stora företag, Stockholm: Miljö- och
energidepartementet, 2014.
[37] N. Eskilsson, D. Hansevi, E. Memic, B. Munksten and L. Nilsson, "Arbetsbeskrivning och mall
för energikartläggning och energiplan," Miljösamverkan Östergötland, 2009.

69
[38] Jernkontoret, "Energikartläggning," 2016. [Online]. Available:
http://www.energihandbok.se/energikartlaggning/. [Accessed 22 February 2016].
[39] Jernkontoret, "Formler och beräkningar," 2016. [Online]. Available:
http://www.energihandbok.se/formler-och-berakningar/. [Accessed 2 Mars 2016].
[40] M. Alveteg, Handbook, Lund: Department of Chemical Engineering, 2012.
[41] Stora Enso, Kvalitetskort PM [Internal material], Nymölla: Stora Enso, 2016.
[42] S.-E. Mörtstedt, Data och diagram- Energi- och kemitekniska tabeller, 7 ed., Stockholm: Liber
AB, 2010.
[43] O. Svensson, Interviewee, Senior engineer, Stora Enso, Nymölla. [Interview]. 2016.
[44] O. Wallberg, Mollier h,s-Diagram, Lund: Department of Chemical Engineering.
[45] P. Björnsson, ”Investeringsbedömning,” Institutionen för teknisk ekonomi och logistik, Lund,
2005.
[46] Andritz, Interviewee, Ventilation. [Interview]. 17 May 2016.


i
Appendix A – Heat transferring from steam to paper web When the steam hits the condensate inside the cylinder heat is transferred from the steam
through the condensate with convection/conduction and the heat flux from the steam to the
condensate is calculated as below:
(A.1)
The heat from the condensate is then transferred through the cylinders wall by conduction and
with Fourier’s law the heat flux through the wall can be calculated if it is assumed that the
media is homogenous. For this, the thermal conductivity coefficient λcyl is needed and the
thickness for the cylinders wall bcyl.
(A.2)
The heat transfer from the cylinder to the paper web occurs by conduction and is calculated
with a contact heat transfer coefficient that takes the resistance of air between the paper web
and cylinder in consideration. With this the heat flux can be decided as following:
(A.3)
Rewriting of all the formulas A.1-A.3 above the total heat flux from the cylinder is [15]:
(A.4)
The energy that is transferred to the paper from the steam must be equal to the energy that is
needed for evaporating the water in the paper. This evaporating energy for the paper is the
product of the rate of mass transfer from a wet paper surface and the latent heat of
evaporation. With Stefan’s equation the rate of mass transfer from a wet paper surface can be
calculated as following equations A.5-A.8 below shows:
(A.5)
– (A.6)
(A.7)
(A.8)
And with the equations A.5-A.8 the energy required for evaporating water from the paper can
be written as equation A.9 below [15]:
(A.9)
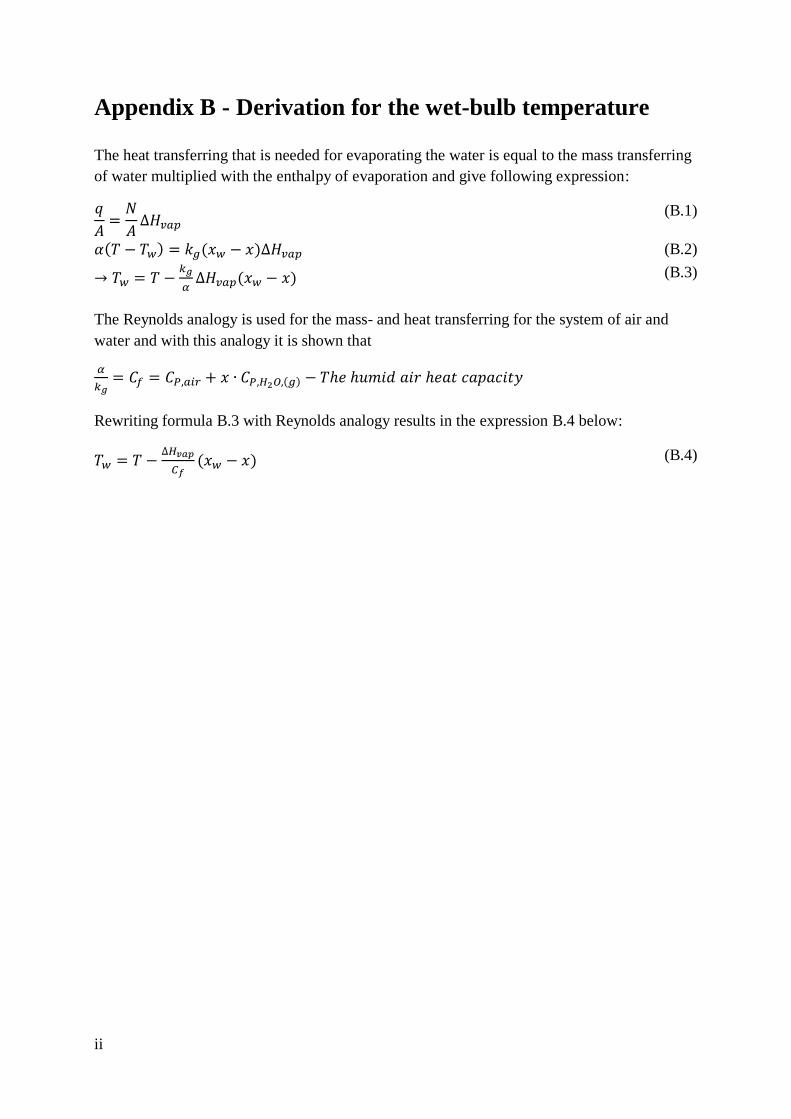
ii
Appendix B - Derivation for the wet-bulb temperature
The heat transferring that is needed for evaporating the water is equal to the mass transferring
of water multiplied with the enthalpy of evaporation and give following expression:
(B.1)
(B.2)
(B.3)
The Reynolds analogy is used for the mass- and heat transferring for the system of air and
water and with this analogy it is shown that
Rewriting formula B.3 with Reynolds analogy results in the expression B.4 below:
(B.4)

iii
Appendix C – Shrinkage of paper
Figure C. 1 – The shrinkage of paper through the paper machine

iv
Appendix D – Mollier chart for deciding air humidity
Figure D. 1-Mollier chart for humid air

v
Appendix E – Steam flows for drying section
Steam flows for both the pre-drying section and after-drying section are read from Metso
DNA at page 8.1 PM1 and the read values are shown in Table E. 1 respectively Table E. 2.
Table E. 1- The steam flows in to the pre-drying section
Steam type Pre-drying [t/h]
Date the values were used
Middle pressure 24 2016-04-19 Low pressure 15.3 2016-04-19
Table E. 2 The steam flows in to the after-drying section
Steam type After-drying [t/h]
Date the values were used
Middle pressure 0 2016-04-29 Low pressure 6.3 2016-04-29
Where the middle-pressure steam should go in to is decided with valves. When reading the
middle-pressure steam in Metso DNA at page 8.1 PM1 it gives the total value of the produced
middle-pressure steam. How much of the middle-pressure steam that goes in to the pre-drying
section, respectively the after-drying section needs to be check with the valves in each
section. For the case 2016-04-19 the total production of middle-pressure steam was 24 t/h but
the valves at the after-drying section where the middle-pressure steam comes in were closed.
In the pre-drying section the valves where opened. This means that all the produced middle-
pressure steam goes in to the pre-drying section this day.
Figure E. 1 shows a simplification for the valves for the middle-pressure steam in the pre-
drying section and after-drying.
Valve Valve
Figure E. 1- Simplification of distribution of the middle-pressure steam in the drying section
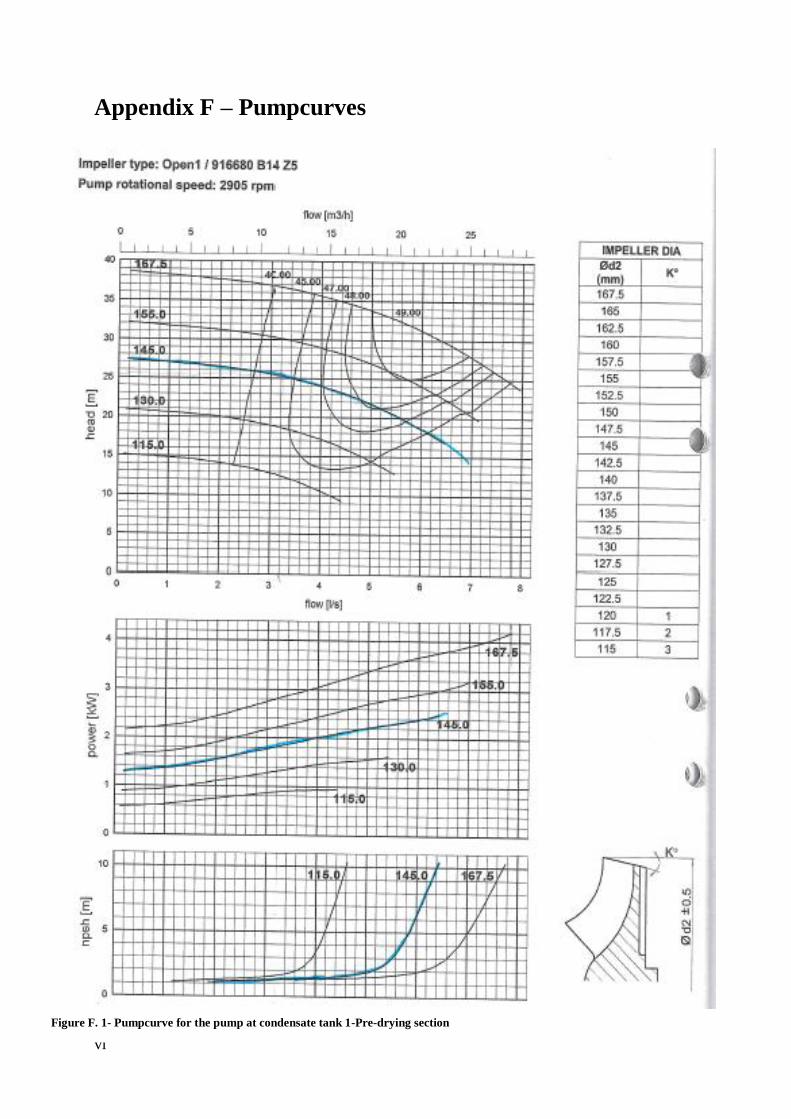
vi
Appendix F – Pumpcurves
Figure F. 1- Pumpcurve for the pump at condensate tank 1-Pre-drying section

vii
Figure F. 2- Pumpcurve for the pump at condensate tank 2-Pre-drying section

viii
Figure F. 3- Pumpcurve for the pump at condensate tank 5-After-drying section

ix
Figure F. 4- Pumpcurve for the pump at condensate tank 6 – After-drying section
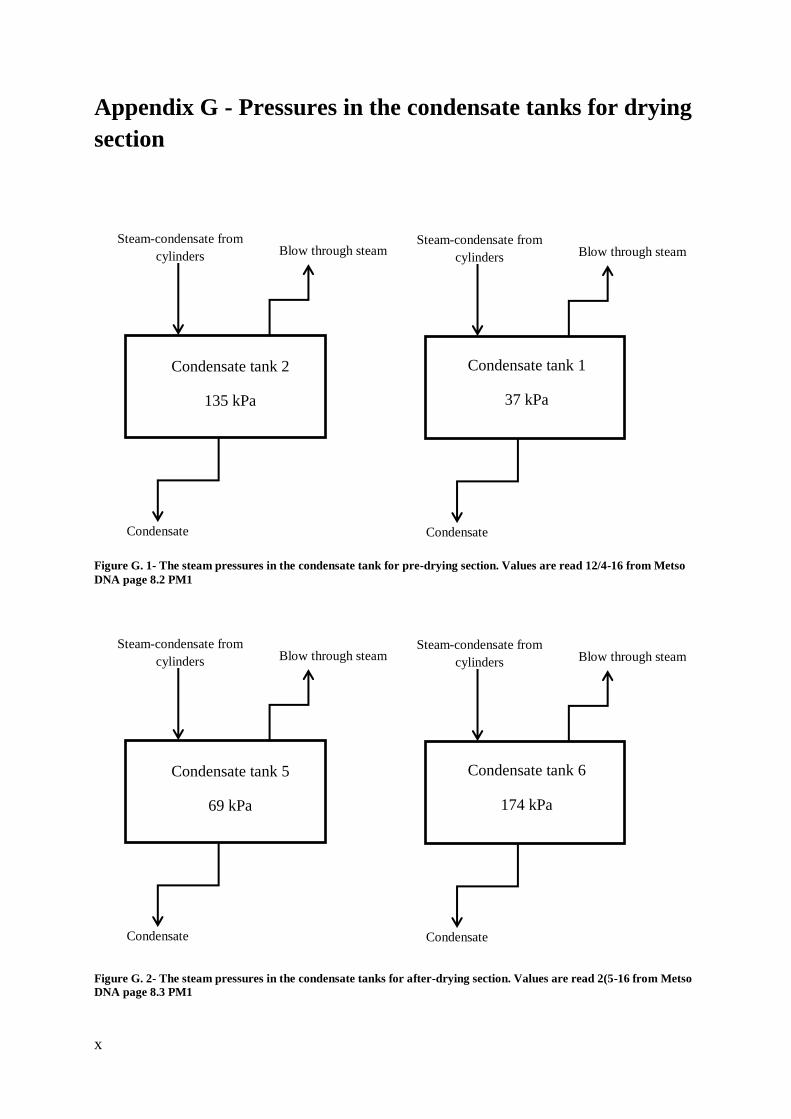
x
Appendix G - Pressures in the condensate tanks for drying
section
Condensate
Condensate tank 5
69 kPa
Steam-condensate from
cylinders
Blow through steam
Condensate tank 6
174 kPa
Condensate
Steam-condensate from
cylinders
Blow through steam
Condensate
Condensate tank 2
135 kPa
Steam-condensate from
cylinders
Blow through steam
Condensate tank 1
37 kPa
Condensate
Steam-condensate from
cylinders
Blow through steam
Figure G. 1- The steam pressures in the condensate tank for pre-drying section. Values are read 12/4-16 from Metso
DNA page 8.2 PM1
Figure G. 2- The steam pressures in the condensate tanks for after-drying section. Values are read 2(5-16 from Metso
DNA page 8.3 PM1