energy and energy literacy in canada: a survey … energy & energy literacy, a survey... ·...
TRANSCRIPT
www.pol icyschool.ca
Volume 6•Issue 10• February 2013
ENERGY AND ENERGY LITERACY INCANADA: A SURVEY OF BUSINESSAND POLICY LEADERSHIP†
Michal C. Moore, André Turcotte, Jennifer Winter, P. Bernard Walp
SUMMARYLots of people have opinions about Canadian energy, how we use and export it, its costs and itsimpacts on the environment. In the end, however, it is leaders in business and policy circles whoseopinions can have a greater impact on influencing how the rest of us think about energy, andultimately, how our national energy picture eventually unfolds. Remarkably, however, a survey ofleaders in business and policy-making across the country finds that their knowledge aboutCanadian energy systems is not that much deeper or different than the Canadian public at large.Their opinions about how we should use, conserve and export energy are also strikingly similar.
Anyone presuming that leaders in business and policy have a firm understanding of howCanadians get their energy might be startled to discover that, in Ontario, Alberta, the Atlanticregion and Saskatchewan, a substantial fraction of these “elite” survey respondents incorrectlyidentify the primary resource used for energy in their province.
Nor are business and policy leaders the ardent free traders some of us might expect when itcomes to energy exports and imports. While an overwhelming majority (89 per cent) of surveyrespondents considered it important or at least somewhat important to decrease Canada’sreliance on the U.S. market for our exports, 56 per cent of those surveyed also advocated for moreCanadian energy independence, even if it meant reduced revenue for the Canadian economy. Notonly that, but they largely believed that eliminating energy imports and relying exclusively onCanadian sources would somehow result in an overall drop in energy costs.
Furthermore, a strong majority of policy-makers and business leaders had a general agreement thatit was worth bearing higher energy costs in the future if it resulted in better environmental quality.
Additionally, when it came to evaluating who they could trust for reliable information about energy,business and policy-making elites proved just about as skeptical as the general public when itcame to companies, industry groups and government officials, ranking all three fairly weakly ontrustworthiness. They saw academics and economic experts as slightly more trustable sources forinformation, though even those sources had limits. And while environmental and communitygroups and activists were given generally middling scores for trustworthiness, business leaders,interestingly enough, actually ranked these activist groups as just a bit more reliable than didpolicy-makers.
Finally, a clear preference in both groups was revealed for more planning and systematicallyadapting to changing energy markets and environmental conditions through the development ofsome form of public policy energy strategies.
† The authors are grateful to an anonymous referee whose comments substantially improved thispaper.
INTRODUCTION
Energy literacy is a term that reflects a composite of the consumer’s values and knowledgeregarding the energy system that supports daily activity in the home, commerce and industry.This survey and report complement an earlier pan-Canadian household survey that developedbaseline information regarding consumer attitudes, understanding of the energy system, anddemand characteristics exhibited by consumers. The second survey concentrates on business andpolicy leaders across the country, where the intent is to understand attitudes regarding energyuse as well as investments and practices that are related to overall energy demand. As well,since this survey is focused on those in leadership positions, we hope to understand more aboutthis cadre of respondents and their forecast for future costs and investment trends.
The importance of studying elite opinion has been repeatedly established in academic literature.One needs to go back to Vilfredo Pareto and Gaetano Mosca at the turn of the 20th century tosee a clear distinction made between elite and mass opinion. Theoretically, elite opinion isdeemed more influential as it possesses the capacity to affect policy decisions. Moreover, asLazarsfeld’s two-step “flow of communications” argues, elite opinion also has the ability toinfluence mass opinion. Hence, the importance of studying what elites1 think and know aboutspecific issues. Furthermore, as Hoffmann-Lange stated2: “compared to public opinion surveys,elite surveys have been relatively rare and the number of studies that have included both eliteand non-elite respondents is even smaller.” The current project was designed as a step towardsrectifying that situation, at least with regards to issues related to energy in Canada.
Background
In 2012, The School of Public Policy initiated a series of public opinion polls designed toinvestigate the level of public understanding and comprehension of energy issues throughoutCanada, effectively establishing a standard of energy literacy. The first survey3 targeted a broadselection of households throughout the country. It was followed by a special and limited surveyof Alberta voters4 who had recently voted in a pivotal provincial election, arguablyrepresentative of attitudes in the country’s most energy-focused province. This third surveyfocuses on a more limited but influential group: business and policy leaders throughout thecountry, including the territories.
The focus continues to be energy knowledge and opinions about use, but the results are useful inan entirely different way, since the individuals and groups surveyed represent an elite sub-section of the population, namely those who are opinion-makers and thought-leaders in society.The results describe yet another spectrum of energy literacy and public policy formation.
1 A group of people considered to be the best in a particular society or category.2 Ursula Hoffman-Lange, “Studying Elite vs Mass Opinion,” in The SAGE Handbook of Public Opinion Research, ed.
Wolfgang Donsbach and Michael W. Traugott (London: SAGE Publications, 2007).3 A. Turcotte, M.C. Moore and J. Winter, “Energy Literacy in Canada,” University of Calgary, The School of Public
Policy Research Papers 5, 32, (2012).4 M.C. Moore and J. Winter, “Green Jobs in Alberta,” Draft paper, The University of Calgary, School of Public Policy,
2013.
1
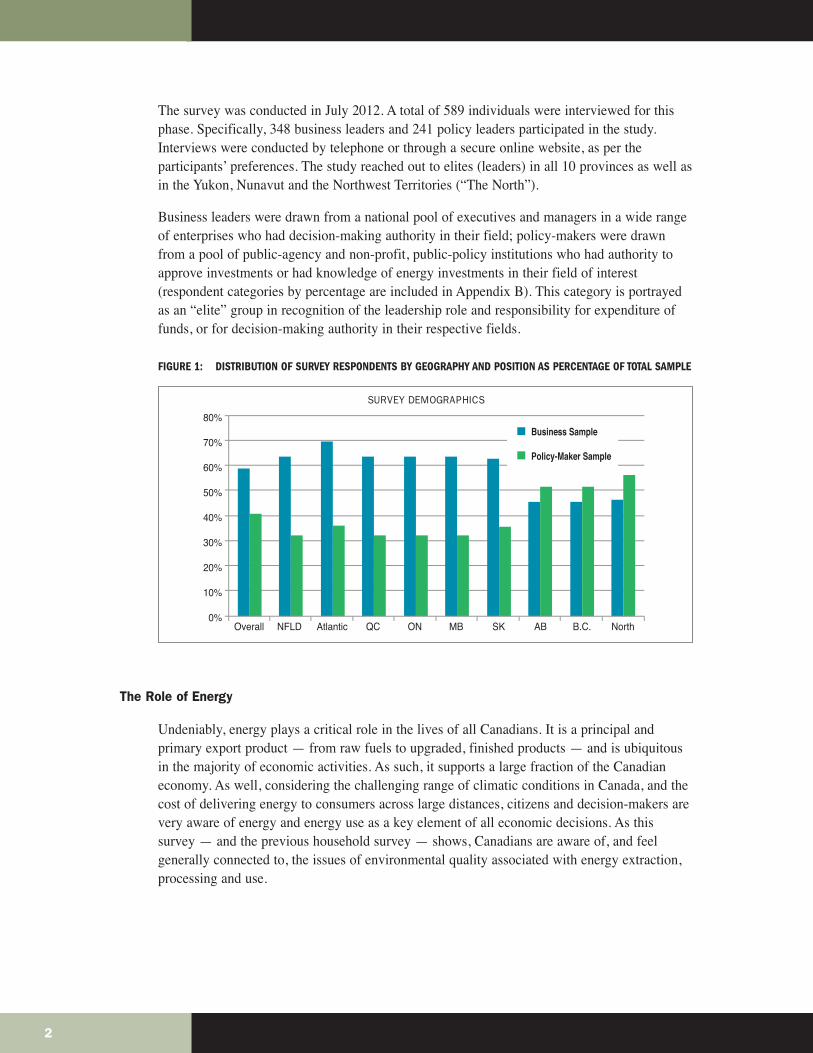
The survey was conducted in July 2012. A total of 589 individuals were interviewed for thisphase. Specifically, 348 business leaders and 241 policy leaders participated in the study.Interviews were conducted by telephone or through a secure online website, as per theparticipants’ preferences. The study reached out to elites (leaders) in all 10 provinces as well asin the Yukon, Nunavut and the Northwest Territories (“The North”).
Business leaders were drawn from a national pool of executives and managers in a wide rangeof enterprises who had decision-making authority in their field; policy-makers were drawnfrom a pool of public-agency and non-profit, public-policy institutions who had authority toapprove investments or had knowledge of energy investments in their field of interest(respondent categories by percentage are included in Appendix B). This category is portrayedas an “elite” group in recognition of the leadership role and responsibility for expenditure offunds, or for decision-making authority in their respective fields.
FIGURE 1: DISTRIBUTION OF SURVEY RESPONDENTS BY GEOGRAPHY AND POSITION AS PERCENTAGE OF TOTAL SAMPLE
SURVEY DEMOGRAPHICS
The Role of Energy
Undeniably, energy plays a critical role in the lives of all Canadians. It is a principal andprimary export product — from raw fuels to upgraded, finished products — and is ubiquitousin the majority of economic activities. As such, it supports a large fraction of the Canadianeconomy. As well, considering the challenging range of climatic conditions in Canada, and thecost of delivering energy to consumers across large distances, citizens and decision-makers arevery aware of energy and energy use as a key element of all economic decisions. As thissurvey — and the previous household survey — shows, Canadians are aware of, and feelgenerally connected to, the issues of environmental quality associated with energy extraction,processing and use.
2
80%
70%
60%
50%
40%
30%
20%
10%
0%
Business Sample
Policy-Maker Sample
Overall NFLD Atlantic QC ON MB SK AB B.C. North
Recent policy statements by the federal government suggest that the goal of Canada becominga world energy superpower5 is both accessible and desirable. This is a goal that cannot bereached without consistent, informed and sustainable public support. Implied in the previousstatement is the idea that citizens who are well informed about energy costs, access demands,reliability and externalities, will play a more positive role in the formation and implementationof energy policy, whether at the federal or provincial level. The upshot can be a broad,interconnected system of policy prescriptions, investment incentives and environmentalstandards that will stand for long periods of time with high levels of public support.
This paper is organized into five parts. First, we describe the public-opinion environment andthe level at which elites are concerned about energy. We then turn our attention to whatbusiness and policy leaders know about energy in various forms. The subsequent two sectionslook at policy concerns and future considerations. We are then in a position to drawconclusions about elite opinion on energy-related issues in Canada.
THE PUBLIC-OPINION ENVIRONMENT
Salient Concerns
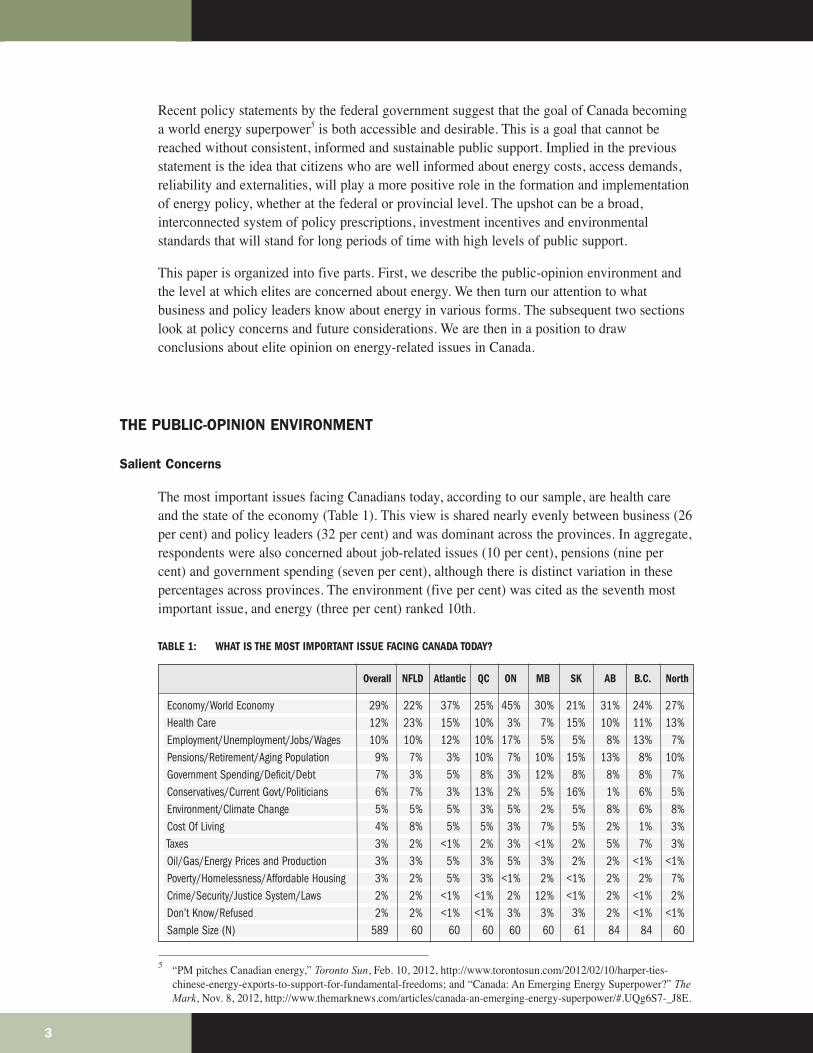
The most important issues facing Canadians today, according to our sample, are health careand the state of the economy (Table 1). This view is shared nearly evenly between business (26per cent) and policy leaders (32 per cent) and was dominant across the provinces. In aggregate,respondents were also concerned about job-related issues (10 per cent), pensions (nine percent) and government spending (seven per cent), although there is distinct variation in thesepercentages across provinces. The environment (five per cent) was cited as the seventh mostimportant issue, and energy (three per cent) ranked 10th.
TABLE 1: WHAT IS THE MOST IMPORTANT ISSUE FACING CANADA TODAY?
5 “PM pitches Canadian energy,” Toronto Sun, Feb. 10, 2012, http://www.torontosun.com/2012/02/10/harper-ties-chinese-energy-exports-to-support-for-fundamental-freedoms; and “Canada: An Emerging Energy Superpower?” TheMark, Nov. 8, 2012, http://www.themarknews.com/articles/canada-an-emerging-energy-superpower/#.UQg6S7-_J8E.
3
Economy/World Economy 29% 22% 37% 25% 45% 30% 21% 31% 24% 27%Health Care 12% 23% 15% 10% 3% 7% 15% 10% 11% 13%Employment/Unemployment/Jobs/Wages 10% 10% 12% 10% 17% 5% 5% 8% 13% 7%Pensions/Retirement/Aging Population 9% 7% 3% 10% 7% 10% 15% 13% 8% 10%Government Spending/Deficit/Debt 7% 3% 5% 8% 3% 12% 8% 8% 8% 7%Conservatives/Current Govt/Politicians 6% 7% 3% 13% 2% 5% 16% 1% 6% 5%Environment/Climate Change 5% 5% 5% 3% 5% 2% 5% 8% 6% 8%Cost Of Living 4% 8% 5% 5% 3% 7% 5% 2% 1% 3%Taxes 3% 2% <1% 2% 3% <1% 2% 5% 7% 3%Oil/Gas/Energy Prices and Production 3% 3% 5% 3% 5% 3% 2% 2% <1% <1%Poverty/Homelessness/Affordable Housing 3% 2% 5% 3% <1% 2% <1% 2% 2% 7%Crime/Security/Justice System/Laws 2% 2% <1% <1% 2% 12% <1% 2% <1% 2%Don’t Know/Refused 2% 2% <1% <1% 3% 3% 3% 2% <1% <1%Sample Size (N) 589 60 60 60 60 60 61 84 84 60
Overall NFLD Atlantic QC ON MB SK AB B.C. North
Latent Concerns
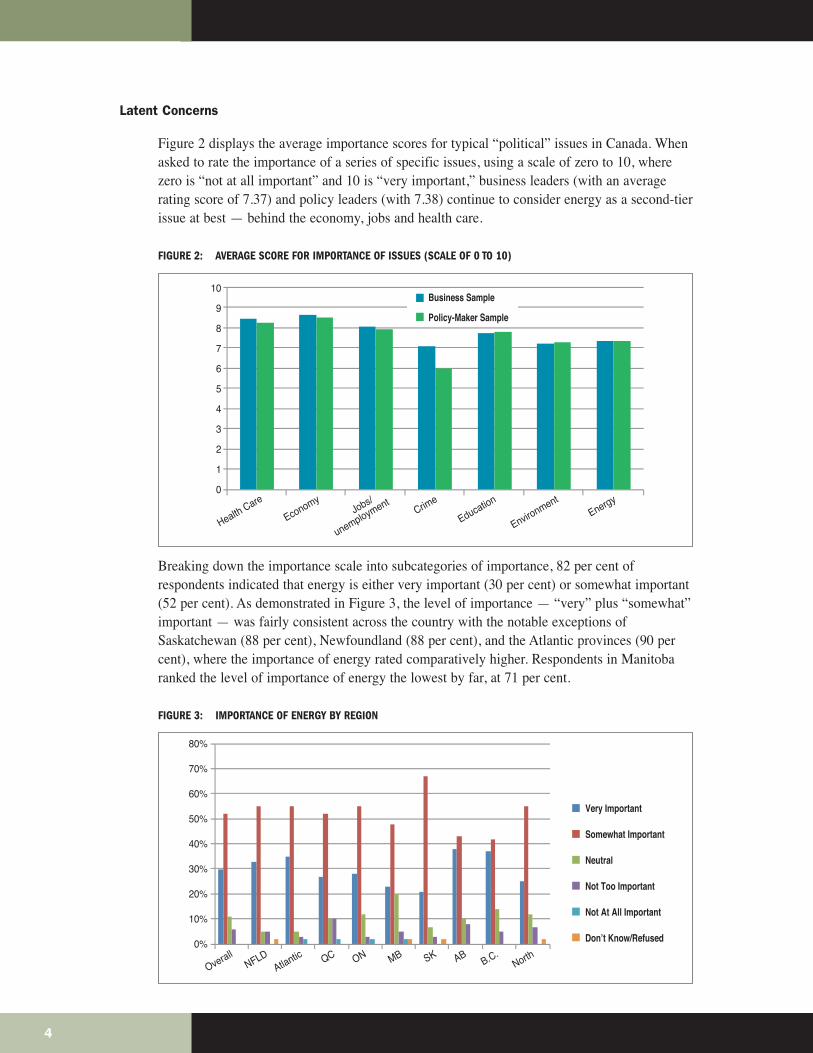
Figure 2 displays the average importance scores for typical “political” issues in Canada. Whenasked to rate the importance of a series of specific issues, using a scale of zero to 10, wherezero is “not at all important” and 10 is “very important,” business leaders (with an averagerating score of 7.37) and policy leaders (with 7.38) continue to consider energy as a second-tierissue at best — behind the economy, jobs and health care.
FIGURE 2: AVERAGE SCORE FOR IMPORTANCE OF ISSUES (SCALE OF 0 TO 10)
Breaking down the importance scale into subcategories of importance, 82 per cent ofrespondents indicated that energy is either very important (30 per cent) or somewhat important(52 per cent). As demonstrated in Figure 3, the level of importance — “very” plus “somewhat”important — was fairly consistent across the country with the notable exceptions ofSaskatchewan (88 per cent), Newfoundland (88 per cent), and the Atlantic provinces (90 percent), where the importance of energy rated comparatively higher. Respondents in Manitobaranked the level of importance of energy the lowest by far, at 71 per cent.
FIGURE 3: IMPORTANCE OF ENERGY BY REGION
4
10
9
8
7
6
5
4
3
2
1
0
Business Sample
Policy-Maker Sample
Health Care
Economy
Jobs/
unemploymentCrim
e
Education
EnvironmentEnergy
OverallNFLD
Atlantic QC ON MB SK ABB.C.
North
80%
70%
60%
50%
40%
30%
20%
10%
0%
Very Important
Somewhat Important
Neutral
Not Too Important
Not At All Important
Don’t Know/Refused
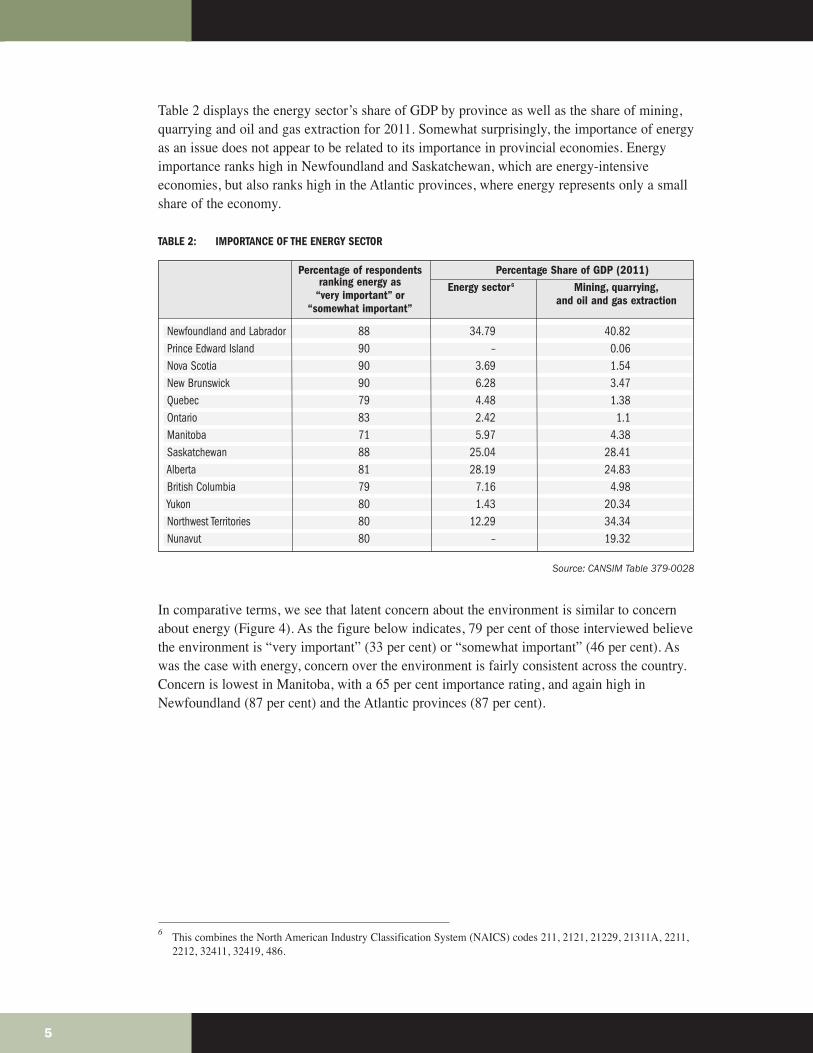
Table 2 displays the energy sector’s share of GDP by province as well as the share of mining,quarrying and oil and gas extraction for 2011. Somewhat surprisingly, the importance of energyas an issue does not appear to be related to its importance in provincial economies. Energyimportance ranks high in Newfoundland and Saskatchewan, which are energy-intensiveeconomies, but also ranks high in the Atlantic provinces, where energy represents only a smallshare of the economy.
TABLE 2: IMPORTANCE OF THE ENERGY SECTOR
Source: CANSIM Table 379-0028
In comparative terms, we see that latent concern about the environment is similar to concernabout energy (Figure 4). As the figure below indicates, 79 per cent of those interviewed believethe environment is “very important” (33 per cent) or “somewhat important” (46 per cent). Aswas the case with energy, concern over the environment is fairly consistent across the country.Concern is lowest in Manitoba, with a 65 per cent importance rating, and again high inNewfoundland (87 per cent) and the Atlantic provinces (87 per cent).
6 This combines the North American Industry Classification System (NAICS) codes 211, 2121, 21229, 21311A, 2211,2212, 32411, 32419, 486.
5
Newfoundland and Labrador 88 34.79 40.82Prince Edward Island 90 – 0.06Nova Scotia 90 3.69 1.54New Brunswick 90 6.28 3.47Quebec 79 4.48 1.38Ontario 83 2.42 1.1Manitoba 71 5.97 4.38Saskatchewan 88 25.04 28.41Alberta 81 28.19 24.83British Columbia 79 7.16 4.98Yukon 80 1.43 20.34Northwest Territories 80 12.29 34.34Nunavut 80 – 19.32
Percentage of respondents Percentage Share of GDP (2011)ranking energy as Energy sector6 Mining, quarrying,
“very important” or and oil and gas extraction“somewhat important”
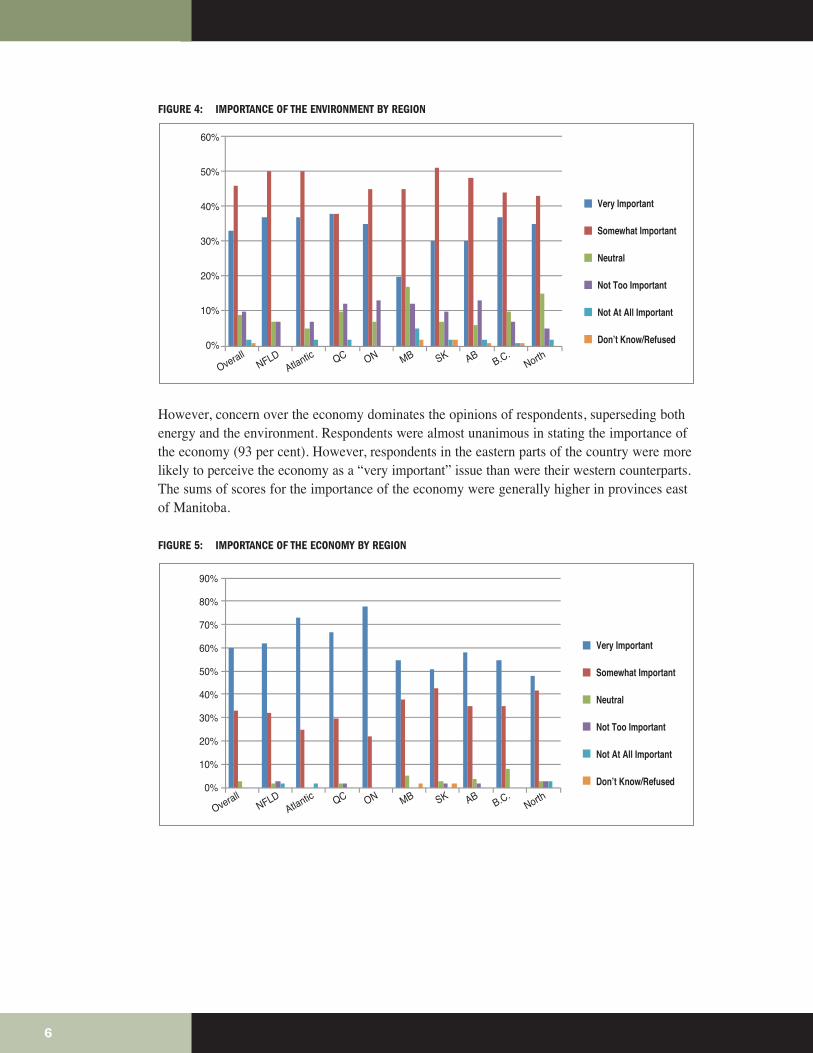
FIGURE 4: IMPORTANCE OF THE ENVIRONMENT BY REGION
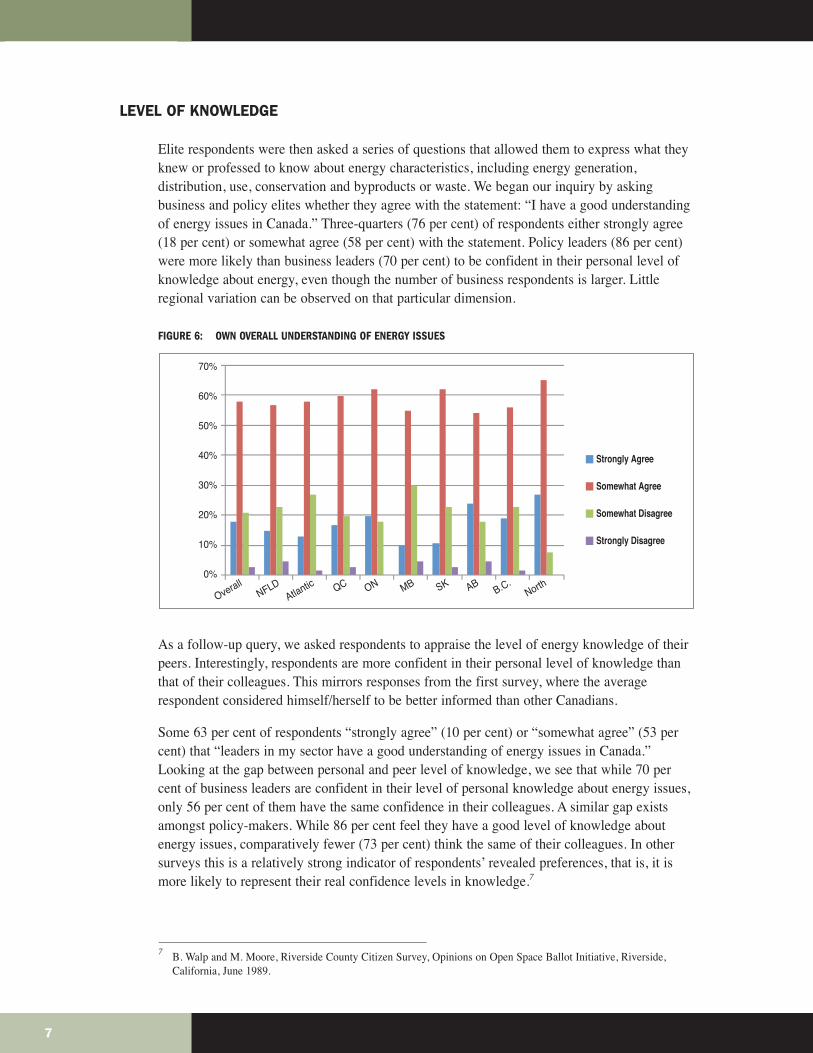
However, concern over the economy dominates the opinions of respondents, superseding bothenergy and the environment. Respondents were almost unanimous in stating the importance ofthe economy (93 per cent). However, respondents in the eastern parts of the country were morelikely to perceive the economy as a “very important” issue than were their western counterparts.The sums of scores for the importance of the economy were generally higher in provinces eastof Manitoba.
FIGURE 5: IMPORTANCE OF THE ECONOMY BY REGION
6
OverallNFLD
Atlantic QC ON MB SK ABB.C.
North
60%
50%
40%
30%
20%
10%
0%
Very Important
Somewhat Important
Neutral
Not Too Important
Not At All Important
Don’t Know/Refused
OverallNFLD
Atlantic QC ON MB SK ABB.C.
North
90%
80%
70%
60%
50%
40%
30%
20%
10%
0%
Very Important
Somewhat Important
Neutral
Not Too Important
Not At All Important
Don’t Know/Refused
LEVEL OF KNOWLEDGE
Elite respondents were then asked a series of questions that allowed them to express what theyknew or professed to know about energy characteristics, including energy generation,distribution, use, conservation and byproducts or waste. We began our inquiry by askingbusiness and policy elites whether they agree with the statement: “I have a good understandingof energy issues in Canada.” Three-quarters (76 per cent) of respondents either strongly agree(18 per cent) or somewhat agree (58 per cent) with the statement. Policy leaders (86 per cent)were more likely than business leaders (70 per cent) to be confident in their personal level ofknowledge about energy, even though the number of business respondents is larger. Littleregional variation can be observed on that particular dimension.
FIGURE 6: OWN OVERALL UNDERSTANDING OF ENERGY ISSUES
As a follow-up query, we asked respondents to appraise the level of energy knowledge of theirpeers. Interestingly, respondents are more confident in their personal level of knowledge thanthat of their colleagues. This mirrors responses from the first survey, where the averagerespondent considered himself/herself to be better informed than other Canadians.
Some 63 per cent of respondents “strongly agree” (10 per cent) or “somewhat agree” (53 percent) that “leaders in my sector have a good understanding of energy issues in Canada.”Looking at the gap between personal and peer level of knowledge, we see that while 70 percent of business leaders are confident in their level of personal knowledge about energy issues,only 56 per cent of them have the same confidence in their colleagues. A similar gap existsamongst policy-makers. While 86 per cent feel they have a good level of knowledge aboutenergy issues, comparatively fewer (73 per cent) think the same of their colleagues. In othersurveys this is a relatively strong indicator of respondents’ revealed preferences, that is, it ismore likely to represent their real confidence levels in knowledge.7
7 B. Walp and M. Moore, Riverside County Citizen Survey, Opinions on Open Space Ballot Initiative, Riverside,California, June 1989.
7
OverallNFLD
Atlantic QC ON MB SK ABB.C.
North
Strongly Agree
Somewhat Agree
Somewhat Disagree
Strongly Disagree
70%
60%
50%
40%
30%
20%
10%
0%
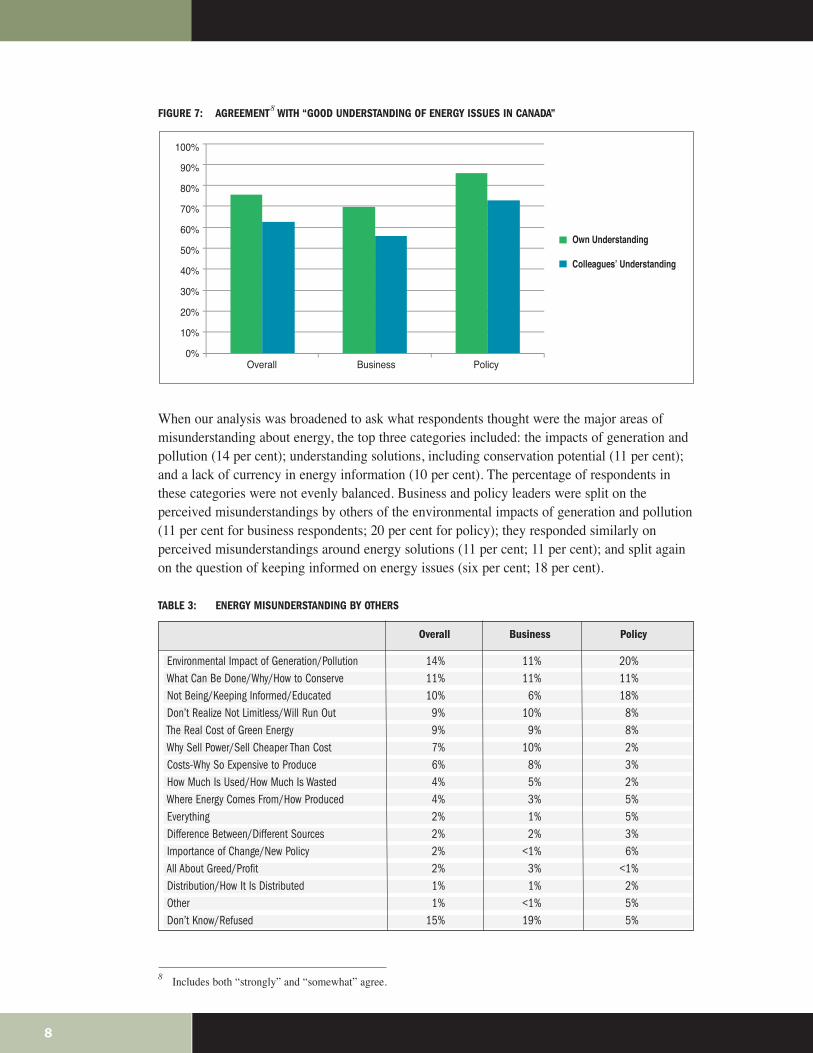
FIGURE 7: AGREEMENT8 WITH “GOOD UNDERSTANDING OF ENERGY ISSUES IN CANADA”
When our analysis was broadened to ask what respondents thought were the major areas ofmisunderstanding about energy, the top three categories included: the impacts of generation andpollution (14 per cent); understanding solutions, including conservation potential (11 per cent);and a lack of currency in energy information (10 per cent). The percentage of respondents inthese categories were not evenly balanced. Business and policy leaders were split on theperceived misunderstandings by others of the environmental impacts of generation and pollution(11 per cent for business respondents; 20 per cent for policy); they responded similarly onperceived misunderstandings around energy solutions (11 per cent; 11 per cent); and split againon the question of keeping informed on energy issues (six per cent; 18 per cent).
TABLE 3: ENERGY MISUNDERSTANDING BY OTHERS
8 Includes both “strongly” and “somewhat” agree.
8
100%
90%
80%
70%
60%
50%
40%
30%
20%
10%
0%Overall Business Policy
Own Understanding
Colleagues’ Understanding
Environmental Impact of Generation/Pollution 14% 11% 20%What Can Be Done/Why/How to Conserve 11% 11% 11%Not Being/Keeping Informed/Educated 10% 6% 18%Don’t Realize Not Limitless/Will Run Out 9% 10% 8%The Real Cost of Green Energy 9% 9% 8%Why Sell Power/Sell Cheaper Than Cost 7% 10% 2%Costs-Why So Expensive to Produce 6% 8% 3%How Much Is Used/How Much Is Wasted 4% 5% 2%Where Energy Comes From/How Produced 4% 3% 5%Everything 2% 1% 5%Difference Between/Different Sources 2% 2% 3%Importance of Change/New Policy 2% <1% 6%All About Greed/Profit 2% 3% <1%Distribution/How It Is Distributed 1% 1% 2%Other 1% <1% 5%Don’t Know/Refused 15% 19% 5%
Overall Business Policy
Knowledge of Specific Energy Characteristics
Energy issues are well reported and discussed in various media throughout Canada. This is notsurprising considering the role of energy in the economy, and the diversity of those reporting orcommenting allows a high degree of comparison and, ultimately, tests of veracity. Before weexplore the level of specific knowledge about energy amongst business and policy leaders, it isworth understanding where the elites in this country obtain their information on this topic andwhat they perceived as the gaps in the availability of pertinent information.
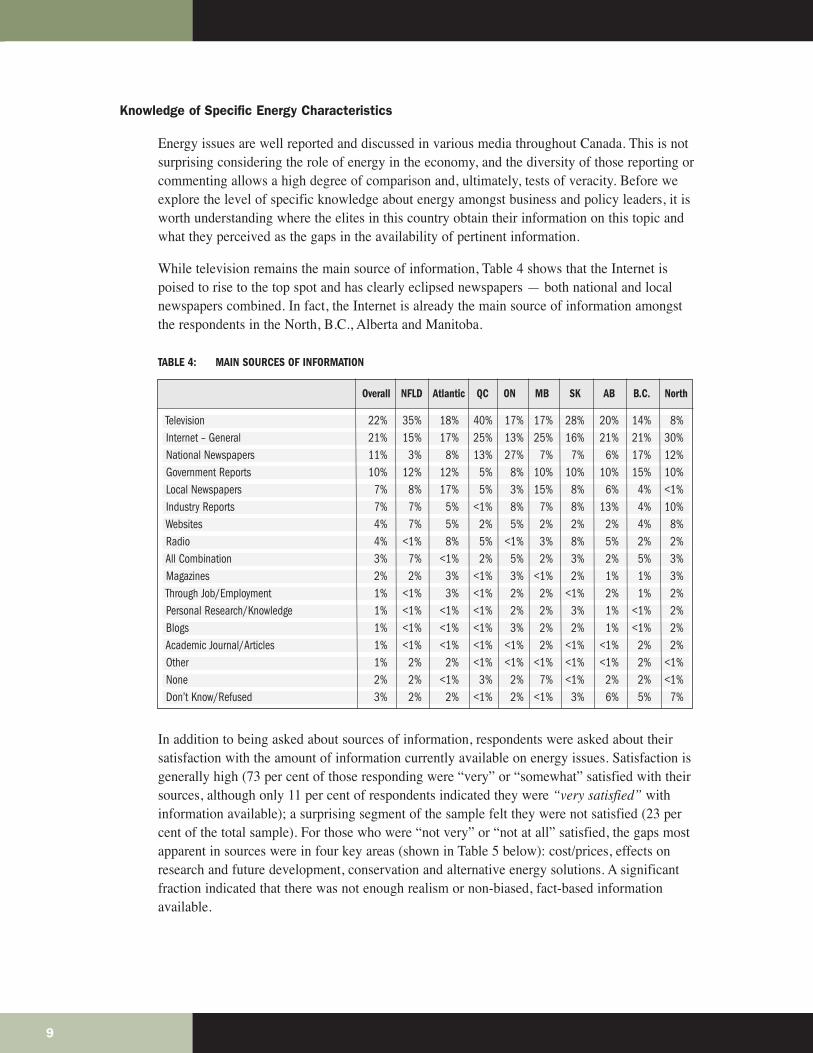
While television remains the main source of information, Table 4 shows that the Internet ispoised to rise to the top spot and has clearly eclipsed newspapers — both national and localnewspapers combined. In fact, the Internet is already the main source of information amongstthe respondents in the North, B.C., Alberta and Manitoba.
TABLE 4: MAIN SOURCES OF INFORMATION
In addition to being asked about sources of information, respondents were asked about theirsatisfaction with the amount of information currently available on energy issues. Satisfaction isgenerally high (73 per cent of those responding were “very” or “somewhat” satisfied with theirsources, although only 11 per cent of respondents indicated they were “very satisfied” withinformation available); a surprising segment of the sample felt they were not satisfied (23 percent of the total sample). For those who were “not very” or “not at all” satisfied, the gaps mostapparent in sources were in four key areas (shown in Table 5 below): cost/prices, effects onresearch and future development, conservation and alternative energy solutions. A significantfraction indicated that there was not enough realism or non-biased, fact-based informationavailable.
9
Television 22% 35% 18% 40% 17% 17% 28% 20% 14% 8%Internet – General 21% 15% 17% 25% 13% 25% 16% 21% 21% 30%National Newspapers 11% 3% 8% 13% 27% 7% 7% 6% 17% 12%Government Reports 10% 12% 12% 5% 8% 10% 10% 10% 15% 10%Local Newspapers 7% 8% 17% 5% 3% 15% 8% 6% 4% <1%Industry Reports 7% 7% 5% <1% 8% 7% 8% 13% 4% 10%Websites 4% 7% 5% 2% 5% 2% 2% 2% 4% 8%Radio 4% <1% 8% 5% <1% 3% 8% 5% 2% 2%All Combination 3% 7% <1% 2% 5% 2% 3% 2% 5% 3%Magazines 2% 2% 3% <1% 3% <1% 2% 1% 1% 3%Through Job/Employment 1% <1% 3% <1% 2% 2% <1% 2% 1% 2%Personal Research/Knowledge 1% <1% <1% <1% 2% 2% 3% 1% <1% 2%Blogs 1% <1% <1% <1% 3% 2% 2% 1% <1% 2%Academic Journal/Articles 1% <1% <1% <1% <1% 2% <1% <1% 2% 2%Other 1% 2% 2% <1% <1% <1% <1% <1% 2% <1%None 2% 2% <1% 3% 2% 7% <1% 2% 2% <1%Don’t Know/Refused 3% 2% 2% <1% 2% <1% 3% 6% 5% 7%
Overall NFLD Atlantic QC ON MB SK AB B.C. North
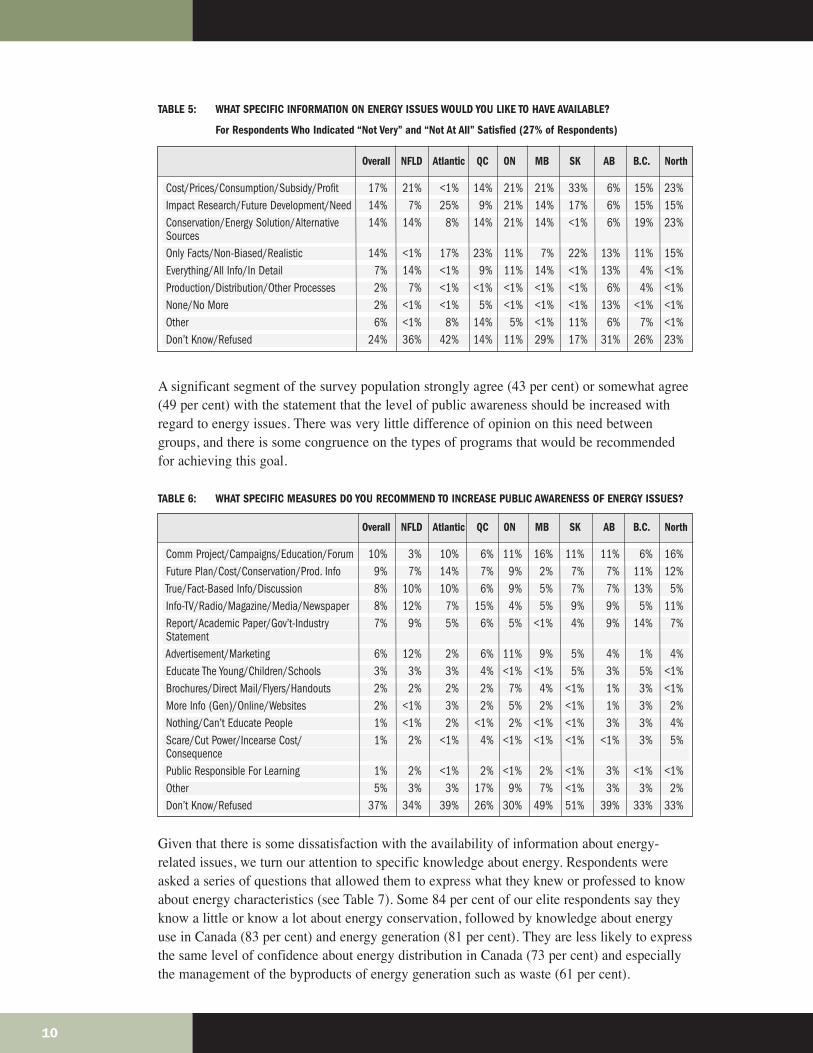
TABLE 5: WHAT SPECIFIC INFORMATION ON ENERGY ISSUES WOULD YOU LIKE TO HAVE AVAILABLE?
For Respondents Who Indicated “Not Very” and “Not At All” Satisfied (27% of Respondents)
A significant segment of the survey population strongly agree (43 per cent) or somewhat agree(49 per cent) with the statement that the level of public awareness should be increased withregard to energy issues. There was very little difference of opinion on this need betweengroups, and there is some congruence on the types of programs that would be recommendedfor achieving this goal.
TABLE 6: WHAT SPECIFIC MEASURES DO YOU RECOMMEND TO INCREASE PUBLIC AWARENESS OF ENERGY ISSUES?
Given that there is some dissatisfaction with the availability of information about energy-related issues, we turn our attention to specific knowledge about energy. Respondents wereasked a series of questions that allowed them to express what they knew or professed to knowabout energy characteristics (see Table 7). Some 84 per cent of our elite respondents say theyknow a little or know a lot about energy conservation, followed by knowledge about energyuse in Canada (83 per cent) and energy generation (81 per cent). They are less likely to expressthe same level of confidence about energy distribution in Canada (73 per cent) and especiallythe management of the byproducts of energy generation such as waste (61 per cent).
10
Cost/Prices/Consumption/Subsidy/Profit 17% 21% <1% 14% 21% 21% 33% 6% 15% 23%Impact Research/Future Development/Need 14% 7% 25% 9% 21% 14% 17% 6% 15% 15%Conservation/Energy Solution/Alternative 14% 14% 8% 14% 21% 14% <1% 6% 19% 23%SourcesOnly Facts/Non-Biased/Realistic 14% <1% 17% 23% 11% 7% 22% 13% 11% 15%Everything/All Info/In Detail 7% 14% <1% 9% 11% 14% <1% 13% 4% <1%Production/Distribution/Other Processes 2% 7% <1% <1% <1% <1% <1% 6% 4% <1%None/No More 2% <1% <1% 5% <1% <1% <1% 13% <1% <1%Other 6% <1% 8% 14% 5% <1% 11% 6% 7% <1%Don’t Know/Refused 24% 36% 42% 14% 11% 29% 17% 31% 26% 23%
Overall NFLD Atlantic QC ON MB SK AB B.C. North
Comm Project/Campaigns/Education/Forum 10% 3% 10% 6% 11% 16% 11% 11% 6% 16%Future Plan/Cost/Conservation/Prod. Info 9% 7% 14% 7% 9% 2% 7% 7% 11% 12%True/Fact-Based Info/Discussion 8% 10% 10% 6% 9% 5% 7% 7% 13% 5%Info-TV/Radio/Magazine/Media/Newspaper 8% 12% 7% 15% 4% 5% 9% 9% 5% 11%Report/Academic Paper/Gov’t-Industry 7% 9% 5% 6% 5% <1% 4% 9% 14% 7%StatementAdvertisement/Marketing 6% 12% 2% 6% 11% 9% 5% 4% 1% 4%Educate The Young/Children/Schools 3% 3% 3% 4% <1% <1% 5% 3% 5% <1%Brochures/Direct Mail/Flyers/Handouts 2% 2% 2% 2% 7% 4% <1% 1% 3% <1%More Info (Gen)/Online/Websites 2% <1% 3% 2% 5% 2% <1% 1% 3% 2%Nothing/Can’t Educate People 1% <1% 2% <1% 2% <1% <1% 3% 3% 4%Scare/Cut Power/Incearse Cost/ 1% 2% <1% 4% <1% <1% <1% <1% 3% 5%ConsequencePublic Responsible For Learning 1% 2% <1% 2% <1% 2% <1% 3% <1% <1%Other 5% 3% 3% 17% 9% 7% <1% 3% 3% 2%Don’t Know/Refused 37% 34% 39% 26% 30% 49% 51% 39% 33% 33%
Overall NFLD Atlantic QC ON MB SK AB B.C. North
11
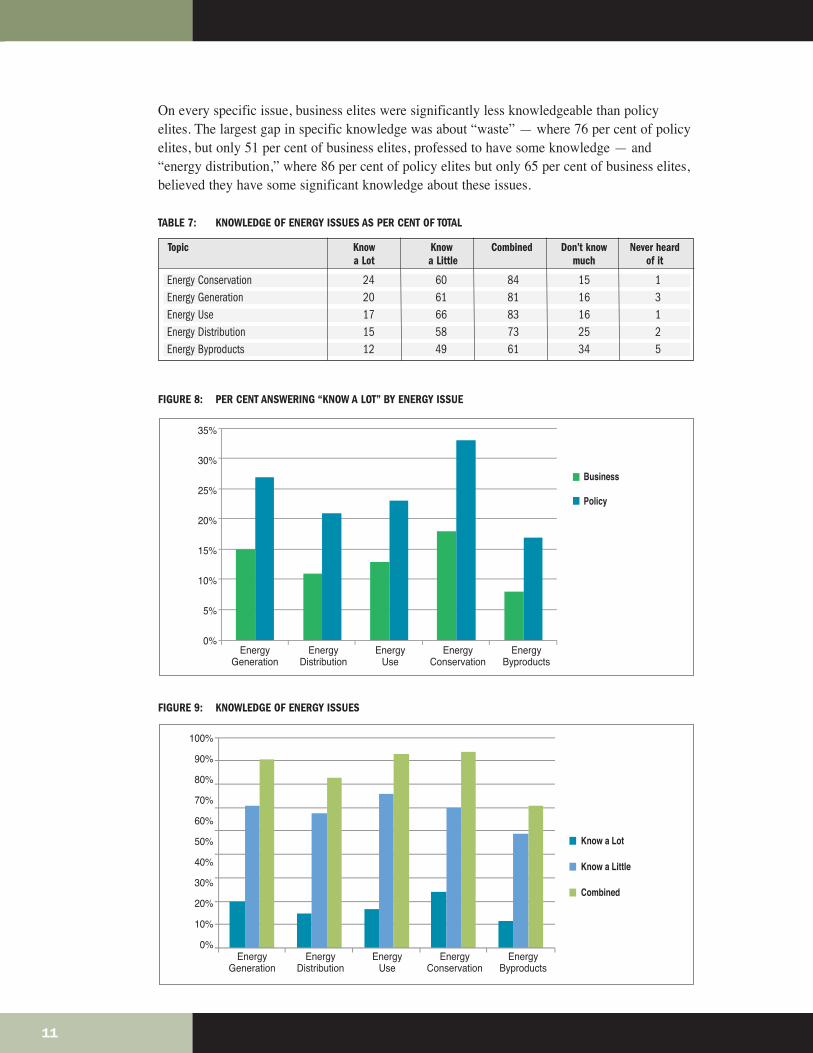
On every specific issue, business elites were significantly less knowledgeable than policyelites. The largest gap in specific knowledge was about “waste” — where 76 per cent of policyelites, but only 51 per cent of business elites, professed to have some knowledge — and“energy distribution,” where 86 per cent of policy elites but only 65 per cent of business elites,believed they have some significant knowledge about these issues.
TABLE 7: KNOWLEDGE OF ENERGY ISSUES AS PER CENT OF TOTAL
FIGURE 8: PER CENT ANSWERING “KNOW A LOT” BY ENERGY ISSUE
FIGURE 9: KNOWLEDGE OF ENERGY ISSUES
Energy Conservation 24 60 84 15 1Energy Generation 20 61 81 16 3Energy Use 17 66 83 16 1Energy Distribution 15 58 73 25 2Energy Byproducts 12 49 61 34 5
Topic Know Know Combined Don’t know Never hearda Lot a Little much of it
35%
30%
25%
20%
15%
10%
5%
0%Energy
GenerationEnergy
DistributionEnergy
UseEnergy
ConservationEnergy
Byproducts
Business
Policy
100%
90%
80%
70%
60%
50%
40%
30%
20%
10%
0%Energy
GenerationEnergy
DistributionEnergy
UseEnergy
ConservationEnergy
Byproducts
Know a Lot
Know a Little
Combined
Sources of Energy
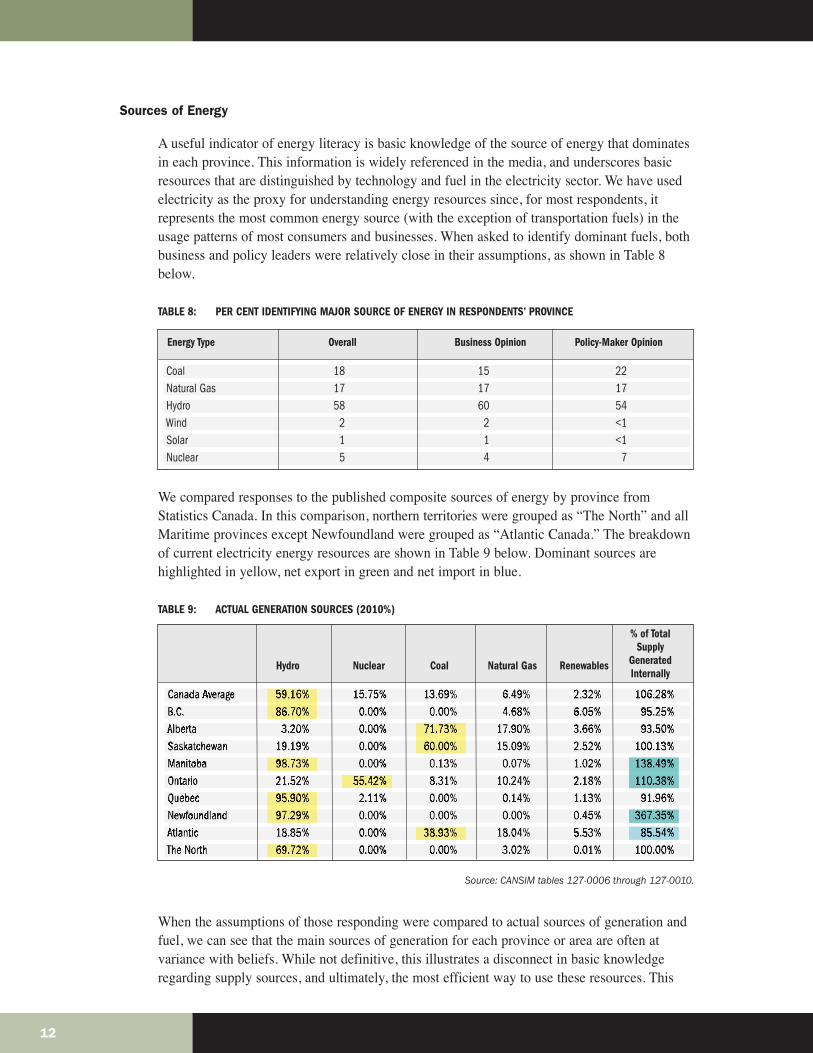
A useful indicator of energy literacy is basic knowledge of the source of energy that dominatesin each province. This information is widely referenced in the media, and underscores basicresources that are distinguished by technology and fuel in the electricity sector. We have usedelectricity as the proxy for understanding energy resources since, for most respondents, itrepresents the most common energy source (with the exception of transportation fuels) in theusage patterns of most consumers and businesses. When asked to identify dominant fuels, bothbusiness and policy leaders were relatively close in their assumptions, as shown in Table 8below.
TABLE 8: PER CENT IDENTIFYING MAJOR SOURCE OF ENERGY IN RESPONDENTS’ PROVINCE
We compared responses to the published composite sources of energy by province fromStatistics Canada. In this comparison, northern territories were grouped as “The North” and allMaritime provinces except Newfoundland were grouped as “Atlantic Canada.” The breakdownof current electricity energy resources are shown in Table 9 below. Dominant sources arehighlighted in yellow, net export in green and net import in blue.
TABLE 9: ACTUAL GENERATION SOURCES (2010%)
Source: CANSIM tables 127-0006 through 127-0010.
When the assumptions of those responding were compared to actual sources of generation andfuel, we can see that the main sources of generation for each province or area are often atvariance with beliefs. While not definitive, this illustrates a disconnect in basic knowledgeregarding supply sources, and ultimately, the most efficient way to use these resources. This
12
Coal 18 15 22Natural Gas 17 17 17Hydro 58 60 54Wind 2 2 <1Solar 1 1 <1Nuclear 5 4 7
Energy Type Overall Business Opinion Policy-Maker Opinion
Hydro Nuclear Coal Natural Gas Renewables
% of TotalSupply
GeneratedInternally
Canada Average 59.16% 15.75% 13.69% 6.49% 2.32% 106.28%B.C. 86.70% 0.00% 0.00% 4.68% 6.05% 95.25%Alberta 3.20% 0.00% 71.73% 17.90% 3.66% 93.50%Saskatchewan 19.19% 0.00% 60.00% 15.09% 2.52% 100.13%Manitoba 98.73% 0.00% 0.13% 0.07% 1.02% 138.49%Ontario 21.52% 55.42% 8.31% 10.24% 2.18% 110.38%Quebec 95.90% 2.11% 0.00% 0.14% 1.13% 91.96%Newfoundland 97.29% 0.00% 0.00% 0.00% 0.45% 367.35%Atlantic 18.85% 0.00% 38.93% 18.04% 5.53% 85.54%The North 69.72% 0.00% 0.00% 3.02% 0.01% 100.00%
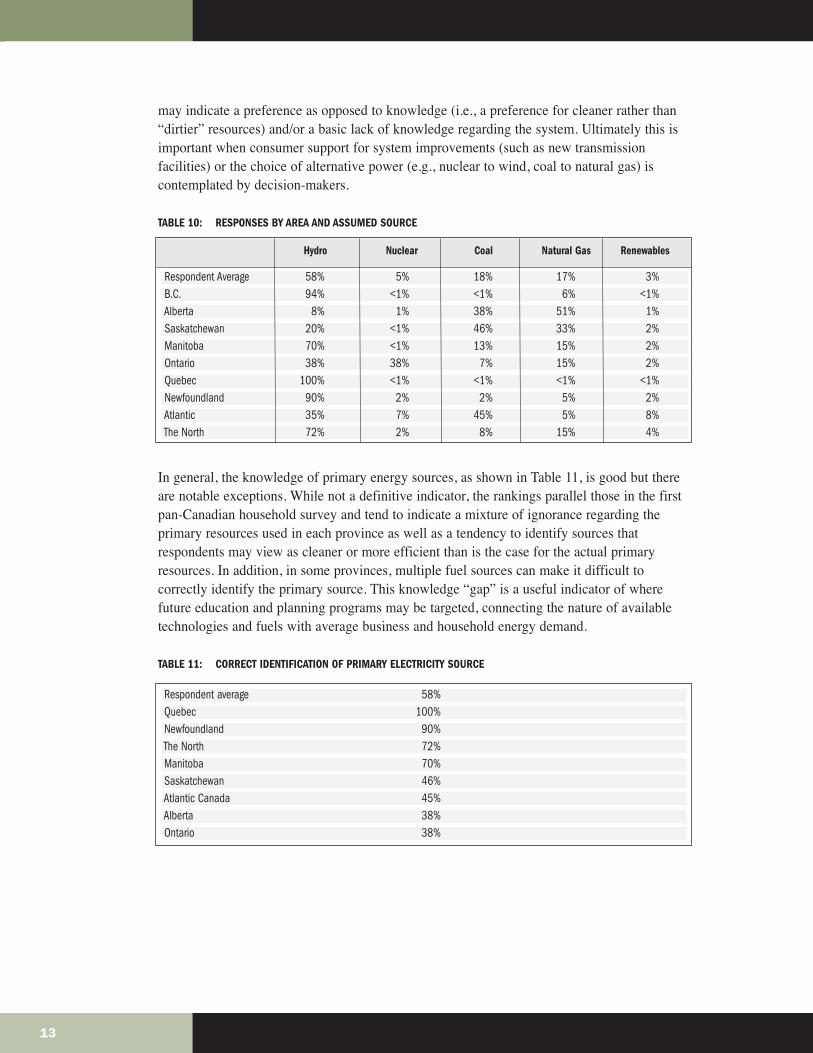
may indicate a preference as opposed to knowledge (i.e., a preference for cleaner rather than“dirtier” resources) and/or a basic lack of knowledge regarding the system. Ultimately this isimportant when consumer support for system improvements (such as new transmissionfacilities) or the choice of alternative power (e.g., nuclear to wind, coal to natural gas) iscontemplated by decision-makers.
TABLE 10: RESPONSES BY AREA AND ASSUMED SOURCE
In general, the knowledge of primary energy sources, as shown in Table 11, is good but thereare notable exceptions. While not a definitive indicator, the rankings parallel those in the firstpan-Canadian household survey and tend to indicate a mixture of ignorance regarding theprimary resources used in each province as well as a tendency to identify sources thatrespondents may view as cleaner or more efficient than is the case for the actual primaryresources. In addition, in some provinces, multiple fuel sources can make it difficult tocorrectly identify the primary source. This knowledge “gap” is a useful indicator of wherefuture education and planning programs may be targeted, connecting the nature of availabletechnologies and fuels with average business and household energy demand.
TABLE 11: CORRECT IDENTIFICATION OF PRIMARY ELECTRICITY SOURCE
13
Respondent Average 58% 5% 18% 17% 3%B.C. 94% <1% <1% 6% <1%Alberta 8% 1% 38% 51% 1%Saskatchewan 20% <1% 46% 33% 2%Manitoba 70% <1% 13% 15% 2%Ontario 38% 38% 7% 15% 2%Quebec 100% <1% <1% <1% <1%Newfoundland 90% 2% 2% 5% 2%Atlantic 35% 7% 45% 5% 8%The North 72% 2% 8% 15% 4%
Hydro Nuclear Coal Natural Gas Renewables
Respondent average 58%Quebec 100%Newfoundland 90%The North 72%Manitoba 70%Saskatchewan 46%Atlantic Canada 45%Alberta 38%Ontario 38%
POLICY CONCERNS
Energy Costs
Energy costs constitute a category of information that dominates many news and media sitesdaily. Interest in cost levels generally is unsurprisingly high overall. In the case of business andpolicy leaders, especially for those with fiscal responsibilities, interest and knowledge arelikely influenced directly.
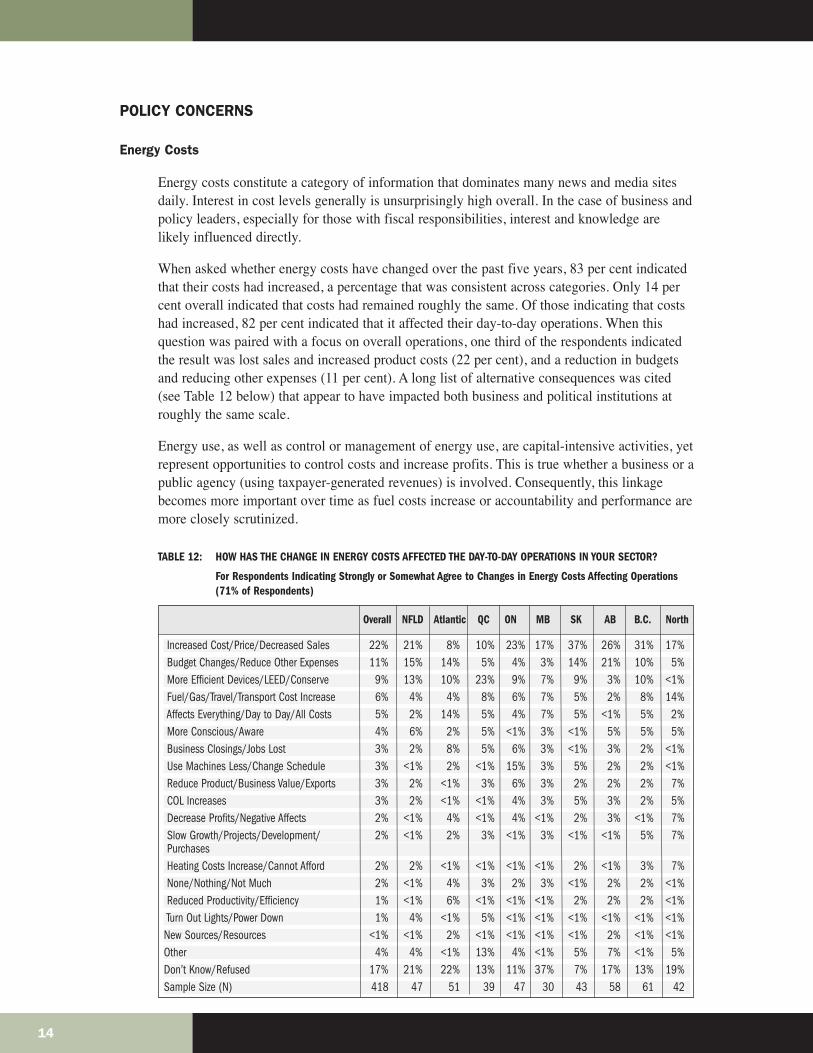
When asked whether energy costs have changed over the past five years, 83 per cent indicatedthat their costs had increased, a percentage that was consistent across categories. Only 14 percent overall indicated that costs had remained roughly the same. Of those indicating that costshad increased, 82 per cent indicated that it affected their day-to-day operations. When thisquestion was paired with a focus on overall operations, one third of the respondents indicatedthe result was lost sales and increased product costs (22 per cent), and a reduction in budgetsand reducing other expenses (11 per cent). A long list of alternative consequences was cited(see Table 12 below) that appear to have impacted both business and political institutions atroughly the same scale.
Energy use, as well as control or management of energy use, are capital-intensive activities, yetrepresent opportunities to control costs and increase profits. This is true whether a business or apublic agency (using taxpayer-generated revenues) is involved. Consequently, this linkagebecomes more important over time as fuel costs increase or accountability and performance aremore closely scrutinized.
TABLE 12: HOW HAS THE CHANGE IN ENERGY COSTS AFFECTED THE DAY-TO-DAY OPERATIONS IN YOUR SECTOR?
For Respondents Indicating Strongly or Somewhat Agree to Changes in Energy Costs Affecting Operations (71% of Respondents)
14
Increased Cost/Price/Decreased Sales 22% 21% 8% 10% 23% 17% 37% 26% 31% 17%Budget Changes/Reduce Other Expenses 11% 15% 14% 5% 4% 3% 14% 21% 10% 5%More Efficient Devices/LEED/Conserve 9% 13% 10% 23% 9% 7% 9% 3% 10% <1%Fuel/Gas/Travel/Transport Cost Increase 6% 4% 4% 8% 6% 7% 5% 2% 8% 14%Affects Everything/Day to Day/All Costs 5% 2% 14% 5% 4% 7% 5% <1% 5% 2%More Conscious/Aware 4% 6% 2% 5% <1% 3% <1% 5% 5% 5%Business Closings/Jobs Lost 3% 2% 8% 5% 6% 3% <1% 3% 2% <1%Use Machines Less/Change Schedule 3% <1% 2% <1% 15% 3% 5% 2% 2% <1%Reduce Product/Business Value/Exports 3% 2% <1% 3% 6% 3% 2% 2% 2% 7%COL Increases 3% 2% <1% <1% 4% 3% 5% 3% 2% 5%Decrease Profits/Negative Affects 2% <1% 4% <1% 4% <1% 2% 3% <1% 7%Slow Growth/Projects/Development/ 2% <1% 2% 3% <1% 3% <1% <1% 5% 7%PurchasesHeating Costs Increase/Cannot Afford 2% 2% <1% <1% <1% <1% 2% <1% 3% 7%None/Nothing/Not Much 2% <1% 4% 3% 2% 3% <1% 2% 2% <1%Reduced Productivity/Efficiency 1% <1% 6% <1% <1% <1% 2% 2% 2% <1%Turn Out Lights/Power Down 1% 4% <1% 5% <1% <1% <1% <1% <1% <1%New Sources/Resources <1% <1% 2% <1% <1% <1% <1% 2% <1% <1%Other 4% 4% <1% 13% 4% <1% 5% 7% <1% 5%Don’t Know/Refused 17% 21% 22% 13% 11% 37% 7% 17% 13% 19%Sample Size (N) 418 47 51 39 47 30 43 58 61 42
Overall NFLD Atlantic QC ON MB SK AB B.C. North

When the issue of planning for the future is introduced, only 28 per cent (23 per cent forbusiness; 36 per cent for policy) strongly agreed that the increase in energy costs over the pastfive years has influenced their planning. This suggests there are built-in expectationsconcerning impending, or continued increases in energy costs. A majority (53 per cent)“somewhat agree” that energy costs have influenced their planning. For those whose planningwas affected by energy costs, the majority of the planning has been focused on introducingefficiency measures, reducing operations, replacing equipment, “greening” their organization,and introducing new budget processes. When asked about profits and operating efficiency overthe past five years, 27 per cent of those responding indicated that energy cost increases hadreduced revenue between five and 10 per cent; an additional 22 per cent of respondentsindicated that business revenue reductions had exceeded 10 per cent during this period.
Support for Energy Sources
We asked about support for various fuels that form the basis of electricity generation for Canadain general, although these vary by province and territory. The question centred on whether or notthe industries were viewed as sustainable for the nation in the long run. Specifically, therespondents were asked to rank each energy source on their opinion regarding its costeffectiveness as an energy source, with a rank of zero indicating “not very sustainable” and a rankof 10 indicating “very sustainable.” In this case, “sustainability” means the cost effectiveness ofeach energy source. Average scores are reported in Figure 10 and Table 13 below.
This point of view about the sustainable nature of resources is in contrast to how respondentsfeel about supporting one form of energy versus another (the question encouraged respondentsto evaluate sustainability for Canada rather than their province). Here, respondent supportlevels are very similar to the earlier general population survey. Coal continues to have lowsupport with policy and business leaders, with an overall rating of 4.07. Perceivedsustainability for nuclear was also low at 5.3, followed by natural gas (6.63). Renewableresources in general fared well, with wind (7.13), solar (7.03), and hydroelectric powerreceiving high scores. Hydroelectric power received the highest rating at 7.96.
FIGURE 10: AVERAGE SUSTAINABILITY SCORES FOR ENERGY SOURCES (SCALE OF ZERO TO 10)
15
Coal NaturalGas
Hydro Wind Solar Nuclear
9
8
7
6
5
4
3
2
1
0
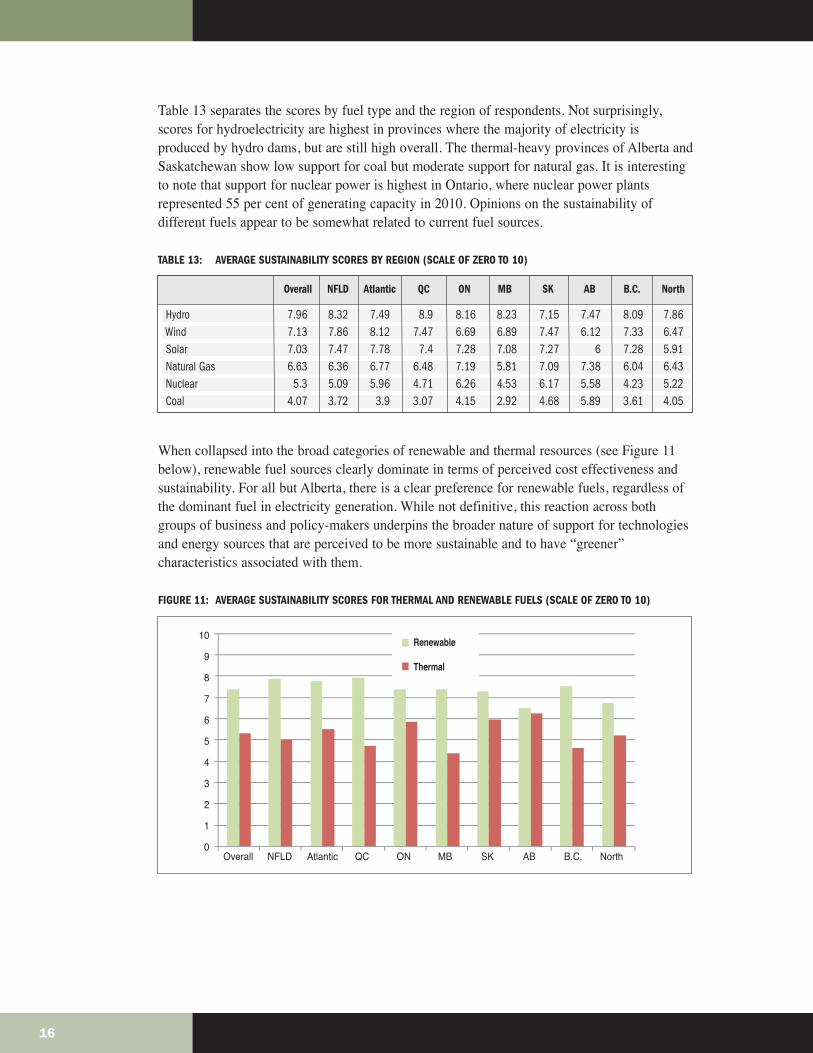
Table 13 separates the scores by fuel type and the region of respondents. Not surprisingly,scores for hydroelectricity are highest in provinces where the majority of electricity isproduced by hydro dams, but are still high overall. The thermal-heavy provinces of Alberta andSaskatchewan show low support for coal but moderate support for natural gas. It is interestingto note that support for nuclear power is highest in Ontario, where nuclear power plantsrepresented 55 per cent of generating capacity in 2010. Opinions on the sustainability ofdifferent fuels appear to be somewhat related to current fuel sources.
TABLE 13: AVERAGE SUSTAINABILITY SCORES BY REGION (SCALE OF ZERO TO 10)
When collapsed into the broad categories of renewable and thermal resources (see Figure 11below), renewable fuel sources clearly dominate in terms of perceived cost effectiveness andsustainability. For all but Alberta, there is a clear preference for renewable fuels, regardless ofthe dominant fuel in electricity generation. While not definitive, this reaction across bothgroups of business and policy-makers underpins the broader nature of support for technologiesand energy sources that are perceived to be more sustainable and to have “greener”characteristics associated with them.
FIGURE 11: AVERAGE SUSTAINABILITY SCORES FOR THERMAL AND RENEWABLE FUELS (SCALE OF ZERO TO 10)
16
10
9
8
7
6
5
4
3
2
1
0Overall NFLD Atlantic QC ON MB SK AB B.C. North
Renewable
Thermal
Hydro 7.96 8.32 7.49 8.9 8.16 8.23 7.15 7.47 8.09 7.86Wind 7.13 7.86 8.12 7.47 6.69 6.89 7.47 6.12 7.33 6.47Solar 7.03 7.47 7.78 7.4 7.28 7.08 7.27 6 7.28 5.91Natural Gas 6.63 6.36 6.77 6.48 7.19 5.81 7.09 7.38 6.04 6.43Nuclear 5.3 5.09 5.96 4.71 6.26 4.53 6.17 5.58 4.23 5.22Coal 4.07 3.72 3.9 3.07 4.15 2.92 4.68 5.89 3.61 4.05
Overall NFLD Atlantic QC ON MB SK AB B.C. North
Energy and the Environment
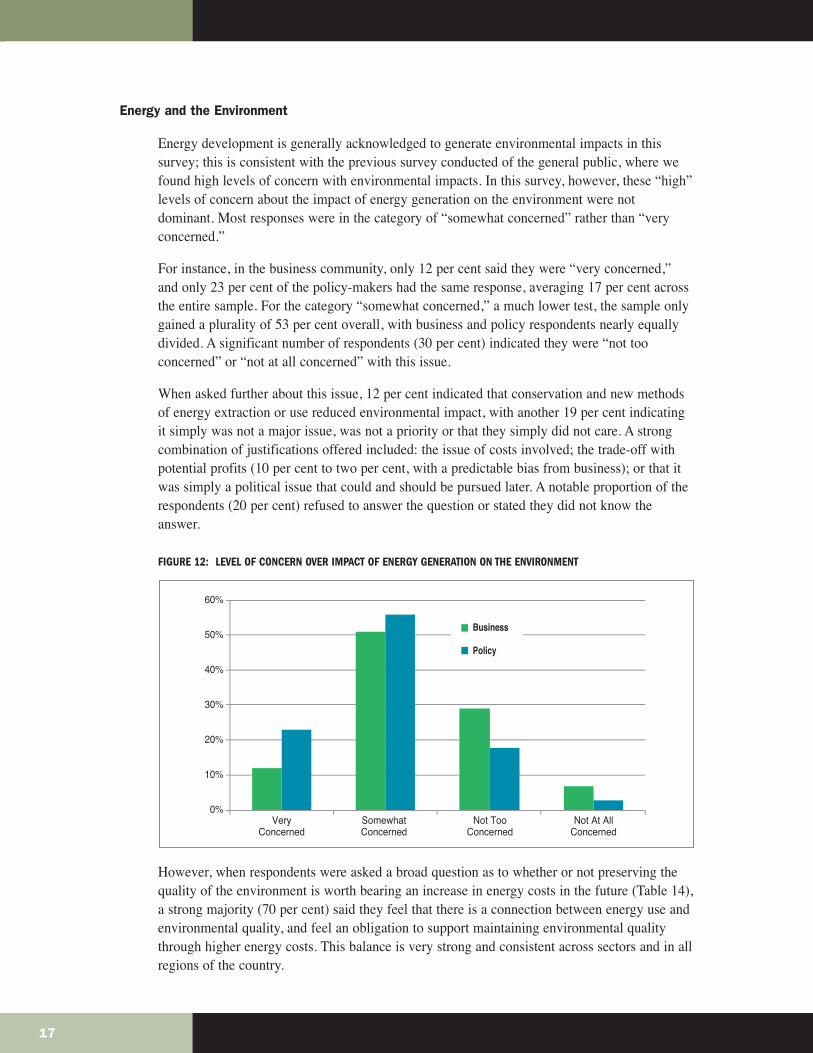
Energy development is generally acknowledged to generate environmental impacts in thissurvey; this is consistent with the previous survey conducted of the general public, where wefound high levels of concern with environmental impacts. In this survey, however, these “high”levels of concern about the impact of energy generation on the environment were notdominant. Most responses were in the category of “somewhat concerned” rather than “veryconcerned.”
For instance, in the business community, only 12 per cent said they were “very concerned,”and only 23 per cent of the policy-makers had the same response, averaging 17 per cent acrossthe entire sample. For the category “somewhat concerned,” a much lower test, the sample onlygained a plurality of 53 per cent overall, with business and policy respondents nearly equallydivided. A significant number of respondents (30 per cent) indicated they were “not tooconcerned” or “not at all concerned” with this issue.
When asked further about this issue, 12 per cent indicated that conservation and new methodsof energy extraction or use reduced environmental impact, with another 19 per cent indicatingit simply was not a major issue, was not a priority or that they simply did not care. A strongcombination of justifications offered included: the issue of costs involved; the trade-off withpotential profits (10 per cent to two per cent, with a predictable bias from business); or that itwas simply a political issue that could and should be pursued later. A notable proportion of therespondents (20 per cent) refused to answer the question or stated they did not know theanswer.
FIGURE 12: LEVEL OF CONCERN OVER IMPACT OF ENERGY GENERATION ON THE ENVIRONMENT
However, when respondents were asked a broad question as to whether or not preserving thequality of the environment is worth bearing an increase in energy costs in the future (Table 14),a strong majority (70 per cent) said they feel that there is a connection between energy use andenvironmental quality, and feel an obligation to support maintaining environmental qualitythrough higher energy costs. This balance is very strong and consistent across sectors and in allregions of the country.
17
60%
50%
40%
30%
20%
10%
0%Very
ConcernedSomewhatConcerned
Not TooConcerned
Not At AllConcerned
Business
Policy
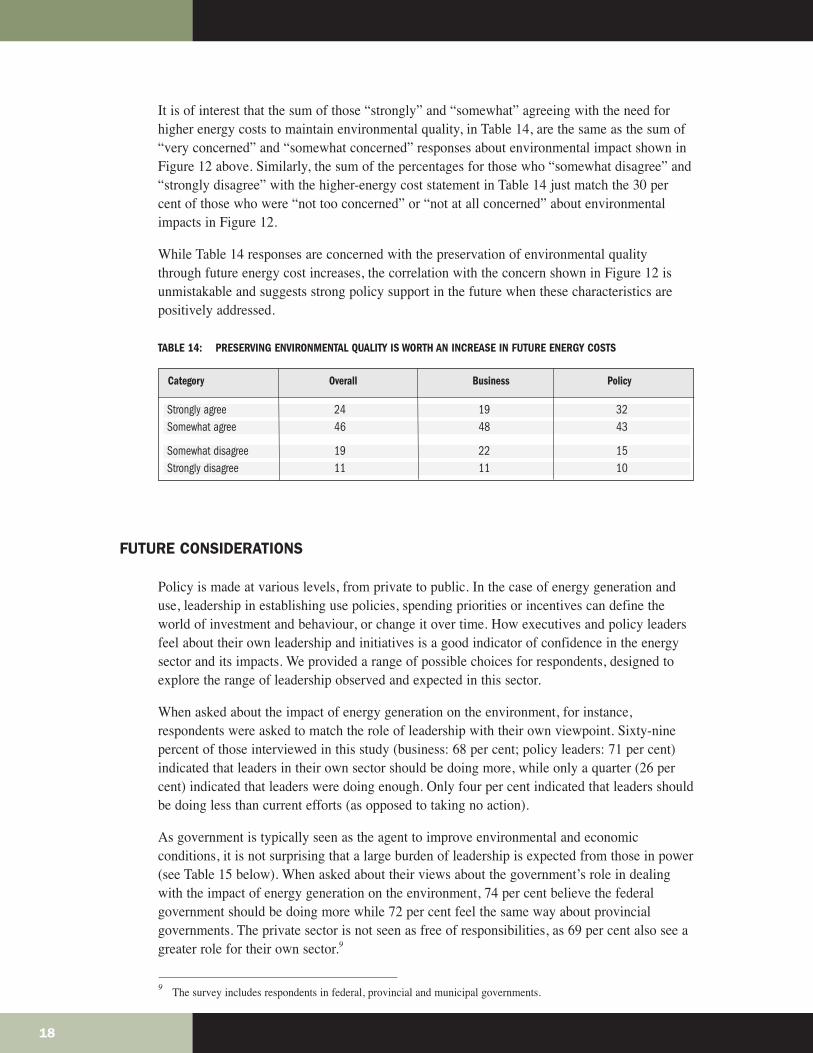
It is of interest that the sum of those “strongly” and “somewhat” agreeing with the need forhigher energy costs to maintain environmental quality, in Table 14, are the same as the sum of“very concerned” and “somewhat concerned” responses about environmental impact shown inFigure 12 above. Similarly, the sum of the percentages for those who “somewhat disagree” and“strongly disagree” with the higher-energy cost statement in Table 14 just match the 30 percent of those who were “not too concerned” or “not at all concerned” about environmentalimpacts in Figure 12.
While Table 14 responses are concerned with the preservation of environmental qualitythrough future energy cost increases, the correlation with the concern shown in Figure 12 isunmistakable and suggests strong policy support in the future when these characteristics arepositively addressed.
TABLE 14: PRESERVING ENVIRONMENTAL QUALITY IS WORTH AN INCREASE IN FUTURE ENERGY COSTS
FUTURE CONSIDERATIONS
Policy is made at various levels, from private to public. In the case of energy generation anduse, leadership in establishing use policies, spending priorities or incentives can define theworld of investment and behaviour, or change it over time. How executives and policy leadersfeel about their own leadership and initiatives is a good indicator of confidence in the energysector and its impacts. We provided a range of possible choices for respondents, designed toexplore the range of leadership observed and expected in this sector.
When asked about the impact of energy generation on the environment, for instance,respondents were asked to match the role of leadership with their own viewpoint. Sixty-ninepercent of those interviewed in this study (business: 68 per cent; policy leaders: 71 per cent)indicated that leaders in their own sector should be doing more, while only a quarter (26 percent) indicated that leaders were doing enough. Only four per cent indicated that leaders shouldbe doing less than current efforts (as opposed to taking no action).
As government is typically seen as the agent to improve environmental and economicconditions, it is not surprising that a large burden of leadership is expected from those in power(see Table 15 below). When asked about their views about the government’s role in dealingwith the impact of energy generation on the environment, 74 per cent believe the federalgovernment should be doing more while 72 per cent feel the same way about provincialgovernments. The private sector is not seen as free of responsibilities, as 69 per cent also see agreater role for their own sector.9
9 The survey includes respondents in federal, provincial and municipal governments.
18
Strongly agree 24 19 32Somewhat agree 46 48 43
Somewhat disagree 19 22 15Strongly disagree 11 11 10
Category Overall Business Policy
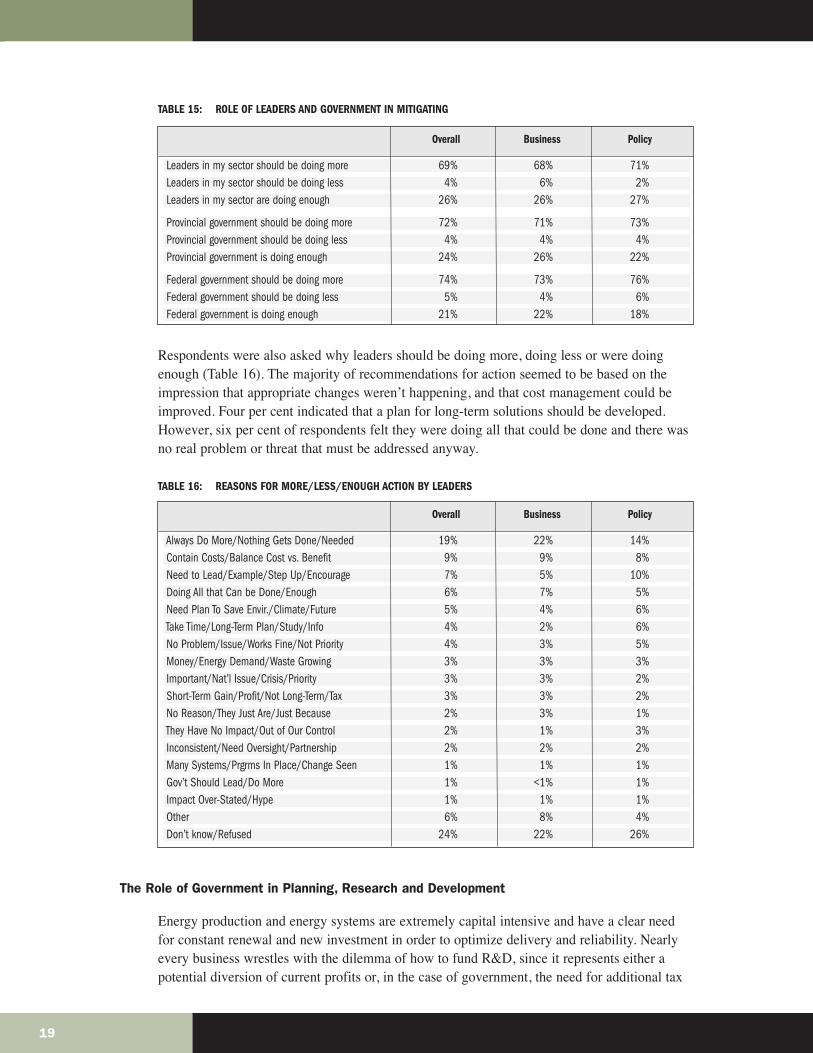
TABLE 15: ROLE OF LEADERS AND GOVERNMENT IN MITIGATING
Respondents were also asked why leaders should be doing more, doing less or were doingenough (Table 16). The majority of recommendations for action seemed to be based on theimpression that appropriate changes weren’t happening, and that cost management could beimproved. Four per cent indicated that a plan for long-term solutions should be developed.However, six per cent of respondents felt they were doing all that could be done and there wasno real problem or threat that must be addressed anyway.
TABLE 16: REASONS FOR MORE/LESS/ENOUGH ACTION BY LEADERS
The Role of Government in Planning, Research and Development
Energy production and energy systems are extremely capital intensive and have a clear needfor constant renewal and new investment in order to optimize delivery and reliability. Nearlyevery business wrestles with the dilemma of how to fund R&D, since it represents either apotential diversion of current profits or, in the case of government, the need for additional tax
19
Leaders in my sector should be doing more 69% 68% 71%Leaders in my sector should be doing less 4% 6% 2%Leaders in my sector are doing enough 26% 26% 27%
Provincial government should be doing more 72% 71% 73%Provincial government should be doing less 4% 4% 4%Provincial government is doing enough 24% 26% 22%
Federal government should be doing more 74% 73% 76%Federal government should be doing less 5% 4% 6%Federal government is doing enough 21% 22% 18%
Overall Business Policy
Always Do More/Nothing Gets Done/Needed 19% 22% 14%Contain Costs/Balance Cost vs. Benefit 9% 9% 8%Need to Lead/Example/Step Up/Encourage 7% 5% 10%Doing All that Can be Done/Enough 6% 7% 5%Need Plan To Save Envir./Climate/Future 5% 4% 6%Take Time/Long-Term Plan/Study/Info 4% 2% 6%No Problem/Issue/Works Fine/Not Priority 4% 3% 5%Money/Energy Demand/Waste Growing 3% 3% 3%Important/Nat’l Issue/Crisis/Priority 3% 3% 2%Short-Term Gain/Profit/Not Long-Term/Tax 3% 3% 2%No Reason/They Just Are/Just Because 2% 3% 1%They Have No Impact/Out of Our Control 2% 1% 3%Inconsistent/Need Oversight/Partnership 2% 2% 2%Many Systems/Prgrms In Place/Change Seen 1% 1% 1%Gov’t Should Lead/Do More 1% <1% 1%Impact Over-Stated/Hype 1% 1% 1%Other 6% 8% 4%Don’t know/Refused 24% 22% 26%
Overall Business Policy
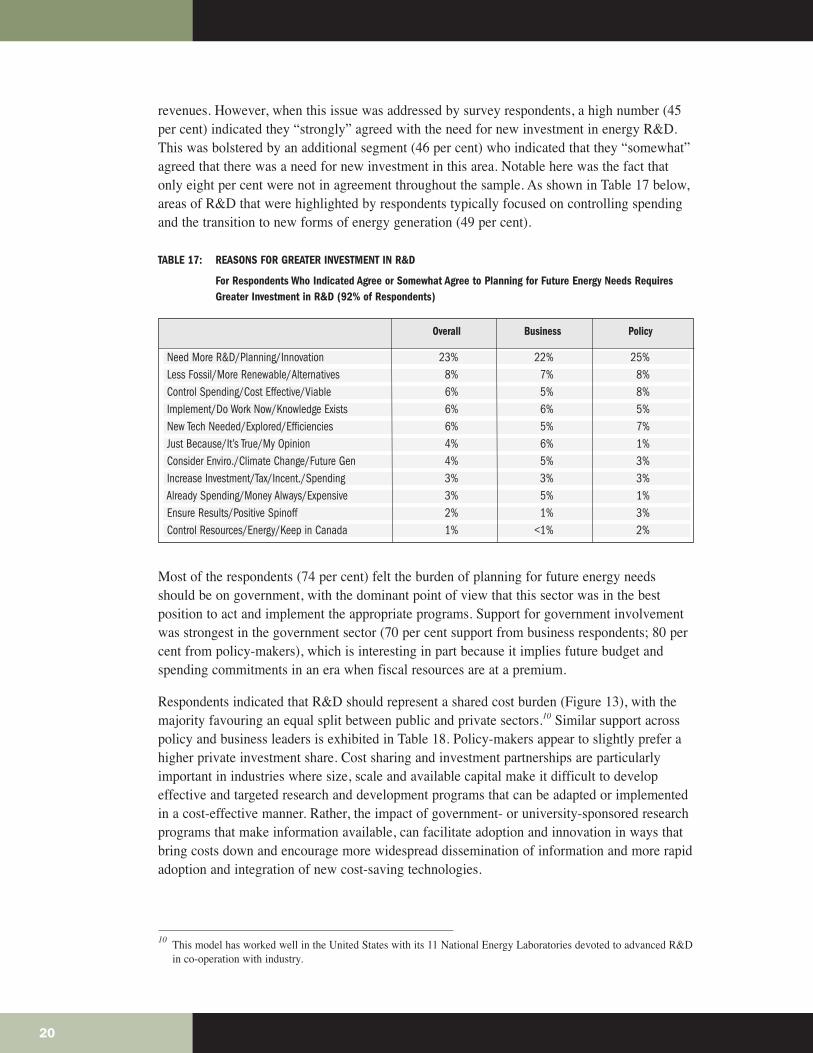
revenues. However, when this issue was addressed by survey respondents, a high number (45per cent) indicated they “strongly” agreed with the need for new investment in energy R&D.This was bolstered by an additional segment (46 per cent) who indicated that they “somewhat”agreed that there was a need for new investment in this area. Notable here was the fact thatonly eight per cent were not in agreement throughout the sample. As shown in Table 17 below,areas of R&D that were highlighted by respondents typically focused on controlling spendingand the transition to new forms of energy generation (49 per cent).
TABLE 17: REASONS FOR GREATER INVESTMENT IN R&D
For Respondents Who Indicated Agree or Somewhat Agree to Planning for Future Energy Needs Requires Greater Investment in R&D (92% of Respondents)
Most of the respondents (74 per cent) felt the burden of planning for future energy needsshould be on government, with the dominant point of view that this sector was in the bestposition to act and implement the appropriate programs. Support for government involvementwas strongest in the government sector (70 per cent support from business respondents; 80 percent from policy-makers), which is interesting in part because it implies future budget andspending commitments in an era when fiscal resources are at a premium.
Respondents indicated that R&D should represent a shared cost burden (Figure 13), with themajority favouring an equal split between public and private sectors.10 Similar support acrosspolicy and business leaders is exhibited in Table 18. Policy-makers appear to slightly prefer ahigher private investment share. Cost sharing and investment partnerships are particularlyimportant in industries where size, scale and available capital make it difficult to developeffective and targeted research and development programs that can be adapted or implementedin a cost-effective manner. Rather, the impact of government- or university-sponsored researchprograms that make information available, can facilitate adoption and innovation in ways thatbring costs down and encourage more widespread dissemination of information and more rapidadoption and integration of new cost-saving technologies.
10 This model has worked well in the United States with its 11 National Energy Laboratories devoted to advanced R&Din co-operation with industry.
20
Need More R&D/Planning/Innovation 23% 22% 25%Less Fossil/More Renewable/Alternatives 8% 7% 8%Control Spending/Cost Effective/Viable 6% 5% 8%Implement/Do Work Now/Knowledge Exists 6% 6% 5%New Tech Needed/Explored/Efficiencies 6% 5% 7%Just Because/It’s True/My Opinion 4% 6% 1%Consider Enviro./Climate Change/Future Gen 4% 5% 3%Increase Investment/Tax/Incent./Spending 3% 3% 3%Already Spending/Money Always/Expensive 3% 5% 1%Ensure Results/Positive Spinoff 2% 1% 3%Control Resources/Energy/Keep in Canada 1% <1% 2%
Overall Business Policy
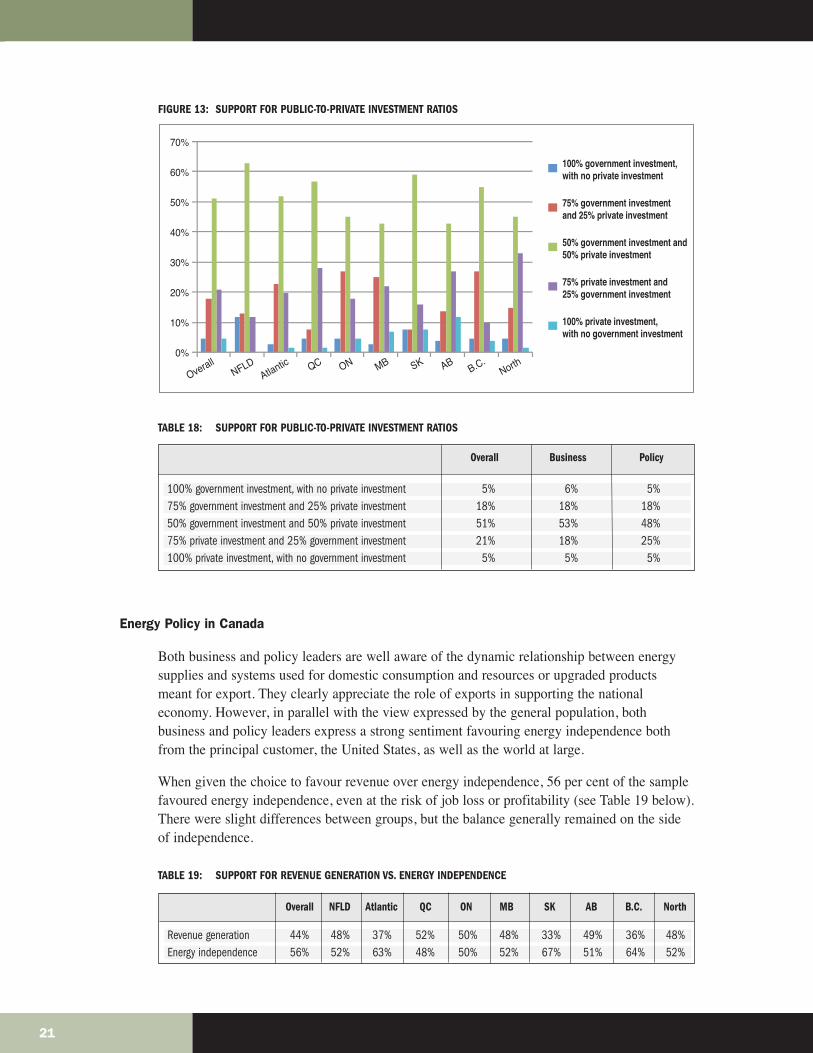
FIGURE 13: SUPPORT FOR PUBLIC-TO-PRIVATE INVESTMENT RATIOS
TABLE 18: SUPPORT FOR PUBLIC-TO-PRIVATE INVESTMENT RATIOS
Energy Policy in Canada
Both business and policy leaders are well aware of the dynamic relationship between energysupplies and systems used for domestic consumption and resources or upgraded productsmeant for export. They clearly appreciate the role of exports in supporting the nationaleconomy. However, in parallel with the view expressed by the general population, bothbusiness and policy leaders express a strong sentiment favouring energy independence bothfrom the principal customer, the United States, as well as the world at large.
When given the choice to favour revenue over energy independence, 56 per cent of the samplefavoured energy independence, even at the risk of job loss or profitability (see Table 19 below).There were slight differences between groups, but the balance generally remained on the sideof independence.
TABLE 19: SUPPORT FOR REVENUE GENERATION VS. ENERGY INDEPENDENCE
21
OverallNFLD
Atlantic QC ON MB SK ABB.C.
North
70%
60%
50%
40%
30%
20%
10%
0%
100% government investment, with no private investment
75% government investment and 25% private investment
50% government investment and 50% private investment
75% private investment and 25% government investment
100% private investment, with no government investment
100% government investment, with no private investment 5% 6% 5%75% government investment and 25% private investment 18% 18% 18%50% government investment and 50% private investment 51% 53% 48%75% private investment and 25% government investment 21% 18% 25%100% private investment, with no government investment 5% 5% 5%
Overall Business Policy
Revenue generation 44% 48% 37% 52% 50% 48% 33% 49% 36% 48%Energy independence 56% 52% 63% 48% 50% 52% 67% 51% 64% 52%
Overall NFLD Atlantic QC ON MB SK AB B.C. North
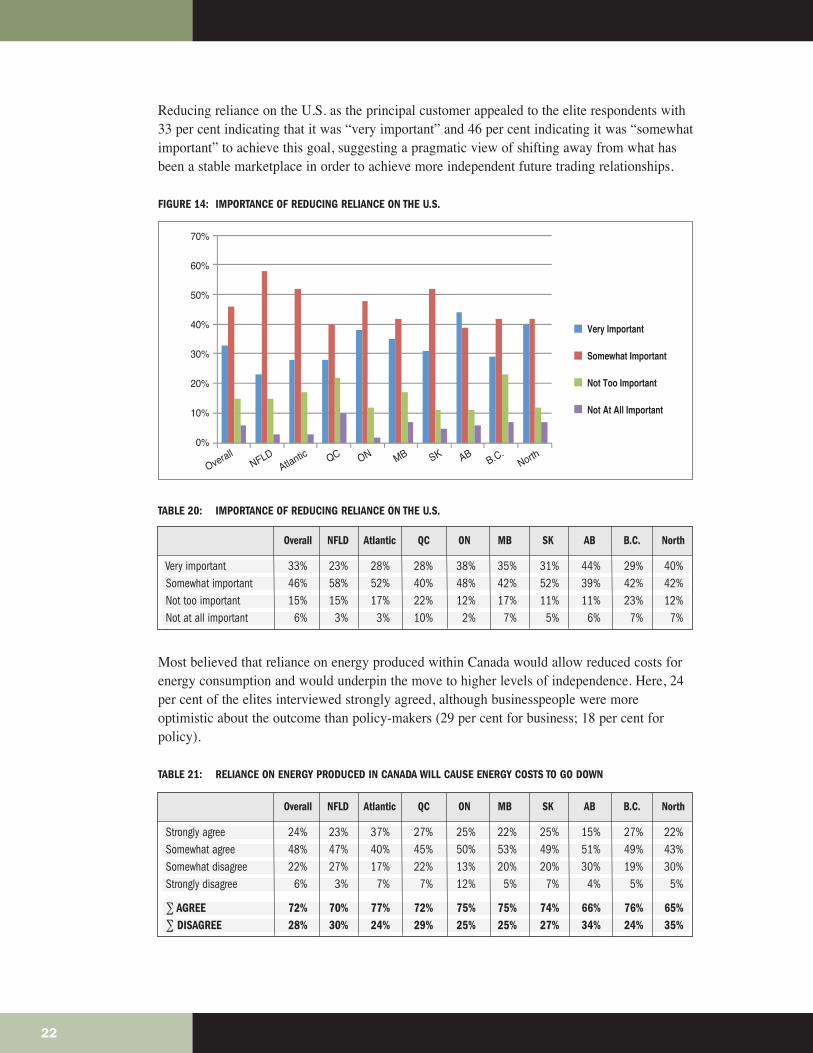
Reducing reliance on the U.S. as the principal customer appealed to the elite respondents with33 per cent indicating that it was “very important” and 46 per cent indicating it was “somewhatimportant” to achieve this goal, suggesting a pragmatic view of shifting away from what hasbeen a stable marketplace in order to achieve more independent future trading relationships.
FIGURE 14: IMPORTANCE OF REDUCING RELIANCE ON THE U.S.
TABLE 20: IMPORTANCE OF REDUCING RELIANCE ON THE U.S.
Most believed that reliance on energy produced within Canada would allow reduced costs forenergy consumption and would underpin the move to higher levels of independence. Here, 24per cent of the elites interviewed strongly agreed, although businesspeople were moreoptimistic about the outcome than policy-makers (29 per cent for business; 18 per cent forpolicy).
TABLE 21: RELIANCE ON ENERGY PRODUCED IN CANADA WILL CAUSE ENERGY COSTS TO GO DOWN
22
70%
60%
50%
40%
30%
20%
10%
0%
OverallNFLD
Atlantic QC ON MB SK ABB.C.
North
Very Important
Somewhat Important
Not Too Important
Not At All Important
Strongly agree 24% 23% 37% 27% 25% 22% 25% 15% 27% 22%Somewhat agree 48% 47% 40% 45% 50% 53% 49% 51% 49% 43%Somewhat disagree 22% 27% 17% 22% 13% 20% 20% 30% 19% 30%Strongly disagree 6% 3% 7% 7% 12% 5% 7% 4% 5% 5%
∑ AGREE 72% 70% 77% 72% 75% 75% 74% 66% 76% 65%∑ DISAGREE 28% 30% 24% 29% 25% 25% 27% 34% 24% 35%
Overall NFLD Atlantic QC ON MB SK AB B.C. North
Very important 33% 23% 28% 28% 38% 35% 31% 44% 29% 40%Somewhat important 46% 58% 52% 40% 48% 42% 52% 39% 42% 42%Not too important 15% 15% 17% 22% 12% 17% 11% 11% 23% 12%Not at all important 6% 3% 3% 10% 2% 7% 5% 6% 7% 7%
Overall NFLD Atlantic QC ON MB SK AB B.C. North
TRUST AND CONFIDENCE
As we pointed out at the beginning of this paper, studying elite opinion is important since it islikely to play an important role in policy development. Energy is a crucial question for thefuture of Canada, and our analysis has given us an in-depth look at what business and policyleaders know and think about issues related to energy in Canada. However, if we are to moveahead with a more coherent energy policy, Canadians will have to turn to trusted people andinstitutions for leadership and directions.
Government and business practices and policy are based on a broad system of trust, rules,regulation and convention. The issue of trust cannot be overstated, since at the heart of oursociety, lack of trust or even a waning of this ephemeral quality can initiate long-term changesin investment and the stability of social or governmental policy. In the end, the issue of trustspeaks to the hopes of the entire citizenry, which of course includes elected and non-electedleadership. Given the nature, size and influence of the energy industry in Canada, theperceptions of leadership in this case give pause, and hope, for changing the level of discourseabout the use of energy resources.
As with our previous survey, we find significant levels of low trust, even among the leadershipin the country, for some of the most basic of institutions dealing with energy issues. Thenumbers in this case speak for themselves, with low levels of satisfaction and trust for coreelements of the economy, especially those representing the energy industry.
Elite respondents were asked to rate the trustworthiness of a series of groups and institutions,using a zero to 10 scale, where zero is “not at all trustworthy” and 10 is “very trustworthy.Overall, academics (6.31), economic experts (6.02), provincial governments (5.33) and localchambers of commerce (5.04) receive the highest ratings. Environmental groups and activists(5.01), community groups and activists (4.98), the federal government (4.95) and citycouncillors (4.79) get comparatively lower ratings, but rate well ahead of the CanadianAssociation of Petroleum Producers (4.30), oil companies (3.98) and energy companyexecutives (3.93).
Ultimately, the issue of trust will influence the utility of future programs for improving overallenergy literacy in the population, reflecting the perceived veracity of both informationdisseminated and the source utilized.
23
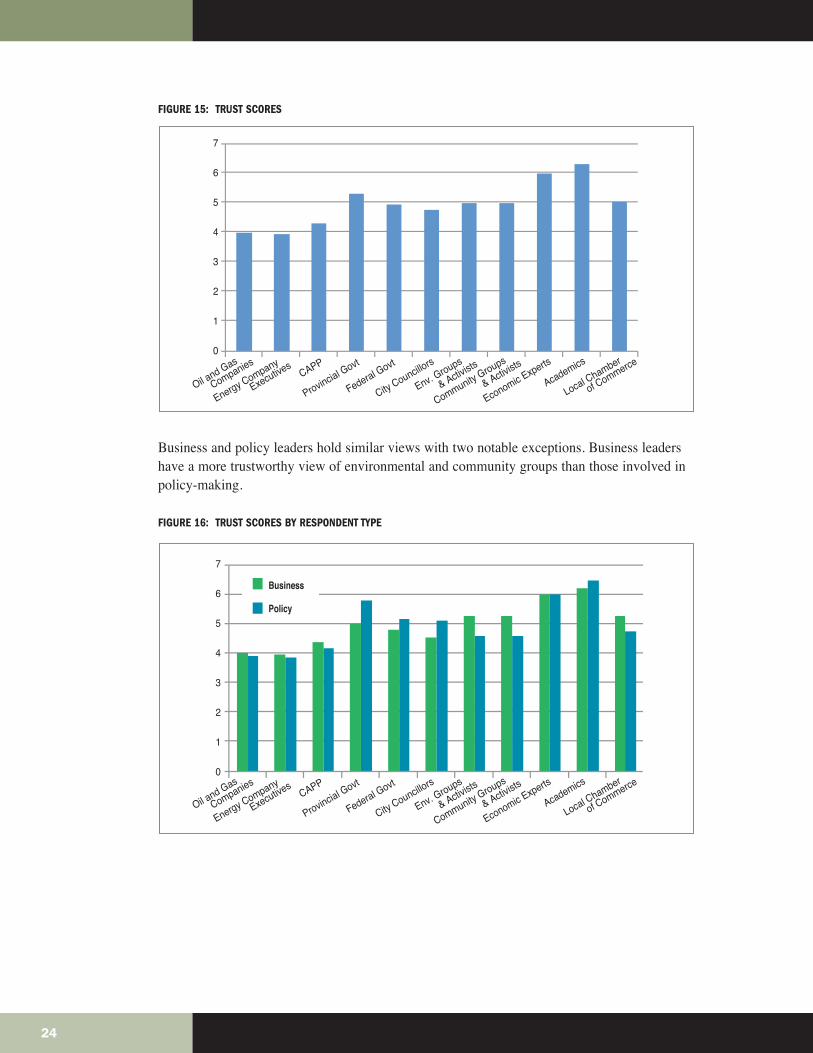
FIGURE 15: TRUST SCORES
Business and policy leaders hold similar views with two notable exceptions. Business leadershave a more trustworthy view of environmental and community groups than those involved inpolicy-making.
FIGURE 16: TRUST SCORES BY RESPONDENT TYPE
24
7
6
5
4
3
2
1
0
Oil and Gas
Companies
Energy Company
Executives
CAPP
Provincial Govt
Federal Govt
City Councillors
Env. Groups
&
Activists
Community Groups
& Activists
Economic Experts
Academics
Local Chamber
o
f Commerce
Oil and Gas
Companies
Energy Company
ExecutivesCAPP
Provincial Govt
Federal Govt
City Councillors
Env. Groups
&
Activists
Community Groups
& Activists
Economic Experts
Academics
Local Chamber
o
f Commerce
7
6
5
4
3
2
1
0
Business
Policy
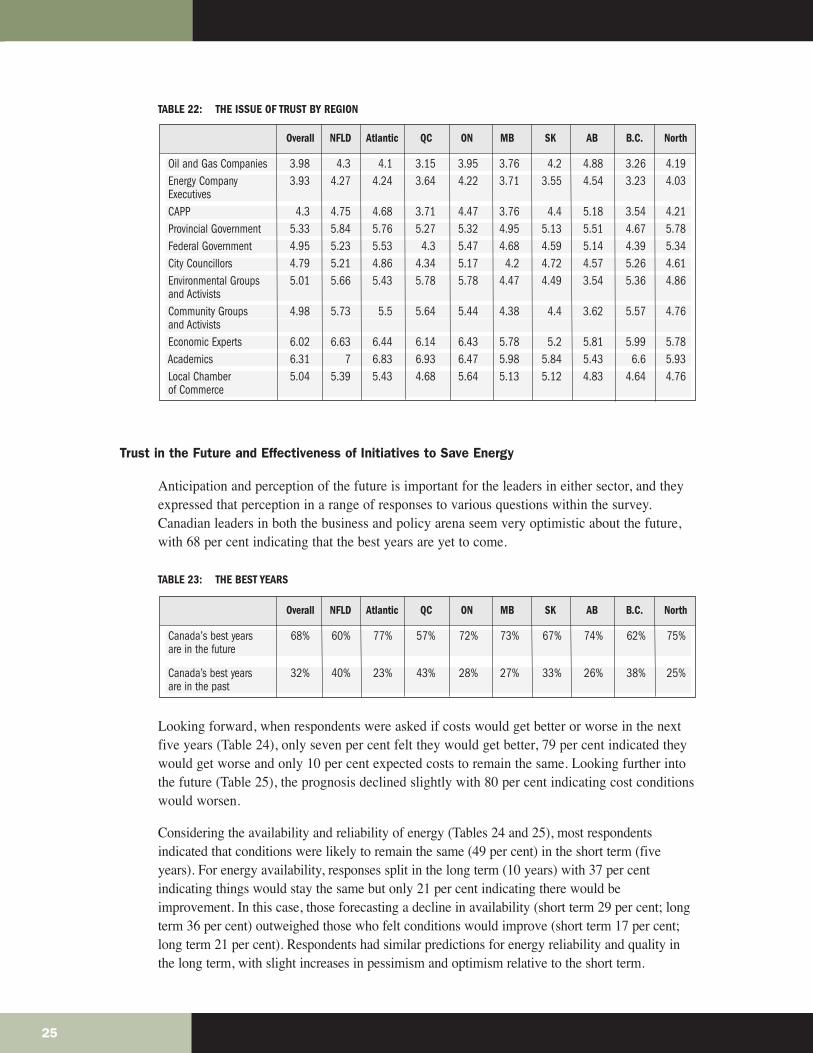
TABLE 22: THE ISSUE OF TRUST BY REGION
Trust in the Future and Effectiveness of Initiatives to Save Energy
Anticipation and perception of the future is important for the leaders in either sector, and theyexpressed that perception in a range of responses to various questions within the survey.Canadian leaders in both the business and policy arena seem very optimistic about the future,with 68 per cent indicating that the best years are yet to come.
TABLE 23: THE BEST YEARS
Looking forward, when respondents were asked if costs would get better or worse in the nextfive years (Table 24), only seven per cent felt they would get better, 79 per cent indicated theywould get worse and only 10 per cent expected costs to remain the same. Looking further intothe future (Table 25), the prognosis declined slightly with 80 per cent indicating cost conditionswould worsen.
Considering the availability and reliability of energy (Tables 24 and 25), most respondentsindicated that conditions were likely to remain the same (49 per cent) in the short term (fiveyears). For energy availability, responses split in the long term (10 years) with 37 per centindicating things would stay the same but only 21 per cent indicating there would beimprovement. In this case, those forecasting a decline in availability (short term 29 per cent; longterm 36 per cent) outweighed those who felt conditions would improve (short term 17 per cent;long term 21 per cent). Respondents had similar predictions for energy reliability and quality inthe long term, with slight increases in pessimism and optimism relative to the short term.
25
Oil and Gas Companies 3.98 4.3 4.1 3.15 3.95 3.76 4.2 4.88 3.26 4.19Energy Company 3.93 4.27 4.24 3.64 4.22 3.71 3.55 4.54 3.23 4.03ExecutivesCAPP 4.3 4.75 4.68 3.71 4.47 3.76 4.4 5.18 3.54 4.21Provincial Government 5.33 5.84 5.76 5.27 5.32 4.95 5.13 5.51 4.67 5.78Federal Government 4.95 5.23 5.53 4.3 5.47 4.68 4.59 5.14 4.39 5.34City Councillors 4.79 5.21 4.86 4.34 5.17 4.2 4.72 4.57 5.26 4.61Environmental Groups 5.01 5.66 5.43 5.78 5.78 4.47 4.49 3.54 5.36 4.86and ActivistsCommunity Groups 4.98 5.73 5.5 5.64 5.44 4.38 4.4 3.62 5.57 4.76and ActivistsEconomic Experts 6.02 6.63 6.44 6.14 6.43 5.78 5.2 5.81 5.99 5.78Academics 6.31 7 6.83 6.93 6.47 5.98 5.84 5.43 6.6 5.93Local Chamber 5.04 5.39 5.43 4.68 5.64 5.13 5.12 4.83 4.64 4.76of Commerce
Overall NFLD Atlantic QC ON MB SK AB B.C. North
Canada’s best years 68% 60% 77% 57% 72% 73% 67% 74% 62% 75%are in the future
Canada’s best years 32% 40% 23% 43% 28% 27% 33% 26% 38% 25%are in the past
Overall NFLD Atlantic QC ON MB SK AB B.C. North
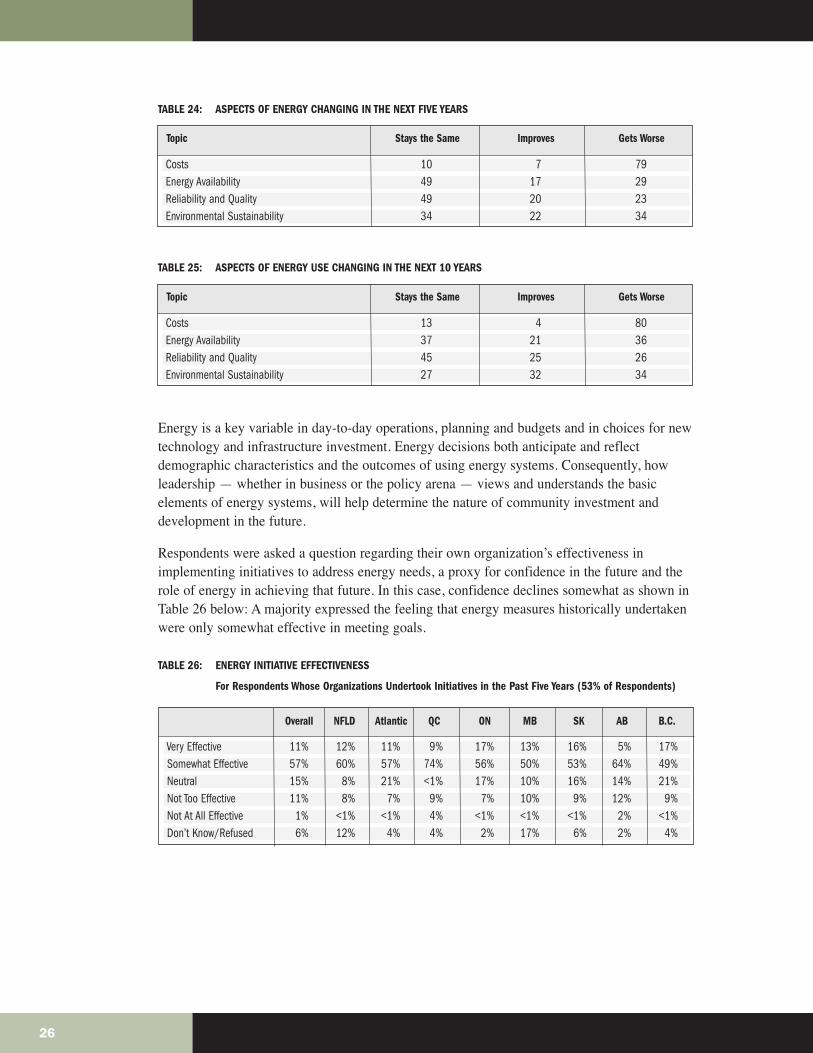
TABLE 24: ASPECTS OF ENERGY CHANGING IN THE NEXT FIVE YEARS
TABLE 25: ASPECTS OF ENERGY USE CHANGING IN THE NEXT 10 YEARS
Energy is a key variable in day-to-day operations, planning and budgets and in choices for newtechnology and infrastructure investment. Energy decisions both anticipate and reflectdemographic characteristics and the outcomes of using energy systems. Consequently, howleadership — whether in business or the policy arena — views and understands the basicelements of energy systems, will help determine the nature of community investment anddevelopment in the future.
Respondents were asked a question regarding their own organization’s effectiveness inimplementing initiatives to address energy needs, a proxy for confidence in the future and therole of energy in achieving that future. In this case, confidence declines somewhat as shown inTable 26 below: A majority expressed the feeling that energy measures historically undertakenwere only somewhat effective in meeting goals.
TABLE 26: ENERGY INITIATIVE EFFECTIVENESS
For Respondents Whose Organizations Undertook Initiatives in the Past Five Years (53% of Respondents)
26
Costs 10 7 79Energy Availability 49 17 29Reliability and Quality 49 20 23Environmental Sustainability 34 22 34
Topic Stays the Same Improves Gets Worse
Costs 13 4 80Energy Availability 37 21 36Reliability and Quality 45 25 26Environmental Sustainability 27 32 34
Topic Stays the Same Improves Gets Worse
Very Effective 11% 12% 11% 9% 17% 13% 16% 5% 17%Somewhat Effective 57% 60% 57% 74% 56% 50% 53% 64% 49%Neutral 15% 8% 21% <1% 17% 10% 16% 14% 21%Not Too Effective 11% 8% 7% 9% 7% 10% 9% 12% 9%Not At All Effective 1% <1% <1% 4% <1% <1% <1% 2% <1%Don’t Know/Refused 6% 12% 4% 4% 2% 17% 6% 2% 4%
Overall NFLD Atlantic QC ON MB SK AB B.C.
SUMMARY AND CONCLUSIONS
This study extends the effort to establish a datum or base understanding of energy literacy inCanada by including a sample of business and policy leaders. Any long-term program, or seriesof policies, that include energy development and use in the country must ultimately include orseek public support, including individuals in these categories. Consequently, their level ofknowledge is an important base to define.
While Canada’s energy resources are diverse in type, quality and quantity, identifying,extracting, upgrading, transporting and ultimately using or exporting them demands supportand approval at all levels of society. We expected both business and policy leaders to begenerally better informed and to express clearer and more incisive opinions regarding energysystems than what we have observed in the general public. In most cases, however, opinionsand understanding did not deviate substantially from that of the general population.
In the case of current levels of “understanding” energy systems, this survey reveals that energyis a topic that engenders opinion and varying levels of knowledge in the leadership of thecountry. However, as a primary day-to-day “issue,” energy is trumped by issues relating to theeconomy, health care and to some extent, the environment both generally and in conjunctionwith energy systems. Leaders do not dismiss energy or necessarily take it for granted; rather,the respondents tend to see energy as integrated into other sectors of the economy, notseparately. This seems to be very important going forward when special attention, approval orinvestment must be singularly targeted towards energy infrastructure or import/export balances.
Using electricity as a proxy, respondents were generally aware of the primary sources ofenergy used by Canadians. Attitudes were generally less positive about certain current fuelssuch as coal, but favoured future investment and policy prescriptions that would encourage“cleaner” resources such as natural gas and renewables. Most leaders have a largely realistic, ifhopeful view of integrating renewable resources, such as wind and solar, into the energysystem.
Business leaders tended to have the most specific information in the area of energyconservation, which probably reflects the fact that they are closer to expenditures made in theinterest of improving energy performance. Beyond this, general knowledge of thecharacteristics and performance potential of various energy technologies including some of theexternalities from their use appeared to be only slightly appreciated or understood. By contrast,there was a high degree of interest and support for future R&D to reduce costs and build moreeffective technology by both groups of leaders.
Across both groups, the interest in future system planning is high and there was broad supportfor creating pan-Canadian energy plans or strategies. The leaders interviewed, however,expressed a similar preference to that revealed in the previous household survey,11 where thevalue of energy independence, even at the risk of lost employment, was extremely high, andsupport for abandoning or diminishing the role of the U.S. as a principal client and consumerof Canadian products was also high.
11 A. Turcotte, M.C. Moore and J. Winter, “Energy Literacy in Canada” (2012).
27
In sum, we can say that leadership in the country is generally knowledgeable regarding energymatters, but it does not treat this area as a separate and distinguishable category of publicpolicy planning. This fact diminishes and potentially masks some of the challenges emergingfor new long-term investment that is sustainable and serves both domestic and internationalmarkets. One difficulty here is that the integration of energy in all other sectors of the economymakes it hard to justify focused policies that target energy-only issues. Nonetheless, it wasclear to a majority of respondents that in the future several sub-issues were important forplanning and investment and, by inference, for society as a whole.
These include the ideas that energy planning and education are important for the country, andshould be improved and emphasized. Included in this category is the need for morecomprehensive public funding and support for energy research and development, as well astying appropriate additional charged costs to supporting the improvement of environmentalquality. Since trust of traditional organizations is low, including trust in government, progressin improving energy literacy should involve programs that link across categories, providingvalue, reliability and confidence, if changes in public behaviour are expected.
This suggests that the large-scale changes coming in the future, ranging from shifts in oil andgas dependence to alternative fuels and systems, must be the subject of more public attention,education and involvement, perhaps in the form of a national or regional strategy discussion onthe future of energy.
Ultimately, for all respondents, overall confidence in the future of the country is high. Thiscorrelates closely with opinions regarding the need to responsibly deal with environmentalimpacts associated with energy generation, transportation and use. However, we find aconsistent thread of pessimism regarding the price and availability of future energy supplies,coupled with a lack of information and knowledge regarding the supply of reliable andaccessible energy products and services, and actual patterns of use and demand.
28

APPENDIX A – ENERGY SURVEY QUESTIONS
[INTRO]
Hello, my name is ** from Feedback Research. The School of Public Policy at the Universityof Calgary has commissioned us to conduct a series of confidential interviews with CanadianLeaders. You should have received a recent email from ** informing you of the study. Wewould like to schedule a 15-minute telephone interview with (INSERT NAME). Alternatively,we can provide you with a secure email link. What would be the best option?
What would be a good time to Interview (INSERT NAME)
[SECOND INTRO]
Thank you for participating in this study. We want to reassure you that this study is private andconfidential and no firm or individual will be identified.
SECTION A: Warm-up
[A1]
In your opinion, what is the most important issue facing Canada today?
[VERBATIM RESPONSE]
[A2]
Using a scale of 0 to 10 where 0 is “not at all important” and 10 is “very important,” howimportant are each of the following issues in Canada right now?
[GRID ROWS; RANDOMIZE]
• Health care• Economy• Jobs/unemployment• Crime• Education• Environment• Energy
[GRID COLUMNS; SINGLE RESPONSE PER ROW]
• 0 – Not at all important• 1• 2• 3• 4• 5• 6• 7• 8• 9• 10 – Very important• Don’t know
29

SECTION B: Awareness and Familiarity
[B1]
How much would you say you know about each of the following?
[GRID ROWS; RANDOMIZE; SINGLE RESPONSE PER ROW]
• Energy generation in Canada• Energy distribution in Canada• Energy use in Canada• Energy conservation• Management of the by-products of energy generation (waste)
[GRID COLUMNS]
• Know a lot• Know a little• Heard of it but don’t know much• Never heard of it
[B2]
How much do you agree or disagree with the following statements?
[GRID ROWS; DO NOT RANDOMIZE; SINGLE RESPONSE PER ROW]
• “I have a good understanding of energy issues in Canada.”• “Leaders in my sector have a good understanding of energy issues in Canada.”
[GRID COLUMNS]
• Strongly agree• Somewhat agree• Somewhat disagree• Strongly disagree
[B3]
[IF DISAGREE TO “SECTOR LEADERS” IN B2]
What do you think that leaders in your sector do not understand about energy issues in Canada?
[VERBATIM RESPONSE]
[B4]
As far as you know, which one of the following is the major source of energy used in yourprovince?
[RANDOMIZE; SINGLE RESPONSE]
• Coal• Natural gas• Hydro• Wind power• Solar power• Nuclear
30

SECTION C: Energy Costs
[C1]
Over the past five years, would you say that energy costs in your sector have increased,decreased or stayed about the same?
[SINGLE RESPONSE]
• Increased • Decreased• Stayed about the same
[C2]
[IF “INCREASED” OR “DECREASED” IN C1]
How much do you agree or disagree that the change in energy costs over the past fiveyears has affected day-to-day operations in your sector?
[SINGLE RESPONSE]
• Strongly agree• Somewhat agree• Somewhat disagree• Strongly disagree
[C3]
[IF “STRONGLY/SOMEWHAT AGREE” IN C2]
How has the change in energy costs affected the day-to-day operations in your sector?
[VERBATIM RESPONSE]
[C4]
[IF “INCREASED” OR “DECREASED” IN C1]
How much do you agree or disagree that the change in energy costs over the past fiveyears has affected planning for the future in your sector?
[SINGLE RESPONSE]
• Strongly agree• Somewhat agree• Somewhat disagree• Strongly disagree
[C5]
[IF “STRONGLY/SOMEWHAT AGREE” IN C4]
How has the change in energy costs over the past five years affected planning for thefuture in your sector?
[VERBATIM RESPONSE]
31

[C6]
If you were to estimate the impact of energy costs over the past five years on your sector’stotal revenue, which statement would best characterize your view?
[SINGLE RESPONSE]
• Changes in energy costs have reduced revenue between 5% and 10%• Changes in energy costs have reduced revenue by more than 10%• Changes in energy costs have increased revenue• Energy costs have had no impact on revenue• Don’t Know
SECTION D: Environmental Concerns
[D1]
Using a scale of 0 to 10 where 0 is “not very sustainable” and 10 is “very sustainable” inyour opinion, how cost effective are the following sources of energy for Canada?
[GRID ROWS; RANDOMIZE]
• Coal• Natural gas• Hydro• Wind power• Solar power• Nuclear
[GRID COLUMNS; SINGLE RESPONSE PER ROW]
• 0 – Not at all sustainable• 1• 2• 3• 4• 5• 6• 7• 8• 9• 10 – Very sustainable• Don’t know
[D2]
Overall, how concerned would you say are leaders in your sector about the impact ofenergy generation on the environment?
[SINGLE RESPONSE]
• Very concerned• Somewhat concerned• Not too concerned• Not at all concerned
32
[D3]
Why do you say that?
[VERBATIM RESPONSE]
[D4]
As far as you know, what are the leaders in your sector doing or have already done toaddress issues related to energy costs? Please check all that apply.
[MULTIPLE RESPONSE, RANDOMIZE]
• Upgraded facilities, equipment (including commercial vehicles) or infrastructure to makethese more energy efficient
• Reduced power consumption in facilities or offices by at least 30%• Keep thermostat in facilities or offices set to 18 degrees Celsius or less during the winter
months• Keep thermostat in facilities or offices set to at least 25 degrees Celsius during the summer
months• Adjusted workplace schedules to reduce energy use during the hours when there is most
demand• Reduced transportation costs by eliminating all unnecessary or gratuitous driving or air travel
by employees • Replaced all light bulbs in facilities and offices with energy efficient light bulbs• Reduced commercial waste by at least 30%• Obtained a commercial energy audit• Other (specify)• None of these
[D5]
When it comes to the impact of energy generation on the environment, which of thefollowing statements regarding the role of leaders in your sector is closest to your ownview?
[SINGLE RESPONSE]
• Leaders in my sector should be doing more• Leaders in my sector should be doing less• Leaders in my sector are doing enough
[D6]
Why do you say that?
[VERBATIM RESPONSE]
33
[D7]
When it comes to the impact of energy generation on the environment, which of thefollowing statements regarding the role of the provincial government is closest to your ownview?
[RANDOMIZE; SINGLE RESPONSE]
• Provincial government should be doing more• Provincial government should be doing less• Provincial government is doing enough
[D8]
When it comes to the impact of energy generation on the environment, which of thefollowing statements regarding the role of the federal government is closest to your ownview?
[RANDOMIZE; SINGLE RESPONSE]
• Federal government should be doing more• Federal government should be doing less• Federal government is doing enough
[D9]
Why do you say that?
[VERBATIM RESPONSE]
SECTION E: Energy Planning
[E1]
When it comes to planning for the future energy needs of your sector, which of thefollowing statements regarding the role of leaders in your sector is closest to your ownview?
[RANDOMIZE; SINGLE RESPONSE]
• Leaders in my sector should be doing more• Leaders in my sector should be doing less• Leaders in my sector are doing enough
[E2]
Why do you say that?
[VERBATIM RESPONSE]
34

[E3]
When it comes to planning for the future energy needs of your sector, which of thefollowing statements regarding the role of government is closest to your own view?
[RANDOMIZE; SINGLE RESPONSE]
• Government should be doing more• Government should be doing less• Government is doing enough
[E4]
Why do you say that?
[VERBATIM RESPONSE]
[E5]
How much do you agree or disagree with the statement “planning for our future energyneeds requires greater investment in research and development”?
[SINGLE REPONSE]
• Strongly agree• Somewhat agree• Somewhat disagree• Strongly disagree
[E6]
[IF “STRONGLY/SOMEWHAT AGREE” IN E9]
[E7]
When it comes to planning for the future energy needs of the country, which of thefollowing statements regarding the role of leaders in your sector is closest to your ownview?
[RANDOMIZE; SINGLE RESPONSE]
• Leaders in my sector should be doing more• Leaders in my sector should be doing less• Leaders in my sector are doing enough
[E8]
Why do you say that?
[VERBATIM RESPONSE]
35
[E9]
When it comes to planning for the future energy needs of the country, which of thefollowing statements regarding the role of government is closest to your own view?
[RANDOMIZE; SINGLE RESPONSE]
• Government should be doing more• Government should be doing less• Government is doing enough
[E10]
Why do you say that?
[VERBATIM RESPONSE]
When it comes to investing in research and development for our future energy needs,which statement regarding the ratio of public to private investment is closest to your ownview?
• 100% government investment, with no private investment• 75% government investment and 25% private investment• 50% government investment and 50% private investment• 75% private investment and 25% government investment• 100% private investment, with no government investment
SECTION F: Energy Imports and Exports
[SPLIT SAMPLE: F1a; F1b]
[F1a]
Some people say that Canada’s energy policy should be focused on revenue generation forthe country even if it means that we have to import some of our energy from othercountries. Other people say that Canada’s energy policy should be focused on achievingenergy independence from the rest of the world (that is, no imports from other countries)even if it means reducing our profitability or the number of jobs.
Which of these two viewpoints is closest to your own?
• Canada’s energy policy should be focused on revenue generation for the country even if itmeans that we have to import some of our energy from other countries.
• Canada’s energy policy should be focused on achieving energy independence from the rest ofthe world (that is, no imports from other countries) even if it means reducing our profitabilityor the number of jobs.
36
[F1b]
Some people say that Canada’s energy policy should be focused on achieving energyindependence from the rest of the world (that is, no imports) even if it means reducing ourprofitability or the number of jobs. Other people say that Canada’s energy policy should befocused revenue generation for the country even if it means that we have to import some ofour energy from other countries.
Which of these two viewpoints is closest to your own?
• Canada’s energy policy should be focused on achieving energy independence from the rest ofthe world (that is, no imports from other countries) even if it means reducing our profitabilityor the number of jobs.
• Canada’s energy policy should be focused on revenue generation for the country even if itmeans that we have to import some of our energy from other countries.
[F2]
As you may know, currently up to 98% of certain Canadian energy exports go to theUnited States. In your opinion, how important is it that we reduce our reliance on theUnited States by exporting more of our energy to other countries?
[SINGLE RESPONSE]
• Very important
• Somewhat important
• Not too important
• Not at all important
SECTION G: Attitudes and Behaviours
[G1]
How much do you agree or disagree with the following statements?
[GRID ROWS; DO NOT RANDOMIZE; SINGLE RESPONSE PER ROW]
• “Preserving the quality of the environment is worth a 10 to 25% increase in energy costs inthe future”
• “If we could rely more on energy produced in Canada (that is, we could achieve “energyindependence”) the overall energy costs in our sector would go down”
• “Canada should limit exports of energy (e.g., oil, gas, coal) in order to preserve supplies forfuture use here at home”
[GRID COLUMNS]
• Strongly agree• Somewhat agree• Somewhat disagree• Strongly disagree
37

[G2]
Using a scale of 0 to 10 where 0 is “not at all trustworthy” and 10 is “very trustworthy,”how trustworthy do you consider the following as a source of information on energy issuesin Canada?
[GRID ROWS; RANDOMIZE]
• Oil and gas companies• Energy company executives• Canadian Association of Petroleum Producers • Provincial government• Federal government• City councillors• Environmental groups and activists • Community groups and activists• Economic experts• Academics • Local chamber of commerce• Other
[GRID COLUMNS; SINGLE RESPONSE PER ROW]
• 0 – Not at all trustworthy• 1• 2• 3• 4• 5• 6• 7• 8• 9• 10 – Very trustworthy• Don’t know
[G3]
What is your main source of information on energy issues?
[RANDOMIZE; SINGLE RESPONSE]
• Government reports• Industry reports• Television• Internet – general• Websites• Blogs• Local newspapers• National newspapers• Magazines• Radio• Other (specify)• None • Don’t Know
38

[G4]
Overall, how satisfied are you with the amount of information on energy issues that iscurrently available?
[SINGLE RESPONSE]
• Very satisfied• Somewhat satisfied• Not very satisfied • Not at all satisfied
[G5]
[IF NOT VERY/NOT AT ALL SATISFIED]
What specific information on energy issues would you like to see made available to you?
[VERBATIM RESPONSE]
[G6]
How much do you agree or disagree with the following statement: “More needs to be doneto increase public awareness of energy issues?”
• Strongly agree• Somewhat agree• Somewhat disagree• Strongly disagree
[G7]
[IF STRONGLY/SOMEWHAT AGREE IN G6]
What specific measures do you recommend to increase public awareness of energy issues?
[VERBATIM RESPONSE]
SECTION H: Profiling Questions
[H1]
What is the primary sector that you currently work in?
[VERBATIM]
[H2]
How long have you worked in your current sector?
[SINGLE RESPONSE]
• Less than five years• 6 years to 20 years• More than 20 years
39

[H3]
Does your organization use a commercial energy audit service to monitor its energy use?
[SINGLE RESPONSE]
• Yes• No• Don’t know
[H4]
As far as you know, in the past five years has your organization undertaken any initiativesto address its energy needs?
[SINGLE RESPONSE]
• Yes• No• Don’t know
[H5]
[IF “YES” IN H4]
What specific types of initiatives to address energy needs have been implemented by yourorganization?
[VERBATIM RESPONSE]
[H6]
[IF “YES” IN H4]
In your opinion, to what degree have the initiatives to address energy needs in yourorganization been effective? Please use a scale where 0 is “not at all effective” and 10 is“very effective.”
[SINGLE RESPONSE]
• 0 – Not at all effective• 1• 2• 3• 4• 5• 6• 7• 8• 9• 10 – Very effective • Don’t know
40

[H7]
[IF LESS THAN “8” IN H6]
What strategies would you recommend to improve the effectiveness of managing energyneeds in your organization?
[VERBATIM RESPONSE]
[H8]
[IF “NO” IN H4]
If your organization were to implement initiatives to address energy needs, what types ofinitiatives would you recommend?
[VERBATIM RESPONSE]
[SPLIT SAMPLE: H9a; H9b]
[H9a]
In the next five years, do you think the following aspects of energy use will improve, getworse, or stay the same?
[GRID ROWS; RANDOMIZE]
• Cost• Availability• Reliability or quality?• Environmental sustainability
[GRID COLUMNS]
• Improve• Get worse• Stay the same• Don’t Know
[H9b]
In the next 10 years, do you think the following aspects of energy use will improve, getworse, or stay the same?
[GRID ROWS; RANDOMIZE]
• Cost• Availability• Reliability• Environmental sustainability
[GRID COLUMNS]
• Improve• Get worse• Stay the same• Don’t Know
41

[H10]
In your opinion, are Canada’s best years yet to come in the future, or are they in the past?
• Canada’s best years are yet to come in the future• Canada’s best years are in the past
SECTION Z: Demographics
Thank you for your time and openness so far. We have just a few more questions to help usclassify your responses today.
[Z1]
Are you…
[SINGLE RESPONSE]
• Male?• Female?
[Z2]
In what year were you born?
[NUMERICAL RESPONSE: RANGE = 1900-1994]
[Z3]
Please enter the first three digits of your organization’s postal code in the space below.(IF MULTIPLE LOCATIONS – Headquarters)
[ALPHANUMERIC RESPONSE; FORMAT A1A]
[Z4]
Including yourself, how many people are currently employed in your organization?
[SINGLE RESPONSE]
• Less than 20• Between 21 and 99• 100 or more
[Z5]
What percentage of the total employees in your organization work in jobs which relate toenergy production or procurement?
[NUMERICAL RESPONSE 0-100]
42
[Z6]
What is the highest level of education that you have completed or the highest degree thatyou have received?
[SINGLE RESPONSE]
• Less than high school (Grades 1-8)• High school diploma or equivalent• College, CEGEP or other non-university certificate or diploma• Undergraduate university degree, certificate or diploma• Master’s degree• Degree in medicine, dentistry, veterinary medicine or optometry• Doctorate• None of the above• Prefer not to answer• Employment
[Z7]
Which one of the following categories best describes your current employment status?
[SINGLE RESPONSE]
• Employed full-time• Employed part-time• Self-employed• Currently between jobs• Retired
[Z8]
In which province do you live?
• Newfoundland and Labrador• Nova Scotia• Prince Edward Island• New Brunswick• Quebec• Ontario• Manitba• Saskatchewan• Alberta• B.C.• Nunavut• Northwest Territories• Yukon
[OUTRO]
Thank you very much for your valuable feedback. We greatly appreciate your participation inthis important survey. You may now close this browser window.
43
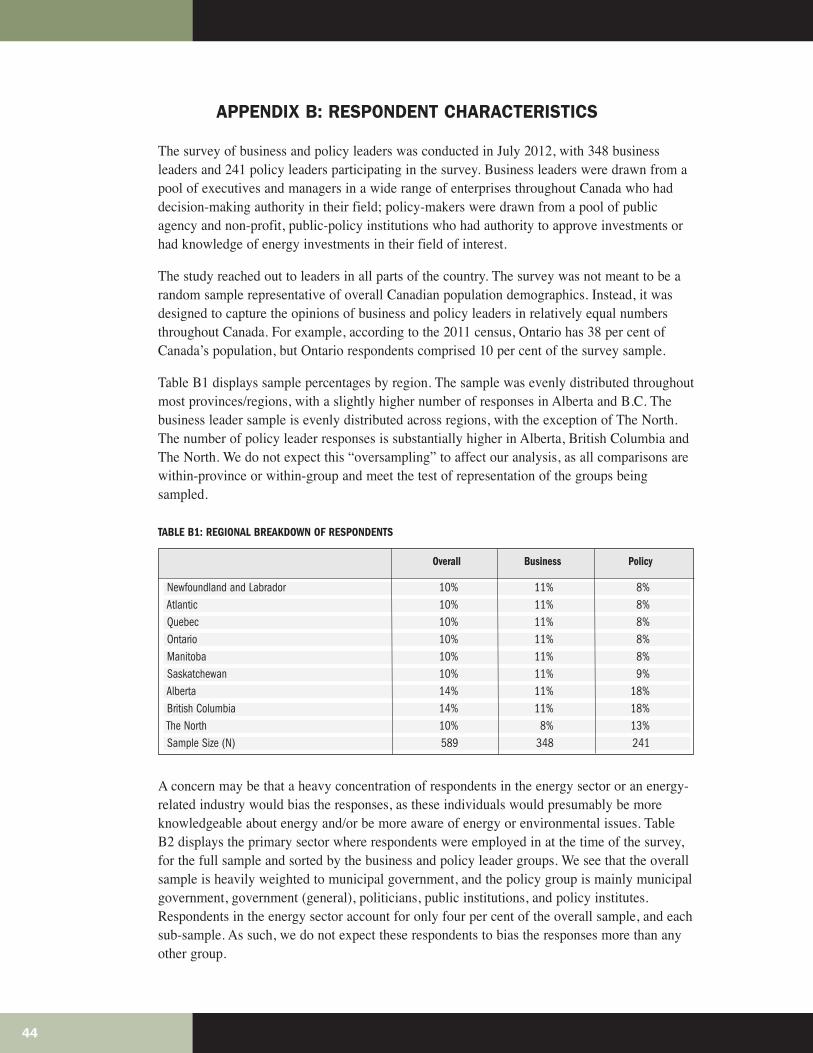
APPENDIX B: RESPONDENT CHARACTERISTICS
The survey of business and policy leaders was conducted in July 2012, with 348 businessleaders and 241 policy leaders participating in the survey. Business leaders were drawn from apool of executives and managers in a wide range of enterprises throughout Canada who haddecision-making authority in their field; policy-makers were drawn from a pool of publicagency and non-profit, public-policy institutions who had authority to approve investments orhad knowledge of energy investments in their field of interest.
The study reached out to leaders in all parts of the country. The survey was not meant to be arandom sample representative of overall Canadian population demographics. Instead, it wasdesigned to capture the opinions of business and policy leaders in relatively equal numbersthroughout Canada. For example, according to the 2011 census, Ontario has 38 per cent ofCanada’s population, but Ontario respondents comprised 10 per cent of the survey sample.
Table B1 displays sample percentages by region. The sample was evenly distributed throughoutmost provinces/regions, with a slightly higher number of responses in Alberta and B.C. Thebusiness leader sample is evenly distributed across regions, with the exception of The North.The number of policy leader responses is substantially higher in Alberta, British Columbia andThe North. We do not expect this “oversampling” to affect our analysis, as all comparisons arewithin-province or within-group and meet the test of representation of the groups beingsampled.
TABLE B1: REGIONAL BREAKDOWN OF RESPONDENTS
A concern may be that a heavy concentration of respondents in the energy sector or an energy-related industry would bias the responses, as these individuals would presumably be moreknowledgeable about energy and/or be more aware of energy or environmental issues. TableB2 displays the primary sector where respondents were employed in at the time of the survey,for the full sample and sorted by the business and policy leader groups. We see that the overallsample is heavily weighted to municipal government, and the policy group is mainly municipalgovernment, government (general), politicians, public institutions, and policy institutes.Respondents in the energy sector account for only four per cent of the overall sample, and eachsub-sample. As such, we do not expect these respondents to bias the responses more than anyother group.
44
Newfoundland and Labrador 10% 11% 8%Atlantic 10% 11% 8%Quebec 10% 11% 8%Ontario 10% 11% 8%Manitoba 10% 11% 8%Saskatchewan 10% 11% 9%Alberta 14% 11% 18%British Columbia 14% 11% 18%The North 10% 8% 13%Sample Size (N) 589 348 241
Overall Business Policy
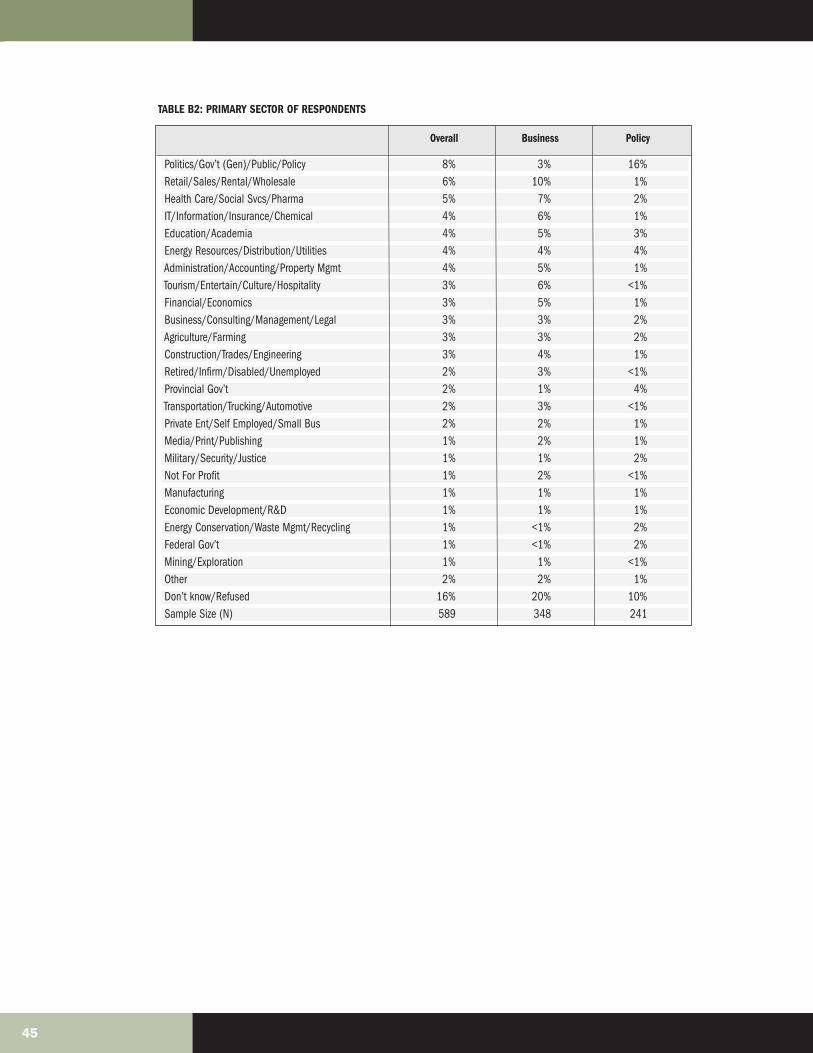
TABLE B2: PRIMARY SECTOR OF RESPONDENTS
45
Politics/Gov’t (Gen)/Public/Policy 8% 3% 16%Retail/Sales/Rental/Wholesale 6% 10% 1%Health Care/Social Svcs/Pharma 5% 7% 2%IT/Information/Insurance/Chemical 4% 6% 1%Education/Academia 4% 5% 3%Energy Resources/Distribution/Utilities 4% 4% 4%Administration/Accounting/Property Mgmt 4% 5% 1%Tourism/Entertain/Culture/Hospitality 3% 6% <1%Financial/Economics 3% 5% 1%Business/Consulting/Management/Legal 3% 3% 2%Agriculture/Farming 3% 3% 2%Construction/Trades/Engineering 3% 4% 1%Retired/Infirm/Disabled/Unemployed 2% 3% <1%Provincial Gov’t 2% 1% 4%Transportation/Trucking/Automotive 2% 3% <1%Private Ent/Self Employed/Small Bus 2% 2% 1%Media/Print/Publishing 1% 2% 1%Military/Security/Justice 1% 1% 2%Not For Profit 1% 2% <1%Manufacturing 1% 1% 1%Economic Development/R&D 1% 1% 1%Energy Conservation/Waste Mgmt/Recycling 1% <1% 2%Federal Gov’t 1% <1% 2%Mining/Exploration 1% 1% <1%Other 2% 2% 1%Don’t know/Refused 16% 20% 10%Sample Size (N) 589 348 241
Overall Business Policy

About the Authors
Michal C. Moore, (PhD) is an economist and Professor of Energy Economics at The School of Public Policy at the University ofCalgary.
He is the former chief economist at the U.S. National Renewable Laboratory in Golden Colorado, where he led a researchteam engaged in examining over-the-horizon issues for the U.S. Department of Energy and developing new methods forcross-cutting analysis. He is an economist and a former commissioner with the California Energy Commission, where heheld the designated economist position.
André Turcotte, (PhD) is an Associate Professor at Carleton University’s School of Journalism and Communication. Heis also the Graduate Supervisor for the Clayton H. Riddell Graduate Program in Political Management. He lectures inadvanced quantitative research, political communication theory and persuasion.
Over the years, Dr. André Turcotte has provided public opinion research advice to many of Canada’s leading privatesector firms as well as several government organizations. Between 1992 and 1993, he was the co-editor of The GallupPoll. He was part of the polling team for the Chretien Liberals in the 1993 Federal Election. Between 1994 and 2000,Dr. Turcotte was the official pollster of the Reform Party of Canada and its Leader, Preston Manning. During that period,he acted as a political commentator on all major Canadian TV networks both in English and French, as well as providingcommentary in print and on the radio. He has also published articles in academic journals and chapters in severalbooks. More recently, he has co-authored Dynasties and Interludes which look at the dynamics of electoral politics inCanada from 1867 to the present day.
Jennifer Winter, (PhD) is a Research Associate in Energy and Environmental Policy at The School of Public Policy, University ofCalgary. Prior to joining The School, she worked as a Research Advisor for Human Resources and Skills Development Canada inOttawa, analyzing Canadian labour markets.
P. Bernard Walp, Science operations staff, Gemini North Observatory, Hilo, Hawaii
46
DISTRIBUTIONOur publications are available online at www.policyschool.ca.
DISCLAIMERThe opinions expressed in these publications are the authors’alone and therefore do not necessarily reflect the opinions of thesupporters, staff, or boards of The School of Public Policy.
COPYRIGHTCopyright © 2013 by The School of Public Policy.
All rights reserved. No part of this publication may bereproduced in any manner whatsoever without writtenpermission except in the case of brief passages quoted incritical articles and reviews.
ISSN1919-112x SPP Research Papers (Print)1919-1138 SPP Research Papers (Online)
DATE OF ISSUEFebruary 2013
MEDIA INQUIRIES AND INFORMATIONFor media inquiries, please contact Morten Paulsen at403-453-0062.
Our web site, www.policyschool.ca, contains more informationabout The School’s events, publications, and staff.
DEVELOPMENTFor information about contributing to The School of PublicPolicy, please contact Courtney Murphy by telephone at403-210-7201 or by e-mail at [email protected].
ABOUT THIS PUBLICATIONThe School of Public Policy Research Papers provide in-depth, evidence-based assessments and recommendations on arange of public policy issues. Research Papers are put through a stringent peer review process prior to being madeavailable to academics, policy makers, the media and the public at large. Views expressed in The School of Public PolicyResearch Papers are the opinions of the author(s) and do not necessarily represent the view of The School of Public Policy.
OUR MANDATEThe University of Calgary is home to scholars in 16 faculties (offering more than 80 academic programs) and 36 ResearchInstitutes and Centres including The School of Public Policy. Under the direction of Jack Mintz, Palmer Chair in Public Policy,and supported by more than 100 academics and researchers, the work of The School of Public Policy and its studentscontributes to a more meaningful and informed public debate on fiscal, social, energy, environmental and internationalissues to improve Canada’s and Alberta’s economic and social performance.
The School of Public Policy achieves its objectives through fostering ongoing partnerships with federal, provincial, stateand municipal governments, industry associations, NGOs, and leading academic institutions internationally. ForeignInvestment Advisory Committee of the World Bank, International Monetary Fund, Finance Canada, Department of ForeignAffairs and International Trade Canada, and Government of Alberta, are just some of the partners already engaged withthe School’s activities.
For those in government, The School of Public Policy helps to build capacity and assists in the training of public servantsthrough degree and non-degree programs that are critical for an effective public service in Canada. For those outside ofthe public sector, its programs enhance the effectiveness of public policy, providing a better understanding of theobjectives and limitations faced by governments in the application of legislation.
47
48
RECENT PUBLICATIONS BY THE SCHOOL OF PUBLIC POLICY
FIXING SASKATCHEWAN'S POTASH ROYALTY MESS: A NEW APPROACH FOR ECONOMIC EFFICIENCY ANDSIMPLICITYhttp://policyschool.ucalgary.ca/?q=content/fix ing-saskatchewans-potash-royalty-mess-new-approach-economic-efficiency-and-simplicityDuanjie Chen and Jack Mintz | February 2013
EXPORT PIPELINES AND PROVINCIAL RIGHTS: HOW BEST TO GET TO THE WEST COAST AND ASIANMARKETShttp://policyschool.ucalgary.ca/?q=content/export-pipelines-and-provincial-rights-how-best-get-west-coast-and-asian-marketsF.L. (Ted) Morton | February 2013
PACIFIC BASIN HEAVY OIL REFINING CAPACITYhttp://policyschool.ucalgary.ca/?q=content/pacific-basin-heavy-oil-refining-capacityD. Hackett, L. Noda, S. Grissom, M.C. Moore and J. Winter | February 2013
SOVEREIGN WEALTH AND PENSION FUNDS CONTROLLING CANADIAN BUSINESSES: TAX-POLICYIMPLICATIONShttp://policyschool.ucalgary.ca/?q=content/sovereign-wealth-and-pension-funds-controlling-canadian-businesses-tax -policy-implicationsVijay Jog and Jack Mintz | February 2013
LABOUR SHORTAGES IN SASKATCHEWANhttp://policyschool.ucalgary.ca/?q=content/labour-shortages-saskatchewanJ.C. Herbert Emery | January 2013
TAX LOSS UTILIZATION AND CORPORATE GROUPS: A POLICY CONUNDRUMhttp://policyschool.ucalgary.ca/?q=content/tax-loss-utilization-and-corporate-groups-policy-conundrumStephen R. Richardson and Michael Smart | January 2013
A PRIMER ON THE GOVERNMENT OF ALBERTA'S BUDGEThttp://policyschool.ucalgary.ca/?q=content/primer-government-albertas-budgetRon Kneebone | January 2013
PROGRESSIVE INCREMENTALISM: U.S FOREIGN ECONOMIC POLICY OVER THE NEXT FOUR YEARShttp://policyschool.ucalgary.ca/?q=content/progressive-incrementalism-us-foreign-economic-policy-over-next-four-yearsJohn M. Curtis | January 2013
INSTRUMENTS FOR FOREST HABITAT CONNECTIVITYhttp://policyschool.ucalgary.ca/?q=content/instruments-forest-habitat-connectivityElizabeth A. Wilman | January 2013
THE SYRIAN CRISIS: WHAT IT MEANS FOR THE WORLD; IS THERE A ROLE FOR CANADA?http://policyschool.ucalgary.ca/?q=content/syrian-crisis-what-it-means-world-there-role-canadaFerry de Kerckhove | December 2012