energy and exergy analysis of kalina cycle system … · mation of physical exergy and chemical...
TRANSCRIPT

Journal of Mechanical Science and Technology 23 (2009) 1871~1876 www.springerlink.com/content/1738-494x
DOI 10.1007/s12206-009-0617-8
Journal of Mechanical Science and Technology
Energy and exergy analysis of kalina cycle system (KCS) 34
with mass fraction ammonia-water mixture variation† Nasruddin1,*, Rama Usvika2, Maulana Rifaldi1 and Agus Noor1
1Department of Mechanical Engineering, University of Indonesia, Depok, 16424, Indonesia 2PT. Rekayasa Industri, Jakarta, Indonesia
(Manuscript Received April 10, 2009; Revised April 29, 2009; Accepted May 4, 2009)
--------------------------------------------------------------------------------------------------------------------------------------------------------------------------------------------------------------------------------------------------------
Abstract Further utilization of waste heat produced by power plant system will increase the efficiency of the whole power plant
system. The Kalina Cycle offers alternative solution to generate additional power from waste heat or from low temperature geothermal resources. The modeling application on energy system is used to study the basic design of thermal system, which uses Kalina Cycle for further utilization of geothermal brine water. If this geothermal brine water were not used in the Kalina Cycle, it would be reinjected to the geothermal reservoir and its remaining energy content would have been wasted. The study of this process is done by Cycle Tempo 5.0 simulation software, to obtain the data of efficiency, energy and exergy that could be generated from the heat source. An ammonia-water mixture is used as a working fluid on Kalina cycle system (KCS) 34. In order to obtain the maximum power output and maximum efficiency, the system will be optimized on the mass fraction of working fluid and also on the turbine output pressure. The result of the study shows that the maximum efficiency and power output are achieved at 78% ammonia-water mixture.
Keywords: Ammonia-water; Exergy; Kalina cycle; Power plant --------------------------------------------------------------------------------------------------------------------------------------------------------------------------------------------------------------------------------------------------------
1. Introduction
In order to reduce primary energy consumption in the energy systems, to conserve energy and to reduce environmental pollution, new thermodynamic cycles have been investigated and developed during the past 20 years.
Kalina cycle system (KCS) 34 was invented by Dr. Alexander Kalina specifically for generating elec-tricity using low to medium temperature geothermal resources as a “topping” thermodynamic cycle prior to district heating. A flow diagram of Kalina cycle system (KCS) 34 is shown in Fig. 1. The basic flow parameters are shown on this diagram.
This research is made for studying, modeling and analysis of a Kalina cycle system (KCS) 34 system
that has been applied in Husavic, Iceland. The final conclusion is validation model and selection of working fluid composition that have improved effi-ciency of thermal power production.
In this study, the efficiency, energy and exergy that could be generated from heat source will be analysed. An ammonia-water mixture is used as a working fluid on Kalina cycle system (KCS) 34. In order to obtain the maximum power output and maximum efficiency, the system will be optimized on the mass fraction of working fluid and also on the turbine output pressure. The possibility of using Kalina cycle system (KCS) 34 in Indonesia was also be analysed where some para-meters are different from the Iceland conditions.
2. Methods
2.1 Cycle description
Fig. 1 shows the schematic diagram of Kalina cycle
†This paper was presented at the 7th JSME-KSME Thermal and FluidsEngineering Conference, Sapporo, Japan, October 2008.
*Corresponding author. Tel.: +62 21 727 0032, Fax.: +62 21 727 0033 E-mail address: [email protected] © KSME & Springer 2009
1872 Nasruddin et al. / Journal of Mechanical Science and Technology 23 (2009) 1871~1876
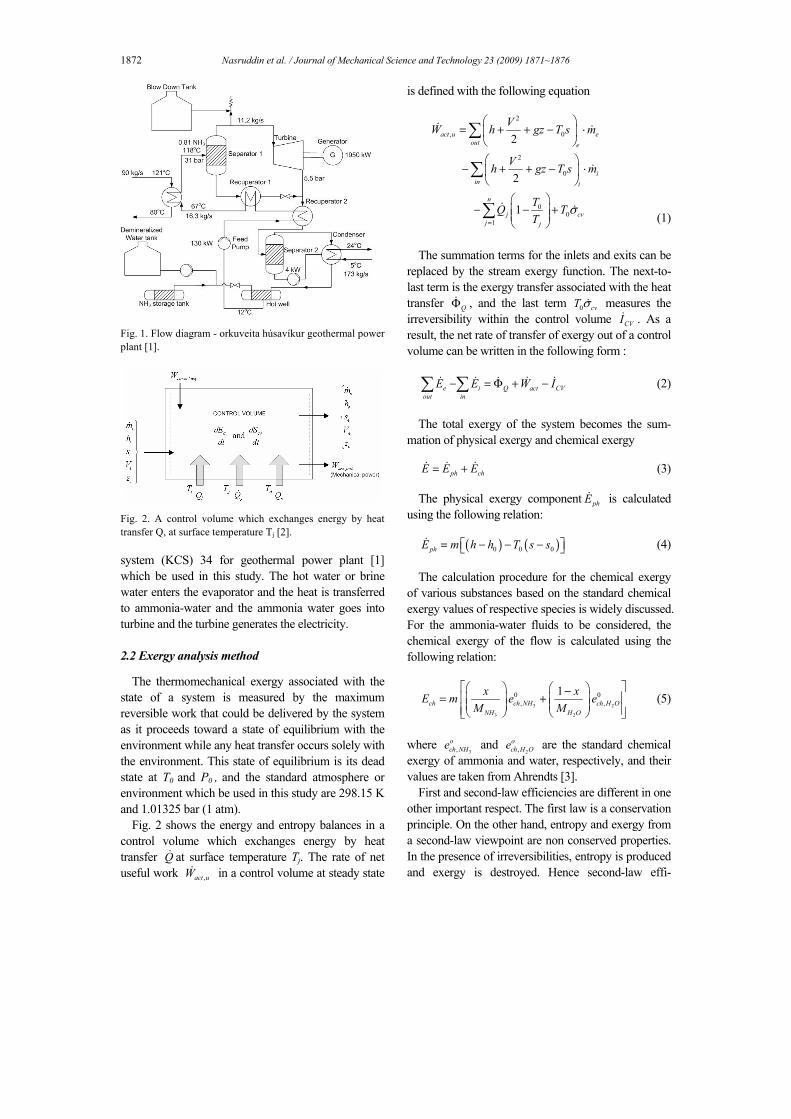
Fig. 1. Flow diagram - orkuveita húsavíkur geothermal power plant [1].
Fig. 2. A control volume which exchanges energy by heat transfer Q, at surface temperature Tj [2]. system (KCS) 34 for geothermal power plant [1] which be used in this study. The hot water or brine water enters the evaporator and the heat is transferred to ammonia-water and the ammonia water goes into turbine and the turbine generates the electricity.
2.2 Exergy analysis method
The thermomechanical exergy associated with the state of a system is measured by the maximum reversible work that could be delivered by the system as it proceeds toward a state of equilibrium with the environment while any heat transfer occurs solely with the environment. This state of equilibrium is its dead state at T0 and P0 , and the standard atmosphere or environment which be used in this study are 298.15 K and 1.01325 bar (1 atm).
Fig. 2 shows the energy and entropy balances in a control volume which exchanges energy by heat transfer Q& at surface temperature Tj. The rate of net useful work ,act uW& in a control volume at steady state
is defined with the following equation
2
, 0
2
0
00
1
2
2
1
act u eout e
iin i
n
j cvj j
VW h gz T s m
Vh gz T s m
TQ TT
σ=
⎛ ⎞= + + − ⋅⎜ ⎟
⎝ ⎠
⎛ ⎞− + + − ⋅⎜ ⎟
⎝ ⎠
⎛ ⎞− − +⎜ ⎟⎜ ⎟
⎝ ⎠
∑
∑
∑
& &
&
& & (1)
The summation terms for the inlets and exits can be
replaced by the stream exergy function. The next-to-last term is the exergy transfer associated with the heat transfer QΦ& , and the last term 0 cvT σ& measures the irreversibility within the control volume CVI& . As a result, the net rate of transfer of exergy out of a control volume can be written in the following form :
e i Q act CV
out inE E W I− = Φ + −∑ ∑& & & && (2)
The total exergy of the system becomes the sum-
mation of physical exergy and chemical exergy
ph chE E E= +& & & (3)
The physical exergy component phE& is calculated using the following relation:
( ) ( )0 0 0phE m h h T s s= ⎡ − − − ⎤⎣ ⎦& (4)
The calculation procedure for the chemical exergy of various substances based on the standard chemical exergy values of respective species is widely discussed. For the ammonia-water fluids to be considered, the chemical exergy of the flow is calculated using the following relation:
3 2
3 2
0 0, ,
1ch ch NH ch H O
NH H O
x xE m e eM M
⎡ ⎤⎛ ⎞ ⎛ ⎞−= +⎢ ⎥⎜ ⎟ ⎜ ⎟⎜ ⎟⎜ ⎟⎢ ⎥⎝ ⎠⎝ ⎠⎣ ⎦ (5)
where
3,och NHe and
2,och H Oe are the standard chemical
exergy of ammonia and water, respectively, and their values are taken from Ahrendts [3].
First and second-law efficiencies are different in one other important respect. The first law is a conservation principle. On the other hand, entropy and exergy from a second-law viewpoint are non conserved properties. In the presence of irreversibilities, entropy is produced and exergy is destroyed. Hence second-law effi-

Nasruddin et al. / Journal of Mechanical Science and Technology 23 (2009) 1871~1876 1873
ciencies measure losses in exergy during a process. A general definition of a second-law effectiveness is
useful exergy out exergy in
exergy destruction and losses 1exergy input
ε =
= − (6)
Gross thermal efficiencyTotal produced electric / mechanical power
Total energy input
= (7)
Total produced electric/mechanical power is Pgenerator
or power from generator, meanwhile the total own consumption is amount of energy use to run the plant auxiliaries, such as the pump or total Ppump and the total energy input is total heat absorbed to evaporator.
The net exergy efficiency is calculated by the following equation:
Exergy out - (aux. power) 100%Exergy absorbIIη = × (8)
2.3 Simulation and description
The schematic model of Kalina cycle system (KCS) 34 is built using Cycle-Tempo 5.0 [4] as shown in Fig. 3. For the input data were the actual data from Húsavík power plant. The hot brine as heat source is supplied through evaporator as a boiler transferring the heat to ammonia-water (1 and 2) and cooling water flow as heat sink is shown at 9 and 11. The input and parameter were made similar to the condition in Húsavík [5] . 2.4 Optimization
The optimum point of the system which indicated by the maximum power output of the turbine can be done with the two-step following procedures. First, we have to find the plausible range of ammonia-water
2323
2121
2020
1919
1818
1717
1616
1515
1414
1313
1212
1111
1010
99
88
77
66
55
44
33
22
11
17 16
15
14
13 11
10
9
8
7
F
6
H
54
3
H
21
Throttle valve
Pump 2Drain Tank
Generator
Pump 1
Cooling water
Return
Cooling water
Suply To District
Heating System
Hot Brine
Supply
Turbine
Condenser
HE-3
LT Recuperator
HE-2
Separator
Evaporator
HT Recuperator
HE-1 Fig. 3. Kalina cycle system (KCS) 34 scheme model.
mass fraction in the system without violation of the mass and energy balances. Based on the running simulation, we can find that the plausible value of the ammonia-water mass fraction, for Kalina cycle system (KCS) 34 in Indonesian conditions the value is between 78% and 85.5% of Ammonia mass fraction. But this range is not yet already optimized. The next step is to find the optimum turbine outlet pressure in order to get maximum power output in this mass fraction range. The ammonia-water mass fraction and turbine output must be in the range values mentioned in Table 2 due to the constraints in Indonesian environmental conditions. The optimization metho-dology is a searching method, which verified using Cycle Tempo 5.0.
The selection of lower limit and upper limit of ammonia-water mass fraction and turbine output are constrained by specific environmental conditions in typical Indonesian geothermal sites, such as: ambient temperature (18-24oC), available cooling water temperature, usually from the nearby river (20-24oC), relative humidity (70-95%), in order to produce the highest possible electrical output. These input conditions for our simulation are different with Iceland conditions. Furthermore the selection of ammonia-water fractions are also constrained by the specific thermodynamic properties of ammonia-water mixture as can be seen in the following T-X diagram.
3. Results and discussion
3.1 Model validation
The simulation results at the steady state condition will be compared to the real operation data of Kalina cycle geothermal power plant in Husavic, Iceland.
9.6 bar
0
20
40
60
80
100
120
140
160
180
200
0 0.1 0.2 0.3 0.4 0.5 0.6 0.7 0.8 0.9 1
Mass Fraction (Ammonia) [-]
Tem
pera
ture
[o C
]
7.4 bar
Fig. 4. T-x Diagram at optimum pressure range [6].

1874 Nasruddin et al. / Journal of Mechanical Science and Technology 23 (2009) 1871~1876
Table 1. Results comparisons.
Apparatus Parameter KCS 34 (real) KCS 34 (simulated)
Pump 1
Pout Tout
Power consumption
35 bar 13oC
130 kW
35 bar 12.9oC
100.59 kW
HT Rec. Tout 1 67oC 67oC
Evaporator
Pout 1 Tin 2 Tout 2 Tout 1
31 bar 121oC 80oC
118 oC
31 bar 121oC 80oC
118 oC (Brine Water) m& supply 90 kg/s 90 kg/s
Separator 1
m& ammonia-water
to turbine Mass fraction
to turbine
11.2 kg/s
+ 95%
12.37 kg/s
96.2%
Turbine Tin Tout Pout
+ 120oC 53 – 60oC
+ 5.5
118.2oC 52.21oC 5.5 bar
Condenser (cooling
water)
m& cooling water Tin 1 Tout 2
173 kg/s 5oC 24oC
173 kg/s 5oC 24oC
Generator Gross electric power 1,950 MW 1.959 MW
Table 1 shows that using the same input parameters,
the results of the simulation are very close with the actual site data, except the power consumption for the feed pump which has the value lower than the real condition. It can be explain that the assumed parameters for this feed pump are different from the real condition. Generally, it can be concluded that the scheme and all input for each apparatus could be used for further analysis.
The exergy flow of the above Kalina cycle is shown in Grassman Diagram as shown in Fig. 5. The dashed box refers to a component of the system.
The above Grassman diagram shows the exergy flow in the KCS 34 at the optimum condition. Apparatus denoted in number. I=Evaporator, II= separator, III=turbine, IV=generator, V=LT Recu-perator, VI=drain tank, VII=condenser, VIII= pump, IX= HT recuperator, all the unit is in kW. The losses in heat exchanging equipment such as apparatus number I, II, V, VII and IX are caused by pressure drop and heat transfer occurred. Turbine has the highest losses is caused by mechanical and isentropic efficiency.
In order to obtain the optimum performance of the system, the Kalina cycle should be optimized using the
2.07%
+1.4
9%3.
75%
1.24%
0.58%
1.48
%
1.58%
19.37%
8.95
%
33.68%
1959.28 kW
1979.07 kW
IX
VIIIVII
VI
V
IVIII
II
I
100%
1.57
%18
.74%
4406.625 kW
6304.18 kW
1481
.625
kW
6289
.1 k
W
3141.25 kW
371.
77 k
W
178.05kW
X
165.89 kW
3057
.77
kW
3585.36 kW3651.36 kW
3669.59 kW3775.84 kW
825.
64 k
W67
.90
kW
Fig. 5. Grassman diagram of exergy flow in KCS 34.
criteria of the highest achievable thermal as well as exergy efficiencies of the system which can be indicated with the maximum power produced in turbine, by varying the feasible ammonia-water mass fraction and turbine exit pressure as the most influential parameters. Table 3 shows that the in-creasing of the thermal efficiency (1st Law) will be followed by the increasing of the 2nd law efficiency.
3.2 KCS 34 application in Indonesia
Geothermal site in Iceland has different environ-ment and climatic conditions with Indonesia. In Indonesia, geothermal resources in normally located in the mountainous area, several hundred or thousands meters above sea level. However, the climatic condition in Indonesia is not as cold as Iceland. Typical air temperature at Indonesian Geothermal Site is around 18-24oC. The cooling water source is normally taken from nearby river, with river water having average temperature between 20-24oC. Meanwhile the cooling water supply temperature in Iceland is about 5oC. Hence, some thermodynamic parameters should be changed in order to obtain the maximum electric power and efficiency using Kalina cycle system (KCS) 34 for Indonesian conditions.
Kalina cycle system (KCS) 34 system parameters in the simulation model are then adjusted to find the optimum power output. To obtain the optimum power output, ammonia-water composition is considered as the most influenced parameters, so it will be varied starting from 78% up to 85.5% mass fraction, and each mass fraction acts as a constraint, which affects the outlet pressure from turbine (lower and upper limit). The results are shown in Table 2.
Fig. 6 shows that the highest electric power pro-duced can be achieved at 78% ammonia-water mass fraction and 7.4 bar outlet pressure, which can produce around 2.145 MW. Refer to Fig. 6 and Table 3, by

Nasruddin et al. / Journal of Mechanical Science and Technology 23 (2009) 1871~1876 1875
Table 2. Optimum pressure range.
Mass fraction Turbine output pressure
(%) ammonia (bar)
78 7.4 - 8.9
81 7.8 - 9.2
84 8.1 - 9.5
85.5 8.3 - 9.6
1600
1675
1750
1825
1900
1975
2050
2125
2200
7.25 7.75 8.25 8.75 9.25 9.75
Electric Power (kWatt)
Outlet Pressure (bar)
Mass Fraction 78% Mass Fraction 81%
Mass Fraction 84% Mass Fraction 85.8%
Fig. 6. Power output of the system as function of mass fraction and turbine outlet pressure.
46485052545658606264
7.25 7.5 7.75 8 8.25 8.5 8.75 9 9.25 9.5 9.75
Nett Efficiency
Outlet Pressure (bar)
Mass Fraction 78% Mass Fraction 81% Mass Fraction 84% Mass Fraction 85.5%
Fig. 7. Exergy efficiency as function of mass fraction and turbine outlet pressure. increasing the electric power output and lowering the outlet pressure, the efficiency will increase as well as the exergy efficiency.
For each mass fraction, Fig. 7 shows that the increasing of the outlet pressure from turbine will decrease the exergy efficiency, because of the exergy absorbed by the system from heat source is constant meanwhile the outlet pressure will increase leads to decreasing electrical power as useful work.
For mass fraction 85.5% the highest exergy efficiency is ηII = 69%, mass fraction 84% is 68.6%, mass fraction 81% is 67.1%, mass fraction 78% is 66.9%, and in a series the pressure are 8.3 bar ; 8.1 bar ; 7.8 bar ; and 7.4 bar, those are bottom line each mass fraction respectively.
Table 3. Energy and exergy efficiency.
Efficiency Energy net
(%) Energy net
(%) Exergy net
(%) Exergy net
(%) Mass
fraction Lowest Highest lowest Highest
78 8.64 11.24 51.41 66.88
81 8.75 10.97 53.45 67.06
84 8.84 10.91 55.63 68.62
85.5 8.95 10.81 57.15 69.00
This analysis refers to the study of Kalina cycle
system (KCS) 34 application in Indonesia, the important things are how to choose the mass fraction and outlet pressure from turbine that maximize electric power output and also system efficiency.
4. Conclusions
Kalina cycle system (KCS) 34 simulation model using Cycle Tempo 5.0 has been established to validate a model for real installation in Husavic, Iceland. The model has produced calculated electrical output of 1.959 MW, which is close to real condition in Husavic site which currently produces electrical power output of 1.950 MW.
It is concluded that if the outlet pressure from turbine is constant, by increasing the ammonia mass fraction the electrical power output will increase and so does the system efficiency. If the mass fraction is constant, by decreasing exit pressure from turbine, it will increase the electrical power output and the system efficiency.
The highest electrical power output for Kalina cycle system (KCS) 34, if it were applied in Indonesia, could be achievable using 78% mass fraction of ammonia-water and 7.4 bar exit pressure from turbine.
References
[1] H. A. Mlcak, Kalina Cycle Concepts for Low Temperature Geothermal. Journal of Geothermal Resources Council Transaction. 26 (2002) 712.
[2] T. J. Kotas, The Exergy Method of Thermal Plant Analysis, Krieger Publishing Company, Florida (1995).
[3] J. Ahrendts, Reference States, Energy, Vol. 5, (1980) 667-677.
[4] Cycle Tempo 5.0 TU Delft (Delft University of Technology), The Netherlands, (2002).

1876 Nasruddin et al. / Journal of Mechanical Science and Technology 23 (2009) 1871~1876
[5] H. Mlcak, M. Mirolli, H. Hjartarson and M. Ralph, Notes from the North: a Report on the Debut Year of the 2 MW Kalina Cycle® Geothermal Power Plant in Húsavík, Iceland, USA, April (2002).
[6] REFPROP 8, Reference Fluid Thermodynamic and Transport Properties, Standard Reference Database 23 NIST (2007).
Nasruddin is a faculty member of Mechanical Engineering De-partment University of Indo-nesia. He received his Bachelor degree from the same university. He then obtained Master of Engineering (MEng.) from K.U. Leuven (Belgium). He received
Doktor der Ingenieurwissenschaften (Dr.-Ing.) from RWTH Aachen University (Germany) in 2005. He has more than 13 years of experiences in lecture and research in engineering thermodynamics. He is a member of ASHRAE.
Rama Usvika received his Engineer degree in Mechanical Engineering from the University of Indonesia in 1996. He then obtained MSc degree in Energy and Environmental Engineering from Ecole des Mines de Nantes (France) in 2005. Mr. Rama
currently serves as Engineering Manager for Power Generation projects at PT. Rekayasa Industri, In-donesia’s premier Engineering & Construction com-pany. He has more than 12 years of experiences in engineering, procurement, construction and com-missioning of In-dustrial Process and Power plants. He is a member of ASME, the author and co-author of several papers on Power and Energy topics.