energy and exergy cost analysis of two different routes
TRANSCRIPT
EasyChair Preprint№ 4076
Energy and Exergy Cost Analysis of TwoDifferent Routes for Vinasse Treatment withEnergy Recovery
Milagros Cecilia Palacios-Bereche, Reynaldo Palacios-Berecheand Silvia Azucena Nebra
EasyChair preprints are intended for rapiddissemination of research results and areintegrated with the rest of EasyChair.
August 23, 2020

PROCEEDINGS OF ECOS 2020 - THE 33RD INTERNATIONAL CONFERENCE ON
EFFICIENCY, COST, OPTIMIZATION, SIMULATION AND ENVIRONMENTAL IMPACT OF ENERGY SYSTEMS
JUNE 29-JULY 3, 2020, OSAKA, JAPAN
1
Energy and exergy cost analysis of two different routes for vinasse treatment with energy
recovery
Milagros Cecilia Palacios-Berechea, Reynaldo Palacios-Bereche
b and Silvia Azucena
Nebrac
a Energy Engineering Modeling and Simulation Laboratory, Federal University of ABC, Santo André,
S.P., Brazil, [email protected] b Federal University of ABC, Santo André, S.P., Brazil, [email protected]
c Federal University of ABC, Santo André, S.P., Brazil/ University of Campinas, Campinas, S.P., Brazil,
Abstract:
The vinasse, produced as the bottom product of the distillation column of the ethanol production process, is the main liquid residue of this industry. It is a dark brown liquid of acidic nature and high organic matter content, thus making it a polluting effluent. Currently, it is used to fertilise and irrigate sugarcane fields, taking advantage of its nutrients and high water content. However, its disposition is still a problem because of its high production rate, which ranges from 10 to 15 litres of vinasse per litre of ethanol produced. This way, this work addresses the vinasse problem by a preliminary exergy cost analysis of three alternatives for vinasse disposition with energy recovery and a Base Case for comparison purposes; being the analysed cases: i) a Base Case (conventional production process), ii) the vinasse concentration with subsequent incineration, iii) the vinasse biodigestion with burning of the produced biogas in the boiler of the cogeneration system, and iv) the vinasse biodigestion and subsequent biogas purification aiming at the biomethane production. The preliminary results show the clean biogas of Case iii as the product with the highest unit exergy cost (7.03), followed by the biomethane of Case iv (with a unit exergy cost of 6.95), indicating that important irreversibilities are associated to the biogas production route.
Keywords:
Vinasse, Concentration, Incineration, Biodigestion, Exergy cost.
1. Introduction Brazil is the biggest producer of sugarcane in the world [1]; and the sugar and ethanol industry is
one of the most important sectors of the national economy. The Brazilian ethanol owes its success
to its economic competitiveness, which was achieved through economies of scale and technological
advances over time [2]. Nowadays, the Brazilian government is presenting the RenovaBio Program,
seeking to expand the biofuel production [3], being the ethanol among the biofuels contemplated.
Nonetheless, the main liquid residue of this production process, or vinasse, still represents a
problem for the industry, because of its difficult and costly disposition due to the large generated
volume. Furthermore, with an increasing ethanol production, encouraged by the RenovaBio
Program, the vinasse generated will increase as well.
The vinasse, produced as the bottom product of the distillation column, is a dark brown liquid of
acidic nature and high organic matter content, thus making it a polluting effluent. However, its solid
content is also rich in nutrients such as potassium, sodium, calcium, phosphorous, manganese and
nitrogen, among others, which can be used as fertilisers. This way, the fertirrigation, current vinasse
disposition, takes advantage of the nutrients in the solid content, and the high water content to
fertilise and irrigate at the same time by aspersing the vinasse over the sugarcane crops [4]. Still, the
main problem for its disposition is the high production rate, which ranges from 10 to 15 litres of
vinasse per litre of ethanol produced [4].

2
This way, this work addresses the vinasse problem by a preliminary exergy cost analysis of three
alternatives for vinasse disposition with energy recovery. Being these alternatives: a) vinasse
concentration with subsequent incineration, b) vinasse biodigestion with burning of the produced
biogas in the boiler of the cogeneration system, and c) vinasse biodigestion with subsequent biogas
purification aiming at the production of biomethane.
This type of analysis (exergoeconomics) is a tool to identify the location, magnitude and source of
thermodynamic losses (irreversibilities) in an energy system. Furthermore, it calculates the cost
associated with the exergy destruction and exergy losses; besides assessing the production costs of
each product in an energy-conversion system that has more than one product. The exergoeconomics
is also used to compare technical alternatives and facilitates feasibility and optimization studies [5].
2. Processes description and cases
2.1. Case i (Base Case): Conventional ethanol, sugar and electricity production process
A conventional ethanol, sugar and electricity production process was considered as a Base Case, for
comparison purposes. The conventional process comprises the following sub-systems: sugarcane
cleaning and juice extraction, juice treatment for sugar and ethanol production routes, juice
concentration, sugar crystallisation, sugar drying, must preparation and cooling, fermentation, and
distillation and rectification. The Base Case was assumed as a medium size plant processing 500
tonnes of sugarcane per hour, and consuming saturated steam at 2.5 bar for thermal requirements.
Figure 1 presents a simplified flowsheet of the Base Case.
Fig. 1. Flowsheet of Case i: Base Case. Modified from [6].
2.2. Case ii: Vinasse concentration with subsequent incineration
The vinasse concentration and incineration route, or Case ii, was considered as a Base Case coupled
to a vinasse concentration system, sending the concentrated vinasse to the boiler of the cogeneration
system. A seven-effect evaporation system and a concentration up to 65 Brix was considered, as
some manufactures already commercialise this type of vinasse evaporators [7]. Figure 2 shows the
simplified flowsheet of Case ii, while Figure 3 presents a simplified scheme of the vinasse
concentration system.

3
Fig. 2. Flowsheet of Case ii: Base Case + vinasse concentration system. Modified from [6].
Fig. 3. Scheme of the seven-effect evaporation system for vinasse.
2.3. Case iii: Biodigestion of vinasse
This case assumes the vinasse biodigestion to produce biogas, which is send to be burnt in the
boiler of the cogeneration system; as can be observed in Figure 4. Mass and energy balances were
carried out utilising the software EES®
according to [8]. The biogas cleaning was assumed to be
carried out in a desulphurisation system according to the THIOPAQ process. The parameters and
guidelines for biogas production and desulphurisation were taken from [9]. Figure 4 shows the
flowsheet for Case iii.
Fig. 4. Flowsheet of Case iii: Base Case + biodigestion + desulphurisation systems. Modified from
[6].
2.4. Case iv: Biomethane production from vinasse biodigestion
Finally, Case iv assumed a Base Case coupled to a biodigestion system, a desulphurisation system
for biogas cleaning, and a purification system for biomethane production. In the same way as in
Case iii, the THIOPAQ process was assumed for the desulphurisation process, while the water
scrubbing process was selected for biogas purification The parameters and guidelines for biogas
production, desulphurisation, and biogas purification were taken from [9]. Figure 5 depicts the
flowsheet of Case iv.

4
Fig. 5. Flowsheet of Case iii: Base Case + biodigestion + dessulphurisation + purification
systems. Modified from [6].
Figure 6 shows the flowsheet for the biogas purification system with water scrubbing according to
[10].
Fig. 6. Flowsheet of purification system with water scrubbing. Source [9].
2.5. Cogeneration system
In sugarcane-processing plants, a power steam cycle, using sugarcane bagasse as fuel, is commonly
used as the cogeneration system. This cogeneration system was based on a Rankine cycle,
producing steam at 65 bar and 520°C [11]. It supplies the requirements of steam, electricity and/or
mechanical work to the plant. A configuration assuming condensing-extraction steam turbines
(CEST), burning all the available bagasse to maximise the electricity surplus, was adopted. Figure 7
presents the scheme of the configuration system adopted.
Fig. 7. Configuration of the cogeneration system (CEST).

5
3. Methodology The main steps performed in the present work are listed below:
▪ Modelling and simulation of conventional production process (Base Case), alternative
technologies for vinasse energy use (Cases ii, iii and iv), and cogeneration system;
▪ exergy analysis;
▪ exergy cost assessment.
3.1. Conventional process, alternative technologies, and cogeneration system simulation
The software Aspen Plus™
V9 was used to simulate the conventional process of sugar, ethanol and
electricity production, thus performing mass and energy balances. The simulation was performed
according to previous studies [8,12]. Data from the literature were collected to perform the process
simulation, and the guidelines from [13–15] were followed. A flowsheet diagram of the simulated
conventional process is presented in Figure 8.
Fig. 8. Sugar and ethanol conventional production process simulated in Aspen Plus™
V9
The alternative technologies considered in this study, comprising vinasse concentration, vinasse
biodigestion, biogas cleaning and biomethane production, were simulated through mass and energy
balances using the software EES®; because of its faster convergence and ease of use.
The vinasse concentration and biodigestion were modelled according to previous works [8,12],
while the biogas cleaning and biomethane production followed the guidelines presented in [9].
A Rankine cycle was used to model the cogeneration system, considering a steam production at
65 bar and 520°C [11].
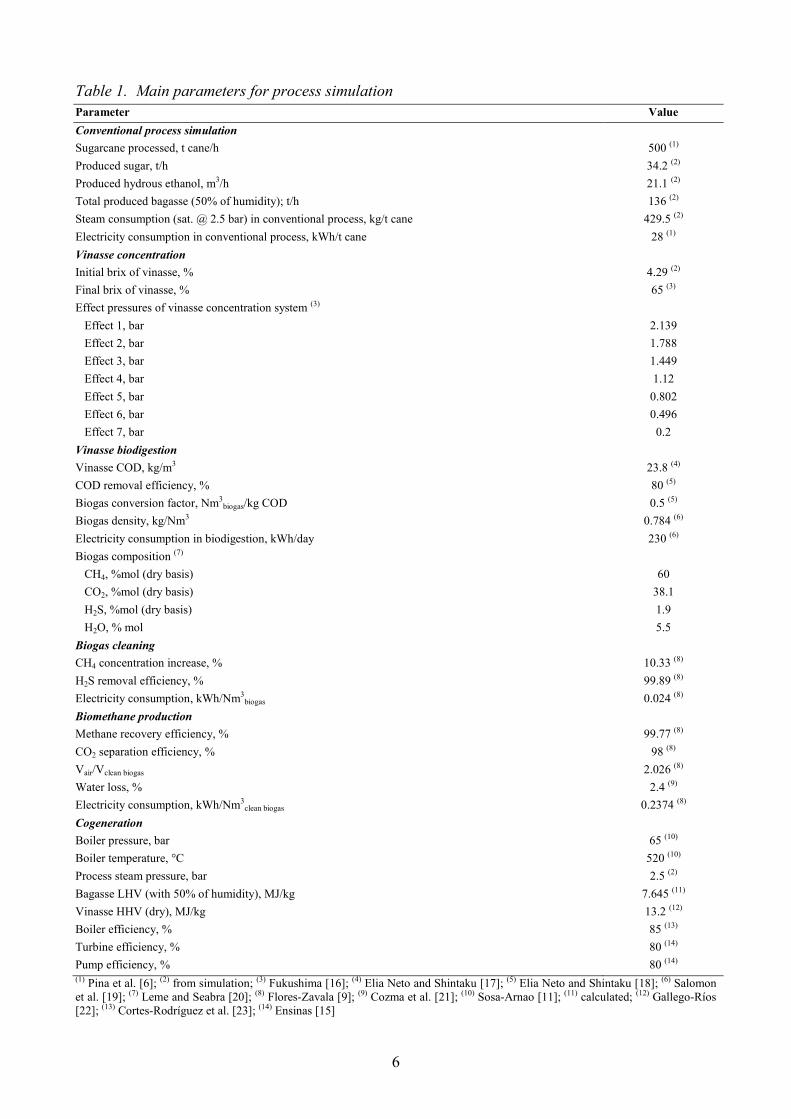
The main parameters for the process simulation are presented in Table 1.
6
Table 1. Main parameters for process simulation
Parameter Value
Conventional process simulation
Sugarcane processed, t cane/h 500 (1)
Produced sugar, t/h 34.2 (2)
Produced hydrous ethanol, m3/h 21.1 (2)
Total produced bagasse (50% of humidity); t/h 136 (2)
Steam consumption (sat. @ 2.5 bar) in conventional process, kg/t cane 429.5 (2)
Electricity consumption in conventional process, kWh/t cane 28 (1)
Vinasse concentration
Initial brix of vinasse, % 4.29 (2)
Final brix of vinasse, % 65 (3)
Effect pressures of vinasse concentration system (3)
Effect 1, bar 2.139
Effect 2, bar 1.788
Effect 3, bar 1.449
Effect 4, bar 1.12
Effect 5, bar 0.802
Effect 6, bar 0.496
Effect 7, bar 0.2
Vinasse biodigestion
Vinasse COD, kg/m3 23.8 (4)
COD removal efficiency, % 80 (5)
Biogas conversion factor, Nm3biogas/kg COD 0.5 (5)
Biogas density, kg/Nm3 0.784 (6)
Electricity consumption in biodigestion, kWh/day 230 (6)
Biogas composition (7)
CH4, %mol (dry basis) 60
CO2, %mol (dry basis) 38.1
H2S, %mol (dry basis) 1.9
H2O, % mol 5.5
Biogas cleaning
CH4 concentration increase, % 10.33 (8)
H2S removal efficiency, % 99.89 (8)
Electricity consumption, kWh/Nm3biogas 0.024 (8)
Biomethane production
Methane recovery efficiency, % 99.77 (8)
CO2 separation efficiency, % 98 (8)
Vair/Vclean biogas 2.026 (8)
Water loss, % 2.4 (9)
Electricity consumption, kWh/Nm3clean biogas 0.2374 (8)
Cogeneration
Boiler pressure, bar 65 (10)
Boiler temperature, °C 520 (10)
Process steam pressure, bar 2.5 (2)
Bagasse LHV (with 50% of humidity), MJ/kg 7.645 (11)
Vinasse HHV (dry), MJ/kg 13.2 (12)
Boiler efficiency, % 85 (13)
Turbine efficiency, % 80 (14)
Pump efficiency, % 80 (14)
(1) Pina et al. [6]; (2) from simulation; (3) Fukushima [16]; (4) Elia Neto and Shintaku [17]; (5) Elia Neto and Shintaku [18]; (6) Salomon
et al. [19]; (7) Leme and Seabra [20]; (8) Flores-Zavala [9]; (9) Cozma et al. [21]; (10) Sosa-Arnao [11]; (11) calculated; (12) Gallego-Ríos
[22]; (13) Cortes-Rodríguez et al. [23]; (14) Ensinas [15]

7
3.2. Exergy calculation
The exergy of each stream of the evaluated processes was calculated according to previous studies
[8,12]. A reference level was chosen at 25°C and 1.01325 bar, according to [24]. The total thermal
exergy (extot) was calculated as the sum of the physical (exphy) and chemical (exch) exergies [24]:
chphytot exexex . (1)
The physical exergy was calculated according to (2), neglecting the potential and kinetic
components:
000 ssThhex phy , (2)
where the subscript 0 indicated the reference level.
The chemical exergy is calculated, generally, considering the activity of the stream, as can be
observed in (3), considering the standard chemical exergy of pure components (first term) and the
losses of chemical exergy due to the dissolution process (second term), according to [24]:
n
i
n
i
iiuiich ayTRexyM
ex1 1
0 ln1
. (3)
Nevertheless, other approaches were followed for certain streams. Thus, when sucrose-containing
streams were contemplated (sugarcane, bagasse, juice, syrup, molasses, sugar), the specific exergy
was calculated according to the guidelines presented in [25]. On the other hand, for ethanol-
containing streams, the guidelines in [26] were followed. The vinasse, as it is produced and
concentrated, was considered as a technical fuel that contains small amounts of sulphur and ashes
[24] to calculate its chemical exergy, as in previous studies [8,12]. The streams participating in the
biodigestion route (biogas, clean biogas and biomethane) were considered as ideal solutions.
3.2. Exergy cost assessment
Since the exergy is an objective measure of the thermodynamic value of an energy carrier, it is also
closely related to the economic value of said carrier, because users pay for the potential of energy to
cause changes [5]. Thus, the exergoeconomic approach was utilised, since it integrates
thermodynamic and economic analysis through the exergy costing, which is the assignment of costs
to the exergy content of an energy carrier [5]. The Theory of Exergetic Cost [27] was followed to
perform the exergy cost assessment in this study.
An exergetic cost balance was performed in each sub-system of the production process of the
proposed cases (4), to calculate the exergetic cost of a flow:
outin BB , (4)
where represents the exergetic cost of each flow that enters (in) to, and goes out (out) from the
control volume.
According to [27], the exergetic cost of a flow ( ) is defined as the amount of exergy required to
produce said flow (5):
iii xEkB , (5)
where the exergetic cost of an i stream is determined by its unit exergetic cost and its total
exergy . The total exergy of a stream is calculated by its specific exergy (calculated in the
previous section) and the mass flow of the stream, which is given by the process simulation.
Applying (4) to all the sub-systems of the production processes of all the considered cases results in
a system of linear equations, where the unit exergetic cost remains unknown. Thus,
assumptions were made by following the propositions of the Theory of the Exergetic Cost [27],
resulting in additional equations that are required to resolve the equation system.
8
▪ A unitary value is assigned as the unit exergy cost of external inputs (sugarcane, freshwater,
chemicals).
1inputexternalk. (6)
▪ By-products of the control volume are assigned a unit exergy cost equal to the input (P4a).
inputproductby kk . (7)
▪ If a control volume has two or more product streams, then the same unit exergy cost is
assigned to all of them (P4b).
nproductproductproduct kkk ...21 . (8)
▪ The unit exergy cost of the energy carrier (steam, condensates, vapour bleeds) is determined
during its generation (at the boiler of the cogeneration system) and do not change throughout the
process.
bleedsvapourscondensatesteamprocesssteamlive kkkk . (9)
▪ The cost of the irreversibility associated with the operation of the condenser in the cogeneration
system, is added to the turbine control volume, thus increasing the unit exergy cost of the
electricity.
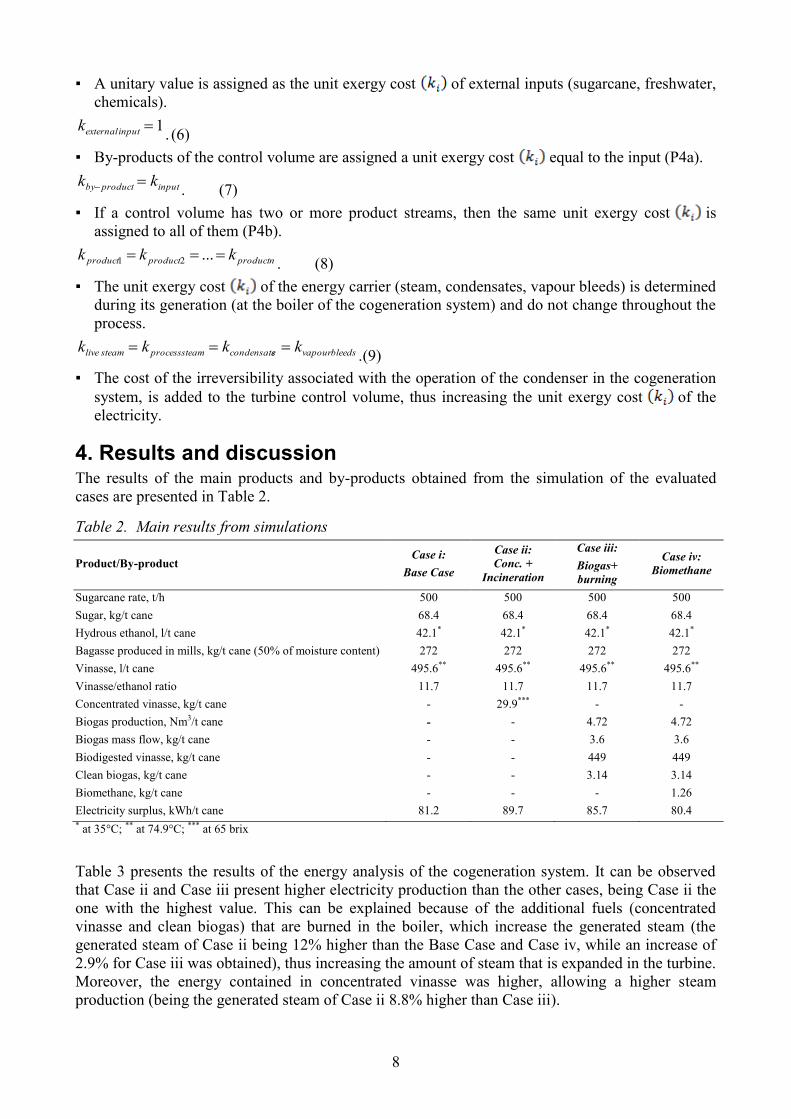
4. Results and discussion The results of the main products and by-products obtained from the simulation of the evaluated
cases are presented in Table 2.
Table 2. Main results from simulations
Product/By-product Case i:
Base Case
Case ii:
Conc. +
Incineration
Case iii:
Biogas+
burning
Case iv:
Biomethane
Sugarcane rate, t/h 500 500 500 500
Sugar, kg/t cane 68.4 68.4 68.4 68.4
Hydrous ethanol, l/t cane 42.1* 42.1* 42.1* 42.1*
Bagasse produced in mills, kg/t cane (50% of moisture content) 272 272 272 272
Vinasse, l/t cane 495.6** 495.6** 495.6** 495.6**
Vinasse/ethanol ratio 11.7 11.7 11.7 11.7
Concentrated vinasse, kg/t cane - 29.9*** - -
Biogas production, Nm3/t cane - - 4.72 4.72
Biogas mass flow, kg/t cane - - 3.6 3.6
Biodigested vinasse, kg/t cane - - 449 449
Clean biogas, kg/t cane - - 3.14 3.14
Biomethane, kg/t cane - - - 1.26
Electricity surplus, kWh/t cane 81.2 89.7 85.7 80.4 * at 35°C; ** at 74.9°C; *** at 65 brix
Table 3 presents the results of the energy analysis of the cogeneration system. It can be observed
that Case ii and Case iii present higher electricity production than the other cases, being Case ii the
one with the highest value. This can be explained because of the additional fuels (concentrated
vinasse and clean biogas) that are burned in the boiler, which increase the generated steam (the
generated steam of Case ii being 12% higher than the Base Case and Case iv, while an increase of
2.9% for Case iii was obtained), thus increasing the amount of steam that is expanded in the turbine.
Moreover, the energy contained in concentrated vinasse was higher, allowing a higher steam
production (being the generated steam of Case ii 8.8% higher than Case iii).

9
On the other hand, since in Case iv the biomethane is considered as an added value product suitable
for sale, the only fuel used in the cogeneration system is the bagasse. For this reason, the amount of
generated steam is the same as in the Base Case, and the electricity surplus resulted in a lower value
because of the additional electricity consumption for this process. Nevertheless, this decrease in
electricity surplus is not significant, being only 0.98% lower than the Base Case.
The electricity consumption in Cases iii and iv was higher in comparison to the others cases
(i and ii) because of the consumption of the biodigestion, desulphurisation and purification
processes, however, this increase was not significant (0.02 kWh/t of cane in Case iii and
0.71 kWh/t of cane in Case iv).
Table 3. Main results – Cogeneration: CEST Configuration
Parameter Case i:
Base Case
Case ii:
Conc. +
Incineration
Case iii:
Biogas +
burning
Case iv:
Biomethane
Steam: Generation and consumption
Generated steam in boiler 1, kg/t cane 552.2 618.6 568.3 552.2
Increasing of generated steam 1 due to new technology,
kg/t cane - 66.4 16.1 -
Steam consumption 2 for vinasse concentration,
kg/tcane - 96.8 - -
Total steam consumption 2, kg/t cane 429.5 526.2 429.5 429.5
Fuel used in cogeneration system
Bagasse, kg/t cane 253.4 253.4 253.4 253.4
Vinasse 3, kg/t cane - 29.9 - -
Clean biogas kg/t cane - - 3.14 -
Electricity
Electricity consumption; kWh/t cane 28 28 28.02 28.71
Electricity surplus, kWh/t cane 81.2 89.7 85.7 80.4 1 at 520°C and 65 bar; 2 saturated at 2.5 bar; *** at 65 brix
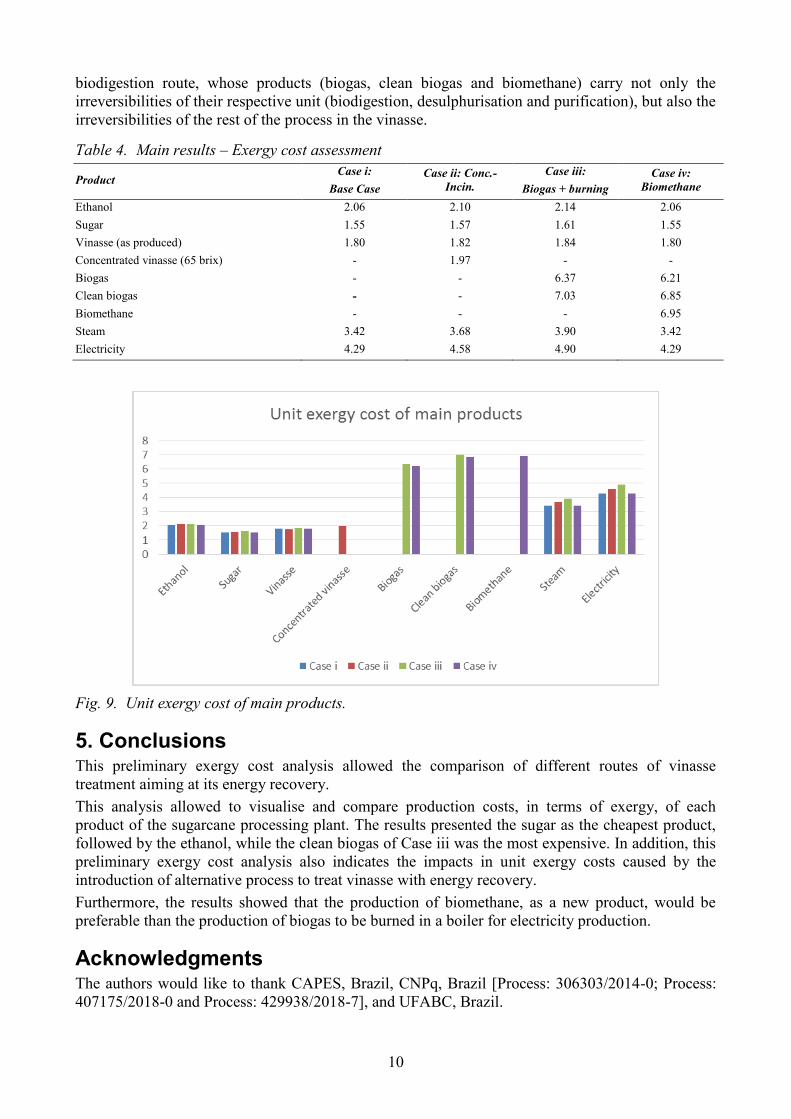
Table 4 and Figure 9 show the main results of the exergy cost assessment, presenting the unit
exergy cost of the main products of the evaluated cases. The unit exergy costs for electricity
resulted in the range of 4.2 and 4.9; while the unit exergy costs for steam resulted between 3.4 and
3.9.
Regarding the main products, Case ii presented slightly higher unit exergy costs in comparison to
the Base Case, because of the higher irreversibilities present in the first one. Furthermore, the unit
exergy costs of the products in Case iii were even higher than in Case ii, because the clean biogas
used in boiler has a significant unit exergy cost (7.03).
The clean biogas unit exergy cost in Case iii resulted in a higher value than the respective cost of
the same product in Case iv, because of the high electricity cost in Case iii.
Regarding the results of Case iv, the unit exergy costs of conventional products resulted the same as
in the Base case. The most expensive product in this case is the biomethane, with an exergy cost of
6.9, followed by the electricity and steam, these results show the influence of irreversibilities caused
by the biochemical reactions inherent to the biogas production.
Regarding the unit exergy cost of the vinasse that leaves the distillation column, Cases i and iv
presents the same value, since both cases presented the same electricity and steam costs, as
previously explained. On the other hand, it can be observed that the vinasse unit exergy cost in
Cases ii and iii present a higher value; because larger costs of inputs process: electricity and steam,
due to additional fuels (concentrated vinasse and biogas), with larger unit exergy costs, are used in
boilers.
It is worth mentioning that the cost distribution of The Theory of Exergetic Cost [27], penalise the
products at the end of the productive process, accumulating exergy cost [28]. Such is the case of the
10
biodigestion route, whose products (biogas, clean biogas and biomethane) carry not only the
irreversibilities of their respective unit (biodigestion, desulphurisation and purification), but also the
irreversibilities of the rest of the process in the vinasse.
Table 4. Main results – Exergy cost assessment
Product Case i:
Base Case
Case ii: Conc.-
Incin.
Case iii:
Biogas + burning
Case iv:
Biomethane
Ethanol 2.06 2.10 2.14 2.06
Sugar 1.55 1.57 1.61 1.55
Vinasse (as produced) 1.80 1.82 1.84 1.80
Concentrated vinasse (65 brix) - 1.97 - -
Biogas - - 6.37 6.21
Clean biogas - - 7.03 6.85
Biomethane - - - 6.95
Steam 3.42 3.68 3.90 3.42
Electricity 4.29 4.58 4.90 4.29
Fig. 9. Unit exergy cost of main products.
5. Conclusions This preliminary exergy cost analysis allowed the comparison of different routes of vinasse
treatment aiming at its energy recovery.
This analysis allowed to visualise and compare production costs, in terms of exergy, of each
product of the sugarcane processing plant. The results presented the sugar as the cheapest product,
followed by the ethanol, while the clean biogas of Case iii was the most expensive. In addition, this
preliminary exergy cost analysis also indicates the impacts in unit exergy costs caused by the
introduction of alternative process to treat vinasse with energy recovery.
Furthermore, the results showed that the production of biomethane, as a new product, would be
preferable than the production of biogas to be burned in a boiler for electricity production.
Acknowledgments The authors would like to thank CAPES, Brazil, CNPq, Brazil [Process: 306303/2014-0; Process:
407175/2018-0 and Process: 429938/2018-7], and UFABC, Brazil.
11
References [1] FAO – Food and Agriculture Organization of the United Nations. FAOSTAT – Available
at:<http://www.fao.org/faostat/en/#data/QC/visualize> [accessed 13.12.2018].
[2] Goldember J., Coelho S.T., Nastari P.M., Lucon O., Ethanol learning curve – The Brazilian
experience. Biomass and Bioenergy 2004;26(3):301-304.
[3] Coelho J.M., Presentation regarding the EPE and the Renovabio program (in Portuguese). V
Symposium of the Post-Graduation Course in Energy of the Federal University of ABC; 2017
Nov 28; Santo André, SP, Brazil.
[4] Freire W.J., Cortez L.A.B, Sugarcane vinasse (in Portuguese). Guaíba, Brazil: Agropecuaria;
2000.
[5] Tsatsaronis G., Thermoeconomic analysis and optimization of energy systems. Progress in
Energy and Combustion Science 1993;19(3):227-257.
[6] Pina E.A., Palacios-Bereche R., Chavez-Rodríguez M.F., Ensinas A.V., Modesto M., Nebra
S.A., Reduction of process steam demand and water-usage through heat integration in sugar and
ethanol production from sugarcane – Evaluation of different plant configurations. Energy
2017;138:1263-1280.
[7] CITROTEC. Vinasse concentration (in Portuguese). 13 SBA – Usina em numerous 2012 –
Available at:<http://www.stab.org.br/13_sba_palestras/24_citrotec_concentracao_vinhaca.pdf>
[accessed 28.4.2018].
[8] Palacios-Bereche M.C., Medina-Jimenez A.C., Palacios-Bereche R., Nebra S.A., Comparison
between two alternatives for the energy use of vinasse: Concentration-Incineration vs
Biodigestion. In: ENCIT 2018: Proceedings of the 17th Brazilian Congress of Thermal
Sciences and Engineering; 2018 Nov 25-28; Águas de Lindóia, SP, Brazil.
[9] Flores-Zavala B.A., Benefiting from the biogas produced in anaerobic biodigesters for
producing biomethane and electric energy (in Portuguese) [dissertation]. Santo André, SP,
Brazil: Federal University of ABC; 2016.
[10] Flores-Zavala B., Palacios-Bereche R., Nebra S.A., Exergy and energy analysis of the water
scrubbing process applied to biogas upgrading. In: ECOS 2015: Proceedings of the 28th
International Conference on Efficiency, Cost, Optimization, Simulation, and Environmental
Impact of Energy Systems; 2015 Jun 30 - Jul 3; Pau, France.
[11] Sosa-Arnao, J. H., 2018. Personal communication. São Paulo.
[12] Palacios-Bereche M.C., Palacios-Bereche R., Nebra S.A., Comparison through exergy
assessment of two alternatives for the energy use of vinasse : Concentration with incineration vs
. Biodigestion. In: ECOS 2018: Proceedings of the 31st International Conference on Efficiency,
Cost, Optimization, Simulation, and Environmental Impact of Energy Systems; 2018 Jun 17-22;
Guimarães, Portugal.
[13] Dias M.O.D.S., Simulation of the ethanol production process from sugarcane and sugarcane
bagasse, aiming at the process integration and production maximisation of energy and bagasse
surpluses (in Portuguese) [dissertation]. Campinas, SP, Brazil: University of Campinas; 2008.
[14] Palacios-Bereche R., Modelling and energy integration of the ethanol production process
from sugarcane biomass (in Portuguese). [thesis]. Campinas, SP., Brazil: University of
Campinas; 2011.
[15] Ensinas, A.V., Thermal integration and thermoeconomic optimisation applied to the sugar
and ethanol industrial process from sugarcane (in Portuguese). [thesis]. Campinas, SP., Brazil:
University of Campinas; 2008.
[16] Fukushima, N.A., Energy analysis of the integration of a vinasse concentration and
incineration system into a sugar and ethanol plant (in Portuguese). [dissertation]. Santo Andre,
SP, Brazil: Federal University of ABC; 2016.

12
[17] Elia Neto A., Shintaku A., Use and reuse of water and effluent generation. In: Handbook of
water reuse and conservation in the sugar-energy agro-industry (in Portuguese). Brasília:
National Agency of Water, Environment Ministry, 2009. p. 67–180.
[18] Elia Neto A., Shintaku A., Good Industrial Practices. In: Handbook of water reuse and
conservation in the sugar-energy agro-industry (in Portuguese). National Agency of Water,
Brasília: Environment Ministry, 2009, p. 181–256.
[19] Salomon K.R., Lora E.E.S., Rocha M.H., del Olmo O.A., Cost calculations for biogas from
vinasse biodigestion and its energy utilization. Sugar Industry 2011; 4:217-223.
[20] Leme R.M., Seabra J.E.A., Technical-economic assessment of different biogas upgrading
routes from vinasse anaerobic digestion in the Brazilian bioethanol industry. Energy
2017;119:754-766.
[21] Cozma P., Wukovits W., Mǎmǎligǎ I., Friedl A., Gavrilescu M., Modeling and simulation of
high pressure water scrubbing technology applied for biogas upgrading. Clean Technologies
and Environmental Policy 2014;17(2).
[22] Gallego-Ríos J.M., Effect of processing conditions on the properties of briquettes produced
from residues from the ethanol production: Characterisation and analysis of the
thermogravimetric behaviour (in Portuguese) [dissertation]. Santo André, SP, Brazil: Federal
University of ABC; 2017.
[23] Cortes-Rodríguez E.F., Nebra S.A., Sosa-Arnao J.H., Experimental efficiency analysis of
sugarcane bagasse boilers based on the first law of thermodynamics. Journal of the Brazilian
Society of Mechanical Sciences and Engineering 2017;39(3):1033-1044.
[24] Szargut J., Morris D.R., Steward F.R., Exergy analysis of thermal, chemical and
metallurgical processes. New York, USA: Hemisphere Publ. Corp; 1988.
[25] Ensinas A.V., Nebra S.A., Exergy Analysis as a Tool for Sugar and Ethanol Process
Improvement. In: Pélissier G., Calvet A., editors. Handbook of Exergy, Hydrogen Energy and
Hydropower Research. Nova Science Publishers. 2009. p. 125-160.
[26] Modesto M., Nebra S.A., Zemp R.J., A Proposal to Calculate the Exergy of Non Ideal
Mixtures Ethanol-Water Using Properties of Excess. In: Proceedings of the 14th European
Biomass Conference; 2005 Oct 17-21; Paris, France.
[27] Lozano M.A., Valero A., Theory of the Exergetic Cost. Energy. Energy 1993;18(9):939-
960.
[28] Silva, M.M., Repowering of power generation systems in the steel industry using
thermoeconomic analysis (in Portuguese). [thesis]. Campinas, SP., Brazil: University of
Campinas; 2004.

13
Appendix A Figures A.1 and A.2 present the flow sheet diagrams of the conventional production process (A.1)
and the vinasse concentration and biogas routes (A.2) depicting the participating process streams.
Fig. A.1. Flow sheet of conventional production process.
Fig. A.2. Flow sheet of concentration and biogas routes.

14
Appendix B Table B1 presents the description of the process streams used in this study.
Description
.
m
(kg/s)
T
(°C)
P
(bar)
brix,
%
ethanol,
%
ex
(kJ/kg)
1 Sugarcane 138.9 25 1.013 19.14 – 5760
2 Imbibition water 41.67 50 1.013 – – 54.1
3 Removed impurities 1.727 25 1.013 – – –
4 Loss of sucrose 0.3991 32.01 1.013 – – –
5 Bagasse 37.77 32.01 1.013 1.66 – 10,055
6 Raw juice 140.7 32.01 1.013 15.41 – 2,742
7 Raw juice – sugar production 98.46 32.01 1.013 15.41 – 2,742
8 Bagasse for filters – sugar production 0.4861 32.01 1.013 1.66 – 10,055
9 SO2 for sulphitation – sugar production 0.08333 25 1.013 – – 4,892
10 CaO for liming – sugar production 0.1258 25 1.013 – – 1,965
11 Water for Ca(OH)2 preparing –sugar production 1.963 25 1.013 – – 49.96
12 Vapour from flash – sugar production 1.275 99.02 0.97 – – 532.4
13 Water for polymer dilution – sugar production 1.458 25 1.013 – – 49.96
14 Water for filter – sugar production 2.917 25 1.013 – – 49.96
15 Filter cake – sugar production 3.966 87.55 1.013 – – –
16 Water for barometric condenser – sugar production 17.66 30 1.013 – – 50.13
17 Outlet of barometric condenser – sugar production 18.28 50.38 0.3 – – 54.15
18 Clarified juice – concentration 99.63 98.11 1.013 14.76 – 2,658
19 Vegetal Vapour – sugar production 14.06 115.3 1.69 – – 613.2
20 Condensate of vegetal vapour – sugar production 14.06 115 1.69 – – 97.76
21 Raw juice – ethanol production 42.2 32.01 1.013 15.41 – 2,742
22 Bagasse for filters – ethanol production 0.2083 32.01 1.013 1.66 – 10,055
23 Vapour from flash – ethanol production 0.5363 99.02 0.97 – – 532.4
24 CaO for liming – ethanol production 0.06944 25 1.013 – – 1,965
25 Water for Ca(OH)2 preparing – ethanol production 1.083 25 1.013 – – 49.96
26 Water for polymer dilution – ethanol production 0.625 25 1.013 – – 49.96
27 Water for filter – ethanol production 1.25 25 1.013 – – 49.96
28 Filter cake – ethanol production 1.681 86.11 1.013 – – –
29 Water for barometric condenser – ethanol
production 6.957 30 1.013 – – 50.13
30 Outlet of barometric condenser – ethanol
production 7.201 50.38 0.3 – – 54.15
31 Clarified juice – must preparation 42.97 96.45 1.013 14.67 – 2,641
32 Vegetal vapour – ethanol production 5.852 115.3 1.69 – – 613.2
33 Condensate of vegetal vapour – ethanol production 5.852 115 1.69 – – 97.76
34 Exhaust steam – juice evaporation system 44.18 127.4 2.5 – – 668.4
35 Condensate of exhaust steam – juice evaporation
system 42.42 127.4 2.5 – – 110.7
36 Vegetal vapour for pan 1– crystallisation 11.39 115.3 1.69 – – 613.2
37 Vegetal vapour for pan 2 – crystallisation 1.825 115.3 1.69 – – 613.2
38 Condensate of vegetal vapour – first effect 7.332 115 1.69 – – 97.76
39 Condensate of vegetal vapour – second effect 8.035 107.3 1.307 – – 90.41
40 Condensate of vegetal vapour – third effect 8.737 97.63 0.93 – – 81.94
41 Condensate of vegetal vapour – fourth effect 9.495 83.27 0.54 – – 71.04
42 Water for barometric condenser – juice
concentration 298.9 30 1.013 – – 50.13
43 Outlet of barometric condenser – juice
concentration 306.2 50.18 0.16 – – 54.08
44 Syrup 22.62 55.5 0.16 65 – 11,422
45 Syrup for crystallisation 21.5 55.5 0.16 65 – 11,422
46 Water for centrifuge 1 – crystallisation 1.748 107.4 6 – – 90.94
47 Water for pan 2 – crystallisation 0.3942 107.4 6 – – 90.94
48 Water for centrifuge 2 – crystallisation 1.291 107.4 6 – – 90.94
49 Water for molasses dilution – crystallisation 0.653 107.4 6 – – 90.94
50 Condensate of vegetal vapour from pan 1 11.39 115 1.69 – – 97.76
51 Condensate of vegetal vapour from pan 2 1.825 115 1.69 – – 97.76
52 Water for barometric condenser – crystallisation 283.3 30 1.013 – – 50.13
53 Outlet of barometric condenser – crystallisation 293.2 50.39 0.16 – – 54.15
54 Wet sugar 9.498 69.63 0.16 99.9 – 17,596
55 Molasses 6.147 57.68 0.16 73 – 12,824
56 Cold air – sugar drying 4.54 25 1.013 – – –
57 Exhaust steam – sugar drying 0.1566 127.4 2.5 – – 668.4
58 Condensate of exhaust steam – sugar drying 0.1566 127.4 2.5 – – 110.7

15
59 Wet air 4.54 25 1.013 – – –
60 Dry sugar 9.498 25 1.013 99.9 – 17,537
61 Syrup for must preparation 1.26 55.5 0.16 65 – 11,422
62 Water for must dilution 2.109 25 1.013 – – 49.96
63 Cooling water for must 521 25 1.013 – – 49.96
64 Outlet of cooling water 521 30 1.013 – – 50.13
65 Water for gas separation – fermentation 1.888 25 1.013 – – 49.96
66 Separated CO2 4.433 30.8 1.013 – – –
67 Water for centrifuge – fermentation 13.28 25 1.013 – – 49.96
68 Yeast purge 0.6988 29.78 1.013 – – –
69 Nutrient for yeast (NH3) 0.01557 25 1.013 – – 19,841
70 H2SO4 for pH regulation 0.0006944 25 1.013 – – 1,666
71 Water for yeast treatment 11.02 25 1.013 – – 49.96
72 Wine 73.43 29.86 1.013 – 6.153 2,183
73 Gases separated – distillation 0.08617 35 1.338 – 9.028 –
74 Second-grade ethanol 0.09807 35 1.338 – 88.64 26,135
75 Fusel oil 4 0.008333 90.32 1.16 – 25.2 –
76 Fusel oil 26 0.02444 82.28 1.16 – 83.3 –
77 Phlegmasse 5.67 103.6 1.16 – 0.219 169.9
78 Vinasse (as diluted solution) 62.88 74.86 1.393 4.39 0.02049 415.7
79 Hydrated ethanol 4.667 35 1.16 – 93.77 27,641
80 Exhaust steam – distillation 15.31 127.4 2.5 – – 668.4
81 Condensate of exhaust steam – distillation 15.31 127.4 2.5 – – 110.7
82 Cooling water – distillation 931.5 25 1.013 – – 49.96
83 Outlet of cooling water 931.5 30 1.013 – – 50.13
84 Vinasse (as solid fuel) 62.88 74.86 1.393 4.39 0.02049 651.4
85 Exhaust steam – vinasse concentration 13.44 127.4 2.5 – – 668.4
86 Condensate of exhaust steam – vinasse
concentration 13.44 127.4 2.5 – – 110.7
87 Condensate of vegetal vapour – 1st effect of
vinasse concentration system 7.399 122.3 2.139 – – 105.2
88 Condensate of vegetal vapour – 2nd effect of
vinasse concentration system 7.825 116.7 1.788 – – 99.43
89 Condensate of vegetal vapour – 3rd effect of
vinasse concentration system 8.203 110.3 1.449 – – 93.19
90 Condensate of vegetal vapour – 4th effect of
vinasse concentration system 8.527 102.8 1.12 – – 86.35
91 Condensate of vegetal vapour – 5th effect of
vinasse concentration system 8.788 93.58 0.802 – – 78.66
92 Condensate of vegetal vapour – 6th effect of
vinasse concentration system 8.967 81.12 0.496 – – 69.58
93 Water for barometric condenser – vinasse
concentration 252.3 30 1.013 – – 50.13
94 Outlet of barometric condenser – vinasse
concentration 261.4 50.38 0.3 – – 54.15
95 Concentrated vinasse 4.15 60.07 0.2 65 – 8,935
96 Electricity for vinasse biodigestion – – – – – 9.583*
97 Electricity for juice extraction – – – – – 9200*
98 Electricity for juice treatment – sugar production – – – – – 450*
99 Electricity for juice treatment – ethanol production – – – – – 450*
100 Electricity for juice concentration – – – – – 900*
101 Electricity for sugar crystallisation – – – – – 1800*
102 Electricity for sugar drying – – – – – 150*
103 Electricity for fermentation – – – – – 600*
104 Electricity for distillation – – – – – 450*
105 Bagasse for self-consumption 1.889 32.01 1.013 1.66 – 10,055
106 Bagasse for boiler 35.19 32.01 1.013 1.66 – 10,055
107 Bagasse surplus 0 32.01 1.013 1.66 – 10,055
108 Steam generated in boiler A 520 65 – – 1,462
109 Process steam B 127.4 2.5 – – 668.4
110 Condensates of process steam (return to boiler) C 102 2.09 – – 85.75
111 Make-up water – cogeneration system D 25 2.09 – – 50.07
112 Electricity for pump 1 – cogeneration system – – – – – E*
113 Electricity for pump 2 – cogeneration system – – – – – F*
114 Biodigested vinasse 62.37 30 1.013 – – 130.3
115 Biogas 0.5138 30 1.013 – – 18,499
116 Electricity for desulphurisation – – – – – 56.62*
117 Effluent from desulphurisation 0.0767 35 1.1 – – –
118 Clean biogas 0.4371 35 1.1 – – 19,795
119 Air – biogas purification 1.46 25 1.01 – – –

16
120 Electricity for purification – – – – – 344.7*
121 Make-up water – biogas purification 2.404 20 1.1 – – 50.14
122 Water purge 2.404 15 1.1 – – 50.68
123 Exhaust stream – biogas purification 1.723 15 1.1 – – 64.59
124 Biomethane 0.1748 15 10 – – 49,116 * Total exergy; A: 76.69 kg/s for Case i, 85.91 kg/s for Case ii, 78.93 kg/s for Case iii, 76.69 kg/s for Case iv; B: 59.65 kg/s for
Case i, 73.09 kg/s for Case ii, 59.65 kg/s for Case iii, 59.65 kg/s for Case iv; C: 57.26 kg/s for Case i, 70.17 kg/s for Case ii,
57.26 kg/s for Case iii, 57.26 kg/s for Case iv; D: 2.379 kg/s for Case i, 2.924 kg/s for Case ii, 2.386 kg/s for Case iii, 2.379 kg/s for
Case iv; E: 2.619 kW for Case i, 1.848 kW for Case ii, 2.998 kW for Case iii, 2.619 kW for Case iv; F: 640.2 kW for Case i,
717.9 kW for Case ii, 659.6 kW for Case iii, 640.2 kW for Case iv