energy audit in wasas of punjab
TRANSCRIPT
Energy Audit of WASAsEngr. Abid Hussainy
Sr Specialist Environment Division The Urban Unit Lahore
22th February 2015 ( PWON Bhurbhan)

What is ENERGY AUDIT?
Inspection, Survey & Analysis Of Current
Energy Needs & Flows
Analysis Of Potential Areas of Interventions
(Weaknesses And Deficiencies),
Identification Of Effective Possibilities
Of Energy Savings Without Reducing the
Output

PCGIP- DLI 4 (Revenue Collection System)
• To Reduce Energy Consumption• Energy Efficient system • Improve service delivery - • Safety for the Staff • Asset Life is improved
Why Energy Audit in WASAs?
Old Energy Bill New Energy Bill
0
2
4
6
8
10
12
Billing

Role of Urban UnitCapacity Building•Training Workshops•Hands on Training of Instrumentation
Design of Tools•Technical Information Performa•Billing Information Performa•Conditional Survey Performa•EA Performa
Support in Data Collection•Conditional Survey•Data Entry
Data Analysis & Planning •Decision Making

Urban Unit Energy Audit Team
Engr. Abid Shah Hussainy – Task Manager
Engr. Rao Ali Raza
Mr. Syed M. Usman Ali
Mr. Abdul Basit

2 Day Energy Audit Training of WASA officials in Collaboration with NED (24-25 October, 2014) by International Trainer /Expert Mr Hashmi from Canada • Training to 15 WASA officials from 5 Cities• EA Exercises • Development of EA Tools (Technical, Billing, Conditional Survey &
Energy Audit Performa) for TWs, DSs, W&WWT Plants.
Hands on Training in the field by Urban Unit Experts in All WASAs ( 25 November- 19 December)• Instrumentation• Support in Data Collection• On Site Energy Audit Training• Conditional Survey
Urban Unit Capacity Building Initiative

Energy Audit Activities Status
Technical Data/ EA Assets
Billing Detail June 13 to June 14
Conditional Survey
Available Data Entry & Analysis by UU 0
50
100
WASA Lahore
Technical Data/ EA Assets
Billing Detail June 13 to June 14
Conditional Survey
Available Data Entry & Analysis by UU 0
50
100
WASA Rawalpindi
Technical Data/ EA Assets
Billing Detail June 13 to June 14
Conditional Survey
Available Data Entry & Analysis by UU 0
50
100
WASA Gujranwala
Technical Data/ EA Assets
Billing Detail June 13 to June 14
Conditional Survey
Available Data Entry & Analysis by UU 0
50
100
WASA Multan
Technical Data/ EA Assets
Billing Detail June 13 to June 14
Conditional Survey
Available Data Entry & Analysis by UU 0
50
100
WASA Faisalabad

Tubewell & Disposal Station Detail
Lahore Rawalpindi Multan Faisalabad Gujranwala
491
362
102 82 6799
21 43 22
Supply Tubewells & Disposal Stations
Supply Stations Disposal Stations
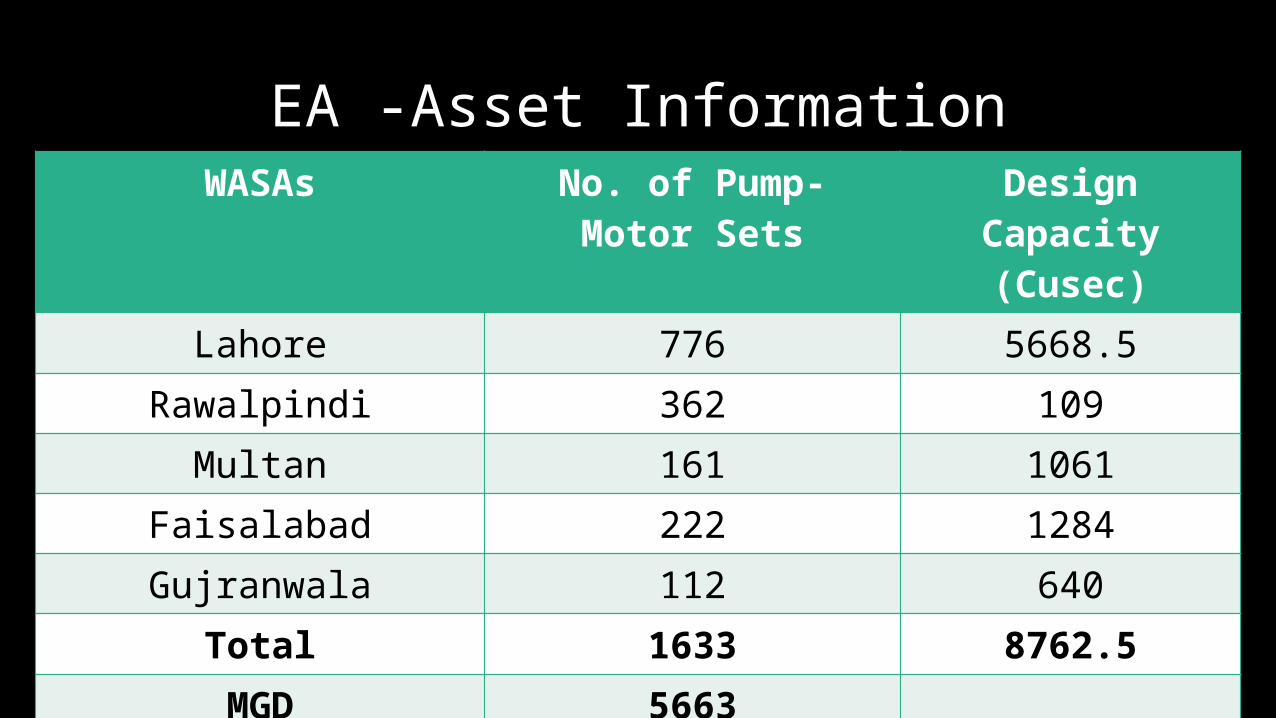
EA -Asset InformationWASAs No. of Pump- Motor Sets Design Capacity
(Cusec)Lahore 776 5668.5
Rawalpindi 362 109Multan 161 1061
Faisalabad 222 1284Gujranwala 112 640
Total 1633 8762.5MGD 5663

Comparison of Load Capacity MW ( Installed Vs Sanctioned)
WASA Lahore WASA Rawalpindi WASA Multan WASA Faisalabad WASA Gujranwala0
10
20
30
40
50
60
70
80
90
64.6
6.8
20.2
11.06.5
78.3
11.514.3
19.9
7.4
Installed Load (MW) Sanctioned Load (MW)

Energy Audit
Part 1
Part 2
Part 3

Energy Audit Findings
Conditional Survey & Analysis-Part 1

Conditional Survey
• Provide an orientation of the entire facility to observe the condition of each asset and the factors those influencing the asset condition towards operation.• Identify areas that warrant further examination for operational &
maintenance practices and potential energy management opportunities.• Identifies obvious opportunities for the room of improvements in the
operation and management side.

Conditional Survey Parameters-24 Parameters
Physical Condition of
Pump
Lubricant Leakage
Water Leakage
Cable Insulation
Cable Sizing
Transformer Condition
Energy Meter Condition
Performance of Starter
Pump Vibration
Pump Noise
Motor Temperature
Control
Cooling Fan Condition
Piping Condition
Condition of Return Valve
Pressure Gauge Condition
Ventilation

Conditional Assessment of E-Assets
•Rating <=40 % Poor•Rating <=60% Fair•Rating <=70 % Good•Rating >70 % Excellent

WASA Lahore – Conditional Survey Result & Financing
Conditional AssessmentRating <=40 % PoorRating <=60% FairRating <=70 % GoodRating >70 % Excellent
Poor 21%
Fair 64%
Good6%
Excellent 8%
Disposal StationsPoor 20%
Fair 60%
Good16%
Excellent 5%
Tubewell StationsRehabilitation Cost
for TW & DS62.10 million
(BOQs for Rehabilitation have
been Prepared)

WASA Multan – Conditional Survey Result
Conditional AssessmentRating <=40 % PoorRating <=60% FairRating <=70 % GoodRating >70 % Excellent
Poor 4%
Fair 38%
Good21%
Excel-lent 38%
Conditional Survey Result - Disposal Station WASA Multan
Poor 3%
Fair 56%
Good
41%
Conditional Survey Result - Tubewell Stations
Rehabilitation Cost for TW & DS11.16 million
(BOQs for Rehabilitation have
been Prepared)
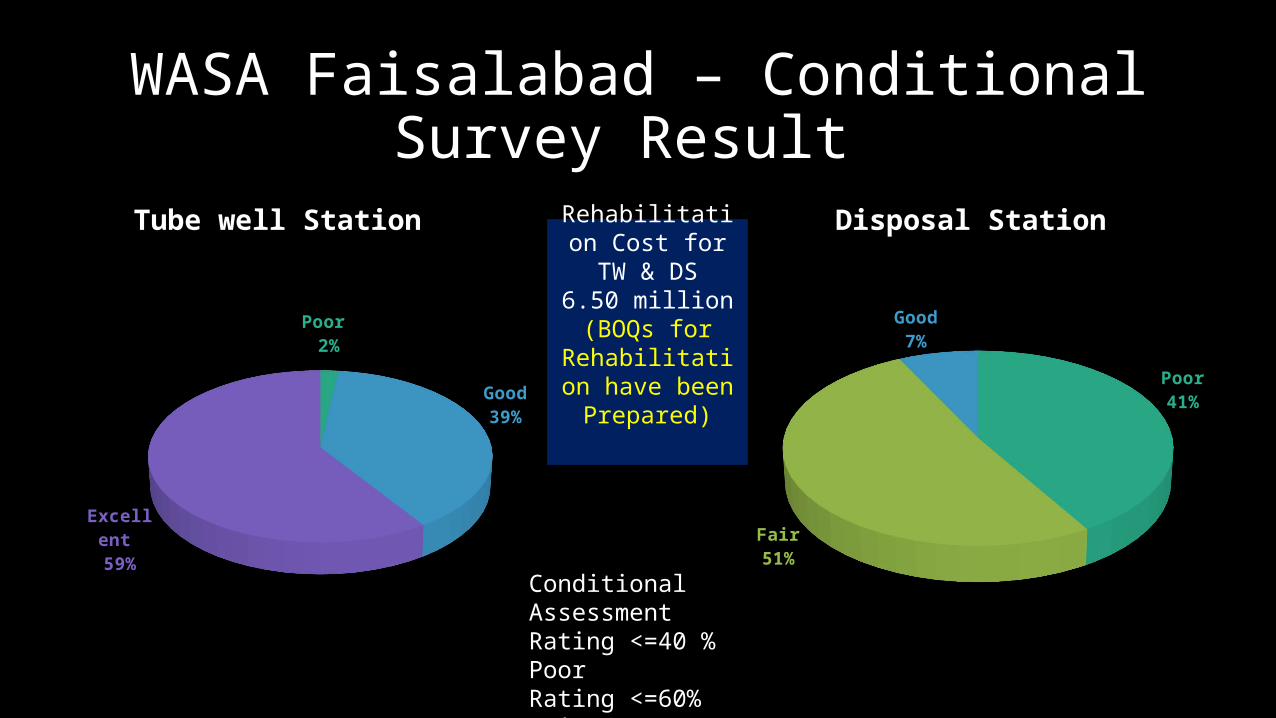
WASA Faisalabad – Conditional Survey Result
Conditional AssessmentRating <=40 % PoorRating <=60% FairRating <=70 % GoodRating >70 % Excellent
Poor
41%
Fair 51%
Good7%
Disposal Station
Poor 2%
Good39%
Excel-lent 59%
Tube well Station Rehabilitation Cost
for TW & DS6.50 million(BOQs for
Rehabilitation have been Prepared)

WASA Rawalpindi – Conditional Survey Result
Conditional AssessmentRating <=40 % PoorRating <=60% FairRating <=70 % GoodRating >70 % Excellent
Poor44%
Fair56%
Tube well Stations
Rehabilitation Cost for TW & DS32.58 million
(BOQs for Rehabilitation have
been Prepared)

WASA Gujranwala – Conditional Survey Result
Conditional AssessmentRating <=40 % PoorRating <=60% FairRating <=70 % GoodRating >70 % Excellent
Poor
33%
Fair 14%
Good33%
Ex-cel-lent 19%
Disposal Stations
Poor 29%
Fair 23%
Good
15%
Ex-cel-lent 30%
Not Operational 3%
Tubewell Stations
Rehabilitation Cost for TW & DS8.01 million(BOQs for
Rehabilitation have been Prepared)

Billing Data & Power Factor Analysis –Part 2
Energy Audit Findings

Annual Electric Billing on TW & DSRs 4.69 Billion / Annum
WASAs Sanctioned Load from WAPDA
(Mega Watt-MW)
Bill AmountFiscal Year 2013-
2014 (PKR-In Million)
Low Power Factor Penalty
(PKR-In Million)
Lahore 78.3 3092.4 21.4Rawalpindi 11.5 382.4 1.9
Multan 14.3 355.5 5.5Faisalabad 19.9 580.1 6.3Gujranwala 7.4 286.9 5.1
Total 131.4 4697.4 40.2

Annual Billing & Annual Low Power Factor Penalty
Lahore Rawalpindi Multan Faisalabad Gujranwala0
5
10
15
20
25 21.4
2.0
5.5 6.3 5.1
Low Power Factor Penalty (PKR-In Million)
Power Factor DefinitionRatio b/w active power to apparent power is called the Power Factor.Disadvantages of Low Power Factor:-1. Penalty from Electric Power Supply Company
Penalty Formula (PKR)= (0.9-Actual PF)*2*Energy Charges
2. Large Line Loss (Copper Loss)3. High input current requirement4. Large KVA Rating of Transformer & large size of
equipment requirement5. Greater Conductor /cable Size & Cost6. Poor Voltage Regulation & Large Voltage Drop7. Low efficiency of equipmentGadgets for Improving Power Factor:-8. Static Capacitors (Fixed Compensation )9. Automatic Power Factor Improvement Relay
(Automatic Compensation)
0
500
1000
1500
2000
2500
3000
3500 3,092.5
580.1 355.5 286.9 382.4
Bill Amount Fiscal Year 2013-2014 (PKR-In Million)

Low Power Factor Penalty PAID by WASAs Since PCGIP Inception
WASA Lahore WASA Faisalabad WASA Multan WASA Gujranwala WASA Rawalpindi0.0
5.0
10.0
15.0
20.0
25.0
30.0
35.0
40.0
45.0 42.8
12.6 11.0 10.1
3.9
LPF Penalty Paid- 80.4 Mil l ion PKR (Last TWO Years)

Costing of LPF Correction of DS & TW WASAs Annual Low Power
Factor Penalty (PKR-In Million)
Cost to Remove L.P.F Penalty (using
Automatic Power Factor Relay / Static
Capacitors)(PKR- In Million)
Payback Time
(Months)
Lahore 21.4 11.4 7Rawalpindi
1.9 0.7 4Multan 5.5 3.9 9
Faisalabad6.3 3.7 7
Gujranwala 5.1 3.1 8Total 40.2 22.8

LPF Savings for Next Three Years- 2014-2017
WASA Lahore WASA Faisalabad WASA Multan WASA Gujranwala WASA Rawalpindi0.0
10.0
20.0
30.0
40.0
50.0
60.0
70.0
64.2
18.8 16.6 15.2
5.9
Projected Savings 2016-2017 120.6 Million PKR

Energy Audit – Part 3
Measurement

Flow Meter
Power Analyzer
Tachometer
General Tool Kit
Vibrometer
Well Sounder
Temperature Gun
Safety Kit
Camera
Energy Audit Instruments
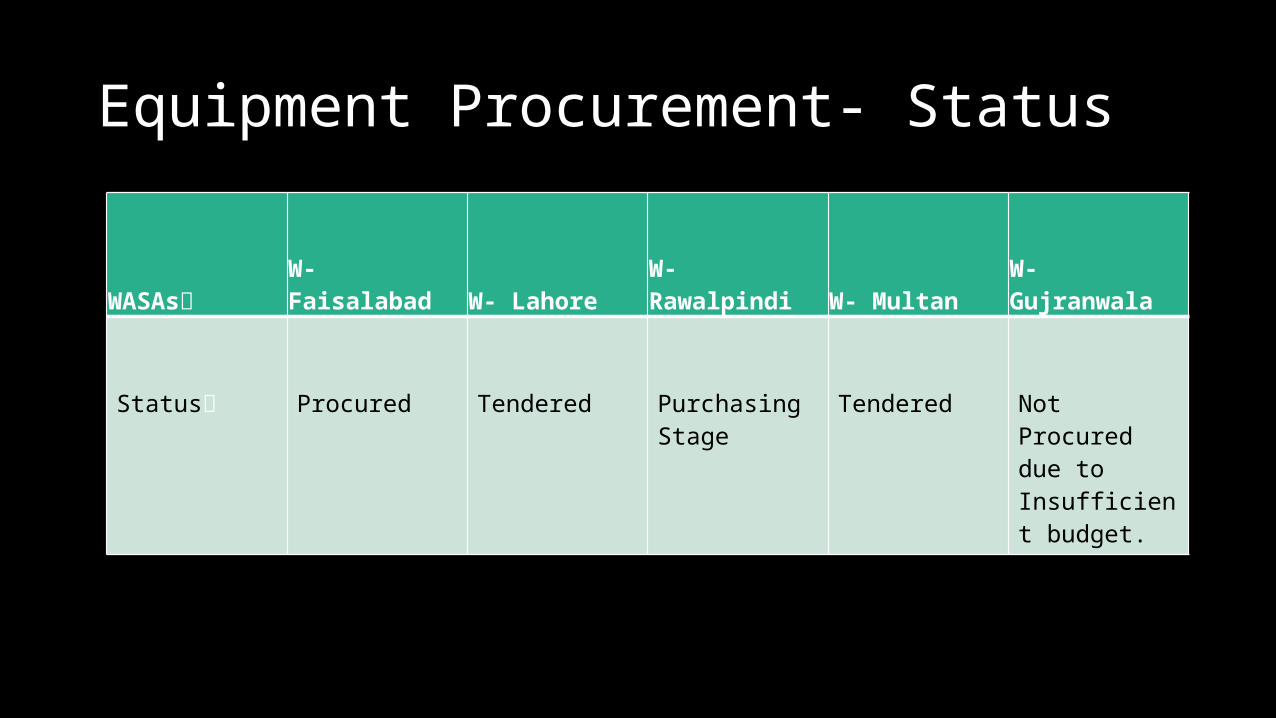
Equipment Procurement- Status
WASAs W- Faisalabad W- Lahore W- Rawalpindi W- Multan W- Gujranwala
Status Procured Tendered Purchasing Stage
Tendered Not Procured due to Insufficient budget.

Energy Audit Results – Chiniot & JICA Tube wells in WASA Faisalabad
Tube well Name
No.s Avg. Motor Efficiency
Avg. Pump Efficiency
Recommendations
Chiniot- Jhang Branch Canal(KSB & Siemens)
21 83.58% 58.95% i) There is no need to replace these motors & Pumps as they are operating at acceptable efficiency range.ii) 17 tube wells require PF improvement.Automatic PFI compensating up to 40KVARS should be installed on these tube wells.
JICA-KSB & Siemens
25 83.57% 75.79% i) There is no need to replace motors & pumps as they are operating at acceptable efficiency range.ii) 09 tube wells require PF improvement. Automatic PFI compensating up to 25KVARS should be installed on these tube wells.

Challenges in Energy Audit (EA)Data Collection
• Field Staff
Data Provision
• High Response Time
• Systematic Record Inadequate
Equipment
• No EA Equipment
• Funds
• No Training of Instruments
Dedicated Team
• Work Overload
• EA Experience
• Lack of Capacity

Recommendation of Energy Audit – Part 1 and 2
Energy Audit Recommendations WASA Rough Cost in Rs Million
Conditional Survey Improvement of All Assets as poor and
Average
All WASA from Power & Energy Head of PCGIP
120.39
PF Corrections 1. Static Capacitors (Fixed Compensation )
2. Automatic Power Factor Improvement
Relay (Automatic Compensation
All WASAs from Power and Energy Head of
PCGIP
22.87
Equipment Immediate Purchase of EA Equipment/Set –
All WASAs except WASA F 1.5 -2

Energy Management PlanStep 1 • Conditional Rehabilitation – Completed – Costing
done and need procurement
Step 2• Power Factor Correction• 10% Saving Potential- Completed – Costing done
and need procurement -
Step 3 • Energy Auditing- Procurement of Firm
Step 4• Efficiency Improvement- 4th Year Procurement
Plans• 15% Saving Potential -
Step 5 • Capacity Building in Energy Management- & System for Monitoring

Comparison of Annual Billing after EMP
Saving Potential 706 Million PKR
Lahore Rawalpindi Multan Faisalabad Gujranwala
3092.5
382.4 355.5580.1 286.9
2319.4
286.8 266.6 435.1 215.2
Annual Billing Vs Expected Billing after EA
Bill AmountFiscal Year 2013-2014 (PKR-In Million)Bill Amount After Implementing EMOs (PKR-In Million)
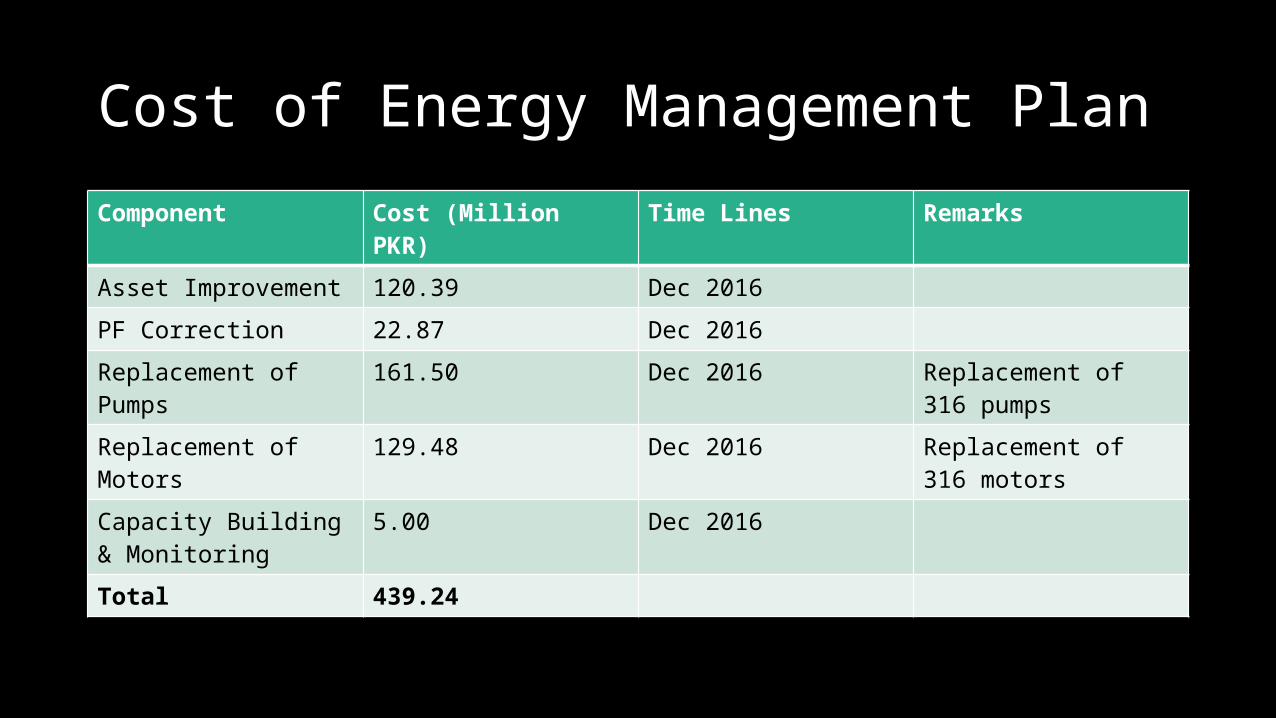
Cost of Energy Management Plan
Component Cost (Million PKR) Time Lines Remarks
Asset Improvement 120.39 Dec 2016
PF Correction 22.87 Dec 2016
Replacement of Pumps 161.50 Dec 2016 Replacement of 316 pumps
Replacement of Motors 129.48 Dec 2016 Replacement of 316 motors
Capacity Building & Monitoring
5.00 Dec 2016
Total 439.24

Add on Asset Management MIS Application • Each Asset has Unique Asset Number /Application Number 1. Attachment of Electricity Bill
Attach Electricity Bill from DISCO Entry of Monthly Bill Amount, Payment, Power Factor and Power Factor Penalty Responsible Authority: Concern XEN/SDO Frequency: 1 Month updating
2. Conditional of Asset Conditional Assessment of Asset Picture of Every Asset Responsible Authority: Concern XEN/SDO Frequency: 6 Month for updateing
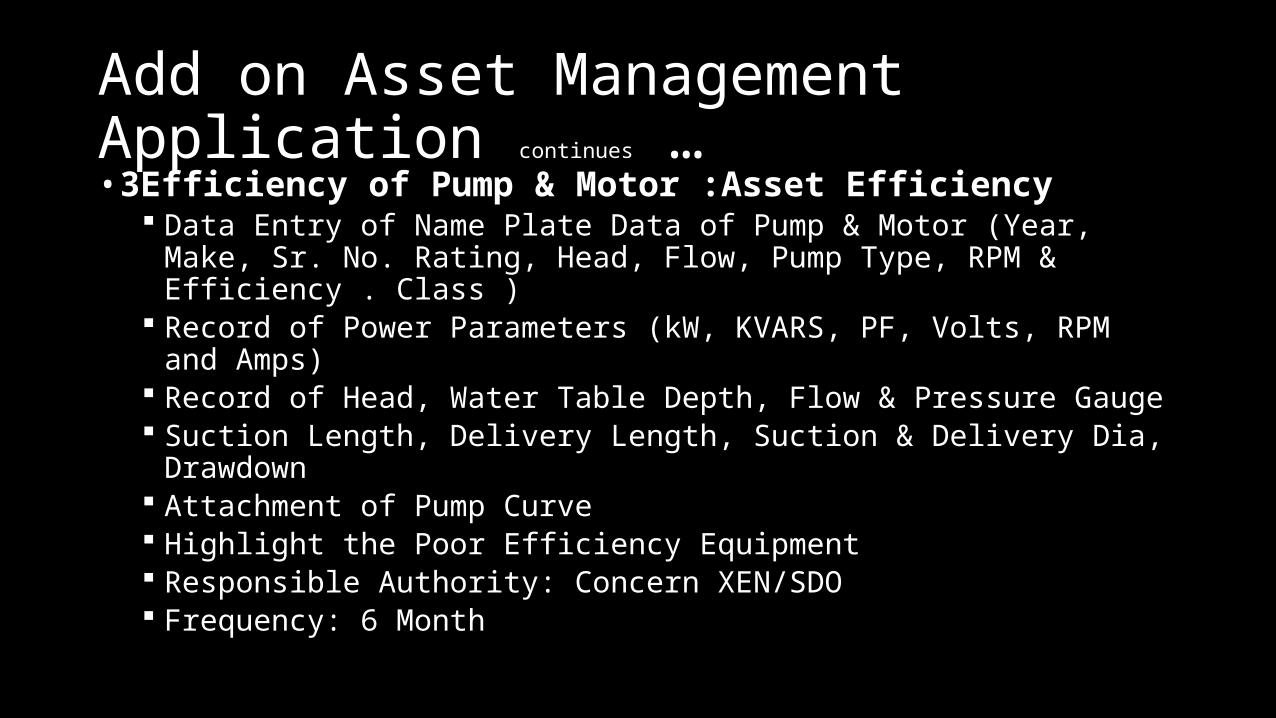
Add on Asset Management Application continues …• 3Efficiency of Pump & Motor :Asset Efficiency
Data Entry of Name Plate Data of Pump & Motor (Year, Make, Sr. No. Rating, Head, Flow, Pump Type, RPM & Efficiency . Class )
Record of Power Parameters (kW, KVARS, PF, Volts, RPM and Amps) Record of Head, Water Table Depth, Flow & Pressure Gauge Suction Length, Delivery Length, Suction & Delivery Dia, Drawdown Attachment of Pump Curve Highlight the Poor Efficiency Equipment Responsible Authority: Concern XEN/SDO Frequency: 6 Month

• O&M History- Cost Centre Rewinding History (Date, Copper (Kg) Required & Labor Cost) Bearing Replacement (Replacement Date, Greasing Date, Bearing No. & Cost) Pump Wear & Tear (Repairing /Replacement Date, Trimming Date & Labor
Cost) Valves Wear & Tear (Valve Type, Repairing/Replacement Date, Cost & Labor
Cost) Next O&M Frequency for Planning - Responsible Authority: Concern XEN/SDO Action Frequency: Quarterly

THANK YOU