energy audit of a building energy audit and saving analysis
TRANSCRIPT
Department of Technology and Built Environment
ENERGY AUDIT OF A BUILDING Energy Audit and Saving Analysis
Shuang Li
Xin Xiong
September 2008
Master Program in Energy System Examiner: Ulf Larsson
Supervisor: Roland Forsberg


Preface
At the end of our final thesis project, looking back all the efforts we have done,
there are so many people we want to say thanks to. Many difficulties which are
out of expected have occurred, such as while the selecting the subject,
measuring and collecting the datum, calculating and so on. Thanks to the help
from our supervisor, professors in university, staffs in the companies, as well
as our classmates, friends and support from our families, we can finally
complete the thesis.
For those reasons, we really appreciate their patient encouragement and
definite love.
Firstly, we appreciate the help and guidance from Prof. Roland Forsberg.
When we met problems of collecting the data, calculating and so on, he always
offered patient suggestions and advices to guide the right way for us. From him,
we learned not only the knowledge about energy, but also the precise attitude
to science.
Meanwhile, we would like to thank Mr. Bengt Olsson and Cleas Bergstrom,
who have been always very patient and provided all the important information
we need.
What’s more, we are thankful for the teaching and instructing from Prof. Ulf
Larsson and Mathias Cehlin.
Special thanks to each other for the care and help during the one year’s
studying aboard. It is a rare and nice experience in our life time.
Finally, much grateful is given to our parents. Whenever happiness, sadness
or hard time, you are always standing by, and never leave us alone.

Abstract
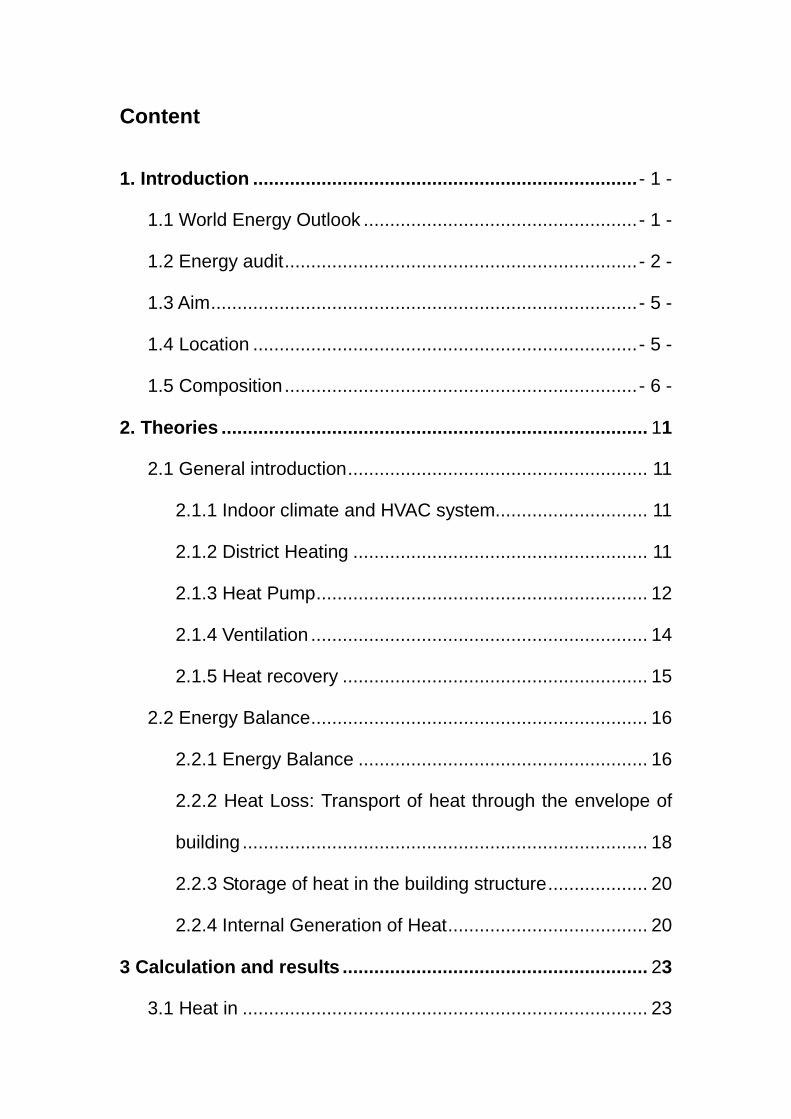
The typical residential building is located at the crossing of S. Centralgatan
Street and Nedre Åkargatan Street in the city of Gavle. It is a quadrangle
building of six floors with a yard in the middle. There are 180 apartments of five
types in total, and at the first floor there is a kindergarten. There is a District
Heating in the building and heating recovery system ventilation which use heat
exchanger to reheat.
Several solutions are used for reducing the heat loss. In the first step, the heat
loss and heat in has been calculated. There are several parameters that
involve the heat loss and heat in of whole building, so each parameter in the
energy balance equation is extracted and calculated. And then the Energy
Balance Sheet has been built. Among the heat loss part, the transmission is
1237MWh, the hot tap water is 332MWh, the mechanical ventilation is
1041MWh, the natural ventilation is 325.7MWh.In the part of heat in, the DH is
1265.7MWh, the heat pump is 793MWh, the solar radiation is 562MWh, the
internal heating is 315MWh.Later in the second step, after analyzing data of
heat loss part, the improvements will be focused on the transmission and hot
tap water parts because the heat loss in those two parts occupy the most. At
the end of final step, the solutions have been discussed to optimize the heating
system.
As conclusion, there are several suggested solutions. The total reduction of
heat loss after adjustment is 163MWh, accounts 5.6% of originally heat loss.
The heat loss of the building has been reduced from 2935.7MWh to
2772.7MWh.

Content
1. Introduction .........................................................................- 1 -
1.1 World Energy Outlook ....................................................- 1 -
1.2 Energy audit...................................................................- 2 -
1.3 Aim.................................................................................- 5 -
1.4 Location .........................................................................- 5 -
1.5 Composition...................................................................- 6 -
2. Theories ................................................................................. 11
2.1 General introduction......................................................... 11
2.1.1 Indoor climate and HVAC system............................. 11
2.1.2 District Heating ........................................................ 11
2.1.3 Heat Pump............................................................... 12
2.1.4 Ventilation ................................................................ 14
2.1.5 Heat recovery .......................................................... 15
2.2 Energy Balance................................................................ 16
2.2.1 Energy Balance ....................................................... 16
2.2.2 Heat Loss: Transport of heat through the envelope of
building ............................................................................. 18
2.2.3 Storage of heat in the building structure................... 20
2.2.4 Internal Generation of Heat...................................... 20
3 Calculation and results .......................................................... 23
3.1 Heat in ............................................................................. 23
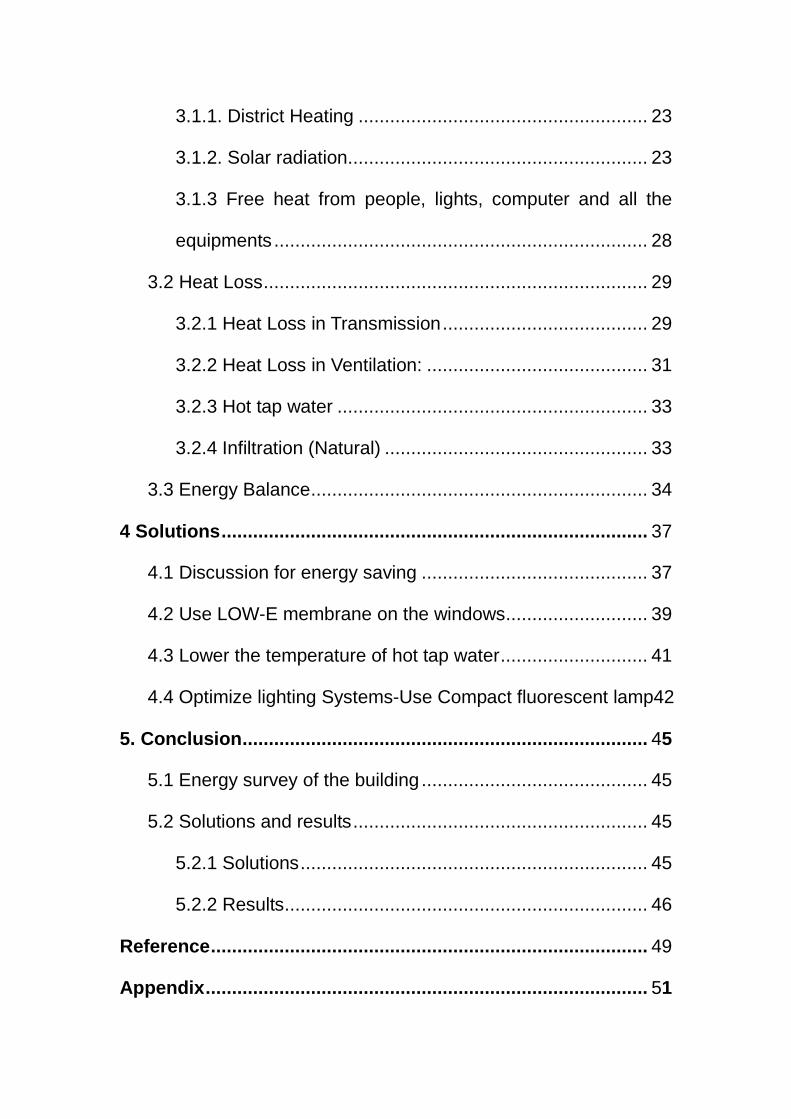
3.1.1. District Heating ....................................................... 23
3.1.2. Solar radiation......................................................... 23
3.1.3 Free heat from people, lights, computer and all the
equipments ....................................................................... 28
3.2 Heat Loss......................................................................... 29
3.2.1 Heat Loss in Transmission....................................... 29
3.2.2 Heat Loss in Ventilation: .......................................... 31
3.2.3 Hot tap water ........................................................... 33
3.2.4 Infiltration (Natural) .................................................. 33
3.3 Energy Balance................................................................ 34
4 Solutions................................................................................. 37
4.1 Discussion for energy saving ........................................... 37
4.2 Use LOW-E membrane on the windows........................... 39
4.3 Lower the temperature of hot tap water............................ 41
4.4 Optimize lighting Systems-Use Compact fluorescent lamp42
5. Conclusion............................................................................. 45
5.1 Energy survey of the building ........................................... 45
5.2 Solutions and results........................................................ 45
5.2.1 Solutions.................................................................. 45
5.2.2 Results..................................................................... 46
Reference................................................................................... 49
Appendix.................................................................................... 51
ENERGY AUDIT OF A BUILDING Shuang Li and Xin Xiong
- 1 -
1. INTRODUCTION
1.1 World Energy Outlook
Energy is an important foundation resource of human society’s development.
However, the rapid-fold increase of energy consumption with the increasing
development of world economy, world’s population and the human being’s
living standards leads to increasingly fierce competition of energy resources
and environmental pollution.
According to the IEA(International Energy Agency)’s forecast in the <World
Energy Outlook 2004>,the world energy consumption will be increasing from
10.24 billion tons of oil equivalent in 2001 to 16.2 billion tons of oil equivalent in
2005,and the world energy consumption will increase by 54% in 2001-2025.
The depletion of global fossil energy is inevitable, and it will end up in the 21st
century basically. As the data shown in the <BP Statistical Review of World
Energy 2006>,the global oil explored reserve could provide production for 40
years or more, natural gas and coal will supply 65 years and 155 years. At the
same time, the emissions of CO2 will increase and how to reduce the emission
of greenhouse gas will be a stern challenge.
With the increasing of world energy consumption, the emission of environment
pollutant (as carbon dioxide, nitrogen oxide, dust particles) has been increased
year by year, and the fossil energy does serious harm to the environment and
global climate day by day. According to the IEA’s statistics, the emission of
world carbon dioxide was approximately 21.56 billion tons in 1990, amounted
to 23.91 billion tons in 2001, estimated that will be 27.72 billion tons in 2010,
amounted to 37.12 billion tons in 2025 and it averagely grows 1.85% per year.
The more stable, sustainable energy supply such as the renewable energy is
ENERGY AUDIT OF A BUILDING Shuang Li and Xin Xiong
- 2 -
required due to the worldwide decline of fossil energy supply.
Due to the use and development trend of world renewable energy source,the
development of the wind energy, the solar energy and the biomass energy is
much better than other conventional energy source. The cost of the wind
power generation technology is much lower as the conventional energy source,
therefore it becomes such clean energy technology which develops fastest in
industrial production and it increases 27% per year.
The IEA's data shows that in strongly encourage renewable energy sources
into the energy market conditions, to 2020 new and renewable energy
(excluding large hydropower and traditional biomass energy) will account for
20 percent of global energy consumption, the proportion of renewable Energy
in total energy consumption will reach 30 percent, from energy security or
environmental requirements, renewable energy will become the strategic
choice of new energy sources.
1.2 Energy audit
An energy audit is an inspection, survey and analysis of energy flows in a
building, process or system,and the objective is to understand the energy
dynamics of the system under study and make sure the high efficiency of
energy using. Typically an energy audit is conducted to seek opportunities to
reduce the amount of energy input into the system without negatively affecting
the output(s). “The Energy Audit serves to identify all of the energy streams
into a facility and to quantify energy use according to discrete functions, similar
to the monthly closing statement of an accounting system”. When the object of
study is an occupied building then reducing energy consumption while
maintaining or improving human comfort, health and safety are of primary
concern. Beyond simply identifying the sources of energy use, an energy audit
seeks to prioritize the energy uses according to the greatest to least cost
ENERGY AUDIT OF A BUILDING Shuang Li and Xin Xiong
- 3 -
effective opportunities for energy savings.
The continuous energy monitoring which get though the energy audits of
energy consumption in the past and present energy is a key step of energy
saving and increasing the energy efficiency. Energy audit includes the
following steps:
A.Data collection
Collect the history data of energy use and understand the situation of energy
use is very important in assessing the building’s energy consumption. Such
information can be collected through the energy bill and meter reading. In
order to obtain a comprehensive analysis of the results, the monthly energy
consumption data in the past three years or more is necessary at least.
B.Surveys and measurement
Through field surveys and measurement,the energy use of the building could
be able to be known as currently as possible. Followed by analysis of the
energy consumption data, the measures of improving the energy efficiency
could be determined.
For example, the type of the windows, U-value coefficient and Calculation
Factor, the lighting requirements and so on are noted. These information could
be compared against the recommendations in the relevant Codes of Practices
such as CP 13:1999 and CP 24:1999
C.Energy consumption benchmarks
Energy consumption benchmarks are different from energy consumption
indicators. They are important tools of evaluating situation in different types of
energy use. The energy consumption performance in same kind of building
ENERGY AUDIT OF A BUILDING Shuang Li and Xin Xiong
- 4 -
could be compared by the energy consumption benchmark。
Property managers can check the account of electrical equipments/system,
check the energy consuming situation of each part, to find out if the energy
efficiency is low or not and search for the way which can improve it. Energy
auditing is a extremely useful energy management method. Through the way
suggested in the energy auditing process, not only reducing the energy
consumption, but also extending the lifetime of the equipment and save money.
Energy auditing must be controlled by the professional technicians who have
the housing equipment installation skills. According to the results technician
write an energy auditing report to suggest a series of management
The effects of different energy saving measurements are difficult to be
estimated because the energy balance and the relations between the different
heat flows and different energy customers are very complicated.
The parameters that could be measured in the energy balance can be divided
in some groups:
1. Transport of energy through the building envelope:
-Transmission losses through walls, roof, floor, windows and doors
-Heat transport due to infiltrations
-Solar radiation through windows
2. Activities and equipments of generating internal heat:
-Free heat due to people
-Free heat due to lights, computers and all the equipments
ENERGY AUDIT OF A BUILDING Shuang Li and Xin Xiong
- 5 -
3. Energy supplied to achieve the required indoor climate:
-Heat supply and loss
-Ventilation air
-Domestic hot water heating
Although all the parameters have not got the same importance, some of them
are relatively small; all of them have been taken in consideration when running
the energy audit.
1.3 Aim
The aim of the project is to improve the energy system of the building in order
to reducing the heat consumption and saving energy and money. The
simulation and optimization program has been used during the progress.
1.4 Location
The building is a residential building which is located at the crossing of S.
Centralgatan and Nedre Åkargatan in Gavle. Gavle city is in the Middle East of
Sweden and by the side of Baltic Sea. It is 180km far away from Stockholm.
ENERGY AUDIT OF A BUILDING Shuang Li and Xin Xiong
- 6 -
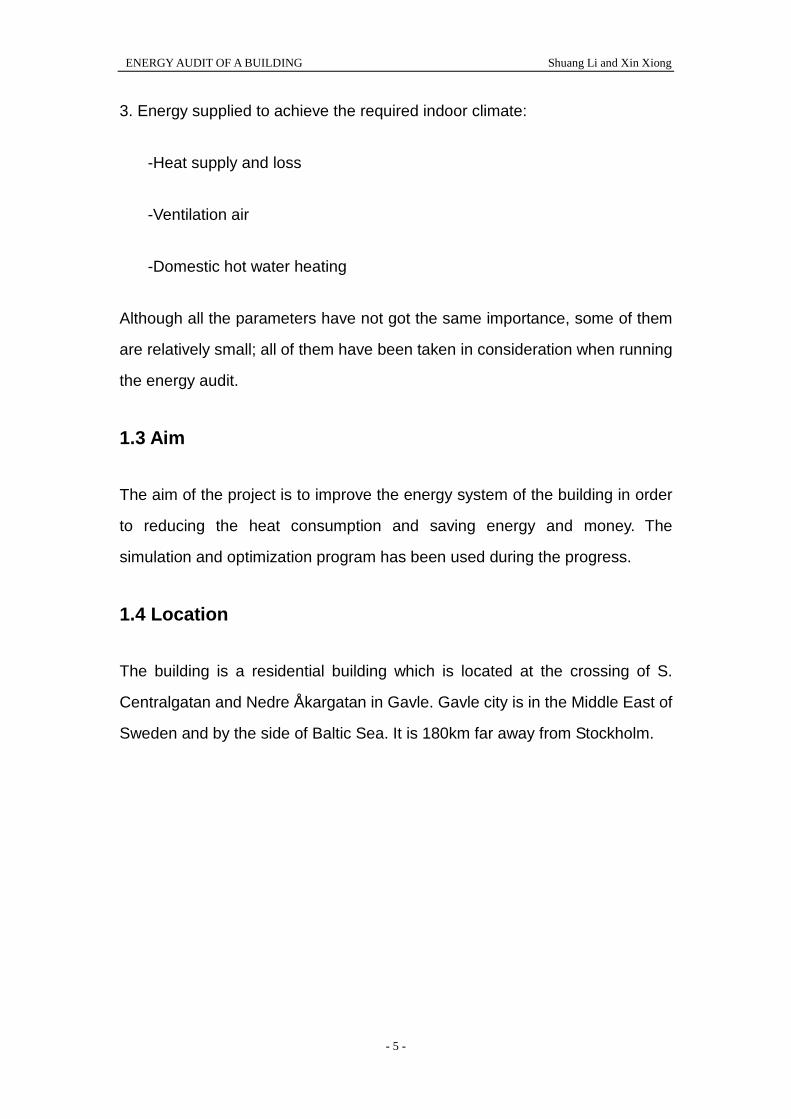
Figure 1: The Building
1.5 Composition
The object in the project is a quadrangle residential building of six floors. There
is a yard in the middle of the building.
There are 180 apartments in this building in total. Five types of apartments are
available. More details are showed as following pictures.
ENERGY AUDIT OF A BUILDING Shuang Li and Xin Xiong
- 7 -
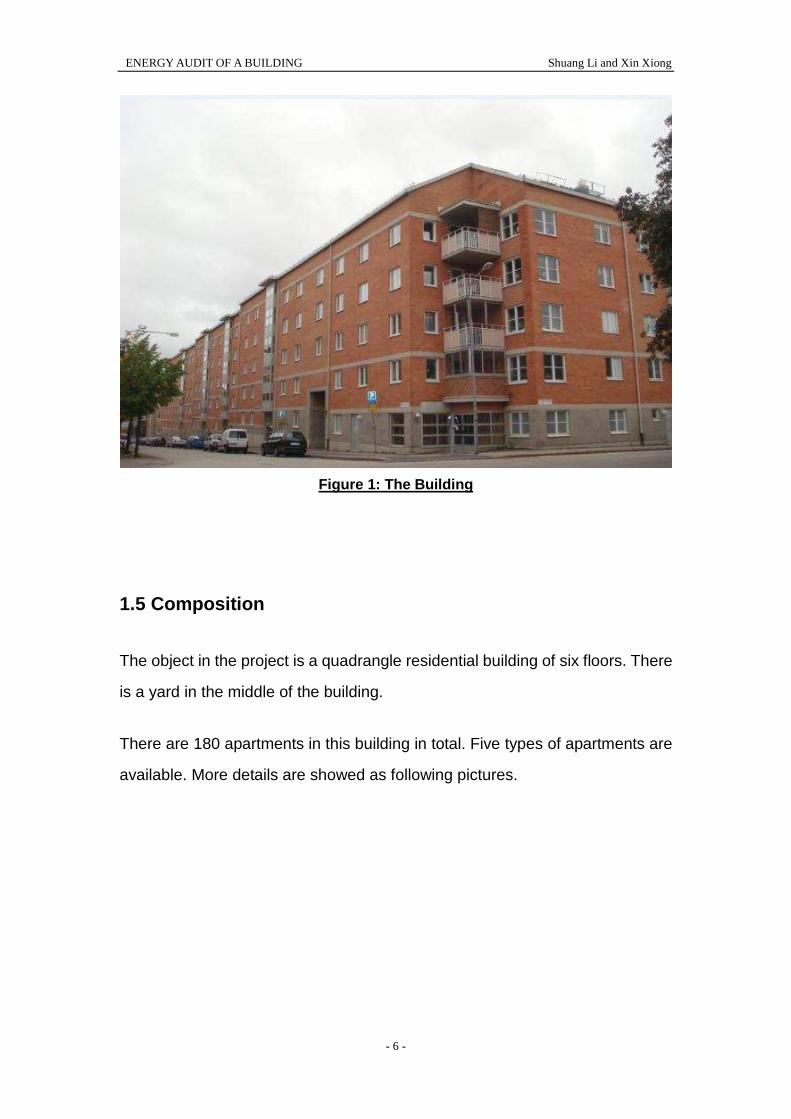
Figure 2: 1-room apartment, totally 32 apartments i n the building
Figure 3: 2-room apartment, totally 48 apartments i n the building
ENERGY AUDIT OF A BUILDING Shuang Li and Xin Xiong
8
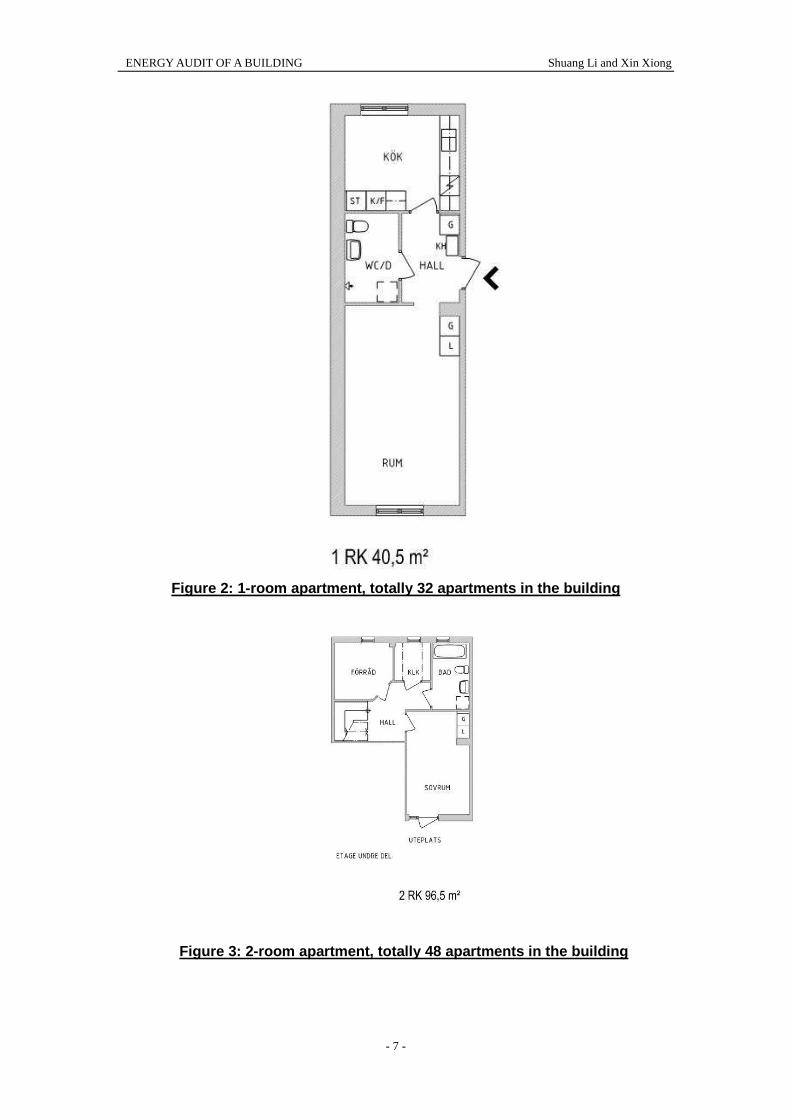
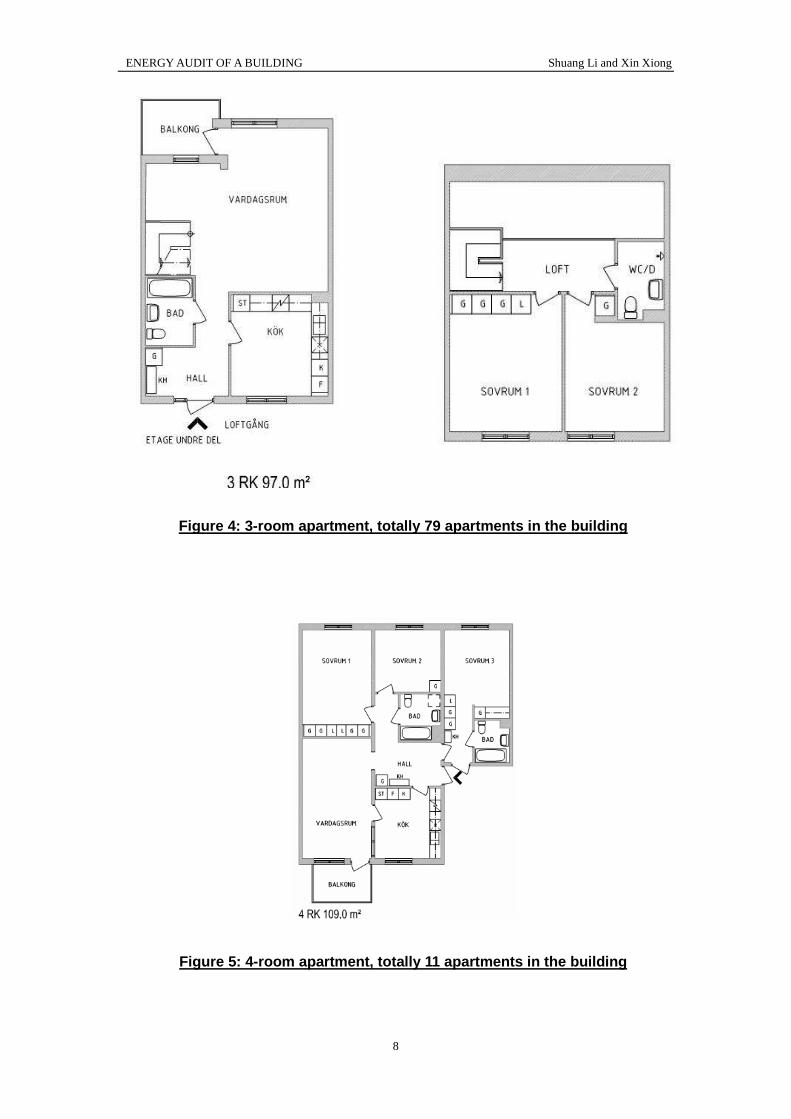
Figure 4: 3-room apartment, totally 79 apartments i n the building
Figure 5: 4-room apartment, totally 11 apartments i n the building
ENERGY AUDIT OF A BUILDING Shuang Li and Xin Xiong
9
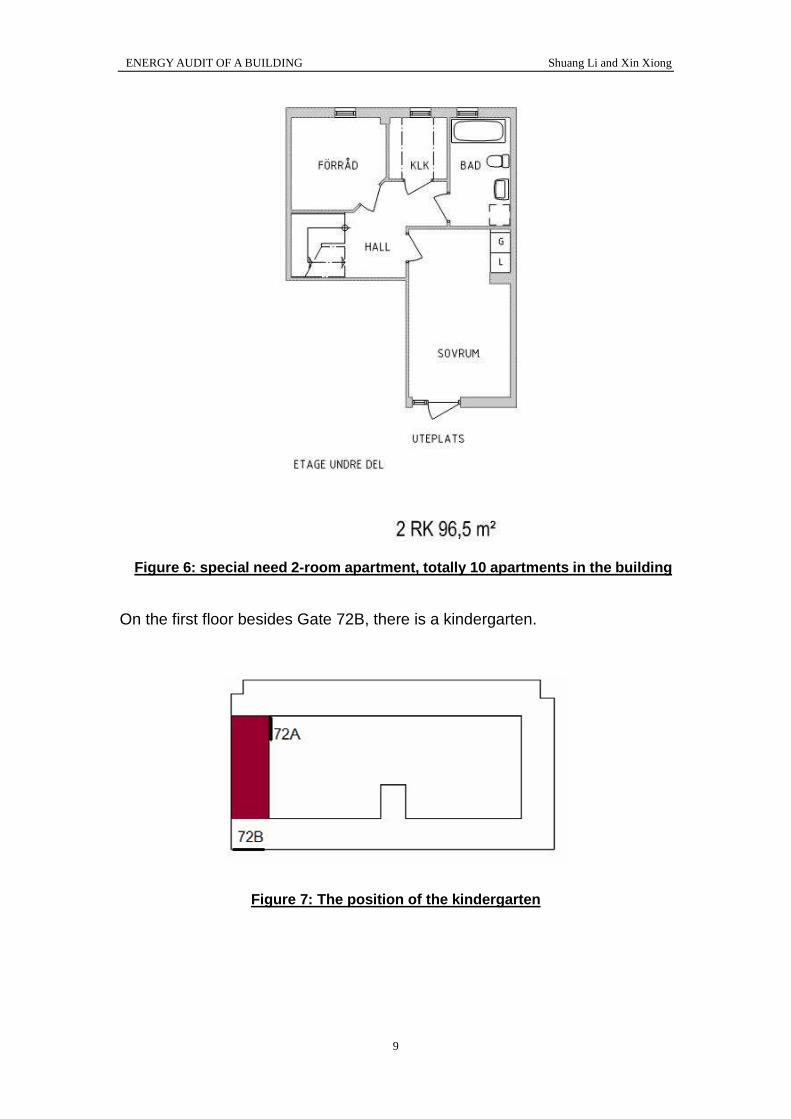
Figure 6: special need 2-room apartment, totally 10 apartments in the building
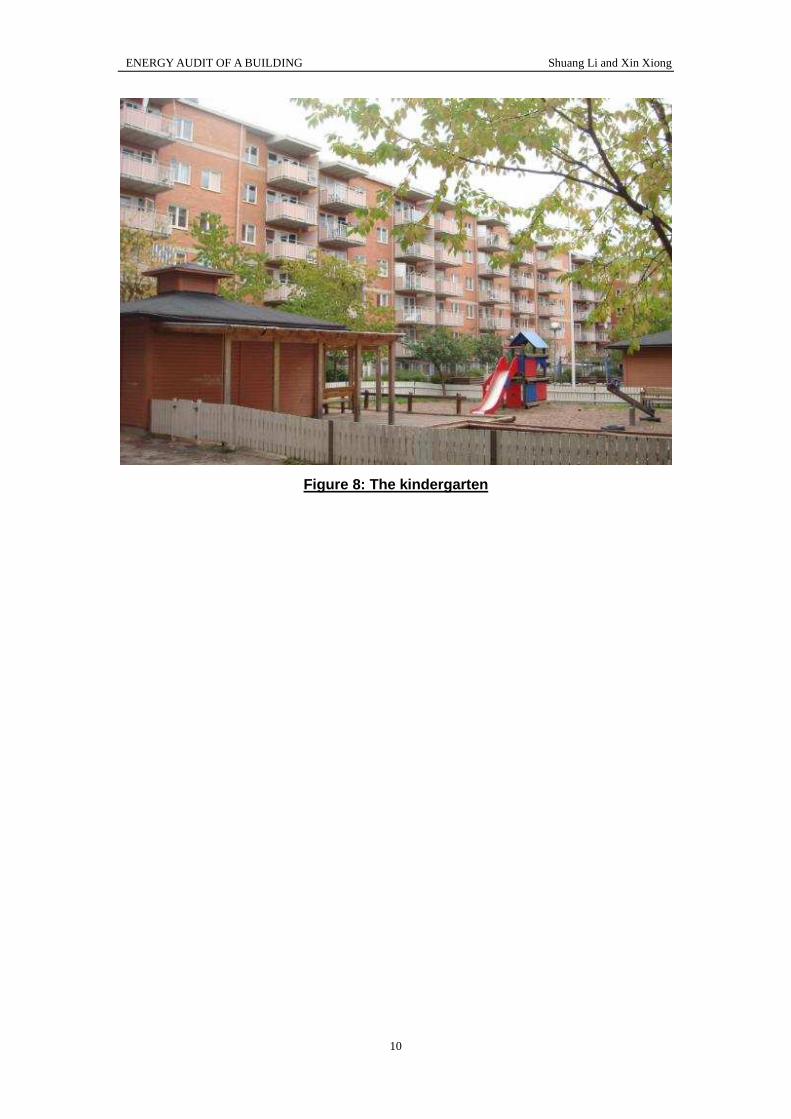
On the first floor besides Gate 72B, there is a kindergarten.
Figure 7: The position of the kindergarten
ENERGY AUDIT OF A BUILDING Shuang Li and Xin Xiong
10
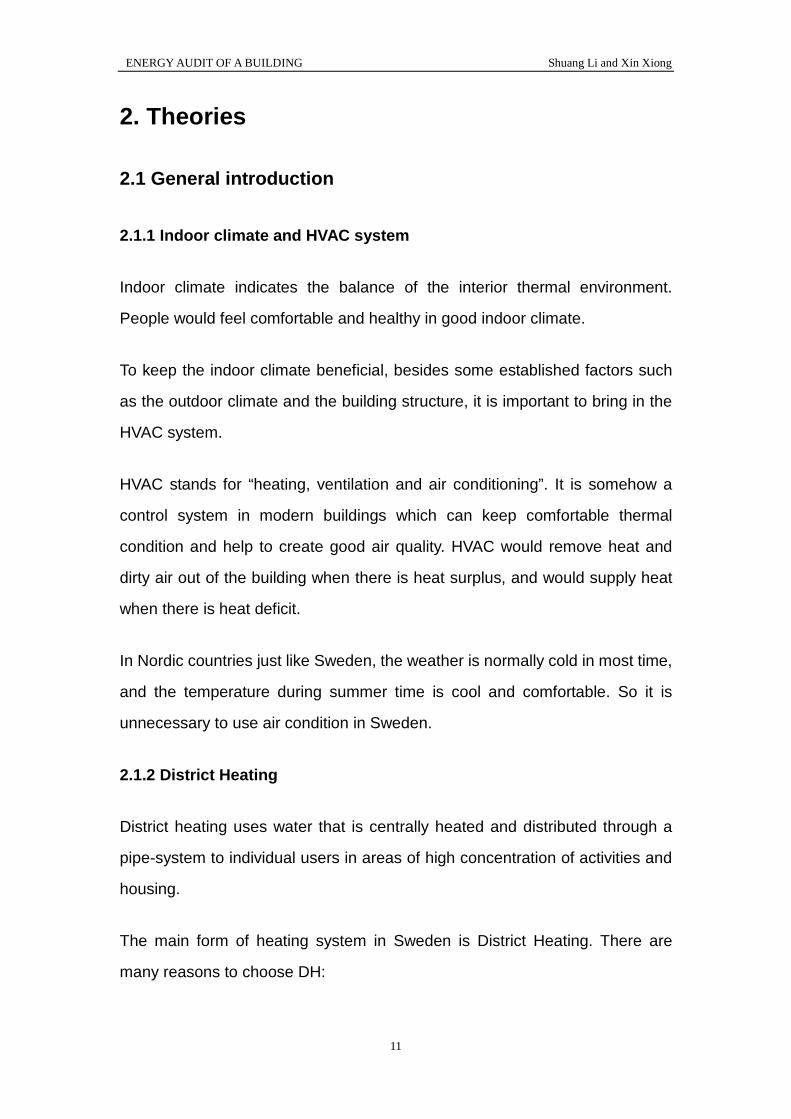
Figure 8: The kindergarten
ENERGY AUDIT OF A BUILDING Shuang Li and Xin Xiong
11
2. Theories
2.1 General introduction
2.1.1 Indoor climate and HVAC system
Indoor climate indicates the balance of the interior thermal environment.
People would feel comfortable and healthy in good indoor climate.
To keep the indoor climate beneficial, besides some established factors such
as the outdoor climate and the building structure, it is important to bring in the
HVAC system.
HVAC stands for “heating, ventilation and air conditioning”. It is somehow a
control system in modern buildings which can keep comfortable thermal
condition and help to create good air quality. HVAC would remove heat and
dirty air out of the building when there is heat surplus, and would supply heat
when there is heat deficit.
In Nordic countries just like Sweden, the weather is normally cold in most time,
and the temperature during summer time is cool and comfortable. So it is
unnecessary to use air condition in Sweden.
2.1.2 District Heating
District heating uses water that is centrally heated and distributed through a
pipe-system to individual users in areas of high concentration of activities and
housing.
The main form of heating system in Sweden is District Heating. There are
many reasons to choose DH:
ENERGY AUDIT OF A BUILDING Shuang Li and Xin Xiong
12
-Easy and flexible to produce heat
-Enables combined heat and power production
-Higher efficiency and lower costs
-Enables new heat sources, e.g. waste burning heat
2.1.3 Heat Pump
A heat pump can absorb heat from surroundings and transport heat from the
heat source to the heat sink. The heat pump usually moves the heat form low
temperature to high temperature, and it is actually a kind of heat lifting gear.
Here is the operation progress of heat pump:
Step 1: The over-heat liquid media evaporates into the gas media with
absorbing the heat of the low temperature object in the evaporator.
Step 2: The gas media coming out from the evaporator has been compressed
into high-temperature high pressure gas media.
Step 3: The high temperature high pressure gas media release the heat
energy to the high temperature object in the condenser, and it turns into
high-pressured liquid media at the same time.
Step 4: The high-pressured liquid media reduces pressure in the expansion,
becomes the over-heated liquid media again, and then enters the evaporator
as the step 1.
According to the different used heat sources, the heat pump has been divided
into several types. Ground-source heat pump heat transfer system can be
installed in a variety of structures. The closed-loop system is constituted of a
series of pipeline which are buried in the mud, ponds or lakes. Ground-source
heat pump loop can be built in drilled holes (vertical and horizontal loop) or
ENERGY AUDIT OF A BUILDING Shuang Li and Xin Xiong
13
ponds, lakes (ponds loop).
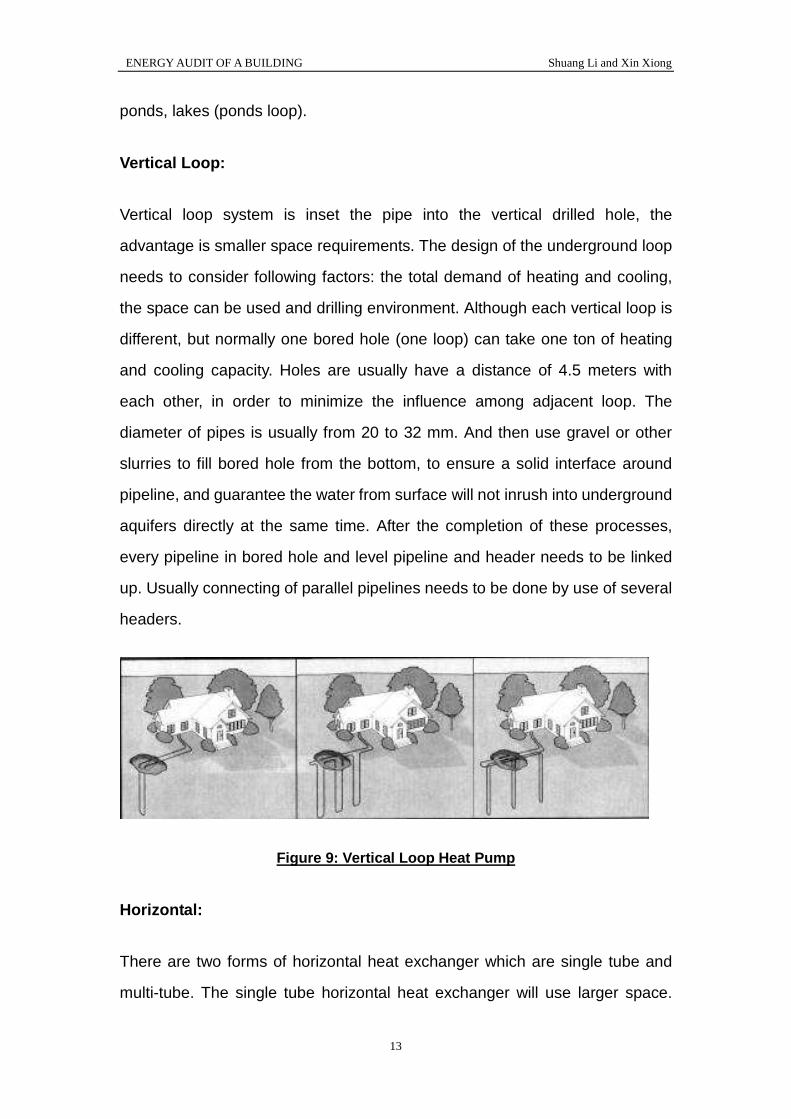
Vertical Loop:
Vertical loop system is inset the pipe into the vertical drilled hole, the
advantage is smaller space requirements. The design of the underground loop
needs to consider following factors: the total demand of heating and cooling,
the space can be used and drilling environment. Although each vertical loop is
different, but normally one bored hole (one loop) can take one ton of heating
and cooling capacity. Holes are usually have a distance of 4.5 meters with
each other, in order to minimize the influence among adjacent loop. The
diameter of pipes is usually from 20 to 32 mm. And then use gravel or other
slurries to fill bored hole from the bottom, to ensure a solid interface around
pipeline, and guarantee the water from surface will not inrush into underground
aquifers directly at the same time. After the completion of these processes,
every pipeline in bored hole and level pipeline and header needs to be linked
up. Usually connecting of parallel pipelines needs to be done by use of several
headers.
Figure 9: Vertical Loop Heat Pump
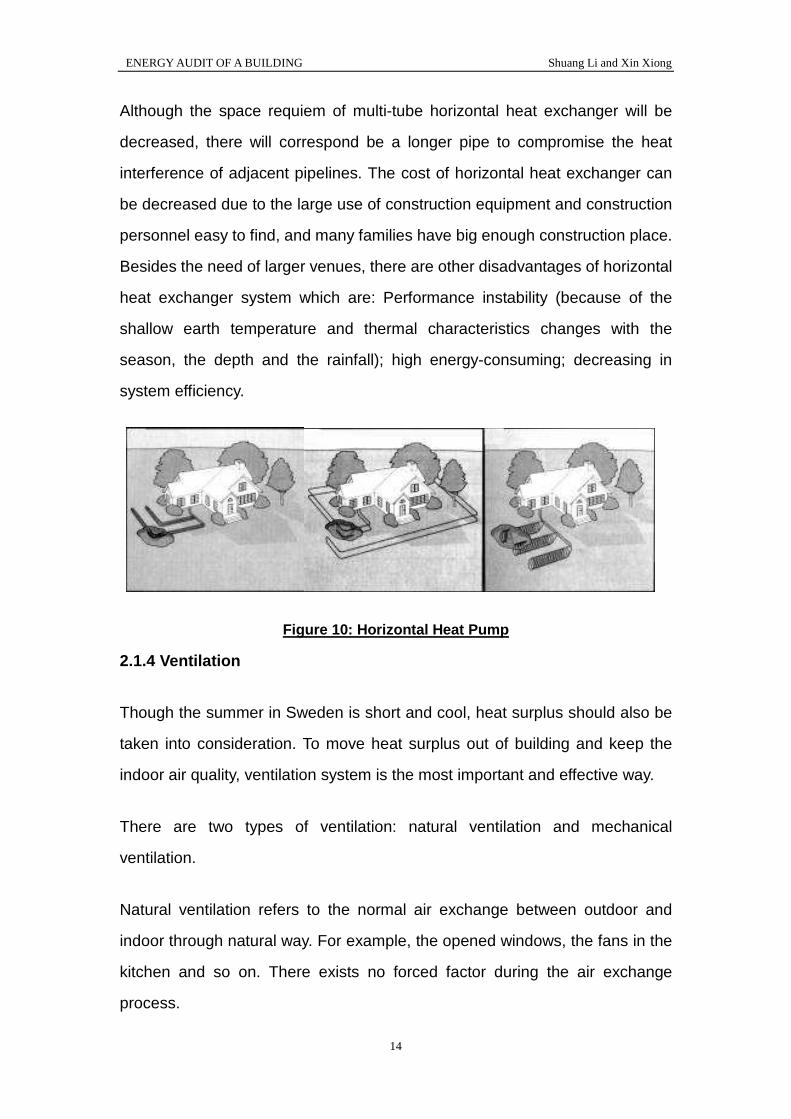
Horizontal:
There are two forms of horizontal heat exchanger which are single tube and
multi-tube. The single tube horizontal heat exchanger will use larger space.
ENERGY AUDIT OF A BUILDING Shuang Li and Xin Xiong
14
Although the space requiem of multi-tube horizontal heat exchanger will be
decreased, there will correspond be a longer pipe to compromise the heat
interference of adjacent pipelines. The cost of horizontal heat exchanger can
be decreased due to the large use of construction equipment and construction
personnel easy to find, and many families have big enough construction place.
Besides the need of larger venues, there are other disadvantages of horizontal
heat exchanger system which are: Performance instability (because of the
shallow earth temperature and thermal characteristics changes with the
season, the depth and the rainfall); high energy-consuming; decreasing in
system efficiency.
Figure 10: Horizontal Heat Pump
2.1.4 Ventilation
Though the summer in Sweden is short and cool, heat surplus should also be
taken into consideration. To move heat surplus out of building and keep the
indoor air quality, ventilation system is the most important and effective way.
There are two types of ventilation: natural ventilation and mechanical
ventilation.
Natural ventilation refers to the normal air exchange between outdoor and
indoor through natural way. For example, the opened windows, the fans in the
kitchen and so on. There exists no forced factor during the air exchange
process.
ENERGY AUDIT OF A BUILDING Shuang Li and Xin Xiong
15
Mechanical ventilation (or forced ventilation) operates mechanically to realize
the air exchange through a specific ventilation system. It removes heat,
airborne pollutant, moisture and so on out of the building and fills in with fresh
and clean air. Mechanical ventilation is mainly used in bathroom or kitchen.
2.1.5 Heat recovery
In mechanical ventilation system, both the exhaust air and the outdoor fresh air
pass through the heat recovery ventilators (HRV), so HRV could gain heat
from exhaust air and use it to pre-heat incoming fresh air. During this process,
there would only exist heat transfer between the two air streams without being
mixed together.
Typically, this process saves about 60%~80% of the energy by reducing
heating requirements as well as needed energy.
To create and maintain a healthier indoor environment, HRV system is
designed to change all the air at least once every two hours. It replaces the
exhaust stale air with fresh and warm air, thus continually keeps a good indoor
climate.
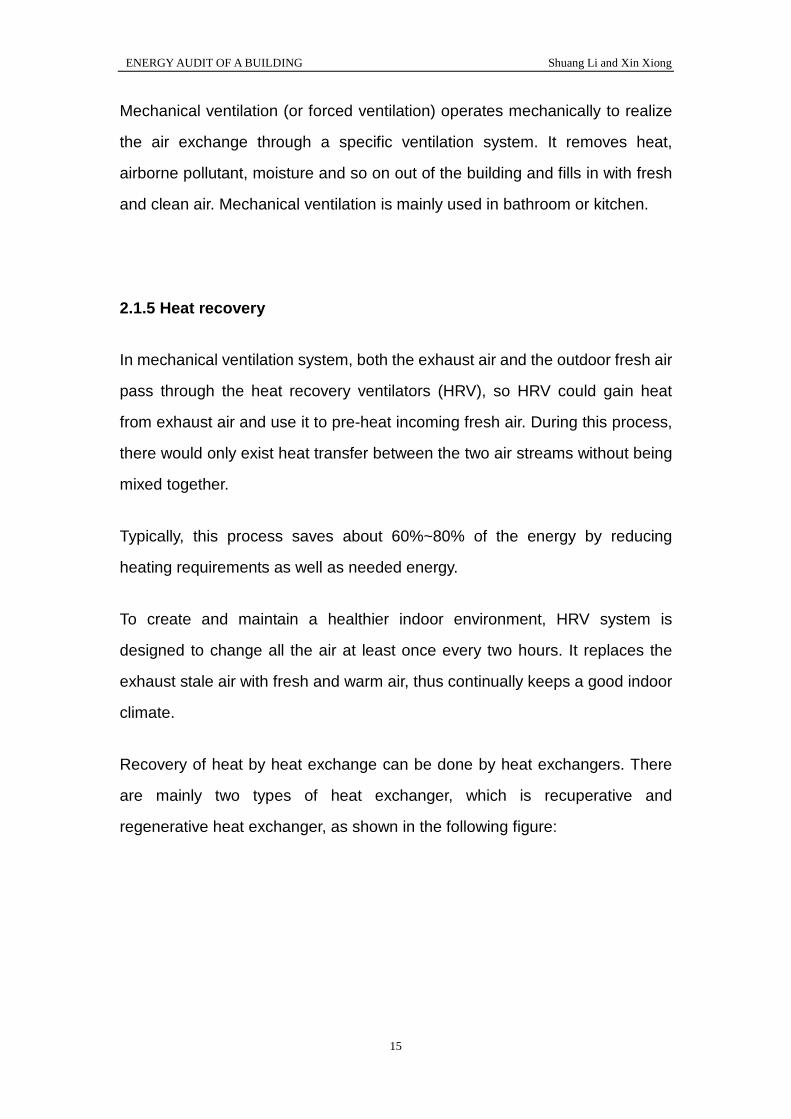
Recovery of heat by heat exchange can be done by heat exchangers. There
are mainly two types of heat exchanger, which is recuperative and
regenerative heat exchanger, as shown in the following figure:
ENERGY AUDIT OF A BUILDING Shuang Li and Xin Xiong
16
Figure 11: Classification of Heat Exchangers
In this building, the heat exchangers belong to indirect system of recuperative
heat exchanger. And the efficiency of the heat exchanger is 50%.
The characteristics of heat exchanger are listed:
(1) Saving electricity. The heat exchanger could supply heat without
electrically operated circulating water pump. The saving is up to 30%-100%.
(2) The area of the heat exchanger is small. So the investment could be
saved up to 70%.
(3) The service life of the heat exchanger is long as 15 years.
2.2 Energy Balance
2.2.1 Energy Balance
Energy is the capacity of a physical system to do work. The famous law of
conservation of energy, that is, First Law of Thermodynamics, points out that
energy can never be created or destroyed, but only converted. The total
ENERGY AUDIT OF A BUILDING Shuang Li and Xin Xiong
17
energy of a system would always remain constant, but energy may transform
to another kind of form.
It is important to analyze energy balance for the building’s energy survey and
saving. First, it can provide a general understanding of the processes and
systems which result in the building’s indoor climate and determine the energy
usage of the building. Second, it could help supplying methods for analysis,
evaluation and design of the building’s indoor climate control systems, while
determine the energy need of the building.
The heat balance of a building is defined by the following parameters:
Transport of heat through the envelope of building
Storage of heat in the building structure
Internal generation of heat in the building
In the case of this building, the First Law of Thermodynamics also applies.
Since there is no energy created or destroyed, the total energy of the building
would always stay in balance. And the energy balance can be expresses as:
Heat loss = Heat in
The factors which result in heat loss as well as heat in are all listed in the
following form:
ENERGY AUDIT OF A BUILDING Shuang Li and Xin Xiong
18
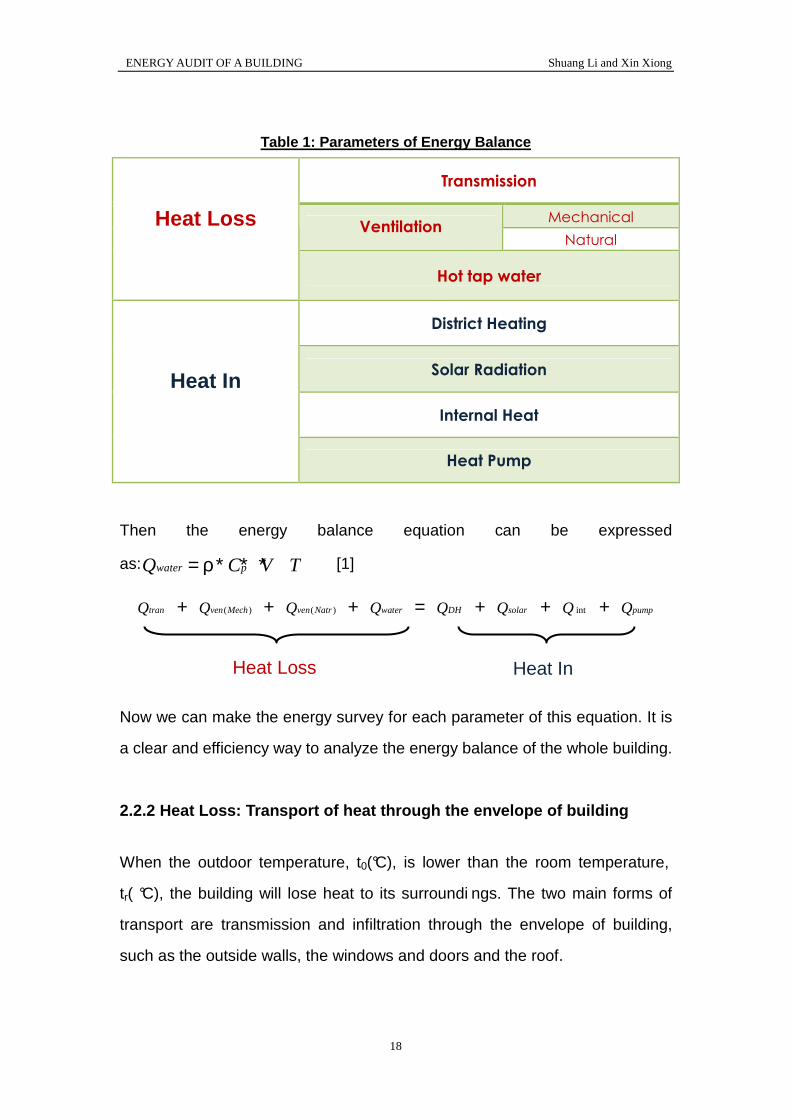
Table 1: Parameters of Energy Balance
Transmission
Mechanical Ventilation
Natural
Heat Loss
Hot tap water
District Heating
Solar Radiation
Internal Heat
Heat In
Heat Pump
Then the energy balance equation can be expressed
as: water pQ C V T= ρ∗ ∗ ∗ [1]
tranQ + ( )ven MechQ + ( )ven NatrQ + waterQ = DHQ + solarQ + intQ + pumpQ
Now we can make the energy survey for each parameter of this equation. It is
a clear and efficiency way to analyze the energy balance of the whole building.
2.2.2 Heat Loss: Transport of heat through the envelope of building
When the outdoor temperature, t0(°C), is lower than the room temperature,
tr( °C), the building will lose heat to its surroundi ngs. The two main forms of
transport are transmission and infiltration through the envelope of building,
such as the outside walls, the windows and doors and the roof.
Heat Loss Heat In
ENERGY AUDIT OF A BUILDING Shuang Li and Xin Xiong
19
a. Transmission:
The outdoor and indoor temperature cannot always be the same. For example,
in the winter, the indoor temperature is about 21℃ due to the heating system,
but the outdoor temperature may be -20℃. The building is not sealed, so there
would surely be a heat flux because of the temperature difference.
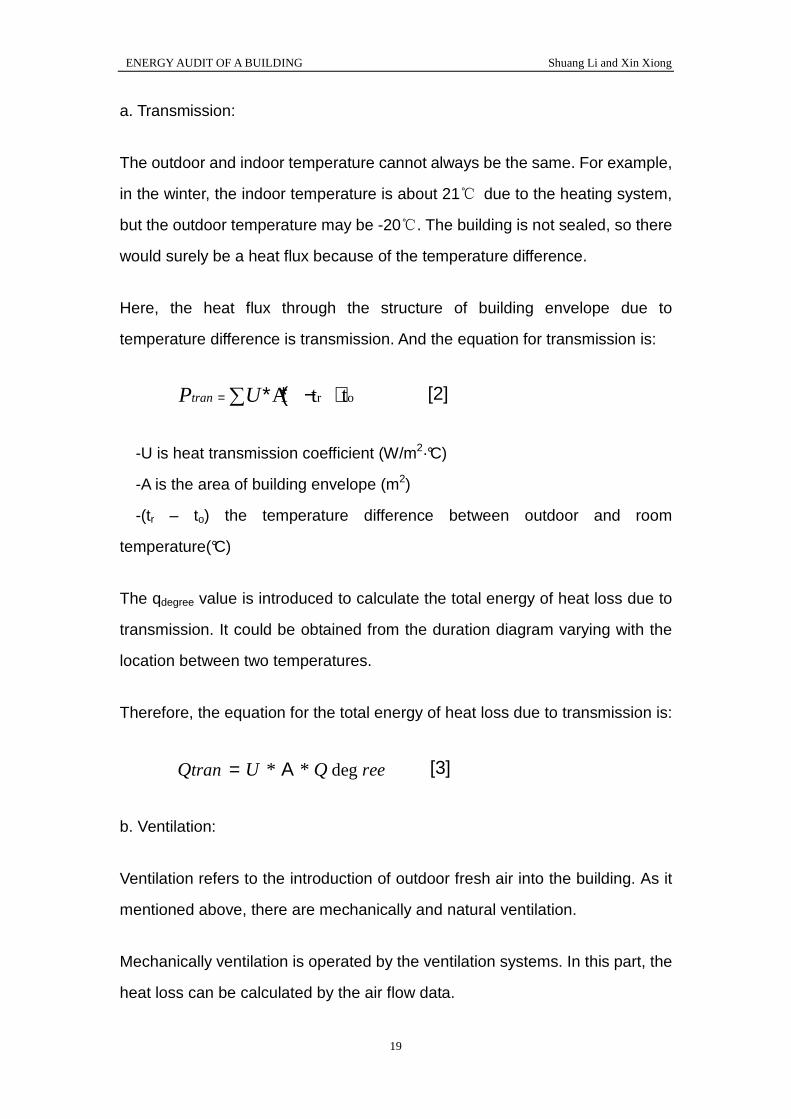
Here, the heat flux through the structure of building envelope due to
temperature difference is transmission. And the equation for transmission is:
r oA t ttranP U= ∗ ∗( − )∑ [2]
-U is heat transmission coefficient (W/m2·°C)
-A is the area of building envelope (m2)
-(tr – to) the temperature difference between outdoor and room
temperature(°C)
The qdegree value is introduced to calculate the total energy of heat loss due to
transmission. It could be obtained from the duration diagram varying with the
location between two temperatures.
Therefore, the equation for the total energy of heat loss due to transmission is:
deg* *tran reeQ U Q= Α [3]
b. Ventilation:
Ventilation refers to the introduction of outdoor fresh air into the building. As it
mentioned above, there are mechanically and natural ventilation.
Mechanically ventilation is operated by the ventilation systems. In this part, the
heat loss can be calculated by the air flow data.
ENERGY AUDIT OF A BUILDING Shuang Li and Xin Xiong
20
Natural ventilation is due to the accidental air introduction because of cracks in
the building envelope and opened doors and windows. So it is not possible to
calculate the heat loss of this part. But because the quantity of the heat loss
equals to heat in, the natural ventilation heat loss can be calculated through
the equation of energy balance.
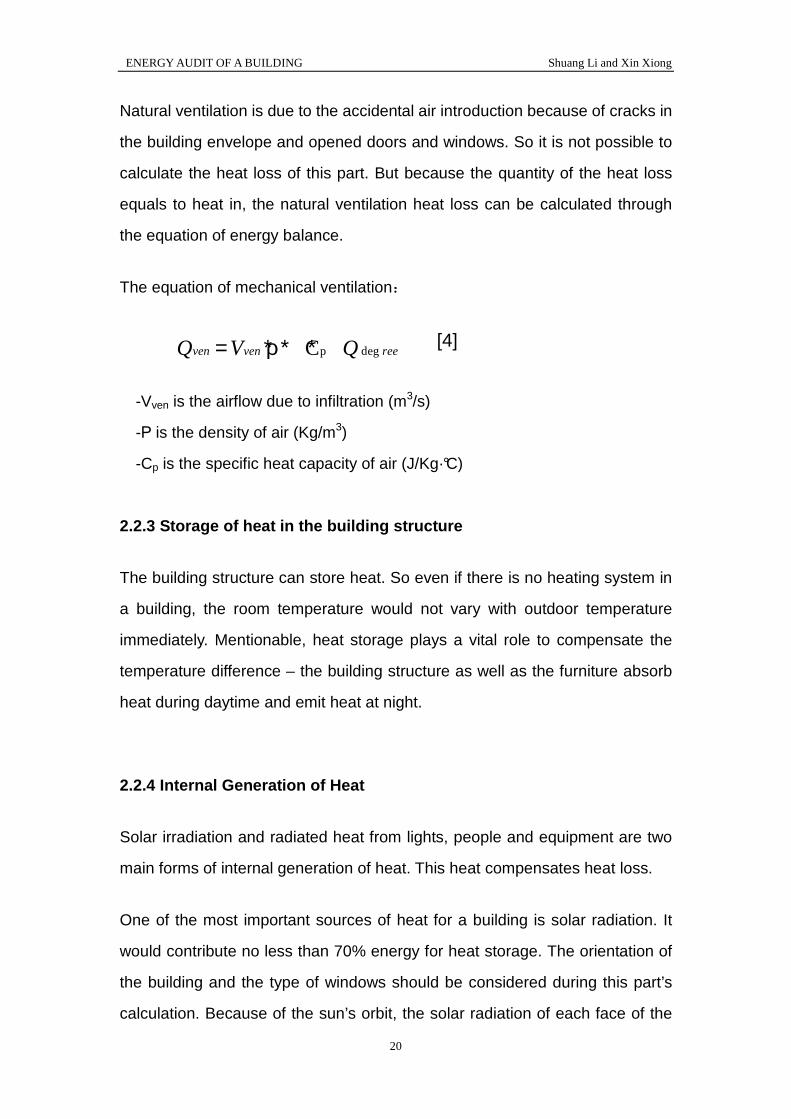
The equation of mechanical ventilation:
p degCven ven reeQ V Q= ∗ρ∗ ∗ [4]
-Vven is the airflow due to infiltration (m3/s)
-Ρ is the density of air (Kg/m3)
-Cp is the specific heat capacity of air (J/Kg·°C)
2.2.3 Storage of heat in the building structure
The building structure can store heat. So even if there is no heating system in
a building, the room temperature would not vary with outdoor temperature
immediately. Mentionable, heat storage plays a vital role to compensate the
temperature difference – the building structure as well as the furniture absorb
heat during daytime and emit heat at night.
2.2.4 Internal Generation of Heat
Solar irradiation and radiated heat from lights, people and equipment are two
main forms of internal generation of heat. This heat compensates heat loss.
One of the most important sources of heat for a building is solar radiation. It
would contribute no less than 70% energy for heat storage. The orientation of
the building and the type of windows should be considered during this part’s
calculation. Because of the sun’s orbit, the solar radiation of each face of the
ENERGY AUDIT OF A BUILDING Shuang Li and Xin Xiong
21
building would not be the same. And due to difference types of windows, such
as 2-glass and 3-glass windows, the coefficient of window varies. All these
factors should be taken into consideration while analyze the solar radiation.
And another source is radiated heat from lights, people and equipment.
People’s activities in the building would emit heat. All the electrical equipments
such as computers, lights, refrigerators, televisions and so on will all generate
heat, in other words, convert electricity into heat.

ENERGY AUDIT OF A BUILDING Shuang Li and Xin Xiong
22
ENERGY AUDIT OF A BUILDING Shuang Li and Xin Xiong
23
3 Calculation and results
3.1 Heat in
3.1.1. District Heating
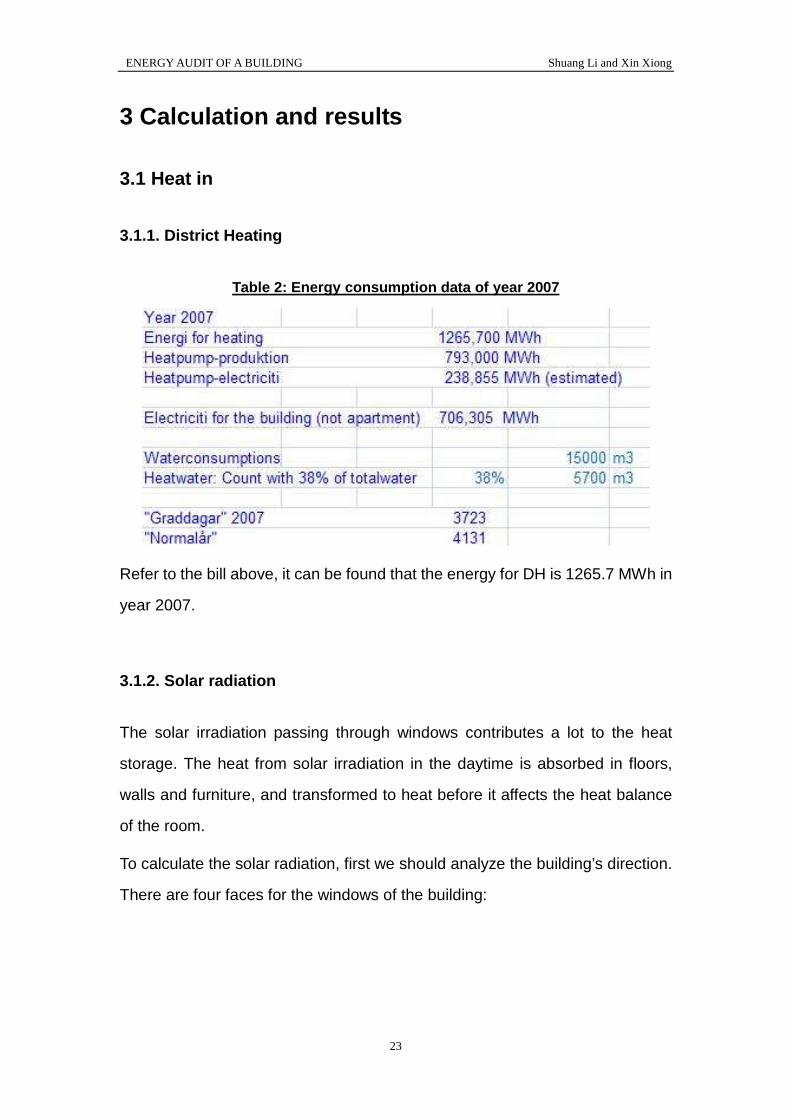
Table 2: Energy consumption data of year 2007
Refer to the bill above, it can be found that the energy for DH is 1265.7 MWh in
year 2007.
3.1.2. Solar radiation
The solar irradiation passing through windows contributes a lot to the heat
storage. The heat from solar irradiation in the daytime is absorbed in floors,
walls and furniture, and transformed to heat before it affects the heat balance
of the room.
To calculate the solar radiation, first we should analyze the building’s direction.
There are four faces for the windows of the building:
ENERGY AUDIT OF A BUILDING Shuang Li and Xin Xiong
24
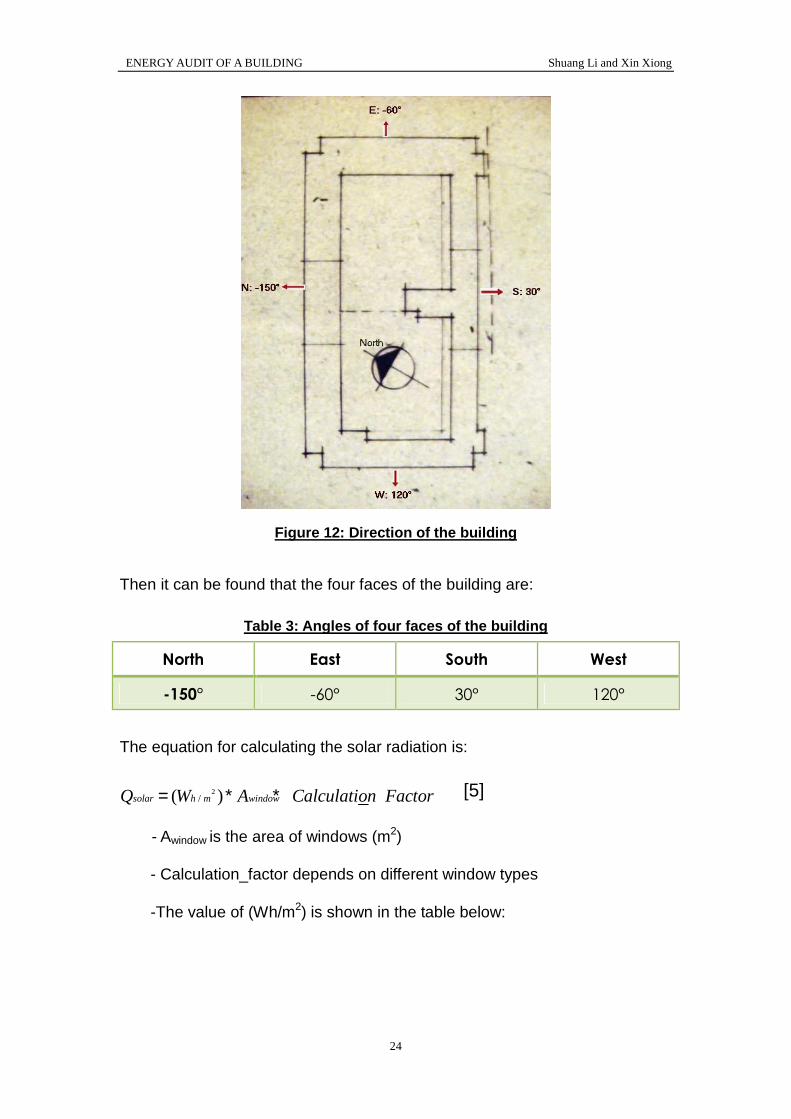
Figure 12: Direction of the building
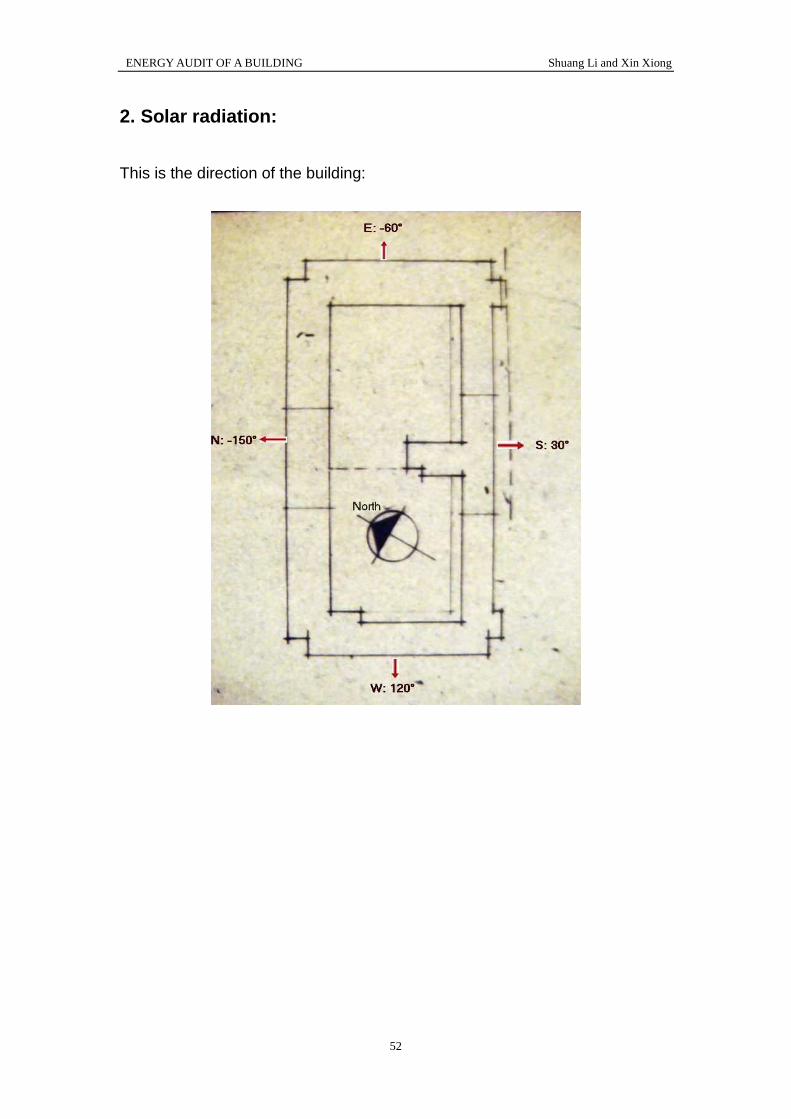
Then it can be found that the four faces of the building are:
Table 3: Angles of four faces of the building
North East South West
-150° -60° 30° 120°
The equation for calculating the solar radiation is:
2/( )solar h m windowQ W A Calculation Factor= ∗ ∗ _ [5]
- Awindow is the area of windows (m2)
- Calculation_factor depends on different window types
-The value of (Wh/m2) is shown in the table below:
ENERGY AUDIT OF A BUILDING Shuang Li and Xin Xiong
25
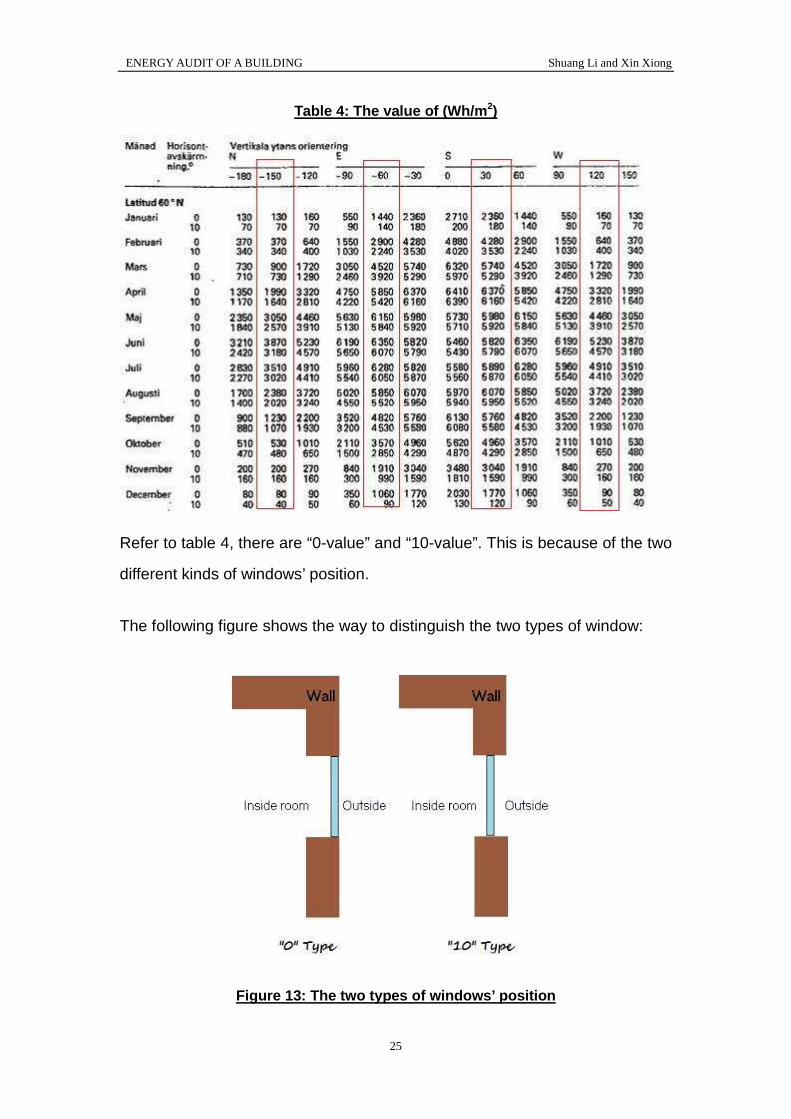
Table 4: The value of (Wh/m 2)
Refer to table 4, there are “0-value” and “10-value”. This is because of the two
different kinds of windows’ position.
The following figure shows the way to distinguish the two types of window:
Figure 13: The two types of windows’ position
ENERGY AUDIT OF A BUILDING Shuang Li and Xin Xiong
26
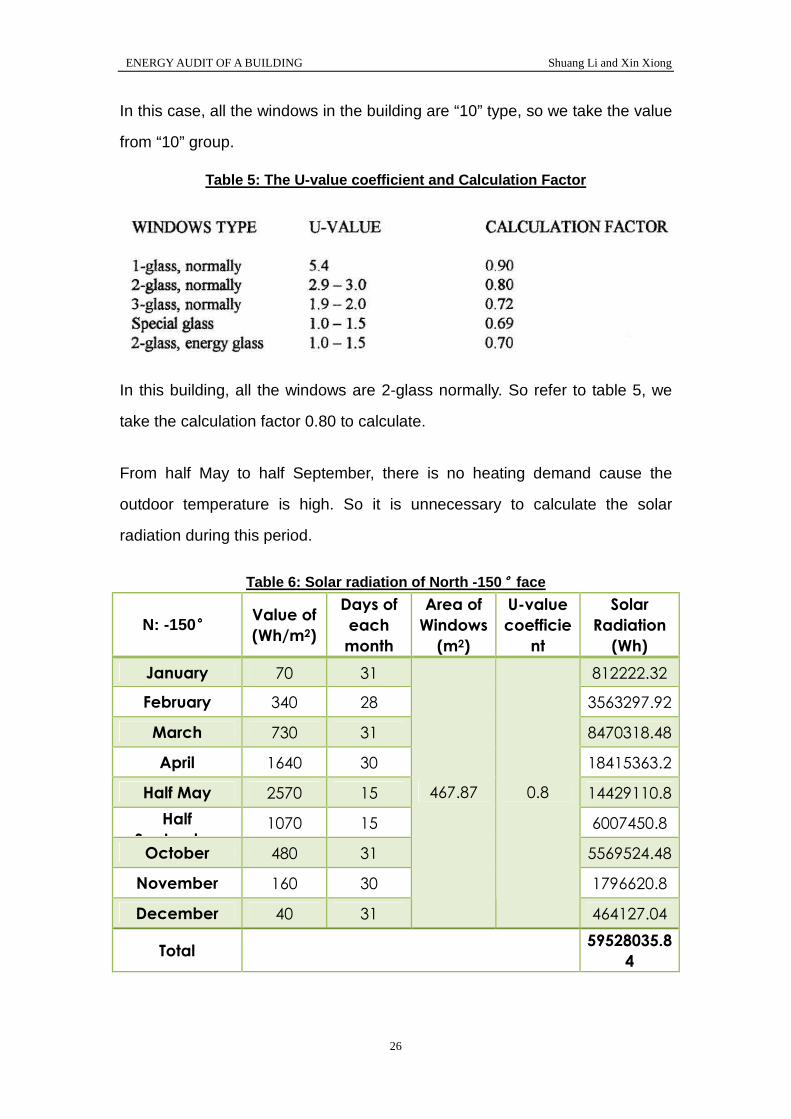
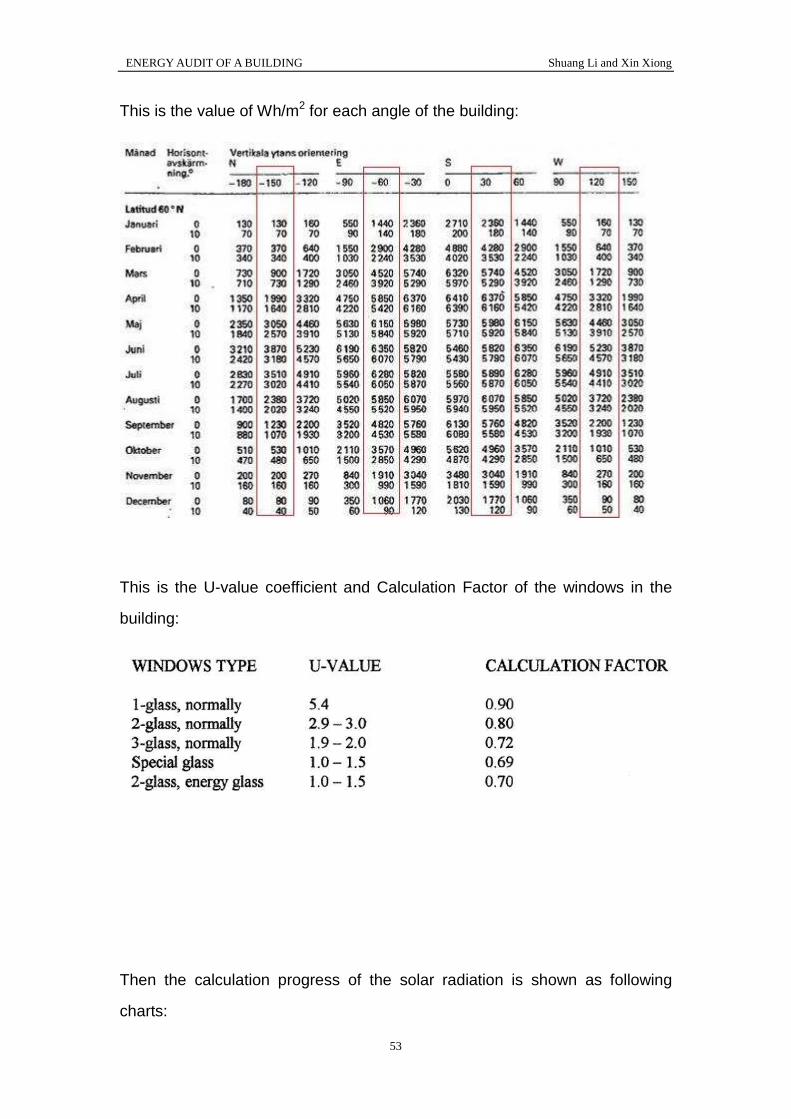
In this case, all the windows in the building are “10” type, so we take the value
from “10” group.
Table 5: The U-value coefficient and Calculation Fa ctor
In this building, all the windows are 2-glass normally. So refer to table 5, we
take the calculation factor 0.80 to calculate.
From half May to half September, there is no heating demand cause the
outdoor temperature is high. So it is unnecessary to calculate the solar
radiation during this period.
Table 6: Solar radiation of North -150 °°°°face
N: -150°°°° Value of
(Wh/m2)
Days of
each
month
Area of
Windows
(m2)
U-value
coefficie
nt
Solar
Radiation
(Wh)
January 70 31 812222.32
February 340 28 3563297.92
March 730 31 8470318.48
April 1640 30 18415363.2
Half May 2570 15 14429110.8
Half
September 1070 15 6007450.8
October 480 31 5569524.48
November 160 30 1796620.8
December 40 31
467.87 0.8
464127.04
Total 59528035.8
4
ENERGY AUDIT OF A BUILDING Shuang Li and Xin Xiong
27
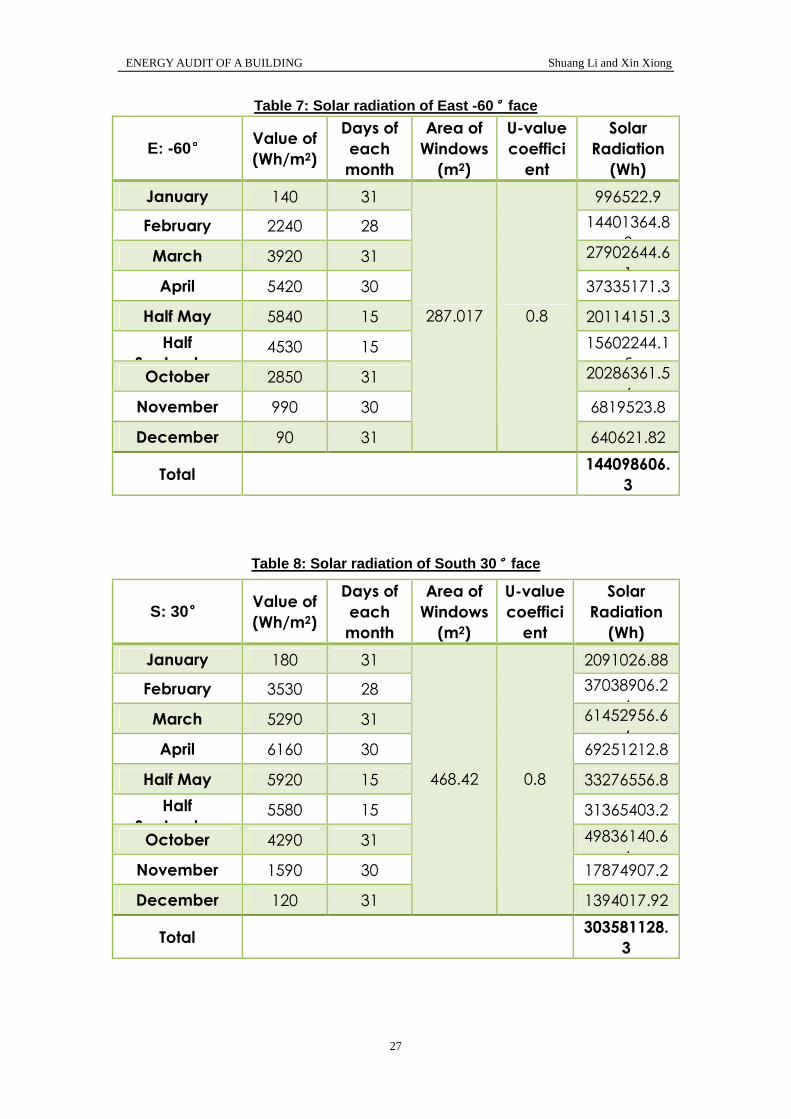
Table 7: Solar radiation of East -60 °°°°face
E: -60°°°° Value of
(Wh/m2)
Days of
each
month
Area of
Windows
(m2)
U-value
coeffici
ent
Solar
Radiation
(Wh)
January 140 31 996522.9
February 2240 28 14401364.8
8 March 3920 31 27902644.6
1 April 5420 30 37335171.3
Half May 5840 15 20114151.3
Half
September 4530 15 15602244.1
5 October 2850 31 20286361.5
6 November 990 30 6819523.8
December 90 31
287.017 0.8
640621.82
Total 144098606.
3
Table 8: Solar radiation of South 30 °°°°face
S: 30°°°° Value of
(Wh/m2)
Days of
each
month
Area of
Windows
(m2)
U-value
coeffici
ent
Solar
Radiation
(Wh)
January 180 31 2091026.88
February 3530 28 37038906.2
4 March 5290 31 61452956.6
4 April 6160 30 69251212.8
Half May 5920 15 33276556.8
Half
September 5580 15 31365403.2
October 4290 31 49836140.6
4 November 1590 30 17874907.2
December 120 31
468.42 0.8
1394017.92
Total 303581128.
3
ENERGY AUDIT OF A BUILDING Shuang Li and Xin Xiong
28
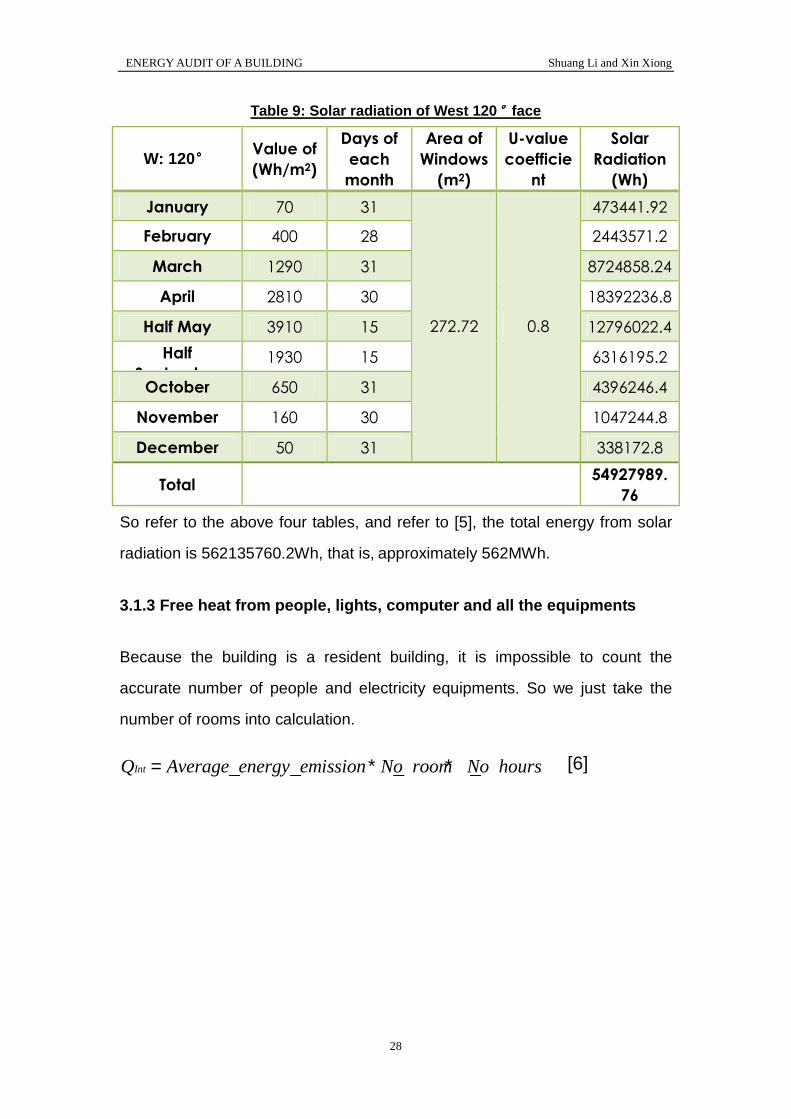
Table 9: Solar radiation of West 120 °°°°face
W: 120°°°° Value of
(Wh/m2)
Days of
each
month
Area of
Windows
(m2)
U-value
coefficie
nt
Solar
Radiation
(Wh)
January 70 31 473441.92
February 400 28 2443571.2
March 1290 31 8724858.24
April 2810 30 18392236.8
Half May 3910 15 12796022.4
Half
September 1930 15 6316195.2
October 650 31 4396246.4
November 160 30 1047244.8
December 50 31
272.72 0.8
338172.8
Total 54927989.
76
So refer to the above four tables, and refer to [5], the total energy from solar
radiation is 562135760.2Wh, that is, approximately 562MWh.
3.1.3 Free heat from people, lights, computer and all the equipments
Because the building is a resident building, it is impossible to count the
accurate number of people and electricity equipments. So we just take the
number of rooms into calculation.
IntQ Average energy emission No room No hours= _ _ ∗ _ ∗ _ [6]
ENERGY AUDIT OF A BUILDING Shuang Li and Xin Xiong
29
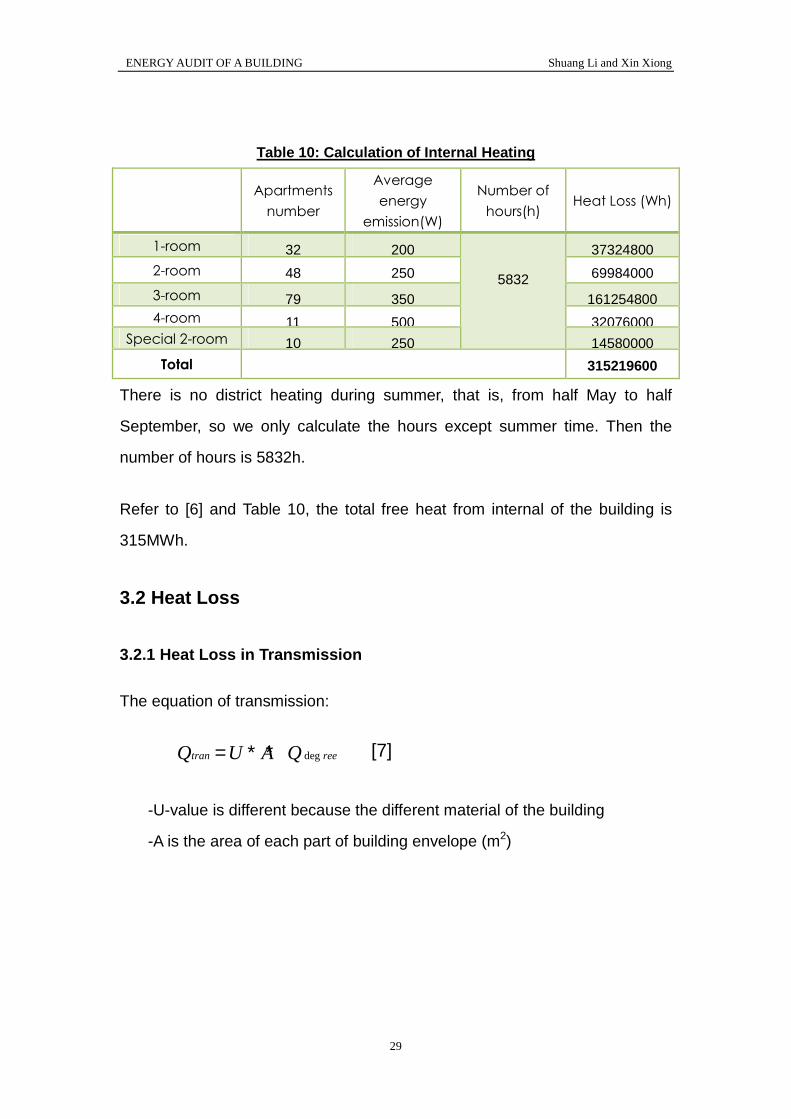
Table 10: Calculation of Internal Heating
Apartments
number
Average
energy
emission(W)
Number of
hours(h) Heat Loss (Wh)
1-room 32 200 37324800
2-room 48 250 69984000
3-room 79 350 161254800 4-room 11 500 32076000
Special 2-room 10 250
5832
14580000
Total 315219600
There is no district heating during summer, that is, from half May to half
September, so we only calculate the hours except summer time. Then the
number of hours is 5832h.
Refer to [6] and Table 10, the total free heat from internal of the building is
315MWh.
3.2 Heat Loss
3.2.1 Heat Loss in Transmission
The equation of transmission:
degtran reeQ U A Q= ∗ ∗ [7]
-U-value is different because the different material of the building
-A is the area of each part of building envelope (m2)
ENERGY AUDIT OF A BUILDING Shuang Li and Xin Xiong
30
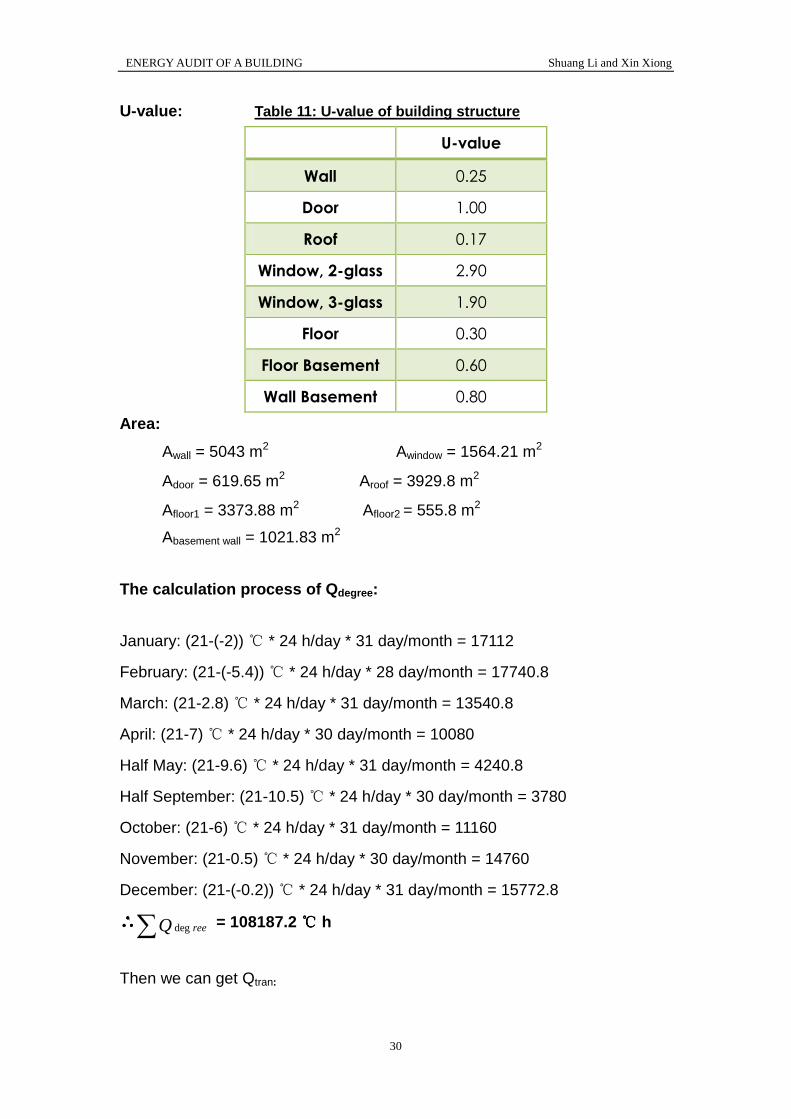
U-value: Table 11: U-value of building structure
U-value
Wall 0.25
Door 1.00
Roof 0.17
Window, 2-glass 2.90
Window, 3-glass 1.90
Floor 0.30
Floor Basement 0.60
Wall Basement 0.80
Area:
Awall = 5043 m2 Awindow = 1564.21 m2
Adoor = 619.65 m2 Aroof = 3929.8 m2
Afloor1 = 3373.88 m2 Afloor2 = 555.8 m2
Abasement wall = 1021.83 m2
The calculation process of Qdegree:
January: (21-(-2)) ℃ * 24 h/day * 31 day/month = 17112
February: (21-(-5.4)) ℃ * 24 h/day * 28 day/month = 17740.8
March: (21-2.8) ℃ * 24 h/day * 31 day/month = 13540.8
April: (21-7) ℃ * 24 h/day * 30 day/month = 10080
Half May: (21-9.6) ℃ * 24 h/day * 31 day/month = 4240.8
Half September: (21-10.5) ℃ * 24 h/day * 30 day/month = 3780
October: (21-6) ℃ * 24 h/day * 31 day/month = 11160
November: (21-0.5) ℃ * 24 h/day * 30 day/month = 14760
December: (21-(-0.2)) ℃ * 24 h/day * 31 day/month = 15772.8
∴∴∴∴ deg reeQ∑ = 108187.2 ℃℃℃℃ h
Then we can get Qtran:
ENERGY AUDIT OF A BUILDING Shuang Li and Xin Xiong
31
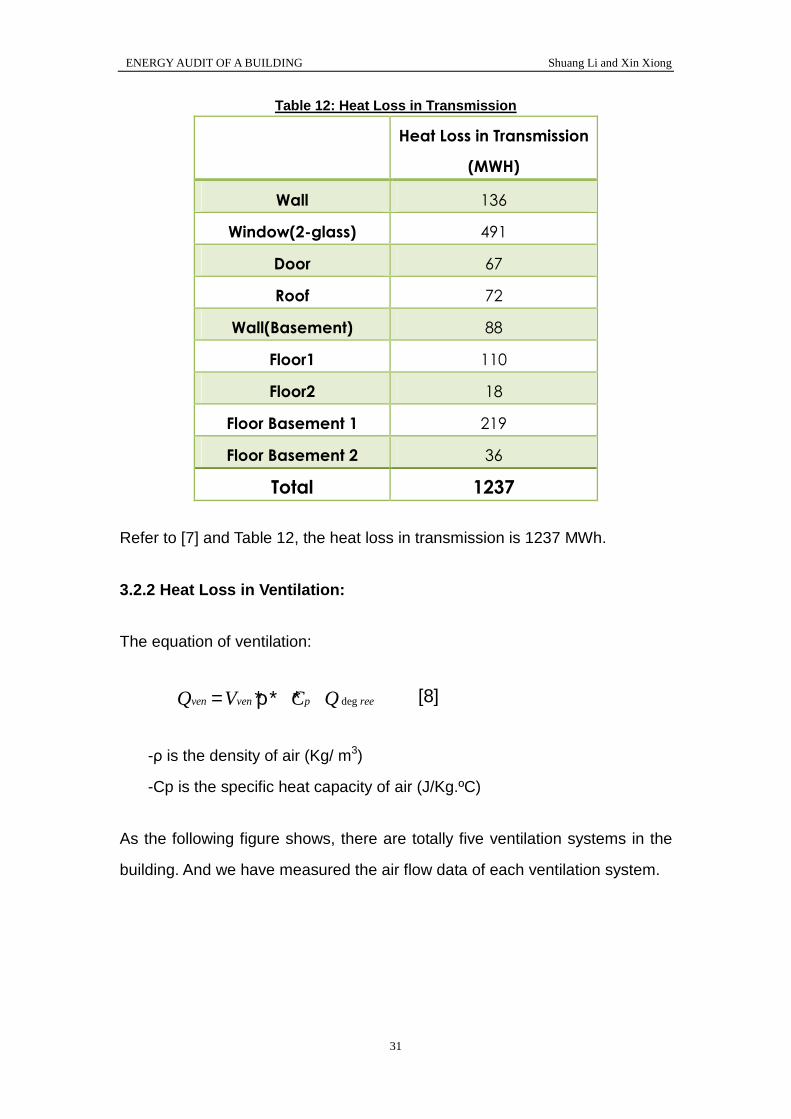
Table 12: Heat Loss in Transmission
Heat Loss in Transmission
(MWH)
Wall 136
Window(2-glass) 491
Door 67
Roof 72
Wall(Basement) 88
Floor1 110
Floor2 18
Floor Basement 1 219
Floor Basement 2 36
Total 1237
Refer to [7] and Table 12, the heat loss in transmission is 1237 MWh.
3.2.2 Heat Loss in Ventilation:
The equation of ventilation:
degven ven p reeQ V C Q= ∗ρ∗ ∗ [8]
-ρ is the density of air (Kg/ m3)
-Cp is the specific heat capacity of air (J/Kg.ºC)
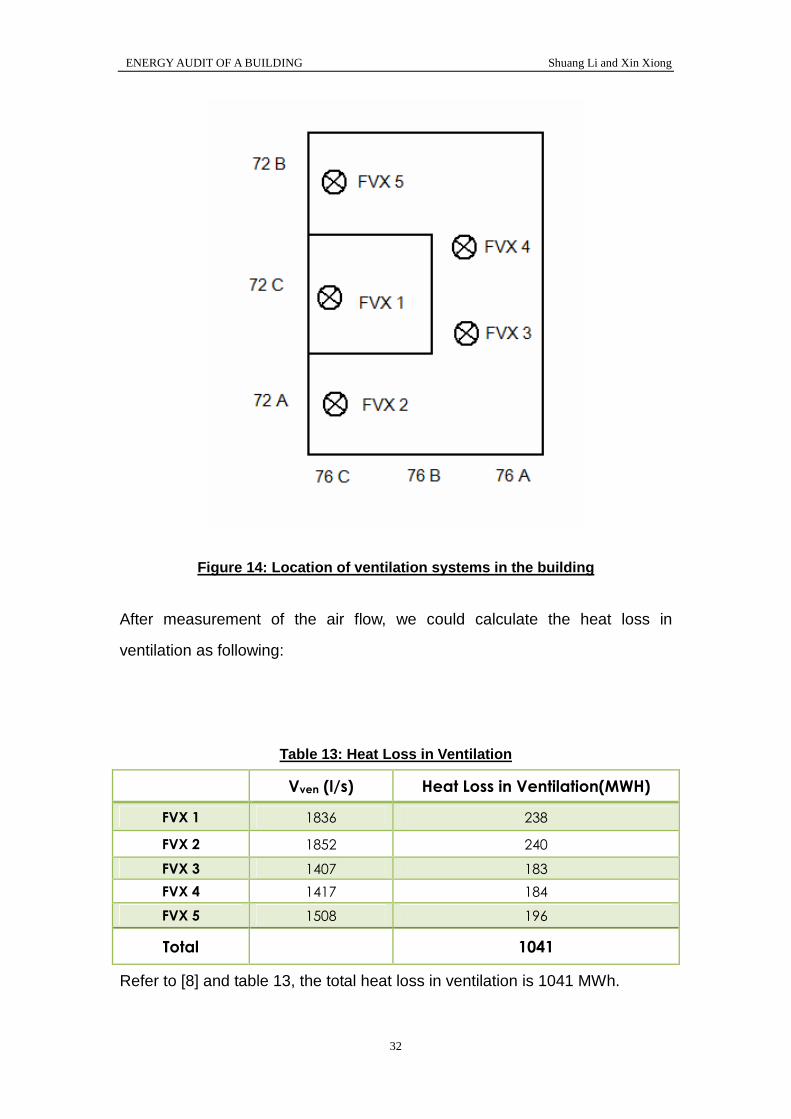
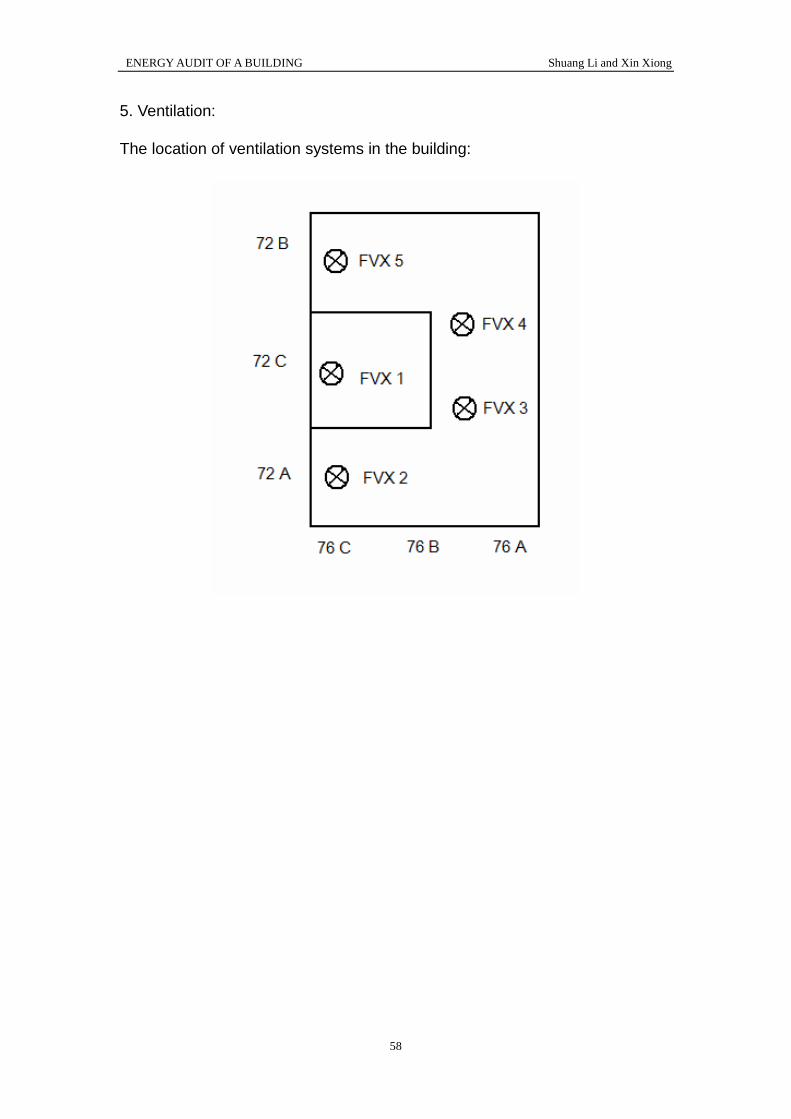
As the following figure shows, there are totally five ventilation systems in the
building. And we have measured the air flow data of each ventilation system.
ENERGY AUDIT OF A BUILDING Shuang Li and Xin Xiong
32
Figure 14: Location of ventilation systems in the b uilding
After measurement of the air flow, we could calculate the heat loss in
ventilation as following:
Table 13: Heat Loss in Ventilation
Vven (l/s) Heat Loss in Ventilation(MWH)
FVX 1 1836 238
FVX 2 1852 240
FVX 3 1407 183
FVX 4 1417 184
FVX 5 1508 196
Total 1041
Refer to [8] and table 13, the total heat loss in ventilation is 1041 MWh.
ENERGY AUDIT OF A BUILDING Shuang Li and Xin Xiong
33
3.2.3 Hot tap water
The equation of hot tap water:
water pQ C V T= ρ∗ ∗ ∗ [9]
-ρ is the density of water (Kg/ m3)
-Cp is the specific heat capacity of water (J/Kg·ºC)
-V is the amount of water that have been consumed (m3)
-T is the temperature difference(℃)
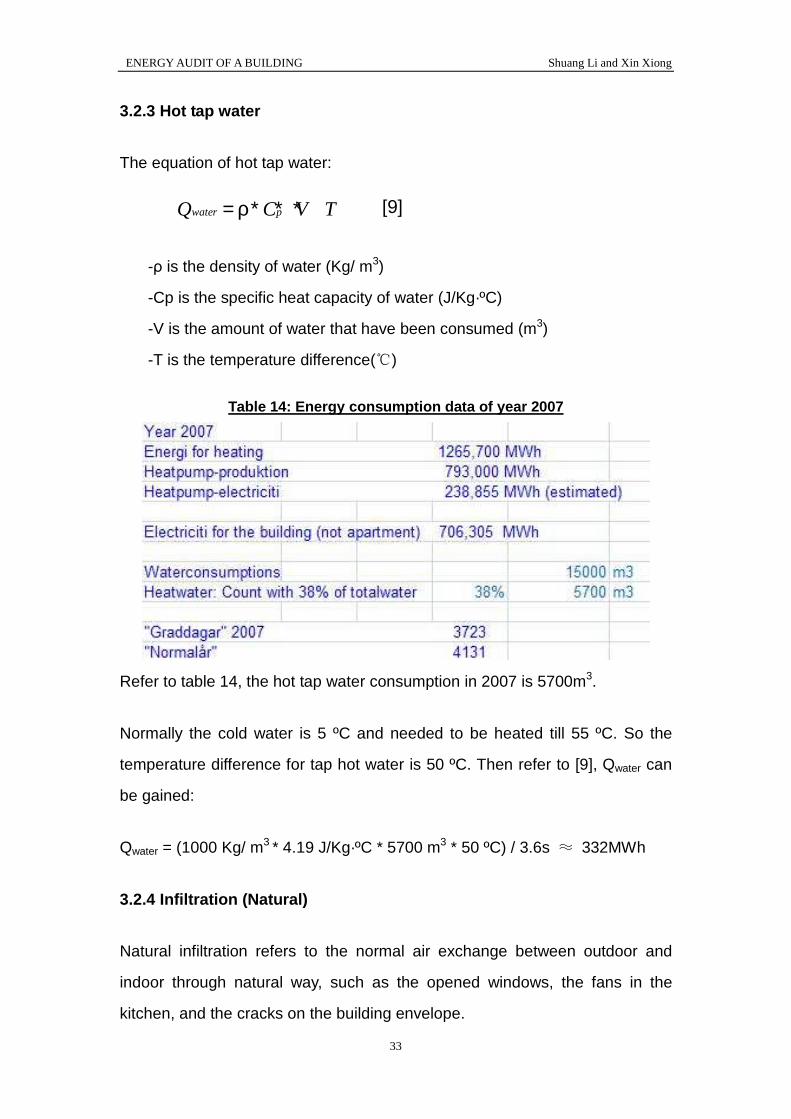
Table 14: Energy consumption data of year 2007
Refer to table 14, the hot tap water consumption in 2007 is 5700m3.
Normally the cold water is 5 ºC and needed to be heated till 55 ºC. So the
temperature difference for tap hot water is 50 ºC. Then refer to [9], Qwater can
be gained:
Qwater = (1000 Kg/ m3 * 4.19 J/Kg·ºC * 5700 m3 * 50 ºC) / 3.6s ≈ 332MWh
3.2.4 Infiltration (Natural)
Natural infiltration refers to the normal air exchange between outdoor and
indoor through natural way, such as the opened windows, the fans in the
kitchen, and the cracks on the building envelope.
ENERGY AUDIT OF A BUILDING Shuang Li and Xin Xiong
34
So the only way to calculate heat loss in this part is making use of energy
balance.
The equation of energy balance is:
( ) ( )tran ven Mech ven Natr water DH solar Int pumpQ Q Q Q QQ Q Q + = + + ++ + [10]
All the parameters have been found out except the heat loss of natural
ventilation, so refer to [10], it is easy to find that the value of Qven(Natural) is
325.7MWh.
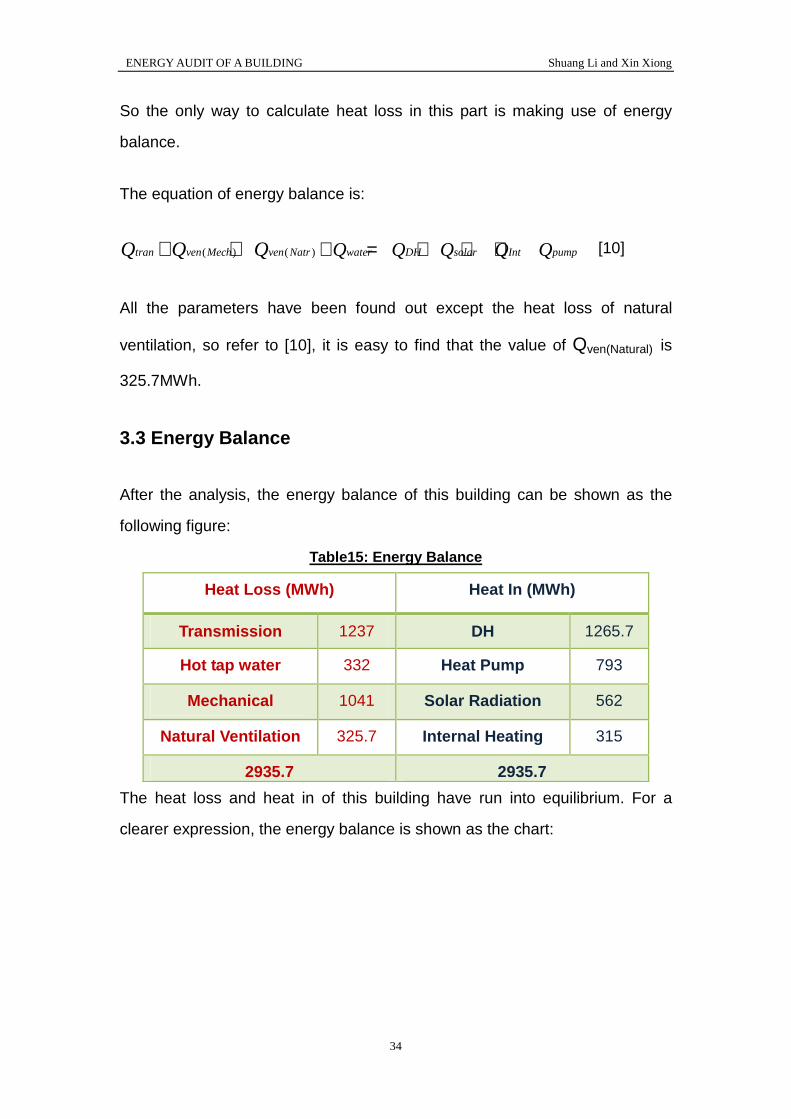
3.3 Energy Balance
After the analysis, the energy balance of this building can be shown as the
following figure:
Table15: Energy Balance
Heat Loss (MWh) Heat In (MWh)
Transmission 1237 DH 1265.7
Hot tap water 332 Heat Pump 793
Mechanical 1041 Solar Radiation 562
Natural Ventilation 325.7 Internal Heating 315
2935.7 2935.7
The heat loss and heat in of this building have run into equilibrium. For a
clearer expression, the energy balance is shown as the chart:

ENERGY AUDIT OF A BUILDING Shuang Li and Xin Xiong
35
Heat Loss Heat In
Energy Balance
Transmission
Hot Top Water
Mechanical Ventilation
Natural Ventilation
DH
Heat Pump
SolarRadiation
Internal Heat
Figure 15: Chart of Energy Balance

ENERGY AUDIT OF A BUILDING Shuang Li and Xin Xiong
36
ENERGY AUDIT OF A BUILDING Shuang Li and Xin Xiong
37
4 Solutions
4.1 Discussion for energy saving
The building must obtain the energy to maintain the indoor temperature in the
winter. The heat in of the building includes the district heating, heat pump and
free heat from people, electrical equipments as well as solar radiation which
enters through the windows, doors, roof and walls.
The heat loss of the building includes the heat loss in transmission through
windows, doors, roof and walls, the heat loss in infiltration and hot tap water.
Once the total heat in and heat loss is in equilibrium, the temperature keeps in
constant.
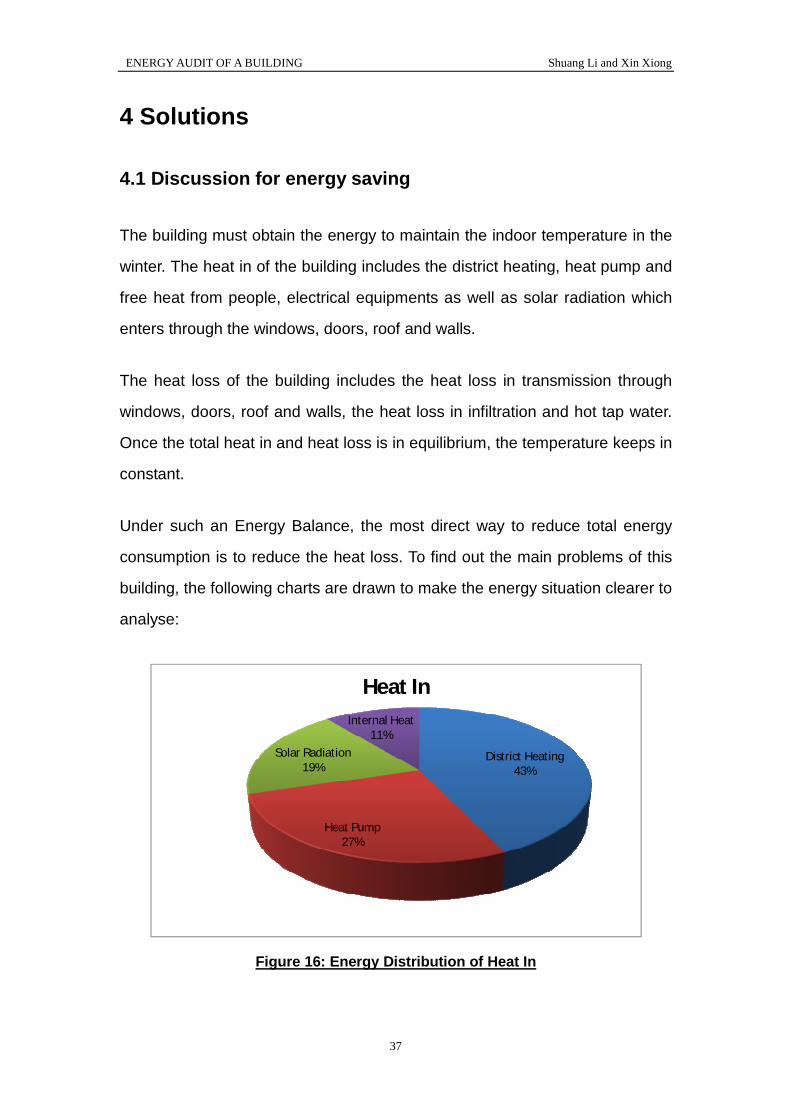
Under such an Energy Balance, the most direct way to reduce total energy
consumption is to reduce the heat loss. To find out the main problems of this
building, the following charts are drawn to make the energy situation clearer to
analyse:
District Heating43%
Heat Pump27%
Solar Radiation19%
Internal Heat11%
Heat In
Figure 16: Energy Distribution of Heat In
ENERGY AUDIT OF A BUILDING Shuang Li and Xin Xiong
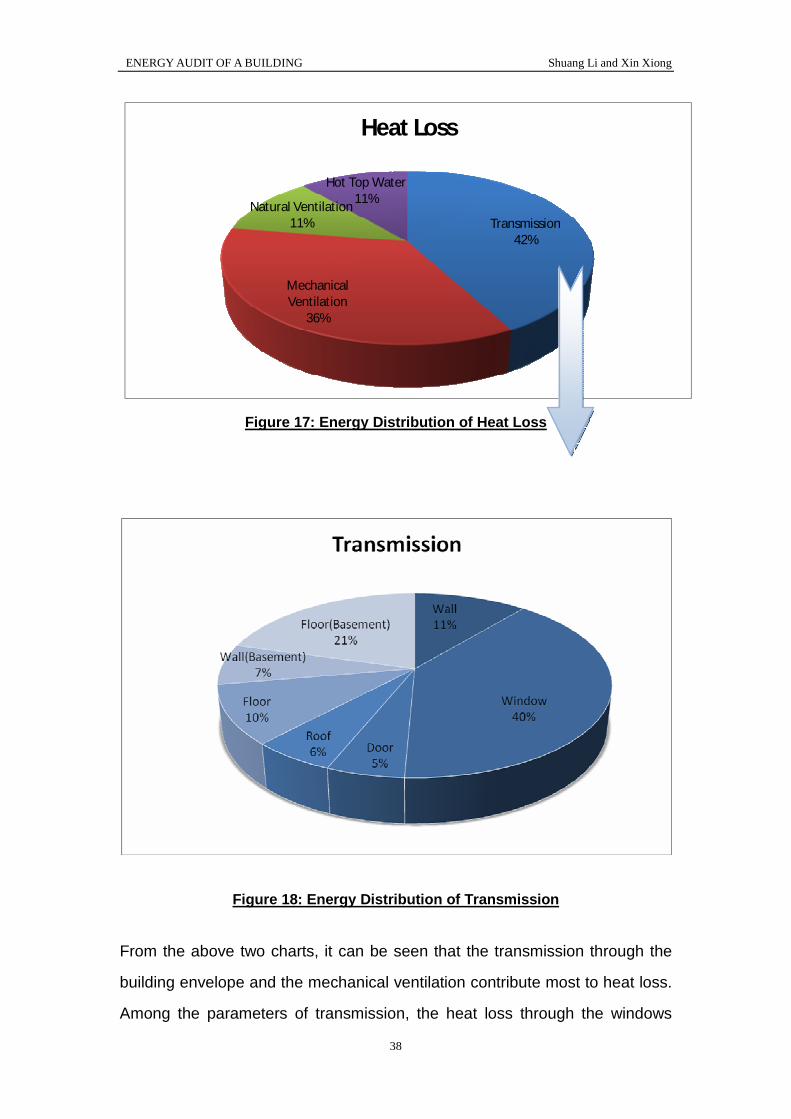
38
Transmission42%
Mechanical Ventilation
36%
Natural Ventilation11%
Hot Top Water11%
Heat Loss
Figure 17: Energy Distribution of Heat Loss
Figure 18: Energy Distribution of Transmission
From the above two charts, it can be seen that the transmission through the
building envelope and the mechanical ventilation contribute most to heat loss.
Among the parameters of transmission, the heat loss through the windows
ENERGY AUDIT OF A BUILDING Shuang Li and Xin Xiong
39
occupies the largest part.
So it is clear that we should pay more attention to transmission, especially the
heat loss through windows, while doing the energy save analysis.
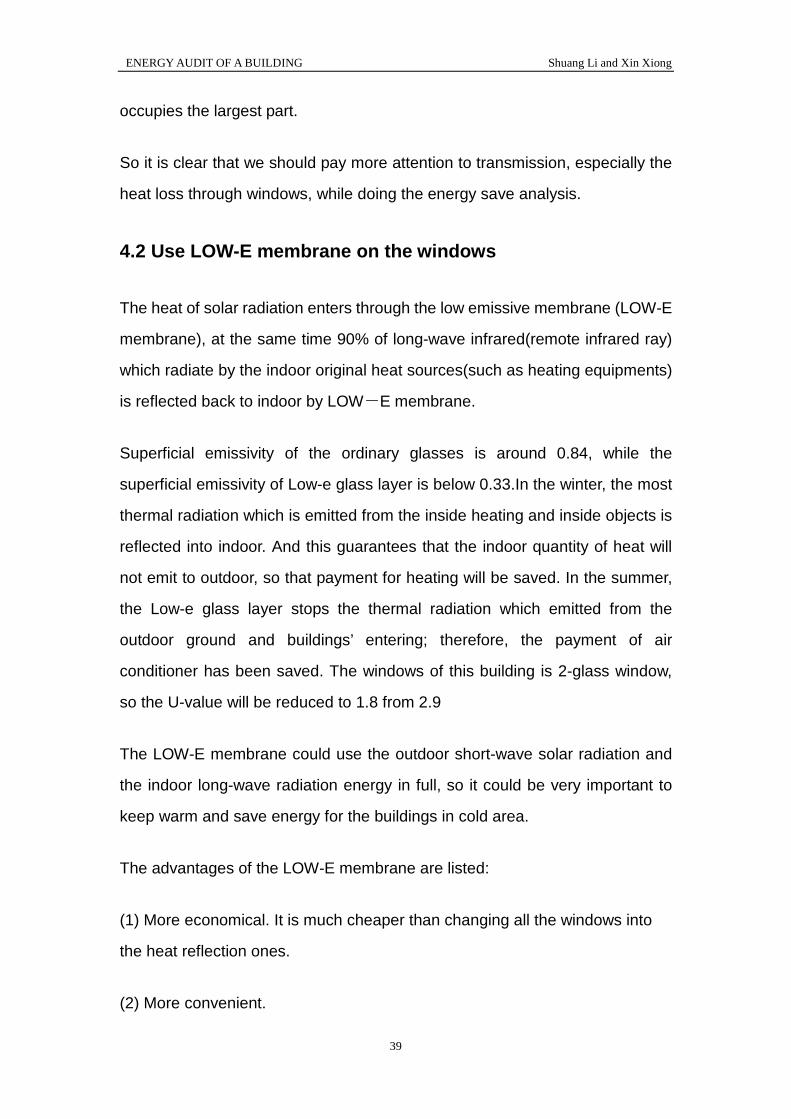
4.2 Use LOW-E membrane on the windows
The heat of solar radiation enters through the low emissive membrane (LOW-E
membrane), at the same time 90% of long-wave infrared(remote infrared ray)
which radiate by the indoor original heat sources(such as heating equipments)
is reflected back to indoor by LOW-E membrane.
Superficial emissivity of the ordinary glasses is around 0.84, while the
superficial emissivity of Low-e glass layer is below 0.33.In the winter, the most
thermal radiation which is emitted from the inside heating and inside objects is
reflected into indoor. And this guarantees that the indoor quantity of heat will
not emit to outdoor, so that payment for heating will be saved. In the summer,
the Low-e glass layer stops the thermal radiation which emitted from the
outdoor ground and buildings’ entering; therefore, the payment of air
conditioner has been saved. The windows of this building is 2-glass window,
so the U-value will be reduced to 1.8 from 2.9
The LOW-E membrane could use the outdoor short-wave solar radiation and
the indoor long-wave radiation energy in full, so it could be very important to
keep warm and save energy for the buildings in cold area.
The advantages of the LOW-E membrane are listed:
(1) More economical. It is much cheaper than changing all the windows into
the heat reflection ones.
(2) More convenient.
ENERGY AUDIT OF A BUILDING Shuang Li and Xin Xiong
40
(3) Environmental protection. Replacing glasses will produce massive
construction trash of glass fragments and increase the cost of transportation
and landfill. However, the LOW-E membrane could use the old glasses and
promote the performance of heat insulation and the safety.
(4) Safer. The heat insulation membrane generally has the function of
enhancing the safety, and simultaneously plays the role of sticking and holding
the glasses fragment.
(5) Healthier. The membrane includes UV (ultraviolet ray) absorbent, which
may cut off 98%-99%ultraviolet rays.
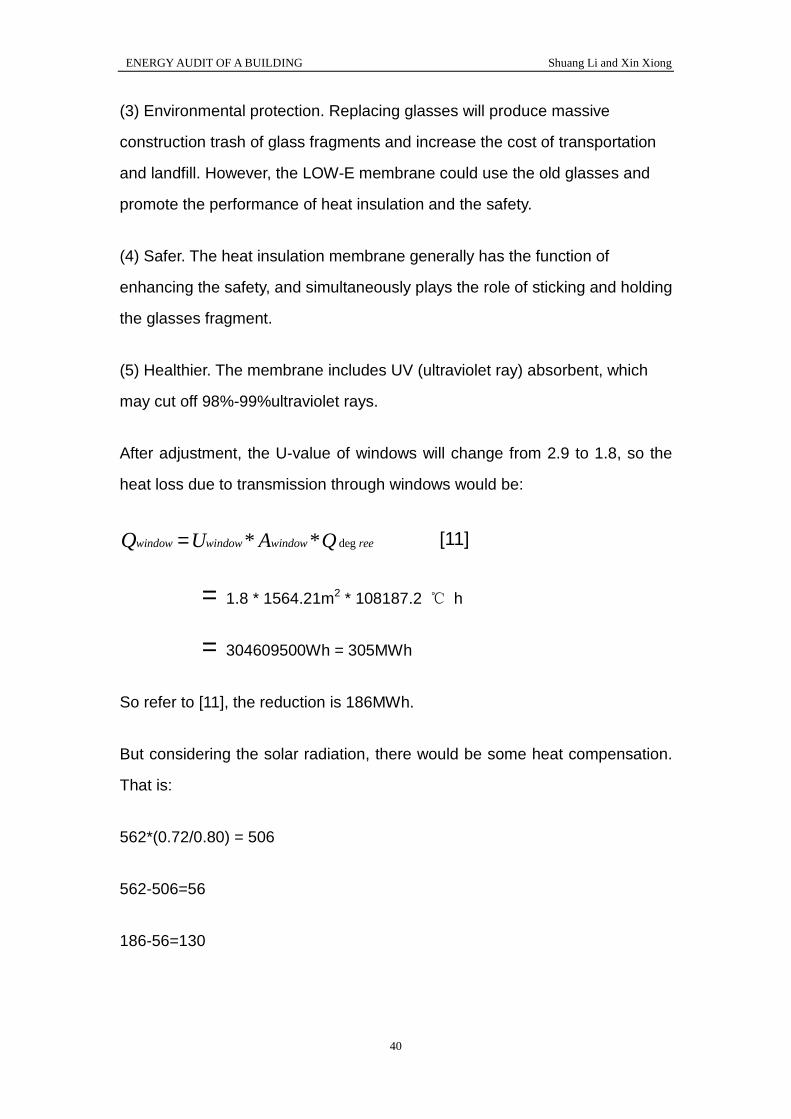
After adjustment, the U-value of windows will change from 2.9 to 1.8, so the
heat loss due to transmission through windows would be:
deg* *window window window reeU A QQ = [11]
= 1.8 * 1564.21m2 * 108187.2 ℃ h
= 304609500Wh = 305MWh
So refer to [11], the reduction is 186MWh.
But considering the solar radiation, there would be some heat compensation.
That is:
562*(0.72/0.80) = 506
562-506=56
186-56=130
ENERGY AUDIT OF A BUILDING Shuang Li and Xin Xiong
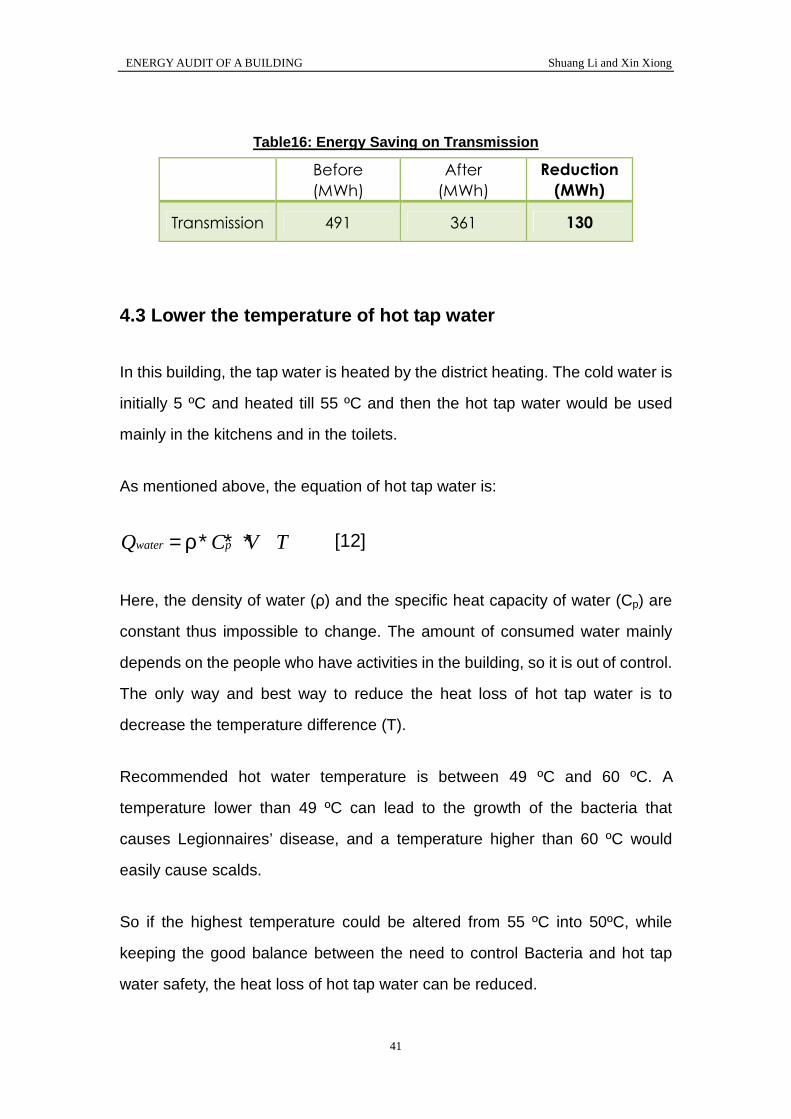
41
Table16: Energy Saving on Transmission
Before
(MWh)
After
(MWh)
Reduction
(MWh)
Transmission 491 361 130
4.3 Lower the temperature of hot tap water
In this building, the tap water is heated by the district heating. The cold water is
initially 5 ºC and heated till 55 ºC and then the hot tap water would be used
mainly in the kitchens and in the toilets.
As mentioned above, the equation of hot tap water is:
water pQ C V T= ρ∗ ∗ ∗ [12]
Here, the density of water (ρ) and the specific heat capacity of water (Cp) are
constant thus impossible to change. The amount of consumed water mainly
depends on the people who have activities in the building, so it is out of control.
The only way and best way to reduce the heat loss of hot tap water is to
decrease the temperature difference (T).
Recommended hot water temperature is between 49 ºC and 60 ºC. A
temperature lower than 49 ºC can lead to the growth of the bacteria that
causes Legionnaires’ disease, and a temperature higher than 60 ºC would
easily cause scalds.
So if the highest temperature could be altered from 55 ºC into 50ºC, while
keeping the good balance between the need to control Bacteria and hot tap
water safety, the heat loss of hot tap water can be reduced.
ENERGY AUDIT OF A BUILDING Shuang Li and Xin Xiong
42
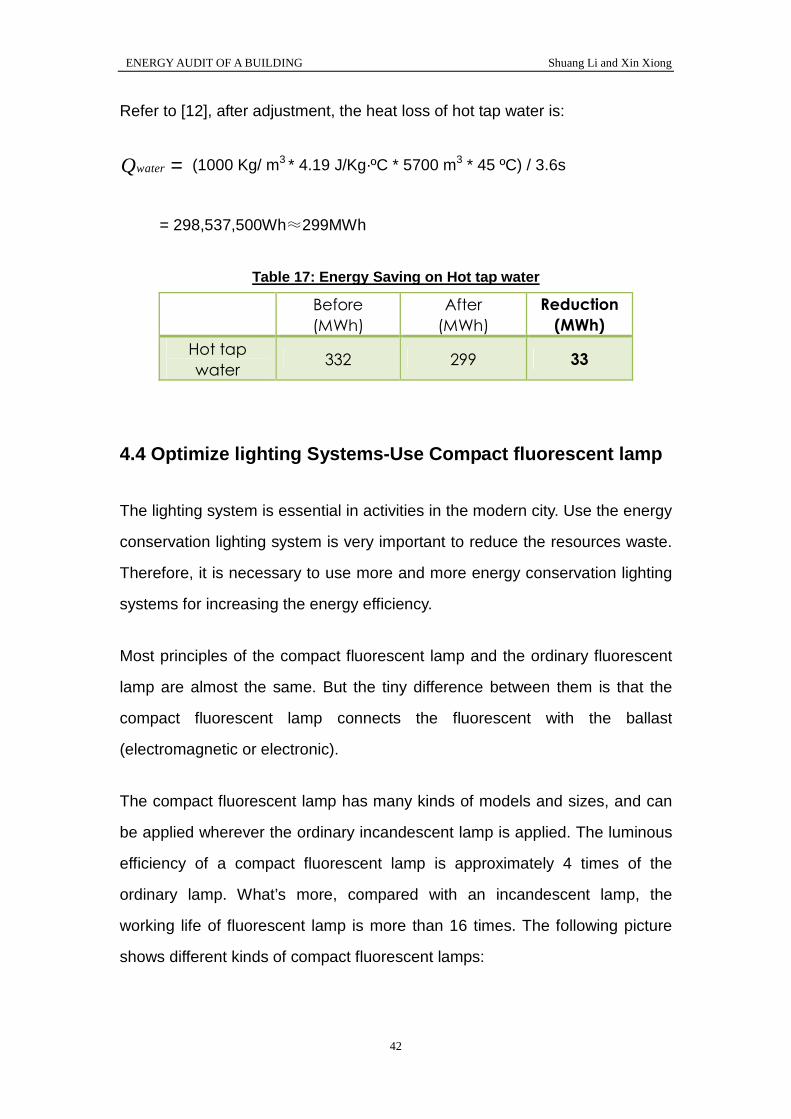
Refer to [12], after adjustment, the heat loss of hot tap water is:
waterQ = (1000 Kg/ m3 * 4.19 J/Kg·ºC * 5700 m3 * 45 ºC) / 3.6s
= 298,537,500Wh≈299MWh
Table 17: Energy Saving on Hot tap water
Before
(MWh)
After
(MWh)
Reduction
(MWh)
Hot tap
water 332 299 33
4.4 Optimize lighting Systems-Use Compact fluorescent lamp
The lighting system is essential in activities in the modern city. Use the energy
conservation lighting system is very important to reduce the resources waste.
Therefore, it is necessary to use more and more energy conservation lighting
systems for increasing the energy efficiency.
Most principles of the compact fluorescent lamp and the ordinary fluorescent
lamp are almost the same. But the tiny difference between them is that the
compact fluorescent lamp connects the fluorescent with the ballast
(electromagnetic or electronic).
The compact fluorescent lamp has many kinds of models and sizes, and can
be applied wherever the ordinary incandescent lamp is applied. The luminous
efficiency of a compact fluorescent lamp is approximately 4 times of the
ordinary lamp. What’s more, compared with an incandescent lamp, the
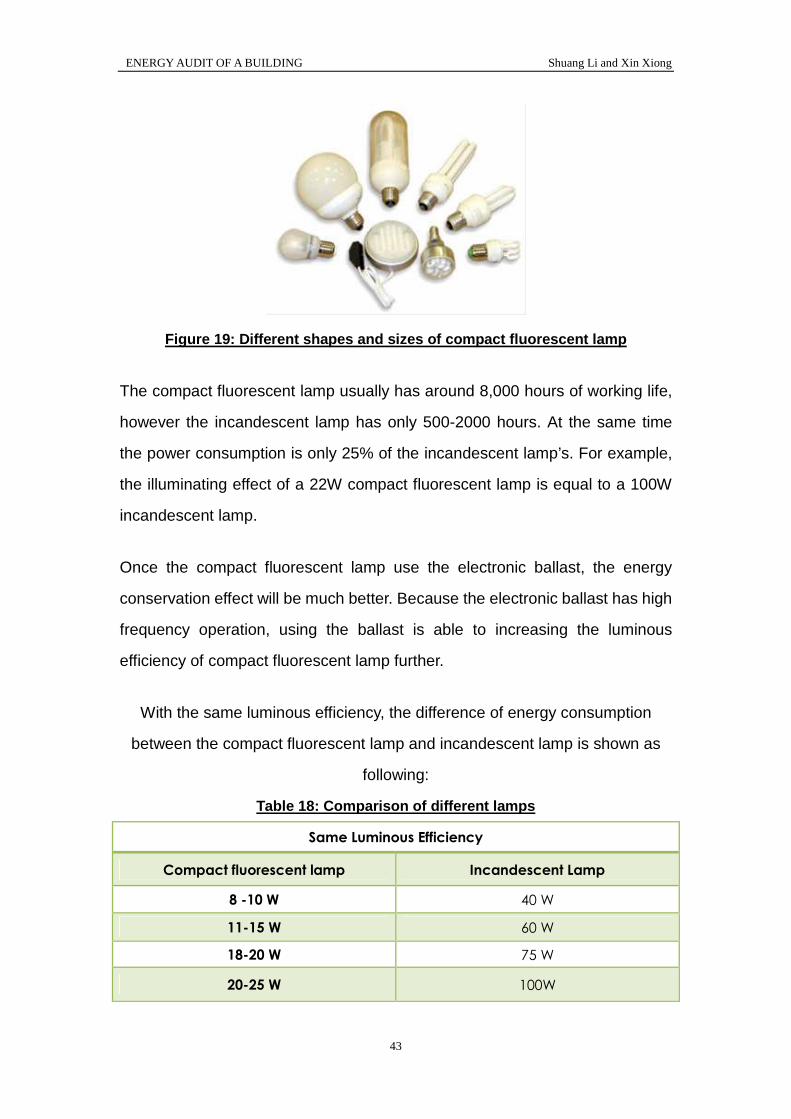
working life of fluorescent lamp is more than 16 times. The following picture
shows different kinds of compact fluorescent lamps:
ENERGY AUDIT OF A BUILDING Shuang Li and Xin Xiong
43
Figure 19: Different shapes and sizes of compact fl uorescent lamp
The compact fluorescent lamp usually has around 8,000 hours of working life,
however the incandescent lamp has only 500-2000 hours. At the same time
the power consumption is only 25% of the incandescent lamp’s. For example,
the illuminating effect of a 22W compact fluorescent lamp is equal to a 100W
incandescent lamp.
Once the compact fluorescent lamp use the electronic ballast, the energy
conservation effect will be much better. Because the electronic ballast has high
frequency operation, using the ballast is able to increasing the luminous
efficiency of compact fluorescent lamp further.
With the same luminous efficiency, the difference of energy consumption
between the compact fluorescent lamp and incandescent lamp is shown as
following:
Table 18: Comparison of different lamps
Same Luminous Efficiency
Compact fluorescent lamp Incandescent Lamp
8 -10 W 40 W
11-15 W 60 W
18-20 W 75 W
20-25 W 100W

ENERGY AUDIT OF A BUILDING Shuang Li and Xin Xiong
44
ENERGY AUDIT OF A BUILDING Shuang Li and Xin Xiong
45
5. Conclusion
5.1 Energy survey of the building
The aim of this paper is to make a detailed analysis of the current energy
situation of the building, then evaluate a series of ways to reduce the energy
consumption and optimize the energy efficiency.
This building is a residential building. It lies in the south of Gavle, just at the
crossing of S. Centralgatan and Nedre Åkargatan street. There are 180
apartments in this building in total.
During the energy survey and save progress, first the whole condition of
energy balance of this building is analyzed. There are several parameters that
involve the heat loss and heat in of whole building, so each parameter in the
energy balance equation is extracted and calculated. Then it can be seen that
the transmission occupy most of the heat loss part, so this parameter should
be given higher consideration while doing the energy save analysis. The
simulation program has been used during the progress. After a plenty of
inquisition into the energy situation, we suggested several solutions to save
energy as well as cost for this building.
5.2 Solutions and results
5.2.1 Solutions
The windows have been used for several years without changing. The
windows of this building are the 2-glass windows whose U-value is 2.9 and a
large amount of heat transmits through this type of windows.
ENERGY AUDIT OF A BUILDING Shuang Li and Xin Xiong
46
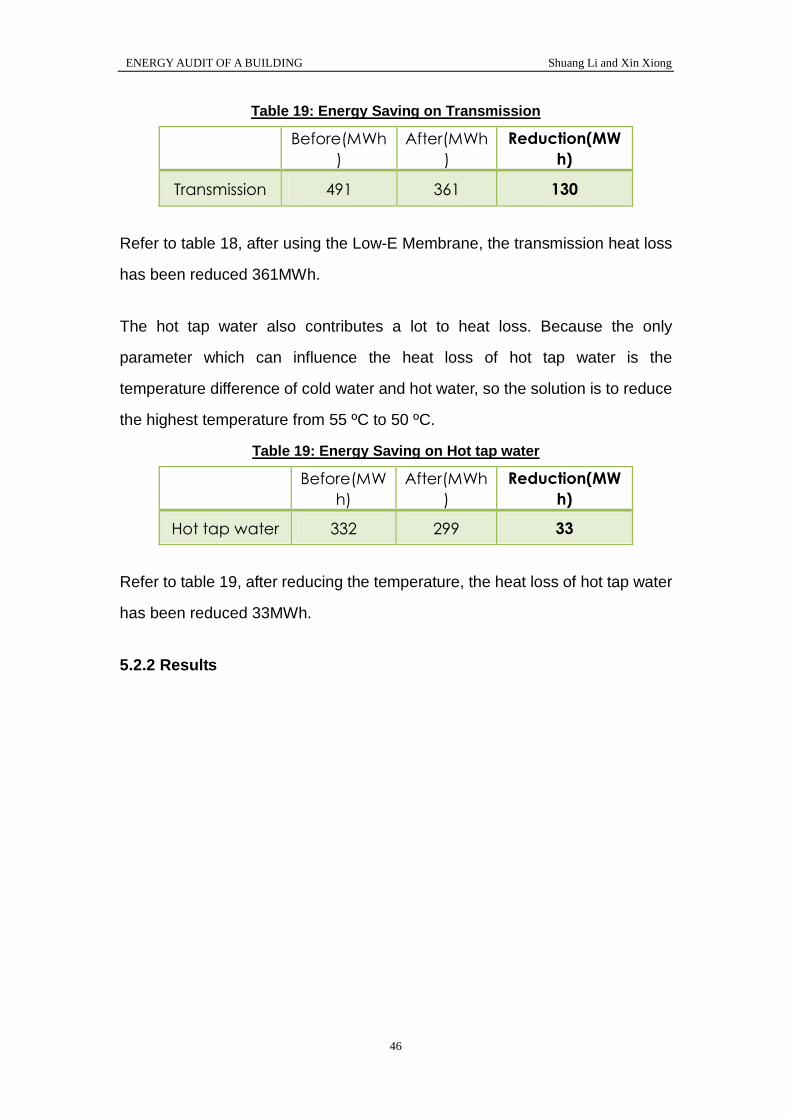
Table 19: Energy Saving on Transmission
Before(MWh
)
After(MWh
)
Reduction(MW
h)
Transmission 491 361 130
Refer to table 18, after using the Low-E Membrane, the transmission heat loss
has been reduced 361MWh.
The hot tap water also contributes a lot to heat loss. Because the only
parameter which can influence the heat loss of hot tap water is the
temperature difference of cold water and hot water, so the solution is to reduce
the highest temperature from 55 ºC to 50 ºC.
Table 19: Energy Saving on Hot tap water
Before(MW
h)
After(MWh
)
Reduction(MW
h)
Hot tap water 332 299 33
Refer to table 19, after reducing the temperature, the heat loss of hot tap water
has been reduced 33MWh.
5.2.2 Results
ENERGY AUDIT OF A BUILDING Shuang Li and Xin Xiong
47
0
50
100
150
200
250
300
350
400
450
500
Trasmission Hot tap water
Before
After
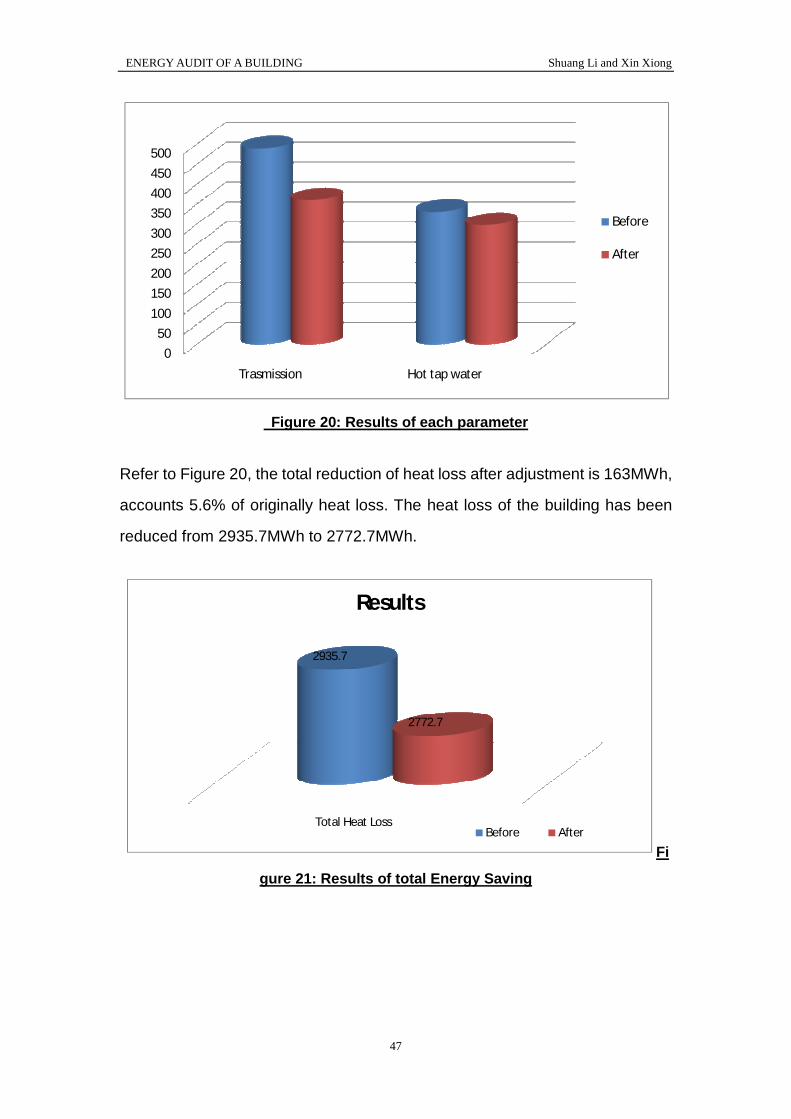
Figure 20: Results of each parameter
Refer to Figure 20, the total reduction of heat loss after adjustment is 163MWh,
accounts 5.6% of originally heat loss. The heat loss of the building has been
reduced from 2935.7MWh to 2772.7MWh.
Total Heat Loss
2935.7
2772.7
Results
Before After
Fi
gure 21: Results of total Energy Saving

ENERGY AUDIT OF A BUILDING Shuang Li and Xin Xiong
48
ENERGY AUDIT OF A BUILDING Shuang Li and Xin Xiong
49
Reference:
BP (2004), BP Statistical Review of World Energy 2004, BP, London.
IEA (2004), World Energy Outlook 2004, OECD/IEA, Paris.
IEA (2004c), Coming in from the Cold: District Heating Policy in the Transition
Economies, OECD/IEA, Paris.
YUAN Liang(2004) Research on the Waterpower Coupling Character in the
District Heating Systems,Xinjiang University, China.
A. Thumann, Handbook of Energy Audits, Fairmont Press, Atlanta,1979.
SS CP 13: 1999 Code of Practice for Mechanical ventilation and
air-conditioning in buildings, PSB, 1999.
SS CP 24: 1999 Code of Practice for Energy efficiency standard for building
services and equipment, PSB, 1999.
C Jaye, J C Simpson and J D Langley, Barriers to safe hot tap water, Injury
Prevention 2001;7:302-306; doi:10.1136/ip.7.4.302
A.W.M. van Schijndel, H.L. Schellen, J.L. Wijffelaars and K. van Zundert,
Application of an integrated indoor climate, HVAC and showcase model for the
indoor climate performance of a museum, Energy and Buildings, Volume 40,
Issue 4, 2008
Taghi Karimipanah, Literature and slides of the course in Building Energy
System, Högskolan i Gävle, 2007.
Heimo Zinko, Literature and slides of the course in Energy Systems, District
ENERGY AUDIT OF A BUILDING Shuang Li and Xin Xiong
50
heating lecture, Högskolan i Gävle, , 2007
ENERGY AUDIT OF A BUILDING Shuang Li and Xin Xiong
51
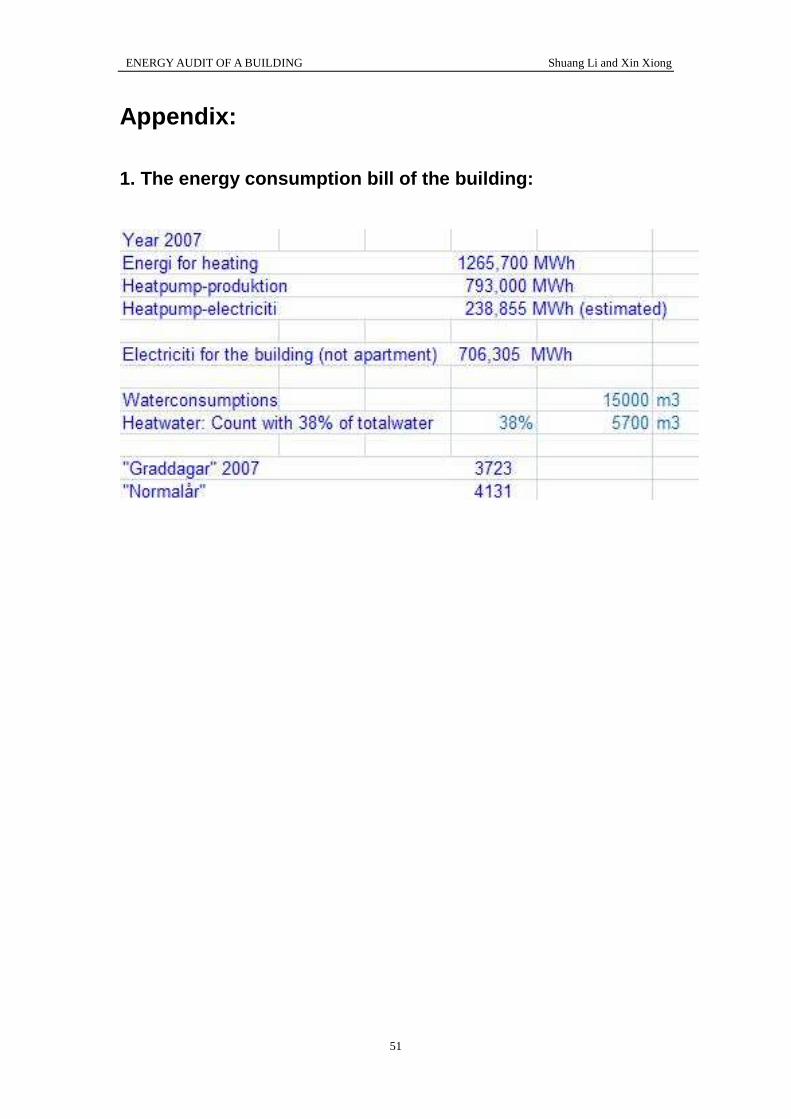
Appendix:
1. The energy consumption bill of the building:
ENERGY AUDIT OF A BUILDING Shuang Li and Xin Xiong
52
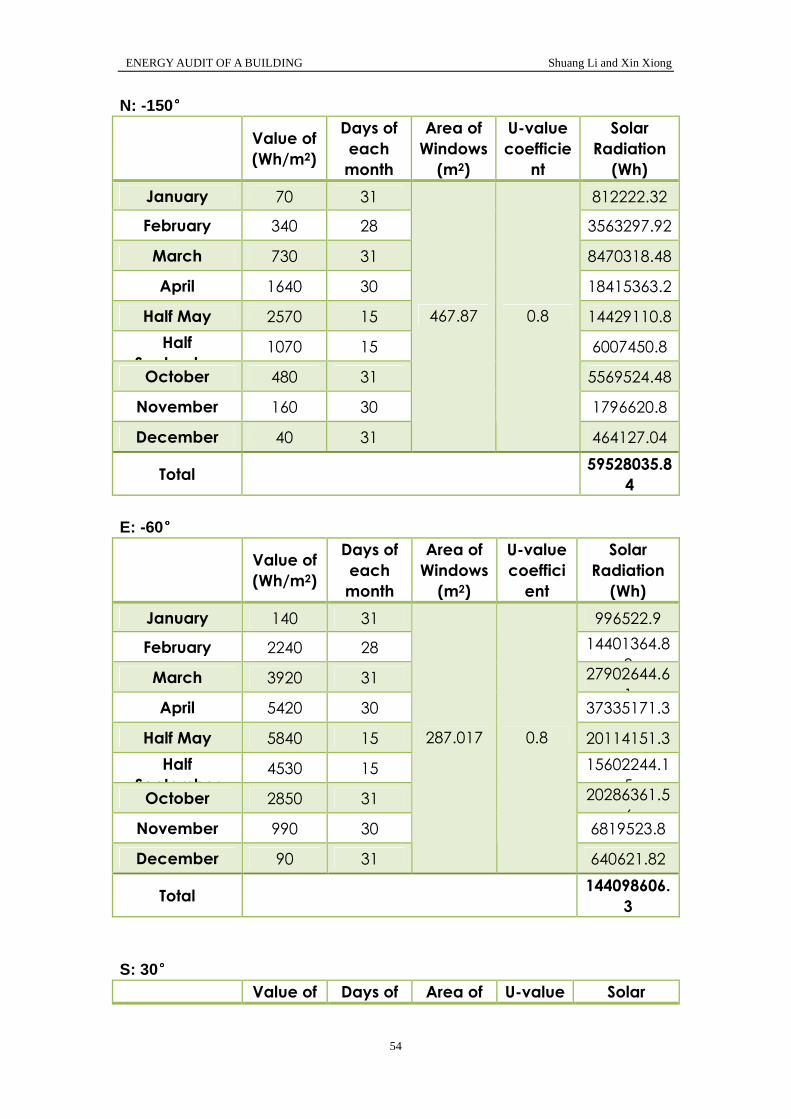
2. Solar radiation:
This is the direction of the building:
ENERGY AUDIT OF A BUILDING Shuang Li and Xin Xiong
53
This is the value of Wh/m2 for each angle of the building:
This is the U-value coefficient and Calculation Factor of the windows in the
building:
Then the calculation progress of the solar radiation is shown as following
charts:
ENERGY AUDIT OF A BUILDING Shuang Li and Xin Xiong
54
N: -150°°°°
Value of
(Wh/m2)
Days of
each
month
Area of
Windows
(m2)
U-value
coefficie
nt
Solar
Radiation
(Wh)
January 70 31 812222.32
February 340 28 3563297.92
March 730 31 8470318.48
April 1640 30 18415363.2
Half May 2570 15 14429110.8
Half
September 1070 15 6007450.8
October 480 31 5569524.48
November 160 30 1796620.8
December 40 31
467.87 0.8
464127.04
Total 59528035.8
4
E: -60°°°°
Value of
(Wh/m2)
Days of
each
month
Area of
Windows
(m2)
U-value
coeffici
ent
Solar
Radiation
(Wh)
January 140 31 996522.9
February 2240 28 14401364.8
8 March 3920 31 27902644.6
1 April 5420 30 37335171.3
Half May 5840 15 20114151.3
Half
September 4530 15 15602244.1
5 October 2850 31 20286361.5
6 November 990 30 6819523.8
December 90 31
287.017 0.8
640621.82
Total 144098606.
3
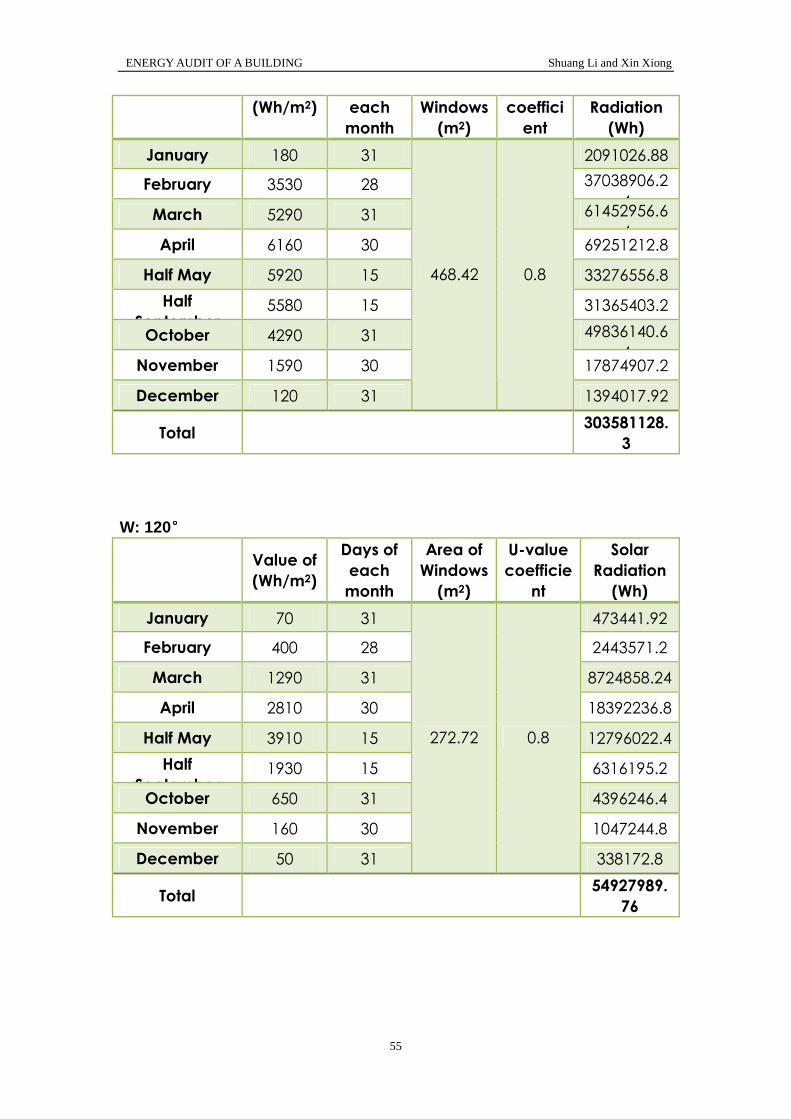
S: 30°°°°
Value of Days of Area of U-value Solar
ENERGY AUDIT OF A BUILDING Shuang Li and Xin Xiong
55
(Wh/m2) each
month
Windows
(m2)
coeffici
ent
Radiation
(Wh)
January 180 31 2091026.88
February 3530 28 37038906.2
4 March 5290 31 61452956.6
4 April 6160 30 69251212.8
Half May 5920 15 33276556.8
Half
September 5580 15 31365403.2
October 4290 31 49836140.6
4 November 1590 30 17874907.2
December 120 31
468.42 0.8
1394017.92
Total 303581128.
3
W: 120°°°°
Value of
(Wh/m2)
Days of
each
month
Area of
Windows
(m2)
U-value
coefficie
nt
Solar
Radiation
(Wh)
January 70 31 473441.92
February 400 28 2443571.2
March 1290 31 8724858.24
April 2810 30 18392236.8
Half May 3910 15 12796022.4
Half
September 1930 15 6316195.2
October 650 31 4396246.4
November 160 30 1047244.8
December 50 31
272.72 0.8
338172.8
Total 54927989.
76
ENERGY AUDIT OF A BUILDING Shuang Li and Xin Xiong
56
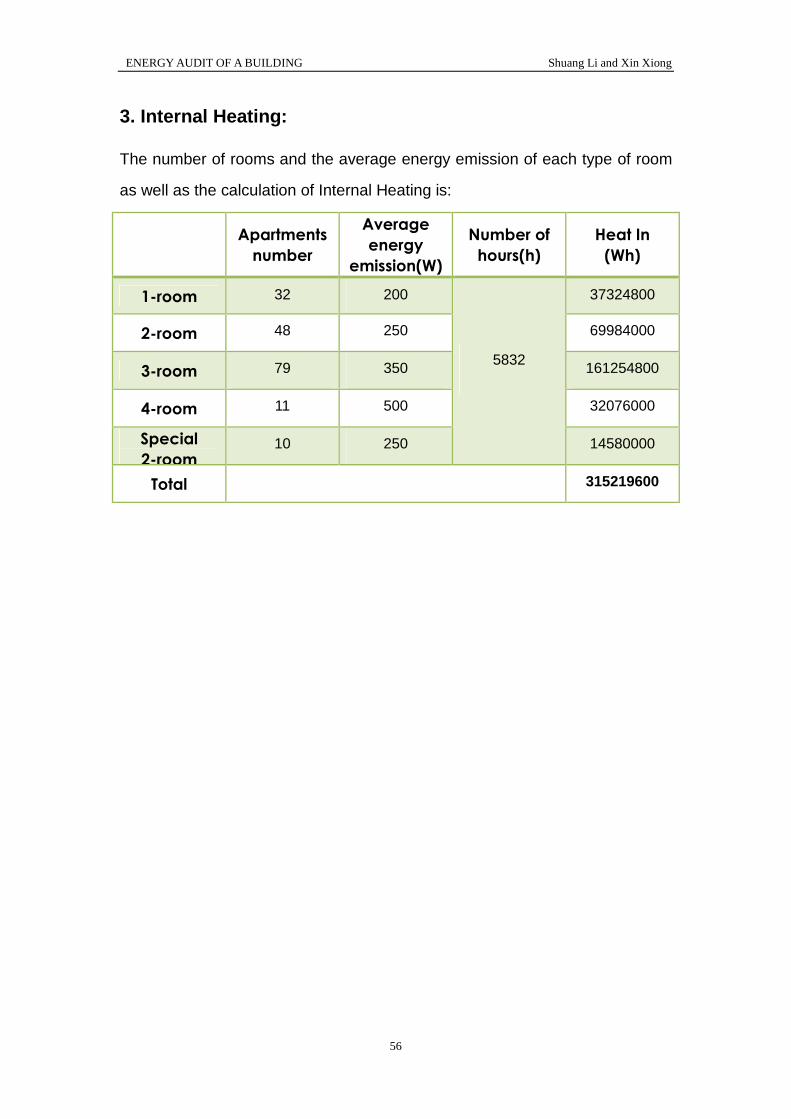
3. Internal Heating:
The number of rooms and the average energy emission of each type of room
as well as the calculation of Internal Heating is:
Apartments
number
Average
energy
emission(W)
Number of
hours(h) Heat In
(Wh)
1-room 32 200 37324800
2-room 48 250 69984000
3-room 79 350 161254800
4-room 11 500 32076000
Special
2-room 10 250
5832
14580000
Total 315219600
ENERGY AUDIT OF A BUILDING Shuang Li and Xin Xiong
57
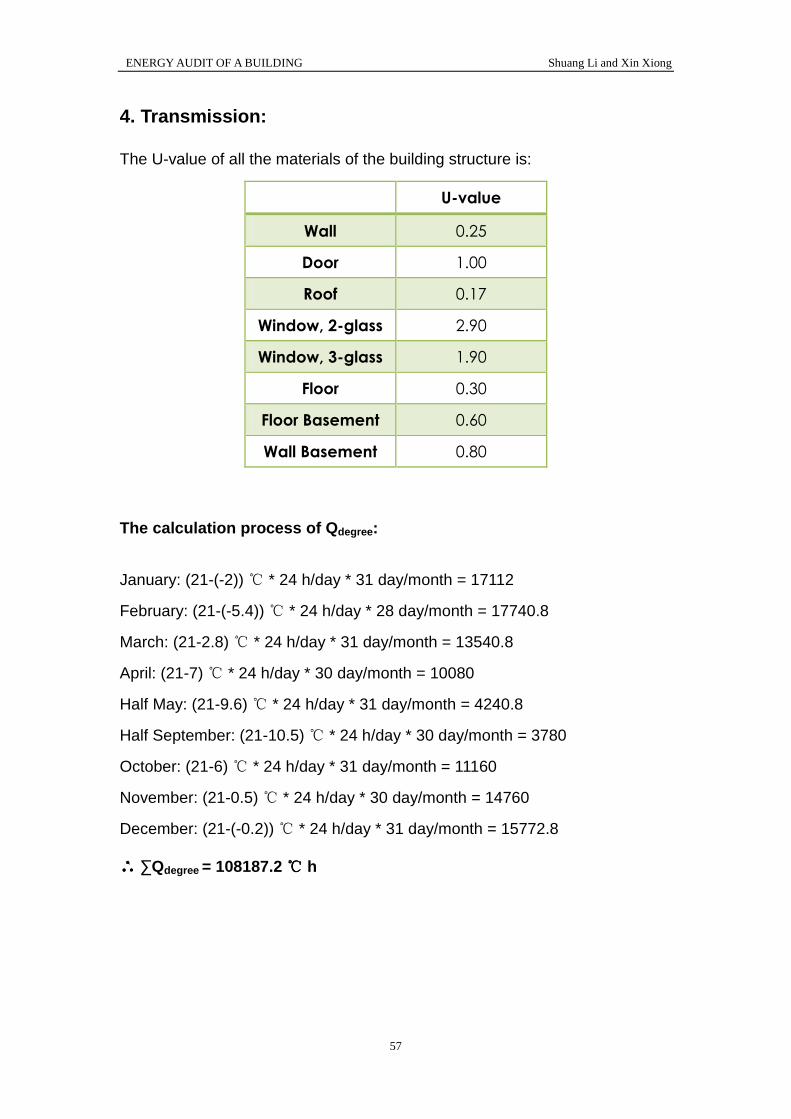
4. Transmission:
The U-value of all the materials of the building structure is:
U-value
Wall 0.25
Door 1.00
Roof 0.17
Window, 2-glass 2.90
Window, 3-glass 1.90
Floor 0.30
Floor Basement 0.60
Wall Basement 0.80
The calculation process of Qdegree:
January: (21-(-2)) ℃ * 24 h/day * 31 day/month = 17112
February: (21-(-5.4)) ℃ * 24 h/day * 28 day/month = 17740.8
March: (21-2.8) ℃ * 24 h/day * 31 day/month = 13540.8
April: (21-7) ℃ * 24 h/day * 30 day/month = 10080
Half May: (21-9.6) ℃ * 24 h/day * 31 day/month = 4240.8
Half September: (21-10.5) ℃ * 24 h/day * 30 day/month = 3780
October: (21-6) ℃ * 24 h/day * 31 day/month = 11160
November: (21-0.5) ℃ * 24 h/day * 30 day/month = 14760
December: (21-(-0.2)) ℃ * 24 h/day * 31 day/month = 15772.8
∴∴∴∴ ∑Qdegree = 108187.2 ℃℃℃℃ h
ENERGY AUDIT OF A BUILDING Shuang Li and Xin Xiong
58
5. Ventilation:
The location of ventilation systems in the building: