energy balanced wsn with enhanced-ddcd … · wireless sensor networks ... yof efficiently...
TRANSCRIPT
International Research Journal of Engineering and Technology (IRJET) e-ISSN: 2395-0056
Volume: 02 Issue: 07 | Oct-2015 www.irjet.net p-ISSN: 2395-0072
© 2015, IRJET ISO 9001:2008 Certified Journal Page 1240
ENERGY BALANCED WSN WITH ENHANCED-DDCD
CLUSTERING METHOD
R.S.Janani1, Mr.R.Shankar2, Ms.M.Savitha3
1PG Scholar, Dept. of ECE [Applied Electronics],kongunadu college of engineering and Technology,Tamil Nadu,
2Assistant Professor,Dept of ECE, kongunadu college of engineering and Technology,Tamil Nadu, India
3Assistant Professor,Dept of ECE, kongunadu college of engineering and Technology,Tamil Nadu, India
-------------------------------------------------------------------------------------------------------------------------------------
Abstract-The direct further work on the DDCD clus-
tering method is developing a method which could
confirm the parameters modified to the real sam-
pled data, particularly the data threshold has major
effect on clustering performance. Furthermore, in
data transmitting process, the energy of sensor
nodes should be considered to construct an energy
balanced networks. Thus, this will be researched in
our future work as well. Wireless sensor networks
(WSNs) are increasingly used in many claims, such
as volcano and fire nursing, urban sensing, and pe-
rimeter surveillance. In this paper, we propose a
grouping method that uses hybrid CS for device
networks. The sensor nodes are organized into clus-
ters. Within a group, nodes transmit data to Cluster
Head (CH) deprived of using CS. CHs use CS to
transmit data to sink. We first suggest an analytical
model that studies the link between the size of clus-
ters and number of transmissions in the cross CS
method, aiming at finding the best size of clusters
that can lead to minimum number of transmissions.
Keywords: Wireless Sensor Networks (WSNs), Clus-
ter Head (CH),Compressive Sensing (CS),Data Densi-
ty Correlation Degree(DDCD).
1. INTRODUCTION
The WSN is ended of "nodes" – from a few to some
hundreds or even thousands, where each node is re-
lated to one (or occasionally several) sensors. Each
such sensor network node has typically several parts:
a radio transceiver with an interior antenna or con-
nection to an external antenna, a microcontroller, an
electronic trip for interfacing with the devices and an
energy source, usually a battery or an embedded form
of energy harvesting. A device node might vary in bulk
from that of a shoebox down to the size of a grain of
dust, although functioning "motes" of frank microscop-
ic scopes have yet to be created. The cost of sensor
nodes is similarly variable, reaching from a few to
hundreds of dollars, liable on the complexity of the
individual sensor nodes. Size and cost limits on sensor
nodes result in corresponding constraints on funds
such as energy, memory, computational rapidity and
roads bandwidth. The topology of the WSNs can differ
from a humble star network to an advanced multi-hop
wireless mesh system. The propagation method be-
tween the hops of the network can be routing or flood-
ing.
International Research Journal of Engineering and Technology (IRJET) e-ISSN: 2395-0056
Volume: 02 Issue: 07 | Oct-2015 www.irjet.net p-ISSN: 2395-0072
© 2015, IRJET ISO 9001:2008 Certified Journal Page 1241
2. LITERATURE SURVEY
R. Szewczyk, A. Mainwaring, J. Polastre, J. An-
derson, and D. Culler Habitat and environmental moni-
toring is a driving request for wireless sensor net-
works. We present an analysis of data from a second
generation sensor networks arranged during the
summer and fall of 2003. During a 4 month deploy-
ment, these networks, consisting of 150 devices, pro-
duced lone datasets for both schemes and biological
analysis. This paper focuses on nodal and network act,
with an stress on time, reliability, and the static and
dynamic aspects of single and multi-hop networks. We
link the results calm to outlooks set during the plan
phase: we were able to accurately forecast lifetime of
the single-hop link, but we misjudged the impact of
multi-hop traffic overhearing and the nuances of pow-
er source range. While initial packet harm data was
commensurate with lab tests, over the duration of the
placement, reliability of the back-end setup and the
transit net had a dominant effect on overall network
act. Finally, we gage the physical design of the sensor
node based on deployment experience and a pole mor-
tem study. The results shack light on a number of de-
sign issues from network deployment, through selec-
tion of power fonts to optimizations of routing results.
J. Haupt, W. Bajwa, M. Rabbat, and R. Nowak
This article describes a very unlike approach to the
dispersed compression of networked data. Consider-
ing a particularly striking aspect of this struggle that
turns around large-scale distributed sources of data
and their storage, transmission, and retrieval. The job
of transmitting material from one point to another is a
common and well-understood exercise. But the trick-
yof efficiently conveying or sharing information from
and among a vast number of distributed nodes re-
mains a great task, primarily because we do not how-
ever have well developed theories and tools for distri-
buted signal processing, communications, and materi-
al theory in large-scale networked systems.
3. DATA DENSITY CORRELATION DEGREE
In cluster-based networks, to select the typi-
cal sensor nodes, we proposed the Data Density Corre-
lation Degree (DDCD) clustering method, which will be
presented in detail in this section. The WSN is mod-
elled by objectiveless graph G = (V ,E). Where V is the
beam node set entailing of all sensor nodes in the
WSN, E is the edge set involving of all associations in
the WSN. The antenna of device node i (i ∈V) is an om-
nidirectional antenna, with a communiqué radius of
α(i ). Let N(i ) be the set of sensor nodes in the disk of
the communication radius of i . In cluster-based data
collection networks, the data transmission course is
that every cluster head sends collected data obtained
from its fellow nodes to the sink node by single hop or
multi-hops. The DDCD clustering algorithm contains
three events: the Sensor Type Calculation (STC) pro-
cedure, the Local Cluster Construction (LCC) and
Global Representative sensor node Selection (GRS).
After sensor node i executes the STC algorithm, sensor
node i stores the device node’s type, two sets of device
nodes’ IDs, which are NodeSetinner (i ) and NodeSet-
outer(i ), and data density correlation degree Sim(i ). If
sensor node i is a core sensor node, NodeSetinner (i
)includesthe IDs of the device nodes whose data are in
the ε-neighbourhood of the data of sensor node i .
NodeSetouter(i ) includes the IDs of the device nodes
whose statisticsare not in the ε- neighbourhood of the

International Research Journal of Engineering and Technology (IRJET) e-ISSN: 2395-0056
Volume: 02 Issue: 07 | Oct-2015 www.irjet.net p-ISSN: 2395-0072
© 2015, IRJET ISO 9001:2008 Certified Journal Page 1242
data of sensor node i . Sim(i ) is calculated by Eq.1. If
sensor node i is a non-core sensor node, NodeSetinner
(i )andNodeSetouter(i ) are empty. Sim(i ) equals zero.
4. SPATIAL CORRELATION BASED DATA GATHER-
ING ALGORITHM
The sensor nodes in the WSN continuously
monitor the physical wonders and communicate the
explanations to the sink. The sensor nodes tend to
have high degree of spatial correlation as they are
tightly deployed in nature. Temporal Connection also
exists if the nodes sense physical phenomena like
Figure:4 Block diagram of.(a)Functions of Sink
Node (b)Functions of Source Node
Temperaturemoisture pressure etc. Hence there is a
need for statistics reduction algorithms which exploits
the correlation of data in sensor network. The planned
data gathering algorithm is calculated for network
with high spatial and temporal correlation. The main
neutral of this algorithm is to reduce the statement
between the source and the sink node.
5. IMPLEMENTATION& RESULTS
5.1 Implementation
Network simulator 2 is used as the simulation
tool in this project. NS was chosen as the simulator
partly because of the range of features it provides and
partly because it has an open source code that can be
modified and extended. There are different versions of
NS and the newest version is ns-2.1b9a while ns-
2.1b10 is under progress
6.NETWORK SIMULATOR (NS)
Network simulator (NS) is an object–oriented,
discrete result simulator for networking research. NS
offers substantial support for simulation of TCP,
routing and multicast protocols ended wired and wire-
less systems. The simulator is a result of an ongoing
effort of research and advanced. Even though there is
a large confidence in NS, it is not a polished product
yet and bugs are being discovered and corrected un-
ceasingly.
NS can simulate the following:
1. Topology: Bound, wireless
2. Scheduling Algorithms: RED, Drop End,
3. Transport Protocols: TCP, UDP
4. Routing: Static and dynamic routing
5. Application: FTP, HTTP, Telnet, Traffic generators
International Research Journal of Engineering and Technology (IRJET) e-ISSN: 2395-0056
Volume: 02 Issue: 07 | Oct-2015 www.irjet.net p-ISSN: 2395-0072
© 2015, IRJET ISO 9001:2008 Certified Journal Page 1243
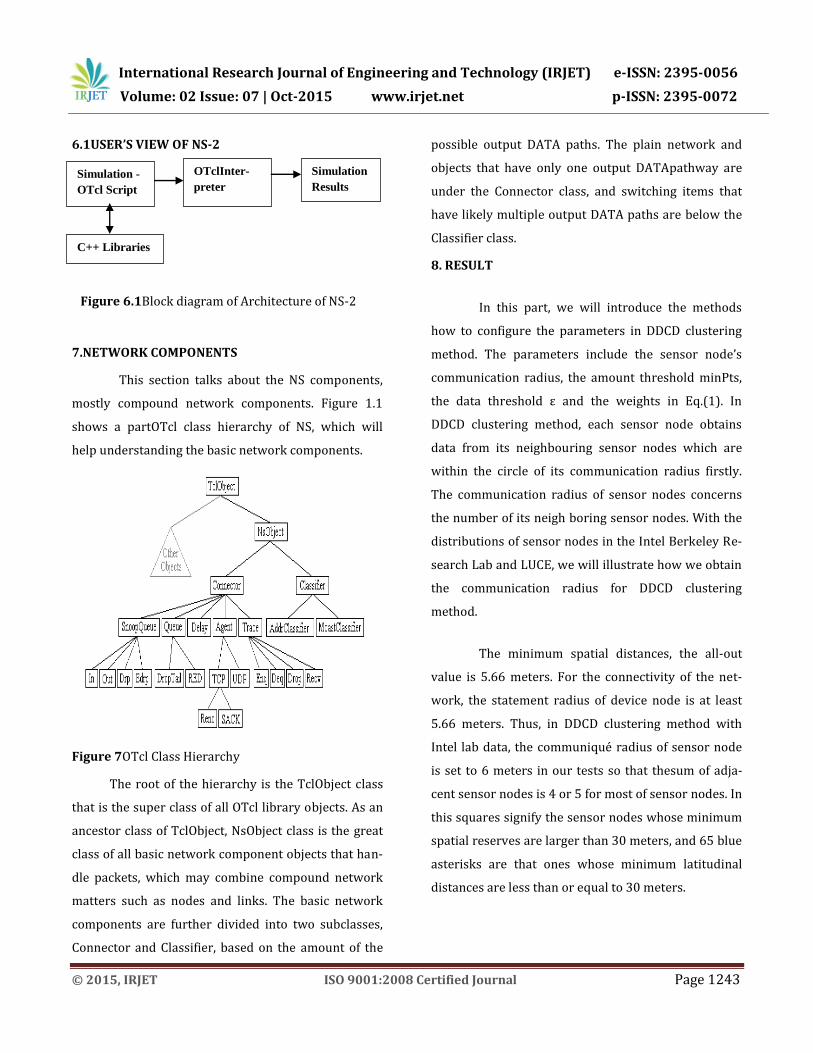
6.1USER’S VIEW OF NS-2
Figure 6.1Block diagram of Architecture of NS-2
7.NETWORK COMPONENTS
This section talks about the NS components,
mostly compound network components. Figure 1.1
shows a partOTcl class hierarchy of NS, which will
help understanding the basic network components.
Figure 7OTcl Class Hierarchy
The root of the hierarchy is the TclObject class
that is the super class of all OTcl library objects. As an
ancestor class of TclObject, NsObject class is the great
class of all basic network component objects that han-
dle packets, which may combine compound network
matters such as nodes and links. The basic network
components are further divided into two subclasses,
Connector and Classifier, based on the amount of the
possible output DATA paths. The plain network and
objects that have only one output DATApathway are
under the Connector class, and switching items that
have likely multiple output DATA paths are below the
Classifier class.
8. RESULT
In this part, we will introduce the methods
how to configure the parameters in DDCD clustering
method. The parameters include the sensor node’s
communication radius, the amount threshold minPts,
the data threshold ε and the weights in Eq.(1). In
DDCD clustering method, each sensor node obtains
data from its neighbouring sensor nodes which are
within the circle of its communication radius firstly.
The communication radius of sensor nodes concerns
the number of its neigh boring sensor nodes. With the
distributions of sensor nodes in the Intel Berkeley Re-
search Lab and LUCE, we will illustrate how we obtain
the communication radius for DDCD clustering
method.
The minimum spatial distances, the all-out
value is 5.66 meters. For the connectivity of the net-
work, the statement radius of device node is at least
5.66 meters. Thus, in DDCD clustering method with
Intel lab data, the communiqué radius of sensor node
is set to 6 meters in our tests so that thesum of adja-
cent sensor nodes is 4 or 5 for most of sensor nodes. In
this squares signify the sensor nodes whose minimum
spatial reserves are larger than 30 meters, and 65 blue
asterisks are that ones whose minimum latitudinal
distances are less than or equal to 30 meters.
Simulation
Results
OTclInter-
preter Simulation -
OTcl Script
C++ Libraries

International Research Journal of Engineering and Technology (IRJET) e-ISSN: 2395-0056
Volume: 02 Issue: 07 | Oct-2015 www.irjet.net p-ISSN: 2395-0072
© 2015, IRJET ISO 9001:2008 Certified Journal Page 1244
9. CONCLUSION& FUTURE WORK
In this paper, we used cross CS to design a
clustering-based data group method, to reduce the
data transmissions in WSN. The information on loca-
tions and distribution of sensor nodes is used to de-
sign the data group method in cluster structure. Sen-
sor nodes are prearranged into clusters. Within a clus-
ter, data are calm to the cluster heads by shortest
track routing; at the cluster head, data are compressed
to the plans using the CS technique.
REFERENCES
[1] R. Szewczyk, A. Mainwaring, J. Polastre, J. Ander-
son, and D. Culler, “An Analysis of a Large Scale Habitat
Monitoring Application,” Proc. ACM Second Int’l Conf.
Embedded Networked Sensor Systems (SenSys ’04),
pp. 214-226, Nov. 2004.
[2] E. Candes and M. Wakin, “An Introduction to Com-
pressive Sampling,” IEEE Signal Processing Magazine,
vol. 25, no. 2, pp. 21-30, Mar. 2008.
[3] R. Baraniuk, “Compressive Sensing [Lecture
Notes],” IEEE Signal Processing Magazine, vol. 24, no.
4, pp. 118-121, July 2007.
[4] D. Donoho, “Compressed Sensing,” IEEE Trans. In-
formation Theory, vol. 52, no. 4, pp. 1289-1306, Apr.
2006.