energy balances - introduction · pdf fileenergy balances - introduction ... production final...
TRANSCRIPT
Workshop on Capacity Development for Mainstreaming Energy
SDGs, Targets and Indicators into Statistical Programmes in
Selected LA Countries
Panama City, Panama, 4-6 February 2015.
UNSD Energy Statistics
Energy Balances - Introduction
Alex Blackburn and Leonardo Souza
Industrial & Energy Statistics Section - United Nations Statistics Division
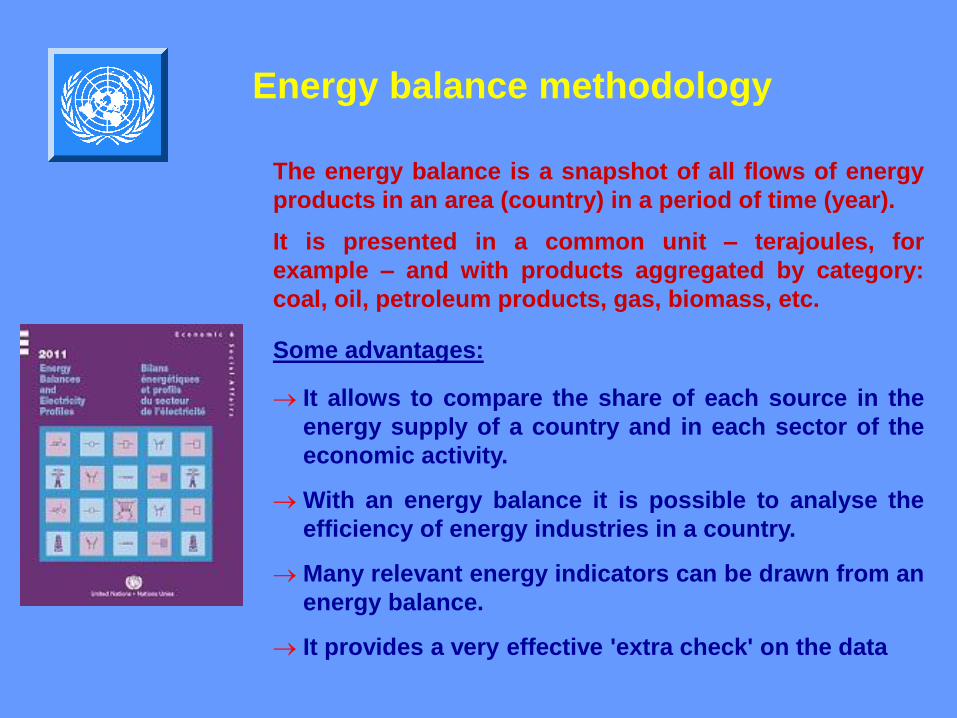
The energy balance is a snapshot of all flows of energy
products in an area (country) in a period of time (year).
It is presented in a common unit – terajoules, for
example – and with products aggregated by category:
coal, oil, petroleum products, gas, biomass, etc.
Some advantages:
It allows to compare the share of each source in the
energy supply of a country and in each sector of the
economic activity.
With an energy balance it is possible to analyse the
efficiency of energy industries in a country.
Many relevant energy indicators can be drawn from an
energy balance.
It provides a very effective 'extra check' on the data
Energy balance methodology

Commodity balances
A commodity balance describes all flows of a
single energy product, where supply and uses
can be measured and compared.
Products are as defined by the current energy
product classification – ideally harmonized with
SIEC
.
I
m
p
o
r
t
s
E
x
p
o
r
t
s
T
r
a
n
s
f
Production
Final consumption L
o
s
s
e
s

Commodity balances – supply and use
Statistical differences: balance b/w supply & use – the smaller the better,
but it should not be made zero artificially as it indicates data problems
2007 2008 2009 2010 2011 2012
DL01 Production 31223 30875 30428 30880 30177 31547
DL022 Receipts from other sources 1 11 16 235 361 433
DL03 Imports 1527 3316 1578 696 1677 763
DL04 Exports 7048 7768 7607 6967 6335 8097
DL051 International marine bunkers 56 54 35 45 27 23
DL06 Stock changes 8 158 -169 121 190 83
DLGA Total energy supply 25639 26222 24549 24678 25663 24540
Gas Oil/ Diesel Oil (DL); Metric tons, thousand
DL07 Transfers and recycled products -1368 -234 -247 -551 -888 -1476
DLSD Statistical differences -917 -1395 -829 -2830 -2932 -2570
DL08 Transformation 274 224 228 229 215 238
DL088 Transf in electricity, CHP and heat plants 274 224 228 229 215 238
DL09 Energy industries own use 29 13 13 16 26 36
DL0925 Oil refineries 29 13 13 16 26 36
DLNA Final consumption 27621 27614 25384 27814 29242 28312
DL11 Non-energy uses 4 3 0 0 0 0
DL12 Final energy consumption 27617 27611 25384 27814 29242 28312
DL121 Manufacturing, construction 4372 4377 3900 4564 4798 4708
DL122 Transport 15686 16396 15594 17137 17891 17694
DL123 Other 7559 6838 5890 6113 6553 5910

Commodity balance – detailing the
consumption side
The commodity balance should be as detailed
as needed for policy and other purposes
2007 2008 2009 2010 2011 2012DL12 Final energy consumption 27617 27611 25384 27814 29242 28312DL121 Manufacturing, construction 4372 4377 3900 4564 4798 4708DL1211 Iron and steel 2 1 3 2 0 0DL1213 Chemical and petrochemical 0 0 2 3 0 0DL1214 Other manuf., const. and non-fuel min. ind. 4370 4376 3895 4559 4798 4708DL122 Transport 15686 16396 15594 17137 17891 17694DL1221 Road 12676 13345 13461 14484 14929 14836DL1222 Rail 2123 2250 1455 1879 2151 2169DL1224 Domestic navigation 870 783 660 766 811 689DL1226 Pipeline transport 17 18 18 8 0 0DL123 Other 7559 6838 5890 6113 6553 5910DL1231 Households 2729 2427 2362 2174 2108 1785DL1232 Agriculture, forestry and fishing 2636 2681 2037 2433 2749 2623DL1235 Commerce and public services 2194 1730 1491 1506 1696 1502
Gas Oil/ Diesel Oil (DL); Metric tons, thousand
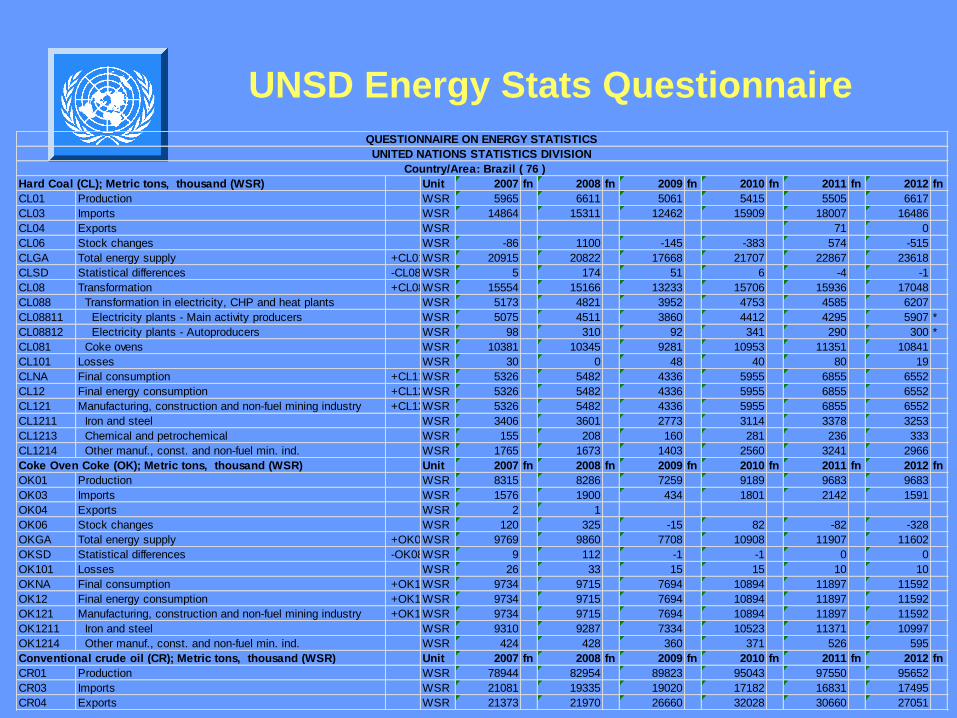
UNSD Energy Stats Questionnaire
Unit 2007 fn 2008 fn 2009 fn 2010 fn 2011 fn 2012 fn
CL01 Production WSR 5965 6611 5061 5415 5505 6617
CL03 Imports WSR 14864 15311 12462 15909 18007 16486
CL04 Exports WSR 71 0
CL06 Stock changes WSR -86 1100 -145 -383 574 -515
CLGA Total energy supply +CL01 +CL022 +CL03 -CL04 -CL051 -CL06WSR 20915 20822 17668 21707 22867 23618
CLSD Statistical differences -CL08 -CL09 -CL101 +CLGA -CLNAWSR 5 174 51 6 -4 -1
CL08 Transformation +CL081 +CL082 +CL083 +CL084 +CL085LP +CL088 +CL089WSR 15554 15166 13233 15706 15936 17048
CL088 Transformation in electricity, CHP and heat plants WSR 5173 4821 3952 4753 4585 6207
CL08811 Electricity plants - Main activity producers WSR 5075 4511 3860 4412 4295 5907 *
CL08812 Electricity plants - Autoproducers WSR 98 310 92 341 290 300 *
CL081 Coke ovens WSR 10381 10345 9281 10953 11351 10841
CL101 Losses WSR 30 0 48 40 80 19
CLNA Final consumption +CL11 +CL121 +CL122 +CL123WSR 5326 5482 4336 5955 6855 6552
CL12 Final energy consumption +CL121 +CL122 +CL123WSR 5326 5482 4336 5955 6855 6552
CL121 Manufacturing, construction and non-fuel mining industry +CL1211 +CL1213 +CL1214WSR 5326 5482 4336 5955 6855 6552
CL1211 Iron and steel WSR 3406 3601 2773 3114 3378 3253
CL1213 Chemical and petrochemical WSR 155 208 160 281 236 333
CL1214 Other manuf., const. and non-fuel min. ind. WSR 1765 1673 1403 2560 3241 2966
Unit 2007 fn 2008 fn 2009 fn 2010 fn 2011 fn 2012 fn
OK01 Production WSR 8315 8286 7259 9189 9683 9683
OK03 Imports WSR 1576 1900 434 1801 2142 1591
OK04 Exports WSR 2 1
OK06 Stock changes WSR 120 325 -15 82 -82 -328
OKGA Total energy supply +OK01 +OK022 +OK03 -OK04 -OK06WSR 9769 9860 7708 10908 11907 11602
OKSD Statistical differences -OK08 -OK09 -OK101 +OKGA -OKNAWSR 9 112 -1 -1 0 0
OK101 Losses WSR 26 33 15 15 10 10
OKNA Final consumption +OK11 +OK121 +OK122 +OK123WSR 9734 9715 7694 10894 11897 11592
OK12 Final energy consumption +OK121 +OK122 +OK123WSR 9734 9715 7694 10894 11897 11592
OK121 Manufacturing, construction and non-fuel mining industry +OK1211 +OK1213 +OK1214WSR 9734 9715 7694 10894 11897 11592
OK1211 Iron and steel WSR 9310 9287 7334 10523 11371 10997
OK1214 Other manuf., const. and non-fuel min. ind. WSR 424 428 360 371 526 595
Unit 2007 fn 2008 fn 2009 fn 2010 fn 2011 fn 2012 fn
CR01 Production WSR 78944 82954 89823 95043 97550 95652
CR03 Imports WSR 21081 19335 19020 17182 16831 17495
CR04 Exports WSR 21373 21970 26660 32028 30660 27051
QUESTIONNAIRE ON ENERGY STATISTICS
UNITED NATIONS STATISTICS DIVISION
Country/Area: Brazil ( 76 )
Hard Coal (CL); Metric tons, thousand (WSR)
Coke Oven Coke (OK); Metric tons, thousand (WSR)
Conventional crude oil (CR); Metric tons, thousand (WSR)

Commodity balances (and the UNSD
energy stats questionnaire) display
basic energy statistics only
- Basic energy statistics comprised
of combinations of products and flows
- All flows relevant to a given
commodity are grouped under the
commodity header
What are the limitations of basic
energy statistics?
- Different reporting units and
different calorific values make statistics
between commodities incomparable.
Commodity balances
2011 2012
CL01 Production 34621 35375
CL03 Imports 9184 7821
CL04 Exports 33552 34648
CL06 Stock changes -167 -138
CLGA Total energy supply 10420 8686
CLSD Statistical differences -41 -1412
CL08 Transformation 8093 7730
CL088 Transformation in electricity, CHP and heat plants4391 4037
CL08811 Electricity plants - Main activity producers 4390 4036
CL08812 Electricity plants - Autoproducers 1 1
CL081 Coke ovens 3702 3693
Hard Coal (CL); Metric tons, thousand
2011 2012
MO01 Production 28587 29584
MO03 Imports 4092 2938
MO04 Exports 5579 6086
MO06 Stock changes -21 -96
MOGA Total energy supply 27121 26532
MO12 Final energy consumption 30687 31676
MO122 Transport 30687 31676
MO1221 Road 30687 31676
Motor Gasoline (MO); Metric tons, thousand
2011 2012
FW01 Production 31200 30094
FW03 Imports 320 384
FW04 Exports 2555 2854
FW088 Transformation in electricity, CHP and heat plants8532 8531
FW08812 Electricity plants - Autoproducers 8532 8531
FW1231 Households 11334 11569
Fuelwood (FW); Cubic metres, thousand
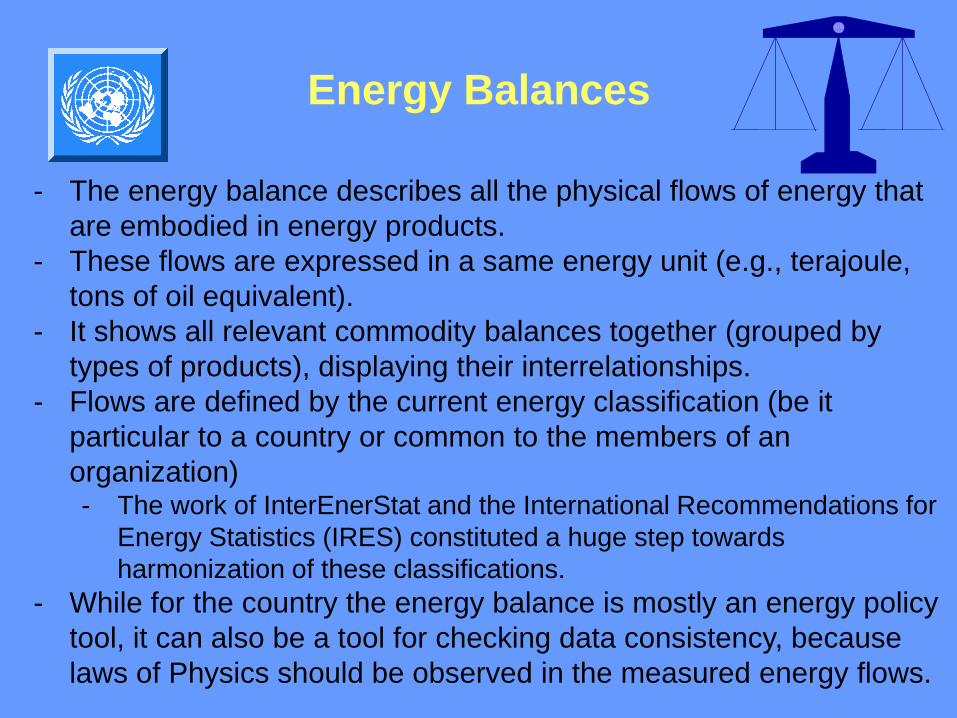
- The energy balance describes all the physical flows of energy that
are embodied in energy products.
- These flows are expressed in a same energy unit (e.g., terajoule,
tons of oil equivalent).
- It shows all relevant commodity balances together (grouped by
types of products), displaying their interrelationships.
- Flows are defined by the current energy classification (be it
particular to a country or common to the members of an
organization) - The work of InterEnerStat and the International Recommendations for
Energy Statistics (IRES) constituted a huge step towards
harmonization of these classifications.
- While for the country the energy balance is mostly an energy policy
tool, it can also be a tool for checking data consistency, because
laws of Physics should be observed in the measured energy flows.
Energy Balances

The energy balance:
conversion to energy units (1)
COAL Physical units (tonnes) are converted to energy units using Net calorific values (NCV) [kJ/kg], which ideally are measured frequently for different processes and sources and then averaged for the country/flow. Specific NCV for different flows, when available (most importantly, Production and Imports) Weighted-average NCV for all other flows (if only NCVs for Production and Imports are available). Default NCV if no information available (undesirable case)
OIL AND OIL PRODUCTS
NCV (can vary over time) [kJ/kg]
Specific NCV, Weighted-average NCV and default NCV as
in the case of coal.
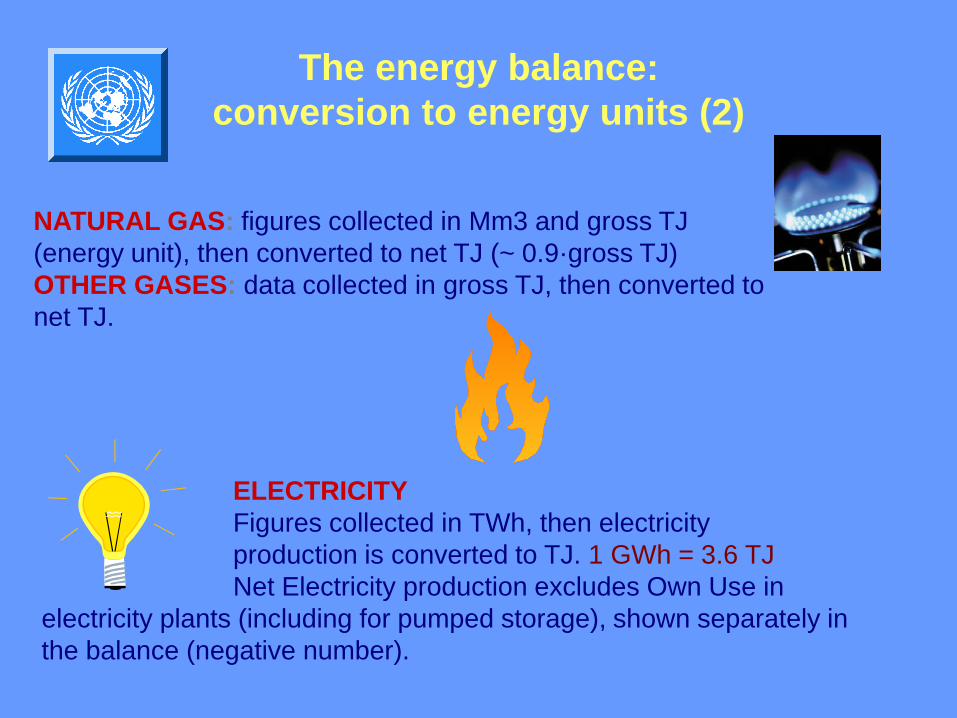
ELECTRICITY
Figures collected in TWh, then electricity
production is converted to TJ. 1 GWh = 3.6 TJ
Net Electricity production excludes Own Use in
electricity plants (including for pumped storage), shown separately in
the balance (negative number).
NATURAL GAS: figures collected in Mm3 and gross TJ
(energy unit), then converted to net TJ (~ 0.9·gross TJ)
OTHER GASES: data collected in gross TJ, then converted to
net TJ.
The energy balance:
conversion to energy units (2)
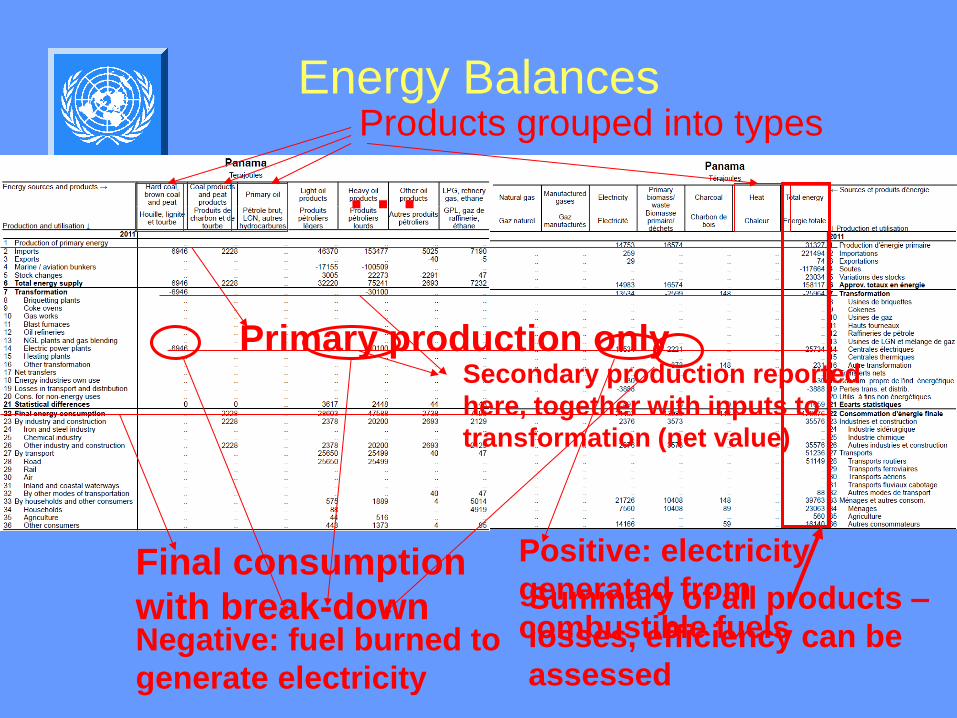
Energy Balances
Primary production only Secondary production reported
here, together with inputs to
transformation (net value)
Summary of all products –
losses, efficiency can be
assessed
Final consumption
with break-down
… Products grouped into types
Positive: electricity
generated from
combustible fuels Negative: fuel burned to
generate electricity
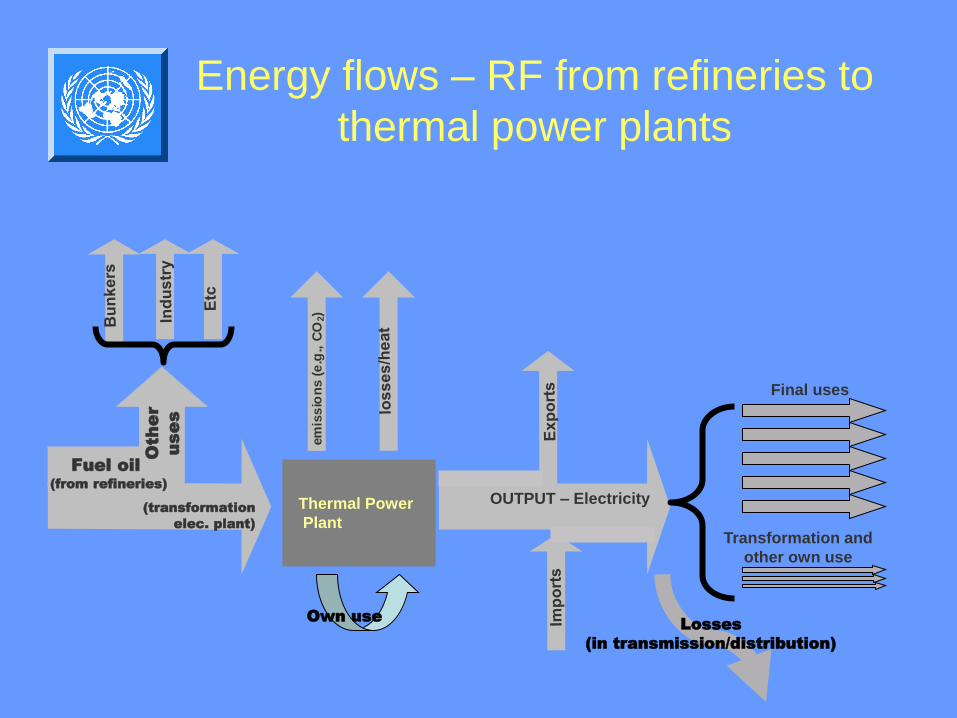
Final uses
Transformation and
other own use
e m
i s s i o
n s (
e . g
. , C
O 2 )
Thermal Power
Plant
OUTPUT – Electricity
Own use
Fuel oil
(from refineries)
Oth
er
use
s
Losses
(in transmission/distribution)
(transformation
elec. plant)
Energy flows – RF from refineries to
thermal power plants
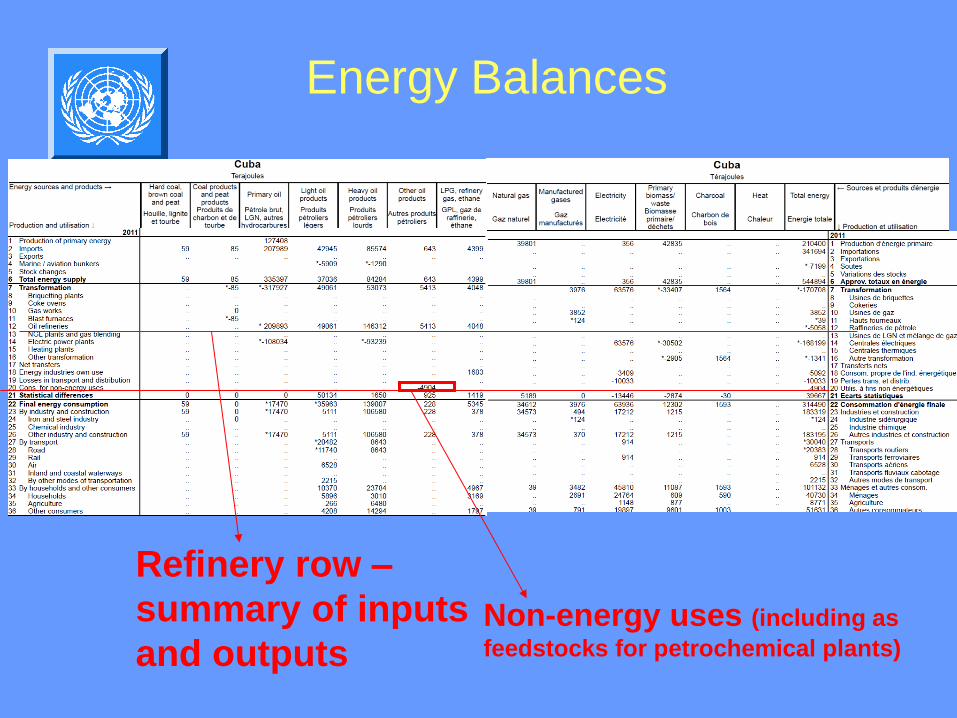
Energy Balances
Non-energy uses (including as
feedstocks for petrochemical plants)
Refinery row –
summary of inputs
and outputs

Refinery flows and energy/mass balances
T H R O U G H P U T OUTPUT
Feedstocks
crude oil
Petrochemical plants
REFINERY
natural gas liquids
OUTPUT ( mostly non - energy use )
e m
i s s i o
n s (
e . g
. , C
O 2 )
e l e
c t r
i c i t
y
additives
Ex: synthetic crude oil from oil sands
liquids from coal liquefaction
other hydrocarbons
energy and non-energy products from refineries
OU
TP
UT
- so
me
LP
G, e
th
an
e,
n
ap
hth
a

Thank you for your attention!
¡Gracias por su atención!