energy conservation accomplishments - seattle · conservation accomplishments report for 25 years....
TRANSCRIPT

Energy ConservationAccomplishments:
1977-2006Evaluation Unit
Conservation ResourcesDivision
2007

Seattle City Light 2007Printed on recycled paper © 77498 (11-01)

Energy Conservation
Accomplishments: 1977-2006
Evaluation Support
Conservation Resources
Division
2007
Debra Tachibana, EDITOR
& Dennis Pearson
Seattle City Light

This report is intended for use by City of Seattle departments for purposes of accountability and planning. Information presented in this report may be
quoted in the stated form. Any calculations made from these data must be
reviewed and approved by the Conservation Resources Division, Seattle City
Light, prior to publication in any other document or medium.
Printed on recycled paper
Copyright © 2007 (December) Seattle City Light
Prepared by the City of Seattle — Seattle City Light Department
Conservation Resources Division, Evaluation Support
700 Fifth Avenue, Suite 3200, P.O. Box 34023, Seattle, Washington 98104-4023
Phone (206) 684-3233 — Fax (206) 684-3385
Web site: www.seattle.gov/light/conserve
Seattle City Light
Seattle City Light is a publicly owned utility dedicated to exceeding our
customer expectations by producing and delivering low cost, reliable power in
an environmentally responsible and safe way. We are committed to delivering
the best customer service experience of any utility in the nation.
Conservation Resources
Bringing energy efficiency into every home and business in Seattle
Energy Conservation Accomplishments: 1977-2006 Seattle City Light
Contents i
TABLE OF CONTENTS
Page
TABLE OF CONTENTS .................................................................................................. i LIST OF TABLES ............................................................................................................. iv LIST OF FIGURES............................................................................................................ v I. SUMMARY OF ACCOMPLISHMENTS AND EXPENDITURES .................. I- 1
A Few Fast Facts About Conservation.................................................................. I- 4 Introduction ............................................................................................................ I- 5 Evaluation Reporting ............................................................................................. I- 6 Purpose and Organization of Report ..................................................................... I- 6 Information Sources and Terms............................................................................. I- 8 Summary of Residential Programs........................................................................ I-10 Summary of Commercial–Industrial Programs..................................................... I-13 Conservation Program Participation by Year........................................................ I-16 Conservation Energy Savings by Year .................................................................. I-19 Community Benefits and Customer Bill Savings by Year.................................... I-26 Conservation Staffing and Budgets by Year ......................................................... I-30 Conservation Expenditures by Year ...................................................................... I-33 Conservation Funding by Year.............................................................................. I-37 Conservation Plan Productivity by Year ............................................................... I-44 Conservation Partners ............................................................................................ I-51
See also List of Tables and List of Figures

Energy Conservation Accomplishments: 1977-2006 Seattle City Light
ii Contents
TABLE OF CONTENTS (Continued)
Page
II. ACTIVE RESIDENTIAL PROGRAMS .............................................................. II- 1
2006 Residential Highlights .................................................................................. II- 3 Built Smart & Long-Term Super Good Cents Programs...................................... II-13 Homewise / Low-Income Electric Program.......................................................... II-25 Multifamily Conservation Programs ..................................................................... II-35 Neighborhood Power Programs: Lighting, Green Audit &
Weatherization / Warm Home .................................................................. II-59 Retail-Wise Lighting & Appliance Programs ....................................................... II-71
III. ACTIVE COMMERCIAL–INDUSTRIAL PROGRAMS .................................. III- 1
2006 Commercial–Industrial Highlights ............................................................... III- 3 Energy Smart Services Program............................................................................ III-23 Lighting Design Lab Program ............................................................................... III-39 $mart Business Program........................................................................................ III-47 Sustainable Design & Energy Code Programs...................................................... III-55
IV. DISCONTINUED RESIDENTIAL PROGRAMS............................................... IV- 1
Blanket Seattle / Water Heater Insulation and Setback......................................... IV- 3 Energy Efficient Water Heater Rebate Program ................................................... IV- 7 Home Energy Check Program............................................................................... IV-15 Home Energy Loan Program ................................................................................. IV-19 Home Water Savers Program ................................................................................ IV-29 Neighborhood Conservation Workshops .............................................................. IV-37 Residential Efficiency Standards........................................................................... IV-39 Residential Insulation Program.............................................................................. IV-45 Water Heater Rebate Program............................................................................... IV-49

Energy Conservation Accomplishments: 1977-2006 Seattle City Light
Contents iii
TABLE OF CONTENTS (Continued)
Page
V. DISCONTINUED COMMERCIAL–INDUSTRIAL PROGRAMS ................... V- 1
BPA Commercial Tank Wrap Program ................................................................ V- 3 Commercial Incentives Pilot Program................................................................... V- 7 Energy Code Major Projects Requirement............................................................ V-15 Energy Management Partnership Program............................................................ V-19 Energy Management Survey Program................................................................... V-23 Energy $avings Plan Program................................................................................ V-29 Energy Smart Design Program .............................................................................. V-45 General Service Efficiency Standards ................................................................... V-65 Industrial Research and Demonstration Project .................................................... V-69 Lighting Incentive Programs.................................................................................. V-73 Lighting Survey Program....................................................................................... V-77 Street and Area Lighting Program......................................................................... V-79 Walk-Through Survey Program ............................................................................ V-83
VI. BIBLIOGRAPHY.................................................................................................. VI- 1
Accountability Reports .......................................................................................... VI- 3 Residential Evaluations.......................................................................................... VI- 5 Commercial–Industrial Evaluations ...................................................................... VI- 9 Cross-Sector and Miscellaneous Papers................................................................ VI-14 Conference and Journal Papers.............................................................................. VI-18
Energy Conservation Accomplishments: 1977-2006 Seattle City Light
iv Contents
LIST OF TABLES
Page
Table 1 Residential Conservation Program Summary......................................... I-11 Table 2 Commercial–Industrial Conservation Program Summary ..................... I-14 Table 3 Program Participation by Year................................................................ I-17 Table 4 First Year Electricity Savings by Participation Year from Completed Projects......................................................................... I-20 Table 5 Program Electricity Savings in Each Year from Completed Projects......................................................................... I-23 Table 6 Customer Bill Savings by Year, in Nominal Dollars ............................. I-28 Table 7 Conservation Staffing and Budgets by Year........................................... I-31 Table 8 Conservation Expenditures by Year ....................................................... I-35 Table 9 BPA Conservation Funds and Revenues by Year .................................. I-39 Table 10 Other Sources of Revenue for Weatherization (Loan) Programs by Year..................................................................................................... I-42 Table 11 2006 Progress Toward Conservation Goals............................................ I-47
Table 12 Seattle City Light Conservation Plan Accomplishments ....................... I-48
Note: Program-specific tables for participation, electricity savings, expenditures, and BPA funding are not listed here, but can be found in SECTIONS II-V.

Energy Conservation Accomplishments: 1977-2006 Seattle City Light
Contents v
LIST OF FIGURES
Page
Figure 1 Residential Energy Savings..................................................................... I-12 Figure 2 Commercial–Industrial Energy Savings ................................................. I-15 Figure 3 Program Participants with Completed Projects ...................................... I-18 Figure 4 First Year Electricity Savings from Completed Projects........................ I-21 Figure 5 Program Electricity Savings in Each Year from Completed Projects......................................................................... I-24 Figure 6 Programmatic Load Reduction in Each Year from Completed Projects......................................................................... I-25 Figure 7 Customer Bill Savings in Each Year from Completed Projects......................................................................... I-29 Figure 8 Conservation Staffing and Budgets......................................................... I-32 Figure 9 Conservation Expenditures in Year ........................................................ I-36 Figure 10 External Conservation Program Funding ............................................... I-40 Figure 11 Conservation Indicators........................................................................... I-50 Figure 12 Residential First Year Electricity Savings from Completed Projects......................................................................... II- 4 Figure 13 Commercial–Industrial First Year Electricity Savings from Completed Projects......................................................................... III- 4

Energy Conservation Accomplishments: 1977-2006 Seattle City Light
vi Contents

Energy Conservation Accomplishments: 1977-2006 Seattle City Light
Summary of Accomplishments and Expenditures I-1
I. SUMMARY OF ACCOMPLISHMENTS
AND EXPENDITURES

Energy Conservation Accomplishments: 1977-2006 Seattle City Light
I-2 Summary of Accomplishments and Expenditures

Energy Conservation Accomplishments: 1977-2006 Seattle City Light
Summary of Accomplishments and Expenditures I-3
We should measure the performance of DSM
programs in much the same way, and with the
same competence and diligence, that we
monitor the performance of power plants.
Eric Hirst, in Measuring Performance: Key to Successful
Utility Demand-Side Management Programs, Oak Ridge National Laboratory, 1990

Energy Conservation Accomplishments: 1977-2006 Seattle City Light
I-4 Summary of Accomplishments and Expenditures
A Few Fast Facts about Conservation
Conservation Programs Save Energy
Seattle City Light has operated conservation programs for 30 years, since 1977.
In 2006, conservation reduced City Light’s electric system load by 11% (120 average megawatts, or 1,001,367 megawatt-hours).
These savings accrued from still-active measures installed during 1982-2006.
That is enough electricity to power 118,400 Seattle homes—one-third of the residential service area.
If all the City Light program energy savings acquired since 1977 were available today,
we could power the homes of nearly four cities the size of Seattle—or the entire 2006 Utility load in all sectors, with 32% to spare.
Energy savings first put into production in 2006 were 57.6 gigawatt-hours (thousand megawatt-hours, or million kilowatt-hours).
Conservation Programs Cut CO2 Emissions
Avoided energy production in 2006 reduced the release of carbon dioxide into the atmosphere by over 600,800 tons.
That is equivalent to 1 of 3 service area households garaging a vehicle for the year.
And this impact will continue for the next 16 years, as long as installed measures keep saving energy.
Conservation Customers Save on Electric Bills
From 1977-2006, program participants have saved over $557 million on bills.
Half of these cost savings went to residential customers.
In 2006, conservation customers reduced their City Light bills by $64 million.
Seattle City Light Statistics
2006 Average Number of Customers
Megawatt-hours Sold
Average Seattle Rate per kWh
Average National Rate per kWh
Residential 339,640 3,060,651 6.58¢ 9.42¢ Nonresidential 39,590 6,393,854 5.97¢ 7.30¢
Total 379,230 9,454,505 6.17¢ 7.98¢
Service Area: 131 sq. miles Population: 741,600 Personnel (FTEs): 1,548

Energy Conservation Accomplishments: 1977-2006 Seattle City Light
Summary of Accomplishments and Expenditures I-5
Introduction The City of Seattle has actively pursued energy conservation as an alternative to new generation development for 30 years, since 1977. The City’s municipally owned electric utility, Seattle City Light (City Light), has developed and implemented conservation programs and policies to increase the efficiency of electricity use in homes and businesses. These programs provide to customers conservation information and financial incentives that encourage them, for example, to insulate their homes, install energy efficient appliances, or install efficient lights in commercial and industrial establishments. Regulations are part of Seattle’s conservation efforts; Seattle maintains an energy code for new residential and commercial construction. In 2005, Seattle City Light underwent reorganization and the Energy Management Services Division was renamed the Conservation Resources Division, with a new reporting relationship to the Power Supply and Environmental Affairs business unit. In 2006 the Conservation Resources Services Division (CRD) continued progress toward energy savings goals. Working with customers and trade allies, City Light secured 7.26 aMW in 2006 through new project authorizations, rebates, and contracts (95% of the 7.63 aMW annual goal). This will be enough energy to power about 7,150 Seattle homes each year for the next 16 years, while measures remain active. In addition to reducing customer energy bills, these potential energy savings will benefit the environment. Conservation delays the need for new power plants, reducing air pollution and greenhouse gas emissions (specifically carbon dioxide) from alternative fossil-fueled power plants. It would take 7,255 vehicles annually (each driving 10,000 miles and getting 20 mpg) to emit carbon dioxide gas into the atmosphere equal to that newly secured by City Light conservation programs during 2006. Meanwhile City Light completed installation of measures in 2006 that are now saving 6.92 aMW each year—enough energy to power about 6,810 Seattle homes for 16 years, while measures remain active. It would take 6,910 vehicles to emit carbon dioxide gas into the atmosphere equal to that avoided by projects completing work through City Light conservation programs in 2006, and these savings will continue for another 16 years, on average.

Energy Conservation Accomplishments: 1977-2006 Seattle City Light
I-6 Summary of Accomplishments and Expenditures
Evaluation Reporting In 1980, Seattle City Light established an evaluation capability to provide information on conservation program energy savings, cost-effectiveness, and operational efficiency. Since that time, nearly 150 evaluation studies have been completed (see BIBLIOGRAPHY). Most of these studies have been performed after programs have been operating approximately six months to two years. Evaluators ensure that the energy savings counted as programmatic savings are truly due to program effects and not due to other factors such as customers’ response to the changing price of electricity, other sources of conservation information, or year-to-year weather variations. Thus, whenever possible, savings are calculated by comparing the change in electricity use of program participants with that of a group of nonparticipating customers or a control group. In addition, City Light measures the performance of programs in the midst of delivering energy management products and services. Evaluators have surveyed City Light customers to assess customer satisfaction, to gather information that will assist in the development of effective marketing strategies, and to verify electricity savings calculations. Where relevant data have been available, evaluators have also used the evaluation results from similar programs operated by other utilities. This is done for purposes of comparison or benchmarking, and sometimes to adjust estimates of City Light’s program savings. CRD Evaluation Support (the evaluation unit) has been publishing the annual Energy
Conservation Accomplishments report for 25 years. Each year has seen expansion and improvement in the report.
Purpose and Organization of Report The Energy Conservation Accomplishments report is an annual monitoring and performance measurement report, not an evaluation of programs. It compiles detailed performance data for all of Seattle City Light’s conservation efforts since 1977, both active and discontinued programs. Currently this document includes data on the following types of data: � Program descriptions � Program participation levels � Energy savings and average load reduction � Estimated lifetimes of energy savings � Program expenditures � Bonneville Power Administration (BPA) and other funding � Documentation of information sources and calculations

Energy Conservation Accomplishments: 1977-2006 Seattle City Light
Summary of Accomplishments and Expenditures I-7
The supporting documentation, presented in hundreds of footnotes, is a major strength of this report. It allows the serious user to probe into the sources of data or estimates, any necessary adjustments, assumptions made, and other contextual comments. While this report includes the best data available for annual calendar-year tracking and evaluated energy savings, it is not a substitute for rigorous evaluation studies, especially in the collection, interpretation, and utilization of cost data. The municipal financial accounting systems used for most cost reporting have been awkward tools for capturing itemized program-specific expenses, and to assign them to the appropriate calendar year (many budget and contract funds are carried over from one year to the next). While there is an attempt to assign costs and savings to the year in which they occur, for some programs this is difficult. In new construction, for example, the financial incentives may be paid a year or more before a facility is constructed and occupied, and savings start to accumulate. Another financial tracking dilemma has occurred in residential weatherization loan programs where the tracking systems report the total cost of the job, not just the portion financed by Seattle City Light. Repayment of loans is made to a City account that is not tracked by program or budget year.
For these and other reasons, the reader is strongly advised NOT to use the cost data in this
report to attempt calculation of program cost effectiveness. Inappropriate use of expenditure data could lead to significant errors in comparisons across programs. The information presented in this edition of the Energy Conservation Accomplishments report supersedes that of earlier editions. As new data were added for 2003-2006, revisions were made in reports of program participation, energy savings, expenditures, and funding for earlier years.
Users are advised to consult new values for 2001 through 2006 in particular. This report is divided into five sections. The remainder of SECTION I presents a summary of the electricity savings and expenditures for conservation programs from the start of the programs
through 2006. The information provided on each program in SECTIONS II−V includes descriptions of the program and population served, conservation measures, participation, electricity savings, load reduction, expenditures, and outside funding. SECTION II summarizes information for active programs in the residential sector, while SECTION III provides comparable data for the commercial and industrial sectors. SECTION IV contains information on residential programs that have been discontinued or replaced. While these programs are no longer operating and incurring costs, many continue to produce electricity savings. Similarly, inactive commercial and industrial programs are described in SECTION V. This report ends with a BIBLIOGRAPHY listing selected reports on energy program evaluations completed by CRD Evaluation Support (the evaluation unit) over the past 25 years.

Energy Conservation Accomplishments: 1977-2006 Seattle City Light
I-8 Summary of Accomplishments and Expenditures
Information Sources and Terms The main sources of expenditure data are cost ledger reports (1977-1990); City Light
Management Information System−MIS reports (1977-1990); Seattle Financial Management
System−SFMS reports (1990-1999); and SUMMIT financial system reports (1999-2006). Other sources of information, such as planning documents, were consulted on specific programs. The primary sources of information for electricity savings are evaluation reports produced or commissioned by CRD Evaluation Support (the evaluation unit). Several programs experience a lag of one or more years before authorized and contracted
conservation savings are put into service. Tables in the Electricity Savings portion of entries for several programs described authorized/contracted projects as well as completed projects. These programs include Built Smart / Long-Term Super Good Cents, Multifamily Conservation Programs, Energy $avings Plan, Energy Smart Design, Energy Smart Services, and $mart Business. The first table in each entry depicts projects contracted by City Light during the calendar year. This table describes the potential energy savings that will be realized when the projects are completed. The second table in each entry for these programs continues to describe savings realized from projects completed during the calendar year. Note that the energy savings (both MWh and aMW) reported in both tables reflect savings from current year participants as well as savings in that year from all prior participants for whom the measure lifetime has not yet expired. For a description of first-year savings from current year participants only, see the referenced footnotes in each program entry. Following are definitions for some energy savings terms used throughout this report.
Measure Lifetime: The active lifetime of measures is expressed in terms of the average residual life, or the point at which approximately 50% of measures would have been retired due to failure. Failure can mean physical failure, but also includes early removals due to remodeling and renovation. After this number of years has elapsed, participants are dropped from the cumulative total of participants for which energy savings are calculated. This simplifying procedure is followed rather than the more complex procedure of declining the participant cohort count over the maximum technical measure life.
Kilowatt-hour (kWh) Savings: Seattle City Light sets goals and measures conservation energy savings in annual kilowatt-hours. The utility does not track demand impacts (kilowatts). As a hydroelectric utility able to shift daily loads within its own resources (and both summer and winter peaks), the utility is most interested in the averaged impact of conservation acquisitions on avoided production and power purchases.
Gross Energy Savings: An estimate of change in electricity use from before to after participants take program-related actions. Gross savings do not distinguish naturally occurring conservation from effects attributable solely to the program.

Energy Conservation Accomplishments: 1977-2006 Seattle City Light
Summary of Accomplishments and Expenditures I-9
Net Energy Savings: An estimate of electricity savings attributable solely to implementation of the program; that is, Gross Energy Savings from participants minus the energy savings that would have occurred even if the program had not been offered. Nonprogram savings are determined from baseline data or a comparison group of nonparticipants, to control for the effects of naturally occurring conservation, changes in behavior and equipment holdings, economic factors, and free-ridership. Typically, evaluations at Seattle City Light have not incorporated spillover effects into estimates of Net Energy Savings; however where these effects are significantly large and capable of documentation, recent evaluations have addressed spillover effects and reported energy savings from them.
First Year Energy Savings: The net electricity savings acquired in the first year after program participation from projects completed in that year. Savings are counted in the calendar year when measure installation is completed, to facilitate alignment of savings with expenditures and external funding.
Cumulative Energy Savings: The electricity savings from the current year participants (First
Year Energy Savings), PLUS savings in that year from all prior participants, for program measures with an unexpired lifetime; that is, energy savings in a given year from cumulative participants.
Annual Megawatt-hour (MWh) Savings: The Cumulative Energy Savings in a given calendar year, expressed in megawatt-hours (thousands of kilowatt-hours) or gigawatt-hours (millions).
Average Megawatt (aMW) Load Reduction: The total annual load reduction, calculated as Annual MWh Savings divided by 8,760 hours per year. Thus savings are reflected as an overall trimming of energy production in every hour of the year, and are not assigned to peak or other costing periods. In energy savings tables for individual programs, aMW savings are reported without further adjustment.
Transmission and Distribution Credit: The City Light protocol is to incorporate into aMW statements a 5.2% system average credit for avoided transmission and distribution (T&D) line losses (from generation or wholesale power sources), but never to apply the credit to statements of MWh or kWh impacts. This adjustment is made for sector-level and Division-level summaries in SECTION I of this report.
Savings Since Start of Program: The sum of Cumulative Energy Savings estimates across ALL the years from program inception through the current reporting year. This construct exceeds the actual energy savings experienced in any given calendar year; it illustrates the relative investments made by City Light in various resource options.

Energy Conservation Accomplishments: 1977-2006 Seattle City Light
I-10 Summary of Accomplishments and Expenditures
Summary of Residential Programs
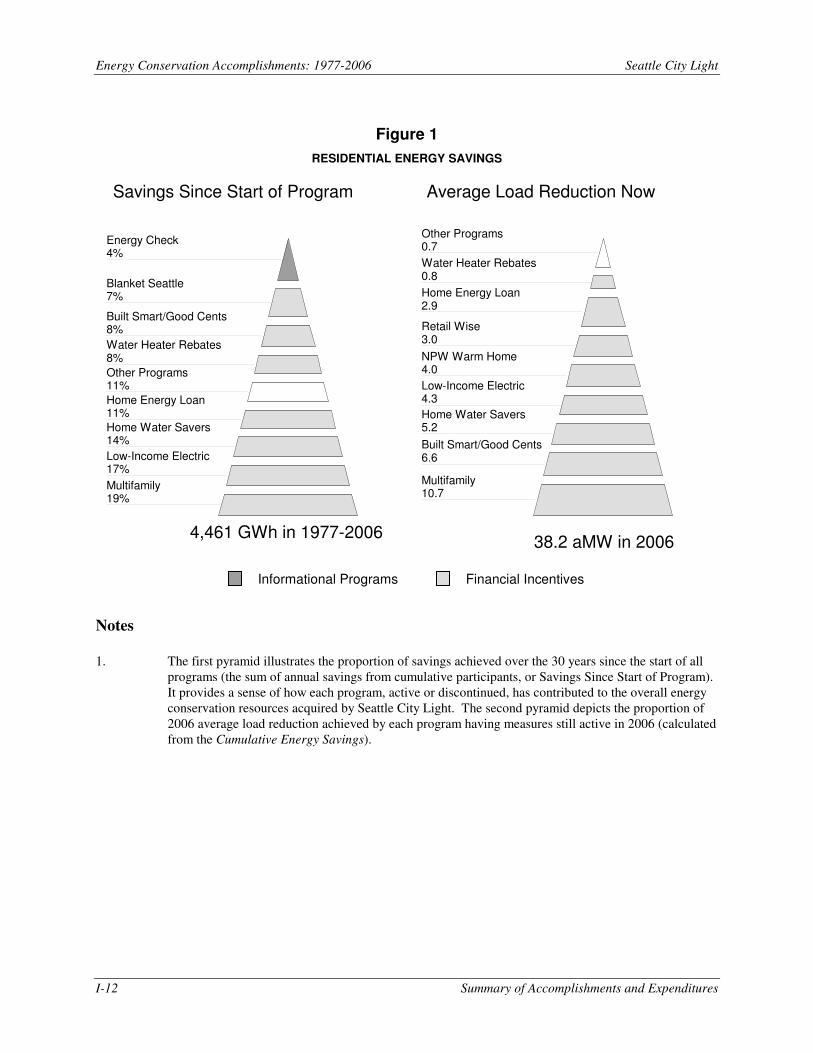
While 15 programs are listed in Table 1, five were still in operation during 2006. The largest of the active programs are Multifamily Conservation and Built Smart. Other active programs at year-end include the HomeWise/Low-Income Electric, Neighborhood Power, and Retail-Wise Lighting and Appliance Programs. Total electricity savings achieved by individual residential programs over the entire 1977-2006 period are depicted in the left pyramid of Figure 1. These savings are expressed as gigawatt-hours (GWh, a million kilowatt-hours). While Blanket Seattle (a completed program) had provided the greatest savings through 1993, the tank wraps offered through Blanket Seattle had a shorter lifetime than the measures installed through the weatherization programs, and tank wrap savings are now declining. Savings from the Water Heater Rebate programs continue to provide significant benefits, as does the Home Water Savers Program. However, over the long run the HomeWise/Low-Income Electric, Home Energy Loan, and Multifamily weatherization and lighting programs will provide City Light’s most enduring residential conservation resource. The Home Energy Check Program is the only audit information and advice program to generate significant savings. The average load reduction effected by programs with active measures in 2006 is shown graphically in the right pyramid of Figure 1 (average megawatts, adjusted to include savings on electricity transmission and distribution). At the present time, the greatest energy savings are being derived from past participants in the now-closed Home Water Savers Program, and from the major weatherization programs. Home Water Savers Program savings will have a relatively shorter lifetime because this was an early adopter program. Changes in the national and state plumbing codes have been eroding these savings as remodeling and renovation take place in the homes reached by this program. Weatherization savings have a much longer lifetime, usually around 30 years. Seattle City Light’s residential programs acquired 9,288 MWh in new energy savings from projects completed in 2006, at an overall levelized incentive cost of 2.0¢ per kilowatt-hour (kWh) over the lifetime of conservation measures. Measures installed just in non-low income residences acquired savings at an incentive cost of 1.5¢ per kWh.

Energy Conservation Accomplishments: 1977-2006 Seattle City Light
Summary of Accomplishments and Expenditures I-11
Table 1
RESIDENTIAL CONSERVATION PROGRAM SUMMARY (1)
First Year Lifetime Cumulative Average
MWh of MWh Megawatt
Residential Year Year Electricity Program Cumulative Electricity Load
Conservation Programs Pgm Pgm Savings Measures Number of Savings Reduction
Started Ended in 2006 in Years Participants thru 2006 in 2006
Active Programs:
Built Smart / Super Good Cents 1992 4,070 33 855 354,687 6.590
Low-Income Electric Pgm 1981 103 30 11,656 742,801 4.258
Multifamily Conservation Pgms 1986 2,878 22 3,811 867,411 10.694
Neighborhood Power Pgms 1994 (1997) 367 6 230,474 211,668 3.976
Retail-Wise Light and Appliance 1992 1,870 9 41,328 144,474 3.024
Inactive Programs:
Blanket Seattle / Water Heat Insulation and Setback Pgm 1977 1983 0 10 113,513 313,652 0.000
Energy Code: Residential 1992 1996 0 15 220 29,436 0.282
En Eff Water Htr Rebate Pgm 1992 2002 0 12 49,608 119,125 0.804
Home Energy Check Pgm 1981 1992 0 10 35,238 180,357 0.000
Home Energy Loan Pgm 1981 1993 0 30 12,286 505,117 2.904
Home Water Savers Pgm 1992 1995 0 15 84,535 633,873 5.243
Neighborhood Workshops 1978 1982 0 10 2,354 11,532 0.000
Residential Efficiency Stds 1981 1996 0 30 1,340 65,262 0.338
Residential Insulation Pgm 1978 1980 0 30 494 25,684 0.113
Water Heater Rebate Pgm 1983 1990 0 16 40,076 256,483 0.000
Residential Total 9,288 627,788 4,461,569 38.226
Notes
1. Data for this table were aggregated from individual program entries in SECTIONS II and IV of this
report; savings from residential Energy Code participants are included in this table although the program is reported in SECTION III. For the residential weatherization programs, buildings are counted as participants rather than dwelling units affected. In 1997 the Warm Home Program ended as a stand-alone, and continuing home weatherization activity was absorbed into the Neighborhood Power Program. Neighborhood Power participant counts in 2001 include 178,481 customers receiving Conservation Kits (and 51,606 others installing compact fluorescent light bulbs, not counted above); another 48,659 customers received Conservation Kits in 2005. Not shown are another 6,969 bulbs distributed in 1998-2000 and 54,236 in 2002-2006. RetailWise counts in 2002 exclude retail purchases of 262,995 bulbs and fixtures during 1999-2002, as well as regional NEEA programs.
Energy Conservation Accomplishments: 1977-2006 Seattle City Light
I-12 Summary of Accomplishments and Expenditures
Figure 1
RESIDENTIAL ENERGY SAVINGS
Multifamily19%
Low-Income Electric17%
Home Water Savers14%
Home Energy Loan11%
Other Programs11%
Water Heater Rebates8%
Built Smart/Good Cents8%
Blanket Seattle7%
Energy Check4%
Multifamily10.7
Built Smart/Good Cents6.6
Home Water Savers5.2
Low-Income Electric4.3
NPW Warm Home4.0
Retail Wise3.0
Home Energy Loan2.9
Water Heater Rebates0.8
Other Programs0.7
4,461 GWh in 1977-200638.2 aMW in 2006
Informational Programs Financial Incentives
Savings Since Start of Program Average Load Reduction Now
Notes
1. The first pyramid illustrates the proportion of savings achieved over the 30 years since the start of all
programs (the sum of annual savings from cumulative participants, or Savings Since Start of Program). It provides a sense of how each program, active or discontinued, has contributed to the overall energy conservation resources acquired by Seattle City Light. The second pyramid depicts the proportion of 2006 average load reduction achieved by each program having measures still active in 2006 (calculated from the Cumulative Energy Savings).

Energy Conservation Accomplishments: 1977-2006 Seattle City Light
Summary of Accomplishments and Expenditures I-13
Summary of Commercial–Industrial Programs A summary of Commercial and Industrial (C–I) conservation programs is provided in Table 2. There are 16 program entries representing informational programs, financial incentive programs and regulations. Of the four programs operating in 2006, the largest was the Energy Smart Services Program. The Energy Smart Design and Energy $avings Plan Programs enrolled their last projects in 2001, all of which reached completion by the end of 2005. Beginning January 2002, all new energy management services to medium and large commercial and industrial customers were initiated under Energy Smart Services. Energy savings have not been measured for the Lighting Design Lab, for the new Sustainability Programs, or for commercial buildings affected by the Energy Code Program. Among discontinued C–I programs still generating energy savings, the largest were the Energy Smart Design and Energy $avings Plan Programs. The electricity savings achieved from individual commercial and industrial conservation programs over the entire 1977-2006 period are shown in the left pyramid of Figure 2. These savings are expressed as gigawatt-hours (GWh, a million kilowatt-hours). The average load reduction effected by programs with active measures in 2006 is shown graphically in the right pyramid of Figure 2 (average megawatts, adjusted to include savings on electric transmission and distribution). Currently the greatest energy savings are being acquired from the Energy Smart Design Program, which is graphed in combination with commercial projects from Energy Smart Services, in this figure. Seattle City Light’s commercial and industrial programs acquired 48,323 MWh in new energy savings from projects completed in 2006, at an overall levelized incentive cost of 1.4¢ per kilowatt-hour (kWh) over the lifetime of conservation measures.

Energy Conservation Accomplishments: 1977-2006 Seattle City Light
I-14 Summary of Accomplishments and Expenditures
Table 2
COMMERCIAL–INDUSTRIAL CONSERVATION PROGRAM SUMMARY (1)
First Year Lifetime Cumulative Average
MWh of MWh Megawatt
Commercial – Industrial Year Year Electricity Program Cumulative Electricity Load
Conservation Programs Pgm Pgm Savings Measures Number of Savings Reduction
Started Ended in 2006 in Years Participants thru 2006 in 2006
Active Programs:
Energy Smart Services Pgm 2002 44,708 15 4,404 427,758 19.903
Lighting Design Lab 1988 — 16 5,773 0 0.000
Smart Business Rebate Pgm 1995 3,614 11 2,215 126,594 3.052
Sustainability & Energy Code 1989 — 15 1,522 0 0.000
Inactive Programs:
BPA Comrcl Tank Wrap Pgm 1982 1983 0 12 997 5,988 0.000
Cmrcl Incentives Pilot Pgm 1986 1991 0 16 234 344,997 0.679
En Code Major Projects Reqmt 1984 1991 0 16 46 143,232 0.366
Energy Mgmt Partnership Pgm 1980 1983 0 16 32 110,447 0.000
Energy Mgmt Survey Pgm 1984 1992 0 16 938 584,488 0.340
Energy $avings Plan 1988 2004 0 16 478 782,622 9.499
Energy Smart Design Pgm 1989 2003 0 15 2,360 3,988,697 47.311
General Service Efficiency Stds 1983 1996 0 18 762 51,178 0.154
Industrial R & D Project 1988 1992 0 15 15 47,941 0.139
Lighting Incentive Pgms 1981 1983 0 5 358 61,057 0.000
Lighting Survey Pgm 1979 1983 0 5 111 28,210 0.000
Street and Area Lighting Pgm 1982 1992 0 16 — 521,579 0.587
Walk-Through Survey Pgm 1980 1983 0 16 449 185,168 0.000
Commercial – Industrial Total 44,323 20,694 7,409,961 82,030
Notes
1. Data for this table were aggregated from individual program entries in SECTIONS III and V of this
report; however, savings from residential Energy Code participants are included in Table 1. For the new construction and retrofit programs, buildings are counted as participants rather than square footage affected. Participant counts exclude 60,984 streetlights retrofitted in 1982-1992.

Energy Conservation Accomplishments: 1977-2006 Seattle City Light
Summary of Accomplishments and Expenditures I-15
Figure 2
COMMERCIAL–INDUSTRIAL ENERGY SAVINGS
Energy Smart D/S(c)58%
Energy Savings Plan/S(i)12%
Management Survey8%
Other Programs8%
Street/Area Lighting7%
Cmcl Incentive Pilot5%
Walk-Thru Survey2%
Energy Smart D/S(c)62.9
Energy Savings Plan/S(i)13.9
Smart Business3.1
Other Programs1.0
CIPP0.7
Street/Area Lighting0.6
7,410 GWh in 1977-2006 82.0 aMW in 2006
Informational Programs Financial Incentives
Savings Since Start of Program Average Load Reduction Now
Notes
1. The first pyramid illustrates the proportion of savings achieved over the 30 years since the start of all
programs (the sum of annual savings from cumulative participants, or Savings Since Start of Program). It provides a sense of how each program, active or discontinued, has contributed to the overall energy conservation resources acquired by Seattle City Light. The second pyramid depicts the proportion of 2006 average load reduction achieved by each program having measures still active in 2006 calculated from the Cumulative Energy Savings). ‘Energy Smart D/S(c)’ combines the impacts of the Energy Smart Design Program and Energy Smart Services for commercial projects; ‘Energy $avings P/S(i)’ combines the impacts of the Energy $avings Plan Program and Energy Smart Services for industrial projects.

Energy Conservation Accomplishments: 1977-2006 Seattle City Light
I-16 Summary of Accomplishments and Expenditures
Conservation Program Participation by Year As might be expected, participation in City Light’s conservation programs and regulations (see Table 3) started slowly in 1977 and built up over time. In Figure 3, the peak of participation in 1982 shows the dramatic impact of the Blanket Seattle Program that installed over 107,000 free water-heater wraps in 1981-1983. Participation in Commercial–Industrial (C–I) programs also rose in 1983 while the commercial water heater wrap program was operating. Another peak in residential participation came in 1992, when 92,000 households in 81,000 buildings installed efficient-flow showerheads from the Home Water Savers Program. In 2001, Seattle City Light reached into more homes than ever when 230,087 households installed one or more compact fluorescent (CF) light bulbs received from the Conservation Kit Program and supplemental distributions. Not shown in Table 3 or Figure 3 are another 39,817 CF bulbs distributed by various means (1998-2000, 2002-2005), nor the 166,418 CF bulbs purchased by 2002 due to prior participation of households in the Conservation Kit Program. As of year end 2006, City Light has provided about 648,482 ‘service units.’ A service unit may be conservation measures provided to a single-family home, multiplex or multifamily building, or a commercial–industrial building. Since City Light’s 2006 customer base is about 379,230, it is apparent that some have participated in more than one program, or multiple times in the same program. As may be seen, City Light has made significant progress on the Conservation Resources goal to “bring energy efficiency into every home and business in Seattle.”

Energy Conservation Accomplishments: 1977-2006 Seattle City Light
Summary of Accomplishments and Expenditures I-17
Table 3
PROGRAM PARTICIPATION BY YEAR (1)
Residential Commercial Industrial Total Program Program Program Program
Year Participants Participants Participants Participants
1977 232 0 0 232 1978 2,703 0 0 2,703 1979 6,840 51 0 6,891 1980 9,189 43 5 9,237 1981 8,290 165 12 8,467 1982 74,871 680 5 75,556 1983 49,166 1,038 7 50,211 1984 10,237 436 6 10,679 1985 10,691 341 4 11,036 1986 10,666 249 2 10,917 1987 8,968 192 1 9,161 1988 8,381 135 2 8,518 1989 8,021 524 6 8,551 1990 4,189 1,055 4 5,248 1991 2,187 808 3 2,998 1992 86,931 604 12 87,547 1993 10,566 900 12 11,478 1994 9,859 661 33 10,553 1995 8,328 724 177 9,229 1996 5,429 498 160 6,087 1997 4,198 635 22 4,855 1998 6,079 639 14 6,732 1999 7,549 709 14 8,272 2000 9,472 737 9 10,218 2001 (2) 187,254 1,455 12 188,721 2002 7,137 3,061 23 10,221 2003 5,430 1,320 30 6,780 2004 5,104 813 30 5,947 2005 53,826 843 64 54,733 2006 5,995 657 52 6,704
Total 627,788 19,973 721 648,482
Notes
1. Participation figures are aggregated from individual conservation program entries in SECTIONS II-V of
this report. Both program participation and compliance with efficiency regulations are included here. For the residential weatherization programs, buildings are counted as participants rather than dwelling units affected. For new construction and retrofit commercial and industrial programs, buildings are counted as participants rather than square footage affected. The Street and Area Lighting Program is excluded.
2. Neighborhood Power participant counts include 178,481 customers receiving Conservation Kits in
2001 and 48,659 in 2005; however, RetailWise counts in 2002 exclude retail bulb purchases. See notes to Table 1 and Table 2 for more details.

Energy Conservation Accomplishments: 1977-2006 Seattle City Light
I-18 Summary of Accomplishments and Expenditures
Figure 3
19
77
1978
1979
1980
1981
198
2
1983
1984
1985
198
6
198
7
1988
1989
1990
199
1
1992
1993
1994
1995
199
6
1997
1998
1999
200
0
*2001
2002
2003
2004
*2005
2006
0
25,000
50,000
75,000
175,000
200,000
Sector:Commercial-IndustrialResidential
Program ParticipantsWith Completed Projects
Participating Service Units
Notes
1. Participation figures are aggregated from individual conservation program entries in SECTIONS II-V of
this report. Both program participation and compliance with efficiency regulations are included here. The Street and Area Lighting Program is excluded.

Energy Conservation Accomplishments: 1977-2006 Seattle City Light
Summary of Accomplishments and Expenditures I-19
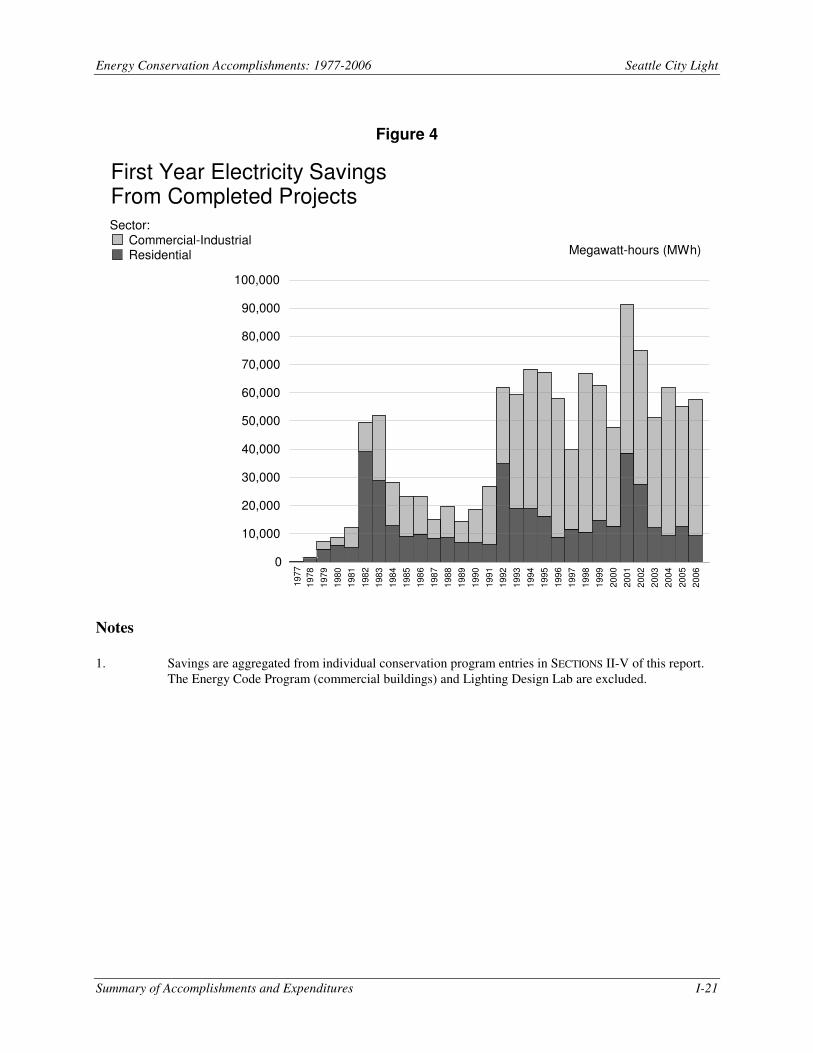
Conservation Energy Savings by Year Table 4 describes incremental first year energy savings acquired from the cohort of participants in each program year. Projects completed in 2006 generated 57,611 megawatt-hours (MWh). Of these 2006 first year savings, 84% were acquired from Commercial and Industrial projects. By contrast, 42% of first year savings in 1992 were acquired from the Commercial and Industrial sectors. Figure 4 illustrates the acquisition of first year savings by sector for each annual cohort of new program participants. Annual acquisition from residential programs hit peaks in 1982-1983 with Blanket Seattle (a water-heater wrap program), in 1992 with Home Water Savers (showerheads), in 2001 with Conservation Kits (compact fluorescent bulbs), and with ‘spillover’ CF light purchasing in 2002. Annual acquisition from Commercial-Industrial programs rose in 1993-1996 with the ramp-up and down of BPA funding. City Light rallied in 1998-1999 with utility funds, retrenched in 2000 prior to the West Coast energy price crisis, and rallied again in 2001 with the residential Conservation Kit and the highly successful ‘10+10’ Incentive Bonus for medium and large business customers; 2003 saw a repeat of the ‘10+10’ Bonus offer. Savings in subsequent years from each cohort would typically be lower than the amount shown in Table 4 (due to expiration of measure lifetimes). In fact, the sum of first year savings across years would be equivalent to 147 average-megawatts (aMW) if all measures were still installed and performing at first year levels; the actual load reduction in 2006 was 82% of this amount.

Energy Conservation Accomplishments: 1977-2006 Seattle City Light
I-20 Summary of Accomplishments and Expenditures
Table 4
FIRST YEAR ELECTRICITY SAVINGS BY PARTICIPATION YEAR — from Completed Projects — (1)
Industrial– Total Residential Commercial Government First Year Programs Programs Programs Savings
Year (MWh) (MWh) (MWh) (MWh)
1977 116 0 0 116 1978 1,680 0 0 1,680 1979 4,591 2,592 0 7,183 1980 5,940 1,784 917 8,641 1981 5,103 5,539 1,434 12,076 1982 39,022 8,415 2,152 49,589 1983 28,855 13,113 10,044 52,012 1984 12,843 9,689 5,686 28,218 1985 9,092 8,497 5,532 23,121 1986 9,887 7,455 5,843 23,185 1987 8,426 3,848 2,744 15,018 1988 8,671 10,021 955 19,647 1989 6,955 4,029 3,387 14,371 1990 6,864 8,953 2,779 18,596 1991 6,168 20,056 686 26,910 1992 34,788 21,358 5,734 61,880 1993 18,980 35,215 5,071 59,266 1994 18,941 45,604 3,840 68,385 1995 16,247 36,340 14,718 67,305 1996 8,836 39,350 9,732 57,918 1997 11,696 23,568 4,575 39,839 1998 10,649 53,566 2,617 66,832 1999 14,748 34,315 13,470 62,533 2000 12,700 33,280 1,779 47,759 2001 38,647 49,604 2,954 91,205 2002 27,527 38,097 9,287 74,911 2003 12,086 33,047 5,985 51,118 2004 9,252 35,554 16,915 61,721 2005 12,548 33,238 9,391 55,177 2006 9,289 37,383 10,940 57,612
Total 411,147 653,510 159,167 1,223,824
Notes
1. Savings are aggregated from individual conservation program entries in SECTIONS II-V of this report.
The Energy Code Program (commercial buildings) and Lighting Design Lab are excluded.
Energy Conservation Accomplishments: 1977-2006 Seattle City Light
Summary of Accomplishments and Expenditures I-21
Figure 4
19
77
1978
1979
1980
1981
198
2
1983
1984
1985
198
6
198
7
1988
1989
1990
199
1
1992
1993
1994
1995
199
6
1997
1998
1999
200
0
200
1
2002
2003
2004
200
5
2006
0
10,000
20,000
30,000
40,000
50,000
60,000
70,000
80,000
90,000
100,000
Sector:Commercial-IndustrialResidential
First Year Electricity SavingsFrom Completed Projects
Megawatt-hours (MWh)
Notes
1. Savings are aggregated from individual conservation program entries in SECTIONS II-V of this report.
The Energy Code Program (commercial buildings) and Lighting Design Lab are excluded.
Energy Conservation Accomplishments: 1977-2006 Seattle City Light
I-22 Summary of Accomplishments and Expenditures
A summary of electricity savings by sector from conservation efforts is provided in Table 5. This table (displayed graphically in Figure 5) shows that there has been a dramatic increase in electricity savings from 1977 through 2006. In 1978 City Light conservation programs saved approximately 1,800 MWh; by 2006, the combined residential, commercial and industrial programs saved nearly 1,001,400 MWh. These savings come from two sources: (1) savings from earlier program participants that continue over the lifetime of the conservation measures installed, and (2) first year savings from new participants that are added each year. The electricity savings described in this document are primarily based on programs with measured electricity savings derived from evaluation studies. Because measured evaluation savings generally involve comparison with ‘control groups’ of nonparticipants, short-term price effects are factored out. Long-term price effects are not considered here. From 1977 through 2006, conservation programs saved over 11.9 million megawatt-hours (MWh). These savings acquired since the start of all programs would be enough to provide electricity to about 1,403,240 homes for one year (four times the number that exist in City Light’s whole service area). In fact, if all 1977-2006 savings had been available in 2006, they could have powered the entire Utility load in all sectors for the year, with 32% so spare. Energy savings acquired in 2006 from cumulative participants with active measures totaled 1,001,367 MWh, enough to power 118,364 homes (about one-third of our residential service area). Electric space heat and water heat are prevalent in Seattle’s marine climate, making City Light a winter-peaking utility. Air conditioning during the summer is rare in homes, although it is common in commercial buildings all year round. Greater electricity use during the winter has governed the evolution of conservation programs in Seattle. Nonetheless, City Light focuses on average overall load reduction as its basic energy management strategy, from year-round lighting, appliance, and water heat end uses as well as from winter heating and summer cooling. The average utility system load reduction in 2006 was 114.3 average megawatts (aMW). By sector, this unadjusted on-site load reduction was: Residential, 36.3 aMW; Commercial, 64.0 aMW; and Industrial–Governmental, 13.9 aMW. Figure 6 describes the average megawatts of load reduction achieved in each year from 1977 through 2006. These reductions in average load (from Tables 1 and 2) are adjusted upward by 5.2% to reflect savings from avoided energy transmission and distribution (energy that would have been lost on lines arriving from alternative system resources). With this adjustment, the average load reduction in 2006 reached 120.3 aMW—11% of the entire Utility average load. By sector, this adjusted on-site load reduction was: Residential, 38.2 aMW; Commercial, 67.4 aMW; and Industrial–Governmental, 14.7 aMW. In 1991 the load reduction acquired by business programs overtook residential program production.

Energy Conservation Accomplishments: 1977-2006 Seattle City Light
Summary of Accomplishments and Expenditures I-23
Table 5
PROGRAM ELECTRICITY SAVINGS IN EACH YEAR — from Completed Projects — (1)
Residential Commercial Industrial– Total Programs Programs Government Savings
Year (MWh) (MWh) Pgms (MWh) (MWh)
1977 116 0 0 116 1978 1,796 0 0 1,796 1979 6,386 2,592 0 8,978 1980 12,325 4,376 916 17,617 1981 17,428 9,915 2,350 29,693 1982 56,073 18,330 4,503 78,906 1983 77,729 31,443 14,547 123,719 1984 77,878 38,539 20,233 136,650 1985 87,210 46,680 25,765 159,655 1986 96,413 50,859 31,608 178,880 1987 104,780 50,854 34,352 189,986 1988 111,822 53,099 35,307 200,228 1989 114,873 57,129 38,694 210,696 1990 117,197 66,083 41,473 224,753 1991 120,163 86,139 42,158 248,460 1992 135,883 107,497 47,892 291,272 1993 144,436 142,671 52,963 340,070 1994 162,919 187,980 56,803 407,702 1995 178,496 223,965 71,522 473,983 1996 186,748 261,885 80,337 528,970 1997 197,760 283,195 83,479 564,434 1998 207,893 332,409 85,726 626,028 1999 220,839 361,715 96,490 679,044 2000 230,860 385,340 95,089 711,289 2001 266,380 426,395 97,201 789,976 2002 291,040 457,738 104,009 852,787 2003 299,537 487,267 102,016 888,820 2004 305,122 512,466 115,222 932,810 2005 313,160 541,174 118,511 972,845 2006 318,307 561,012 122,048 1,001,367
Total 4,461,569 5,788,747 1,621,214 11,871,530
Notes
1. Savings are aggregated from individual conservation program entries in SECTIONS II-V of this report.
The Energy Code Program (commercial buildings) and Lighting Design Lab are excluded.

Energy Conservation Accomplishments: 1977-2006 Seattle City Light
I-24 Summary of Accomplishments and Expenditures
Figure 5
19
77
1978
1979
1980
1981
198
2
1983
1984
1985
198
6
198
7
1988
1989
1990
199
1
1992
1993
1994
1995
199
6
1997
1998
1999
200
0
200
1
2002
2003
2004
200
5
2006
0
100,000
200,000
300,000
400,000
500,000
600,000
700,000
800,000
900,000
1,000,000
1,100,000
Sector:Commercial-IndustrialResidential
Program Electricity Savings in Each YearFrom Completed Projects
Megawatt-hours (MWh)
Notes
1. Savings are aggregated from individual conservation program entries in SECTIONS II-V of this report.
The Energy Code Program (commercial buildings) and Lighting Design Lab are excluded.

Energy Conservation Accomplishments: 1977-2006 Seattle City Light
Summary of Accomplishments and Expenditures I-25
Figure 6
0 0 1 2 4
915 16
1921 23 24 25 27
3035
41
49
57
6468
75
8285
95
102107
112117
120
19
77
1978
1979
1980
1981
1982
1983
1984
1985
1986
1987
1988
1989
1990
1991
1992
1993
1994
1995
1996
1997
1998
1999
2000
2001
2002
2003
2004
2005
2006
0
10
20
30
40
50
60
70
80
90
100
110
120
130
Sector:Total aMWCommercial-IndustrialResidential
Programmatic Load Reduction in Each Year From Completed Projects
Average Megawatts (aMW) with T&D Savings
Notes
1. Load reduction in average megawatts is adjusted upward by 5.2% to reflect savings in energy
transmission and distribution.

Energy Conservation Accomplishments: 1977-2006 Seattle City Light
I-26 Summary of Accomplishments and Expenditures
Community Benefits and Customer Bill Savings by Year There are many ways of looking at the benefits of conservation. Conservation projects and City Light programs support a significant infrastructure of private sector contractors, vendors, installers, design engineers, and others, who contribute to the local economy. Efficiency investments, especially in the industrial sector, have been shown through evaluation studies to lead to greater production benefits and economic viability for participating businesses. From City Light’s perspective, the primary benefits from conservation programs are the energy savings and load reduction that displace alternative, more costly resources. From a customer’s perspective, however, bill savings (and perhaps increased comfort, functionality, and property value) are the major attraction of conservation programs. Table 6 and Figure 7 show that City Light’s customers have experienced enormous bill savings as a result of their participation in conservation programs. From the community perspective, reduced energy usage reaps significant benefits for the atmosphere.
Customer Bill Savings: In ‘nominal’ dollars—those of each year as they occur—customer bill savings from 1977 through 2006 totaled nearly $557 million (see Table 6 and the columns of Figure 7). If this amount were adjusted using the Consumer Price Index for urban and clerical workers, then the savings would be about $667 million in 2006 dollars (the labeled line in Figure 7). Over the entire 30-year period, 48% of these bill savings went to customers in the residential sector. In recent years, commercial customer bill savings have been increasing. In 2006 the average annual electric rates by customer sector were, in cents per kilowatt-hour: Residential, 6.58¢ (weighted by seasonal end blocks and rate assistance categories); Commercial and Industrial (nonresidential), 5.97¢. At the same time, the national average cost of electricity for residential customers in 2005 was 9.42¢ per kWh.
Community Benefits: Another perspective on the benefits of conservation is Seattle City Light’s role in reducing greenhouse gas emissions. Beginning with programs active in 1988, Seattle tracked indirect reductions of carbon dioxide (CO2) emissions for Voluntary Reporting of
Greenhouse Gases to the U.S. Department of Energy (EIA-1605). From conservation and generation system efficiency measures installed during 1991-2005, Seattle City Light achieved reductions of about 415,277 short tons of atmospheric carbon dioxide in 2005. About 90% of this amount (374,660 tons) was attributable to the Utility’s energy conservation programs. These calculations assumed that an efficient natural gas-fired combined-cycle combustion turbine would have been utilized in the absence of these 1991-2005 conservation savings. The rate was computed as 0.4324 short tons per megawatt-hour saved, equivalent to 3,787.8 tons of carbon dioxide emissions avoided per average megawatt of load reduction.
Energy Conservation Accomplishments: 1977-2006 Seattle City Light
Summary of Accomplishments and Expenditures I-27
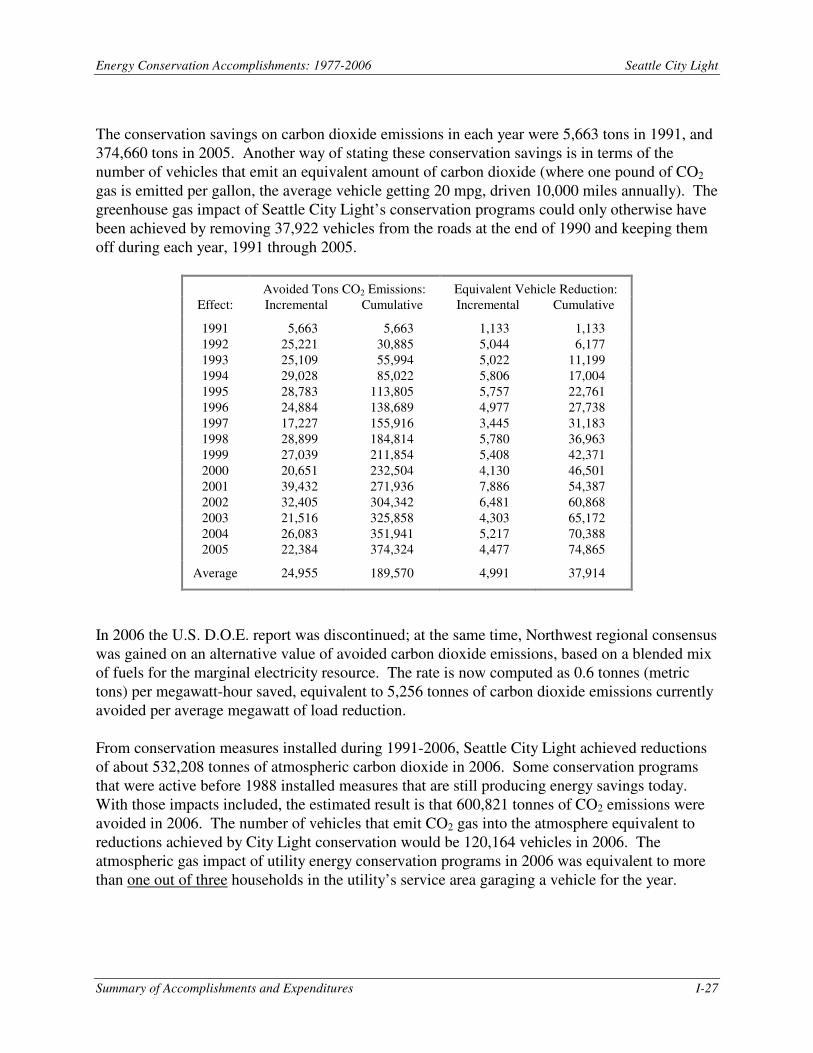
The conservation savings on carbon dioxide emissions in each year were 5,663 tons in 1991, and 374,660 tons in 2005. Another way of stating these conservation savings is in terms of the number of vehicles that emit an equivalent amount of carbon dioxide (where one pound of CO2 gas is emitted per gallon, the average vehicle getting 20 mpg, driven 10,000 miles annually). The greenhouse gas impact of Seattle City Light’s conservation programs could only otherwise have been achieved by removing 37,922 vehicles from the roads at the end of 1990 and keeping them off during each year, 1991 through 2005.
Avoided Tons CO2 Emissions: Equivalent Vehicle Reduction: Effect: Incremental Cumulative Incremental Cumulative
1991 5,663 5,663 1,133 1,133
1992 25,221 30,885 5,044 6,177
1993 25,109 55,994 5,022 11,199
1994 29,028 85,022 5,806 17,004
1995 28,783 113,805 5,757 22,761
1996 24,884 138,689 4,977 27,738
1997 17,227 155,916 3,445 31,183
1998 28,899 184,814 5,780 36,963
1999 27,039 211,854 5,408 42,371
2000 20,651 232,504 4,130 46,501
2001 39,432 271,936 7,886 54,387
2002 32,405 304,342 6,481 60,868
2003 21,516 325,858 4,303 65,172
2004 26,083 351,941 5,217 70,388 2005 22,384 374,324 4,477 74,865
Average 24,955 189,570 4,991 37,914
In 2006 the U.S. D.O.E. report was discontinued; at the same time, Northwest regional consensus was gained on an alternative value of avoided carbon dioxide emissions, based on a blended mix of fuels for the marginal electricity resource. The rate is now computed as 0.6 tonnes (metric tons) per megawatt-hour saved, equivalent to 5,256 tonnes of carbon dioxide emissions currently avoided per average megawatt of load reduction. From conservation measures installed during 1991-2006, Seattle City Light achieved reductions of about 532,208 tonnes of atmospheric carbon dioxide in 2006. Some conservation programs that were active before 1988 installed measures that are still producing energy savings today. With those impacts included, the estimated result is that 600,821 tonnes of CO2 emissions were avoided in 2006. The number of vehicles that emit CO2 gas into the atmosphere equivalent to reductions achieved by City Light conservation would be 120,164 vehicles in 2006. The atmospheric gas impact of utility energy conservation programs in 2006 was equivalent to more than one out of three households in the utility’s service area garaging a vehicle for the year.
Energy Conservation Accomplishments: 1977-2006 Seattle City Light
I-28 Summary of Accomplishments and Expenditures
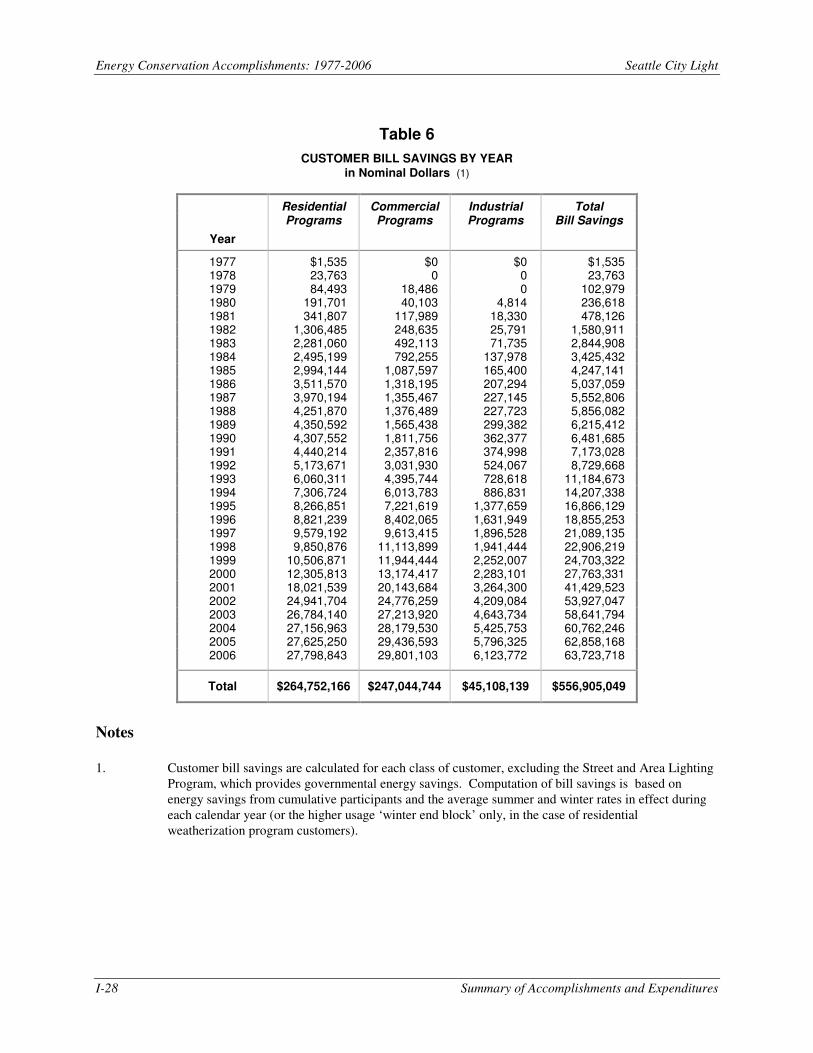
Table 6
CUSTOMER BILL SAVINGS BY YEAR in Nominal Dollars (1)
Residential Commercial Industrial Total
Year
Programs Programs Programs Bill Savings
1977 $1,535 $0 $0 $1,535 1978 23,763 0 0 23,763 1979 84,493 18,486 0 102,979 1980 191,701 40,103 4,814 236,618 1981 341,807 117,989 18,330 478,126 1982 1,306,485 248,635 25,791 1,580,911 1983 2,281,060 492,113 71,735 2,844,908 1984 2,495,199 792,255 137,978 3,425,432 1985 2,994,144 1,087,597 165,400 4,247,141 1986 3,511,570 1,318,195 207,294 5,037,059 1987 3,970,194 1,355,467 227,145 5,552,806 1988 4,251,870 1,376,489 227,723 5,856,082 1989 4,350,592 1,565,438 299,382 6,215,412 1990 4,307,552 1,811,756 362,377 6,481,685 1991 4,440,214 2,357,816 374,998 7,173,028 1992 5,173,671 3,031,930 524,067 8,729,668 1993 6,060,311 4,395,744 728,618 11,184,673 1994 7,306,724 6,013,783 886,831 14,207,338 1995 8,266,851 7,221,619 1,377,659 16,866,129 1996 8,821,239 8,402,065 1,631,949 18,855,253 1997 9,579,192 9,613,415 1,896,528 21,089,135 1998 9,850,876 11,113,899 1,941,444 22,906,219 1999 10,506,871 11,944,444 2,252,007 24,703,322 2000 12,305,813 13,174,417 2,283,101 27,763,331 2001 18,021,539 20,143,684 3,264,300 41,429,523 2002 24,941,704 24,776,259 4,209,084 53,927,047 2003 26,784,140 27,213,920 4,643,734 58,641,794 2004 27,156,963 28,179,530 5,425,753 60,762,246 2005 27,625,250 29,436,593 5,796,325 62,858,168 2006 27,798,843 29,801,103 6,123,772 63,723,718
Total $264,752,166 $247,044,744 $45,108,139 $556,905,049
Notes
1. Customer bill savings are calculated for each class of customer, excluding the Street and Area Lighting
Program, which provides governmental energy savings. Computation of bill savings is based on energy savings from cumulative participants and the average summer and winter rates in effect during each calendar year (or the higher usage ‘winter end block’ only, in the case of residential weatherization program customers).

Energy Conservation Accomplishments: 1977-2006 Seattle City Light
Summary of Accomplishments and Expenditures I-29
Figure 7
0 0 0 1 13
6 78
10 10 11 11 11 1113
16
20
2325
2728
3032
46
59
6465 65
64
197
7
19
78
19
79
19
80
19
81
19
82
19
83
19
84
19
85
19
86
19
87
19
88
19
89
19
90
19
91
19
92
19
93
19
94
19
95
19
96
19
97
19
98
19
99
20
00
20
01
20
02
20
03
20
04
20
05
2,0
06
$0
$5,000,000
$10,000,000
$15,000,000
$20,000,000
$25,000,000
$30,000,000
$35,000,000
$40,000,000
$45,000,000
$50,000,000
$55,000,000
$60,000,000
$65,000,000
$70,000,000
Sector:Total Present ValueCommercial-IndustrialResidential
Customer Bill Savings in Each YearFrom Completed Projects
Nominal Dollars
Notes
1. Customer bill savings are calculated for each class of customer, excluding the Street and Area Lighting
Program, which provides governmental energy savings. Computation of bill savings is based on energy savings from cumulative participants and the average summer and winter rates in effect during each calendar year (or the higher usage ‘winter end block’ only, in the case of residential weatherization program customers). The columns show savings in nominal dollars of each year; the total line shows the present-day value of savings in 2006 dollars.
2. The 2006 average rate per kWh for each class of customers was: Residential Standard (RSC end-
block), 9.81¢; Residential Elderly/Disabled and Low-Income (REC/RLC end-block), 3.91¢; Small General Service (SMC–City), 5.86¢; Medium General Service (MDC–City), 5.67¢; Medium General Service (MDS–suburban), 5.78¢; Large and High-Demand General Service (LGC–City), 5.23¢.
Energy Conservation Accomplishments: 1977-2006 Seattle City Light
I-30 Summary of Accomplishments and Expenditures
Conservation Staffing and Budgets by Year The Conservation Resources Division of Seattle City Light is organized to carry out Seattle’s commitment to the conservation energy resource. Staffing levels peaked in 1982 and 1983 during a period of expected energy resource deficits, when substantial Bonneville Power Administration funding was available for conservation. The annual summary of budgeted staff positions and total division budgets (nominal dollars) are shown in Table 7 and Figure 8. In 2006 the division budgeted for 66.0 full-time equivalent staff positions, of which 54.5 were occupied at mid-year. Most employees are organized into functional teams within sector-based groups: Community Conservation and Commercial–Industrial Conservation. The teams deliver informational, in-the-field, incentive, contracting and financial services; they also supply program coordination, implementation planning, and program administration for residential, commercial, industrial, and governmental–institutional customers. Another small group provides division-wide Support Services including policy direction, Web-site/marketing, general administrative support, and program evaluation. The total division budget includes not only Direct Program costs but also these related Support Service costs. In 2006 the total division budget was just under $20.0 million. This corresponds to 3.4% of total Seattle City Light customer revenues in 2006, the lowest level since 1981 (down from a high of 9.5% in 1995). From 1977 through 2006, Seattle City Light has budgeted $500.7 million nominal dollars for the acquisition of the conservation energy resource. Budgets include expenses that are later offset by revenues from outside funding sources and, in past years, customer loan repayments. Actual expenditure of budgeted monies does not always take place within the same calendar year. Budgeted obligations are entered into which carry across years. For example, incentive monies may be obligated by contract for efficiency improvements in new construction projects that are built one to four years after initial program entry. Following Figure 8 is a description of actual expenditures by year for program participants with conservation work completed during each calendar year.

Energy Conservation Accomplishments: 1977-2006 Seattle City Light
Summary of Accomplishments and Expenditures I-31
Table 7
CONSERVATION STAFFING AND BUDGETS BY YEAR
Total CRD Budgeted Total CRD City Light Budget as Positions Budget in Customer Percent
Year FTEs Nominal$ Revenues of Sales
1977 7.5 $1,491,000 $98,599,000 1.5% 1978 18.5 1,760,000 91,148,000 1.9 1979 23.5 2,658,000 96,399,000 2.8 1980 82.0 2,758,000 113,362,000 2.4 1981 99.0 7,295,000 133,836,000 5.5 1982 115.5 16,495,000 148,410,000 11.1 1983 118.5 16,329,000 164,610,000 9.9 1984 99.0 11,495,000 199,373,000 5.8 1985 99.0 10,869,000 227,444,000 4.8 1986 99.0 12,643,000 241,637,000 5.2 1987 96.0 13,633,000 245,459,000 5.6 1988 97.0 15,320,000 263,610,000 5.8 1989 97.0 15,420,000 281,248,000 5.5 1990 93.5 13,578,000 284,463,000 4.8 1991 90.5 21,639,000 280,945,000 7.7 1992 83.5 22,000,000 292,564,000 7.5 1993 89.5 29,106,000 320,359,000 9.1 1994 89.5 29,640,000 332,801,000 8.9 1995 89.5 31,365,000 329,808,000 9.5 1996 89.5 26,300,000 356,671,000 7.4 1997 84.5 19,800,000 362,711,000 5.5 1998 70.0 19,600,000 360,625,000 5.4 1999 69.5 19,157,000 367,935,000 5.2 2000 67.5 18,241,000 391,578,000 4.7 2001 71.5 20,018,000 503,437,000 4.0 2002 69.0 24,289,000 562,432,000 4.3 2003 69.0 18,875,000 552,233,000 3.4 2004 67.0 19,955,000 576,692,000 3.5 2005 67.0 19,292,000 562,548,000 3.4 2006 66.0 19,706,000 583,114,000 3.4
1977-2006 — $500,727,000 $9,326,051,000 5.4%
Notes
1. In 2006 the division budgeted for 66.0 full-time equivalent staff positions, of which 54.5 were occupied
at mid-year. Some conservation implementation is also carried out by other City Light divisions (e.g., Customer Engineering) and other City agencies (e.g., the Office of Housing; and the Department of Planning and Development—formerly Design, Construction and Land Use). Those staffs are not included in the positions above.

Energy Conservation Accomplishments: 1977-2006 Seattle City Light
I-32 Summary of Accomplishments and Expenditures
Figure 8
19
77
19
78
19
79
19
80
19
81
19
82
19
83
19
84
19
85
19
86
19
87
19
88
19
89
19
90
19
91
19
92
19
93
19
94
19
95
19
96
19
97
19
98
19
99
20
00
20
01
20
02
20
03
20
04
20
05
20
06
$0
$5,000,000
$10,000,000
$15,000,000
$20,000,000
$25,000,000
$30,000,000
$35,000,000
0
20
40
60
80
100
120
140
BudgetFTE Positions
Conservation Staffing and Budgets
Budget Dollars (Nominal) Staffing (FTEs)

Energy Conservation Accomplishments: 1977-2006 Seattle City Light
Summary of Accomplishments and Expenditures I-33
Conservation Expenditures by Year Conservation expenditures by year for each program can be found in SECTIONS II-V. The annual summary of Residential and C–I program expenditures is shown in Table 8 and Figure 9. Expenditures to date (including accruals for outstanding work nearing completion) comprise 90% of conservation budgets to date. Four caveats should be kept in mind when examining these expenditure data.
First: Both Direct Program costs and Support Service costs are presented. Support Service costs include conservation-related expenditures for functions such as support of energy codes and early adopter activities, long range planning, research and development, performance measurement and evaluation, data processing, Web-site development and general marketing, as well as overall conservation administration. From 1977 through 1992, Support Service costs included general DSM administration but excluded any general corporate overhead charges. Beginning in April 1993, a corporate service overhead charge was initiated for utility Administrative and General (A&G) expenses. This charge distributes City Light non-programmatic, non-conservation labor and expenses to individual conservation programs in proportion to programmatic labor hours. The new A&G service charge affected a portion of Support Service costs that is capitalized. During the period 1977-1992, Direct Program costs also excluded indirect costs from other City Departments, e.g., for facilities and general utility administration. Direct Program costs included labor, expenses, and customer incentives. Specific overhead charges for employee benefits, vehicles, and equipment have always been included in program-level costs. The 1993-2006 program administration cost data now include the corporate service overhead charge, begun in April 1993, for utility A&G expenses. In 1993 the new A&G service overhead charge for all active programs was $975,976. This comprised 26% of City Light’s programmatic conservation administration expenses in 1993, increasing total administration by about 38% over prior years. In 1994 the A&G service charge was $1,224,735 (31% of program administration expenses); in 1995 it was $1,286,428 (22%). The A&G service charge continued at similar levels in subsequent years. Because City Light program costs now include the City Light A&G charge, expenditures for low-income programs (operated by the City Office of Housing, formerly the Department of Housing and Human Services) have been adjusted for the same 1993-2005 period. Indirect expenses formerly excluded from expenditure tables (reported only in footnotes) have been restored to the tables and program summaries. The former exclusion of OH/DHHS indirect costs, and the current inclusion for 1993-2006, are intended to foster more accurate comparisons of costs across programs.

Energy Conservation Accomplishments: 1977-2006 Seattle City Light
I-34 Summary of Accomplishments and Expenditures
Program-specific expenses reported in each program entry (see SECTIONS II-V) continue to exclude the costs of most conservation Support Services, which are reported only at the utility level in SECTION I. However, City Light accounting practices charge some program-specific planning, evaluation, and data processing expenses to the relevant programs for purposes of capitalizing the complete Utility cost of resource acquisition. In all cases, the total expenditures reported here represent the initial cost to the utility and not the total resource cost.
Second: Some of the expenditures in Table 8 (a portion of those for the HELP, Multifamily Conservation Programs, and earlier Residential Insulation Program) were loans to customers that have already been paid back to City Light. Information on repayment is included under the category of revenues, in the discussion following Table 9.
Third: Program expenditures reflect work completed but exclude obligations or encumbrances for work contracted and still in progress. As has been noted earlier, budget is often obligated for projects at the stage of contract acquisition, while projects may be completed and put into production in subsequent years.
And Fourth: As is often the case, historical records for early conservation expenditures are probably less reliable than more recent figures, since record-keeping systems have improved over time. Thus historical series should accord greater weight to the accuracy of information on the past decade than on the previous one. In 2006 the total division expenditures were just over $20.0 million. This corresponds to 3.5% of total City Light customer revenues in 2006 (down from 8.6% in 1995). From 1977 through 2006, City Light has expended nearly $450 million nominal dollars for the acquisition of the conservation energy resource. Expenditures include costs that are later offset by revenues from outside funding sources and (formerly) customer loan repayments. Utility expenditures exclude excess costs associated with conservation projects that are borne directly by the customer. It is clear from Table 8 that for years residential program expenditures were consistently higher than expenditures for C–I conservation efforts. This was due to a later start for C–I efforts and the fact that early C–I programs focused on conservation information and advice rather than financial incentives. The peak in 1983 conservation expenditures echoes the peak in program participation shown earlier in Table 3. This was a ‘high point’ for conservation activity when several short-term programs were underway (e.g., tank wraps) and City Light was receiving significant funding for conservation activities from the BPA. The next peak in expenditures came in 1995, at the height of regional support for conservation resource acquisition. A third peak in 2001 reflects the Utility’s response to the West Coast energy price crisis. In 1993 for the first time, C–I expenditures exceeded Residential program expenditures, by over $2 million.

Energy Conservation Accomplishments: 1977-2006 Seattle City Light
Summary of Accomplishments and Expenditures I-35
Table 8
CONSERVATION EXPENDITURES BY YEAR
Industrial– Total (1) Support Total Residential Commercial Government Program Services Conservation
Year Programs Programs Programs Expenditures (2) Expenditures
1977 $0 $0 $0 $0 $168,015 $168,015 1978 329,195 0 0 329,195 903,979 1,233,174 1979 651,947 8,292 0 660,239 710,263 1,370,502 1980 789,202 87,201 0 876,403 911,967 1,788,370 1981 3,136,571 241,968 0 3,378,539 880,232 4,258,771 1982 8,630,058 402,827 682,052 9,714,937 946,225 10,661,162 1983 11,582,744 500,131 2,380,145 14,463,020 885,567 15,348,587 1984 8,532,480 292,676 1,158,046 9,983,202 874,460 10,857,662 1985 8,351,650 318,067 1,329,245 9,998,962 872,185 10,871,147 1986 8,848,212 447,401 1,221,759 10,517,372 2,825,156 13,342,528 1987 7,717,157 1,042,471 995,767 9,755,395 2,727,756 12,483,151 1988 7,716,451 1,960,093 991,366 10,667,910 2,804,379 13,472,289 1989 7,033,981 2,362,291 1,122,319 10,518,591 1,992,417 12,511,008 1990 7,574,461 2,909,756 556,862 11,041,079 2,157,998 13,199,077 1991 7,110,443 4,258,688 401,541 11,770,672 894,674 12,665,346 1992 7,548,393 5,957,779 479,493 13,985,665 3,195,691 17,181,356 1993 8,304,001 10,765,436 886,407 19,955,844 2,610,218 22,566,062 1994 11,252,776 11,160,191 914,277 23,327,244 3,090,435 26,417,679 1995 13,618,771 9,597,147 2,172,550 25,388,468 3,012,332 28,400,800 1996 6,595,868 9,432,413 2,051,652 18,079,933 3,302,634 21,382,567 1997 5,660,930 6,730,987 1,354,792 13,746,709 2,819,454 16,566,163 1998 5,605,327 11,227,480 934,810 17,767,617 2,330,961 20,098,578 1999 6,396,437 9,786,753 1,774,390 17,957,580 2,539,336 20,496,916 2000 6,143,300 8,979,240 581,396 15,703,936 1,903,001 17,606,937 2001 10,259,916 13,816,710 781,131 24,857,757 1,806,864 26,664,621 2002 6,965,799 9,691,462 1,377,802 18,035,063 1,273,584 19,308,647 2003 5,701,836 10,557,036 1,224,256 17,483,128 1,299,859 18,782,987 2004 5,033,794 11,153,900 2,067,505 18,255,199 1,319,856 19,575,055 2005 6,223,549 10,319,289 1,702,176 18,245,014 1,961,674 20,206,689 2006 5,469,457 10,745,160 2,035,649 18,250,266 1,950,476 20,200,742
Total $198,784,706 $164,752,845 $31,177,388 $394,714,939 $54,971,648 $449,686,588
Notes
1. Expenditures are aggregated from the conservation program entries in SECTIONS II–V of this report. Program expenditures reflect work completed, from which energy savings are being acquired. Excluded are obligations and encumbrances for work contracted and in progress. Hence these expenditure totals do not equal those from general accounting ledgers. The expenditure figures are also not net of BPA reimbursements, customer loan repayments, or other sources of revenue.
2. Support services include conservation-related expenditures such as support of energy codes and early adopter
activities, long-range planning, research and development, evaluation, data processing and general administration. There were timing problems in reconciling the general accounting system to evaluation audit records for 1982-1986. Support service expenditures averaged $2.6 million in 1986-1999 (or about 14% of total expenditures for conservation) and $1.6 million in 2000-2005 (8%). Recently Support service expenditures include a fee to the regional Northwest Energy Efficiency Council: $635,607 in 2005 and $586,070 in 2006.
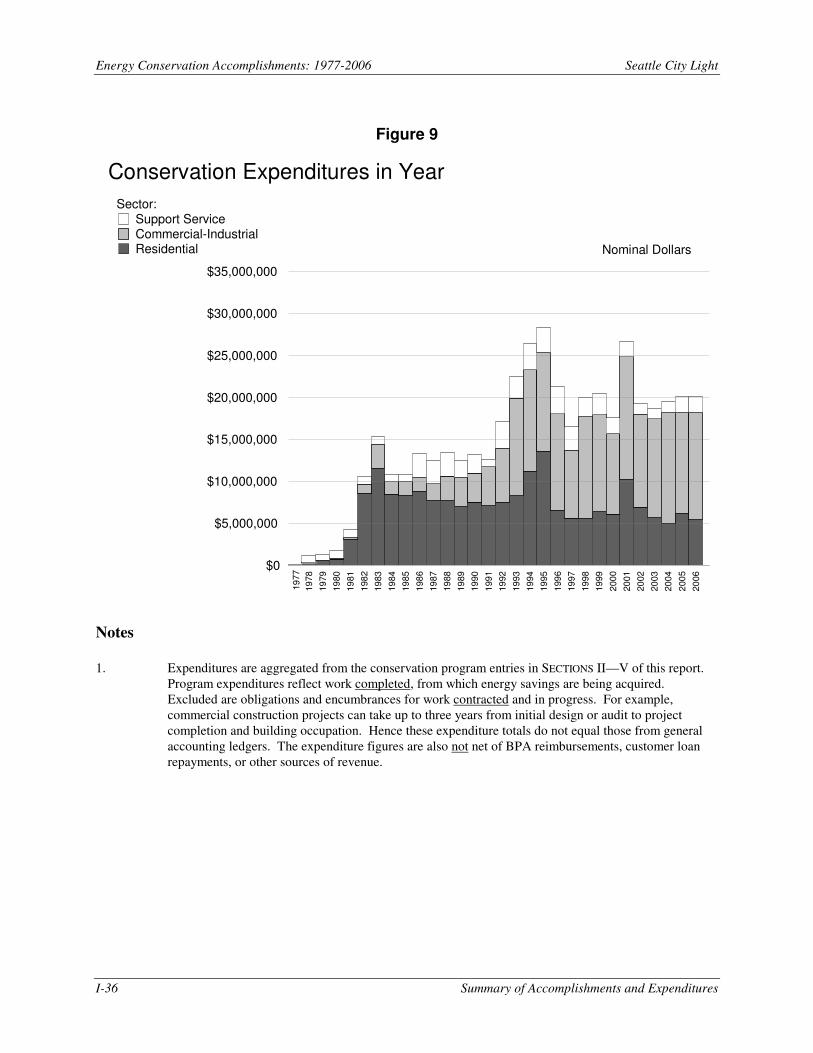
Energy Conservation Accomplishments: 1977-2006 Seattle City Light
I-36 Summary of Accomplishments and Expenditures
Figure 9
19
77
19
78
19
79
19
80
19
81
198
2
19
83
19
84
19
85
198
6
19
87
19
88
19
89
19
90
199
1
19
92
19
93
19
94
19
95
199
6
19
97
19
98
19
99
200
0
20
01
20
02
20
03
20
04
200
5
20
06
$0
$5,000,000
$10,000,000
$15,000,000
$20,000,000
$25,000,000
$30,000,000
$35,000,000
Sector:Support ServiceCommercial-IndustrialResidential
Conservation Expenditures in Year
Nominal Dollars
Notes
1. Expenditures are aggregated from the conservation program entries in SECTIONS II—V of this report.
Program expenditures reflect work completed, from which energy savings are being acquired. Excluded are obligations and encumbrances for work contracted and in progress. For example, commercial construction projects can take up to three years from initial design or audit to project completion and building occupation. Hence these expenditure totals do not equal those from general accounting ledgers. The expenditure figures are also not net of BPA reimbursements, customer loan repayments, or other sources of revenue.
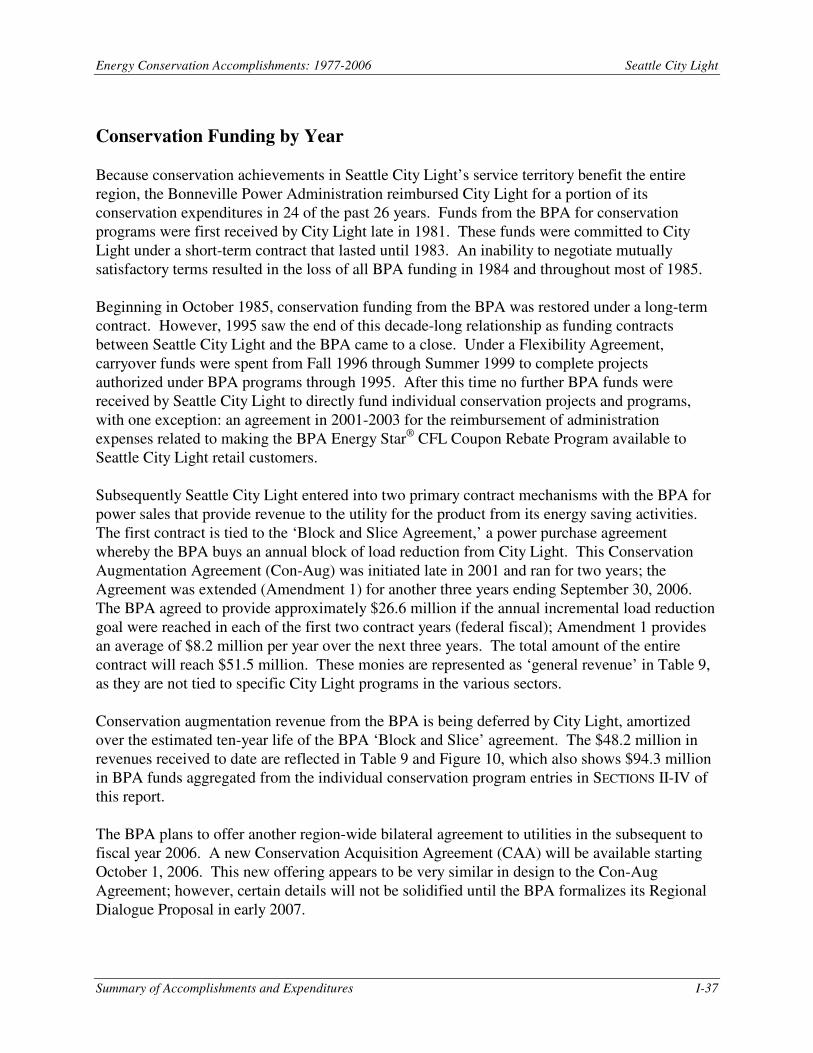
Energy Conservation Accomplishments: 1977-2006 Seattle City Light
Summary of Accomplishments and Expenditures I-37
Conservation Funding by Year Because conservation achievements in Seattle City Light’s service territory benefit the entire region, the Bonneville Power Administration reimbursed City Light for a portion of its conservation expenditures in 24 of the past 26 years. Funds from the BPA for conservation programs were first received by City Light late in 1981. These funds were committed to City Light under a short-term contract that lasted until 1983. An inability to negotiate mutually satisfactory terms resulted in the loss of all BPA funding in 1984 and throughout most of 1985. Beginning in October 1985, conservation funding from the BPA was restored under a long-term contract. However, 1995 saw the end of this decade-long relationship as funding contracts between Seattle City Light and the BPA came to a close. Under a Flexibility Agreement, carryover funds were spent from Fall 1996 through Summer 1999 to complete projects authorized under BPA programs through 1995. After this time no further BPA funds were received by Seattle City Light to directly fund individual conservation projects and programs, with one exception: an agreement in 2001-2003 for the reimbursement of administration expenses related to making the BPA Energy Star® CFL Coupon Rebate Program available to Seattle City Light retail customers. Subsequently Seattle City Light entered into two primary contract mechanisms with the BPA for power sales that provide revenue to the utility for the product from its energy saving activities. The first contract is tied to the ‘Block and Slice Agreement,’ a power purchase agreement whereby the BPA buys an annual block of load reduction from City Light. This Conservation Augmentation Agreement (Con-Aug) was initiated late in 2001 and ran for two years; the Agreement was extended (Amendment 1) for another three years ending September 30, 2006. The BPA agreed to provide approximately $26.6 million if the annual incremental load reduction goal were reached in each of the first two contract years (federal fiscal); Amendment 1 provides an average of $8.2 million per year over the next three years. The total amount of the entire contract will reach $51.5 million. These monies are represented as ‘general revenue’ in Table 9, as they are not tied to specific City Light programs in the various sectors. Conservation augmentation revenue from the BPA is being deferred by City Light, amortized over the estimated ten-year life of the BPA ‘Block and Slice’ agreement. The $48.2 million in revenues received to date are reflected in Table 9 and Figure 10, which also shows $94.3 million in BPA funds aggregated from the individual conservation program entries in SECTIONS II-IV of this report. The BPA plans to offer another region-wide bilateral agreement to utilities in the subsequent to fiscal year 2006. A new Conservation Acquisition Agreement (CAA) will be available starting October 1, 2006. This new offering appears to be very similar in design to the Con-Aug Agreement; however, certain details will not be solidified until the BPA formalizes its Regional Dialogue Proposal in early 2007.

Energy Conservation Accomplishments: 1977-2006 Seattle City Light
I-38 Summary of Accomplishments and Expenditures
The second contract between the BPA and City Light is also tied to an existing power sales agreement. The Conservation and Renewables Discount provides a discount to City Light’s federal power purchase if the utility makes investments in energy efficiency or renewable energy resources; investments are accumulated as credits against the total discount available. This contract was initiated in early 2001 and can extend through the BPA federal fiscal year 2006. The total discount available to City Light over the contract period is about $10.7 million, with the discount applied to the monthly BPA power bill. The discount is recorded by City Light as wholesale power revenue; through the end of 2005, $10.7 million in available credit had accumulated. By claiming over $10.7 million in credit, City Light effectively had secured the entire discount in 2005 and closed out this agreement. About 38% of the credit is for energy conservation, 36% for renewables (wind), 24% for donations to qualifying organizations or activities, and 1% for administration. These funds are not reflected in Table 9 or Figure 10. A new Conservation Rate Credit (CRC) program will be offered by the BPA in fiscal year 2006, which began October 1, 2006. In many regards this will be administratively very similar to the preceding Conservation and Renewables Discount. The new offering will differ by placing cost-effectiveness parameters on energy efficiency measures where previously none existed. City Light again will use renewables to secure a portion of the CRC and use a combination of energy efficiency and donations to secure the credit. The history of BPA conservation funding for specific City Light programs is clear from Table 9. In total, BPA conservation program funding from 1981 through 1999 comprised 22% of the total conservation programs budget over the past two decades, 25% of actual total conservation
expenditures, and 29% of actual direct program-delivery expenditures (excluding general support costs). While City Light received over $94 million in BPA conservation program funds during 1981-1999, the bulk of this was provided during two discrete periods. During 1981-1983, 43% of City Light’s conservation program expenditures were covered by BPA funds; during 1992-2000, BPA funds comprised 40%. Over the intervening eight-year period, BPA funding reimbursed only 19% of City Light expenditures for conservation. Other partners besides the Bonneville Power Administration have provided funding for Seattle conservation resources. The Lighting Design Lab (LDL) is a regional facility budgeted and operated by Seattle City Light. Outside grants have been received from other utilities and organizations to partially support the LDL. From 1989 through 2006, these non-BPA revenues supporting the Lighting Design Lab have totaled $6,257,616, including in-kind grants of products. Beginning in 1998, the Lab’s operation costs have been funded 71% by the Northwest Energy Efficiency Alliance of regional utilities and agencies, while Seattle City Light continues to provide about 24% in operational support.

Energy Conservation Accomplishments: 1977-2006 Seattle City Light
Summary of Accomplishments and Expenditures I-39
Table 9
BPA CONSERVATION FUNDS AND REVENUES BY YEAR (1)
Industrial– General BPA $ as % of Residential Commercial Government Conservation Total of Total SCL Program Program Program Purchase All Funds & Program (2)
Year Funds Funds Funds Revenue Revenues Expenditures
1977 $0 $0 $0 $0 $0 0.0% 1978 0 0 0 0 0 0.0 1979 0 0 0 0 0 0.0 1980 0 0 0 0 0 0.0 1981 50,762 40,073 0 0 90,835 2.7 1982 3,599,926 103,589 1,109,813 0 4,813,328 49.5 1983 4,539,191 268,127 2,219,626 0 7,026,944 48.6 1984 0 0 0 0 0 0.0 1985 159,590 0 80,663 0 240,253 2.4 1986 2,677,085 87,039 54,624 0 2,818,748 26.8 1987 601,761 471,201 0 0 1,072,962 11.0 1988 484,673 1,666,837 0 0 2,151,510 20.2 1989 705,689 2,208,014 0 0 2,913,703 27.7 1990 463,381 2,160,570 0 0 2,623,951 23.8 1991 777,040 3,100,055 0 0 3,877,095 32.9 1992 2,093,095 3,789,011 137,912 0 6,020,018 43.0 1993 2,591,091 9,576,614 504,456 0 12,672,161 63.5 1994 3,026,752 10,206,948 593,056 0 13,826,756 59.3 1995 4,143,574 8,098,110 1,367,049 0 13,608,733 53.6 1996 2,111,635 7,066,353 1,154,526 0 10,332,514 57.1 1997 1,440,949 3,528,591 508,336 0 5,477,876 39.8 1998 386,442 2,505,684 169,707 0 3,061,833 17.2 1999 38,750 1,479,310 162,000 0 1,680,060 9.4 2000 0 0 0 0 0 0.0 2001 14,273 0 0 3,332,671 3,346,944 13.5 2002 17,898 0 0 13,330,684 13,348,582 72.9 2003 0 0 0 14,049,213 14,049,213 80.4 2004 0 0 0 8,628,000 8,628,000 47.3 2005 0 0 0 4,825,323 4,825,324 26.4 2006 0 0 0 4,010,862 4,010,862 22.0
Total $29,923,557 $56,356,126 $8,061,768 $48,176,753 $142,518,204 36.1%
Notes 1. BPA conservation program funds are aggregated from the conservation program entries in SECTIONS II-V of
this report. Amounts may differ from those shown in financial statements because the revenues reported by program are based on invoices sent to the BPA during each calendar year. General accounting statements may include additional amounts accrued at year-end which were not yet invoiced. BPA general funds are stated by scheduled date of conservation augmentation payment under the ‘Block and Slice Agreement’.
2. Total program expenditures from Table 8 (fifth column), the denominator for this percentage, include only
direct program costs and exclude support services.

Energy Conservation Accomplishments: 1977-2006 Seattle City Light
I-40 Summary of Accomplishments and Expenditures
Figure 10
19
77
19
78
19
79
19
80
19
81
19
82
19
83
19
84
19
85
19
86
19
87
19
88
19
89
19
90
19
91
19
92
19
93
19
94
19
95
19
96
19
97
19
98
19
99
20
00
20
01
20
02
20
03
20
04
20
05
20
06
$0
$5,000,000
$10,000,000
$15,000,000
$20,000,000
$25,000,000
$30,000,000
$35,000,000
for SCL Program CostsCustomer RepaymentsRegional AgenciesCmcl-Indl BPA$Residential BPA$
External Conservation Program Funding
Revenue in Nominal Dollars
Notes
1. External funding for individual programs is comprised not only of monies received from the Bonneville
Power Administration and other regional agencies, but also of utility cost repayments from customers who participated in three residential weatherization programs. These funds are compared to Seattle City Light program delivery expenditures for all 30 programs to illustrate the portion of conservation costs reimbursed by the region and participants. The difference has been funded through customer rates, through municipal bonds for capital improvements and, most recently, from debt and current revenues. Conservation expenditures are deferred and amortized over a 20-year period in accordance with City Council-passed resolutions. This figure excludes general (non-program specific) funding received from the BPA for conservation augmentation under the ‘Block and Slice’ power purchase agreement.

Energy Conservation Accomplishments: 1977-2006 Seattle City Light
Summary of Accomplishments and Expenditures I-41
Besides the BPA and NEEA, external funding partners for the Lab over the years have included B.C. Hydro, California Energy Commission, Idaho Power, Natural Resources Defense Council, Northwest Conservation Act Coalition, Northwest Power Planning Council, Pacific Power, Puget Sound Power and Light Company, Snohomish Public Utilities District No.1, Tacoma City Light, University of Washington, Washington State Energy Office, and Washington Water Power. The Northwest Energy Efficiency Alliance has also lent support to City Light’s Retail-Wise Lighting and Appliance programs. The value of this support was estimated at $2,515,100 in 1997-2006, chiefly in the form of informational services, sales promotion, and contractor management of manufacturer rebates. The story of external funding for conservation savings acquired by Seattle City Light, in relation to utility spending, is told in Figure 10 (in nominal dollars). Besides BPA and external funding, revenues received from participating customers have also offset residential program costs. Table 10 describes cost offsets for three conservation programs: Home Energy Loan, Multifamily Conservation (Standard-Income and Common-Area Lighting), and Warm Home. Two of these programs were designed to receive from customers excess payments that were passed through to contractors, to cover job costs unrelated to energy benefits (e.g., upgrade to the aesthetic quality of window replacements). From 1981 through 1996 these excess payments totaled about $8.9 million, amounting to 13% of total expenditures in the named programs (17% of measure costs only). Excess payments in these programs comprised 6% of residential program expenditures overall. This program mechanism was discontinued by 1999. Revenues are also received from customer repayments, either up front or on loan contracts established by the same set of programs. Seattle City Light financed loans to residential customers since 1981 through the Home Energy Loan Program (HELP), since 1986 through the Multifamily Conservation Program for Standard-Income buildings, since 1993 through the Multifamily Common-Area Lighting Program, and since 1994 through the Warm Home Program. City Light stopped establishing new loans in 1998. However, customers continue to carry some annual current payment obligations for work contracted during each year. Table 10 presents the total expenditures for these programs, along with BPA funding, customer excess cost payments, customer debt that was financed, and debt repayments to date. The few final payments on outstanding loans are scheduled for 2007, which will bring the last outstanding loans to a close.

Energy Conservation Accomplishments: 1977-2006 Seattle City Light
I-42 Summary of Accomplishments and Expenditures
Table 10
OTHER SOURCES OF REVENUE FOR WEATHERIZATION (LOAN) PROGRAMS BY YEAR (1)
Program Program BPA Funds Participant Participant Participant Participant
Expenditures Expenditures for Admin. Excess Cost Debt Debt Re- Total Costs
Year for Admin. for Measures. & Measures Payments (2) Financed Payments (2) To Date (2)
1981 $163,479 $257,949 $0 $68,900 $189,049 $4,162 $73,062 1982 390,572 2,485,304 746,937 663,400 1,217,687 24,014 687,414 1983 1,032,068 4,471,027 1,522,982 1,118,035 2,077,530 158,870 1,276,905 1984 1,164,754 2,540,742 0 678,200 1,862,542 67,887 746,087 1985 1,053,891 2,697,823 118,430 720,200 1,897,968 617,941 1,338,141 1986 1,158,908 3,836,677 1,518,391 974,721 1,614,810 3,987,183 4,961,904 1987 1,020,090 2,468,148 40,072 561,786 1,875,660 2,813,770 3,375,556 1988 1,034,322 2,848,020 29,088 374,722 2,471,788 2,368,638 2,743,360 1989 1,015,351 2,199,446 73,532 524,353 1,675,093 1,793,703 2,318,056 1990 940,450 3,455,101 30,028 586,547 2,868,554 2,785,272 3,371,819 1991 877,989 2,937,643 108,395 792,818 2,144,825 2,818,007 3,610,825 1992 815,725 2,045,215 287,533 428,180 1,415,540 2,311,760 2,739,940 1993 1,571,192 3,899,325 383,122 544,059 3,028,674 2,673,461 3,217,520 1994 1,646,238 5,320,437 461,872 318,012 3,558,342 1,616,599 1,934,611 1995 1,630,085 7,213,232 3,198,719 261,727 1,188,961 1,184,565 1,446,292 1996 1,224,668 2,930,627 1,479,912 272,143 1,479,043 1,994,664 2,266,807 1997 871,069 2,095,365 834,371 0 1,230,583 1,208,909 1,208,909 1998 750,253 1,774,096 35,451 0 415,534 1,369,238 1,369,238
1999 — — 0 0 (–74,331) 911,402 911,402 2000 — — 0 0 (–220,472) 405,266 405,266 2001 — — 0 0 (–96,769) 242,647 242,647 2002 — — 0 0 41,944 217,973 217,973 2003 — — 0 0 (–6,099) 90,101 90,101 2004 — — 0 0 4,507 61,773 61,773 2005 — — 0 0 (–2,470) 38,452 38,452 2006 — — 0 0 (–1,361) 11,582 11,582
Total $18,361,104 $55,476,177 $10,868,835 $8,887,803 $31,857,132 $31,777,840 $40,655,643
Total % 25% 75% 15% 12% 43% 43% 55%
Measure % 100% 16% 57% 57% 73%
Notes
1. Seattle City Light received revenues from both the Bonneville Power Administration and customers participating in three conservation programs: the Home Energy Loan, Multifamily Conservation (Standard-Income and Common-Area Lighting), and Warm Home Programs. Funds received from the BPA were recorded in the Seattle Financial Management System (SFMS) as revenues by program; loan repayments are not, but rather go into the general revolving fund.
2. Other sources of revenue included excess payments from customers to Seattle City Light at the time of contract initiation (for measure-related costs not covered by program terms); immediate repayment to City Light for measures installed, where the utility acted as general contractor; and loan payments made over 5 to 10 years for measure costs financed after excess payments, immediate repayments, discounts, and BPA reimbursements had been credited to the customer’s project. Reported customer repayments reflect revenues received by City Light to date; the stream of payments on recent loans continues, with only $1,103 outstanding at the end of 2006.

Energy Conservation Accomplishments: 1977-2006 Seattle City Light
Summary of Accomplishments and Expenditures I-43
As Table 10 shows, 25% of expenditures in these programs paid for directly for program delivery, customer services, and other program administration; the remaining 75% was for measures installed. Participating customers paid excess costs averaging 12% of total program costs, immediately upon project completion (16% of measure costs). Another 43% of total program costs (57% of measure costs) was incurred as debt to Seattle City Light, payable immediately or financed for customers through Utility loans. Thus over the past 26 years, participating customers paid City Light directly for 73% of the measure cost of these three residential weatherization and lighting programs, as operated during 1981-1998. Combined with BPA funding, these funds covered 93% of the measure costs. The $3,861,046 of unreimbursed measure costs, added to program administrative costs, left Seattle City Light with 30% of the overall cost of these 1981-1998 programs. Data are not readily available on the present value of past loans and repayments in current year dollars. Thus, while it is inaccurate to report repayment of prior year expenditures in nominal dollars, the following financial information is presented for illustration. These data provide a sense of the degree to which the financed programs have repaid the ratepayers for bearing the costs of loans through City Light’s borrowing authority. Participating customer contracts from the weatherization and lighting program loans have resulted in the repayment during 1981-2006 of $32 million (nominal dollars). The amount of program expenditures repaid by participating customers has grown with time as more loan contracts are paid off. To date, customers have repaid over 99% of all amounts financed by loans and discounts through this set of programs. These repayments to date comprise 16% of residential program expenditures overall (including non-loan programs). Meanwhile during the past 26 years, BPA funding reimbursed 16% of expenditures in the affected loan programs, and 15% of residential expenditures overall. Thus about two-thirds of the cost ($128,116,215) of all residential programs to date has been borne by Seattle City Light ratepayers in general.
Total Residential Expenditures 1977-2006 $198,784,707 100%
� Bonneville Reimbursements ( 29,923,557) 15% � Costs Beyond Program Limits (excess) ( 8,887,803) 4% � Customer Debt Incurred to the Utility ( 31,857,132) 16%
Net Cost to Seattle City Light & Ratepayers $ 128,116,215 64%
Loans Outstanding December 31, 2006 $ 1,103

Energy Conservation Accomplishments: 1977-2006 Seattle City Light
I-44 Summary of Accomplishments and Expenditures
Conservation Plan Productivity by Year After 15 years of operating successful conservation programs, Seattle City Light wrote the 1992 Conservation Implementation Plan (CIP) outlining a strategy for acquiring 100 aMW of new programmatic electric energy savings over the upcoming decade. Since 1997, City Light’s conservation programs have operated under the direction provided by the Energy Management
Services (EMS) Plan, which replaced the CIP. The EMS Plan was developed in response to a variety of industry developments including an evolving, deregulated, competitive business environment and the curtailment of conservation funding from the Bonneville Power Administration. The EMS Plan outlined a portfolio of conservation programs and services designed to meet several city-wide policy directives, including revised annual energy savings goals of six average megawatts (6 aMW) of load reduction continuing through the period 1997-2002. The Seattle City Council endorsed the EMS Plan on September 26, 1996, with the adoption of Resolution 29427. This resolution highlighted specific City Council directives beyond the annual savings goals, including the following: � Offer comprehensive energy management services � Support neighborhood-wide integrated resource conservation � Offer an industrial DSM pollution control service � Provide leadership in the Municipal Resource Conservation Program � Deliver services in collaboration with other City Departments Since 1997, annual goals have been revised slightly year-by-year to accommodate regional market transformation activities, new service offerings, and constraints on budgets and funding. City Light’s Energy Management Services/Conservation Resources Division has had the responsibility of carrying out the goals established in the EMS Plan. The primary directive of the Plan is to acquire cost-effective energy conservation.
Policy Direction and Planning
While other utilities stepped back from investments in conservation during the 1990s, City Light was visionary in keeping its conservation infrastructure and program delivery system in place, recognizing the long-term value of the conservation resource. In 2000 the City reviewed current utility efforts with an eye to doubling its ambitious conservation goals as soon as possible. In 2001 the utility acted expeditiously to accelerate conservation acquisition. In April 2000, the City of Seattle adopted an Earth Day Resolution initiating the City’s commitment to reducing greenhouse gases. City Light is directed to meet growing Seattle’s electric needs with no net increase in greenhouse gas emissions, by using cost-effective energy efficiency and renewable resources to meet as much load growth as possible.

Energy Conservation Accomplishments: 1977-2006 Seattle City Light
Summary of Accomplishments and Expenditures I-45
In June 2000, the Energy Management Services Division completed a Conservation Potential
Assessment to identify the cost-effective energy conservation potential within its service territory. Aided by the Northwest Power Planning Council, this effort produced the following key findings. � Approximately 180 to 260 average megawatts (aMW) of cost-effective energy conservation
is available over the next two decades. This potential is available in all sectors, roughly proportional to energy sales.
� The greatest potential is in the commercial sector. By end use, lighting offers the greatest potential, followed by space heat, HVAC (heating, ventilation and air conditioning), and refrigeration.
� The majority of energy savings are in ‘lost opportunities’, which are only cost-effective or feasible to acquire at the time of purchase or construction.
In September 2000, Seattle City Light published a Strategic Resource Assessment to outline options for meeting load growth over the next ten years. It committed to meet load growth consistent with the 2000 Earth Day Resolution, using energy efficiency and renewable resources. Seattle considers conservation its first-priority electric resource. As a result, City Light doubled its current conservation goal for the upcoming decade to acquire another 100 aMW of energy savings. The acceleration strategy doubled annual conservation goals from 6 aMW to 12 aMW and raised budgets from $18 million to $24 million. Meanwhile the utility determined to acquire an additional 100 aMW from renewable resources such as wind-power over the same ten-year period.
Program Review
Also in 2000, City Light contracted an independent and comprehensive review of demand side management accomplishments during the preceding three years, and of program efficiency in the current year. In general the consultants found that conservation division activities are operating well. Many of their recommendations were either already under development or have been considered as the Division moved into 2001 putting together its Conservation Acceleration package. The Conservation Program Review, completed around year-end 2000, found that the cost and energy savings data in the annual ENERGY CONSERVATION ACCOMPLISHMENTS report are accurate with respect to City Light data tracking systems. For many programs, savings estimates are conservative and may understate the true accomplishments. This is because the estimates often include one or more factors that decrease net savings (free riders, persistence, takeback) but do not include those that would increase net savings (free drivers, spillover effects). The savings estimates for several programs were found to be based on evaluations that are dated (over five years old). Also, cost-effectiveness measures for some programs include non-energy costs but exclude non-energy benefits, which if included would increase their apparent cost-effectiveness.

Energy Conservation Accomplishments: 1977-2006 Seattle City Light
I-46 Summary of Accomplishments and Expenditures
Progress Toward Acquisition Goals
From 1984 to 1991, total conservation expenditures remained stable in constant dollar (2006$) terms. The investment began to increase in 1992 with adoption of the Conservation Implementation Plan. This plan, endorsed by the Seattle City Council, called on Seattle City Light to meet all electric load growth in the next decade through conservation. A City ordinance was passed to increase the 1993 budget for immediate implementation of the Plan. Success in meeting Plan targets is measured in two ways. Contracts signed with customers reflect commitments to bring new resources on line in 1992-2008. Annual staff productivity is managed to meet customer service and contract goals. Projects completed during a given year reflect resources put into production and now generating energy savings. It is this measure, reported in Table 11, that shows Seattle City Light’s progress in capturing the conservation resource. The Conservation Implementation Plan called for acquiring an increment of 100.0 average megawatts (aMW) in energy savings by the year 2003 (beginning in 1992, in addition to the nearly 30.0 aMW then in production). The Energy Management Service Plan adopted in 1996 pushed that date out to 2006. Subsequently targets for 2001-2006 have been revised as depicted in Table 12. The Plan target for 2006 was to secure 7.63 aMW from projects contracted with customers (including T&D, transmission and distribution savings). This brings the 1992-2006 cumulative contracting target up to 118.68 aMW. Energy savings secured by contract in 1992-2006 (123.20 aMW) put City Light ahead of cumulative conservation acquisition targets by 4%. Projects authorized during 2005 in all sectors are now projected to bring in approximately 60,457 megawatt-hours (MWh). This will reduce daily energy loads by 7.26 aMW, with T&D savings incorporated. There were 0.02 aMW of energy savings in 2006 from non-incentive services to commercial and industrial customers. As a result, Seattle City Light achieved 96% of the 2006 goal for new conservation acquisitions. As shown in Table 11, the projects actually completed and put into service during 2006 saved 57,611 megawatt-hours, or 6.92 aMW with T&D savings. Cumulative conservation production in 1992-2006 is ahead of target with acquisition goals, due to over-production in prior years. So far, implementing the Plan has yielded total energy savings of 111.36 aMW from completed projects, plus 5.19 aMW from non-incentive projects. This impact is incremental over the 8.90 aMW still in production from pre-Plan conservation projects (down from nearly 30 aMW in 1991). The total average Utility load reduction due to programmatic conservation was 120.26 aMW in 2006.

Energy Conservation Accomplishments: 1977-2006 Seattle City Light
Summary of Accomplishments and Expenditures I-47
This estimate of conservation program energy savings excludes the impact of the Sustainable Design & Energy Code Programs. Inference from load forecasting by the Northwest Energy and Conservation Council suggests that 3.5-8.6 million square feet per year of commercial space has been newly constructed or renovated/remodeled in Seattle each year since 1986 (averaging 7.0 million in recent years). The commercial code has been revised twice since 1986, when regional and City energy codes began to take effect—in 1994, 2000, and again in 2004—with Seattle supplements that ‘go beyond’ the Washington State Energy Code. During the period 1987-1994, Seattle likely saved an incremental 0.73 aMW each year, rising to 2.59 aMW per year in 1995-2000, and about 3.26 aMW per year in 2001-2006, from the energy codes. By 2006, the cumulative impact of commercial new construction energy codes has likely been around 41 aMW. Because these estimates are very preliminary, they are not included in the following two tables.
Table 11
2006 PROGRESS TOWARD CONSERVATION GOALS (1)
2006 2006 First Year First Year Progress Customer Program Program Energy Load Toward 100
Sector Participants Expenditures Savings Reduction aMW Goal (MWh) (aMW) (aMW)
Residential 5,995 $5,469,457 9,289 1.12 30.54
Commercial /
Industrial / 709 $12,780,809 48,323 5.80 80.82 Government
All Sectors 6,704 $18,250,265 57,612 6.92 111.36
Notes
1. Actual energy savings are based on projects completed during 2006 rather than on contracted projects,
for which operational statistics are routinely reported by Seattle City Light. Progress is reported for 1992-2006 (plus ESD 1991) toward the incremental goal of 100 aMW by the year 2006. Completions have been adjusted, compared to earlier reports, based on evaluation review of program records. There were 0.02 aMW of energy savings in 2006 from non-incentive services to commercial and industrial customers.

Energy Conservation Accomplishments: 1977-2006 Seattle City Light
I-48 Summary of Accomplishments and Expenditures
Table 12
SEATTLE CITY LIGHT CONSERVATION PLAN ACCOMPLISHMENTS
Incremental Projects Non- Projects Cumulative First Year Authorized Incentive Completed Projects Goal in Year (1) Impacts (1) in Year (2) Completed
Year (aMW) (aMW) (aMW) (aMW) (aMW)
1991 3.20 3.21 0.00 1.08 1.08 1992 7.90 9.63 0.00 7.12 8.20 1993 6.50 10.36 0.00 7.07 15.27 1994 7.00 11.00 0.00 8.08 23.35 1995 9.50 9.36 0.00 7.99 31.35 1996 7.68 8.36 0.24 6.91 38.26 1997 6.01 5.35 1.63 4.78 43.04 1998 6.70 6.40 0.08 8.03 51.07 1999 6.59 4.69 2.11 7.51 58.58 2000 6.59 5.24 0.21 5.74 64.31 2001 10.52 13.62 0.17 10.95 75.26 2002 9.47 6.79 0.14 9.00 84.26 2003 7.63 7.15 0.28 6.14 90.40 2004 8.15 9.45 0.31 7.41 97.81 2005 7.63 5.34 0.00 6.63 104.44 2006 7.63 7.26 0.02 6.92 111.36
1991-2006 118.68 123.20 5.19 111.36 —
Notes
1. A 5.2% credit for savings on transmission and distribution is included in energy savings presented as
average megawatts of load reduction. The cumulative goal through 2006 exceeds 100 aMW to allow for removals from service of measures with expired lifetimes. Besides the program goals cited here, City of Seattle conservation goals for 2002-2006 also include an additional 3.16 aMW annual savings from stricter new construction energy codes.
Authorizations have been revised to reflect cancellations of new construction projects contracted in
1992-2004. New non-incentive services provided in 1996-2006 added a reported 5.19 aMW of savings from commercial and industrial customers.
2. Cumulative progress is reported for projects completed in the years 1992-2006 (plus ESD 1991),
toward the incremental goal of 100 aMW by the year 2006. Completions have been adjusted, compared to earlier reports, based on evaluation review of program records. Non-incentive impacts are excluded from cumulative progress toward goals.

Energy Conservation Accomplishments: 1977-2006 Seattle City Light
Summary of Accomplishments and Expenditures I-49
Residential savings received a large boost in 1992 from the Home Water Savers Program, which reached into nearly every home in the City. Residential savings received another boost in 2001 from the Conservation Kit distribution described in the Neighborhood Power entry to this report, and from the Kit spillover retail purchasing described in the RetailWise entry. Another major Conservation Kit distribution was mounted in 2006 with homes that did not receive the 2001 Kits. During 1993 through 2006, however, the most significant gains were made in the commercial sector. In 2001 the major impetus of the 10+10 Bonus Plan for business customers drove savings up during the period of the West Coast energy crisis. By both annual and cumulative standards, the energy savings acquired under the CIP and EMS Plans are on track and ahead of schedule. Program expenditures reported in Table 11 include City Light’s payments for measures and incentives to customers, as well as the cost of delivering programs. Program costs are counted before the Utility receives program-specific reimbursements from the Bonneville Power Administration (BPA) or other outside parties. Also not counted in this measure are customer costs that accompany program participation (in excess of conservation incentives), and indirect administrative support expenses. The first-year energy savings acquired in 2006 came at a program cost to Seattle City Light of $18 million. Over the lifetime of conservation measures, the simple levelized program cost for measures installed during 2006 will be about 25 mills per kilowatt-hour (kWh), or 2.5¢. (A mill is one-tenth of a cent.) This calculation is based on the cost to the Utility, not adjusting for funds supplied by customers (excess co-payments and loan repayments) or by outside agencies. The Conservation Resources Division serves customers in three building sectors: residential, commercial, and industrial. The simple levelized program cost of savings from work completed during 2006 is projected for the Residential sector at 37 mills per kWh. Excluding low-income programs these costs are about 30 mills. These calculations do not adjust for funding or repayment offsets. Program costs from measures installed in 2006 will be about 25 mills per kWh from Commercial projects and 15 mills per kWh from Industrial projects. These are all simple levelized costs: program cost divided by the present value of lifetime energy savings, stated in 2006 dollars, unadjusted for funding or customer payment offsets. Comparisons in Figure 11 portray the productivity of the Conservation Resources Division over the years. This figure plots together three key conservation program indicators: � Conservation staff in ‘full-time equivalents’ (from Table 7); � Annual expenditures for conservation activities, adjusted for inflation (Table 8); and, � ‘Lifetime energy conservation savings’ achieved per year—a measure that attributes to each
calendar year the first-year energy savings, multiplied by the average residual measure life, for that year’s participants.
Energy Conservation Accomplishments: 1977-2006 Seattle City Light
I-50 Summary of Accomplishments and Expenditures
This graph’s rendition of savings differs from that of Figure 5 in one key regard. Figure 11 assigns all savings, present and future, to the year in which measures were installed, for purposes of better aligning costs and savings. This allows productivity to be evaluated per unit of investment (staff effort and budget-year dollars) in the year when measures were installed. By contrast, Figure 5 depicts cumulative energy savings spread out over the years when they have actually been realized.
Figure 11
19
77
197
8
197
9
198
0
198
1
198
2
198
3
198
4
198
5
198
6
198
7
198
8
198
9
199
0
199
1
199
2
19
93
199
4
199
5
199
6
199
7
199
8
199
9
20
00
200
1
200
2
200
3
200
4
200
5
200
6
$0
$5,000,000
$10,000,000
$15,000,000
$20,000,000
$25,000,000
$30,000,000
$35,000,000
0
20
40
60
80
100
120
140
0
200,000
400,000
600,000
800,000
1,000,000
1,200,000
1,400,000
Life MWHStaffingExpenditures
Conservation Indicators
Expenditures (Nominal) Staffing (FTEs)
Lifetime Savings (MWh)

Energy Conservation Accomplishments: 1977-2006 Seattle City Light
Summary of Accomplishments and Expenditures I-51
Conservation Partners Seattle City Light has worked with a variety of partners over the years to accomplish the mission of bringing energy efficiency into every home and business in the service area. Foremost among those partners has been the Pacific Northwest federal power authority, the Bonneville Power Administration (BPA).
The City Light—BPA Relationship The BPA is a federal power-marketing agency that developed and distributes power from regional hydroelectric projects. Under the Pacific Northwest Electric Power Planning and Conservation Act of 1980 (the Regional Power Act), the BPA is responsible to provide for the electricity needs of its customers. The Act established conservation as the first priority resources to meet those needs. In 1977 the BPA promulgated its first conservation ‘buy-back’ provisions for utilities that purchased its power. The power sales contract between Seattle City Light and the BPA has been structured so that whenever conservation measures are installed in City Light’s service area for whatever reason, the BPA’s obligation to service City Light’s electricity needs is reduced. This means that BPA ratepayers receive the benefits of conservation in Seattle’s service area while Seattle ratepayers forego inexpensive BPA power. For this reason the BPA has paid a substantial portion of the costs of conservation acquired by City Light during the period 1982-1999. The BPA provided no funding for City Light’s early programs from 1977 to 1981. A short-term contract was established in 1981 to fund water heating and lighting conservation programs. The BPA’s subsequent funding was inconsistent and dropped off considerably in 1984 through 1991. The BPA projected energy capacity deficits by 1983, but the expected shortfall did not materialize, and in 1984 City Light and the BPA were unable to negotiate a satisfactory funding agreement. Seattle shouldered more than its fair share of conservation costs during the 1980s due to its commitment to maintain a viable conservation resource during the period of regional surplus. City Light focused on building capability, preserving the conservation infrastructure, and mitigating lost opportunities. As the regional surplus failed in the late 1980s, the BPA once again provided funding for conservation. Between 1985 and late 1992, the BPA provided full conservation cost reimbursement to utilities that bought all their power from the BPA, but only partial reimbursement to utilities that generated a portion of their own resources, such as City Light. Prior to late 1992 City Light received 75% reimbursement of qualifying conservation costs, or otherwise shared costs through an equivalent in-kind obligation.

Energy Conservation Accomplishments: 1977-2006 Seattle City Light
I-52 Summary of Accomplishments and Expenditures
The BPA amended its cost-sharing policy in late 1992. Therefore City Light expected full funding for conservation programs because they directly benefit the BPA and the region. City Light sought 100% coverage, although this ideal has rarely been achieved in practice. Beginning in the BPA fiscal year 1993, cost sharing was increased to 100% of ‘qualifying’ incentive payments and administration expenses. Actual BPA funding has ranged from 9% (1999) to 60% (1994) of total City Light programmatic conservation expenses. In the early 1990s, City Light and the BPA established contracts that cover all the major program areas of City Light’s Conservation Implementation Plan for energy management services. These include single-family, multifamily, appliance, commercial, and industrial energy efficiency programs. During the 1990s energy forecasts predicted an energy balance that often dips into deficit over a 20-year horizon. The BPA’s U.S. Treasury borrowing authority, however, had reached its limits. To supplement this authority, in 1993 the BPA asked City Light to borrow to provide its own capital for conservation investments. The BPA would repay the loan over a specified period of time. In 1994 the Seattle City Council approved a Conservation Resource Acquisition and Financing Agreement (the Third Party Financing Agreement, or 3PF) between City Light and the BPA. Under the terms of this agreement, City Light agreed to provide front-end financing of its BPA-sponsored conservation programs, using the proceeds of bond issues as the main source of funding. The BPA, for its part, agreed to pay for its share of program costs with interest. In this way the BPA could take advantage of City Light’s lower tax-exempt borrowing rate and conserve its limited authorization to borrow from the U.S. Treasury. The BPA agreed to share the savings from the lower interest cost by increasing its funding of the conservation programs. This agreement became effective in June 1994. The follow-on Flexibility Agreement allowed BPA funds to be paid out in subsequent years for projects contracted prior to 1996. BPA programs were established by contracts that traditionally provided measure specifications and limited the delivery design of utility programs. Many BPA programs required receipt-and-acceptance inspections. BPA funding programs in which City Light has participated over the years are listed by contract below, along with the names of City Light programs which received partial funding from the BPA.
1981–1983 SHORT-TERM CONTRACT
Blanket Seattle, BPA Commercial Tank Wrap, Lighting Incentive, Street and Area Lighting Programs

Energy Conservation Accomplishments: 1977-2006 Seattle City Light
Summary of Accomplishments and Expenditures I-53
1982–1983, RESIDENTIAL WEATHERIZATION PROGRAM CONSERVATION AGREEMENT, 1985–1990 ENERGY BUY-BACK PROGRAM—EBB
Home Energy Loan, Low-Income Electric Programs; Multifamily Conservation Programs: Low-Income and Standard-Income (pilot)
1985–1986 LONG-TERM CONTRACT
Street and Area Lighting Program
1986–1990 COMMERCIAL INCENTIVES PILOT PROGRAM CONTRACT—CIPP
Commercial Incentives Pilot Program
1987–1992 DATA GATHERING PROJECT GRANT (Oct.87–Nov.92)
Home Energy Loan, Low-Income Electric Programs; Multifamily Conservation Program: Low-Income
1987–1994 EARLY ADOPTER PROGRAM CONTRACT—EAP (Sep.87–Dec.94)
City of Seattle Energy Code Major Projects Requirement, Energy Code Program
1988–1992 ENERGY SMART DESIGN ASSISTANCE PROGRAM, OPTION I UTILITY AGREEMENT—ESD (Sep.88–Sep.92)
Energy Smart Design Program
1990–1995 RESIDENTIAL WEATHERIZATION CONSERVATION ACQUISITION AGREEMENT, WEATHERWISE PROGRAM—WEATHERWISE (Sep.90–Sep.95)
Home Energy Loan, Low-Income Electric Programs; Multifamily Conservation Programs: Low-Income and Standard-Income
1991–1991 SUPER GOOD CENTS PROMOTIONS PROGRAM GRANT—SG¢ (Jul.91–Dec.91)
Long-Term Super Good Cents Program
1991–1992 ENERGY SAVINGS PLAN CONSERVATION AGREEMENT—E$P (Oct.91–Sep.92)
Energy Savings Plan Program
1991–1995 COMMERCIAL RESOURCE ACQUISITION AGREEMENT, ENERGY SMART DESIGN PROGRAM: LONG TERM CONTRACT—ESD (Sep.92–Sep.95)
Energy Smart Design Program
1992–1995 ENERGY SAVINGS PLAN INDUSTRIAL CONSERVATION AGREEMENT—E$P (Oct.92–Sep.95)
Energy Savings Plan Program
Energy Conservation Accomplishments: 1977-2006 Seattle City Light
I-54 Summary of Accomplishments and Expenditures
1992–1995 RESIDENTIAL CONSERVATION AGREEMENT—RCA (Jan.92–Sep.95)
Energy Efficient Water Heater Rebate (Water Heaters), Home Water Savers (Showerheads), Long-Term Super Good Cents Programs (Super Good Cents), Energy Code Program (Washington State Options)
1993–1995 CONSERVATION RESOURCES ACQUISITION AGREEMENT: TARGETED ACQUISITION MULTIUNIT RETROFIT PROGRAM (TARGETED ACQUISITION PROGRAM)—TAP (MAR.93–SEP.95)
Multifamily Conservation Programs: Standard-Income and Common-Area Lighting
1994–1995 THIRD PARTY FINANCING AGREEMENT—3PF (Jun.94–Sep.95)
All programs excluding the Residential Efficiency Standards, General Service Efficiency Standards, and Lighting Design Lab
1995–1999 FLEXIBILITY AGREEMENT FOR PAYMENT UNDER PRIOR CONTRACTS (Sep.95–Aug.99)
Multifamily Conservation Programs: Low-Income, Standard-Income and Common-Area Lighting; Low-Income Electric Program; Warm Home Program; Long-Term Super Good Cents Programs (Super Good Cents), Energy Code Program (Washington State Options); Energy Smart Design Program; Energy Savings Plan Program; and Lighting Design Lab
2001-2003 ENERGY STAR®
LABELED COMPACT FLUORESCENT LAMP COUPON REBATE AGREEMENT (Aug.01–Sep.03)
Coupon Rebate Programs (reported in Residential RetailWise Lighting and Appliances).
2001–2006 CONSERVATION AUGMENTATION AGREEMENTS (Oct.01–Sep.03; Amendment Oct.03–Sep.06)
Power purchase based on firm power acquired by ongoing City Light Programs: Multifamily Conservation Programs: Low-Income, Standard-Income (weatherization), and Common-Area Lighting; Low-Income Electric Program; Neighborhood Power Program; Energy Efficient Water Heater Rebates; Built Smart; WashWise and LaundryWise; Energy Smart Services Program; and Smart Business
In 1994-1995 the federal government held hearings to determine whether the BPA should continue to receive ongoing federal support. City Light began preparing to be on its own without BPA support for its energy management service programs. With the finalization of Flexibility Agreement payments in 1999, Seattle City Light conservation programs became independent of the BPA. In 2001 the two utilities agreed that Seattle City Light would make available to its retail customers the BPA Energy Star® CFL Coupon Rebate Program, for a small reimbursement of administrative expenses to City Light. The Conservation Augmentation Agreement initiated a new phase in the relationship between Seattle City Light and the federal power authority, as this power purchase does not directly fund individual utility conservation projects or programs. Rather, based upon attainment of an overall average load reduction goal from ongoing City Light conservation programs, the utility agrees to reduce BPA power purchases to which is entitled, in the amount of firm power acquired by completed conservation projects in each year covered by the contract.

Energy Conservation Accomplishments: 1977-2006 Seattle City Light
Summary of Accomplishments and Expenditures I-55
Collaborative Action
During 2005 the Conservation Resources Division continued many partnering efforts, and also undertook a number of new collaborations. In addition to serving on several City interdepartmental teams, the Division has significant ongoing and project-specific ties to other City Departments and outside entities such as other utilities, other governmental agencies, other environmental and energy efficiency-related organizations, and education institutions, as well as trade allies in the private sector. These symbiotic relationships supply many benefits for participants—a principal benefit being the leveraging of resources. Examples of City Light’s ongoing collaborative action relationships include the following. Other City Departments
SEATTLE OFFICE OF HOUSING (OH): This office administers and operates programs funded by City Light to weatherize single-family and multifamily residential buildings. SEATTLE PUBLIC UTILITIES (SPU): City Light and SPU teamed up on several ongoing and special efforts during 2004-2005. They shared funding of the WashWise program to promote retail purchases of resource-efficient washing machines, and funding of the LaundryWise program to promote resource-efficient washing machines in common area laundry rooms of multifamily buildings. The two departments collaborated on multi-resource conservation referrals through the Built Smart program; on implementation of the Home Utility Profile Service; and on Facility Assessments for commercial and industrial customers. City Light refers multifamily and small business customers to the SPU Toilet Rebate program. SEATTLE PARKS & RECREATION (PARKS): The Parks Department convened a Utility Summit in 2005 with Seattle City Light, Seattle Public Utilities, and Puget Sound Energy, to plan a multi-year effort to increase efficiency of electricity, natural gas, and water resource consumption. SEATTLE FLEETS & FACILITIES: In 2005, City Light delivered conservation services to new public buildings such as a fire station, community center, and branch library, as well as the central library downtown. OH, SPU, AND OTHER CITY DEPARTMENTS: City Light delivers Neighborhood Power projects with partners that also include the Mayor of Seattle, Mayor’s Office for Senior Citizens, Office of Neighborhoods (Clean and Green Seattle Initiative), Seattle Police Department (Crime Prevention Unit), and Department of Parks and Recreation. Local neighborhood partners in 2004 included the Ballard District Council, Ballard Chamber of Commerce, and Ballard High School; as well as the Southeast District Council, North Beacon Community Council, Rainier Chamber of Commerce, and International District Business Improvement Area. Workshops were conducted in collaboration with the American Lung Association, The Re-Store, Crown Baptist Church, International Drop-In Center, Filipino Community Center, and Environment Justice

Energy Conservation Accomplishments: 1977-2006 Seattle City Light
I-56 Summary of Accomplishments and Expenditures
Network in Action. Similar efforts ensued in the North Rainier / International District and University (of Washington) District neighborhoods during 2004-2005.
DEPARTMENT OF PLANNING & DEVELOPMENT (DPD): City Light performs ongoing work to update, revise and implement the Seattle Energy Code and the Washington State Energy Code, as well as review and approve projects for compliance. City Light continues to fund 3.8 full-time equivalent positions at DPD (formerly DCLU) for energy code development, implementation, and enforcement. SEATTLE OFFICE OF SUSTAINABILITY AND ENVIRONMENT: This office has the lead coordination role for the City of Seattle’s sustainable development effort. Within this context, City Light participated in City interdepartmental workgroup sessions to develop strategies for a Sustainable Lake Union neighborhood. City Light staff in 2004 served on the City Green Building Team, working with DPD, SPU, Parks, and Executive Services Departments, on new City facilities. City Light staff members also serve on the City Environmental Coordinating Committee. One staff member transferred from City Light to DPD in 2005, to more closely coordinate activities. CITY LIGHT’S ACCOUNT EXECUTIVE OFFICE AND OTHER INTERNAL UNITS: Conservation Resources Division staff work internally on creative and flexible solutions to help key customers manage energy, develop emergency use reduction plans, and get advance warning of rate hikes. Low-income/Affordable Housing Providers
SEATTLE HOUSING AUTHORITY (SHA) & KING COUNTY HOUSING AUTHORITY (KCHA): In 2005, City Light funding of Office of Housing low-income weatherization programs (retrofit), and the Built Smart Program for Affordable Housing (new construction), was coordinated with non-profit low-income housing providers through the Housing Development Consortium of Seattle-King County, SHA, and KCHA. Regional and National Entities
KING COUNTY DEPARTMENT OF NATURAL RESOURCES: City Light cooperates with this department’s Hazardous Waste Management Program, Seattle Tilth, and Master Composters/Soil Builders at local festivals. City Light also partners with the Puget Sound Clean Air Agency and local jurisdictions on greenhouse gas reduction and mitigation. NORTHWEST ENERGY EFFICIENCY ALLIANCE (NEEA): This group promotes Energy Star lighting and appliance programs, and funded the Lighting Design Lab through 2005. City Light served on the Lab Steering Committee and Utility Coordination Committee, as well as at the Residential Sector Initiative and partnership meetings. Staff attended ongoing meetings during 2005 with the NEEA Director to improve the working relationships that regional utilities have with the Alliance. City Light actively participates in regional market transformational efforts led by NEEA, including coordination of Lighting Design Lab and Better Bricks activities. City Light

Energy Conservation Accomplishments: 1977-2006 Seattle City Light
Summary of Accomplishments and Expenditures I-57
also participated in three pilot projects during 2004: Building Performance Services, Natural Ventilation, and One-2-Five. PACIFIC NORTHWEST UTILITIES AND AGENCIES: Besides the BPA and NEEA, partners providing external funding to the Lighting Design Lab over the years have included the Alaska Energy Authority, B.C. Hydro (British Columbia), California Energy Commission, Idaho Power, Natural Resources Defense Council, Northwest Energy Coalition (NW Conservation Act Coalition), Northwest Power Planning Council, Pacific Power, Puget Sound Power and Light Company, Snohomish Public Utilities District No.1, Tacoma City Light, University of Washington, Washington State Energy Office, and Washington Water Power. ELECTRIC LEAGUE: The City Light conservation director presides on the Electric League Board. City Light helps coordinate Electric League administrative activities; and the two organizations partnered on the Powerful Business Conferences of 2003 and 2005. NATIONAL SUSTAINABILITY ENERGY TASK FORCE: In affiliation with municipalities, City Light continues leadership and acts as a role model, for other municipal jurisdictions, of transferable conservation and energy efficiency programs and services. U.S. DEPARTMENT OF ENERGY (DOE): City Light has on-going symbiotic partnerships with other environmental organizations, both public and non-profit. In 2004, DOE and the General Services Administration (GSA) contributed to City Light’s Green Power Program as a way to meet their renewable energy mandate. LOCAL TRADE ALLIES: These allies play an integral part in the successful delivery of conservation services. Trade allies include contractors installing insulation, windows, lighting, and efficient equipment; engineers, architects, designers, and building developers; lighting and equipment specifiers; manufacturers, retailers, and suppliers. PROFESSIONAL ORGANIZATIONS: City Light staff perform committee work, coordinate activities and events, and make presentations to a variety of professional affiliates, including the American Energy Service Professionals, American Institute of Architects, ASHRAE 90.1, Commercial Building Industry Review, E-Source, Energy Ideas Clearinghouse, International Energy Program Evaluation Conference, Master Builders Association of King County, Natural Resources Defense Council, Western SUN–Solar Utility Network, Consortium for Energy Efficiency, NW Energy Efficiency Alliance, and Pacific NW Electric League. SEATTLE CENTRAL COMMUNITY COLLEGE (SCCC): City Light is in partnership with the College to develop and deliver a Sustainable Building Advisor Certificate Program. This program began its sixth consecutive year (eighth course) in the fall of 2005. The program was licensed to Mount Hood Community College for use in western Oregon, and to Coiste na n-larchimí, a community development organization in Ireland. In 2005 a non-profit organization, the National Sustainable

Energy Conservation Accomplishments: 1977-2006 Seattle City Light
I-58 Summary of Accomplishments and Expenditures
Building Advisor Program (NASBAP), was formed to license the curriculum nationally to community college. LOCAL AND REGIONAL EVENTS: City Light played an integral part in hosting or delivering events such as the Powerful Business Conference (during 2003 and 2005), a Daylighting Controls Summit, and a Direct Digital Control Systems training course. EDUCATIONAL VISITATIONS: During 2004 City Light hosted one Chinese delegation interested in conservation and energy efficiency programs. RECOGNITION AWARDS: The Power Players Award is granted each year by Seattle City Light, along with the U.S. Department of Energy and the Bonneville Power Administration. It goes to customers and partners for their exemplary efforts in resource conservation and environmental leadership. In 2004 the winners of City Light’s Power Players Award were Bentall Capital, City of Seattle Fleets and Facilities Department, Kusak Cut Glass Works, Newmark Tower, Qwest, Reglaze Unlimited Inc., Seattle University, Stewart Lumber, University of Washington, and Washington State Convention and Trade Center.
� � �
Next Sections The remainder of this report contains detailed information on specific active and discontinued conservation programs.