energy conservation measures for municipal … conservation measures for municipal wastewater...
TRANSCRIPT

Energy Conservation Measures for Municipal Wastewater Treatment PlantsCase Studies of Innovative Technologies and
Practices
Presented at the Ground Water Protection Council Conference: Water and Energy in Changing Climates
Laura Dufresne, P.E.The Cadmus Group, Inc.
September 29, 2010

Acknowledgements USEPA funded project Jim Wheeler, EPA Office of Wastewater
Management
Phil Zahreddine, EPA Office of Wastewater Management
Technical experts Steve Couture, Cadmus
Dave Reardon, HDR
Ken Henderson, HDR

Presentation Overview Importance of Energy Management
Study Background and Methodology
Summary of Innovative and Emerging ECMs
Examples and Case Studies
Wrap up and Questions

Importance of Energy Management Treating municipal wastewater takes a lot of energy 15 – 30 % of operating costs for large facilities
30 – 40% of operating costs for small facilities
Total energy use in U.S.: 100 billion kWh per year
At $0.075/kWh, total estimated cost of $7.5 billion
Areas for improvement Energy savings from more efficient operation
New technologies with short payback periods
Source: WEF MOP 32, 2009; Carns 2005

Importance of Energy Management (continued)
Opportunities for waste capture and reuse
Biogas from sludge treatment can be captured onsite and used to generate electricity
Recovered heat from equipment can also be used at the plant
A CHP system fueled by biogas saved the Back River WWTP in Baltimore more than $1.8 million dollars annually in electricity costs. Installation was ~$14 million, resulting in a simple payback of < 8 years

Importance of Energy Management (continued)
Nutrient recovery
Example: Ostara process
Recovers phosphorus and other nutrients from sludge, converts them to fertilizers
As of September, 3 Ostara facilities in the U.S.
For more information, see http://www.ostara.com/
Wastewater recovery and reuse

Comprehensive Energy Management EPA Energy Management Guidebook for Water and Wastewater
Plan-do-check-act management approach to improving energy efficiency
Available online at http://www.epa.gov/waterinfrastructure/pdfs/guidebook_si_energymanagement.pdf
ENERGY STAR Portfolio Manager
Benchmark energy use and track improvements over time
Performance rating system
Logon at http://www.energystar.gov/index.cfm?c=water.wastewater_drinking_water

Web Resources and Tools (Examples) Pump System Assessment Tool (PSAT)
http://www1.eere.energy.gov/industry/bestpractices/software_psat.html Motors
MotorMaster+ http://www.motorsmatter.org/ 1*2*3 Approach to Motor Management
http://www.motorsmatter.org/tools/123approach.html Technical Resources
CEE, extensive reference list http://www.cee1.org/ind/mot-sys/ww/resources.php3
EPA sustainable water infrastructure home page http://water.epa.gov/infrastructure/sustain/index.cfm
Financing Resources CWSRF http://www.epa.gov/owm/cwfinance/cwsrf/contacts.htm CEC How to finance energy efficiency projects
http://www.energy.ca.gov/reports/efficiency_handbooks/400-00-001A.PDF

Study Background and Methodology
Began in Spring of 2009
Literature review, selection of case study candidates (30+)
Findings reviewed by diverse panel of experts
Collected case study data, drafted report
Peer review by different set of experts

Study Focus Report includes conventional technologies with proven
track record
Pumping and Aeration
Focus is on innovative and emerging technologies
Aeration control and new equipment
Advanced treatment processes such as UV disinfection, Anoxic Zone Mixing
Solids processing
Findings will be posted on the web this Fall: http://water.epa.gov/scitech/wastetech/publications.cfm

Summary of FindingsECM Category ECM Description
Design and Control of Aeration Systems
Intermittent aeration
Dual impeller mechanical aeratorIntegrated air flow aeration controlAutomated SRT/DO ControlAdvanced control using parameters other than DO (off-gas monitoring, Symbio®, BIOS)
Blower and Diffuser Technology for Aeration Systems
High speed turbo blowers
Single-stage centrifugal blowers with inlet guide vanes and variable diffuser vanes
Ultra-fine bubble diffusers
New diffuser cleaning technology

Summary of Findings (continued)ECM Category ECM Description
Advanced and Other Treatment Processes
Low-pressure, high-output lamps for UV disinfection
Automated channel routing for UV disinfection
Membrane air scour for MBRs
Hyperbolic mixers
Pulsed air mixing of anoxic and anaerobic zones
Solids Processing
Vertical linear motion mixer
Upgrading multiple hearth furnaces to incorporate waste heat recovery/combustion air preheating
Solar drying

Summary of Findings – Case StudiesCase
Study No.
FacilityAvg Daily
Flow(MGD)
ECM(s) Project Cost Energy SavingsPayback Period (Yrs)1
1 Green Bay Metropolitan Sewerage District De Pere, WI
8.0 Aeration system upgrade:• Replaced 5 positive displacement
blowers with 6 HST® ABS magnetic bearing turbo blowers
$850,000($2004)
$63,758/yr2,143,975 kWh/yr (50% reduction)
13.3
2 Sheboygan Regional WWTP Sheboygan, MI
11.8 Aeration system upgrade:• Replaced 4 positive displacement
blowers with 2 Turblex ® blowers with upgraded DO control and SCADA
• Installed air control valves on headers, upgraded PCL
$790,000 ($2005) ($773,000 with $17,000 utility incentive) for blowers,$128,000 ($2009) for air control valves
$25,6440/yr associated with blower replacement (358,000 kWh/yr –13% reduction)$38,245/yr associated with air control valves (459,000 kWh/yr –17% reduction)
14
3 Big Gulch Wastewater Treatment Plant, Mukilteo, WA
1.5 • Replaced mechanical aeration with Sanitare fine bubble diffusers and air bearing KTurbo blowers.
• Upgraded to automated DO control• Installed automated ORP-based
control for nitrification (dNOx Anoxic Control System)
For Oxidation Ditch A: $487,066 ($2007) - ($447,875 with $39,191 incentive), For Oxidation Ditch B: $1,045,023 ($2007) - ($998,429 with $46,594 incentive),
$10,649 per year (based on Y2010 savings following Ditch A and Ditch B commissioning)
> 20 years(see Note 1)

Summary of Findings – Case Studies (cont.)Case Study No.
FacilityAvg Daily
Flow(MGD)
ECM(s) Project Cost Energy SavingsPayback Period (Yrs)1
4 City of Bartlett, TN Wastewater Treatment Facility
1.0 Added VFD Control of oxidation ditch rotors using 4-20mA signal from optical DO probes
$13,500 total ($2007)
$9,176/yr71,905 kWh/yr (13% reduction)
1.5
5 Oxnard, CA Plant #32
22.4 Optimization and control of SRT and DO using proprietary process modeling based control algorithms
$135,000 $26,980/yr306,600 kWh/yr (20% reduction)
5
6 Bucklin Point –Narragansett Bay Commission (RI)
23.7 DO Optimization Using Floating Pressure Blower Control and a Most Open Valve Strategy
$200,000 ($2007)
Average of approx $135,786/yr for first 3 years1,247,033 kWh/yr (11.6% reduction) for first 3 years
1.5

Summary of Findings – Case Studies (cont.)Case Study No.
FacilityAvg Daily
Flow(MGD)
ECM(s) Project Cost Energy SavingsPayback Period (Yrs)1
7 Washington Suburban Sanitary Commission (MD) Western Brach WWTP
21.6 Solids processing system upgrade:•Waste Heat Recovery•Flue Gas Recirculation (FGR)•Circle Slot Jets (CSJs) Air injection System
$4,500,000 $400,000 / yr estimated natural gas 320,000 therms/yr (76% reduction)
11.3
8 San Jose/Santa Clara (CA) Water Pollution Control Plant
107 Plant pumping systems optimization, BNR pulsed aeration and DAF Solids Thickening Process optimization using proprietary process control algorithms
$269,569 $1,178,811/yr for electricity and natural gas
3 months
9 Waco Metropolitan Area Regional Sewer System (Waco, TX)
22.8 Aeration system upgrade:•Increased number of diffusers•Installed DO probes and automatic blower and aeration system control
$349,218 ($2002)(Total installed cost = $397,708)
$331,272 total energy savings for first two years after ECM installed4,643,000 kWh/yr average (33% reduction)
2.4

Examples and Case Studies AerationNew DO measurement technologyNew blower technology (Turbo Blowers and Variable Vane
Inlet Guides and Diffusers) Examples: Burlington, VT and Oneida, NY
Fine bubble and ultra-fine bubble diffusers
UV disinfectionLow-pressure high-output lamps
Anoxic zone mixing Solar drying

New DO Measurement Technology• Most common: membrane electrodes
Require frequency calibration and maintenance
• New optical DO probes
Requires less frequent calibration and less maintenance
Good accuracy and reliability
Manufacturers include Hach, Orion, YSI, Insite IG, Endress and Hauser, Analytical Technologies, Inc.
YSI hand-held optical DO probe

Turbo Blowers
• Uses advanced bearing design to operate at high speeds
• 10 – 20 percent more efficient than older models
• Emerged in U.S. in 2007, still need to be tested

Turbo Blowers (cont.)
Source: manufacturer websites
HSI Air Bearing Turbo Blower Atlas Copco Mechanical Bearing Turbo Blower

Example: Burlington, VT
0
10
20
30
40
50
60
1 2 3 4 5 6 7 8 9 10 11 12 13 14 15 16 17 18 19 20 21 22 23 24
Pow
er (k
W)
Hour (January 25, 2010)
Instantaneous Power Draw for 50 HP Kturbo Blower
Metered Electricity Use of 75 HP Multi-Stage Centrifugal Blower(Average Based on Measured Data)
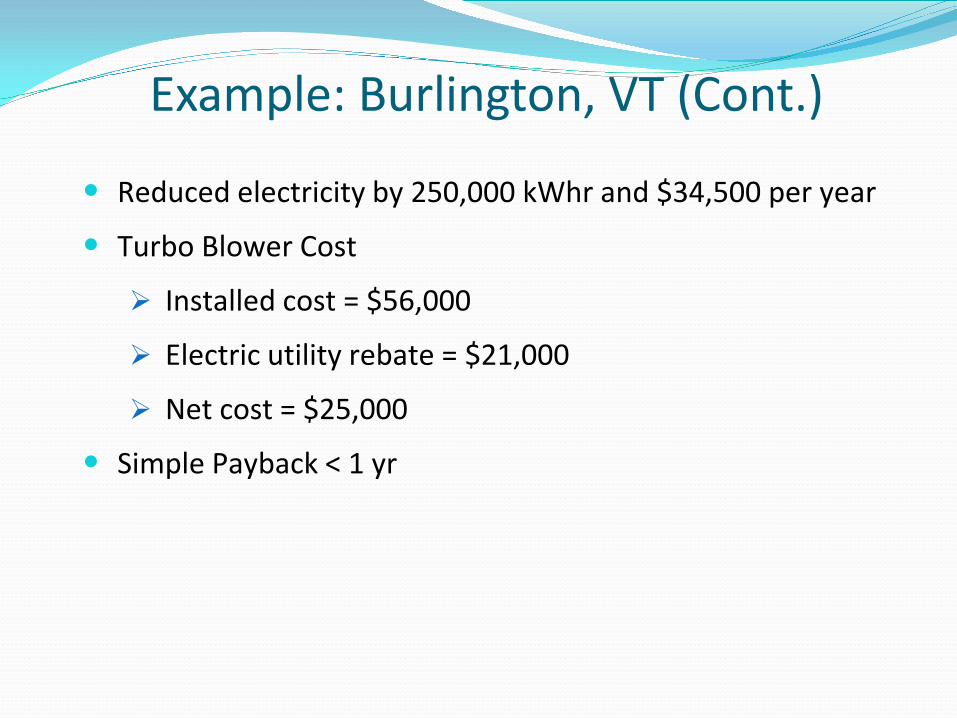
Example: Burlington, VT (Cont.)
• Reduced electricity by 250,000 kWhr and $34,500 per year
• Turbo Blower Cost
Installed cost = $56,000
Electric utility rebate = $21,000
Net cost = $25,000
• Simple Payback < 1 yr

Single Stage Centrifugal with Inlet Guide Vanes and Variable Diffuser Vanes, City of Oneida, NY
Equipment Manufacturer (Type)
Equipment Capital Cost
Annual Energy Costs Net Present Value
Continental Blower (multistage centrifugal)
$118,000 $93,800 $1.16M
HSI (multistage centrifugal) $159,600 $98,900 $1.26MGardner Denver (multistage centrifugal)
$158,000 $104,000 $1.31M
Turblex (single-stage centrifugal with inlet guide vanes and variable diffuser vanes)
$423,750 $58,000 $1.07M
Roots (positive displacement) $104,800 $97,200 $1.19M
Net Present Worth of Blower Selections
Notes:1) Assumed 10-year life span, 4% inflation, $0.12/kWhSource: Greene and Ramer (2007), used with permission of Mark Greene.

Diffusers• It’s all about bubble size Smaller bubbles have higher
oxygen transfer efficiency
• Coarse bubbles (> 5 mm): pre 1970s• Fine bubble diffuser technology (2 – 5 mm):
energy savings of 30 to 40 percent• Ultra-fine bubbles (0.2 – 1 mm): the next big
thing

UV Disinfection: Low-Pressure High Output Lamps
• Low-pressure: least energy but many lamps
• Medium-pressure: fewest no. of lamps but high energy use
• New low-pressure high output: low energy AND fewer lamps
Example: Calgon C3500TM
EPA ETV program has verified low-pressure high-output UV lamps for wastewater treatment and water reuse. For more information, see http://www.epa.gov/etv/pubs/600s07015.pdf

Evaluation of UV Disinfection Equipment Power and Cost Estimates for Stockton, CA WWTP
Dose (mJ/cm2)
Lamp Type Total No. of Lamps
Power (kW)1 Annual Energy Costs2
Life Cycle Cost3
50 Medium Pressure 216 648 $681,000 $20,427,000
Low Pressure High Output 768 143 $150,000 $14,248,000
70 Medium Pressure 324 1,058 $1,120,000 $31,741,000
Low Pressure High Output 1,152 219 $231,000 $19,726,000
110 Medium Pressure 540 1,512 $1,589,000 $46,988,000
Low Pressure High Output 1,792 415 $437,000 $30,615,000
55 mgd Peak Flow, 38 mgd Average Flow, 65% Design UVTPower draw is based on operational values (kW).Based on operational values and energy cost of $0.13 per kWh.Life Cycle Cost = 13.01 (20 years annual cost at 4.5% discount rate) * annual O&M cost + project cost
Source: Salveson et al. 2009; Supplemental information provided in e-mail communication to the author from Nitin Goel, March 24, 2010. Used with permission.

Anoxic Zone Mixing
Hyperbolic MixerTested in
New YorkWashington DC
Invent Hyperclassic Mixer
Source: Fillos, J. and K. Ramalingam. 2005

Anoxic Zone Mixing (cont.)Pulsed large bubble mixing instead of mechanical mixing
Example: Biomix technology

Solids Processing – Solar Drying
Source: http://www.parkson.com/Page.aspx?PageID=289&FileName=Solar%20Drying&CC=true

Conclusions
• Many new technologies available to reduce energy used for wastewater treatment
- Cost effective with short payback periods
• Opportunity for resource recovery and reuse should also be a priority

Questions?
Laura Dufresne, P.E.The Cadmus Group, Inc.
1555 Wilson Blvd, Suite 710Arlington, VA 22209