energy consumption and conservation practices in qatar—a case study of a hotel building
TRANSCRIPT
Es
Na
b
c
a
ARRAA
KEBCES
1
tCigbtp3ca
s
h0
Energy and Buildings 84 (2014) 55–69
Contents lists available at ScienceDirect
Energy and Buildings
j ourna l ho me page: www.elsev ier .com/ locate /enbui ld
nergy consumption and conservation practices in Qatar—A casetudy of a hotel building
asser Ayouba,c, Farayi Musharavati a,∗, Shaligram Pokharela, Hossam A. Gabbarb
Department of Mechanical and Industrial Engineering, College of Engineering, Qatar University, Doha, QatarFaculty of Energy Systems and Nuclear Science, University of Ontario Institute of Technology, Ontario, CanadaFaculty of Industrial Education, Helwan University, Helwan, Egypt
r t i c l e i n f o
rticle history:eceived 3 March 2014eceived in revised form 13 July 2014ccepted 22 July 2014vailable online 1 August 2014
eywords:nergy conservation in Qatarehavior changeommercial buildingsnvelop designcenarios
a b s t r a c t
This paper considers energy conservation practices in Qatar with special emphasis on commercialbuildings. Energy conservation approaches are classified into five main areas and an Energy Con-servation Matrix (ECM) database for buildings is developed. The ECM maps the energy conservationtechniques/technologies to models versus their application domain. Three scenarios (building envelopedesign, change in customer behavior, and consideration of renewable energy supply) are analyzed tostudy different alternatives for efficiency improvement. The analysis is done in a case hotel. The analysisshows that, the energy conservation potential of using envelope redesign for the case study is about 7.5%while conservation through behavior change ranges between 2.74% and 15.80%. The conserved energypotential ranges between 10% and 24.12% of the site energy in the combinatorial scenario that integratedenvelope design alternatives with customer behavior change. The renewable energy (RE) scenario con-serves energy, indirectly, by using green energies generated from renewable sources. The output shows
that due to changes as per the three scenarios, total CO2 emissions of the building are also reduced. Theanalysis shows that adoption of 30% RE alternative can reduce emissions by about 27% with respect tothe reference scenario. It is believed that the scenarios developed in this paper and the results obtainedwill motivate the designers to consider alternative designs or redesigns in the large scale commercialbuildings.© 2014 Elsevier B.V. All rights reserved.
. Introduction
Qatar’s climate is arid, i.e. it is dry, very hot and humid. In addi-ion, Qatar is the second highest electricity consumer among Gulfooperation Council (GCC) countries. About 65% of Qatar’s electric-
ty is consumed by cooling systems in all types of buildings [1]. Therowth in economy and population in Qatar has been accompaniedy an increased number of industrial entities as well as construc-ion of industrial and commercial buildings. As a result electricityroduction in Qatar, between 1999 and 2010, increased by about.7 times [2]. Fig. 1 shows the pattern of electricity growth, for fouronsumption sectors, namely; residential, industrial, commercial
nd governmental organizations, in the past 12 years.The amount of energy consumption by sector in GWh and thehare of each sector in percentages for first and last year data
∗ Corresponding author. Tel.: +974 4403 4325.E-mail addresses: [email protected], [email protected] (F. Musharavati).
ttp://dx.doi.org/10.1016/j.enbuild.2014.07.050378-7788/© 2014 Elsevier B.V. All rights reserved.
(1999, 2011) of the analyzed period are compared as shown inFig. 2.
It is easy to recognize that there is a real change between res-idential sector and industrial sector. According to the statistics ofMinistry of Energy and Industry, the number of recorded industrialunits increased from 482 in December 2007 to 611 in December2011. Main growth is in the textile group (textile, apparel andleather) and basic metallurgical group. The electricity consumptionin industrial sector increased by about 15% of the total demand inthis period (i.e. from 1999 to 2011) while there is a relative percent-age decline in the residential sector demands by about 12%. Thegrowth in electricity consumption of commercial sector reached295% and governmental sector by 441%.
Although electricity consumption in industrial sector increasedfrom 1134 GWh in 1999 to 8233 GWh in 2011, with a growth rate
of 726%, the sectors related to number of population (residentialand governmental) have kept control over the energy consumptionuntil year 2009 after which a turning point in the favor of indus-trial sector is observed. In year 2011, the electricity consumption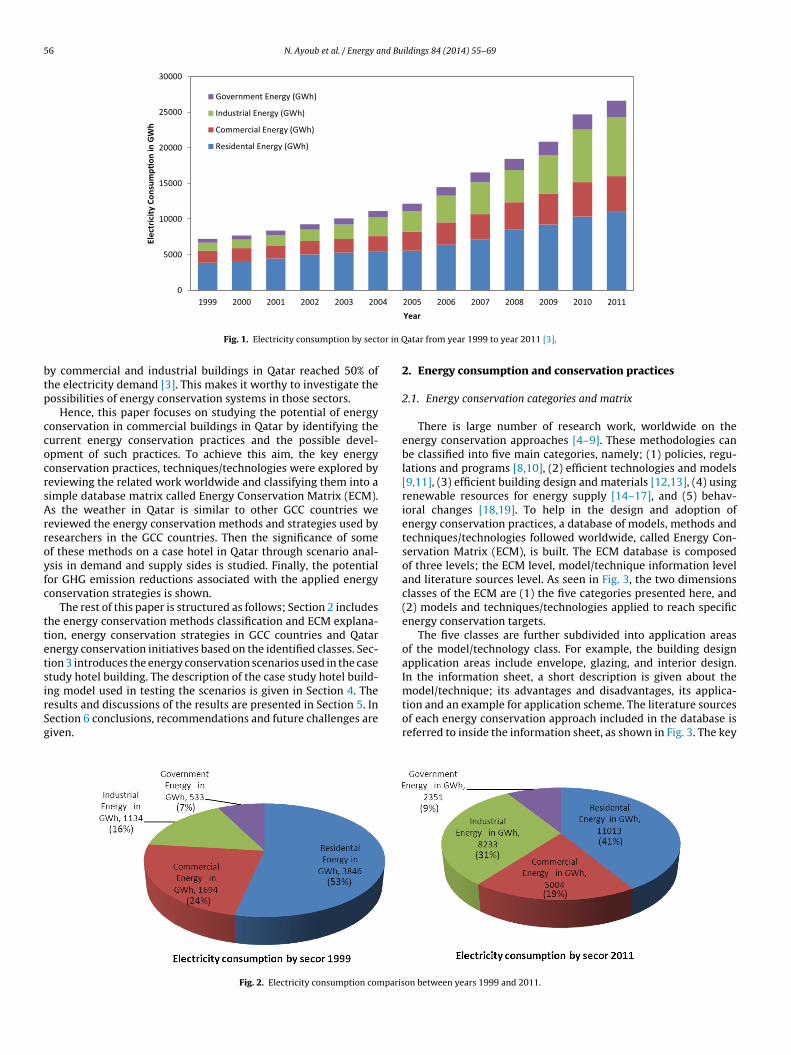
56 N. Ayoub et al. / Energy and Buildings 84 (2014) 55–69
0
5000
10000
15000
20000
25000
30000
1999 2000 2001 2002 2003 2004 2005 2006 2007 2008 2009 2010 2011
Elec
tric
ity C
onsu
mp�
on in
GW
h
Governme nt Energ y ( GWh)
Industrial Energ y ( GWh)
Commercial Energy ( GWh)
Resid ental Energy (GWh)
or in Q
btp
ccocrsArroyfc
ttetsirSg
Fig. 1. Electricity consumption by sect
y commercial and industrial buildings in Qatar reached 50% ofhe electricity demand [3]. This makes it worthy to investigate theossibilities of energy conservation systems in those sectors.
Hence, this paper focuses on studying the potential of energyonservation in commercial buildings in Qatar by identifying theurrent energy conservation practices and the possible devel-pment of such practices. To achieve this aim, the key energyonservation practices, techniques/technologies were explored byeviewing the related work worldwide and classifying them into aimple database matrix called Energy Conservation Matrix (ECM).s the weather in Qatar is similar to other GCC countries weeviewed the energy conservation methods and strategies used byesearchers in the GCC countries. Then the significance of somef these methods on a case hotel in Qatar through scenario anal-sis in demand and supply sides is studied. Finally, the potentialor GHG emission reductions associated with the applied energyonservation strategies is shown.
The rest of this paper is structured as follows; Section 2 includeshe energy conservation methods classification and ECM explana-ion, energy conservation strategies in GCC countries and Qatarnergy conservation initiatives based on the identified classes. Sec-ion 3 introduces the energy conservation scenarios used in the casetudy hotel building. The description of the case study hotel build-
ng model used in testing the scenarios is given in Section 4. Theesults and discussions of the results are presented in Section 5. Inection 6 conclusions, recommendations and future challenges areiven.Fig. 2. Electricity consumption comparis
Year
atar from year 1999 to year 2011 [3].
2. Energy consumption and conservation practices
2.1. Energy conservation categories and matrix
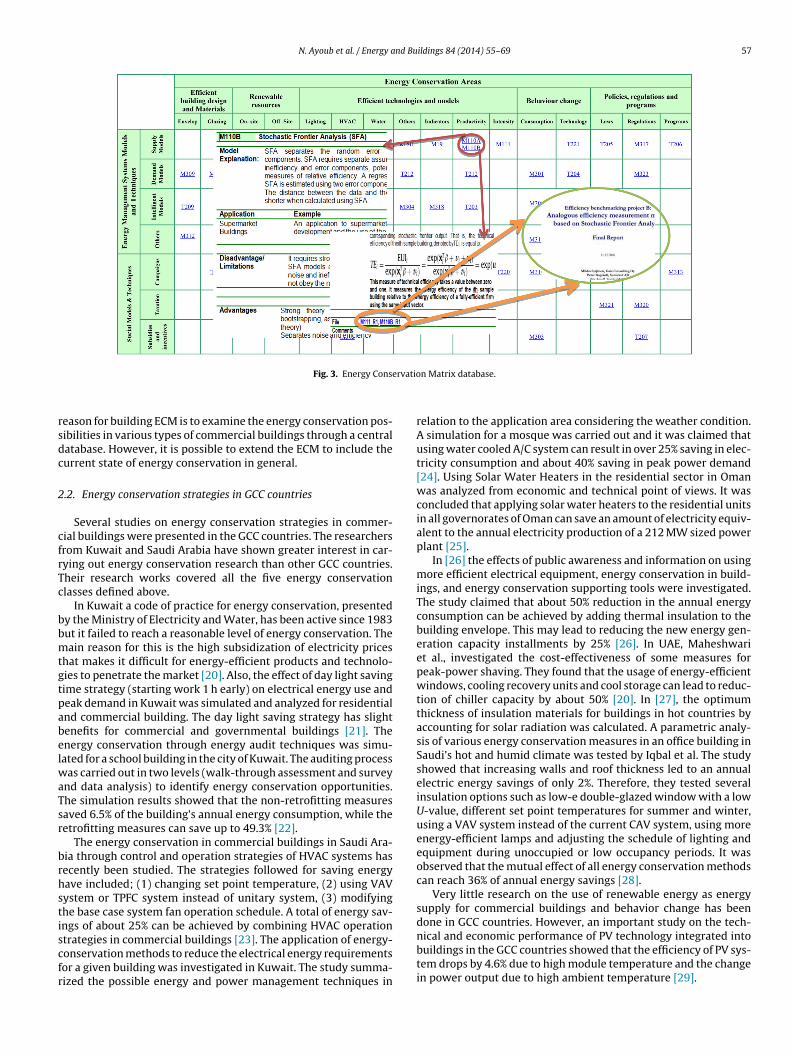
There is large number of research work, worldwide on theenergy conservation approaches [4–9]. These methodologies canbe classified into five main categories, namely; (1) policies, regu-lations and programs [8,10], (2) efficient technologies and models[9,11], (3) efficient building design and materials [12,13], (4) usingrenewable resources for energy supply [14–17], and (5) behav-ioral changes [18,19]. To help in the design and adoption ofenergy conservation practices, a database of models, methods andtechniques/technologies followed worldwide, called Energy Con-servation Matrix (ECM), is built. The ECM database is composedof three levels; the ECM level, model/technique information leveland literature sources level. As seen in Fig. 3, the two dimensionsclasses of the ECM are (1) the five categories presented here, and(2) models and techniques/technologies applied to reach specificenergy conservation targets.
The five classes are further subdivided into application areasof the model/technology class. For example, the building designapplication areas include envelope, glazing, and interior design.In the information sheet, a short description is given about the
model/technique; its advantages and disadvantages, its applica-tion and an example for application scheme. The literature sourcesof each energy conservation approach included in the database isreferred to inside the information sheet, as shown in Fig. 3. The keyon between years 1999 and 2011.
N. Ayoub et al. / Energy and Buildings 84 (2014) 55–69 57
rvatio
rsdc
2
cfrTc
bbmtgtpabelwaTsr
brhstiscfr
Fig. 3. Energy Conse
eason for building ECM is to examine the energy conservation pos-ibilities in various types of commercial buildings through a centralatabase. However, it is possible to extend the ECM to include theurrent state of energy conservation in general.
.2. Energy conservation strategies in GCC countries
Several studies on energy conservation strategies in commer-ial buildings were presented in the GCC countries. The researchersrom Kuwait and Saudi Arabia have shown greater interest in car-ying out energy conservation research than other GCC countries.heir research works covered all the five energy conservationlasses defined above.
In Kuwait a code of practice for energy conservation, presentedy the Ministry of Electricity and Water, has been active since 1983ut it failed to reach a reasonable level of energy conservation. Theain reason for this is the high subsidization of electricity prices
hat makes it difficult for energy-efficient products and technolo-ies to penetrate the market [20]. Also, the effect of day light savingime strategy (starting work 1 h early) on electrical energy use andeak demand in Kuwait was simulated and analyzed for residentialnd commercial building. The day light saving strategy has slightenefits for commercial and governmental buildings [21]. Thenergy conservation through energy audit techniques was simu-ated for a school building in the city of Kuwait. The auditing process
as carried out in two levels (walk-through assessment and surveynd data analysis) to identify energy conservation opportunities.he simulation results showed that the non-retrofitting measuresaved 6.5% of the building’s annual energy consumption, while theetrofitting measures can save up to 49.3% [22].
The energy conservation in commercial buildings in Saudi Ara-ia through control and operation strategies of HVAC systems hasecently been studied. The strategies followed for saving energyave included; (1) changing set point temperature, (2) using VAVystem or TPFC system instead of unitary system, (3) modifyinghe base case system fan operation schedule. A total of energy sav-ngs of about 25% can be achieved by combining HVAC operation
trategies in commercial buildings [23]. The application of energy-onservation methods to reduce the electrical energy requirementsor a given building was investigated in Kuwait. The study summa-ized the possible energy and power management techniques inn Matrix database.
relation to the application area considering the weather condition.A simulation for a mosque was carried out and it was claimed thatusing water cooled A/C system can result in over 25% saving in elec-tricity consumption and about 40% saving in peak power demand[24]. Using Solar Water Heaters in the residential sector in Omanwas analyzed from economic and technical point of views. It wasconcluded that applying solar water heaters to the residential unitsin all governorates of Oman can save an amount of electricity equiv-alent to the annual electricity production of a 212 MW sized powerplant [25].
In [26] the effects of public awareness and information on usingmore efficient electrical equipment, energy conservation in build-ings, and energy conservation supporting tools were investigated.The study claimed that about 50% reduction in the annual energyconsumption can be achieved by adding thermal insulation to thebuilding envelope. This may lead to reducing the new energy gen-eration capacity installments by 25% [26]. In UAE, Maheshwariet al., investigated the cost-effectiveness of some measures forpeak-power shaving. They found that the usage of energy-efficientwindows, cooling recovery units and cool storage can lead to reduc-tion of chiller capacity by about 50% [20]. In [27], the optimumthickness of insulation materials for buildings in hot countries byaccounting for solar radiation was calculated. A parametric analy-sis of various energy conservation measures in an office building inSaudi’s hot and humid climate was tested by Iqbal et al. The studyshowed that increasing walls and roof thickness led to an annualelectric energy savings of only 2%. Therefore, they tested severalinsulation options such as low-e double-glazed window with a lowU-value, different set point temperatures for summer and winter,using a VAV system instead of the current CAV system, using moreenergy-efficient lamps and adjusting the schedule of lighting andequipment during unoccupied or low occupancy periods. It wasobserved that the mutual effect of all energy conservation methodscan reach 36% of annual energy savings [28].
Very little research on the use of renewable energy as energysupply for commercial buildings and behavior change has beendone in GCC countries. However, an important study on the tech-
nical and economic performance of PV technology integrated intobuildings in the GCC countries showed that the efficiency of PV sys-tem drops by 4.6% due to high module temperature and the changein power output due to high ambient temperature [29].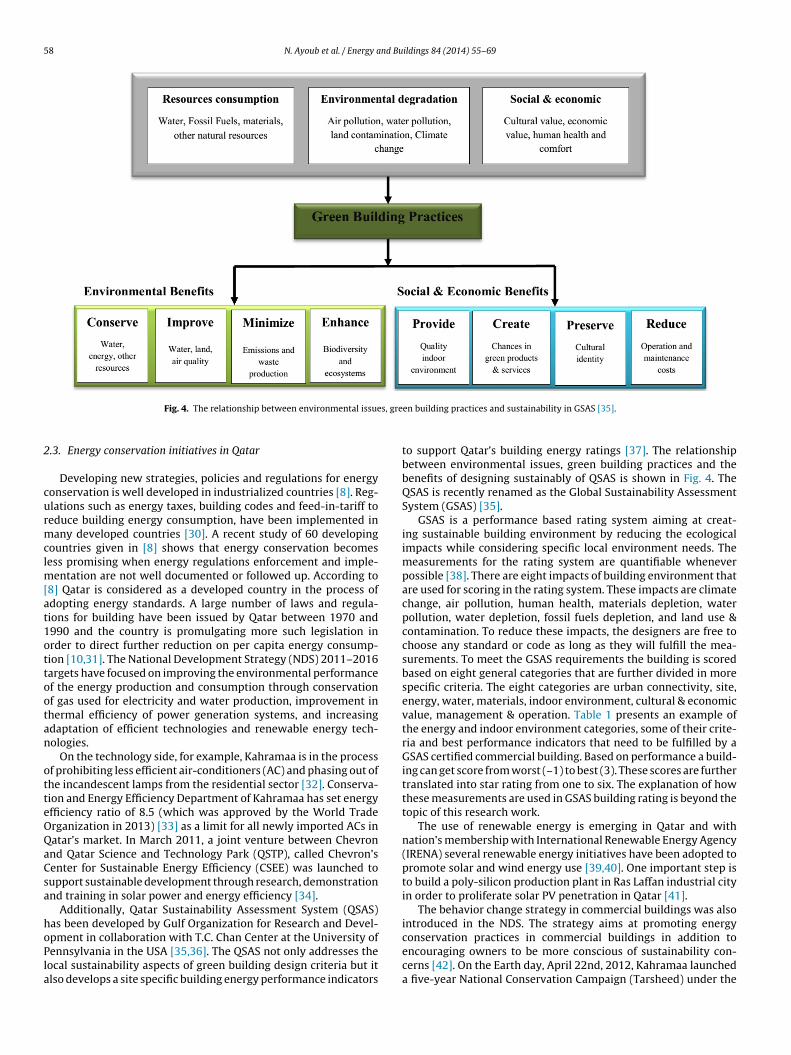
58 N. Ayoub et al. / Energy and Buildings 84 (2014) 55–69
s, gre
2
curmclm[at1ottootan
otteOQaCsa
hoPla
Fig. 4. The relationship between environmental issue
.3. Energy conservation initiatives in Qatar
Developing new strategies, policies and regulations for energyonservation is well developed in industrialized countries [8]. Reg-lations such as energy taxes, building codes and feed-in-tariff toeduce building energy consumption, have been implemented inany developed countries [30]. A recent study of 60 developing
ountries given in [8] shows that energy conservation becomesess promising when energy regulations enforcement and imple-
entation are not well documented or followed up. According to8] Qatar is considered as a developed country in the process ofdopting energy standards. A large number of laws and regula-ions for building have been issued by Qatar between 1970 and990 and the country is promulgating more such legislation inrder to direct further reduction on per capita energy consump-ion [10,31]. The National Development Strategy (NDS) 2011–2016argets have focused on improving the environmental performancef the energy production and consumption through conservationf gas used for electricity and water production, improvement inhermal efficiency of power generation systems, and increasingdaptation of efficient technologies and renewable energy tech-ologies.
On the technology side, for example, Kahramaa is in the processf prohibiting less efficient air-conditioners (AC) and phasing out ofhe incandescent lamps from the residential sector [32]. Conserva-ion and Energy Efficiency Department of Kahramaa has set energyfficiency ratio of 8.5 (which was approved by the World Traderganization in 2013) [33] as a limit for all newly imported ACs inatar’s market. In March 2011, a joint venture between Chevronnd Qatar Science and Technology Park (QSTP), called Chevron’senter for Sustainable Energy Efficiency (CSEE) was launched toupport sustainable development through research, demonstrationnd training in solar power and energy efficiency [34].
Additionally, Qatar Sustainability Assessment System (QSAS)as been developed by Gulf Organization for Research and Devel-
pment in collaboration with T.C. Chan Center at the University ofennsylvania in the USA [35,36]. The QSAS not only addresses theocal sustainability aspects of green building design criteria but itlso develops a site specific building energy performance indicatorsen building practices and sustainability in GSAS [35].
to support Qatar’s building energy ratings [37]. The relationshipbetween environmental issues, green building practices and thebenefits of designing sustainably of QSAS is shown in Fig. 4. TheQSAS is recently renamed as the Global Sustainability AssessmentSystem (GSAS) [35].
GSAS is a performance based rating system aiming at creat-ing sustainable building environment by reducing the ecologicalimpacts while considering specific local environment needs. Themeasurements for the rating system are quantifiable wheneverpossible [38]. There are eight impacts of building environment thatare used for scoring in the rating system. These impacts are climatechange, air pollution, human health, materials depletion, waterpollution, water depletion, fossil fuels depletion, and land use &contamination. To reduce these impacts, the designers are free tochoose any standard or code as long as they will fulfill the mea-surements. To meet the GSAS requirements the building is scoredbased on eight general categories that are further divided in morespecific criteria. The eight categories are urban connectivity, site,energy, water, materials, indoor environment, cultural & economicvalue, management & operation. Table 1 presents an example ofthe energy and indoor environment categories, some of their crite-ria and best performance indicators that need to be fulfilled by aGSAS certified commercial building. Based on performance a build-ing can get score from worst (–1) to best (3). These scores are furthertranslated into star rating from one to six. The explanation of howthese measurements are used in GSAS building rating is beyond thetopic of this research work.
The use of renewable energy is emerging in Qatar and withnation’s membership with International Renewable Energy Agency(IRENA) several renewable energy initiatives have been adopted topromote solar and wind energy use [39,40]. One important step isto build a poly-silicon production plant in Ras Laffan industrial cityin order to proliferate solar PV penetration in Qatar [41].
The behavior change strategy in commercial buildings was alsointroduced in the NDS. The strategy aims at promoting energy
conservation practices in commercial buildings in addition toencouraging owners to be more conscious of sustainability con-cerns [42]. On the Earth day, April 22nd, 2012, Kahramaa launcheda five-year National Conservation Campaign (Tarsheed) under the
N. Ayoub et al. / Energy and Buildings 84 (2014) 55–69 59
Table 1Example of GSAS categories, criteria and performance indicators [38].
Category Criteria Value
Energy Energy demand performance reference 125 (kWh/m2/year)Fossil fuel conservation reference 171 (kWh/m2/year)CO2 emissions reference 38.496 (kg/m2/year)
Indoorenvironment
Thermal comfort (predicted mean vote, PMV) PMV ≤ 0.5Natural ventilation, NV Using NV is done in three month or moreMechanical ventilation Outdoor air volume <5% of ASHRAE 62.1-2010
requirement and all equipment has efficiencies not
bamw(3
3
fdcitb
3
cccs
3
dtiaCdwTg
3
ItwbwSeAwstwc
anner “Keep Qatar Pulsing. Consume Wisely”. The campaign aimst preserving the environment and natural resources through threeain objectives; (1) increasing the efficiency in the electricity andater sectors, (2) stopping waste and irrational consumption, and
3) reducing the consumption of electricity by 20% and water by5% over the five-year period [32].
. Commercial building energy conservation scenarios
Energy conservation can be applied in commercial buildingsrom different perspectives: demand side or supply side. Foremand side, energy conservation method should consider the keyonsumption systems such as HVAC systems, water heating, light-ng, and cooking. For the supply side, electricity grid supply andhe emerging renewable based electricity supply systems shoulde considered.
.1. Demand scenarios
The demand side control can be done using several energyonservation techniques. In this paper, two of the conservationsategories, envelope design alternatives and customer behaviorhange, are investigated. The following subsections present thecenarios considered to apply these measures.
.1.1. Reference demand and supply scenarioIn this scenario, the envelope construction materials are
esigned based on standard CBECS-1980–2004. The reason to selecthe CBECS standard is the fact that most of the existing buildingsn Qatar were built before 2004 with the extra wall base. Materi-ls used are either metallic or bricks and fits to the standards inBECS. For the reference scenario, the two alternatives materialesigns are tested for energy conservation potential to decide as tohich alternative is better from energy conservation perspectives.
he electricity supply is assumed to be from the national electricityrid. The natural gas is supplied through gas grid.
.1.2. Building envelope design alternatives scenarioBuilding envelope is an important factor in conserving energy.
t includes all building elements that lay between the interior ofhe building and the exterior environment which includes: walls,indows, doors, roof and foundations. These components need to
e integrated in such a way that they keep the building warm in theinter and cool in the summer. The National Institute of Building
ciences, USA, has developed a comprehensive guide for exteriornvelope design and construction for institutional/office buildings.ccording to this guide, envelope design includes five systems (1)all systems, (2) roofing systems, (3) fenestration, (4) below grade
ystems, and (5) atria systems [43]. Envelope insulation (wall sys-em) and glazing (fenestration) are the most popular and effectiveays for energy conservation in buildings [44]. Due to the harsh
limate in summer, the roof insulation alternatives have also to be
less than that specified in ASHRAE 90.1-2007
taken into account. Therefore, the envelope design alternative sce-narios that consider the three insulation systems are consideredhere.
In addition to the CBECS standards, there are two more build-ing design standards issued by the American Society of Heating,Refrigerating and Air Conditioning Engineers (ASHRAE), namely;Standard 90.1—2004 for Energy Standard for Buildings Except Low-Rise Residential Buildings and Standard 189.1—2009 for the Designof High Performance, Green Buildings Except Low-Rise ResidentialBuildings [45]. Each of these standards has different constructionand material alternatives for the three insulation systems consid-ered in this study. Therefore, in this scenario, these constructionmaterials are considered in 20 design alternatives. Table 2 showsthe thermal and solar absorptance for the outer layer material ofthe fac ade, the U-values of all envelop components and wall con-ductivity for all alternatives. The materials used in the constructionof buildings with low energy consumption can be summarized aswood for walls, Insulation Entirely Above Deck (IEAD) for roof andfixed windows for glazing. The glazing to wall ratio used in alldesign alternatives is 40%. The construction sequence of windowis 3 mm glass clear–13 mm air gap–3 mm glass clear.
3.1.3. Behavior change demand scenarioThe whole idea in behavioral change is the information led
awareness and behavioral action to avoid the unnecessary use ofenergy, for example, turning off lights when the space is not in use,reusing towels, reducing water consumption, turn off signs andusing equipment only when it is needed. Some of these changescan also be affected by means of technology, such as sensors,which emulates the consumer behavior. A number of studies haveaddressed the behavioral issues from engineering, physiologicaland social point of views [46–50]. The methods to achieve energysavings from such issues are given in [51–55]. The studies haveshown that achieving up to a 25% of savings through behavioralchanges is possible [52–54] through several intervention methodsas shown in Table 3.
In our simulation of the 5% and 15% scenarios, the reductionis achieved by reducing the consumption of all the technologiesunder human control. To reach a reduction of 25% the set point tem-perature has to be increased by 3 ◦C. Table 4 shows the simulationparameters used for energy and water consumption equipment (byresidents and staff) and light in the 5% reduction scenario.
3.1.4. Behavior change and envelope alternative designIn this scenario, the design alternatives of low energy consump-
tion potential are used in combination with behavior change toestimate the best energy conservation options. Three possibilities
of behavior change and the best three envelope design alternativesresulting from the envelope design alternatives are modeled. Ninesimulation models are developed to identify the best energy con-servation design alternative.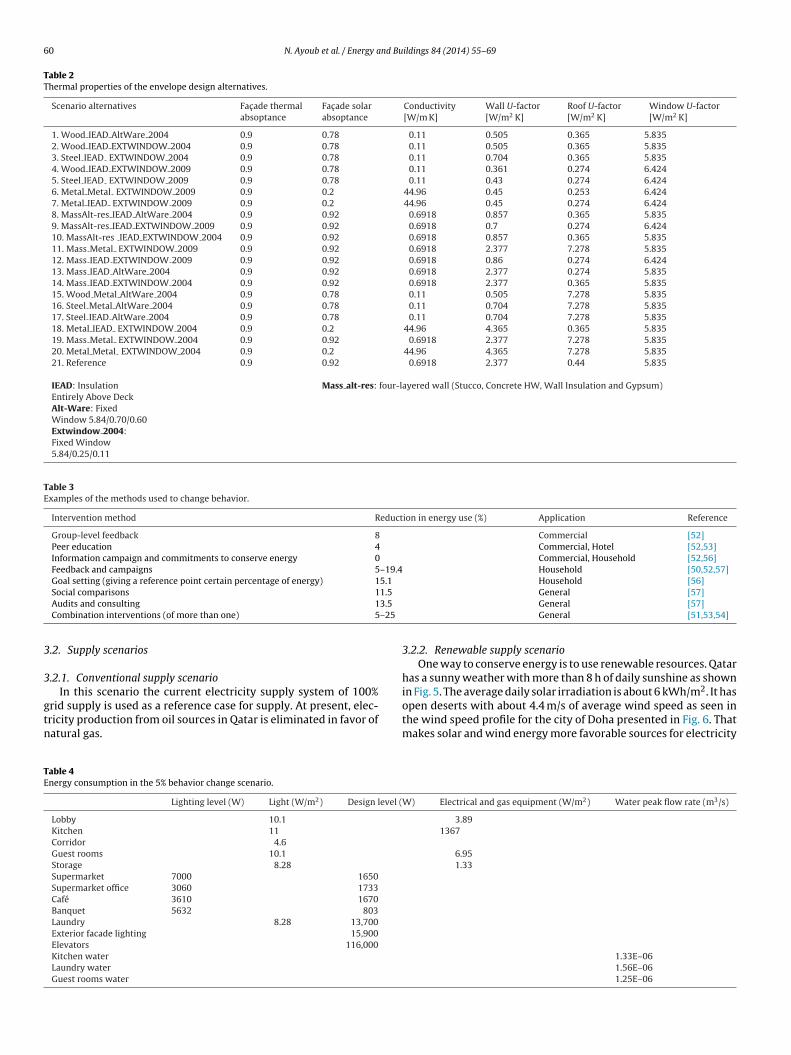
60 N. Ayoub et al. / Energy and Buildings 84 (2014) 55–69
Table 2Thermal properties of the envelope design alternatives.
Scenario alternatives Fac ade thermalabsoptance
Fac ade solarabsoptance
Conductivity[W/m K]
Wall U-factor[W/m2 K]
Roof U-factor[W/m2 K]
Window U-factor[W/m2 K]
1. Wood IEAD AltWare 2004 0.9 0.78 0.11 0.505 0.365 5.8352. Wood IEAD EXTWINDOW 2004 0.9 0.78 0.11 0.505 0.365 5.8353. Steel IEAD EXTWINDOW 2004 0.9 0.78 0.11 0.704 0.365 5.8354. Wood IEAD EXTWINDOW 2009 0.9 0.78 0.11 0.361 0.274 6.4245. Steel IEAD EXTWINDOW 2009 0.9 0.78 0.11 0.43 0.274 6.4246. Metal Metal EXTWINDOW 2009 0.9 0.2 44.96 0.45 0.253 6.4247. Metal IEAD EXTWINDOW 2009 0.9 0.2 44.96 0.45 0.274 6.4248. MassAlt-res IEAD AltWare 2004 0.9 0.92 0.6918 0.857 0.365 5.8359. MassAlt-res IEAD EXTWINDOW 2009 0.9 0.92 0.6918 0.7 0.274 6.42410. MassAlt-res IEAD EXTWINDOW 2004 0.9 0.92 0.6918 0.857 0.365 5.83511. Mass Metal EXTWINDOW 2009 0.9 0.92 0.6918 2.377 7.278 5.83512. Mass IEAD EXTWINDOW 2009 0.9 0.92 0.6918 0.86 0.274 6.42413. Mass IEAD AltWare 2004 0.9 0.92 0.6918 2.377 0.274 5.83514. Mass IEAD EXTWINDOW 2004 0.9 0.92 0.6918 2.377 0.365 5.83515. Wood Metal AltWare 2004 0.9 0.78 0.11 0.505 7.278 5.83516. Steel Metal AltWare 2004 0.9 0.78 0.11 0.704 7.278 5.83517. Steel IEAD AltWare 2004 0.9 0.78 0.11 0.704 7.278 5.83518. Metal IEAD EXTWINDOW 2004 0.9 0.2 44.96 4.365 0.365 5.83519. Mass Metal EXTWINDOW 2004 0.9 0.92 0.6918 2.377 7.278 5.83520. Metal Metal EXTWINDOW 2004 0.9 0.2 44.96 4.365 7.278 5.83521. Reference 0.9 0.92 0.6918 2.377 0.44 5.835
IEAD: InsulationEntirely Above DeckAlt-Ware: FixedWindow 5.84/0.70/0.60Extwindow 2004:Fixed Window5.84/0.25/0.11
Mass alt-res: four-layered wall (Stucco, Concrete HW, Wall Insulation and Gypsum)
Table 3Examples of the methods used to change behavior.
Intervention method Reduction in energy use (%) Application Reference
Group-level feedback 8 Commercial [52]Peer education 4 Commercial, Hotel [52,53]Information campaign and commitments to conserve energy 0 Commercial, Household [52,56]Feedback and campaigns 5–19.4 Household [50,52,57]Goal setting (giving a reference point certain percentage of energy) 15.1 Household [56]
1.5
3.5
–25
3
3
gtn
TE
Social comparisons 1Audits and consulting 1Combination interventions (of more than one) 5
.2. Supply scenarios
.2.1. Conventional supply scenario
In this scenario the current electricity supply system of 100%rid supply is used as a reference case for supply. At present, elec-ricity production from oil sources in Qatar is eliminated in favor ofatural gas.
able 4nergy consumption in the 5% behavior change scenario.
Lighting level (W) Light (W/m2) Design level (
Lobby 10.1
Kitchen 11
Corridor 4.6Guest rooms 10.1
Storage 8.28
Supermarket 7000 1650Supermarket office 3060 1733Café 3610 1670Banquet 5632 803Laundry 8.28 13,700Exterior facade lighting 15,900Elevators 116,000Kitchen water
Laundry water
Guest rooms water
General [57]General [57]General [51,53,54]
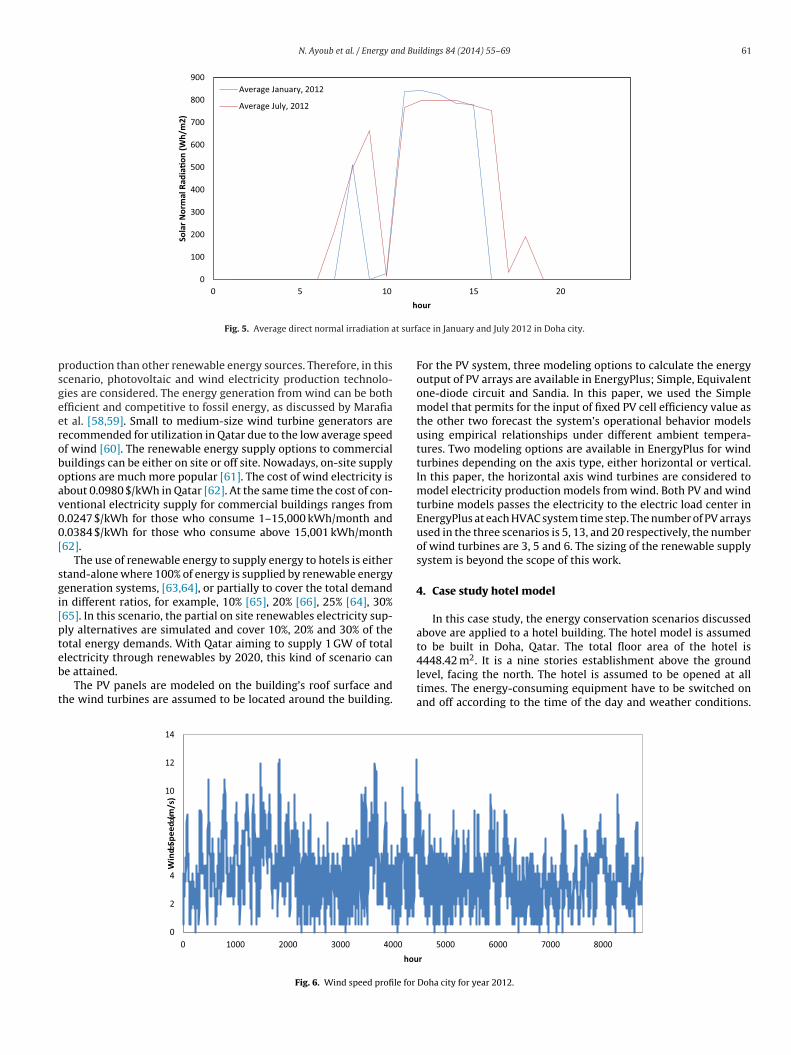
3.2.2. Renewable supply scenarioOne way to conserve energy is to use renewable resources. Qatar
has a sunny weather with more than 8 h of daily sunshine as shown2
in Fig. 5. The average daily solar irradiation is about 6 kWh/m . It hasopen deserts with about 4.4 m/s of average wind speed as seen inthe wind speed profile for the city of Doha presented in Fig. 6. Thatmakes solar and wind energy more favorable sources for electricity
W) Electrical and gas equipment (W/m2) Water peak flow rate (m3/s)
3.891367
6.951.33
1.33E–061.56E–061.25E–06
N. Ayoub et al. / Energy and Buildings 84 (2014) 55–69 61
0
100
200
300
400
500
600
700
800
900
0 5 10 15 20
Sola
r Nor
mal
Rad
ia�o
n (W
h/m
2)
hour
Average Janu ary, 2 012
Average Jul y, 2012
t surf
psgeeroboav00[
sgi[pteb
t
Fig. 5. Average direct normal irradiation a
roduction than other renewable energy sources. Therefore, in thiscenario, photovoltaic and wind electricity production technolo-ies are considered. The energy generation from wind can be bothfficient and competitive to fossil energy, as discussed by Marafiat al. [58,59]. Small to medium-size wind turbine generators areecommended for utilization in Qatar due to the low average speedf wind [60]. The renewable energy supply options to commercialuildings can be either on site or off site. Nowadays, on-site supplyptions are much more popular [61]. The cost of wind electricity isbout 0.0980 $/kWh in Qatar [62]. At the same time the cost of con-entional electricity supply for commercial buildings ranges from.0247 $/kWh for those who consume 1–15,000 kWh/month and.0384 $/kWh for those who consume above 15,001 kWh/month62].
The use of renewable energy to supply energy to hotels is eithertand-alone where 100% of energy is supplied by renewable energyeneration systems, [63,64], or partially to cover the total demandn different ratios, for example, 10% [65], 20% [66], 25% [64], 30%65]. In this scenario, the partial on site renewables electricity sup-ly alternatives are simulated and cover 10%, 20% and 30% of theotal energy demands. With Qatar aiming to supply 1 GW of total
lectricity through renewables by 2020, this kind of scenario cane attained.The PV panels are modeled on the building’s roof surface andhe wind turbines are assumed to be located around the building.
0
2
4
6
8
10
12
14
0 1000 2000 3000 4000
Win
d Sp
eed
(m/s
)
hou
Fig. 6. Wind speed profile for
ace in January and July 2012 in Doha city.
For the PV system, three modeling options to calculate the energyoutput of PV arrays are available in EnergyPlus; Simple, Equivalentone-diode circuit and Sandia. In this paper, we used the Simplemodel that permits for the input of fixed PV cell efficiency value asthe other two forecast the system’s operational behavior modelsusing empirical relationships under different ambient tempera-tures. Two modeling options are available in EnergyPlus for windturbines depending on the axis type, either horizontal or vertical.In this paper, the horizontal axis wind turbines are considered tomodel electricity production models from wind. Both PV and windturbine models passes the electricity to the electric load center inEnergyPlus at each HVAC system time step. The number of PV arraysused in the three scenarios is 5, 13, and 20 respectively, the numberof wind turbines are 3, 5 and 6. The sizing of the renewable supplysystem is beyond the scope of this work.
4. Case study hotel model
In this case study, the energy conservation scenarios discussedabove are applied to a hotel building. The hotel model is assumedto be built in Doha, Qatar. The total floor area of the hotel is
4448.42 m2. It is a nine stories establishment above the groundlevel, facing the north. The hotel is assumed to be opened at alltimes. The energy-consuming equipment have to be switched onand off according to the time of the day and weather conditions.5000 6000 7000 8000r
Doha city for year 2012.
62 N. Ayoub et al. / Energy and Buildings 84 (2014) 55–69
Table 5Thermal zones of the hotel and their infiltration rate.
Zone Type Area (m2) Air changes per hour Design flow rate
Zone 1 Banquet hall/large café 445.49/301.27 (total area 746.76) 0.0409/0.0276Zone 2 Kitchen 305.7 0.12Zone 3 Corridor 288.03 0.12Zone 4 Super market/office 744.47 0.0344/0.0252Zone 5 Lobby 697.99 0.12Zone 6 Guest rooms 5115.23
Zone 7 Guest rooms 5237.96
Zone 8 Store room 153.32
EHpdiDr
tEwibbmSiuT
wfbcil
TM
5.1.2. Building envelope design alternatives scenarioThe results of energy consumption simulation for the hotel in
the twenty alternatives scenarios with their construction types
Table 7The hotel HVAC system components’ parameters.
HVAC components Componentsparameters
Value
Fan (variable airflow)Fan efficiency 60.45%Motor efficiency 93%
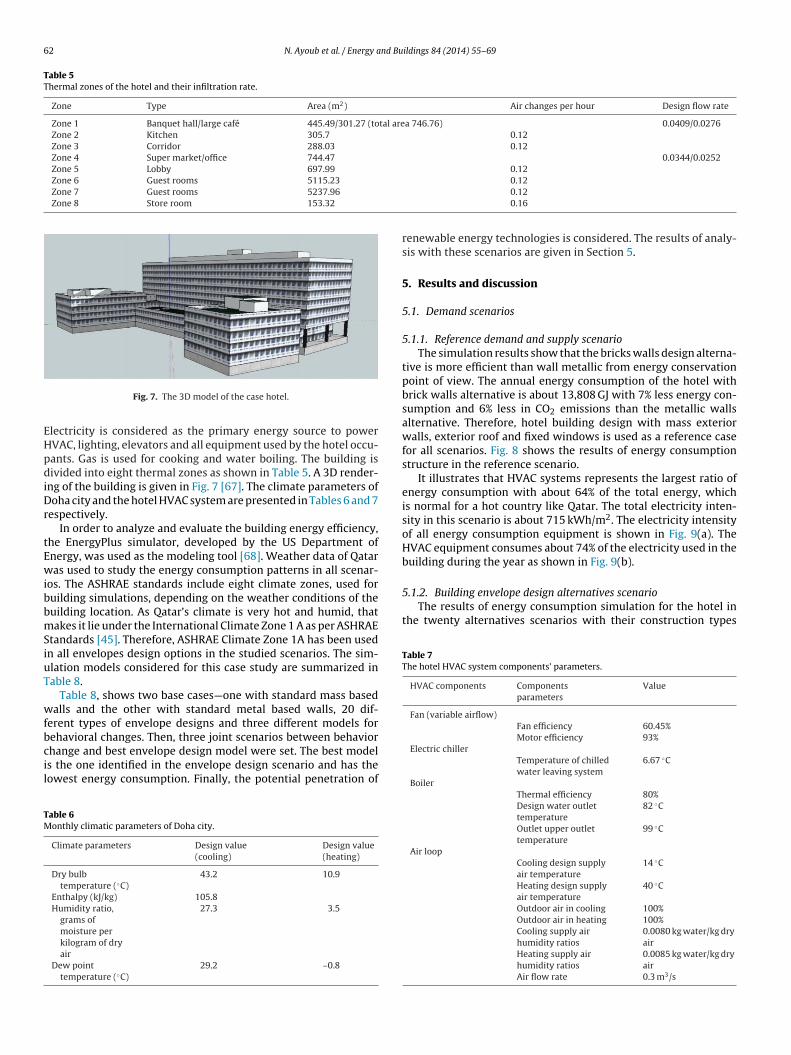
Fig. 7. The 3D model of the case hotel.
lectricity is considered as the primary energy source to powerVAC, lighting, elevators and all equipment used by the hotel occu-ants. Gas is used for cooking and water boiling. The building isivided into eight thermal zones as shown in Table 5. A 3D render-
ng of the building is given in Fig. 7 [67]. The climate parameters ofoha city and the hotel HVAC system are presented in Tables 6 and 7
espectively.In order to analyze and evaluate the building energy efficiency,
he EnergyPlus simulator, developed by the US Department ofnergy, was used as the modeling tool [68]. Weather data of Qataras used to study the energy consumption patterns in all scenar-
os. The ASHRAE standards include eight climate zones, used foruilding simulations, depending on the weather conditions of theuilding location. As Qatar’s climate is very hot and humid, thatakes it lie under the International Climate Zone 1 A as per ASHRAE
tandards [45]. Therefore, ASHRAE Climate Zone 1A has been usedn all envelopes design options in the studied scenarios. The sim-lation models considered for this case study are summarized inable 8.
Table 8, shows two base cases—one with standard mass basedalls and the other with standard metal based walls, 20 dif-
erent types of envelope designs and three different models forehavioral changes. Then, three joint scenarios between behavior
hange and best envelope design model were set. The best models the one identified in the envelope design scenario and has theowest energy consumption. Finally, the potential penetration ofable 6onthly climatic parameters of Doha city.
Climate parameters Design value(cooling)
Design value(heating)
Dry bulbtemperature (◦C)
43.2 10.9
Enthalpy (kJ/kg) 105.8Humidity ratio,
grams ofmoisture perkilogram of dryair
27.3 3.5
Dew pointtemperature (◦C)
29.2 –0.8
0.120.120.16
renewable energy technologies is considered. The results of analy-sis with these scenarios are given in Section 5.
5. Results and discussion
5.1. Demand scenarios
5.1.1. Reference demand and supply scenarioThe simulation results show that the bricks walls design alterna-
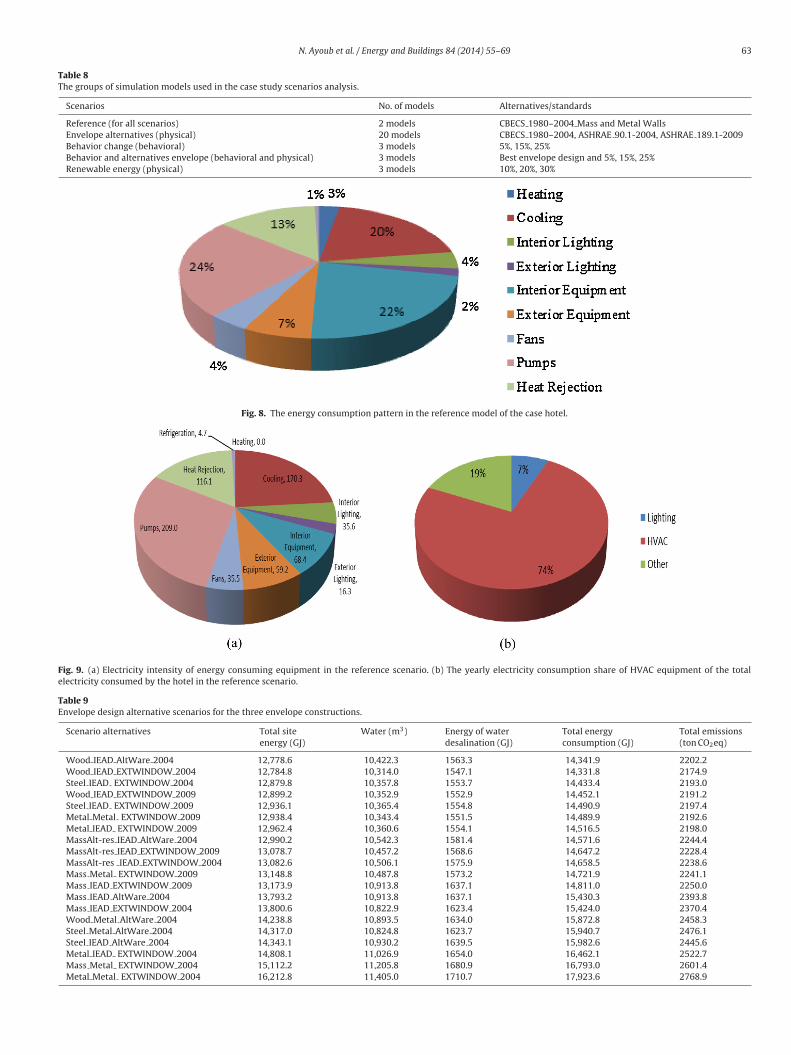
tive is more efficient than wall metallic from energy conservationpoint of view. The annual energy consumption of the hotel withbrick walls alternative is about 13,808 GJ with 7% less energy con-sumption and 6% less in CO2 emissions than the metallic wallsalternative. Therefore, hotel building design with mass exteriorwalls, exterior roof and fixed windows is used as a reference casefor all scenarios. Fig. 8 shows the results of energy consumptionstructure in the reference scenario.
It illustrates that HVAC systems represents the largest ratio ofenergy consumption with about 64% of the total energy, whichis normal for a hot country like Qatar. The total electricity inten-sity in this scenario is about 715 kWh/m2. The electricity intensityof all energy consumption equipment is shown in Fig. 9(a). TheHVAC equipment consumes about 74% of the electricity used in thebuilding during the year as shown in Fig. 9(b).
Electric chillerTemperature of chilledwater leaving system
6.67 ◦C
BoilerThermal efficiency 80%Design water outlettemperature
82 ◦C
Outlet upper outlettemperature
99 ◦C
Air loopCooling design supplyair temperature
14 ◦C
Heating design supplyair temperature
40 ◦C
Outdoor air in cooling 100%Outdoor air in heating 100%Cooling supply airhumidity ratios
0.0080 kg water/kg dryair
Heating supply airhumidity ratios
0.0085 kg water/kg dryair
Air flow rate 0.3 m3/s
N. Ayoub et al. / Energy and Buildings 84 (2014) 55–69 63
Table 8The groups of simulation models used in the case study scenarios analysis.
Scenarios No. of models Alternatives/standards
Reference (for all scenarios) 2 models CBECS 1980–2004 Mass and Metal WallsEnvelope alternatives (physical) 20 models CBECS 1980–2004, ASHRAE 90.1-2004, ASHRAE 189.1-2009Behavior change (behavioral) 3 models 5%, 15%, 25%Behavior and alternatives envelope (behavioral and physical) 3 models Best envelope design and 5%, 15%, 25%Renewable energy (physical) 3 models 10%, 20%, 30%
Fig. 8. The energy consumption pattern in the reference model of the case hotel.
Fig. 9. (a) Electricity intensity of energy consuming equipment in the reference scenario. (b) The yearly electricity consumption share of HVAC equipment of the totalelectricity consumed by the hotel in the reference scenario.
Table 9Envelope design alternative scenarios for the three envelope constructions.
Scenario alternatives Total siteenergy (GJ)
Water (m3) Energy of waterdesalination (GJ)
Total energyconsumption (GJ)
Total emissions(ton CO2eq)
Wood IEAD AltWare 2004 12,778.6 10,422.3 1563.3 14,341.9 2202.2Wood IEAD EXTWINDOW 2004 12,784.8 10,314.0 1547.1 14,331.8 2174.9Steel IEAD EXTWINDOW 2004 12,879.8 10,357.8 1553.7 14,433.4 2193.0Wood IEAD EXTWINDOW 2009 12,899.2 10,352.9 1552.9 14,452.1 2191.2Steel IEAD EXTWINDOW 2009 12,936.1 10,365.4 1554.8 14,490.9 2197.4Metal Metal EXTWINDOW 2009 12,938.4 10,343.4 1551.5 14,489.9 2192.6Metal IEAD EXTWINDOW 2009 12,962.4 10,360.6 1554.1 14,516.5 2198.0MassAlt-res IEAD AltWare 2004 12,990.2 10,542.3 1581.4 14,571.6 2244.4MassAlt-res IEAD EXTWINDOW 2009 13,078.7 10,457.2 1568.6 14,647.2 2228.4MassAlt-res IEAD EXTWINDOW 2004 13,082.6 10,506.1 1575.9 14,658.5 2238.6Mass Metal EXTWINDOW 2009 13,148.8 10,487.8 1573.2 14,721.9 2241.1Mass IEAD EXTWINDOW 2009 13,173.9 10,913.8 1637.1 14,811.0 2250.0Mass IEAD AltWare 2004 13,793.2 10,913.8 1637.1 15,430.3 2393.8Mass IEAD EXTWINDOW 2004 13,800.6 10,822.9 1623.4 15,424.0 2370.4Wood Metal AltWare 2004 14,238.8 10,893.5 1634.0 15,872.8 2458.3Steel Metal AltWare 2004 14,317.0 10,824.8 1623.7 15,940.7 2476.1Steel IEAD AltWare 2004 14,343.1 10,930.2 1639.5 15,982.6 2445.6Metal IEAD EXTWINDOW 2004 14,808.1 11,026.9 1654.0 16,462.1 2522.7Mass Metal EXTWINDOW 2004 15,112.2 11,205.8 1680.9 16,793.0 2601.4Metal Metal EXTWINDOW 2004 16,212.8 11,405.0 1710.7 17,923.6 2768.9
64 N. Ayoub et al. / Energy and Buildings 84 (2014) 55–69
F alterne
(acchtd(saaa
eeaclodhabttSbisanrf
bt
TR
ig. 10. (a) Electricity intensity of energy consuming equipment in the best designlectricity consumed by the hotel in the best design alternative.
Exterior Wall Roof Exterior Window) are shown in Table 9. Inddition to the energy consumed by energy operations, we havealculated the energy used in water desalination. The reason foronsidering water consumption as a factor is the fact that Qataras no source of fresh water and it relies mainly on water desalina-ion to supply potable water [69]. According to a recent study, theesalting of one cubic meter of water consumes 8.18 MJ of energy2.27 kWh of electricity) [46]. This means, the larger the water con-umption, the higher the energy required to operate the buildinglong its life time. Therefore, reducing water consumption by suit-ble consumption and design policies can indirectly improves themount of energy conservation in the building.
It is clear that the scenario Wood IEAD AltWare is the leastnergy consumption design option. Also, Table 3 shows that consid-ring energy used for water desalination has made the secondlternative (Wood IEAD EXTWINDOW 2004) is the lowest energyonsumption option. The CO2 emissions for this alternative are theowest between all alternatives too. This shows the importancef considering water consumption as an important sustainabilityesign factor. The best alternative (Wood IEAD AltWare 2004) thatas the lowest site energy consumption ranked the seventh in themount of CO2 emissions. The difference in energy consumptionetween the first eight alternatives is less than 2%. It is importanto note that the first three alternatives with lower energy consump-ion are from ASHRAE Standard 90.1—2004. Although ASHRAEtandard 189.1—2009 is the newest standard that considers greenuilding principles, one of its modeled alternatives ranked fourth
n the twenty alternatives presented here. This agrees with a recenttudy on the applicability of international standard on the hot andrid climate of GCC countries. In that study the applicability of inter-ational leading schemes (BREEAM and LEED) was tested and theesults showed that the international assessment schemes are not
ully applicable to the Saudi built environment [70].One of the reasons for ASHRAE Standard 90.1—2004 to performetter than ASHRAE Standard 189.1—2009 in this study is, may be,hat we have assessed the alternatives over one year and did not
able 10esults of behavior change scenario alternatives.
Reference scenario Alterconsu
Total site energy [GJ] 13,808.83 13,37Total electricity intensity (kWh/m2) 713.95 69Site energy conservation potential (%) 0
Electric energy conservation potential (%) 0
ative. (b) The yearly electricity consumption share of HVAC equipment of the total
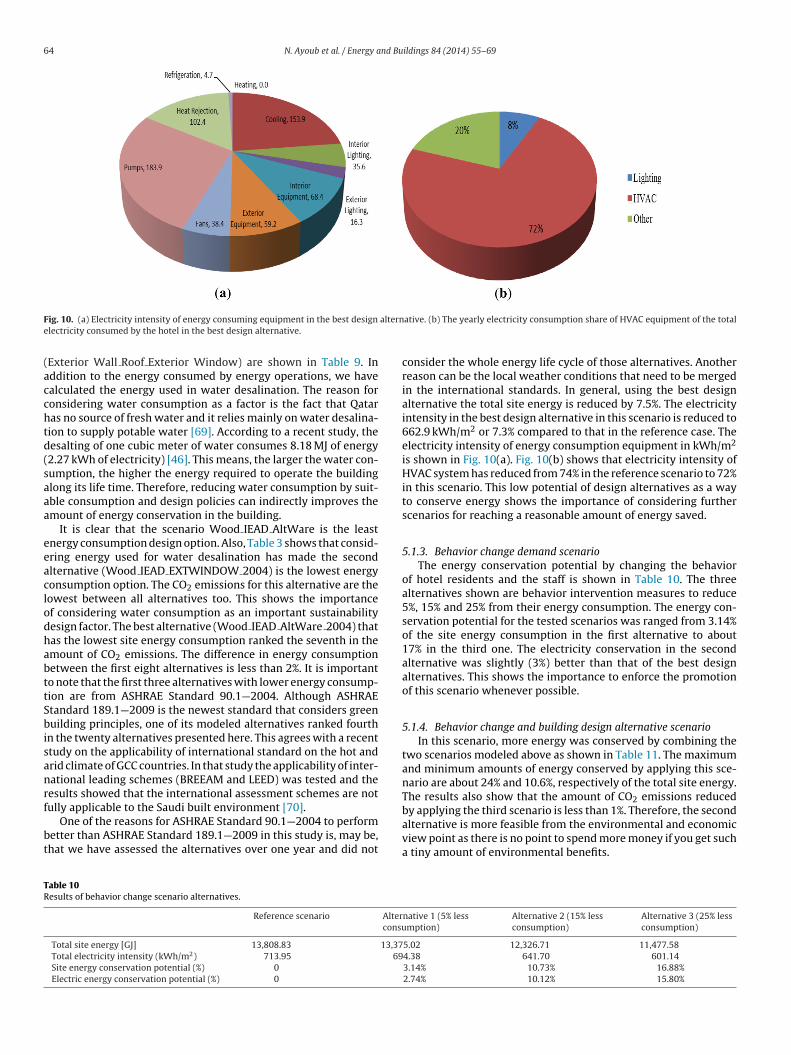
consider the whole energy life cycle of those alternatives. Anotherreason can be the local weather conditions that need to be mergedin the international standards. In general, using the best designalternative the total site energy is reduced by 7.5%. The electricityintensity in the best design alternative in this scenario is reduced to662.9 kWh/m2 or 7.3% compared to that in the reference case. Theelectricity intensity of energy consumption equipment in kWh/m2
is shown in Fig. 10(a). Fig. 10(b) shows that electricity intensity ofHVAC system has reduced from 74% in the reference scenario to 72%in this scenario. This low potential of design alternatives as a wayto conserve energy shows the importance of considering furtherscenarios for reaching a reasonable amount of energy saved.
5.1.3. Behavior change demand scenarioThe energy conservation potential by changing the behavior
of hotel residents and the staff is shown in Table 10. The threealternatives shown are behavior intervention measures to reduce5%, 15% and 25% from their energy consumption. The energy con-servation potential for the tested scenarios was ranged from 3.14%of the site energy consumption in the first alternative to about17% in the third one. The electricity conservation in the secondalternative was slightly (3%) better than that of the best designalternatives. This shows the importance to enforce the promotionof this scenario whenever possible.
5.1.4. Behavior change and building design alternative scenarioIn this scenario, more energy was conserved by combining the
two scenarios modeled above as shown in Table 11. The maximumand minimum amounts of energy conserved by applying this sce-nario are about 24% and 10.6%, respectively of the total site energy.The results also show that the amount of CO2 emissions reduced
by applying the third scenario is less than 1%. Therefore, the secondalternative is more feasible from the environmental and economicview point as there is no point to spend more money if you get sucha tiny amount of environmental benefits.native 1 (5% lessmption)
Alternative 2 (15% lessconsumption)
Alternative 3 (25% lessconsumption)
5.02 12,326.71 11,477.584.38 641.70 601.143.14% 10.73% 16.88%2.74% 10.12% 15.80%
N. Ayoub et al. / Energy and Buildings 84 (2014) 55–69 65
Table 11Behavior change and building design alternatives.
Referencescenario
Alternative 1 (bestdesign and 5% lessconsumption)
Alternative 2 (bestdesign and 15% lessconsumption)
Alternative 3 (bestdesign and 25% lessconsumption)
Total site energy [GJ] 13,808.83 12,345.25 11,302.37 10,478.25Total electricity intensity (kWh/m2) 713.95 642.23 589.99 550.82
11
5
igoTeegCttrr
Site energy conservation potential (%) 0
Electric energy conservation potential (kWh/m2) 0
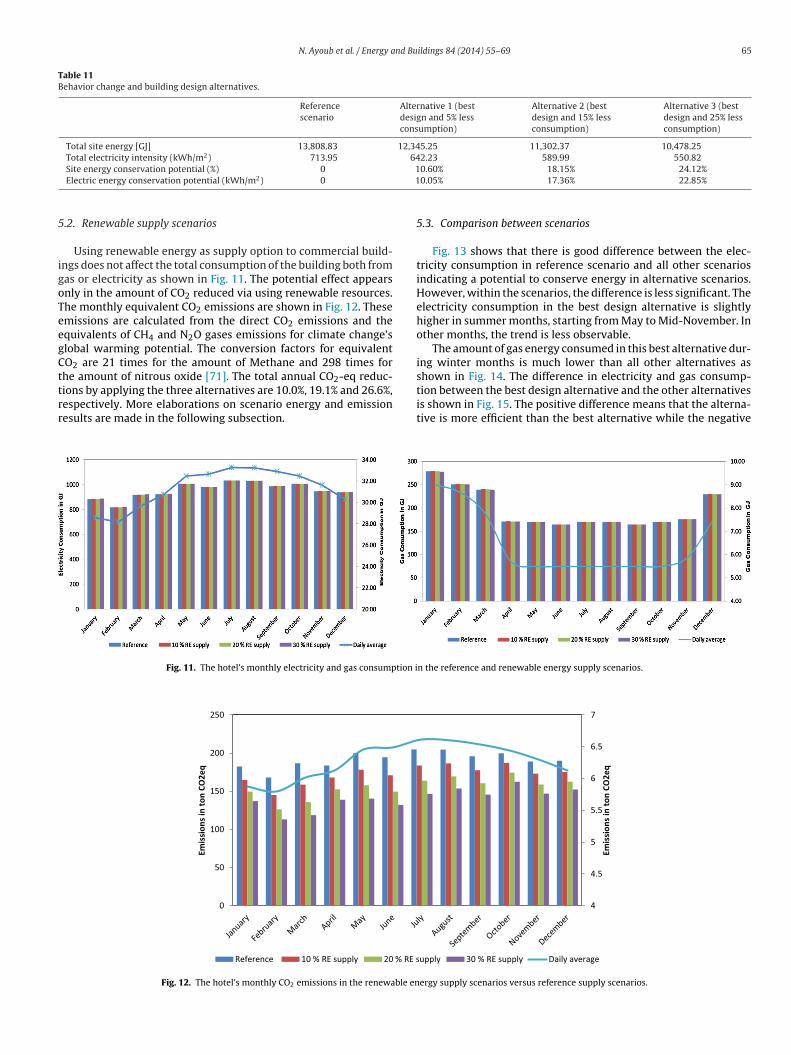
.2. Renewable supply scenarios
Using renewable energy as supply option to commercial build-ngs does not affect the total consumption of the building both fromas or electricity as shown in Fig. 11. The potential effect appearsnly in the amount of CO2 reduced via using renewable resources.he monthly equivalent CO2 emissions are shown in Fig. 12. Thesemissions are calculated from the direct CO2 emissions and thequivalents of CH4 and N2O gases emissions for climate change’slobal warming potential. The conversion factors for equivalentO2 are 21 times for the amount of Methane and 298 times forhe amount of nitrous oxide [71]. The total annual CO2-eq reduc-
ions by applying the three alternatives are 10.0%, 19.1% and 26.6%,espectively. More elaborations on scenario energy and emissionesults are made in the following subsection.Fig. 11. The hotel’s monthly electricity and gas consumption i
0
50
100
150
200
250
Emis
sions
in to
n CO
2eq
Reference 10 % RE supply 20 % RE s
Fig. 12. The hotel’s monthly CO2 emissions in the renewable en
0.60% 18.15% 24.12%0.05% 17.36% 22.85%
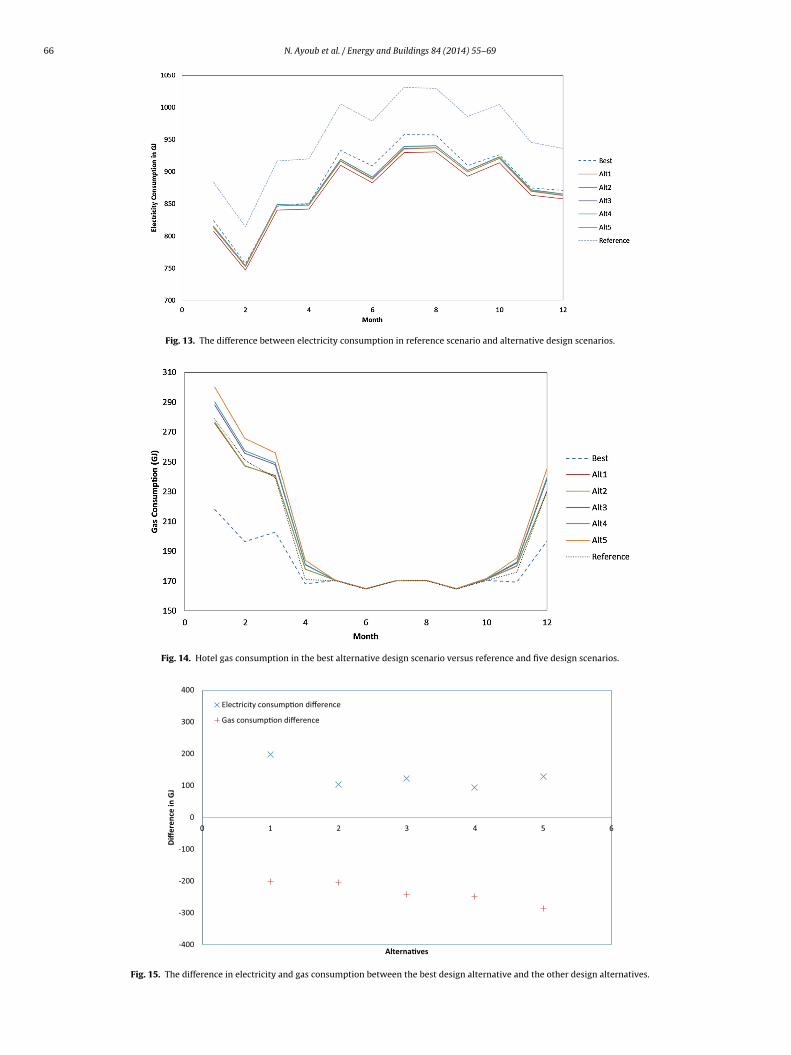
5.3. Comparison between scenarios
Fig. 13 shows that there is good difference between the elec-tricity consumption in reference scenario and all other scenariosindicating a potential to conserve energy in alternative scenarios.However, within the scenarios, the difference is less significant. Theelectricity consumption in the best design alternative is slightlyhigher in summer months, starting from May to Mid-November. Inother months, the trend is less observable.
The amount of gas energy consumed in this best alternative dur-ing winter months is much lower than all other alternatives asshown in Fig. 14. The difference in electricity and gas consump-
tion between the best design alternative and the other alternativesis shown in Fig. 15. The positive difference means that the alterna-tive is more efficient than the best alternative while the negativen the reference and renewable energy supply scenarios.
4
4.5
5
5.5
6
6.5
7
Emis
sions
in to
n CO
2eq
upply 30 % RE supply Daily average
ergy supply scenarios versus reference supply scenarios.
66 N. Ayoub et al. / Energy and Buildings 84 (2014) 55–69
Fig. 13. The difference between electricity consumption in reference scenario and alternative design scenarios.
Fig. 14. Hotel gas consumption in the best alternative design scenario versus reference and five design scenarios.
-400
-300
-200
-100
0
100
200
300
400
0 1 2 3 4 5 6
Diffe
renc
e in
GJ
Alterna�ves
Electric ity consump�on difference
Gas cons ump�on difference
Fig. 15. The difference in electricity and gas consumption between the best design alternative and the other design alternatives.
N. Ayoub et al. / Energy and Buildings 84 (2014) 55–69 67
best
dcdatmcar
sen1paotwsaic
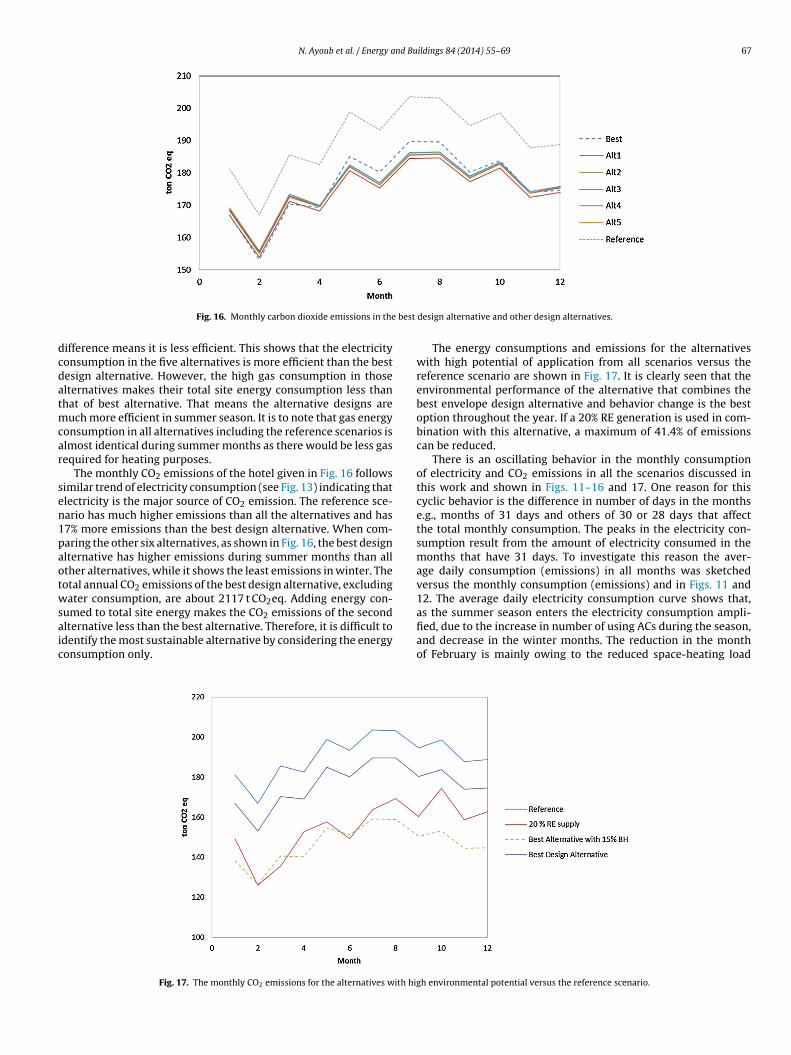
Fig. 16. Monthly carbon dioxide emissions in the
ifference means it is less efficient. This shows that the electricityonsumption in the five alternatives is more efficient than the bestesign alternative. However, the high gas consumption in thoselternatives makes their total site energy consumption less thanhat of best alternative. That means the alternative designs are
uch more efficient in summer season. It is to note that gas energyonsumption in all alternatives including the reference scenarios islmost identical during summer months as there would be less gasequired for heating purposes.
The monthly CO2 emissions of the hotel given in Fig. 16 followsimilar trend of electricity consumption (see Fig. 13) indicating thatlectricity is the major source of CO2 emission. The reference sce-ario has much higher emissions than all the alternatives and has7% more emissions than the best design alternative. When com-aring the other six alternatives, as shown in Fig. 16, the best designlternative has higher emissions during summer months than allther alternatives, while it shows the least emissions in winter. Theotal annual CO2 emissions of the best design alternative, excludingater consumption, are about 2117 t CO2eq. Adding energy con-
umed to total site energy makes the CO emissions of the second
2lternative less than the best alternative. Therefore, it is difficult todentify the most sustainable alternative by considering the energyonsumption only.Fig. 17. The monthly CO2 emissions for the alternatives with hig
design alternative and other design alternatives.
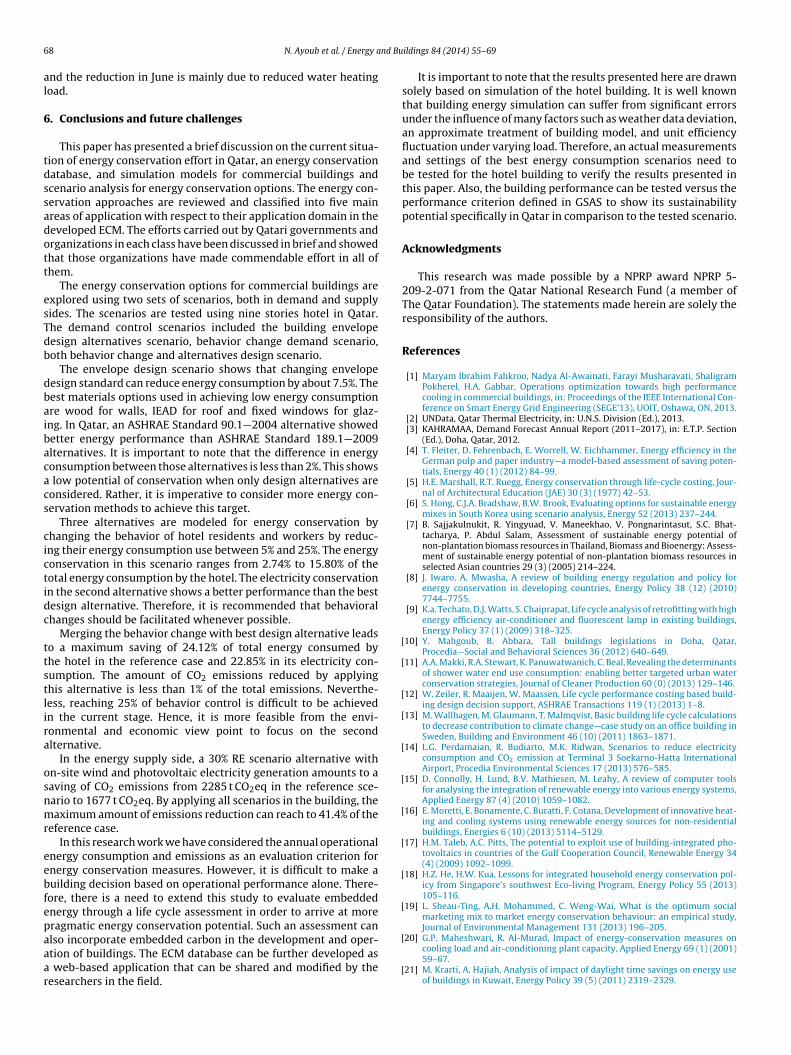
The energy consumptions and emissions for the alternativeswith high potential of application from all scenarios versus thereference scenario are shown in Fig. 17. It is clearly seen that theenvironmental performance of the alternative that combines thebest envelope design alternative and behavior change is the bestoption throughout the year. If a 20% RE generation is used in com-bination with this alternative, a maximum of 41.4% of emissionscan be reduced.
There is an oscillating behavior in the monthly consumptionof electricity and CO2 emissions in all the scenarios discussed inthis work and shown in Figs. 11–16 and 17. One reason for thiscyclic behavior is the difference in number of days in the monthse.g., months of 31 days and others of 30 or 28 days that affectthe total monthly consumption. The peaks in the electricity con-sumption result from the amount of electricity consumed in themonths that have 31 days. To investigate this reason the aver-age daily consumption (emissions) in all months was sketchedversus the monthly consumption (emissions) and in Figs. 11 and12. The average daily electricity consumption curve shows that,as the summer season enters the electricity consumption ampli-
fied, due to the increase in number of using ACs during the season,and decrease in the winter months. The reduction in the monthof February is mainly owing to the reduced space-heating loadh environmental potential versus the reference scenario.
6 nd Bu
al
6
tdssadott
esTdb
dbaibacacs
cictidc
ttstlira
osnmr
eebfepaaar
[
[
[
[
[
[
[
[
[
[
8 N. Ayoub et al. / Energy a
nd the reduction in June is mainly due to reduced water heatingoad.
. Conclusions and future challenges
This paper has presented a brief discussion on the current situa-ion of energy conservation effort in Qatar, an energy conservationatabase, and simulation models for commercial buildings andcenario analysis for energy conservation options. The energy con-ervation approaches are reviewed and classified into five mainreas of application with respect to their application domain in theeveloped ECM. The efforts carried out by Qatari governments andrganizations in each class have been discussed in brief and showedhat those organizations have made commendable effort in all ofhem.
The energy conservation options for commercial buildings arexplored using two sets of scenarios, both in demand and supplyides. The scenarios are tested using nine stories hotel in Qatar.he demand control scenarios included the building envelopeesign alternatives scenario, behavior change demand scenario,oth behavior change and alternatives design scenario.
The envelope design scenario shows that changing envelopeesign standard can reduce energy consumption by about 7.5%. Theest materials options used in achieving low energy consumptionre wood for walls, IEAD for roof and fixed windows for glaz-ng. In Qatar, an ASHRAE Standard 90.1—2004 alternative showedetter energy performance than ASHRAE Standard 189.1—2009lternatives. It is important to note that the difference in energyonsumption between those alternatives is less than 2%. This shows
low potential of conservation when only design alternatives areonsidered. Rather, it is imperative to consider more energy con-ervation methods to achieve this target.
Three alternatives are modeled for energy conservation byhanging the behavior of hotel residents and workers by reduc-ng their energy consumption use between 5% and 25%. The energyonservation in this scenario ranges from 2.74% to 15.80% of theotal energy consumption by the hotel. The electricity conservationn the second alternative shows a better performance than the bestesign alternative. Therefore, it is recommended that behavioralhanges should be facilitated whenever possible.
Merging the behavior change with best design alternative leadso a maximum saving of 24.12% of total energy consumed byhe hotel in the reference case and 22.85% in its electricity con-umption. The amount of CO2 emissions reduced by applyinghis alternative is less than 1% of the total emissions. Neverthe-ess, reaching 25% of behavior control is difficult to be achievedn the current stage. Hence, it is more feasible from the envi-onmental and economic view point to focus on the secondlternative.
In the energy supply side, a 30% RE scenario alternative withn-site wind and photovoltaic electricity generation amounts to aaving of CO2 emissions from 2285 t CO2eq in the reference sce-ario to 1677 t CO2eq. By applying all scenarios in the building, theaximum amount of emissions reduction can reach to 41.4% of the
eference case.In this research work we have considered the annual operational
nergy consumption and emissions as an evaluation criterion fornergy conservation measures. However, it is difficult to make auilding decision based on operational performance alone. There-ore, there is a need to extend this study to evaluate embeddednergy through a life cycle assessment in order to arrive at moreragmatic energy conservation potential. Such an assessment can
lso incorporate embedded carbon in the development and oper-tion of buildings. The ECM database can be further developed asweb-based application that can be shared and modified by theesearchers in the field.
[
[
ildings 84 (2014) 55–69
It is important to note that the results presented here are drawnsolely based on simulation of the hotel building. It is well knownthat building energy simulation can suffer from significant errorsunder the influence of many factors such as weather data deviation,an approximate treatment of building model, and unit efficiencyfluctuation under varying load. Therefore, an actual measurementsand settings of the best energy consumption scenarios need tobe tested for the hotel building to verify the results presented inthis paper. Also, the building performance can be tested versus theperformance criterion defined in GSAS to show its sustainabilitypotential specifically in Qatar in comparison to the tested scenario.
Acknowledgments
This research was made possible by a NPRP award NPRP 5-209-2-071 from the Qatar National Research Fund (a member ofThe Qatar Foundation). The statements made herein are solely theresponsibility of the authors.
References
[1] Maryam Ibrahim Fahkroo, Nadya Al-Awainati, Farayi Musharavati, ShaligramPokherel, H.A. Gabbar, Operations optimization towards high performancecooling in commercial buildings, in: Proceedings of the IEEE International Con-ference on Smart Energy Grid Engineering (SEGE’13), UOIT, Oshawa, ON, 2013.
[2] UNData, Qatar Thermal Electricity, in: U.N.S. Division (Ed.), 2013.[3] KAHRAMAA, Demand Forecast Annual Report (2011–2017), in: E.T.P. Section
(Ed.), Doha, Qatar, 2012.[4] T. Fleiter, D. Fehrenbach, E. Worrell, W. Eichhammer, Energy efficiency in the
German pulp and paper industry—a model-based assessment of saving poten-tials, Energy 40 (1) (2012) 84–99.
[5] H.E. Marshall, R.T. Ruegg, Energy conservation through life-cycle costing, Jour-nal of Architectural Education (JAE) 30 (3) (1977) 42–53.
[6] S. Hong, C.J.A. Bradshaw, B.W. Brook, Evaluating options for sustainable energymixes in South Korea using scenario analysis, Energy 52 (2013) 237–244.
[7] B. Sajjakulnukit, R. Yingyuad, V. Maneekhao, V. Pongnarintasut, S.C. Bhat-tacharya, P. Abdul Salam, Assessment of sustainable energy potential ofnon-plantation biomass resources in Thailand, Biomass and Bioenergy: Assess-ment of sustainable energy potential of non-plantation biomass resources inselected Asian countries 29 (3) (2005) 214–224.
[8] J. Iwaro, A. Mwasha, A review of building energy regulation and policy forenergy conservation in developing countries, Energy Policy 38 (12) (2010)7744–7755.
[9] K.a. Techato, D.J. Watts, S. Chaiprapat, Life cycle analysis of retrofitting with highenergy efficiency air-conditioner and fluorescent lamp in existing buildings,Energy Policy 37 (1) (2009) 318–325.
10] Y. Mahgoub, B. Abbara, Tall buildings legislations in Doha, Qatar,Procedia—Social and Behavioral Sciences 36 (2012) 640–649.
11] A.A. Makki, R.A. Stewart, K. Panuwatwanich, C. Beal, Revealing the determinantsof shower water end use consumption: enabling better targeted urban waterconservation strategies, Journal of Cleaner Production 60 (0) (2013) 129–146.
12] W. Zeiler, R. Maaijen, W. Maassen, Life cycle performance costing based build-ing design decision support, ASHRAE Transactions 119 (1) (2013) 1–8.
13] M. Wallhagen, M. Glaumann, T. Malmqvist, Basic building life cycle calculationsto decrease contribution to climate change—case study on an office building inSweden, Building and Environment 46 (10) (2011) 1863–1871.
14] L.G. Perdamaian, R. Budiarto, M.K. Ridwan, Scenarios to reduce electricityconsumption and CO2 emission at Terminal 3 Soekarno-Hatta InternationalAirport, Procedia Environmental Sciences 17 (2013) 576–585.
15] D. Connolly, H. Lund, B.V. Mathiesen, M. Leahy, A review of computer toolsfor analysing the integration of renewable energy into various energy systems,Applied Energy 87 (4) (2010) 1059–1082.
16] E. Moretti, E. Bonamente, C. Buratti, F. Cotana, Development of innovative heat-ing and cooling systems using renewable energy sources for non-residentialbuildings, Energies 6 (10) (2013) 5114–5129.
17] H.M. Taleb, A.C. Pitts, The potential to exploit use of building-integrated pho-tovoltaics in countries of the Gulf Cooperation Council, Renewable Energy 34(4) (2009) 1092–1099.
18] H.Z. He, H.W. Kua, Lessons for integrated household energy conservation pol-icy from Singapore’s southwest Eco-living Program, Energy Policy 55 (2013)105–116.
19] L. Sheau-Ting, A.H. Mohammed, C. Weng-Wai, What is the optimum socialmarketing mix to market energy conservation behaviour: an empirical study,Journal of Environmental Management 131 (2013) 196–205.
20] G.P. Maheshwari, R. Al-Murad, Impact of energy-conservation measures oncooling load and air-conditioning plant capacity, Applied Energy 69 (1) (2001)59–67.
21] M. Krarti, A. Hajiah, Analysis of impact of daylight time savings on energy useof buildings in Kuwait, Energy Policy 39 (5) (2011) 2319–2329.
nd Bu
[
[
[
[
[
[
[
[
[
[
[
[
[[
[
[
[
[
[[
[
[
[
[
[
[
[
[
[
[
[
[
[
[
[
[
[
[
[
[
[
[
[
[
[
[
[
[
[
N. Ayoub et al. / Energy a
22] A. Alajmi, Energy audit of an educational building in a hot summer climate,Energy and Buildings 47 (2012) 122–130.
23] M. Fasiuddin, I. Budaiwi, HVAC system strategies for energy conservation incommercial buildings in Saudi Arabia, Energy and Buildings 43 (12) (2011)3457–3466.
24] A.M.R. Al-Marafie, R.K. Suri, G.P. Maheshwari, Energy and power managementin air-conditioned buildings in Kuwait, Energy 14 (9) (1989) 557–562.
25] A.H. Al-Badi, M.H. Albadi, Domestic solar water heating system in Oman: cur-rent status and future prospects, Renewable and Sustainable Energy Reviews16 (8) (2012) 5727–5731.
26] S.A. Alajlan, M.S. Smiai, U.A. Elani, Effective tools toward electrical energy con-servation in Saudi Arabia, Energy Conversion and Management 39 (13) (1998)1337–1349.
27] M.J. Al-Khawaja, Determination and selecting the optimum thickness of insu-lation for buildings in hot countries by accounting for solar radiation, AppliedThermal Engineering 24 (17–18) (2004) 2601–2610.
28] I. Iqbal, M.S. Al-Homoud, Parametric analysis of alternative energy conserva-tion measures in an office building in hot and humid climate, Building andEnvironment 42 (5) (2007) 2166–2177.
29] S. Sharples, H. Radhi, Assessing the technical and economic performance ofbuilding integrated photovoltaics and their value to the GCC society, RenewableEnergy 55 (2013) 150–159.
30] N. Ayoub, N. Yuji, Governmental intervention approaches to promote renew-able energies—special emphasis on Japanese feed-in tariff, Energy Policy 43(2012) 191–201.
31] M. Darwish, Towards energy conservation in Qatar, Open Journal of EnergyEfficiency 2 (2013) 176–191.
32] F.A. Kaabi, Conservation Plan for Tarsheed, Qatar General Electricity andWater Corporation, Conservation & Energy Efficiency Department, Doha, Qatar,2012.
33] GulfTimes, Qatar sets new energy-saving standards for air-conditioners, GulfTimes, Doha, Qatar, 2013.
34] Chevron, Chevron Center for Sustainable Energy Efficiency, Doha, 2011.35] GORD, Qatar Sustainability Assessment System (QSAS), Gulf Organization for
Research and Development Doha, Qatar, 2010.36] A. Sharifi, A. Murayama, A critical review of seven selected neighborhood sus-
tainability assessment tools, Environmental Impact Assessment Review 38(2013) 73–87.
37] E. Elsarrag, Y. Alhorr, Modelling the thermal energy demand of a Passive-Housein the Gulf Region: the impact of thermal insulation, International Journal ofSustainable Built Environment 1 (1) (2012) 1–15.
38] Y.A. Horr, Commercial & Residential GSAS Training Manual V 2.1, Gulf Organi-sation for Research & Development Doha, 2013.
39] H. Doukas, K.D. Patlitzianas, A.G. Kagiannas, J. Psarras, Renewable energysources and rationale use of energy development in the countries of GCC: mythor reality? Renewable Energy 31 (6) (2006) 755–770.
40] M. Preston, Renewable Energy in Qatar, Norton Rose Fulbright, Abu Dhabi, 2011.41] A.W. Bhutto, A.A., Bazmi, G., Zahedi, J.J. Klemes, A Review of Progress in Renew-
able Energy Implementation in the Gulf Cooperation Council Countries, Journalof Cleaner Production, (0).
42] QNDS, Qatar National Development Strategy 2011–2016, Towards QatarNational Vision 2030, Q.G.S.f.D. Planning, Doha, 2011.
43] NIBS, Building Envelope Design Guide, The National Institute of Building Sci-ences, 2013.
44] Y. Ali, M. Mustafa, S. Al-Mashaqbah, K. Mashal, M. Mohsen, Potential of energysavings in the hotel sector in Jordan, Energy Conversion and Management 49(11) (2008) 3391–3397.
45] ASHRAE, Building Envelope Climate Criteria, ANSI/ASHRAE/IESNA Standard 90,1-2007 Normative Appendix B, 2009.
46] M. Darwish, A.H. Hassabou, B. Shomar, Using Seawater Reverse Osmosis(SWRO) desalting system for less environmental impacts in Qatar, Desalination
309 (2013) 113–124.47] C.-C. Teng, J.-S. Horng, M.-L. Hu, L.-H. Chien, Y.-C. Shen, Developing energyconservation and carbon reduction indicators for the hotel industry inTaiwan, International Journal of Hospitality Management 31 (1) (2012)199–208.
[
ildings 84 (2014) 55–69 69
48] O. Berezan, C. Raab, M. Yoo, C. Love, Sustainable hotel practices and nationality:the impact on guest satisfaction and guest intention to return, InternationalJournal of Hospitality Management 34 (2013) 227–233.
49] T.-Y. Hsiao, C.-M. Chuang, N.-W. Kuo, S.M.-F. Yu, Establishing attributes of anenvironmental management system for green hotel evaluation, InternationalJournal of Hospitality Management 36 (2014) 197–208.
50] W. Abrahamse, L. Steg, Social influence approaches to encourage resourceconservation: a meta-analysis, Global Environmental Change 23 (6) (2013)1773–1785.
51] G. Morton, N. Griffiths, Achieving energy efficiency through behaviouralchange—what does it take? In: A.T. plc (Ed.), European Environment Agency,2012.
52] A.R. Carrico, M. Riemer, Motivating energy conservation in the workplace: anevaluation of the use of group-level feedback and peer education, Journal ofEnvironmental Psychology 31 (1) (2011) 1–13.
53] G. Peschiera, J.E. Taylor, The impact of peer network position on electricityconsumption in building occupant networks utilizing energy feedback systems,Energy and Buildings 49 (2012) 584–590.
54] CabinetOffice, Behaviour Change and Energy Use, Cabinet Office BehaviouralInsights Team, London, 2011.
55] G. Kok, S.H. Lo, G.-J.Y. Peters, R.A.C. Ruiter, Changing energy-related behavior:an intervention mapping approach, Energy Policy 39 (9) (2011) 5280–5286.
56] W. Abrahamse, L. Steg, C. Vlek, T. Rothengatter, A review of intervention studiesaimed at household energy conservation, Journal of Environmental Psychology25 (3) (2005) 273–291.
57] M.A. Delmas, M. Fischlein, O.I. Asensio, Information strategies and energy con-servation behavior: a meta-analysis of experimental studies from 1975 to 2012,Energy Policy 61 (2013) 729–739.
58] A.-H. Marafia, H.A. Ashour, Feasibility of Wind Energy Utilization in Qatar,Engineering Journal of Qatar University 15 (2002) 241–251.
59] A.H. Marafia, H.A. Ashour, Economics of off-shore/on-shore wind energy sys-tems in Qatar, Renewable Energy 28 (12) (2003) 1953–1963.
60] G. Lahn, F. Preston, Targets to promote energy savings in the Gulf CooperationCouncil states, Energy Strategy Reviews 2 (1) (2013) 19–30.
61] A.J. Marszal, P. Heiselberg, R. Lund Jensen, J. Nørgaard, On-site or off-site renew-able energy supply options? Life cycle cost analysis of a Net Zero EnergyBuilding in Denmark, Renewable Energy 44 (2012) 154–165.
62] M.J. Shawon, L. El Chaar, L.A. Lamont, Overview of wind energy and its cost inthe Middle East, Sustainable Energy Technologies and Assessments 2 (2013)1–11.
63] G.J. Dalton, D.A. Lockington, T.E. Baldock, Feasibility analysis of stand-alonerenewable energy supply options for a large hotel, Renewable Energy 33 (7)(2008) 1475–1490.
64] G.J. Dalton, D.A. Lockington, T.E. Baldock, Case study feasibility analysis ofrenewable energy supply options for small to medium-sized tourist accom-modations, Renewable Energy 34 (4) (2009) 1134–1144.
65] G.J. Dalton, D.A. Lockington, T.E. Baldock, Feasibility analysis of renewableenergy supply options for a grid-connected large hotel, Renewable Energy 34(4) (2009) 955–964.
66] S. Sinha, S.S. Chandel, Review of software tools for hybrid renewable energysystems, Renewable and Sustainable Energy Reviews 32 (2014) 192–205.
67] A. Abdelsalam, H.A. Gabbar, F. Musharavati, S. Pokharel, Dynamic aggre-gated building electricity load modeling and simulation, Simulation ModellingPractice and Theory, 2013, submitted for publication.
68] EnergyPlus, EnergyPlus Energy Simulation Software, in: E.E.a.R.E, US Depart-ment of Energy (Ed.).
69] R. Sadiq, F.I. Khan, B. Veitch, Evaluating offshore technologies for producedwater management using GreenPro-I—a risk-based life cycle analysis for greenand clean process selection and design, Computers & Chemical Engineering 29(5) (2005) 1023–1039.
70] S.H. Alyami, Y. Rezgui, A. Kwan, Developing sustainable building assessment
scheme for Saudi Arabia: Delphi consultation approach, Renewable and Sus-tainable Energy Reviews 27 (2013) 43–54.71] N. Ayoub, E. Elmoshi, H. Seki, Y. Naka, Evolutionary algorithms approach forintegrated bioenergy supply chains optimization, Energy Conversion and Man-agement 50 (12) (2009) 2944–2955.