energy consumption assessment in a conventional foodservice system
TRANSCRIPT

ENERGY CONSUMPTION ASSESSMENT IN A CONVENTIONAL FOODSERVICE SYSTEM
MARTHA J. BARCLAY, Ph.D., R.D.' Assistant Professor
Department of Home Economics The University of Iowa Iowa City, Iowa 52242
and
MARY JO HITCHCOCK, Ph.D., R.D. Professor
Department of Nutrition and Food Science The University of Tennessee Knoxville, Tennessee 3 791 6
Received for Publication February 14, 1984
ABSTRACT
A schematic energy flow decision model was developed for a conven- tional foodservice system. Quantitative energy consumption data were obtained by metering the flow of natural gas, steam condensate, and electricity in 15 selected pieces of foodservice equipment along the con- tinuum from receiving through service for 11 menu items. The mean energy consumption by equipment during the food product flow of each menu item ranged from 240 to 3,076 British thermal units per pound menu item.
INTRODUCTION
During the 1970s, financial expenditures for energy resources increased from 2 to approximately 19% of the total operating budget for many foodservice operations (National Restaurant Association, 1979). Because of this noticeable increase in cost for energy resources and the projections for even greater financial expenditures in the future, identifi-
~
'Send editorial correspondence to this author.
Journal of Foodservice Systems 3 (1984) 33-47. All rights reserved. Copyright 1984 by Food & Nutrition Press, Inc., Westport, Connecticut.
33
34 MARTHA J. BARCLAY AND MARY JO HITCHCOCK
cation of energy resource consumption is important to the administrative dietitian. Identifying and monitoring energy resource consumption is the first step toward minimizing financial expenditures for energy. Theoreti- cal studies have described potential energy usage (Dwyer et al. 1977; McProud 1977); however, in-house metering studies are necessary to describe actual energy consumption. Therefore, the purposes of this research were: (1) to develop a schematic energy-flow decision model; (2) to meter the energy resource consumption along the food-product flow continuum, and (3) to determine the quantity of energy resources con- sumed to produce one pound of a selected menu item. This information, in turn, should assist the administrative dietitian in making decisions concerning effective energy usage in a foodservice operation.
EXPERIMENTAL METHODS
Prior to the actual metering of energy usage, a pilot study was con- ducted at one of The University of Tennessee, Knoxville, foodservice facilities to investigate the food-product flow of menu items; to identify the equipment to be monitored including the type of meter hook-up required and associated variables; and the beginning/ending points of food processing. Since metering took place during the actual storage, preparation, and serving of menu items at this cafeteria, food products were selected from the cycle menus on the basis of equipment required for processing and frequency of service. Selected items were roast beef, meatloaf, fried chicken, baked ham, egg products, bacon, sausage, corn- on-the-cob, green peas, vegetable soup, and oatmeal. All of the menu items studied were prepared from ingredients purchased according to specifications developed by the University Food Services using standard- ized recipes. Identical quantities of each menu item were used for each replication. The as-purchased (AP) mass of each menu item prepared was selected for monitoring instead of the edible-portion (EP) mass. Observations made during the pilot study suggested that even though a constant amount of each unprocessed menu item was prepared according to a standardized recipe, the resultant EP mass varied. In addition, this investigation was conducted in an ongoing operation of meal service to the students which could not be disrupted. All menu items were prepared with only one type of hot food preparation equipment, except meatloaf, and it was prepared in both the gas forced-air convection oven and the gas rotary oven.

ENERGY CONSUMPTION ASSESSMENT 35
Food Product Flow
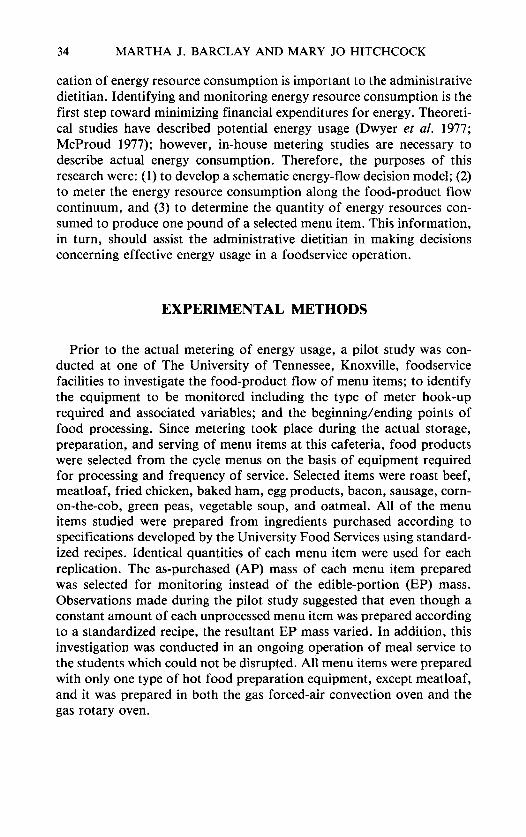
Each selected menu item was followed from the receipt of the ingredients through the service of the prepared menu item. A minimum of three replications was made of the food product flow and the monitor- ing of the quantitative energy consumption along the flow for each menu item. The foodservice areas included the receipt, storage, preparation, holding, and service areas (Table 1).
Equipment
Electric, natural gas, and steam using equipment was identified. The electric equipment included a grill, deep-fat fryer, steam table, warming oven, slicer, and compressors for three refrigerators, and two freezers. The natural-gas equipment was the convection oven and the rotary oven. The condensate flow of a jet steamer, a 20-gallon steam jacketed kettle, and a 60-gallon steam jacketed kettle was metered. The equipment was maintained routinely by the inhouse maintenance staff. This study did not include the metering of sanitation equipment, lights, or the heating, ventilation, and air-conditioning (HVAC) system.
Metering
Meters used to monitor electric equipment were model MT 145 kilo- watt-hour meters. Only three electrical meters could be installed at one time because of possible interference with electrical service and safety precautions; therefore, meters were periodically rotated between equip- ment. Hook-ups were made by splicing meter lines with current lines between the wall receptable and the equipment or between the fuse box and the equipment. Model No. lA, Sprague Gas Meters were installed in the gas input line of the rotary and convection ovens; model 00-1 1, Niagara Nutating Disc Liquid Meters were installed in the condensate line of the steam equipment. A copper coil was submerged in an ice bath preceding the condensate meter to slow the expulsion of condensate from the jet steamer only. All installations were approved by the local util- ity company representative and the University maintenance staff representatives.
Quantitative energy consumption data were obtained for each piece of equipment during the processing of selected menu items. Quantitative
Tabl
e 1.
Foo
dser
vice
are
as,
sele
cted
equ
ipm
ent
and
asso
ciat
ed v
aria
bles
mon
itore
d
Ax
Equipment
Associated Variables
Receiving
Refrigerat
ors
Power
rating
and
stor
age
Freezer
Dimensions
Ambi
ent
temperature
Initial product
temperature
Bus i
nesslnon- bus iness hours
Thermostat setting
Quantity of p
roduct s
tored
Product
k tored
Duty
cyc
le
Preparation
Refrigerat
or
Power
rating
Freezer
Diminsions
Ambi
ent
temperature
Initial product
temp
erat
ure
Business/non-business
hour
s Pr
oduc
t ktored
Thermostat setting
Quan
tity
of product
stored
Duty c
ycle
Grill
Power
rating
Ther
most
at setting
Deep
-fat
fryer Dimensions
Duty
cyc
le
Rotary over
Product
Quantity. of product prepared
Convection ove
n Product
temperature
Equipment
activity
Slicer
Power
rating
Product
Prod
uct temperature
Quan
tity
of product
Steam jacketed Power rating
Kettles
Capacity
Jet
steame
rs
Product
Product
temerature
Quantity o
f product
Equipment
activity
Holdin!
and
Warming oven
Power
rating
Product
temp
erat
ure
Duty c
ycle
se
rvic
e Steam tabl
e Dimensions
Quantity of
product
Equipment
activity
Product
Number o
f we
lls
filled1
Percent
fill o
f ov
en2
it; > z U
X
lfor steam table
Zfor
warming oven

ENERGY CONSUMPTION ASSESSMENT 37
energy consumption data was obtained for the grill during approximately 12 h of processing of eggs; for the deep-fat fryer during approximately 6 h of the processing of fried chicken; for the rotary oven during approxi- mately 12 h of processing of meatloaf and roast beef; for the convection oven during at least three processing trials of baked ham, meatloaf, bacon and sausage patties; for the slicer during the processing of roast beef and baked ham; for the steam jacketed kettles during at least five processing trials for each corn-on-the-cob, oatmeal, and vegetable soup; and for the jet steamers during at least seven processing trials for peas. Meter readings for the refrigerators and freezers were taken during both the business and nonbusiness hours for three consecutive days for each piece of equipment to reflect a typical situation. Meter readings were taken during and between meal service periods for the holding and service equipment for three consecutive days during business hours, again to reflect a typical situation in this facility.
Variables
Variables associated with menu items, equipment used, or processing activities that might influence the energy consumption were identified. These included the menu item, associated quantity as purchased (AP) and temperature, equipment power rating, dimensions of equipment, duty cycle of equipment, equipment activity (on/off/idle), thermostat setting, ambient temperature inside refrigerators and freezers, number of steam table wells, percent fill of warming oven, personnel preparing menu items, and the 24-hour clock time (Table 1).
Beginning and Ending Points
Energy consumption monitored within each area began with the physical entrance of the product into that foodservice area and ended when the menu item was transported out of the designated geographical location. The beginning point for monitoring hot-food preparation equipment began when the equipment was turned on for preparation of the menu item and ended when the equipment was turned off. In the refrigerators, freezers, warming ovens, electric steam table, and steam equipment, metering began when the product was placed in the equip- ment and ended when the menu item was removed.

38 MARTHA J. BARCLAY AND MARY JO HITCHCOCK
Data Collection
Between July and December 1978, a minimum of three energy resource metering replications were made for each piece of equipment used during the preparation of the menu items. In this facility approximately 1,500 meals were served per day during the summer quarter and over 4,500 meals were served per day during the fall quarter. A 3-week cycle menu was used during the summer quarter and a 4-week cycle menu was used during the fall quarter. The amount of time each piece of equipment was monitored during each replication and in total varied depending on the equipment processing time required for each menu item. Data relevant to each of the variables were collected concurrently with the energy con- sumption metering of each piece of equipment.
Analysis
All energy consumption data were converted to equivalent British thermal units (Btus): 1 kilowatt hour of electricity= 3,412 Btu; 1 cubic foot natural gas = 1,000 Btu; and 1 pound steam condensate = 1 ,OOO Btu. Apportioned energy consumed by each piece of equipment for each pound of a menu item was determined by appropriate formula. As an example, the following formulae were used to calculate the apportioned energy requirement for the grill and deep-fat fryer:
(1)
(2)
total kilowatt-hours during preparation period total pounds menu item prepared
Nr. kilowatt-hour/pound =
(Nr. kilowatt-hours) x 3,412 Btu/kilowatt-hour (pound menu item)
Nr. Btdpound =
The energy consumed by the refrigerators and freezers was apportioned by dividing the mass of the products used for the menu items on a parti- cular day by the maximum cooling load allowed assuming 30 lb of pro- duct per cubic foot (Kotschevar and Terrell 1977) and then multiplying the result by the mean hourly energy use of the equipment and the dura- tion of the equipment use time.
This apportioned energy was subtotaled for each area to determine area requirements for each menu item. Finally, the total apportioned energy requirement was calculated by adding the subtotals. Coded data were analyzed by the statistical analysis system (SAS-76) programs (Barr et al. 1976). Statistical significance of the variables was determined by

ENERGY CONSUMPTION ASSESSMENT 39
regression analysis followed by a f-distribution test. For each piece of equipment except for the holding and service equipment and refrigera- tors and freezers, data from all of the replications for all of the products processed in that equipment were used in the determination of the statis- tical significance of any variable. For the refrigerators and freezers, data were compiled for three consecutive days for each of three refrigerators and two freezers. The data for all of the refrigerators and for both freezers were used for the regression analysis followed by the f-distribu- tion test. For the holding and service equipment data were compiled during three business days and then used for the statistical analysis.
RESULTS AND DISCUSSION
A schematic energy flow decision model was developed from the food product flow data for the conventional foodservice system (Fig. 1). The model identified foodservice areas and associated equipment. Modified energy flow models were developed for selected menu items. In this descriptive study, these models were used to sequentially analyze and contrast energy consumption between products and between preparation methods for the same product.
Results from the analysis of energy consumption, along the food-pro- duct flow, indicated that the apportioned energy per pound of menu items ranged from 0 to 7 +. 1 Btu per pound in the receiving and storage areas (Table 2); from 36 to 1,547 Btu per pound in the preparation area; and from 171 to 1,526 Btu per pound in the holding and service areas. The total apportioned energy per pound consumed along the food pro- duct flow for each menu item ranged from 240 Btu per pound for vege- table soup to 3,076 Btu per pound for baked ham.
Results from a regression analysis followed by an f-distribution test for each piece of equipment indicated that some of the variables identi- fied were associated with the quantity of energy consumed by that piece of equipment. For example, the thermostat setting of refrigerators and freezers, deep-fat fryers, rotary oven, and warming oven significantly influenced the quantity of energy resources required to process a menu item (Table 3) -the higher the setting the more energy resource required.
The mass of each menu item prepared also had a significant influence on the quantity of energy required by the deep-fat fryer and the convec- tion oven; the greater the mass the less energy resource required per pound. For example, preparation of 25.3 lb of baked ham in a partially loaded convection oven required more energy per pound than when the convection oven was fully loaded as with meatloaf (see Table 2). Convec-

40 MARTHA J. BARCLAY AND MARY JO HITCHCOCK
RECEIVING
1 I
I
I packaging portioning slicers
1 HOLDING I
I
I t
c SERVICE
FIG. 1. SCHEMATIC ENERGY FLOW DECISION MODEL
tion ovens appear to be one piece of equipment that requires a specific amount of heat to heat the oven cavity which would suggest that the quantity of energy required is stable, and that as the amount of product heat processed increases, the quantity of energy required for heat pro- cessing per pound decreases. The same appears to be true for the deep-fat fryer, except that when the deep-fat fryer basket is filled beyond its

Tab
le 2
. Su
mm
ary
of m
ean
ener
gy c
onsu
mpt
ion
alon
g fo
od p
rodu
ct f
low
in t
he c
onve
ntio
nal
food
ser
vice
sys
tem
for
sel
ecte
d m
enu
item
s
Tot
al
Poun
d R
ecei
vin
g an
d S
tora
ge
Hol
ding
and
Ser
vice
T
otal
Ene
rgy
Item
M
ass
Btu
llb
. B
tull
b.
Btu
llb
. M
enu
(A.P
.)
m
Roa
st b
eef
167.
2 1
84
8 22
2 10
71
190.
1 6
7 14
20
3 92
3 M
eatl
oaf
Mea
tloa
f 19
0.1
6 46
3 20
3 6
72
Bak
ed h
am
25.3
3
1547
15
26
3076
1
573
19 1
76
5 F
ried
ch
ick
en
216.
5
1
460
17
1
632
Egg
pro
du
cts
231.
0
1
77
43
1
509
Cor
n-on
-cob
89
.5
17.6
0
36
574
6 10
O
atm
eal
0 66
17
4 24
0 V
eget
. so
up
58.1
21.1
7
900
9 14
18
21
Bac
on
Saus
age
21.1
7
1046
9
14
1967
Gre
en p
eas
79.2
1
1
244
488
733
'The
ro
tary
ove
n w
as u
sed
to b
ake
the
mea
tloa
f
'The
co
nve
ctio
n o
ven
was
use
d t
o b
ake
the
mea
tloa
f P
e

42 MARTHA J. BARCLAY AND MARY JO HITCHCOCK
Table 3. Factors affecting energy consumption by electrical, natural gas, and steam equipment in a foodservice system
Signi f icance
Area Equipment Energy Consumption (P=) or ( P O
Receiving Refr igera tors Thermostat s e t t i n g (p = .0001)
and s torage Freezer Thermostat s e t t i n g (p = .0001)
Level
Prepara t ion Refr igera tor Thermostat s e t t i n g (p = .0001)
1 _ _ _ 1 Freezer ---
G r i l l
Deep-fat
f r y e r
Convection
oven
Rotary oven
Steam jacke ted
k e t t l e s
Minutes on per
5-minute i n t e r v a l (p = .0001)
Kilogram mass
of batch (P < . lo )
Percent of basket fill (p = .0001)
Kilogram mass
of batch (P < -01)
Thermostat s e t t i n g (P < -01) Cook respons ib le f o r
product prepara t ion (p < .05)
Kilogram mass
of batch (p = .0001)
Cook respons ib le f o r
product prepara t ion (p = .0001)
Thermostat s e t t i n g (p = .0001)
Cook respons ib le f o r
product prepara t ion (p = .0001)

ENERGY CONSUMPTION ASSESSMENT 43
Table 3. Continued
1
1
--- 1 Jet steamer --- 1 Slicer --- ---
Holding Warming oven Thermostat setting (p = .0001)
1 --- I and service Steam table ---
'No specific variable identified as significantly influencing
the energy consumption by this equipment
recommended capacity, the amount of time and energy required for heat processing per pound tends to increase slightly.
Other significant differences were found in the amount of energy con- sumed for the deep-fat fryer, rotary oven, and convection oven as the result of the decisions made by the three different cooks concerning the thermostat setting in the heat processing equipment, the quantity of pro- duct prepared at one time in a piece of equipment, the length of the heat processing period, and the heat processing equipment used for a recipe. The energy consumed by the grill was influenced significantly by the min- utes electric current was flowing during a 5-minute interval, but did not appear to be influenced by menu item quantity or initial temperature of product prepared. This indicated that a noticeable quantity of heat was lost to the atmosphere. Products prepared in steam equipment required the least energy per pound for heat processing.
Variables that did not appear to have significant influence on the energy consumed include the temperature of the product prior to pro- cessing in each piece of equipment, percent fill of the warming oven, and the time of day for refrigerators and freezers.
Applications
This food model was developed from on-premise metering during actual food preparation and could be used to follow alternate food pro- duct flows. Data from both the food product flow and the energy con-

44 MARTHA J. BARCLAY AND MARY JO HITCHCOCK
sumption requirements by equipment could be used to project energy resource requirements in this foodservice facility. In other foodservice facilities, this model could be modified based on the different areas in a foodservice system and the associated equipment in each area. Then this information could be used to make decisions in such areas as equipment scheduling, equipment usage by personnel, and equipment purchasing that would optimize energy usage. For example, for this model, modified energy flow models could be developed such as the one shown in Fig. 2 for meatloaf. Results from these two alternate flows indicate that a greater quantity of energy is required when the rotary oven is used in pre- paration than when the convection oven is used, other equipment remaining the same along the food product flow. Thus, the least energy intensive preparation oven, the convection oven, should be identified on the standardized recipe as the preferred oven to use in this facility. Simi- lar analyses for the least energy intensive food product flow of many other items could be developed.
The methodology for this research could be used to assess the energy- use effectiveness between various types of foodservice systems, especially if one is designing or contemplating the change of a foodservice system. The model could be modified to represent the areas in alternate systems and the associated equipment where the modified model and the energy consumption data for the equipment could be used to study the energy required for food-product flow alternatives. In essence, this methodol- ogy could be used as one approach for structuring a more adequate data base relative to energy usage.
Additionally, the cost of each energy flow should be calculated because, depending on the cost of available energy resources, the least energy intensive food-product flow may be the most expensive flow depending on the cost of the energy resources. Development of an energy costing model would assist in the evaluation of potential food product flows.
Limitations
Limitations to this study include the lack of control over many vari- ables beginning with personnel and food production decisions made by personnel. Even though standardized recipes were used, personnel may modify the type, market form or quantity of ingredients used or the pro- cedures used to prepare a product. Thus, future research should investi- gate the energy consumption for processing menu items when only one

ENERGY CONSUMPTION ASSESSMENT 45
Receiving
1.170 Btu
(Receiving and Storage)
135,696 Btu 88,003 Btu (Preparation)
convection Preparation
J 1
38,621 Btu
(Holding and Service)
'refrigerator
2warming oven
175,487 Mean Total Btu (923 Btullb. Meatloaf)a
127,794 Mean Total Btu (672 Btu/lb. Meatloaf)b 3otary oven used convection oven used
FIG. 2. SEQUENTIAL ENERGY CONSUMPTION THROUGH THE FOOD PRODUCT FLOW FOR MEATLOAF (760 servings) (190.1 lb)

46 MARTHA J. BARCLAY AND MARY JO HITCHCOCK
person prepares a product from the same market form of ingredients several times along the same food product flow with the same or varia- tions of equipment.
Also, variability in the maintenance of equipment would need to be controlled. The older the equipment, the less maintained the equipment, and subsequently, the less energy efficient the equipment tends to be. Because the equipment is perceived as old or not well maintained, per- sonnel may alter the recommend thermostat settings of the equipment to obtain an acceptable finished product.
Finally, practitioners may not have the luxury of being able to choose between two or more types of equipment for heat processing menu items. So being able to identify the most energy efficient food product flow may not be practical. Another reason for this impracticality might be the amount of time one can devote to the analysis of food product flow and the subsequent expense of this analysis. Both the expense and time required for this analysis might be modified by adapting this methodol- ogy and the associated energy consumption data for equipment to com- puter software.
CONCLUSIONS
This present study is descriptive of energy consumption in an operat- ing foodservice facility. A schematic energy flow decision model was developed that could be used to analyze the most effective and efficient food product flow for a menu item in this foodservice facility. Alternate flows could be analyzed in order to minimize the energy required to store, prepare, hold, and serve the menu item while maintaining the qual- ity of the food served. Various factors were identified as having signifi- cant influences on the energy consumption by equipment such as the quantity of product prepared in the convection oven and deep-fat fryer, rotary and warming ovens. Decisions concerning how equipment was used by the food preparation personnel were another significant influ- ence on the amount of energy required to prepare a product in the con- vention and rotary ovens, and the deep-fat fryer. The number of minutes that current was flowing during each 5-minute period in the grill was a significant variable which indicates that the area exposed to the atmos- phere influences the energy consumption. Each of these noticable influ- ences should be investigated further.
The methodology developed could be used to analyze the energy con- sumption for the processing of menu items, to forecast energy consump- tion, and to determine the most efficient and effective food product flow

ENERGY CONSUMPTION ASSESSMENT 47
in a foodservice facility. From this data, decisions concerning energy conservation could be made about purchasing, scheduling, and equip- ment usage, processing menu items, and developing appropriate employee training programs.
REFERENCES
BARR, A. J., GOODNIGHT, J. H., SALL, J. P. and HELWIG, J. T. 1976. A User’s Guide to SAS-76. SAS Institute, Inc., Raleigh, NC.
DWYER, S. J . , UNKLESBAY, K., UNKLESBAY, N. and DUNLAP, C. 1977. Identification of Major Areas of Energy Utilization in the Food Processing/ Food Service Industry. University of Missouri, Columbia, MO.
MCPROUD, L. M. 1977. Energy management in production of entrees in hos- pital foodservice systems. Unpublished Ph.D. thesis, University of Wisconsin, Madison, WI.
NATIONAL RESTAURANT ASSOCIATION 1979. Personal communication. Washington, DC: NRA, March.