energy consumption: highlights and future development
TRANSCRIPT

Energy Demand Model and energy efficiency improvements
Chief Advisor Peter Bach
66th Semi-annual IEA ETSAP meeting
Copenhagen, 17 November 2014

Outline
1. Energy efficiency improvements in Denmark
• Very short
2. Energy Demand Model
• Used for long-term energy system scenarios

EE in Denmark - overview
• Strong EE improvements
• De-coupling energy consumption and economic growth
• Also under the actual economic crises
• Long-term stable policy framework
• Combination of several policies and measure

Energy efficiency has delivered
• The de-coupling is linked to increased energy efficiency
• End-use efficiency • Better insulation of buildings
• More efficient appliances etc.
• Higher efficiency in industries
• Efficiency of energy supply • Especially increased use of combined heat and
power production – CHP
• But also more efficient power plans and individual boilers
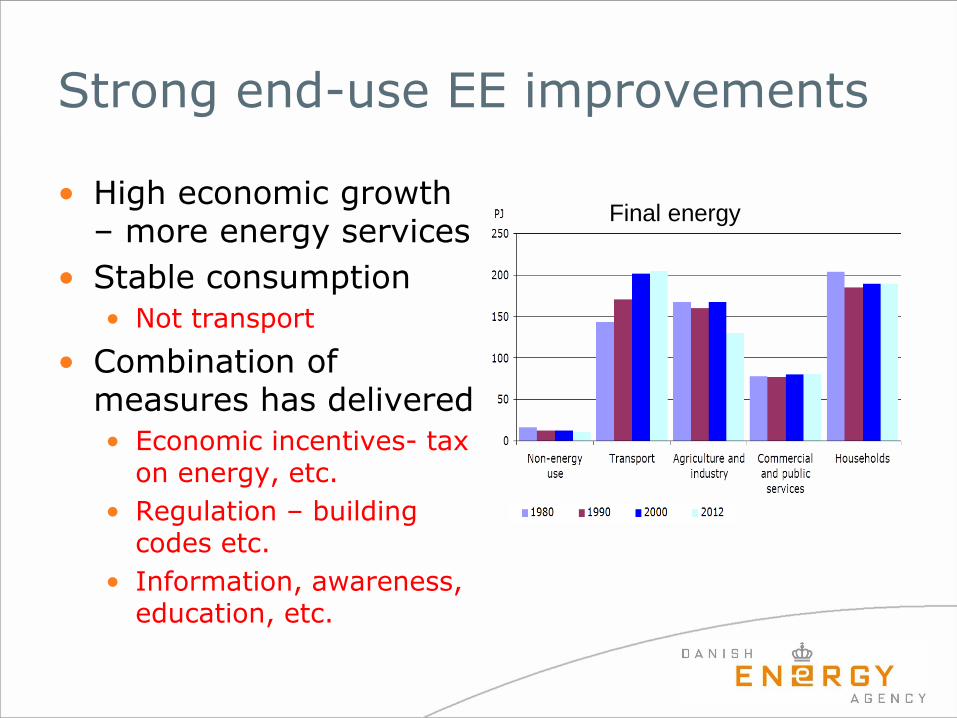
Strong end-use EE improvements
• High economic growth – more energy services
• Stable consumption
• Not transport
• Combination of measures has delivered
• Economic incentives- tax on energy, etc.
• Regulation – building codes etc.
• Information, awareness, education, etc.
Final energy
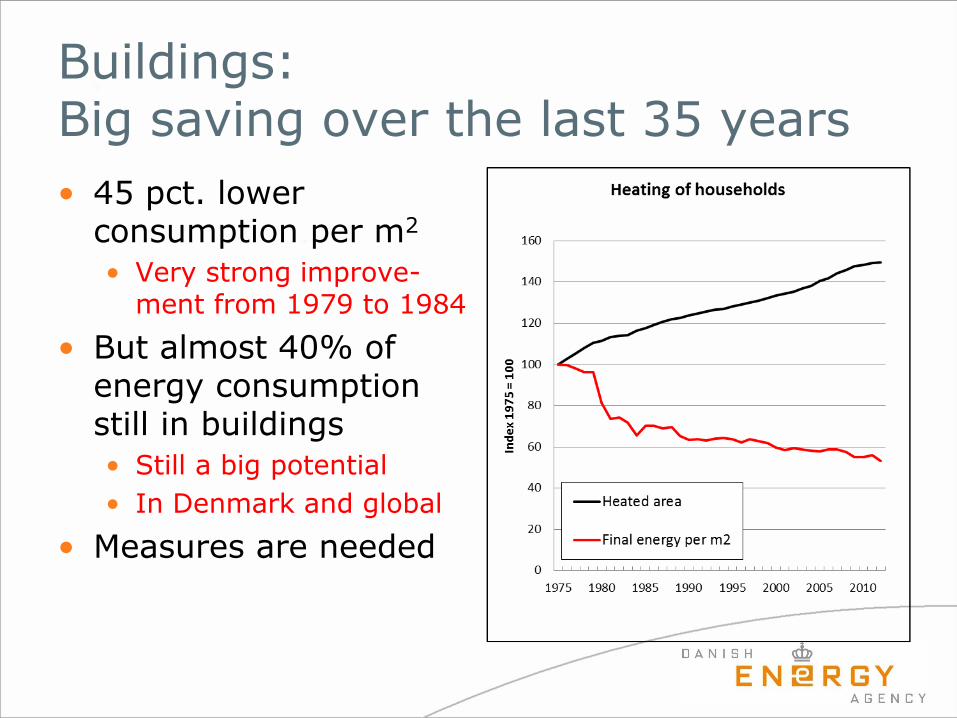
Buildings: Big saving over the last 35 years
• 45 pct. lower consumption per m2
• Very strong improve-ment from 1979 to 1984
• But almost 40% of energy consumption still in buildings
• Still a big potential
• In Denmark and global
• Measures are needed

High efficiency improvement in industry
• CO2-packages in 1993 and 1996
• CO2-tax
• Voluntary agreements scheme
• Subsidy scheme
• Energy efficiency obligation for energy distributers
• Strong focus on
industry
Decrease in intensity:
1975-2012: 1,5 % p.a.
1994-2012: 2,1 % p.a.

Energy Demand Model

Energy Demand Model
• The demand side of our 2050 energy scenarios • Can the Danish energy system be based om 100%
renewable?
• Very simple but also robust model • Useful for long-term scenarios – calculation for 2035 and
2050
• Not for short and medium term forecast
• Main principle: EnergyDemand(2050) = EnergyDemand(2011) * growth energy services * energy efficiency

Net energy demand

Energy quality
• Temperature requirements in industrial processes
• Relevant categories for transport
• Split between space heating and hot tap water could also be relevant
Net demand, 2011 Cars Light Trucks Busses MC/knal Flights Rail Ships Proces heat Individual Distric Electricity Total
PJ trucks Tractors Etc <50 °C 50-75 °C 75-100 °C 100-150 °C 150-200 °C >200 °C heating heating
Single-famile houses 0,19 69,09 32,33 22,38 123,99
Multi-famile house 5,65 33,91 8,92 48,49
Public sector 2,99 9,87 8,59 21,44
Wholesale 0,05 0,64 0,13 0,13 1,27 4,12 5,22 11,57
Retail trade 0,05 0,09 0,09 1,05 2,75 6,23 10,26
Private services 0,04 0,56 1,14 0,99 8,29 12,27 13,23 36,52
Agriculture andForestry 2,96 0,91 1,88 0,72 0,15 4,21 10,83
Horticulture 0,03 3,44 0,38 0,03 0,81 4,70
Fishing 1,96 0,01 0,14 2,11
Manufacturing Industry 0,10 0,85 1,25 5,94 13,55 4,21 19,68 9,66 4,86 27,86 87,96
Construction 0,82 0,72 0,72 1,30 3,57
Transport 17,84 7,15 7,39 2,16 0,16 13,38 2,32 2,24 52,64
I alt 17,84 7,25 11,30 2,16 0,35 13,38 2,32 4,20 2,49 7,30 8,29 14,92 4,21 20,90 98,17 100,12 98,90 414,09
Energy services
• Buildings: • Heated area - For households based on population,
average family size, and average size of new homes
• For commercial sector simple forecast based on historical data
• Appliances, etc.: • Split in groups with different drivers (number of m2,
population, private consumption)
• Industry, etc: • Economic growth – value added
• Same assumptions in all scenarios

Energy efficiency improvements
Moderate Big Very big
2035 2050 2035 2050 2035 2050
Households:
Single-family house 15% 26% 20% 34% 25% 45%
Multi-family house 15% 26% 20% 34% 25% 45%
Lighting 20% 34% 24% 42% 30% 53%
Appliances (ex) 21% 36% 30% 53% 35% 62%
Commercial
Buildings 13% 21% 18% 31% 24% 42%
Lighting 20% 34% 24% 42% 30% 53%
Appliances (ex) 13% 21% 17% 29% 25% 45%
Industry etc.
Process heat 13% 21% 17% 29% 23% 39%
Space heating 13% 21% 17% 29% 24% 42%
Electricity 14% 24% 17% 29% 23% 39%

Energy demand 2050

0
50
100
150
200
250
2011 2035 2050
Households
Frozen
Moderate
Big
Very big
0
20
40
60
80
100
120
140
2011 2035 2050
Industry
Frozen
Moderate
Big
Very big
0
20
40
60
80
100
120
2011 2035 2050
Commercial
Frozen
Moderate
Big
Very big
0
10
20
30
40
50
60
70
80
90
2011 2035 2050
Transport
Frozen
Moderate
Big
Very big

Cost related to EE improvements
• Investments calculated as an annual cost
• Lifetime
• 5% discount rate
• Data from reports and studies on saving potentials and cost
• Extra investments compared to normal replacement, etc.

Suggestion for improvements
• Alternatives for the development of energy services • Economic growth can be a bad indicator in the long-term
• Split of industries in sub-groups
• Better data for the investment cost
• Thank you for your attention • [email protected]