energy conversion and management - engineeringpilon/publications/ecm2015-diurnalpcm.pdf · pcm...
TRANSCRIPT
Energy Conversion and Management 93 (2015) 215–227
Contents lists available at ScienceDirect
Energy Conversion and Management
journal homepage: www.elsevier .com/ locate /enconman
Diurnal thermal analysis of microencapsulated PCM-concrete compositewalls
http://dx.doi.org/10.1016/j.enconman.2014.12.0780196-8904/� 2015 Elsevier Ltd. All rights reserved.
⇑ Corresponding author. Tel.: +1 (310) 206 5598; fax: +1 (310) 206 2302.E-mail address: [email protected] (L. Pilon).
Alexander M. Thiele a, Gaurav Sant b,c, Laurent Pilon a,⇑a Mechanical and Aerospace Engineering Department, University of California, Los Angeles, Henry Samueli School of Engineering and Applied Science, United Statesb Civil and Environmental Engineering Department, Laboratory for the Chemistry of Construction Materials (LC2), University of California, Los Angeles, Henry Samueli Schoolof Engineering and Applied Science, United Statesc California Nanosystems Institute (CNSI), University of California, Los Angeles, Henry Samueli School of Engineering and Applied Science, United States
a r t i c l e i n f o a b s t r a c t
Article history:Received 27 August 2014Accepted 25 December 2014
Keywords:Phase change materialsMicroencapsulatedBuilding materialsEnergy efficient buildingEffective thermal properties
This paper examines the benefits of adding microencapsulated phase change material (PCM) to concreteused in building envelopes to reduce energy consumption and costs. First, it establishes that the time-dependent thermal behavior of microencapsulated PCM-concrete composite walls can be accurately pre-dicted by an equivalent homogeneous wall with appropriate effective thermal properties. The resultsdemonstrate that adding microencapsulated PCM to concrete resulted in a reduction and a time-shiftin the maximum heat flux through the composite wall subjected to diurnal sinusoidal outdoor temper-ature and solar radiation heat flux. The effects of the PCM volume fraction, latent heat of fusion, phasechange temperature and temperature window, and outdoor temperature were evaluated. Several designrules were established including (i) increasing the PCM volume fraction and/or enthalpy of phase changeincreased the energy flux reduction and the time delay, (ii) the energy flux reduction was maximizedwhen the PCM phase change temperature was close to the desired indoor temperature, (iii) the optimumphase change temperature to maximize the time delay increased with increasing average outdoor tem-perature, (iv) in extremely hot or cold climates, the thermal load could be delayed even though the reduc-tion in daily energy flux was small, and (v) the choice of phase change temperature window had littleeffect on the energy flux reduction and on the time delay. This analysis can serve as a framework todesign PCM composite walls in various climates and seasons and to take advantage of time of use elec-tricity pricing.
� 2015 Elsevier Ltd. All rights reserved.
1. Introduction
In 2011 in the United States, residential and commercialbuilding operation represented about 40% of the total end-useenergy consumed [1]. About 40% of this energy was consumedfor heating, ventilation, and air conditioning (HVAC) [2]. Thedemand of residential and commercial buildings for electricityvaries significantly during the day [3]. To satisfy demand duringpeak hours, the utilities rely on so-called ‘‘peaker plants,’’ whichare costly to operate and typically run on fossil fuel [4]. Inaddition, utility companies offer time of use (TOU) electricityrate schedules to encourage ratepayers to shift their electricityuse to off-peak hours. In practice, the price of electricity islower during off-peak hours and higher during peak hours. Tocurb the energy consumption of the building sector, the 2008California long term energy efficiency strategic plan established
two major goals: (1) all new residential buildings should bezero net energy (ZNE) by 2020 and (2) all new commercialbuildings by 2030 [5].
Building energy consumption could be reduced by usingdynamic building envelope materials that control the heat flowinto and out of buildings. Composite cementitious materialscontaining microencapsulated phase change materials (PCMs)have been suggested as a way to increase buildings’ thermalinertia and thus their energy efficiency [6–8]. PCMs storeenergy in the form of latent heat by reversibly changing phasebetween solid and liquid. The goal in implementing compositePCM walls is to significantly reduce and time-shift themaximum thermal load on the building in order to reduceand smooth out the electricity demand for heating and cooling.This could also help ratepayers take advantage of TOUelectricity rate schedules while reducing the ecological footprintof buildings [3,4,9–12]. The choice of PCM should be adapted tothe climate and building orientation so as to maximize theabove mentioned benefits.

Nomenclature
a length of cubic unit cell, lmAc cross-sectional area, m2
cp;j specific heat of phase ‘‘j’’ in the composite structure, J/kg K
D diameter, lmEr energy flux reduction, %hi; ho indoor and outdoor convective heat transfer coefficient,
W=m2 Khsf latent heat of fusion, J/kgH enthalpy, Jkj thermal conductivity of phase ‘‘j’’ in the composite
structure, W/m KL wall thickness, mm or cmn normal unit vectorQ 00 energy flux, J/m2
q00s solar radiation heat flux, W/m2
q00x ; q00y; q
00z heat flux along the x-, y-, and z-directions, W/m2
r position vector r ¼ hx; y; zit time, stmax time of maximum heat flux through composite wall, htmax;m time of maximum heat flux through pure concrete wall,
hT temperature, �CTin; T1; Tsky indoor, ambient, and sky temperatures, �CTmax; Tmin maximum and minimum outdoor temperatures, �CV volume, m3
Greek symbolsa thermal diffusivity, m2/sas surface solar absorptivityDTpc phase change temperature window, �CDx minimum mesh size, lm� surface emissivity/c=s volume fraction of core with respect to shell material in
a microcapsule/j volume fraction of phase ‘‘j’’ in the composite structureqj density of phase ‘‘j’’ in the composite structure, kg/m3
r Stefan–Boltzmann constant, W=m2 K4
sd time delay, i.e. sd ¼ tmax � tmax;m, h
Subscriptsc refers to core material (PCM)eff refers to effective propertiesi refers to initial conditionsj refers to constituent material ‘‘j’’l refers to PCM liquid phaseL refers to values at x ¼ Lm refers to matrix (concrete)max refers to maximum value of variablemin refers to minimum value of variableopt refers to optimum valuess refers to PCM solid phase or shellt refers to total quantities
216 A.M. Thiele et al. / Energy Conversion and Management 93 (2015) 215–227
This study aims to evaluate the effects of adding microencapsu-lated PCMs to a concrete wall on buildings’ thermal load. First, sim-ulation tools and effective medium approximations (EMAs) wereimplemented to simulate, simply and accurately, transient heattransfer through three-component composite walls consisting ofcore–shell microcapsules embedded in a continuous matrix. Then,a parametric study was performed to determine the effects of thePCM properties on the reduction and delay of thermal load throughsuch composite walls subjected to diurnal sinusoidal outdoor tem-perature and solar radiation heat flux. This study will serve as aframework for the design of composite walls containing microen-capsulated PCM for energy efficient buildings in various climates.
2. Background
2.1. Building materials containing PCM
The use of composite building materials containing PCMs hasbeen reviewed extensively [8,13–20] and need not be repeated.The forms of PCM composite walls that have received the mostattention include wallboard (i.e., plasterboard or drywall), shape sta-bilized PCM (SSPCM) board, and PCM-concrete composites, as wellas masonry blocks and alternative containers made of PVC or alumi-num foil [14,18,20]. Methods of adding PCMs into building materialsgenerally fall into four categories: (i) direct incorporation, (ii) immer-sion, (iii) macroencapsulation, and (iv) microencapsulation [20].Direct incorporation consists of adding PCMs to supporting materi-als, such as wallboard or concrete, during the production process.Immersion method involves dipping a finished porous buildingmaterial into melted PCM. Major drawbacks of these two methodsinclude the lack of a barrier to protect the PCM against leakage dur-ing melting and against chemical reactions with the matrix material[18,19]. To address this issue, macroencapsulation of PCMs in con-tainers such as bags, tubes, or panels has been proposed beforeincorporating the encapsulated PCM into composite walls [13,20].
However, macroencapsulation suffers from a large temperature dif-ferential between the encapsulated PCM core and the boundarywhich can lead to incomplete melting or solidification of the PCM[13,20,21]. This can be addressed by containing PCMs in microscopiccapsules with thin walls and diameter ranging from 1 lm to 1 mm[21,22]. The microencapsulated PCM can easily be added to a build-ing material during production as long as the shell material is com-patible with the supporting material [13,20,21].
Concrete is an appealing construction material thanks to itsinherently large thermal inertia. In fact, concrete has a significantlylarger volumetric heat capacity than gypsum wallboard due to itshigher density [8]. It has been suggested that PCM could be encap-sulated prior to incorporation into concrete to prevent leakage andto ensure that it does not react with the concrete constituents[8,23]. Hunger et al. [23] studied the effect of adding microencap-sulated PCM to self-compacting concrete on the effective thermaland mechanical properties of the composite. They found that thecompressive strength of their specific mixture decreased by 13%for every additional mass percentage of PCM. The effective thermalconductivity of the composite also decreased with the addition ofPCM. They concluded that composite concrete with a PCM contentof 3 wt.% and a compressive strength of 35 N/mm2 was acceptablefor most building applications. Cabeza et al. [6] constructed cubi-cles made with plain concrete and with concrete containing5 wt.% microencapsulated PCM. The cubicles were exposed toweather conditions in Lleida, Spain and temperatures were mea-sured at the inner wall surfaces. The PCM concrete cubicle featureda 3 �C decrease in the amplitude of indoor temperature oscillationsand a 2 h shift in the maximum indoor temperature compared withits counterpart made of plain concrete.
2.2. Simulating phase change in single phase systems
Analytical solutions of solid–liquid phase change heat transferproblems are only available for homogeneous systems with simple
A.M. Thiele et al. / Energy Conversion and Management 93 (2015) 215–227 217
geometries and boundary conditions [7,24,25]. As a result, numer-ical methods have been devised to model heat transfer duringsolid–liquid phase change including (i) the enthalpy method, (ii)the heat capacity method, (iii) the temperature transformingmodel, and (iv) the heat source method [24]. The advantages, dis-advantages, and limitations of each method have been reviewed byAl-Saadi and Zhai [24]. The enthalpy method [25–29] and heatcapacity method [26,27,30,31] are the two most commonly usednumerical methods [7].
The enthalpy method consists of solving the transient heat con-duction equation expressed in terms of temperature and enthalpyHðTÞ as [26],
@qHðTÞ@t
¼ rðkrTÞ ð1Þ
where q and k are the density and thermal conductivity of the PCM,respectively. The enthalpy function HðTÞ represents the total energyof the material including sensible and latent forms of energy. Theenthalpy of a PCM can be determined as a continuous function oftemperature by using differential scanning calorimetry (DSC) mea-surements [32]. Otherwise, a piecewise enthalpy function HðTÞmaybe defined in terms of the latent heat of fusion hsf and the phasechange temperature window DTpc [25,28,29].
Alternatively, the heat capacity method consists of solving thetransient heat conduction equation expressed in terms of temper-ature and specific heat cpðTÞ as [26,30,27,31],
qcpðTÞ@T@t¼ rðkrTÞ ð2Þ
To account for the latent heat stored during phase transition, thespecific heat is defined as a piecewise function of temperature givenby Lamberg et al. [27],
cp;cðTÞ ¼cp;c;s for T < Tpc � DTpc=2
cp;c;s þhsf
DTpcfor Tpc � DTpc=2 6 T 6 Tpc þ DTpc=2
cp;c;l for T > Tpc þ DTpc=2
8>><>>:
ð3Þ
where cp;c;s and cp;c;l are the specific heats of the solid and liquidphase, respectively. Here, hsf ; Tpc , and DTpc are the latent heat offusion, the phase change temperature, and the temperature win-dows, respectively.
Lamberg et al. [27] experimentally studied heat transferthrough a homogeneous paraffin PCM block contained in a rectan-gular aluminum enclosure. The PCM temperature was measuredusing thermocouples placed at various locations in the enclosure.The authors compared the measured local temperatures to numer-ical predictions obtained by implementing both the enthalpy andthe heat capacity methods. They concluded that both numericalmethods provided a ‘‘good estimation’’ of melting and freezing pro-cesses but that the heat capacity method agreed more closely withexperimental data.
2.3. Simulating phase change in PCM composites
Zhou et al. [33] numerically simulated a room in a skyrise withone south-facing exterior wall and three interior walls. The multi-layer ceiling and walls had either a mixed PCM-gypsum or a shape-stabilized PCM (SSPCM) composite layer at the inner surface. Time-dependent outdoor temperature and solar radiation heat flux wereimposed on the exterior wall to reflect a typical winter week in Bei-jing, China. The authors modeled phase change using the enthalpymethod and studied the effect of phase change temperature Tpc
and temperature window DTpc on the indoor temperature. Theamplitude of the temperature oscillations was found to decreasewith decreasing phase change temperature window DTpc . It could
be reduced by as much as 46% and 56% for mixed PCM-gypsumand SSPCM layers, respectively, compared with a plain gypsumboard layer. They also found that the optimal phase change tem-perature Tpc to minimize the amplitude of the indoor temperatureoscillations was 21 �C for both mixed PCM-gypsum and for SSPCMlayers. In another study, Zhou et al. [34] simulated the same roomwith multilayer ceiling and walls containing a SSPCM compositelayer on a different winter week in Beijing, China. Once again,the amplitude of temperature oscillations was minimized for aphase change temperature Tpc of 20 �C, which was within the rangeof indoor comfort temperature.
Diaconu and Cruceru [35] conducted a numerical study of aroom with multilayer exterior walls consisting of an insulationlayer between two PCM wallboards. Time-dependent temperatureand solar radiation heat flux were imposed at the outer surface ofthe walls to reflect yearly averaged annual weather conditions inBechar, Algeria. Each PCM-wallboard layer was assumed to behomogeneous with some arbitrarily chosen effective thermal prop-erties. The enthalpy method was used to simulate phase change.The cooling/heating load on the room was determined by perform-ing an energy balance on the indoor space. The authors evaluatedthe effects of phase change temperature Tpc and temperature win-dow DTpc in each PCM wallboard on the total annual heating andcooling energy reduction and on the reduction of the peak heatingand cooling loads. Unlike Zhou et al. [33], they found that DTpc hadvery little effect on the heating and cooling energy reductions.However, they also found that the annual total heating and coolingloads were minimized when the phase change temperature of PCMwithin the outer and inner layers was near the desired indoortemperature.
Mathieu-Potvin and Gosselin [36] conducted a numerical studyof south-facing multilayer exterior walls consisting of a plane-par-allel PCM layer sandwiched between two insulation layers. First,the effects of the position and phase change temperature of thePCM layer on the annual energy flux through the wall subjectedto sinusoidal outdoor temperature oscillations were studied. Theannual energy flux was minimized when the PCM layer was posi-tioned near the center of the wall and the phase change tempera-ture was close to the indoor temperature. Second, a geneticalgorithm was used to optimize a 20-layer wall to minimize theannual thermal energy flux through the wall subjected either tosinusoidal outdoor temperature boundary conditions or to outdoortemperature and solar radiation heat flux based on real weatherdata corresponding to Orlando, FL and Quebec City, Canada. Eachlayer was 0.5 cm thick and was made of concrete, insulation, orpure PCM with one of six possible phase change temperatures.For the wall subjected to sinusoidal outdoor temperature, the opti-mal design for Quebec City, Canada did not include a PCM layer.The authors postulated that this was because the indoor tempera-ture was not within the range of outdoor temperature variation.However, the optimal design included a PCM layer when the wallwas subjected to realistic outdoor temperature and solar radiationheat flux boundary conditions, even though the indoor tempera-ture was not within the range of outdoor temperature variationfor most of the year. The authors concluded that realistic outdoortemperature and solar radiation heat flux conditions must be con-sidered in order to determine the energy saving potential of a PCMcomposite wall.
Hembade et al. [37] simulated transient 1D heat conduction andphase change within a 20 cm thick concrete wall containing a 1–5 cm thick layer of PCM microcapsules over a summer day in Phoe-nix and Los Angeles. However, it is not clear how the PCM wasincorporated into the wall and what method was used to simulatephase change. The wall was subjected to convective heat transferto a time-dependent indoor temperature varying between19.9 and 24.9 �C in Phoenix and between 18.9 and 21.9 �C in

T(0,t)
'' 0zq
0
y
x
z L
'' 0yq
'' 0yq
'' 0zq, ''x oq
, ''x Lq
T(L,t)(b)
(a)
a
DcDs
a a
Fig. 1. (a) Schematic of a single unit cell containing core–shell capsules with a face-centered cubic packing arrangement and (b) schematic and coordinate system of aheterogeneous composite of length L made up of aligned unit cells. Core and shelldiameters and unit cell length corresponding to core and shell volume fractions /c
and /s were denoted by Dc ;Ds , and a, respectively.
218 A.M. Thiele et al. / Energy Conversion and Management 93 (2015) 215–227
Los Angeles. It was also subjected to convective heat transfer to anequivalent outdoor temperature based on weather data. The con-tribution from solar irradiation on the outer wall was accountedfor via the outdoor temperature using the sol–air temperaturemethod, widely used in architecture [38]. The PCM layer was trea-ted as homogeneous having the thermal properties of microencap-sulated paraffin but the authors did not account for the thermalproperties of the continuous phase (e.g., concrete). Different PCMswere used in each climate with phase change temperature windowof 27–31 �C in Phoenix and of 22–25 �C in Los Angeles. The PCMused in Phoenix had a substantially larger density and latent heatof fusion and a smaller thermal conductivity than that used in LosAngeles. The authors found that adding a 5 cm thick (25 vol.%)layer of PCM reduced the daily energy flux through the inner sur-face of the wall by 60% and 40% in Phoenix and Los Angeles, respec-tively. The larger reduction in Phoenix can be attributed, in part, tothe fact that the sensible and latent heat storage capacity and thethermal resistance were larger for the wall simulated for Phoenix.Unfortunately, it is difficult to draw design rules from these simu-lations as both the thermal properties of the PCM and the indoortemperature varied in each climate and no systematic parametricor optimization study was performed. In addition, treatment ofthe solar irradiance on the outer wall surface was not rigorousalthough essential, according to Mathieu-Potvin and Gosselin [36].
Kissock and Limas [39] solved the transient 1D heat diffusionequation in a 30.4 cm thick multilayer wall consisting of an insula-tion layer sandwiched between two concrete layers each imbibedwith 10 wt.% PCM. The wall was subjected to convective heattransfer to a constant indoor temperature of 21.1 �C and to an out-door temperature varying sinusoidally between 10 and 32.2 �Cover a single day. The density and thermal conductivity of thePCM-concrete composite layers were assumed to be identical tothat of pure concrete. The effective specific heat was determinedby a weighted average of the concrete specific heat and the tem-perature-dependent PCM specific heat measured using a differen-tial scanning calorimeter. The authors assumed that the idealphase change temperature to minimize heat transfer through awall would be identical to the desired indoor temperature and theyshifted the temperature-dependent PCM specific heat accordingly.The maximum heat flux through the wall was reduced by 77% anddelayed by 4 h by adding 10 wt.% PCM to the concrete layers. How-ever, directly imbibing concrete with PCM is neither a realistic, nora durable solution as the PCM reacts chemically with the cementfeaturing very high pH. Thus, PCM should be microencapsulated,as previously discussed. In addition, in their diurnal simulations,Kissock and Limas [39] ignored (i) heating of the outer wall surfaceby solar radiation and (ii) the effect of PCM on the effective densityand thermal conductivity of the composite wall.
Overall, the literature reported contradictory conclusions aboutthe effects of phase change temperature window DTpc on the time-dependent thermal load through multilayer walls containing PCM.Previous studies of microencapsulated PCM-concrete walls [37]did not rigorously account for the thermal effects of the PCM, shell,and/or concrete matrix materials. In addition, no study has per-formed a systematic parametric analysis to determine design rulesto minimize and/or delay the heat transfer rate through such a wallbased on climate conditions. The aim of the present study is (1) todevelop a simple, efficient, and accurate thermal model of micro-encapsulated PCM-concrete composite walls and (2) to investigatethe impact of adding microencapsulated PCMs to concrete walls onthe thermal load of buildings. The effects of four design parame-ters, namely, (i) the PCM volume fraction, (ii) latent heat of fusion,(iii) phase change temperature and (iv) temperature window onthe reduction and delay of thermal load were systematically eval-uated, along with the effect of the outdoor temperatureoscillations.
3. Analysis
3.1. Schematic
Fig. 1a shows a single unit cell containing core–shell particlesarranged in a face-centered cubic (FCC) packing. The correspondingcore and shell volume fractions /c and /s are respectivelyexpressed as,
/c ¼2pD3
c
3a3 and /s ¼2p D3
s � D3c
� �3a3 ð4Þ
where a is the length of the unit cell while Dc and Ds are the innercore and outer shell diameters, respectively. The unit cell width awas arbitrarily taken to be 25 lm for all cases considered. Through-out this study, /s was arbitrarily imposed to be 8% and Dc and Ds
were adjusted based on the desired PCM volume fraction /c . Thevolume fraction of core with respect to shell material/c=s ¼ ðDc=DsÞ3 ranged from about 55% to 86%. This was within arealistic range of microencapsulated PCMs [21]. It was achievedby adjusting Dc and Ds ranging from about 9 to 15 lm and fromabout 11 to 16 lm, respectively. Note that, in a recent study [40],we showed that the packing arrangement and the polydispersityof the microcapsules had no effect on the effective thermal conduc-tivity of the composite wall. In other words, the situation depictedin Fig. 1a is also representative of the practical situation of ran-domly distributed and polydisperse microcapsules in concrete[40]. Fig. 1b illustrates a heterogeneous slab of a three-componentcomposite material consisting of aligned unit cells of monodispersemicrocapsules filled with PCM and embedded in a concrete matrixin an FCC packing arrangement. It also shows the associated coordi-nate system and the boundary conditions used to validate the

Table 1Density q, specific heat capacity cp , and thermal conductivity k of PCM, high densitypolyethylene (HDPE), and concrete.
Material Subscript q (kg/m3) cp (J/kg K) k (W/m K) Refs.
PCM c 860 2590 0.21 [41]HDPE s 930 2250 0.49 [42]Concrete m 2300 880 1.4 [43]
A.M. Thiele et al. / Energy Conversion and Management 93 (2015) 215–227 219
effective homogeneous model. The overall thickness of this compos-ite slab was denoted by L.
3.2. Assumptions
To make the problem mathematically tractable, the followingassumptions were made: (1) all materials were isotropic and hadconstant properties except for the temperature-dependent specificheat of the PCM given by Eq. (3). (2) The specific heat of the PCMwas the same for solid and liquid phases, i.e., cp;c;s ¼ cp;c;l. (3) Inter-facial contact resistances between the concrete, the shell, and thePCM were negligible. (4) Natural convection in the molten micro-encapsulated PCM was absent based on the fact that the Rayleighnumber was very small, and (5) there was no heat generation inthe wall.
3.3. Heterogeneous wall simulations
3.3.1. Governing equationsUnder the above assumptions, the local temperatures in the
PCM, shell, and concrete at time t and location r ¼ hx; y; zi withinthe heterogeneous composite material denoted by Tcðr; tÞ; Tsðr; tÞ,and Tmðr; tÞ were governed by the transient heat conduction equa-tion in each domain, given by,
@Tc
@t¼ acðTcÞr2Tc;
@Ts
@t¼ asr2Ts; and
@Tm
@t¼ amr2Tm ð5Þ
where aj ¼ kj=qjcp;j is the thermal diffusivity of constituent j, wheresubscripts ‘‘c’’, ‘‘s’’, and ‘‘m’’ refer to the core, the shell, and thematrix, respectively. Here, the heat capacity method was used tosolve for the local temperature Tcðr; tÞ.
3.3.2. Boundary conditionsThese transient three-dimensional (3D) energy conservation
equations were solved in the PCM, the shell, and the concretedomains. The initial temperature was assumed to be uniformthroughout the composite material and equal to Ti, i.e.,
Tðx; y; z;0Þ ¼ Ti ð6Þ
At time t ¼ 0, the temperature was imposed on the faces of the slablocated at x ¼ 0 and x ¼ L so that the overall heat transfer took placealong the x-direction (Fig. 1b), i.e.,
Tð0; y; z; tÞ ¼ Tð0; tÞ and TðL; y; z; tÞ ¼ TðL; tÞ ð7Þ
where Tð0; tÞ and TðL; tÞ were taken as constant and equal to T0 andTL, respectively.
By virtue of symmetry, the heat flux through the four lateralfaces vanished, i.e.,
q00yðx;0;z;tÞ¼ q00y x;a;z;tð Þ¼0 and q00z x;y;0;tð Þ¼ q00z x;y;a;tð Þ¼0 ð8Þ
where q00y x; y; z; tð Þ and q00z x; y; z; tð Þ are the heat fluxes at locationðx; y; zÞ along the y- and z-axes and given by Fourier’s law, i.e.,q00y ¼ �k@T=@y and q00z ¼ �k@T=@z, respectively.
Coupling between the temperatures in the different domains ofthe heterogeneous composite was achieved by imposing continu-ous heat flux boundary conditions across their interfaces, i.e.,
�km@Tm
@n
����m=s
¼ �ks@Ts
@n
����m=s
and �ks@Ts
@n
����s=c
¼ �kc@Tc
@n
����s=c
ð9Þ
where km; ks, and kc are the thermal conductivities of the matrix,shell, and core, respectively, and n is the unit normal vector atany given point on the concrete/shell and shell/PCM interfaces, des-ignated by m=s and s=c, respectively.
3.3.3. Constitutive relationshipsTable 1 summarizes the thermophysical properties of the differ-
ent materials used in this study. The density, thermal conductivity,and specific heat of the PCM, shell, and matrix corresponded tothose of a commercial organic PCM PureTemp 20 by Entropy Solu-tion Inc. (Plymouth, MN) [41], high density polyethylene (HDPE)[42], and concrete [43], respectively. Here, the PCM specific heatcp;cðTcÞ was given by Eq. (3). The phase change temperature Tpc
and temperature window DTpc as well as the latent heat of fusionhsf of the PCM were treated as parameters.
Due to the heterogeneous nature of the composite and to thedifferences in the thermal properties of the core, shell, and matrix,the heat flux was not necessarily uniform over a given cross-sec-tion perpendicular to the x-axis. Thus, the area-averaged heat flux�q00x along the x-direction was defined as,
�q00xðx; tÞ ¼1Ac
ZZq00x x; y; z; tð Þdydz ð10Þ
where Ac is the cross-sectional area of the computational domainperpendicular to the x-axis.
3.4. Homogeneous wall simulations
3.4.1. Governing equationThe temperature T in the homogeneous material equivalent to
the heterogeneous wall of identical dimensions was governed by
@T@t¼ aeff ðTÞr2T ð11Þ
where aeff ðTÞ ¼ keff = qcp� �
eff ðTÞ is the effective thermal diffusivity.Note that aeff ðTÞ is a function of the local temperature T since itaccounts for the temperature-dependent specific heat of the PCM.However, a consistent model for the effective volumetric heatcapacity qcp
� �eff and the effective thermal conductivity keff of the
composite wall needs to be specified.
3.4.2. Effective thermal propertiesTo approximate the heterogeneous composite by a homoge-
neous medium with some effective thermal properties, it is neces-sary to define its effective volumetric heat capacity qcp
� �eff and its
effective thermal conductivity keff . First, from thermodynamic con-siderations, the volumetric heat capacity of any material qcp
� �is
related to its enthalpy H according to [44],
qcpV ¼ @H@T
ð12Þ
where V is the volume of the material. Eq. (12) applies not only tosingle phase systems but also to a three-component composite wallof total volume Vt ¼ Vc þ Vs þ Vm where Vc;Vs, and Vm are the over-all volumes occupied by the core, shell, and matrix, respectively.The corresponding total enthalpy Ht (in J) is the sum of the enthal-pies of each constituent, i.e., Ht ¼ Hc þ Hs þ Hm. Thus, the effectivevolumetric heat capacity can be expressed as,
qcp� �
eff ðTÞ¼1Vt
@Ht
@T¼/c qcp
� �cðTÞþ/s qcp
� �sþ 1�/c�/sð Þ qcp
� �m ð13Þ
where /c ¼ Vc=Vt and /s ¼ Vs=Vt are the volume fractions of thecore and shell materials, while qcp
� �c; qcp� �
s, and qcp� �
m are the

220 A.M. Thiele et al. / Energy Conversion and Management 93 (2015) 215–227
volumetric heat capacities of the core, shell, and matrix materials,respectively. By substituting cp;cðTÞ given by Eq. (3) into Eq. (13),qcp� �
eff ðTÞ can be expressed as,
qcp� �
eff ðTÞ ¼
qcp� �
eff ;s for T < Tpc � DTpc=2
qcp� �
eff ;s þ /cqchsf
DTpcfor Tpc � DTpc=2 6 T 6 Tpc
þDTpc=2qcp� �
eff ;l for T > Tpc þ DTpc=2
8>>>>><>>>>>:
ð14Þ
where qcp� �
eff ;s is the effective volumetric heat capacity of the PCM-concrete composite wall with unmelted PCM given byqcp� �
eff ;s ¼ /c qcp� �
c;s þ /s qcp� �
s þ 1� /c � /sð Þ qcp� �
m. Here, it wasassumed to be equal to the effective volumetric heat capacity ofthe composite with fully melted PCM, i.e., qcp
� �eff ;s ¼ qcp
� �eff ;l.
Moreover, Felske [45] used the self-consistent field approxima-tion [46] to derive an effective medium approximation (EMA) topredict the effective thermal conductivity keff of monodispersespherical capsules randomly distributed in a continuous matrixgiven by,
keff ¼2km 1�/c�/sð Þ 3þ2/s
/cþ/skc
/c ks
� �þ 1þ2/cþ2/sð Þ 3þ /s
/c
� �kcþ2/sks
/c
h i2þ/cþ/sð Þ 3þ2/s
/cþ/skc
/c ks
� �þ 1�/c�/sð Þ 3þ/s
/c
� �kckmþ2 /sks
/c km
h i :
ð15Þ
This expression was validated using detailed numerical simulationsof ordered and randomly distributed monodisperse and polydis-perse microcapsules [40].
It is important to note that Eqs. (13)–(15) indicate that theeffective volumetric heat capacity and thermal conductivitydepended only on the constitutive phase properties and on theirvolume fractions. They were independent of core and shell diame-ters, microcapsule spatial arrangement, and polydispersity. Thus,from a thermal point of view, FCC packing is representative ofany arbitrary packing arrangement, as previously discussed [40].
3.4.3. Boundary conditionsTwo types of boundary conditions were imposed on the homo-
geneous wall. First, to demonstrate that the heterogeneous com-posite can be treated as a homogeneous material with someeffective thermal properties, the initial and boundary conditionsgiven by Eqs. (6) and (7) were imposed with Tð0; tÞ ¼ T0 andTðL; tÞ ¼ TL. Second, when simulating sinusoidal diurnal boundaryconditions, convective heat transfer was imposed at the interiorwall surface x ¼ L with a constant indoor temperature Tin main-tained by the HVAC system so that [36],
�keff@T@xðL; y; z; tÞ ¼ hi½TðL; tÞ � Tin� ð16Þ
where hi is the indoor mixed convective heat transfer coefficientaccounting for both forced and natural convections. Combined con-vective and radiative heat transfer was imposed at the exterior wallsurface given by Mathieu-Potvin and Gosselin [36] and Diaconu andCruceru [35],
�keff@T@xð0;y;z;tÞ¼ ho½Tð0;tÞ�T1ðtÞ�þasq00s ðtÞ��r½Tð0;tÞ
4�T4sky� ð17Þ
where ho is the outdoor convective heat transfer coefficient, Tsky
represents the average sky temperature, as and � are the total hemi-spherical absorptivity and emissivity of the outdoor wall surface,respectively, and r is the Stefan–Boltzmann constant, i.e.,r ¼ 5:67� 10�8 W=m2 K4. The ambient outdoor temperature T1ðtÞwas imposed as a sinusoidal function of time t (in s) expressed as,
T1ðtÞ ¼Tmax þ Tmin
2þ Tmax � Tmin
2sin
p43;200
t � 2p3
� �ð18Þ
where Tmax and Tmin are the maximum and minimum outdoor tem-peratures during a day, respectively. A phase shift of 2p/3 placedthe peak outdoor temperature Tmax at 2:00 pm, as the daily maxi-mum occurred between 1:00 pm and 3:00 pm for more than 80%of the year in California climate zone 9 (Los Angeles, CA) based onweather data [47]. Similarly, the solar radiation heat flux q00s ðtÞ asa function of time t (in s) was imposed as,
q00s ðtÞ ¼0 for 6 : 00 pm 6 t 6 6 : 00 am
q00s;max cos p43;200 t � p� �
for 6 : 00 am 6 t 6 6 : 00 pm
(
ð19Þ
where q00s;max is the maximum daily solar radiation heat flux (in W/m2). Here, the maximum daily solar radiation heat flux q00s;max wastaken as 535 W/m2 and occurred at 12:00 pm corresponding tothe average daily maximum value and time throughout the yearin California climate zone 9 [47].
3.4.4. Constitutive relationshipsThe indoor heat transfer coefficient hi was taken to be 8 W=m2 K.
This value was consistent with experimental measurements formixed forced and natural convection on a vertical wall reportedby Awbi and Hatton [48]. The outdoor heat transfer coefficient ho
was taken as 20 W=m2 K, based on previous numerical simulationsof walls exposed to outdoor weather conditions [37,49]. These val-ues of indoor hi and outdoor ho heat transfer coefficients were verysimilar to those recommended by ISO standard 6946 of 7.7 and
25 W=m2 K, respectively [50]. The total hemispherical solar absorp-tivity as and surface emissivity � of the outer wall were taken as0.26 and 0.9, respectively corresponding to typical values for whitepaint [43]. Finally, an average sky temperature Tsky of 2 �C was used[43]. Four outdoor temperature conditions were considered withminimum and maximum outdoor temperatures Tmin and Tmax setat (i) 20 and 40 �C, (ii) 10 and 30 �C, (iii) 0 and 20 �C, or (iv) 5 and35 �C, respectively. Table 1 summarizes the properties correspond-ing to PureTemp 20 PCM microencapsulated in HDPE and dispersedin concrete. The resulting effective volumetric heat capacityðqcpðTÞÞeff increased and the effective thermal conductivity keff
decreased nearly linearly with increasing PCM volume fraction /c
from 0.0 to 0.5 and /s ¼ 0:08 (see Supplementary material). Thus,both the thermal resistance and the sensible heat storage capacityof the composite wall increased with the addition of PCM.
3.5. Performance metrics
Many numerical studies considering building materials con-taining PCMs reported either the inside surface temperature ofthe wall and/or the average indoor temperature [31,33,51]. It hasbeen suggested that reducing the fluctuation of these temperaturesenhances the thermal comfort of occupants within a room [31,33].However, they do not directly contribute in determining energy orcost savings. In the present study, the energy flux reduction andthe time delay of the maximum thermal load were used to evaluatethe performance of PCM composite walls with respect to plain con-crete walls. First, the energy flux reduction Er was defined as therelative difference between the daily energy fluxes (in J/m2)through the plain concrete wall Q 00L;m and through the PCM-con-crete composite wall Q 00L expressed as,
Er ¼Q 00L;m � Q 00L
Q 00L;mð20Þ
where the energy fluxes Q 00L;m and Q 00L were respectively expressedas,

A.M. Thiele et al. / Energy Conversion and Management 93 (2015) 215–227 221
Q 00L;m ¼Z 24 h
0jq00L;mðtÞjdt and Q 00L ¼
Z 24 h
0jq00LðtÞjdt ð21Þ
Here, q00L;m and q00L are the conductive heat fluxes (in W/m2) at theinner wall located at x ¼ L for plain concrete walls and for PCM-con-crete composite walls, respectively. They are given by Fourier’s lawas,
q00L;mðtÞ ¼ �km@Tm
@x
����L
and q00LðtÞ ¼ �keff@T@x
����L
ð22Þ
The absolute values of q00L;m and q00L were considered to account forthe fact that there is an energy cost associated with maintainingthe indoor temperature at Tin, regardless of the direction of the heatflux across the wall. The energy flux reduction Er describes thereduction in the daily thermal energy added or removed from theroom per unit surface area of wall achieved by adding microencap-sulated PCM to the concrete wall.
The second performance metric considered was the time delaysd of the maximum inner wall heat flux defined as sd ¼ tmax � tmax;m
where tmax and tmax;m are the times at which q00LðtÞ, for the PCM-con-crete composite wall, and q00L;mðtÞ, for the plain concrete wall,reached their respective maximum value during the day. The timedelay is an important metric when a building is located in a place,such as California, where TOU electricity rate schedules are used byutility companies. In these cases, the time delay of the heat fluxmay shift the peak cooling load to a time of day with lower elec-tricity rates, thus resulting in cost savings for the ratepayer.
3.6. Method of solution
The governing Eqs. (5) and (11) along with the initial andboundary conditions given by Eqs. (6)–(9), (16), and (17) weresolved using the commercial finite element solver COMSOL Multi-physics 4.3. In cases with varying outdoor boundary temperatures,simulations were run for 3 days and temperature and heat fluxpredictions for the third day were considered. By then, the diurnalheat flux had reached periodic steady-state and the maximum rel-ative difference in the inner wall heat flux was less than 1% whenextending the simulation period by one day. Numerical conver-gence was considered to be achieved if the maximum relative dif-ference in the predicted local heat flux q00xðx; tÞ was less than 0.5%when reducing the mesh size or time step by a factor of 2. In prac-tice, converged solutions were obtained by imposing the minimummesh size and maximum growth rate to be Dx ¼ ðDs � DcÞ=6 and1.5, respectively. The number of finite elements needed to obtaina converged solution ranged from 3289 to 786,985 depending onthe size of the computational cell and on the core and shelldimensions.
Fig. 2. Area-averaged inner surface heat flux �q00L predicted for the heterogeneousthree-phase 1 mm thick slab and the corresponding homogeneous slab witheffective thermal properties as a function of time t for Tð0; tÞ ¼ T0 ¼ 20 �C andTðL; TÞ ¼ TL ¼ 37 �C. Values of effective volumetric specific heat and effectivethermal conductivity were qcp
� �eff ;s ¼ 2:04, 2.08, and 2.11 MJ=m3 K and keff ¼ 1:23,
0.94, and 0.75 W/m K corresponding to PCM volume fractions of /c ¼ 0:05, 0.25,and 0.4, respectively. The phase change properties were taken to be hsf ¼ 180 kJ/kg,Tpc ¼ 20 �C, and DTpc ¼ 3 �C.
3.7. Validation
In order to validate the computational tool, heat conductionthrough a two-dimensional 0.1 � 0.2 m2 rectangular paraffin slabheated at constant temperature on one side and thermally insu-lated on the other. This slab, undergoing partial solid–liquid phasetransition was simulated following the study by Ogoh and Groulx[30]. The predicted transient temperature profiles agreed well withthe exact solution for the one-dimensional Stefan problem derivedby Alexiades [52] (see Supplementary material). The results werealso consistent with those of Ogoh and Groulx [30] and supporttheir conclusion that conduction through a material during phasechange can be modeled numerically using the heat capacitymethod.
4. Results and discussion
4.1. Heterogeneous vs. homogeneous wall
In this section, we consider the slab of heterogeneous compos-ite material shown in Fig. 1b with thickness L ¼ 1 mm subjected toa step boundary condition given by Eqs. (6) and (7). The initial tem-perature Ti and inner surface temperature TðL; tÞ ¼ TL were equaland arbitrarily chosen to be 20 �C, and the outer surface tempera-ture Tð0; tÞ ¼ T0 was taken as 37 �C. The composite material con-sisted of PCM microencapsulated in HDPE shells and distributedin concrete (Table 1) and featured PCM volume fractions /c of0.05, 0.25, or 0.40 while /s was constant and equal to 0.08. The cor-responding effective volumetric heat capacity qcp
� �eff ;s of the
equivalent homogeneous wall predicted by Eq. (13) was 2.04,2.08, and 2.11 MJ=m3 K, respectively. Similarly, the effective ther-mal conductivity keff predicted by Eq. (15) was 1.23, 0.94, and0.75 W/m K, respectively. The latent heat of fusion hsf , phasechange temperature Tpc , and temperature window DTpc of thePCM were taken as 180 kJ/kg, 21.5 �C, and 3 �C, respectively.
Fig. 2 shows the area-averaged inner surface heat flux�q00LðtÞ ¼ q00xðL; tÞ as a function of time for PCM volume fraction /c
of 0.5, 0.25, and 0.4. It also shows the corresponding predictionsof the heat flux for the equivalent homogeneous slab with theabove mentioned effective thermal properties. In all cases, theaverage relative difference in the predicted area-averaged innersurface heat flux �q00LðtÞ between the heterogeneous composite slaband the equivalent homogeneous slab was less than 2% at all timeswhen the inner surface heat flux was greater than 5% of its steady-state value. Fig. 2 also demonstrates that increasing the PCM vol-ume fraction decreased the inner surface heat flux at all timesand delayed its steady state. This can be attributed to the fact thatadding PCM not only enhanced the latent and sensible thermalmass of the composite material but also its thermal resistance.
Fig. 3 compares the temperature profiles along the centerlineðx; a=2; a=2Þ of the composite structure of Fig. 1b at different timespredicted for the heterogeneous composite and for the correspond-ing homogeneous material for (a) /c ¼ 0:05 and (b) /c ¼ 0:40under the same conditions as the results shown in Fig. 2. The rela-tive difference in the local temperature between the heteroge-neous composite and the equivalent homogeneous material was

222 A.M. Thiele et al. / Energy Conversion and Management 93 (2015) 215–227
less than 1% at all times and locations. Fig. 3a and b confirm thatthe time delay in the temperature evolution increased withincreasing PCM volume fraction. They also illustrate that the tem-perature front progressed faster in the absence of phase change.
Overall, these results demonstrated that the heterogeneouscomposite can be treated as a homogeneous material with effectivevolumetric heat capacity qcp
� �eff ðTÞ and effective thermal conduc-
tivity keff given by Eqs. (13)–(15). Consequently, for the remainderof this study, a PCM-concrete composite wall will be simulated as ahomogeneous wall with these effective thermal properties. Thiswill make possible the simulation of walls with realistic thicknessL, on the order of tens of centimeters. Simulating a heterogeneouswall of such thickness with PCM microcapsules would be exces-sively time consuming and would require large computationalresources due to the large number of mesh elements required tosolve for the local temperature in the PCM and shell of themicrocapsules.
4.2. Diurnal thermal behavior
4.2.1. Effect of PCM volume fractionThis section considered homogeneous walls of thickness
L ¼ 10 cm subjected to sinusoidal diurnal boundary conditionsimposed at the inner and outer wall surfaces as described by Eqs.(16)–(19). The latent heat of fusion hsf , phase change temperature
(a)
(b)
0.0 0.2 0.4 0.6 0.8 1.018
20
22
24
26
28
30
32
34
36
38 t = 0.0 s t = 0.1 s t = 0.2 s t = 0.4 s t = 0.7 s
c = 0.4
Tem
pera
ture
, T (o C
)
Axial position, x (mm)
Increasing time
0.0 0.2 0.4 0.6 0.8 1.018
20
22
24
26
28
30
32
34
36
38 c = 0.05 Heterogeneous Homogeneous with phase change Homogeneous without phase change
Tem
pera
ture
, T (o C
)
Axial position, x (mm)
Increasing time
Fig. 3. Temperature profiles at different times through a 1 mm thick heterogeneouscomposite slab and its equivalent homogeneous slab with and without phasechange for PCM volume fraction of (a) /c ¼ 0:05 and (b) /c ¼ 0:4, respectively. Allboundary conditions and thermal properties were consistent with those specifiedfor Fig. 2.
Tpc , and temperature window DTpc were taken as 180 kJ/kg, 20 �C,and 3 �C, respectively. The outdoor temperature T1ðtÞ describedby Eq. (18) oscillated sinusoidally around Tpc betweenTmin ¼ 10 �C and Tmax ¼ 30 �C. In order to isolate the thermal effectof varying the PCM volume fraction /c , the shell volume fraction /s
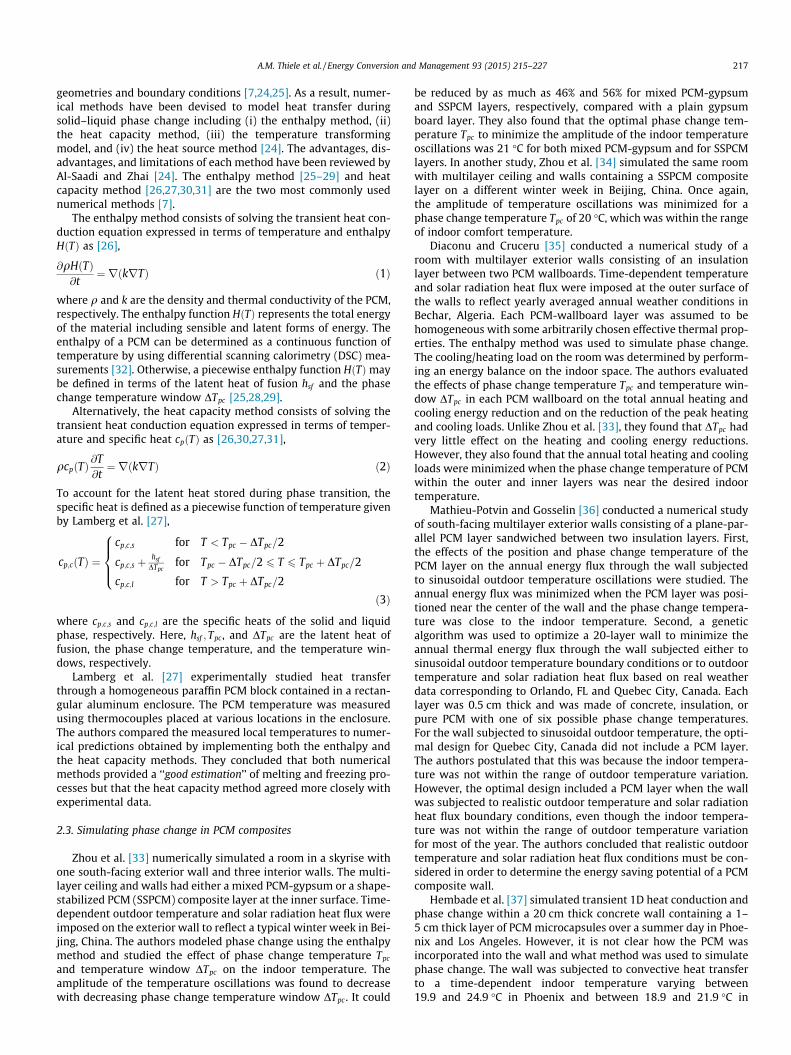
was taken as constant and equal to 0.08, representative of actualcommercial products [41]. Note that the trends and design rulesreported in this paper were found to be the same for different shellvolume fractions /s (not shown). Fig. 4a plots the inner wall heatflux as a function of time for PCM volume fractions /c ranging from0.0 to 0.5. It demonstrates that increasing the PCM volume fractionsignificantly reduced the heat transfer through the wall. In fact, aPCM volume fraction /c of 0.5 reduced the range of variation inthe inner wall heat flux by more than 90% compared with plainconcrete. Moreover, adding microencapsulated PCM to concretedelayed the peak inner wall heat flux corresponding to the maxi-mum cooling load.
Fig. 4b plots the energy flux reduction Er as a function of PCMvolume fraction /c ranging from 0.0 to 0.5. In order to distinguishthe contribution of phase change from that of other thermaleffects, the PCM specific heat cp;c was imposed to be either constantand equal to cp;c;s or a function of temperature as described by Eq.(3). Fig. 4b shows that the energy flux reduction Er increased sub-stantially with increasing PCM volume fraction. In the absence ofphase change, Er increased linearly with increasing /c due to theassociated increase in thermal resistance and sensible heat storageof the wall, i.e., keff < km and ðqcpÞeff ;s > ðqcpÞm. The energy fluxreduction Er was notably larger when phase change was accountedfor. However, its rise slowed down significantly when the PCM vol-ume fraction /c exceeded 0.2. In fact, the temperature profile cor-responding to /c ¼ 0:5 revealed that the temperature within aportion of the wall never exceeded the upper limit of the phasechange temperature window Tpc þ DTpc=2 during the day. In otherwords, the benefit of the latent heat of fusion was not fully realizedwhen the PCM volume fraction exceeded a critical value.
Fig. 4c shows the time delay sd in the maximum inner wall heatflux as a function of PCM volume fraction /c . It indicates that sd
increased significantly with increasing PCM volume fraction,reaching more than 13 h for /c of 0.5. Here also, the contributionof phase change to the time delay was important and dominatedover that of other thermal effects.
4.2.2. Effect of latent heat of fusionThe inner wall heat flux was computed as a function of time for
latent heat of fusion hsf ranging from 100 to 400 kJ/kg, representa-tive of actual PCMs [16,22,41] (see Supplementary material). Thevolume fraction of PCM /c , phase change temperature Tpc , andtemperature window DTpc were taken as 0.1, 20 �C, and 3 �C,respectively. The minimum and maximum outdoor temperatureswere Tmin ¼ 10 �C and Tmax ¼ 30 �C, respectively. The results estab-lished that increasing the latent heat of fusion reduced and delayedheat transfer through the wall. In fact, the energy flux reduction Er
increased from 25% to 64% and the time delay sd increased from 0.8to 5.7 h as hsf increased from 100 to 400 kJ/kg (see Supplementarymaterial). This trend was consistent with physical intuition basedon the fact that increasing the latent heat of fusion enhanced thewall’s thermal mass and the amount of energy stored therein.
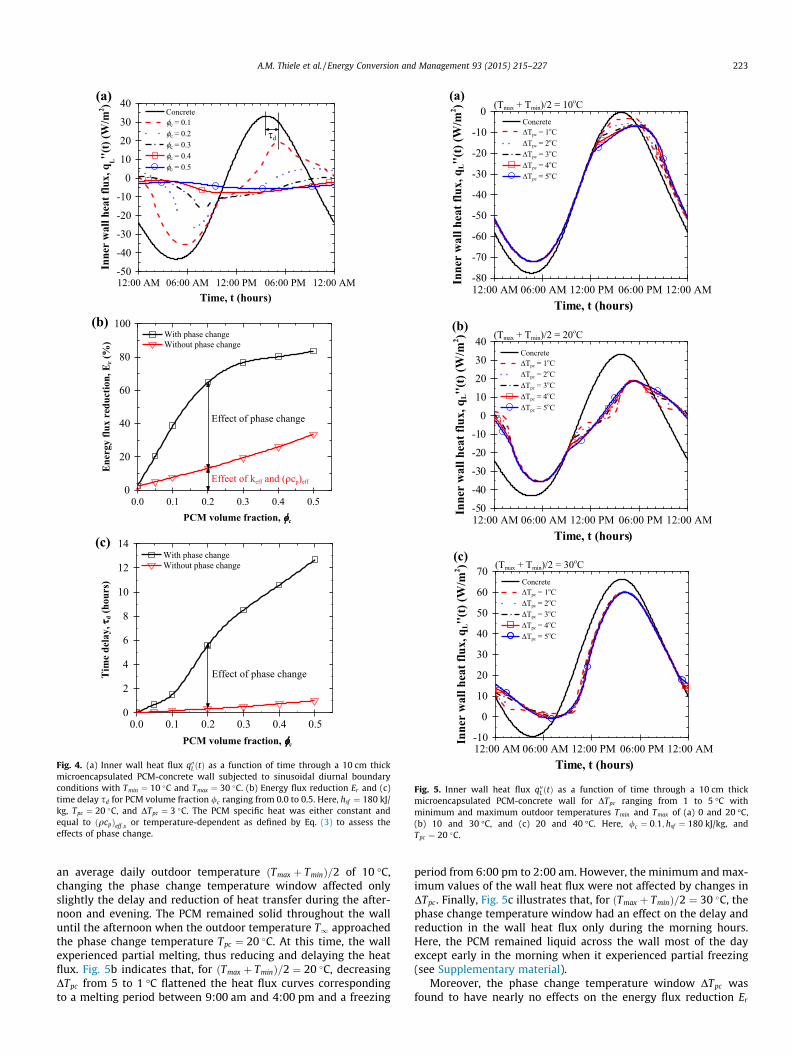
4.2.3. Effect of phase change temperature windowFig. 5a–c plot the inner wall heat flux q00LðtÞ as a function of time
for phase change temperature window DTpc ranging from 1 to 5 �Cand for average outdoor temperature ðTmax þ TminÞ=2 of 10, 20, and30 �C, respectively. The volume fraction of PCM /c , latent heat offusion hsf , phase change temperature Tpc , and amplitude of the out-door temperature oscillations ðTmax � TminÞ=2 were taken as 0.1,180 kJ/kg, 20 �C, and 10 �C, respectively. Fig. 5a indicates that, for
(a)
(b)
0.0 0.1 0.2 0.3 0.4 0.50
2
4
6
8
10
12
14
Effect of phase change
With phase change Without phase change
PCM volume fraction, c
Tim
e de
lay,
d (
hour
s)
12:00 AM 06:00 AM 12:00 PM 06:00 PM 12:00 AM-50
-40
-30
-20
-10
0
10
20
30
40
Time, t (hours)
Inne
r w
all h
eat f
lux,
qL''(
t) (W
/m2 )
Concretec = 0.1c = 0.2c = 0.3c = 0.4c = 0.5
d
0.0 0.1 0.2 0.3 0.4 0.50
20
40
60
80
100 With phase change Without phase change
PCM volume fraction, c
Ene
rgy
flux
redu
ctio
n, E
r (%
)
Effect of keff and cp)eff
Effect of phase change
(c)
Fig. 4. (a) Inner wall heat flux q00L ðtÞ as a function of time through a 10 cm thickmicroencapsulated PCM-concrete wall subjected to sinusoidal diurnal boundaryconditions with Tmin ¼ 10 �C and Tmax ¼ 30 �C. (b) Energy flux reduction Er and (c)time delay sd for PCM volume fraction /c ranging from 0.0 to 0.5. Here, hsf ¼ 180 kJ/kg, Tpc ¼ 20 �C, and DTpc ¼ 3 �C. The PCM specific heat was either constant andequal to ðqcpÞeff ;s or temperature-dependent as defined by Eq. (3) to assess theeffects of phase change.
(a)
(b)
12:00 AM 06:00 AM 12:00 PM 06:00 PM 12:00 AM-10
0
10
20
30
40
50
60
70
Inne
r w
all h
eat f
lux,
qL''(
t) (W
/m2 ) (Tmax + Tmin)/2 = 30oC
Time, t (hours)
ConcreteTpc = 1oCTpc = 2oCTpc = 3oCTpc = 4oCTpc = 5oC
12:00 AM 06:00 AM 12:00 PM 06:00 PM 12:00 AM-80
-70
-60
-50
-40
-30
-20
-10
0
Inne
r w
all h
eat f
lux,
qL''(
t) (W
/m2 ) (Tmax + Tmin)/2 = 10oC
Time, t (hours)
ConcreteTpc = 1oCTpc = 2oCTpc = 3oCTpc = 4oCTpc = 5oC
(c)
12:00 AM 06:00 AM 12:00 PM 06:00 PM 12:00 AM-50
-40
-30
-20
-10
0
10
20
30
40
Inne
r w
all h
eat f
lux,
qL''(
t) (W
/m2 ) (Tmax + Tmin)/2 = 20oC
Time, t (hours)
ConcreteTpc = 1oCTpc = 2oCTpc = 3oCTpc = 4oCTpc = 5oC
Fig. 5. Inner wall heat flux q00LðtÞ as a function of time through a 10 cm thickmicroencapsulated PCM-concrete wall for DTpc ranging from 1 to 5 �C withminimum and maximum outdoor temperatures Tmin and Tmax of (a) 0 and 20 �C,(b) 10 and 30 �C, and (c) 20 and 40 �C. Here, /c ¼ 0:1; hsf ¼ 180 kJ/kg, andTpc ¼ 20 �C.
A.M. Thiele et al. / Energy Conversion and Management 93 (2015) 215–227 223
an average daily outdoor temperature ðTmax þ TminÞ=2 of 10 �C,changing the phase change temperature window affected onlyslightly the delay and reduction of heat transfer during the after-noon and evening. The PCM remained solid throughout the walluntil the afternoon when the outdoor temperature T1 approachedthe phase change temperature Tpc ¼ 20 �C. At this time, the wallexperienced partial melting, thus reducing and delaying the heatflux. Fig. 5b indicates that, for ðTmax þ TminÞ=2 ¼ 20 �C, decreasingDTpc from 5 to 1 �C flattened the heat flux curves correspondingto a melting period between 9:00 am and 4:00 pm and a freezing
period from 6:00 pm to 2:00 am. However, the minimum and max-imum values of the wall heat flux were not affected by changes inDTpc. Finally, Fig. 5c illustrates that, for ðTmax þ TminÞ=2 ¼ 30 �C, thephase change temperature window had an effect on the delay andreduction in the wall heat flux only during the morning hours.Here, the PCM remained liquid across the wall most of the dayexcept early in the morning when it experienced partial freezing(see Supplementary material).
Moreover, the phase change temperature window DTpc wasfound to have nearly no effects on the energy flux reduction Er

(a)
(b)
12:00 AM 06:00 AM 12:00 PM 06:00 PM 12:00 AM-10
0
10
20
30
40
50
60
70
Inne
r w
all h
eat f
lux,
qL''(
t) (W
/m2 ) (Tmax + Tmin)/2 = 30oC
ConcreteTpc = 17oCTpc = 20oCTpc = 21oCTpc = 22oCTpc = 28oC
Time, t (hours)
12:00 AM 06:00 AM 12:00 PM 06:00 PM 12:00 AM-80
-70
-60
-50
-40
-30
-20
-10
0
Inne
r w
all h
eat f
lux,
qL''(
t) (W
/m2 ) (Tmax + Tmin)/2 = 10oC
Time, t (hours)
ConcreteTpc = 10oCTpc = 13oCTpc = 15oCTpc = 17oCTpc = 20oC
(c)
12:00 AM 06:00 AM 12:00 PM 06:00 PM 12:00 AM-50
-40
-30
-20
-10
0
10
20
30
40
Inne
r w
all h
eat f
lux,
qL''(
t) (W
/m2 ) (Tmax + Tmin)/2 = 20oC
ConcreteTpc = 18oCTpc = 20oCTpc = 22oCTpc = 24oC
Time, t (hours)
Fig. 6. Inner wall heat flux q00LðtÞ as a function of time through a 10 cmmicroencapsulated PCM-concrete wall for Tpc ranging from 10 to 28 �C withminimum and maximum outdoor temperatures Tmin and Tmax of (a) 0 and 20 �C, (b)10 and 30 �C, and (c) 20 and 40 �C, respectively. Here, /c ¼ 0:1;hsf ¼ 180 kJ/kg, andDTpc ¼ 3 �C.
(a)
(b)
12 16 20 24 28 320.0
0.5
1.0
1.5
2.0
2.5
3.0
3.5 (Tmax + Tmin)/2 = 10oC (Tmax + Tmin)/2 = 20oC (Tmax + Tmin)/2 = 30oC
Phase change temperature, Tpc (oC)
Tim
e de
lay,
d (
hour
s)
Tin
12 16 20 24 28 320
5
10
15
20
25
30
35
40
45Er,max
(Tmax + Tmin)/2 = 10oC (Tmax + Tmin)/2 = 20oC (Tmax + Tmin)/2 = 30oC
Tin
Ene
rgy
flux
redu
ctio
n, E
r (%
)
Phase change temperature, Tpc (oC)
Fig. 7. (a) Energy flux reduction Er and (b) time delay sd as a function of phasechange temperature Tpc for average outdoor temperature ðTmax þ TminÞ=2 of 10, 20,and 30 �C and outdoor temperature amplitude ðTmax � TminÞ=2 of 10 �C. Here,/c ¼ 0:1; hsf ¼ 180 kJ/kg, and DTpc ¼ 3 �C.
224 A.M. Thiele et al. / Energy Conversion and Management 93 (2015) 215–227
and on the time delay sd. In fact, Er was strictly independent of DTpc
when the heat flux was unidirectional during the entire day. BothEr and sd were the largest for ðTmax þ TminÞ=2 of 20 �C and equal to�40% and �2 h, respectively (see Supplementary material).
4.2.4. Effect of phase change temperatureFig. 6a–c plot the inner wall heat flux q00LðtÞ as a function of time
for different phase change temperature Tpc ranging from 10 to 28 �Cand for average outdoor temperature ðTmax þ TminÞ=2 of 10, 20, and30 �C, respectively. The volume fraction of PCM /c , latent heat of
fusion hsf , phase change temperature window DTpc , and amplitudeof the outdoor temperature oscillations ðTmax � TminÞ=2 were takenas 0.1, 180 kJ/kg, 3 �C, and 10 �C, respectively. Fig. 6a–c indicatethat, for given outdoor temperature conditions, increasing thephase change temperature Tpc up to a certain value delayed thepeak and reduced the amplitude of the heat flux through the micro-encapsulated PCM-concrete composite wall compared with a plainconcrete wall. They suggest that the delay and reduction of thethermal load on the wall may be maximized by choosing the opti-mum phase change temperature based on outdoor temperatureconditions.
Fig. 7a plots the energy flux reduction Er as a function of phasechange temperature Tpc for average outdoor temperatureðTmax þ TminÞ=2 of 10, 20, and 30 �C and for /c ¼ 0:1;hsf ¼ 180 kJ/kg,and DTpc ¼ 3 �C. First, it is interesting to note that, for an averagedaily outdoor temperature of 10 �C, even though the shape of theheat flux curves varied dramatically (Fig. 6a), the energy flux reduc-tion was independent of Tpc . In fact, the value of Er was equal to thatachieved in the absence of phase change, i.e., energy saving wassolely due to the increase in sensible heat storage and thermal resis-tance. Here, the heat flux was unidirectional from the inside to theoutside (i.e., q00L < 0) throughout the day (Fig. 6a). For an average out-door temperature of 20 �C, a distinct maximum energy flux reduc-tion Er;max of 39% was achieved for a phase change temperature Tpc
equal to the indoor temperature Tin of 20 �C. This result was consis-tent with conclusions reported in the literature for multilayer com-posite walls containing a PCM layer [36,35]. Lastly, for an average
0
5
10
15
20
25
30
35
40
45 (Tmax - Tmin)/2 = 10oC (Tmax - Tmin)/2 = 15oC
Max
imum
ene
rgy
flux
redu
ctio
n,
Er,
max
(%)
Average outdoor temperature,(Tmax + Tmin)/2 (oC)
Tin0
5
10
15
20
25
30
Average outdoor temperature,(Tmax + Tmin)/2 (oC)
(Tmax - Tmin)/2 = 10oC (Tmax - Tmin)/2 = 15oC
Tpc
,opt
,(o C
) Tin
0.0
0.5
1.0
1.5
2.0
2.5
3.0
3.5 (Tmax - Tmin)/2 = 10oC (Tmax - Tmin)/2 = 15oC
Max
imum
tim
e de
lay,
d,m
ax (h
ours
)
Average outdoor temperature,(Tmax + Tmin)/2 (oC)
Tin
5 10 15 20 25 30 35 5 10 15 20 25 30 35 40
5 10 15 20 25 30 35 5 10 15 20 25 30 35 400
5
10
15
20
25
30
35
Average outdoor temperature,(Tmax + Tmin)/2 (oC)
(Tmax - Tmin)/2 = 10oC (Tmax - Tmin)/2 = 15oC
Tpc
,opt
,(o C
)Tin
(a) (b)
(c) (d)
d r
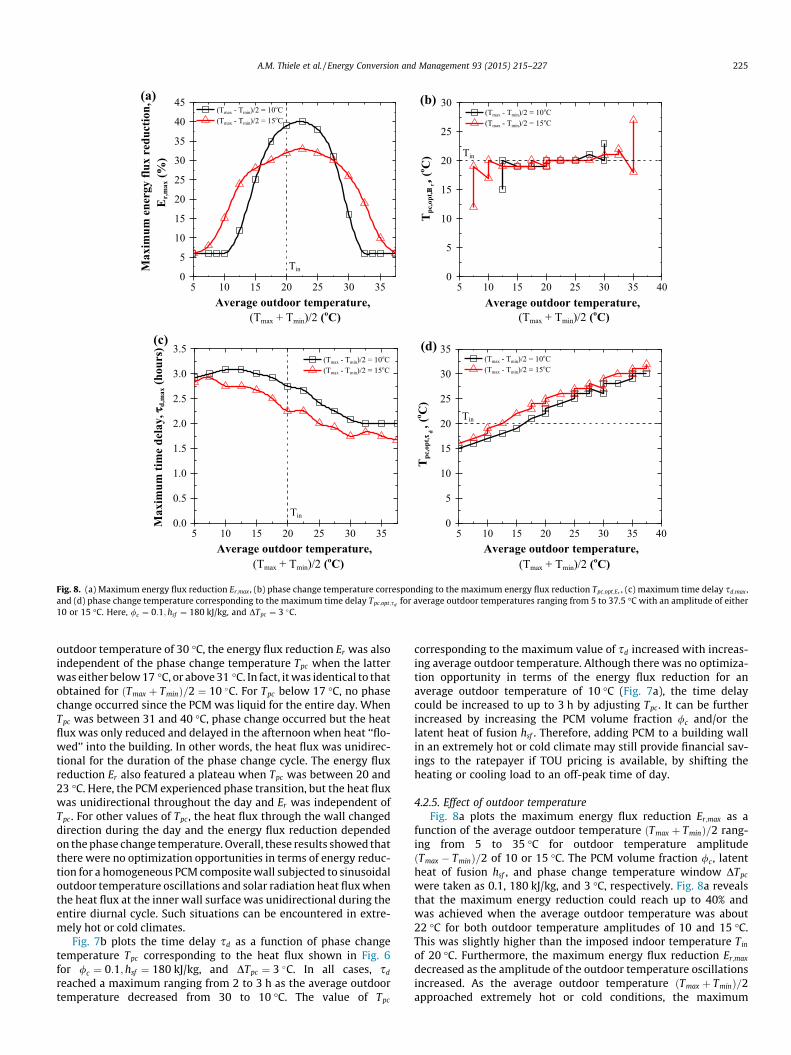
Fig. 8. (a) Maximum energy flux reduction Er;max , (b) phase change temperature corresponding to the maximum energy flux reduction Tpc;opt;Er , (c) maximum time delay sd;max ,and (d) phase change temperature corresponding to the maximum time delay Tpc;opt;sd
for average outdoor temperatures ranging from 5 to 37.5 �C with an amplitude of either10 or 15 �C. Here, /c ¼ 0:1; hsf ¼ 180 kJ/kg, and DTpc ¼ 3 �C.
A.M. Thiele et al. / Energy Conversion and Management 93 (2015) 215–227 225
outdoor temperature of 30 �C, the energy flux reduction Er was alsoindependent of the phase change temperature Tpc when the latterwas either below 17 �C, or above 31 �C. In fact, it was identical to thatobtained for ðTmax þ TminÞ=2 ¼ 10 �C. For Tpc below 17 �C, no phasechange occurred since the PCM was liquid for the entire day. WhenTpc was between 31 and 40 �C, phase change occurred but the heatflux was only reduced and delayed in the afternoon when heat ‘‘flo-wed’’ into the building. In other words, the heat flux was unidirec-tional for the duration of the phase change cycle. The energy fluxreduction Er also featured a plateau when Tpc was between 20 and23 �C. Here, the PCM experienced phase transition, but the heat fluxwas unidirectional throughout the day and Er was independent ofTpc. For other values of Tpc , the heat flux through the wall changeddirection during the day and the energy flux reduction dependedon the phase change temperature. Overall, these results showed thatthere were no optimization opportunities in terms of energy reduc-tion for a homogeneous PCM composite wall subjected to sinusoidaloutdoor temperature oscillations and solar radiation heat flux whenthe heat flux at the inner wall surface was unidirectional during theentire diurnal cycle. Such situations can be encountered in extre-mely hot or cold climates.
Fig. 7b plots the time delay sd as a function of phase changetemperature Tpc corresponding to the heat flux shown in Fig. 6for /c ¼ 0:1;hsf ¼ 180 kJ/kg, and DTpc ¼ 3 �C. In all cases, sd
reached a maximum ranging from 2 to 3 h as the average outdoortemperature decreased from 30 to 10 �C. The value of Tpc
corresponding to the maximum value of sd increased with increas-ing average outdoor temperature. Although there was no optimiza-tion opportunity in terms of the energy flux reduction for anaverage outdoor temperature of 10 �C (Fig. 7a), the time delaycould be increased to up to 3 h by adjusting Tpc . It can be furtherincreased by increasing the PCM volume fraction /c and/or thelatent heat of fusion hsf . Therefore, adding PCM to a building wallin an extremely hot or cold climate may still provide financial sav-ings to the ratepayer if TOU pricing is available, by shifting theheating or cooling load to an off-peak time of day.
4.2.5. Effect of outdoor temperatureFig. 8a plots the maximum energy flux reduction Er;max as a
function of the average outdoor temperature ðTmax þ TminÞ=2 rang-ing from 5 to 35 �C for outdoor temperature amplitudeðTmax � TminÞ=2 of 10 or 15 �C. The PCM volume fraction /c , latentheat of fusion hsf , and phase change temperature window DTpc
were taken as 0.1, 180 kJ/kg, and 3 �C, respectively. Fig. 8a revealsthat the maximum energy reduction could reach up to 40% andwas achieved when the average outdoor temperature was about22 �C for both outdoor temperature amplitudes of 10 and 15 �C.This was slightly higher than the imposed indoor temperature Tin
of 20 �C. Furthermore, the maximum energy flux reduction Er;max
decreased as the amplitude of the outdoor temperature oscillationsincreased. As the average outdoor temperature ðTmax þ TminÞ=2approached extremely hot or cold conditions, the maximum

226 A.M. Thiele et al. / Energy Conversion and Management 93 (2015) 215–227
energy flux reduction Er;max reached a constant value of about 6%.This was equal to the energy flux reduction achieved for PCMvolume fraction /c of 0.1 in absence of phase change. Theseresults confirm that phase change had no effect on the dailyenergy flux reduction in extreme hot or cold climates. It may alsoexplain why Chan [11] and Zwanzig et al. [12] observed smallreductions in wall heat transfer in the hot climates of Hong Kongand Miami, FL, respectively. In fact, Chan [11] showed that theinner wall surface temperature remained above 28 �C for almostthe entire cooling season. This was above the typical desiredindoor temperature range and would therefore result incontinuous cooling to accommodate a unidirectional heat flux.Additionally, the inner wall heat flux in Miami was unidirectionalfor nearly the entire summer week, as illustrated in Fig. 11 ofRef. [12]. However, the authors [11,12] attributed their findingsto the choice of phase change temperature and not to the factthat the heat flux was unidirectional in the climates theyconsidered.
Fig. 8b plots the optimum phase change temperature corre-sponding to the maximum energy flux reduction Tpc;opt;Er as a func-tion of average daily outdoor temperature ranging from 5 to 35 �Cand for outdoor temperature amplitude of 10 and 15 �C. It showsthat Er;max was achieved for an optimum phase change temperatureTpc;opt;Er near the indoor temperature Tin � 1 �C, regardless of theaverage daily outdoor temperature. This may seem counterintui-tive since one would a priori think that the PCM melting tempera-ture should also depend on the outdoor temperature or theclimate, as suggested in the literature [11,12,35].
Fig. 8c plots the maximum time delay sd;max as a function of theaverage outdoor temperature ðTmax þ TminÞ=2 ranging from 5 to35 �C for outdoor temperature amplitude ðTmax � TminÞ=2 of 10 or15 �C. For the selected value of /c ¼ 0:1, the maximum time delaycould reach up to about 3 h and was achieved when ðTmax þ TminÞ=2and ðTmax � TminÞ=2 were 10 �C. Additionally, sd;max decreased onlyslightly from 3 to 2 h as the average daily outdoor temperatureincreased from 5–10 to 35 �C. Fig. 8d plots the optimum phasechange temperature corresponding to the maximum time delayTpc;opt;sd
as a function of average daily outdoor temperature andfor outdoor temperature amplitude ðTmax � TminÞ=2 of 10 or 15 �C.It shows that Tpc;opt;sd
increased nearly linearly from 16 to 31 �Cas ðTmax þ TminÞ=2 increased from 5 to 35 �C.
5. Conclusion
This study demonstrated that a composite wall containingmicroencapsulated PCMs can be accurately represented as ahomogeneous wall with some effective thermal properties givenby Eqs. (13)–(15). This time-dependent homogeneous thermalmodel was used to establish important design rules that caninform the selection of microencapsulated PCMs for concretewalls in various climates. First, adding microencapsulated PCMto concrete walls and increasing the latent heat of fusion bothsubstantially reduced and delayed the thermal load on thebuilding. Second, the phase change temperature leading to themaximum energy flux reduction was equal to the desired indoortemperature regardless of the climate conditions. Third, toachieve the maximum time delay, the optimum phase changetemperature increased with increasing average outdoor tempera-ture. Fourth, in extremely hot or cold climates, the use of PCMdelayed the thermal load to take advantage of TOU pricing eventhough the energy flux reduction was not significant. Lastly, thephase change temperature window had little effect on the energyflux reduction and the time delay. This analysis can inform futuresimulations of composite walls containing microencapsulatedPCMs in any climate.
Acknowledgement
This manuscript was prepared as a result of work sponsored bythe California Energy Commission (Contract: PIR:-12-032), the U.S.National Science Foundation (CMMI: 1130028) and the Universityof California, Los Angeles (UCLA). It does not necessarily representthe views of the Energy Commission, its employees, the State ofCalifornia, or the National Science Foundation. The Energy Com-mission, the State of California, its employees, contractors, andsubcontractors make no warranty, express or implied, and assumeno legal liability for the information in this document; nor does anyparty represent that the use of this information will not infringeupon privately owned rights. This manuscript has not beenapproved or disapproved by the California Energy Commissionnor has the California Energy Commission passed upon the accu-racy or adequacy of the information in this paper.
Appendix A. Supplementary material
Supplementary data associated with this article can be found, inthe online version, at http://dx.doi.org/10.1016/j.enconman.2014.12.078.
References
[1] U.S. Energy Information Administration. Annual energy review 2011,Government Printing Office; 2012.
[2] U.S. Department of Energy. Buildings energy data book; 2011. <http://buildingsdatabook.eren.doe.gov>.
[3] Farid MM, Khudhair AM, Razack SAK, Al-Hallaj S. A review on phase changeenergy storage: materials and applications. Energy Convers Manage2004;45(9):1597–615.
[4] Electricity markets: consumers could benefit from demand programs, butchallenges remain, Tech. Rep. GAO-04-844, Government Accountability Office,Washington, DC, August 2004. <www.energy.ca.gov>.
[5] California Public Utilities Commission and Others. California long term energyefficiency strategic plan: achieving maximum energy savings in california for2009 and beyond. San Francisco (CA): California Public Utilities Commission;2008.
[6] Cabeza LF, Castellon C, Nogues M, Medrano M, Leppers R, Zubillaga O. Use ofmicroencapsulated PCM in concrete walls for energy savings. Energy Build2007;39(2):113–9.
[7] Jayalath A, Mendis P, Gammampila G, Aye L, Ngo T. Applications of phasechange materials in concrete for sustainable built environment: a review. In:Proceedings of the international conference on structural engineering,construction, and management (ICSECM), Kandy, Sri Lanka, December 16–18,2011, p. 1–13.
[8] Ling T-C, Poon C-S. Use of phase change materials for thermal energy storage inconcrete: an overview. Constr Build Mater 2013;46:55–62.
[9] Zhu N, Ma Z, Wang S. Dynamic characteristics and energy performance ofbuildings using phase change materials: a review. Energy Convers Manage2009;50(12):3169–81.
[10] Halford CK, Boehm RF. Modeling of phase change material peak load shifting.Energy Build 2007;39(3):298–305.
[11] Chan ALS. Energy and environmental performance of building façadesintegrated with phase change material in subtropical Hong Kong. EnergyBuild 2011;43(10):2947–55.
[12] Zwanzig SD, Lian Y, Brehob EG. Numerical simulation of phase change materialcomposite wallboard in a multi-layered building envelope. Energy ConversManage 2013;69:27–40.
[13] Khudhair AM, Farid MM. A review on energy conservation in buildingapplications with thermal storage by latent heat using phase changematerials. Energy Convers Manage 2004;45(2):263–75.
[14] Tyagi VV, Buddhi D. PCM thermal storage in buildings: a state of art. RenewSustain Energy Rev 2007;11(6):1146–66.
[15] Pasupathy A, Velraj R. Effect of double layer phase change material in buildingroof for year round thermal management. Energy Build 2008;40(3):193–203.
[16] Sharma A, Tyagi VV, Chen CR, Buddhi D. Review on thermal energy storagewith phase change materials and applications. Renew Sustain Energy Rev2009;13(2):318–45.
[17] Baetens R, Jelle BP, Gustavsen A. Phase change materials for buildingapplications: a state-of-the-art review. Energy Build 2010;42(9):1361–8.
[18] Kuznik F, David D, Johannes K, Roux J-J. A review on phase change materialsintegrated in building walls. Renew Sustain Energy Rev 2011;15(1):379–91.
[19] Tyagi VV, Kaushik SC, Tyagi SK, Akiyama T. Development of phase changematerials based microencapsulated technology for buildings: a review. RenewSustain Energy Rev 2011;15(2):1373–91.

A.M. Thiele et al. / Energy Conversion and Management 93 (2015) 215–227 227
[20] Zhou D, Zhao C-Y, Tian Y. Review on thermal energy storage with phasechange materials (PCMs) in building applications. Appl Energy2012;92:593–605.
[21] Salunkhe PB, Shembekar PS. A review on effect of phase change materialencapsulation on the thermal performance of a system. Renew Sustain EnergyRev 2012;16(8):5603–16.
[22] Sarier N, Onder E. Organic phase change materials and their textileapplications: an overview. Thermochim Acta 2012;540:7–60.
[23] Hunger M, Entrop AG, Mandilaras I, Brouwers HJH, Founti M. The behavior ofself-compacting concrete containing micro-encapsulated phase changematerials. Cem Concr Compos 2009;31(10):731–43.
[24] AL-Saadi SN, Zhai ZJ. Modeling phase change materials embedded in buildingenclosure: a review. Renew Sustain Energy Rev 2013;21:659–73.
[25] Voller V, Cross M. Accurate solutions of moving boundary problems using theenthalpy method. Int J Heat Mass Transfer 1981;24(3):545–56.
[26] Zhang D, Fung AS, Siddiqui O. Numerical studies of integrated concrete with asolid–solid phase change material. In: Proceedings of the 2nd canadian solarbuildings conference, Calgary, Canada, June 10–14, 2007.
[27] Lamberg P, Lehtiniemi R, Henell A-M. Numerical and experimentalinvestigation of melting and freezing processes in phase change materialstorage. Int J Therm Sci 2004;43(3):277–87.
[28] Darkwa J, Su O. Thermal simulation of composite high conductivity laminatedmicroencapsulated phase change material (MEPCM) board. Appl Energy2012;95:246–52.
[29] Gowreesunker BL, Tassou SA, Kolokotroni M. Improved simulation of phasechange processes in applications where conduction is the dominant heattransfer mode. Energy Build 2012;47:353–9.
[30] Ogoh W, Groulx D. Stefan’s problem: validation of a one-dimensional solid-liquid phase change heat transfer process. In: Proceedings of the COMSOLconference, Boston, MA, October 7–9, 2010.
[31] Heim D. Isothermal storage of solar energy in building construction. RenewEnergy 2010;35(4):788–96.
[32] Castellón C, Günther E, Mehling H, Hiebler S, Cabeza LF. Determination of theenthalpy of PCM as a function of temperature using a heat-flux DSC: a study ofdifferent measurement procedures and their accuracy. Int J Energy Res2008;32(13):1258–65.
[33] Zhou G, Zhang Y, Wang X, Lin K, Xiao W. An assessment of mixed type PCM-gypsum and shape-stabilized PCM plates in a building for passive solarheating. Sol Energy 2007;81(11):1351–60.
[34] Zhou G, Zhang Y, Lin K, Xiao W. Thermal analysis of a direct-gain room withshape-stabilized PCM plates. Renew Energy 2008;33(6):1228–36.
[35] Diaconu BM, Cruceru M. Novel concept of composite phase change materialwall system for year-round thermal energy savings. Energy Build2010;42(10):1759–72.
[36] Mathieu-Potvin F, Gosselin L. Thermal shielding of multilayer walls with phasechange materials under different transient boundary conditions. Int J ThermSci 2009;48(9):1707–17.
[37] Hembade L, Neithalath N, Rajan SD. Understanding the energy implications ofphase-change materials in concrete walls through finite-element analysis. JEnergy Eng 2013;140(1):04013009.
[38] Mackey CO, Wright LT. Periodic heat flow-homogeneous walls or roofs. ASHVETrans 1944;50:293–312.
[39] Kissock K, Limas S. Diurnal load reduction through phase-change buildingcomponents. ASHRAE Trans 2006:509–17.
[40] Thiele AM, Kumar A, Sant G, Pilon L. Effective thermal conductivity of three-component composites containing spherical capsules. Int J Heat Mass Transfer2014;73:177–85.
[41] PureTemp 20 Technical Information, Tech. Rep., Entropy Solutions Inc.,Minneapolis, MN; 2011.
[42] Typical engineering properties of high density polyethylene, Tech. Rep., INEOSOlefins & Polymers USA, League City, TX; 2009.
[43] Incropera FP, Bergman TL, Lavine AS, DeWitt DP. Fundamentals of heat andmass transfer. New York City (NY): John Wiley & Sons; 2011.
[44] Bridgman PW. A complete collection of thermodynamic formulas. Phys Rev1914;3(4):273–81.
[45] Felske JD. Effective thermal conductivity of composite spheres in a continuousmedium with contact resistance. Int J Heat Mass Transfer 2004;47:3453–61.
[46] Hashin Z. Assessment of the self consistent scheme approximation:conductivity of particulate composites. J Compos Mater 1968;2(3):284–300.
[47] UCLA Energy Design Tools Group. Climate Consultant; 2014. <http://www.energy-design-tools.aud.ucla.edu>.
[48] Awbi HB, Hatton A. Mixed convection from heated room surfaces. Energy Build2000;32(2):153–66.
[49] Alawadhi EM. Thermal analysis of a building brick containing phase changematerial. Energy Build 2008;40(3):351–7.
[50] International Organization for Standardization. ISO standard 6946: buildingcomponents and building elements: thermal resistance and thermaltransmittance - calculation method; 2007.
[51] Darkwa K, O’Callaghan PW, Tetlow D. Phase-change drywalls in a passive-solarbuilding. Appl Energy 2006;83(5):425–35.
[52] Alexiades V. Mathematical modeling of melting and freezing processes. BocaRaton (FL): CRC Press; 1992.