energy creation technologies - power plants and new energy€¦ · energy creation technologies --...
TRANSCRIPT

Energy Creation Technologies - Power Plants and New Energy
Whole Number 241, ISSN 0429-8284
2013Vol.59 No. 2

Cover Photo:The Abu Mega Solar Power Plant of the Okinawa Electric Power Company, Incorporated (photo courtesy of the Okinawa Electric Power Company, Incorporated), ‶PVI1000 Series” of power conditioners for mega solar applications, 139 MW steam turbine rotor for the Nga Awa Purua Geothermal Power Station in New Zealand, the Yoshinoura Thermal Power Station of the Okinawa Electric Power Company, Incorporated (photo courtesy of the Okinawa Electric Power Company, Incorporated) and prototype 3,000 kW permanent magnet synchronous generator for wind-power generation
22013Vol.59 No.
Energy Creation Technologies -- Power Plants and New Energy
Through the diffi culty of meeting the demand for electricity caused by the long-term shutdown of nuclear power plants in the wake of the Great East Japan Earthquake in addition to the problem of global warm-ing due to carbon emissions, power plants are demanded of lower envi-ronmental impact and higher reliability. Fuji Electric is advancing the development of power plants and new energy technologies as “energy creation” technologies for clean energy creation that is gentle on the environment. At its power plants, Fuji Electric is contributing to preser-vation of global environments and provision of electrical power through high performance and high reliability in each of the areas of “thermal power,” “rotating machines” and “nuclear power.” In terms of new en-ergy (renewable energy), Fuji Electric is advancing development in ar-eas such as geothermal power (binary system, fl ash system) wind power and photovoltaic power (mega solar) to promote widespread use of these forms of power generation.
In this feature we present the various energy creation technologies that contribute to the preservation of global environments and the stable provision of electrical power.
FUJI ELECTRIC REVIEW vol.59 no.2 2013date of issue: June 20, 2013
editor-in-chief and publisher EGUCHI NaoyaCorporate R & D HeadquartersFuji Electric Co., Ltd.Gate City Ohsaki, East Tower, 11-2, Osaki 1-chome, Shinagawa-ku,Tokyo 141-0032, Japanhttp://www.fujielectric.co.jp
editorial offi ce Fuji Electric Journal Editorial Offi cec/o Fuji Offi ce & Life Service Co., Ltd.1, Fujimachi, Hino-shi, Tokyo 191-8502, Japan
Fuji Electric Co., Ltd. reserves all rights concerning the republication and publication after translation into other languages of articles appearing herein.All brand names and product names in this journal might be trademarks or registered trademarks of their respective companies.

Energy Creation Technologies: Current Status and Future Outlook 84YONEYAMA Naoto
Energy Creation Technologies -Power Plants and New EnergyContents
FUJI ELECTRIC REVIEW vol.59 no.2 2013
Power Plant Technologies for Thermal and Geothermal Power Plants 91ONOE Kenji YAMAGATA Naofumi UENO Yasuo
Recent Technology for Improving Corrosion-Resistance 96and Performance of Geothermal TurbinesMORITA Kohei SATO Masahiro
Technology to Counter Silica Scaling in 101Binary Power-Generating System Using Geothermal Hot WaterKAWAHARA Yoshitaka SHIBATA Hiroaki KUBOTA Kokan
Latest Steam Turbine Technologies for Thermal Power Plants 107IZUMI Sakae MORIYAMA Takashi IKEDA Makoto
Global VPI Insulated Indirectly Hydrogen-Cooled Turbine Generator for 113Single-Shaft Type Combined Cycle Power Generation FacilitiesYAMAZAKI Masaru NIIKURA Hitoshi TANIFUJI Satoshi
Technology for Large-Scale Photovoltaic Power Generation Systems 118NAKAGAWA Masayuki XIANG Donghui
The Circuit and Control Technology in the Power Conditioner and 124Converter for Wind Turbine SystemsUMEZAWA Kazuyoshi UEHARA Fukashi YAMADA Toshiya
Permanent Magnet Synchronous Generator for Wind-Power Generation 130MASHIMO Akihide HOSHI Masahiro UMEDA Mio
Development of Fuel Cells Adapted to Meet New Needs 135KOSHI Kazuaki KURODA Kenichi HORIUCHI Yoshimi
Technology for Dry Decontamination and Volume Reduction of 140Contaminated DirtJINZA Keisuke TOMIZUKA Chiaki
84 FUJI ELECTRIC REVIEW vol.59 no.2 2013
CurrentStatus and
Future Outlook
1. Introduction In the “energy creation” sector, Fuji Electric has
worked to increase the effi ciency and performance of thermal power generating facilities, has made deliveries of such to many countries throughout the world in addition to Japan, and has contrib-uted to the stable supply of energy in the world. Moreover, in the renewable energy sector that in-cludes geothermal power generation and the like, Fuji Electric has also worked to develop power gen-erating facilities that are capable of supplying sta-ble energy. Further, with an eye toward renewable energy, Fuji Electric is also advancing the technical development and commercialization of photovol-taic power generation, wind power generation, bio-mass power generation, and the like. This paper describes the present status and future outlook for energy creation technology that will contribute to a more stable supply of energy and a reduced impact on the environment.
2. Global Energy Situation
2.1 Global energy trends
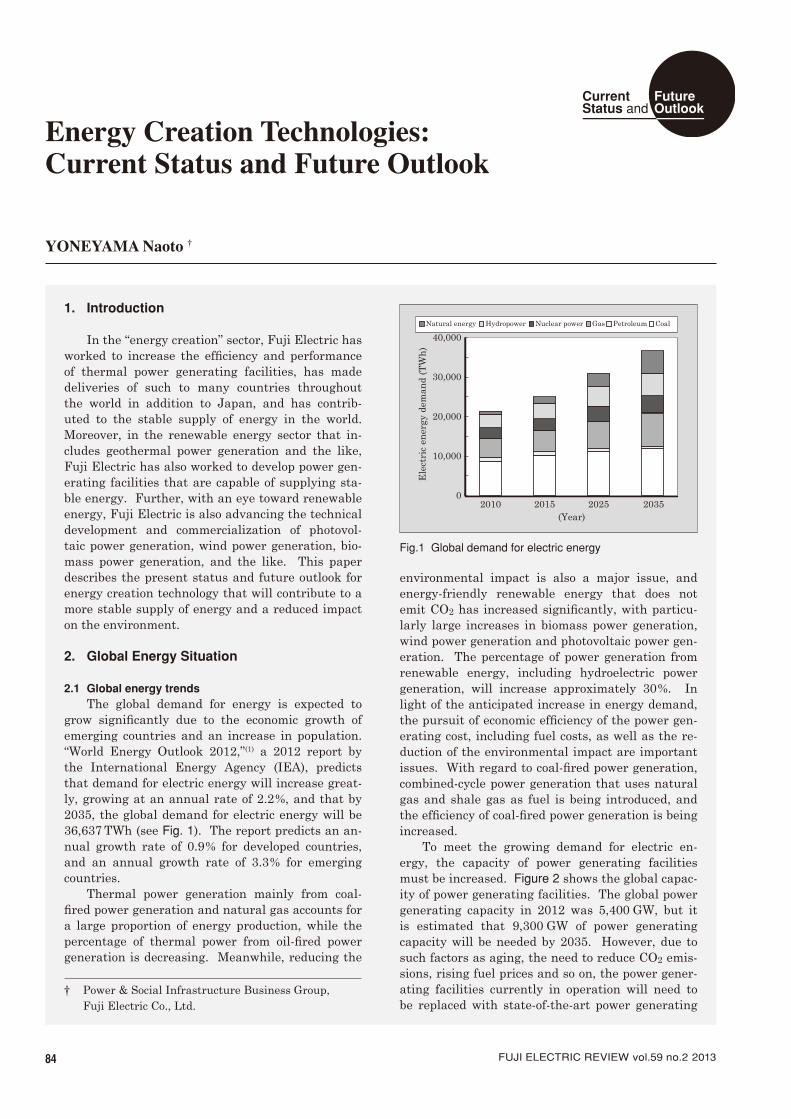
The global demand for energy is expected to grow signifi cantly due to the economic growth of emerging countries and an increase in population. “World Energy Outlook 2012,”(1) a 2012 report by the International Energy Agency (IEA), predicts that demand for electric energy will increase great-ly, growing at an annual rate of 2.2%, and that by 2035, the global demand for electric energy will be 36,637 TWh (see Fig. 1). The report predicts an an-nual growth rate of 0.9% for developed countries, and an annual growth rate of 3.3% for emerging countries.
Thermal power generation mainly from coal-fi red power generation and natural gas accounts for a large proportion of energy production, while the percentage of thermal power from oil-fi red power generation is decreasing. Meanwhile, reducing the
environmental impact is also a major issue, and energy-friendly renewable energy that does not emit CO2 has increased signifi cantly, with particu-larly large increases in biomass power generation, wind power generation and photovoltaic power gen-eration. The percentage of power generation from renewable energy, including hydroelectric power generation, will increase approximately 30%. In light of the anticipated increase in energy demand, the pursuit of economic effi ciency of the power gen-erating cost, including fuel costs, as well as the re-duction of the environmental impact are important issues. With regard to coal-fi red power generation, combined-cycle power generation that uses natural gas and shale gas as fuel is being introduced, and the effi ciency of coal-fi red power generation is being increased.
To meet the growing demand for electric en-ergy, the capacity of power generating facilities must be increased. Figure 2 shows the global capac-ity of power generating facilities. The global power generating capacity in 2012 was 5,400 GW, but it is estimated that 9,300 GW of power generating capacity will be needed by 2035. However, due to such factors as aging, the need to reduce CO2 emis-sions, rising fuel prices and so on, the power gener-ating facilities currently in operation will need to be replaced with state-of-the-art power generating
YONEYAMA Naoto †
Energy Creation Technologies: Current Status and Future Outlook
† Power & Social Infrastructure Business Group, Fuji Electric Co., Ltd.
0
10,000
20,000
30,000
40,000
2010 2015 2025 2035
Ele
ctri
c en
ergy
dem
and
(TW
h)
(Year)
Petroleum CoalNatural energy Hydropower Nuclear power Gas
Fig.1 Global demand for electric energy

85Energy Creation Technologies: Current Status and Future Outlook
Issu
e: E
nerg
y C
reat
ion
Tech
nolo
gies-
Pow
er P
lant
s an
d N
ew E
nerg
y
facilities. The IEA report predicts that by 2035, 2,000 GW, corresponding to approximately one-third of the existing power generating facility ca-pacity, will have been renewed, and that 5,900 GW of new power generating facilities will be built.
2.2 Energy trends in Japan
Figure 3 shows the composition of power gen-eration capacity in Japan. As a repercussion of the tsunami-related disaster at the Fukushima Daiichi Nuclear Power Plant as a result of the Great East Japan Earthquake of March 2011, the shutting down of nuclear power plants in Japan has contin-ued, and measures for the stable supply of electric power are being reviewed. The issue of restarting the nuclear power plants continues to be debated at
a national level. The September 2012 “Innovative Energy and Environmental Strategy” indicated a policy of promoting the advanced use of thermal power generation, advanced use of heat such as through cogeneration, and the development and use of next-generation energy related technologies in order to ensure a stable supply of energy. In particular, the main features of this strategy are to enhance and augment thermal power plants and to promote the introduction of renewable energy. In the enhancement and augmentation of thermal power plants, the introduction of high-effi ciency combined cycle power generation that uses natural gas as fuel and ultra super critical (USC) power generation*1 that uses coal as fuel, and the like, have attracted attention. In terms of renewable en-ergy, with the goal of introducing of 300 TWh (more than 3 times the current amount) by 2030, the in-troduction of renewable energy coupled with the “Feed-in Tariff Scheme for renewable energy” that began in July 2012 has gained momentum.
3. Thermal Power Generation
As shown in Fig. 1, thermal power generation
presently accounts for approximately 67% of the power generated to meet the global demand for electric energy, but as a result of initiatives to pro-mote the introduction of renewable energy and so on, this percentage will decrease to 57% by 2035. Meanwhile, the demand for power can be seen to be increasing to approximately 1.5 times the present level. Under these circumstances, from the per-spective of reducing CO2 emissions and of increas-ing economic effi ciency, including consideration of the fuel cost, oil-fi red power generation will be cut in half, combined cycle power generation that uses natural gas as fuel will be increased to 1.8 times its present level, and coal-fi red power generation will also be increased to nearly 1.4 times its present level mainly in emerging countries.
In the thermal power sector, high-effi ciency combined cycle power generation based on a combi-nation of gas turbines and steam turbines and that uses natural gas as fuel and ultra super critical (USC) power generation that uses coal as fuel will become the mainstream types of power generation in the future.
3.1 Combined cycle power generation
Combined cycle power generation has the char-acteristics of being highly effi cient, contributing to the prevention of global warming with low CO2
*1: Ultra super critical (USC) power generation
USC power generation is thermal pow-er generation technology in which the steam
is used under the conditions of ultra super critical pressure (steam temperature of at least 593°C and steam pressure of at least 24.1 MPa). USC power generation enables
the thermal energy required to vaporize wa-ter to be reduced so that power can be gener-ated more effi ciently.
Powergeneration
capacity955 TWh
Coal25.0%
(Reference: the Federation of Electric Power Companies of Japan)
Nuclear power10.7%
LNG39.5%
Petroleum14.4%
Natural energy1.4%
Hydro-power9.0%
Fig.3 Composition of power generation capacity in Japan
Petroleum CoalNatural energy Hydropower Nuclear power Gas
(Year)
0
1,000
2,000
3,000
4,000
5,000
6,000
7,000
8,000
9,000
10,000
2012 2035
Enhancement ofnew facilities
5,900
5,400
9,300
Cap
acit
y of
pow
er g
ener
atin
g fa
cili
ties
(G
W)
Disuse ofdecrepit facilities
2,000
Fig.2 Global capacity of power generating facilities

86 FUJI ELECTRIC REVIEW vol.59 no.2 2013
emissions, short startup time, good tracking per-formance according to load fl uctuations, etc., and will play an important role in future thermal power generation. Furthermore, combined cycle power generation has until now used natural gas as fuel, but recently, shale gas development has been ad-vancing rapidly mainly in the US and expectations for the future use of shale gas with gas turbines is increasing.
Fuji Electric has also been working with com-bined cycle power generation, and has moved for-ward with the construction of combined cycle power generation equipment (two 251 MW units) at the Yoshinoura Thermal Power Station of the Okinawa Electric Power Company, Incorporated (see Fig. 4). In November 2012, Unit No. 1 completed its comprehensive testing and began commercial op-eration. In addition, Unit No. 2 began commercial operation in May 2013. This power generating fa-cility was developed jointly with Siemens AG and is a single-shaft type combined cycle power generat-ing plant that combines a Siemens-made gas tur-bine (STG6-4000F, F-class), a single-cylinder reheat steam turbines with axial-fl ow exhaust developed by Fuji Electric, and a generator. In plant perfor-mance testing, effi ciency of at least 51% (HHV*2 ba-sis) was achieved, and good results that surpassed the expectations of the original design were con-fi rmed for the short-term load response capability and frequency adjustment capability.
In the future, combined cycle power genera-tion will progress toward larger sizes and improved thermal effi ciency as a result of higher combustion temperatures of the gas turbine. Siemens AG has also developed a larger capacity H-class gas tur-bine that employs a higher combustion tempera-
ture, and in an actual combined cycle power plant, that achieves the world’s highest effi ciency, signifi -cantly above 60% (LHV*2 basis, sending end). Fuji Electric continues to improve the performance of steam turbines and generators and to make equip-ment more compact, and is working on combined cycle power generation both in Japan and overseas. (see “Global VPI Insulated Indirectly Hydrogen-Cooled Turbine Generator for Single-Shaft Type Combined Cycle Power Generation Facilities” on page 113.)
3.2 Coal-fi red power generation
Coal-fi red power generation is being developed mainly by emerging countries in order to increase its economic effi ciency. In developed countries, ef-forts to reduce CO2 emissions are seen to restrict new development, but with new technical develop-ments such as higher effi ciencies resulting from the development of the ultra supercritical pressure tur-bine and the gasifi cation of coal, the merit of coal-fi red power generation has been reconsidered.
In the medium capacity sector, Fuji Electric has delivered many high-performance, highly reliable coal-fi red power generation facilities to countries throughout the world. Recently, Fuji Electric has been working on steam turbines and generators (4 units, 300 MW) for the Haiphong Thermal Power Plant in Vietnam, and steam turbines and genera-tors (2 units, 300 MW) for the Nghi Son Thermal Power Plant.
For ultra supercritical power generation, Fuji Electric, in collaboration with Siemens AG, has de-livered the turbine and generator (1 unit, 600 MW) for Unit 1 of J-Power’s Isogo Thermal Power Plant. Utilizing a main steam temperature of 600 °C and a reheat steam temperature of 610 °C, an advanced blade stage design achieves high plant effi ciency and contributes to reduced CO2 emissions and im-proved economic effi ciency. Higher effi ciency by in-creasing the temperature and pressure of the main steam in steam turbines will continue to be sought in the future. On the other hand, improving the reliability of turbines is also an important factor. Thus, in addition to improving the performance of the steam turbine stage, Fuji Electric continues to develop rotor material, casing material and turbine blade material, improve the corrosion resistance of turbine blades, and develop corrosion monitoring technology.
The development of 700 °C class steam tem-perature, advanced ultra-supercritical (A-USC) power generation technology that aims to further
*2: HHV, LHVAfter a unit quantity of fuel placed in
a constant state is completely combusted adiabatically, the amount of heat that must
be dissipated in order for the combustion gas to be returned to its original temperature is called the “calorifi c value.” The calorifi c value is specifi ed as either the higher heat-
ing value (HHV), which includes the latent heat of the water vapor, or as the lower heat-ing value (LHV), which does not include that latent heat.
Fig.4 Yoshinoura Thermal Power Station of the Okinawa Electric Power Company, Incorporated(Photo: provided by the Okinawa Electric Power Company, Incorporated)

87Energy Creation Technologies: Current Status and Future Outlook
Issu
e: E
nerg
y C
reat
ion
Tech
nolo
gies-
Pow
er P
lant
s an
d N
ew E
nerg
y
improve effi ciency is being advanced for next-generation steam turbines. Fuji Electric is also is advancing the technical development of A-USC technology through its participation in the “METI-sponsored development of advanced ultra-supercrit-ical power generation.” (see “Latest Steam Turbine Technologies for Thermal Power Plants” on page 107.)
4. Geothermal Power Generation
Among renewable energy sources, geothermal
power has the characteristics of (a) being usable as a base load supply with an output that does not fl uctuate due to weather or the like, (b) hav-ing a high capacity utilization rate, and (c) being highly economic effi ciency, and is being developed in geothermal resource-rich countries throughout the world.
Geothermal resources exist in abundance in the Pacifi c Rim (Japan, United States, Indonesia, Philippines, New Zealand and Chile) and in Africa (Kenya and Ethiopia), and geothermal power gen-eration is being developed in various countries. Japan is said to be ranked third in geothermal re-sources (having geothermal resources of approxi-mately 23.5 GW) behind the United States and Indonesia. Fuji Electric has focused on geothermal power generation, and having been involved in the research and development of geothermal power generation equipment since the 1960s, has a suc-cessful record of delivering many highly reliable geothermal power generation systems and has a large share of the global market in terms of deliver-ies.
Described below are two methods of geothermal power generation, large-scale fl ash power genera-tion used directly with a geothermal turbine where-by hot water and steam ejected from the ground are boiled at low pressure and only the steam is re-moved, and small-capacity binary power generation in which a secondary medium having a low boiling point is vaporized by relatively low-temperature geothermal water and that vapor is harnessed to rotate the turbine and generate power.
In regard to fl ash power generation, in October 2010, Fuji Electric delivered a 140 MW geothermal power system, the world’s largest capacity for tri-ple-fl ash power generation*3, to the Nga Awa Purua Geothermal Power Station in New Zealand (see Fig.
5). More recently, in December 2012, Fuji Electric delivered a geothermal power system (2 units, 55 MW) to the Ulubelu Geothermal Power Station in Indonesia. (see “Power Plant Technologies for Thermal and Geothermal Power Plants” on page 91.)
In geothermal power generation, large quanti-ties of corrosive gas and impurities are contained in the geothermal fl uid and may cause such prob-lems as corrosion, erosion-corrosion*4, scaling, and the like. Based on onsite verifi cation test data and on inspection and maintenance data obtained from a track record of many deliveries, Fuji Electric is researching and developing optimal materials and coating technology for the turbine blades and casing in order to improve the reliability of the turbine, generator and ancillary equipment. It is important to improve both reliability and performance, and turbine blades and the like that are highly resis-tant to corrosion and that are highly effi cient are under development. (see “Recent Technology for Improving Corrosion-Resistance and Performance of Geothermal Turbines” on page 96.)
The method of binary power generation was developed in order to effectively utilize geothermal hot water that is at a relatively low temperature, and this method is expected be introduced in small-size geothermal power systems. On the other hand, the binary power generation method can also be used with reinjection hot water that, through use of the fl ash power generation method, has been returned to a reinjection well because that reinjec-tion hot water still contains thermal energy. Fuji Electric calls this power generation method “hybrid
*3: Triple-fl ash power generationIn the fl ash method of power genera-
tion, geothermal resources extracted as hot water are separated into steam and hot wa-ter, and the separated steam is sent to a tur-bine, where power is generated. The sepa-rating of the steam and hot water in 3 stages
is called triple-fl ash power generation, and enables the extracted geothermal resources to be utilized maximally.
*4: Erosion-corrosion Erosion-corrosion is the phenomenon
whereby the thinning of metal is accelerated as a result of the synergistic action of erosion (mechanical wear due to fl ow and solid par-ticles) and corrosion (electrochemical wear within a corrosive solution).
Fig.5 Nga Awa Purua Geothermal Power Station in New Zealand

88 FUJI ELECTRIC REVIEW vol.59 no.2 2013
geothermal power generation” and seeks to apply it to improve the energy recovery effi ciency of entire power plants. Silica scaling occurs easily in low temperature reinjection hot water, and constric-tion in the reinjection well must be prevented. Fuji Electric is also researching the occurrence of silica scaling in reinjection hot water, and is utilizing the results of that research to promote hybrid geother-mal power generation. (see “Technology to Counter Silica Scaling in Binary Power-Generating System Using Geothermal Hot Water” on page 101.)
5. Renewable Energy
The prevention of global warming is important
as a corporate social mission, and the introduction of renewable energy that does not emit CO2 is be-ing promoted in various countries throughout the world. According to the IEA report, the introduc-tion of renewable energy is expected to grow at an annual rate of 6 to 8%. In Japan, the best mix of energy, distributed energy systems, the construc-tion of smart communities, and the like are being debated as part of the national energy policy, and renewable energy is positioned as a signifi cant por-tion of that policy. The Feed-in Tariff Scheme for renewable energy applies to photovoltaic energy, wind power, geothermal energy, medium and small hydropower, and biomass power generation, and stipulates that generated power is to be purchased for a predetermined term at a fi xed price. For this reason, renewable energy power producers are eas-ily able to establish business plans, and the intro-duction of renewable energy generation is gaining momentum. Presently, the introduction of photo-voltaic power generation, for which construction is relatively simple, is advancing, but the introduction of wind power and thermal power is expected to ad-vance subsequently. Fuji Electric is also advancing the research and development of renewable energy power generating devices and equipment, and has been working on the commercialization of high ef-fi ciency, high performance devices and plant con-struction with EPC*5.
5.1 Photovoltaic power generation
Photovoltaic power generation can be broadly
classifi ed as small photovoltaic power generation systems installed on house roofs and large-scale photovoltaic power generation (mega-solar) systems installed mainly on the ground. Fuji Electric is working primarily on mega-solar. The key to photo-voltaic power generating systems lies in the extent to which its economic effi ciency can be increased. Important factors include minimizing loss of the power generating system, increasing the amount of power generated per unit area, improving device re-liability to increase the utilization rate and thereby boost the amount of power generated annually, re-ducing the construction costs for photovoltaic panel installation and wiring, and so on.
Fuji Electric is applying its power electronics technology and system design technology acquired thus far to build photovoltaic power generation systems that have high economic effi ciency. In the power electronics technology sector, Fuji Electric has developed a 1,000 V DC, 1 MW power condi-tioner (PCS) (see Fig. 6) that incorporates indus-try-leading advanced T-type neutral-point-clamped (AT-NPC) 3-level conversion circuit*6 for use in mega-photovoltaic systems. The application of an AT-NPC 3-level conversion circuit dramatically reduced the switching loss and fi ltering loss and resulted in achieving the world’s highest effi ciency of 98.5%. With the DC input set to 1,000 V, DC-side loss is reduced, and lower construction costs are anticipated as a result of an outdoor type model that eliminates the need for a structure to house
*5: EPC EPC is an acronym for engineering,
procurement and construction, and indi-cates the engineering design, procurement of materials, and construction work as the scope of services at the time of plant con-struction. The contracting of this work col-lectively is called the EPC method or EPC business of contracting.
*6: AT-NPC 3-level conversion circuitCompared to a typical 2-level conver-
sion circuit that has two output voltage stages, a 3-level conversion circuit has one additional stage. As a result, the wave-form of the output line-to-line voltage more closely resembles a sine wave, and this has the advantages of allowing the LC fi lter of the device to be made smaller, increasing the power conversion effi ciency, and so on. A conventional 3-level circuit is connected
to the neutral point of a DC power supply and is therefore referred to as a neutral-point-clamped (NPC) scheme. With the advanced T-type NPC (AT-NPC) scheme, elements having different rated voltages are combined and a reverse blocking IGBT (RB-IGBT) is used as an intermediate element to simplify the circuit compared to the conven-tional scheme and to realize higher power conversion effi ciency.
Fig.6 Outdoor PCS (1,000 V DC, 1 MW)

89Energy Creation Technologies: Current Status and Future Outlook
Issu
e: E
nerg
y C
reat
ion
Tech
nolo
gies-
Pow
er P
lant
s an
d N
ew E
nerg
y
the PCS. In the system design sector, Fuji Electric is improving design techniques for a comprehensive system design that considers the installation envi-ronment and economic effi ciency through optimiz-ing the photovoltaic module and array according to the environment, reducing wiring loss, planning of interconnection equipment that conforms to the grid interconnection requirements, and designing monitoring controls that incorporate smart technol-ogy and/or are cloud based, etc. (see “Technology for Large-Scale Photovoltaic Power Generation Systems” on page 118.)
In addition, Fuji Electric plans to build a 2 MW photovoltaic power facility on vacant land in Yamanashi Prefecture in Japan. This facility will be used to carry out verifi cation testing of the devel-oped PCS and grid interconnection equipment, to collect data for reliability confi rmation and product improvement, and to improve construction tech-niques. This facility is expected to be completed in March 2013, and the verifi cation data and effec-tive construction techniques obtained here will be applied to advance the construction of high perfor-mance and highly economic effi cient photovoltaic power systems.
5.2 Wind power generation
Wind power generation occupies an impor-tant position among types of renewable energy. In Japan, onshore installations of wind power genera-tion have been mostly small-scale until now. From the perspective of economic effi ciency and due to limited installation sites, offshore wind power gen-eration is being eyed for large-scale wind power generation (wind farms) in the future. The large-scale wind power generating equipment at such sites will have power generating capacities of 3 to 5 MW per unit. Fuji Electric is focusing its efforts on large-scale generators for wind power facilities, PCSs, power stabilization devices, and the like.
For wind power generation, it had been com-mon to use a double-fed system that employs a speed-increasing gear to increase the rotational speed of the wind turbine and cause the genera-tor to rotate at high speed. However, as the power generating capacity increases, such as in the case of offshore wind power, a large-size speed increasing gear becomes necessary, and trouble and mainte-nance associated with that speed-increasing gear becomes a large issue. As a recent trend, a direct-drive system that omits the speed-increasing gear is being used in large-scale wind power generation.
Fuji Electric has developed and commercial-
ized a 3,000 kW permanent magnet synchronous generator for use in a direct-drive system. With the direct-drive system, the rotational speed is slow, at approximately 15 min–1, and the generator is large in size, but by using a method of excita-tion with a permanent magnet and optimizing the ventilation and cooling system, the winding method and the structure, smaller size, lighter weight and higher performance are achieved. Additionally, with this method, a large-size PCS at full capacity is required for the generator, but high effi ciency is realized by applying an AT-NPC 3-level conver-sion circuit that incorporates Fuji Electric’s power electronics technology in the PCS. (see “Permanent Magnet Synchronous Generator for Wind-Power Generation” on page 130.)
In consideration of applications to offshore wind power generation, the cooling system is character-ized by the use of water cooling, rather than cooling with the outside air. FRT capability*7 is also pro-vided as a standard feature.
Moreover, wind power output fl uctuates from moment to moment, and the effect of such fl uctua-tions on the power quality is an issue. To advance the introduction of wind power generation, Fuji Electric combines a storage cell and power stabi-lizer so that fl uctuations in the output from wind power generation can be suppressed through con-trol of the charging and discharging of the storage cell, and also applies a power stabilizer to increase the quality of the voltage and frequency of the pow-er grid. (see “The Circuit and Control Technology in the Power Conditioner and Converter for Wind Turbine Systems” on page 124.)
6. Postscript
The global demand for electric power energy
will increase greatly in the future, and accordingly, “energy creation” to produce electric power energy will play an important role. In order to realize a stable supply of electric power and a low carbon society, Fuji Electric remains committed to the pur-suit of energy creation. Fuji Electric will continue to advance the research and development of large-scale thermal power generation and geothermal power generation, and to provide highly effi cient, high performance and highly reliable power genera-tion equipment. Renewable energy is environmen-tally friendly, does not emit CO2, and is positioned as an important energy for achieving the best mix of energy. In the renewable energy sector, in addi-tion to power generation capability, grid intercon-
*7: FRT capabilityFault ride through (FRT) capability is,
at the time of a three-phase short circuit or two-phase short circuit with the power grid,
the ability to continue operation so as to output three-phase current within a speci-fi ed range and to suppress power supply fl uctuations of the grid, without the inverter
quickly halting its output. The specifi ed range indicates the duration of momentary line drop and the voltage drop range and is determined by each country.

90 FUJI ELECTRIC REVIEW vol.59 no.2 2013
nection technology and stabilizing technology are also important factors. Fuji Electric seeks to com-bine the power electronics technology and control technology at which it excels in order to build opti-mal systems.
Fuji Electric is also working to build smart com-munities for which further growth is anticipated. To build a smart community society, it is impor-tant to aggregate technologies for energy creation,
energy savings, power electronics and energy opti-mizing control, information communication and the like, and Fuji Electric intends to use its collective strengths to contribute to society.
Reference (1) International Energy Agency. World Energy
Outlook 2012, Organization for Economic, 2012.
Issu
e: E
nerg
y C
reat
ion
Tech
nolo
gies-
Pow
er P
lant
s an
d N
ew E
nerg
y
A B S T R A C T
1. Introduction The Yoshinoura Thermal Power Station (Unit No.
1) of the Okinawa Electric Power Company, Incor-porated and the Ulubelu Geothermal Power Station both started operation in 2012. In both cases, since the power generating facilities supplied by Fuji Electric would become the main facility in each regional power system, each project was carried out under the watch-ful eye of the stakeholders and customers.
The Unit No. 1 of the Yoshinoura Thermal Power Station is the largest capacity gas turbine combined cycle (GTCC) generator built by Fuji Electric as a turn-key (EPC) project, and is also the largest capacity gen-erator on the main island of Okinawa. The Ulubelu Geothermal Power Station has been built at a highland on the Indonesian island of Sumatra, where the power grid infrastructure is fragile, and is also the largest ca-pacity geothermal power plant on that island.
The plant technology used in large-scale thermal and geothermal projects is described below using these power plants as examples.
2. Yoshinoura Thermal Power Station of
the Okinawa Electric Power Company, Incorporated
2.1 Plant overview Fuji Electric and Siemens AG delivered a sin-
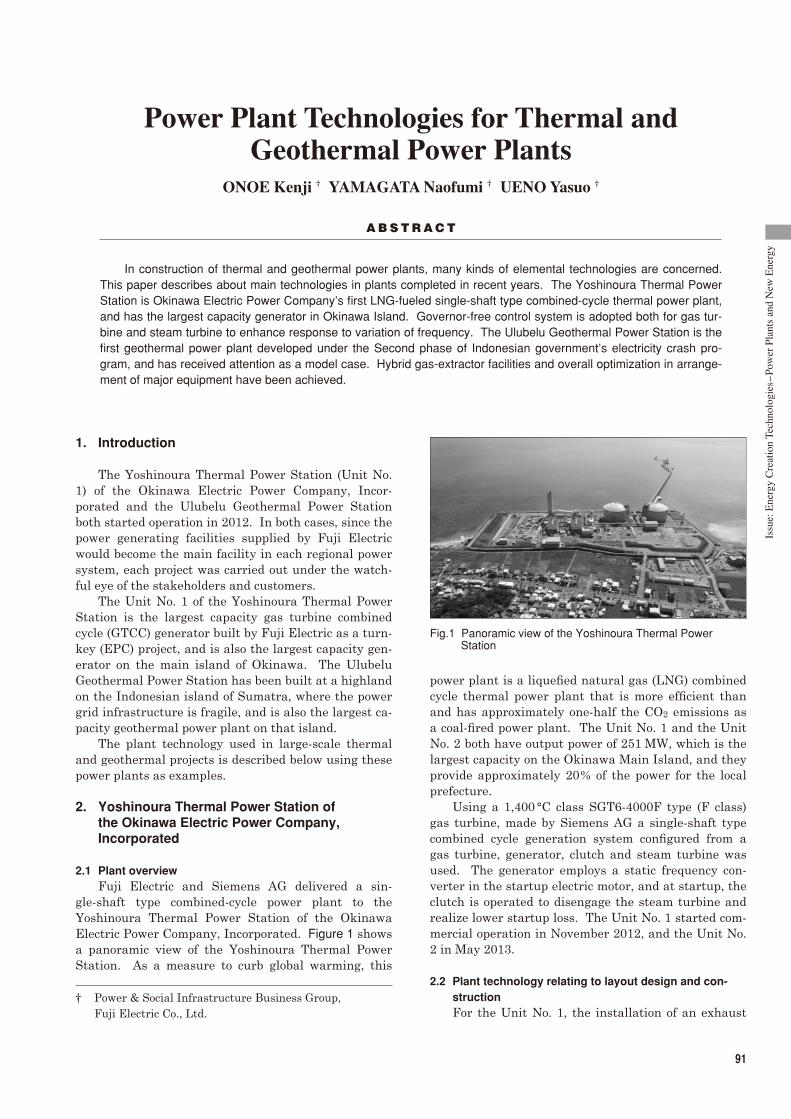
gle-shaft type combined-cycle power plant to the Yoshinoura Thermal Power Station of the Okinawa Electric Power Company, Incorporated. Figure 1 shows a panoramic view of the Yoshinoura Thermal Power Station. As a measure to curb global warming, this
ONOE Kenji † YAMAGATA Naofumi † UENO Yasuo †
Power Plant Technologies for Thermal and Geothermal Power Plants
In construction of thermal and geothermal power plants, many kinds of elemental technologies are concerned. This paper describes about main technologies in plants completed in recent years. The Yoshinoura Thermal Power Station is Okinawa Electric Power Company’s fi rst LNG-fueled single-shaft type combined-cycle thermal power plant, and has the largest capacity generator in Okinawa Island. Governor-free control system is adopted both for gas tur-bine and steam turbine to enhance response to variation of frequency. The Ulubelu Geothermal Power Station is the fi rst geothermal power plant developed under the Second phase of Indonesian government’s electricity crash pro-gram, and has received attention as a model case. Hybrid gas-extractor facilities and overall optimization in arrange-ment of major equipment have been achieved.
91
power plant is a liquefi ed natural gas (LNG) combined cycle thermal power plant that is more effi cient than and has approximately one-half the CO2 emissions as a coal-fi red power plant. The Unit No. 1 and the Unit No. 2 both have output power of 251 MW, which is the largest capacity on the Okinawa Main Island, and they provide approximately 20% of the power for the local prefecture.
Using a 1,400 °C class SGT6-4000F type (F class) gas turbine, made by Siemens AG a single-shaft type combined cycle generation system confi gured from a gas turbine, generator, clutch and steam turbine was used. The generator employs a static frequency con-verter in the startup electric motor, and at startup, the clutch is operated to disengage the steam turbine and realize lower startup loss. The Unit No. 1 started com-mercial operation in November 2012, and the Unit No. 2 in May 2013.
2.2 Plant technology relating to layout design and con-
struction For the Unit No. 1, the installation of an exhaust
† Power & Social Infrastructure Business Group, Fuji Electric Co., Ltd.
Fig.1 Panoramic view of the Yoshinoura Thermal Power Station

92 FUJI ELECTRIC REVIEW vol.59 no.2 2013
heat recovery boiler began in March 2011, and the installation of a gas turbine, generator and steam tur-bine began in May 2011. These large pieces of equip-ment were loaded into the power plant from a newly constructed loading wharf, carried onto the site via a low-fl oor trailer, and then were installed on the foun-dation inside the turbine building with a power jack.
In the past, a main turbine consisting of a No. 1 gas turbine, generator and steam turbine would be located on the 3rd fl oor of the turbine building, and therefore the building was required to have a height of at least 25 m. At the Yoshinoura power plant, how-ever, the building was planned in consideration of its economic effi ciency and the shaft center of the main generator is positioned at +5.5 m above FL (1st fl oor height) so that the turbine building can have a height of approximately 20 m, which is lower than in the past. Inside the building, machinery, piping and electrical equipment are compactly arranged both vertically and horizontally, and although it was expected that the in-stallation work would become crowded, the processes and work tasks were coordinated, and installation of the Unit No. 1 was completed without accident. Figure 2 shows the installation of the gas turbine on the foun-dation.
In transporting the equipment, it was assumed that typhoons, which are an Okinawa region-specifi c weather condition, would occur frequently. In consid-eration that shipping vessel delivery schedules would be cancelled, so that processes would not be delayed due to the suspension of outdoors work or while wait-ing for the repair of damages due to strong winds, we anticipated the expected path of typhoons on a daily basis, and substituted work processes and processed remaining loads. As a result, the effect on the installa-tion process was minimized, and testing could begin in May 2012.
2.3 Control technology and plant technology
In May 2012, as the initial event in the trial opera-tion of the Unit No. 1, the fi rst fi ring of the gas turbine was carried out. Subsequently, the gas turbine was
operated under no-load conditions and combustion tun-ing was carried out, the exhaust heat recovery boiler was cleaned with hot water and blow-out of the steam piping was carried out. In June 2012, the Unit No. 1, was put into parallel operation*1 (i.e., connected to the power grid) for the fi rst time at 6 MV, and compre-hensive trial operation of the plant was initiated. In the comprehensive trial operation that spanned a six-month period, confi rmation of the static characteristics of each device prior to the load rejection test, and con-fi rmation of the dynamic characteristics of each device after the load rejection test were advanced steadily with the cooperation of the Okinawa Electric Power Company, Incorporated.
The power grid on the Okinawa Main Island is in-dependent of the power grids of the other power com-panies. When this power generating facility, which has capacity equivalent to 20% of the power grid, is connected to the power grid, there was concern over the possibility of a signifi cant adverse effect on power availability on the Okinawa Main Island should a problem occur during testing. For this reason, the 100% load rejection testing was carried out under par-ticularly tense circumstances (see Fig. 3).
In order to limit the effect of fl uctuations in the amount of power supplied during trial operation, i.e., to maintain the balance between supply and de-mand in the power grid, the Okinawa Electric Power Company, Incorporated has made elaborate plans for a supply system that is coordinated with other power plants that are connected to the power grid. At the power plant, after the load rejection, the steam turbine was disengaged via the clutch (a disengageable con-necting device positioned between the turbine and the generator) and stopped, and testing proceeded to the gas turbine no-load independent operation.
Because this power generating facility has a capac-ity equivalent to 20% of the power grid, it also plays
*1: Parallel operation: The connection of a generator to a power transmission system and the start of transmitting power.
Fig.2 Installation of a gas turbine on a foundation.
Fig.3 Central control room during load rejection tests

93Power Plant Technologies for Thermal and Geothermal Power Plants
Issu
e: E
nerg
y C
reat
ion
Tech
nolo
gies-
Pow
er P
lant
s an
d N
ew E
nerg
y
an important role in maintaining the frequency of the power grid. It is important to provide the power gen-erating facility with a load change function capable of responding rapidly to short-duration changes in the electric power demand to stabilize grid frequency. This power generating facility is also provided with an operating function that can incorporate economic dis-patching control (EDC), automatic frequency control (AFC) and governor free (GF)*2 control over the normal range of operation, from minimum load to maximum load. As characteristic functions, in addition to gover-nor free control provided for the gas turbine, governor free control is also provided for the steam turbine to utilize effectively the heat stored in a high-pressure steam drum. As a result, the slight delay of the gas turbine output control due to the fuel control system is supported by the function of the steam turbine, and by adjusting the response performance and the load re-sponse width in the responsivity test, the requirements were satisfi ed.
In plant performance tests conducted in October, it was confi rmed that the effi ciency of at least 51% (HHV basis), which is the highest level for a 1,400 °C gas tur-bine (F class) installed in Japan, is possible. As a re-sult of the combination of a two-stage combustor and a denitration apparatus that are used to realize low NOX emissions in the normal operating load range, NOX
emissions well below 5 ppm (corresponding to 16% oxy-gen) were confi rmed.
A heat run test, which is the last voluntary test be-fore use, was performed from November 26th to 27th in 2012, and successful commercial was started on November 27th.
2.4 Future developments
In this project, for the fi rst time in Japan, a large, industrial-use gas turbine made by Siemens AG was used for the combined-cycle power generation facil-ity. Siemens AG has a track record of delivering gas turbines throughout the world, and Siemens AG’s gas turbines have maintained a share of 40% or more of this market. In addition to their F-class gas turbines which have a successful track record of many deliver-ies, orders for their H-class gas turbines (SGT-8000H) are also brisk.
Fuji Electric intends to build upon its successful record of delivering the Yoshinoura Thermal Power Station and will continue to focus on delivering com-bined-cycle thermal power plants in Japan.
3. Ulubelu Geothermal Power Station
3.1 Overview of Ulubelu Geothermal Power Station project For this project, Sumitomo Corporation (here-
inafter, Sumitomo) was the main contractor, and in
February 2010, orders for 2×55 MW geothermal power block (Portion A), a substation block (Portion B) and a transmission line (Portion C) were received in an EPC contract from PT.PLN (hereinafter, PLN), a state-owned power company in Indonesia. Fuji Electric and a local engineering company, PT. Rekayasa Industri (hereinafter Rekayasa), received sub-contracts from Sumitomo. The main services provided by Fuji Electric, as a technical leader, were in the design, production, procurement and commissioning of main equipment that includes the steam turbine. Rekayasa was responsible for the design, procurement of balance of plant (BOP), construction and installation.
The Indonesian government is promoting a second-phase electricity crush program to solve their domestic power shortage. From 2010 through 2014, approxi-mately 9,500 MW of power will be developed, and of that amount, approximately 4,000 MW will be geother-mal power. The Ulubelu Geothermal Power Station is the fi rst geothermal power plant developed under this program and therefore attracted attention as a model plant.
The plant site is located approximately 100 km west of the provincial city of Bandar Lampung in South Sumatra at an elevation of 780 m above sea level, and requires about 3 hours to be reached by car (see Fig. 4).
The time to completion of the project after the con-tract until delivery was 28 months for the Unit No. 1 and 32 months for the Unit No. 2.
The Ulubelu Geothermal Power Station applies single-fl ash power generation. The water dominant geothermal resource is separated into steam and brine (hot water) by a separator installed at the production well pad. Steam is sent to the power plant and the brine (hot water) is returned to a reinjection well. The steam is controlled to a constant pressure by a vent-ing system provided in the vicinity of the tie-in point to the power plant, and a demister installed at the power plant performs the fi nal moisture removal, and then the steam is fed to the steam turbine to generate power. Figure 5 shows the main power system of the power plant.
*2: GF (governor free) control: Function for varying the load according to system frequency fl uctuations
Ulubelu GeothermalPower Station Lodging Airport
Approximately100 km
Approximately100 km
Bandar Lampung City
Panjan
Fig.4 Construction site of the Ulubelu Geothermal Power Station

94 FUJI ELECTRIC REVIEW vol.59 no.2 2013
inlet steam conditions of 0.76 MPa and 168 °C, the rat-ed output is 55 MW (max. output is 57.75 MW)
The generator has a rated capacity of 68.75 MVA, and because it is used in a geothermal (corrosive) en-vironment, is provided with a 2-pole fully enclosed air-cooling system that implements proven geothermal countermeasures such as a hydrogen sulfi de gas re-moval fi lter system and the like.
The condenser and cooling system consists of a condenser, hot well pump, cooling tower and circula-tion water piping. In consideration of the optimum operating point for the equipment capacity of the sys-tem as a whole, we set a design vacuum rating of 0.01 MPa as the optimum point and designed the various systems. The condenser used has a proven record for geothermal power generation and is a highly-effi cient direct contact condenser.
The gas extraction system that extracts large quantities of noncondensable gas, which is a major feature of geothermal power generation, is a hybrid system that uses a steam ejector and a vacuum pump. An optimum combination of ejector and vacuum pump capacities was designed to realize a highly effi cient system confi guration.
Focusing on the main devices described above, we comprehensively optimized the layout. At the same time, we optimized the size and routing of large diam-eter pipes such as the main steam pipe and the cir-culating water pipe. As a result, plant effi ciency was improved due to the decrease in pipe pressure loss, and the quantity of piping could be reduced.
Additionally, since the construction of Unit No. 1 and No. 2 would be carried out simultaneously for a while, we coordinated with Rekayasa in advance con-cerning the construction procedures for common parts and for mutually interfering parts, and set deadlines for material delivery that also considered partial deliv-eries so that necessary equipment and materials could be delivered to the site in a timely manner. For par-ticularly important items, delivery date management that included checking the delivery progress was car-ried out thoroughly.
During the construction period, there was a rela-tively large amount of rainfall even during the dry season (April to September), and heavy construction machinery will be inoperable due to heavy muddy land condition when it rains. Thus the construction prog-ress was affected considerably by the weather.
Moreover, because the construction work was per-formed in the mountains on the island of Sumatra, it was diffi cult to secure workers or to add additional workers, and so the construction proceeded with lim-ited manpower. Fuji Electric also dispatched advisors to the site, and these advisors proposed effi cient work processes and endeavored to implement process con-trol.
In the future, it is expected that geothermal power plants will increasingly be constructed at locations
The main equipment of the power plant – the steam turbine, the generator and the steam condenser – are made by Fuji Electric. The cooling tower, non-condensable gas extraction system, hot well pump, pip-ing, valves and the like were procured from Japan as well as third countries, while the electrical equipment, FRP pipes, cables and the like were procured from Indonesia.
The geothermal resource supply and reinjection systems were managed separately by PT. Pertamina Geothermal Energy (hereinafter PGE); a steam pur-chase agreement was entered into with PLN, and tie-ins to the steam and reinjected water are in the vicin-ity of the power plant site.
3.2 Plant technology employed at the time of design and
construction For the steam turbine, Fuji Electric’s “GK Series”
steam turbine for geothermal applications was used (see Fig. 6). This is a single cylinder, double fl ow, reac-tion type condensing turbine. A 21.8-inch blade size, which has a proven record of success in geothermal power generation applications, was selected as the size of the fi nal stage low-pressure blades. At the turbine
Steam (from
well-side)
Generator
Recoverywater
G
Demister
Vacuumpump
A system (100%)B system (100%)
Unit No. 1
Auxiliary cooling water pump
Auxiliary cooling waterheat exchanger
Hot well pump
Unit No. 2
Reinjectionpump Cooling
tower
1stejector
Intercondenser
Fig.5 Ulubelu Geothermal Power Station main power system
Fig.6 Steam turbine in installation process

95Power Plant Technologies for Thermal and Geothermal Power Plants
Issu
e: E
nerg
y C
reat
ion
Tech
nolo
gies-
Pow
er P
lant
s an
d N
ew E
nerg
y
nected from the power grid so that it could continue to operate stably as island operation. At such a time, together with the geothermal supply system being operated by PGE, communication is established by exchanging necessary signals such as the signal to transition to independent operation within the plant, and the ability to implement a coordinated following operation, even in the case of abrupt load changes, was confi rmed. In October 2012, the plant was handed over one week before the contractual taking over date. The commercial operation of the Ulubelu Geothermal Power Station has made a signifi cant contribution to the stable power supply of Southern Sumatra (see Fig. 7).
4. Postscript
This paper has discussed plant technology for ther-
mal and geothermal power plants. Gas turbine com-bined cycle power generation and thermal power gen-eration are environmentally-friendly power generation methods that have low CO2 emissions, and technologi-cal improvements and improvement activities will be carried out worldwide in the future.
In the fi eld of gas turbine combined cycle power generation, Fuji Electric will play the role of introduc-ing the latest technology in the world to the domestic Japanese market, and in the fi eld of geothermal power generation, we intend to share the latest optimization technology world-wide.
having even poorer access. Careful consideration of not only the accessibility, but also the ability to secure manpower will be necessary.
3.3 Plant technology during testing
In Southern Sumatra, the largest power plant is the Taharan Thermal Power Plant (2×100 MW) to which Fuji Electric has delivered steam turbine gener-ator equipment, and because the power grid infrastruc-ture is fragile, even after receiving power, the commis-sioning was often affected by power grid trouble from outside the power plant.
After the Unit No. 1 was put into parallel opera-tion for the fi rst time, whenever power grid system trouble occurred, the power plant would be discon-
Fig.7 Panoramic view of Ulubelu Geothermal Power Station

A B S T R A C T
† Power & Social Infrastructure Business Group,Fuji Electric Co., Ltd.
96
1. Introduction In geothermal power generation, a fl uid mixture
(geothermal fl uid) of steam and hot water heated by subterranean heat is extracted through a well (geo-thermal well) dug deep into the earth. The thermal energy of the mixture is then used to generate electric-ity. The amount of thermal energy in the earth is so vast that it could be said to be an inexhaustible sup-ply for humankind. However, the energy that can be utilized is limited to the very small fraction of it that is in the earth's crust close to the surface of the earth. This is what is particularly referred to as geothermal energy. Geothermal energy differs from the generation of electricity by burning fossil fuels in that it is a clean energy that produces almost no CO 2 emissions, which are a cause of global warming. The energy density is high compared with other renewable energy sources such as wind and sunlight, and it also has the charac-teristic that the generation of electricity is stable and unaffected by factors such as the weather.
In 1960, Fuji Electric delivered to Hakone Hotel Kowakien, Fujita Kanko Inc. the fi rst geothermal power generation equipment for practical use in Japan. Since then, Fuji Electric has supplied approximately 60 geothermal turbines to power plants in Japan and other countries and is noted as one of the top manufac-turers in the fi eld globally. This article introduces the anti-corrosion and performance enhancing technolo-gies used in the latest geothermal turbines from Fuji Electric.
MORITA Kohei † SATO Masahiro †
Recent Technology for Improving Corrosion-Resistance and Performance of Geothermal Turbines
Geothermal energy is a clean form of energy that produces almost no CO 2 emissions. Fuji Electric has supplied approximately 60 geothermal turbines to power plants in Japan and other countries. We have developed several technologies for improving corrosion-resistance of geothermal turbines, including shot-peening of turbine blade root and grooves, rotors made from 2% chromium steel and spray-coating technology. In the area of performance-en-hancing technology, together with new-generation, low-pressure turbine blades for geothermal energy production and high-load, high-effi ciency reaction turbines development, we have also achieved the creation of a high-performance, compact exhaust casing through optimized design. Furthermore, through use of triple-fl ash power generation, we have achieved the creation of a geothermal turbine with the greatest output for single-unit capacity in the world.
2. Technologies to Improve Corrosion-Resistance (1)(2)
2.1 Corrosion-resistance evaluation technologies
Large volumes of corrosive impurities are con-tained in the geothermal fl uid. It is therefore essential for designing the geothermal turbines to evaluate the resistance of the materials to corrosion and the stress level at which use is possible. For this reason, in addi-tion to implementing materials testing in a simulated geothermal environment in a laboratory, Fuji Electric installed test equipment at geothermal sites around the world and performed materials tests in the geo-thermal steam and condensates and accumulated data related to corrosion-resistance.
2.2 Measures against stress corrosion cracking and cor-
rosion fatigue In the designing of geothermal turbines, particular
Fig.1 Shot-peening of rotor moving grooves

97Recent Technology for Improving Corrosion-Resistance and Performance of Geothermal Turbines
Issu
e: E
nerg
y C
reat
ion
Tech
nolo
gies-
Pow
er P
lant
s an
d N
ew E
nerg
y
problems arise with the turbine blades root and rotor grooves, which are exposed to high centrifugal force and steam pressure during operation. A technology was developed to improve the corrosion-resistance by performing shot-peening on the parts of the blade root and grooves where the stress is concentrated, and this technology was applied to actual equipment (see Fig. 1). In the results of comparative testing performed in a simulated geothermal environment, it was verifi ed that the shot-peening greatly improved the strength of the components against stress corrosion cracking (SCC) and corrosion fatigue (CF). Figure 2 shows the results of SCC testing.
2.3 Measures against erosion-corrosion
In recent years, progress in exploration techniques and drilling technology for geothermal wells has re-sulted in the development of geothermal resources at comparatively deeper depths. Accordingly, the steam pressure at the inlet of the geothermal turbine has tended to be higher, rising from the conventional value of approximately 1 MPa to a value of approximately 2MPa. With wet steam turbines*1 , increased steam pressure at the inlet results in a greater tendency for erosion corrosion to occur. Erosion corrosion is a deg-radation of material surface due to the combined ef-fects of chemical and mechanical action of the steam fl ow. The stationary blade holders and rotor are made using carbon steel and low alloy steel, and their sur-faces are prone to erosion corrosion. As a measure to erosion corrosion, Fuji Electric developed a rotor with 2% chromium steel, which has greater resistance to erosion corrosion than the 1% chromium steel conven-tionally used as a rotor material.
Technologies were also developed to coat the sur-face of the rotors with a WC-CoCr material using high velocity oxy-fuel (HVOF) spraying (see Fig. 3).
2.4 Countermeasures to erosion
Erosion caused by the impact of water droplets (drain attack) is the same phenomenon as in ther-mal power turbines. In geothermal power generation plants, where there is more hot water than steam, all stages are operated in wet steam, so it is necessary to consider drain attack and erosion in the design pro-cess. In addition to adding drain pockets to remove the water droplets that cause the erosion, protective mea-sures are taken with the brazing of an erosion shield onto the leading edge of the moving blades (see Fig. 4).
2.5 Scale countermeasures
Silica, calcium carbonate and other substances contained in geothermal steam are deposited on the surface of components such as the blades, casing and rotor. Those impurities accumulate and become scale.
*1: Wet steam turbine: This refers to turbines where the main steam is saturated or nearly-saturated. They are also called saturated steam turbines.
0.001 0.01 0.1 1.0
1.0
0.5
0
Str
ess
(rel
ativ
e va
lue)
Fracture time (relative value)
13% Cr steel13% Cr steel (with shot-peening processing)16% Cr 4% Ni steel16% Cr 4% Ni steel (with shot-peening processing)
Not fractured
No shot-peening With shot-peening
Fig.2 Improved proof stress through shot-peening(Results of stress corrosion cracking tests)
Fig.3 Coating with high velocity oxy-fuel spraying
Rotor
Drain pocket
To steamcondenser
Trajectories of water droplets
Stationary blade
Moving blade
Erosion shields
To steam condenser
Fig.4 Drain removal structure
98 FUJI ELECTRIC REVIEW vol.59 no.2 2013
The scale that builds up on the surface of the blades narrows the passage for the steam and causes a fall in output. Furthermore, the scale that builds up in the gaps between the rotating parts and the static parts becomes a cause of abrasion on the components. Fuji Electric has developed blade washing technology with water droplets sprayed at the inlet of the turbine as a countermeasure to scale.
3. Technologies to Enhance the Performance of
Geothermal Turbines (1)
3.1 New-generation, low-pressure turbine blades for geo-
thermal use Low-pressure blades (for the last 2 to 3 stages)
have long blade lengths and are also used in wet steam, so they need to be resistant to excessive stress and erosion. A great deal of time and effort is there-fore required in their development. For this reason, a range of products have been prepared as a low pres-sure blade series and makes it possible to select the op-timal low-pressure blade design for a particular plant.
The new-generation, low-pressure turbine blades for geothermal use are based on a wealth of experience in geothermal turbine operation and are highly reli-able. As geothermal turbines are used in a corrosive atmosphere, it is essential that special consideration is given in their design to matters such as stress cor-rosion cracking and corrosion fatigue. For this reason, in the development of the new series, by advancing the development based on established conventional devel-opment methods and adding three-dimensional viscous fl ow analysis and FEM analysis for the high-level op-timization of the profi le, we have achieved great im-provements in effi ciency compared with conventional models while securing reliability.
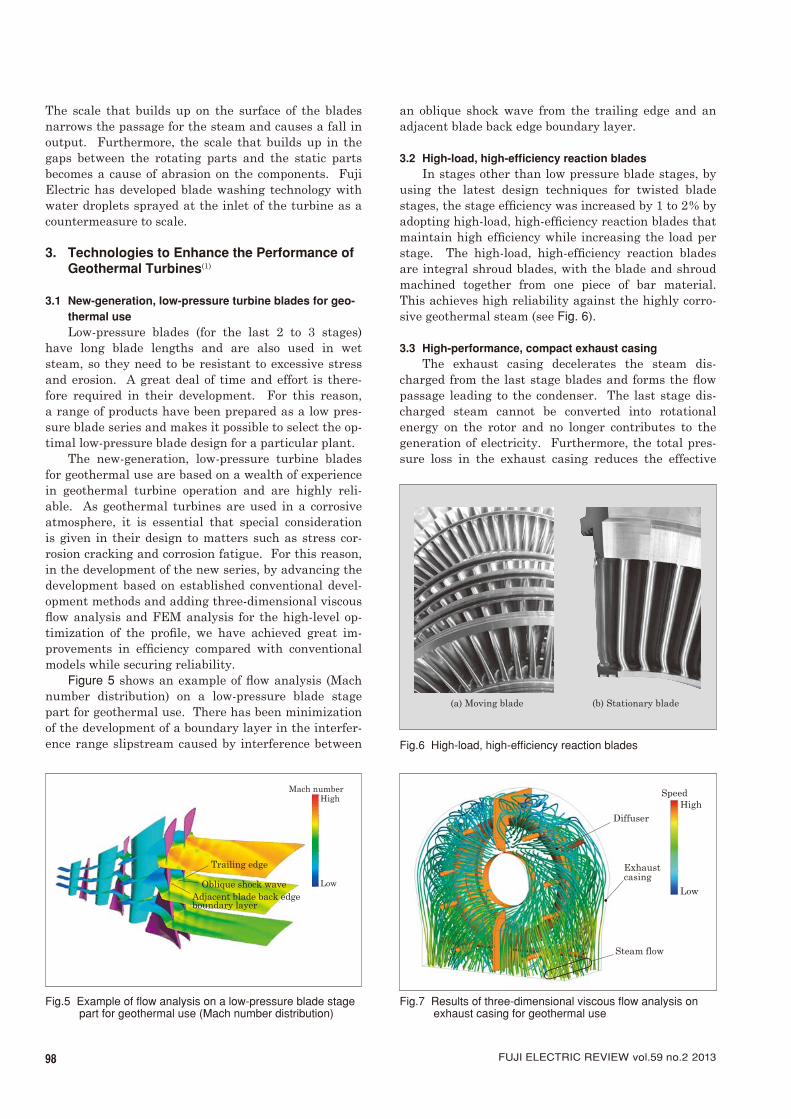
Figure 5 shows an example of fl ow analysis (Mach number distribution) on a low-pressure blade stage part for geothermal use. There has been minimization of the development of a boundary layer in the interfer-ence range slipstream caused by interference between
an oblique shock wave from the trailing edge and an adjacent blade back edge boundary layer.
3.2 High-load, high-effi ciency reaction blades
In stages other than low pressure blade stages, by using the latest design techniques for twisted blade stages, the stage effi ciency was increased by 1 to 2% by adopting high-load, high-effi ciency reaction blades that maintain high effi ciency while increasing the load per stage. The high-load, high-effi ciency reaction blades are integral shroud blades, with the blade and shroud machined together from one piece of bar material. This achieves high reliability against the highly corro-sive geothermal steam (see Fig. 6).
3.3 High-performance, compact exhaust casing
The exhaust casing decelerates the steam dis-charged from the last stage blades and forms the fl ow passage leading to the condenser. The last stage dis-charged steam cannot be converted into rotational energy on the rotor and no longer contributes to the generation of electricity. Furthermore, the total pres-sure loss in the exhaust casing reduces the effective
High
Trailing edge
Oblique shock waveAdjacent blade back edgeboundary layer
Mach number
Low
Fig.5 Example of fl ow analysis on a low-pressure blade stage part for geothermal use (Mach number distribution)
(a) Moving blade (b) Stationary blade
Fig.6 High-load, high-effi ciency reaction blades
SpeedHigh
Diffuser
Exhaustcasing
Steam flow
Low
Fig.7 Results of three-dimensional viscous fl ow analysis on exhaust casing for geothermal use

99Recent Technology for Improving Corrosion-Resistance and Performance of Geothermal Turbines
Issu
e: E
nerg
y C
reat
ion
Tech
nolo
gies-
Pow
er P
lant
s an
d N
ew E
nerg
y
NAP geothermal power station. Figure 10 shows the geothermal turbine rotor installed and Fig. 11 shows the external appearance of the geothermal turbine for the NAP geothermal power station.
While most geothermal power generation plants use either single-fl ash power generation or double-fl ash power generation, the NAP geothermal power station uses triple-fl ash power generation. After some hot water vaporizes in the fi rst fl ash tank, the re-maining heated fl uid is fl ashed further in 2 additional tanks and the resulting steam is introduced into the intermediate pressure and low pressure sections of the turbine. This makes it possible to maximize the use of the geothermal energy and the maximum output of 140 MW is achieved, which is the greatest output for single-unit capacity geothermal power generation equipment in the world. Fuji Electric received many prizes for the development of this equipment, including the 59th Electrical Science and Engineering Promotion Award and the Low CO 2 Kawasaki Brand 2012 grand prize.
heat drop on the turbine stage, so the result is that the performance of the turbine is reduced.
In general, if the exhaust casing is made more compact, then the reduction in the passage cross sec-tion increases the speed of the steam fl ow, which is dis-advantageous for the performance. Fuji Electric has therefore optimized the profi les of the exhaust casing and the diffuser using three-dimensional viscous fl ow analysis. This results in a diffuser profi le that has a deceleration effect greater than conventional models. By increasing the effective heat drop on the stage and reducing the total pressure loss after the diffuser out-fl ow, a more effi cient and compact exhaust casing was achieved (see Fig. 7).
4. Characteristics of the Latest Geothermal
Turbines The geothermal turbine for the Nga Awa Purua
(NAP) Geothermal Power Station in New Zealand, which began operations in 2008 (see Fig. 8), uses a 798mm blade at the fi nal stage, the biggest in the world for geothermal power generation use. Figure 9 shows a cross section diagram of the geothermal turbine for the
Fig.8 Overview of the Nga Awa Purua Geothermal Power Station
DiffuserExhaust casing
Fig.9 Cross section diagram of the geothermal turbine for the NAP geothermal power station
Fig.10 Geothermal turbine rotor installed
Fig.11 External appearance of the geothermal turbine for the NAP geothermal power station

100 FUJI ELECTRIC REVIEW vol.59 no.2 2013
Reference (1) Sakai, Y. et al. The Latest Geothermal Steam
Turbines. FUJI ELECTRIC REVIEW. 2009, vol.55, no.3, p.87-92.
(2) Nakamura, K. et al. Recent Technologies for Steam Turbines. FUJI ELECTRIC REVIEW. 2010, vol.56, no.4, p.123-128.
5. Postscript
Geothermal power generation does not consume
fossil fuels and is a clean form of power generation that generates almost no CO 2 . It is expected that geother-mal power generation will develop even further, and Fuji Electric will work as a top manufacturer of geo-thermal power generation equipment to improve the reliability and performance of geothermal turbines.
We will steadily promote our products development so that we can continue to supply high performance geothermal turbines that are easy to use.

Issu
e: E
nerg
y C
reat
ion
Tech
nolo
gies-
Pow
er P
lant
s an
d N
ew E
nerg
y
A B S T R A C T
† Power & Social Infrastructure Business Group,Fuji Electric Co., Ltd.
‡ Corporate R&D Headquarters, Fuji Electric Co., Ltd.
1. Introduction In geothermal power generation, a geothermal
fl uid containing steam and hot water is extracted from underground and used to generate electricity. This fl uid is at a high temperature and high pressure under the ground, many components are, therefore, dissolved in the geothermal fl uid, and these components can cause corrosion and scaling on the power generation facilities. In particular, there is a tendency for silica precipitation and scaling to occur when the heat is re-covered from the geothermal fl uid and the temperature of the fl uid falls. The expense of measures to this scal-ing has a great effect on the economic effi ciency of geo-thermal power generation.
Fuji Electric has worked with the objective of the effi cient extraction and utilization of heat from the geo-thermal fl uid to develop measures technologies for the silica scaling that becomes an issue for it. This article particularly introduces the technologies to evaluate the rate of silica scaling and technologies to inhibit and dissolve the silica scale in geothermal hot water binary power-generating systems.
2. Geothermal Hot Water Binary Power-
Generating Systems The methods of geothermal power generation can
be broadly categorized into the fl ash type and the bina-ry type. The fl ash method uses a separator to separate off just the steam from the mixed fl uid of geothermal steam and hot water, which is taken from underground from a well (production well). This steam is then sent
KAWAHARA Yoshitaka † SHIBATA Hiroaki † KUBOTA Kokan ‡
Technology to Counter Silica Scaling in Binary Power-Generating System Using Geothermal Hot Water
A geothermal hot water binary power-generating system that uses reinjection hot water from a fl ash geothermal power-generating system as the heat source is able to draw heat from geothermal fl uid effi ciently, achieving high eco-nomic effi ciency. However, there are concerns that cooling of thermal water causes silica scaling to adhere to power-plant equipment and wells. Field tests at the steam production well pad in the Kakkonda Geothermal Power Plant of Tohoku Hydropower & Geothermal Energy Co., Inc. have proven that in thermal water with low silica concentration the speed of silica scaling is not affected by water temperature, because the silica polymerization reaction is halted; thus, practical use of the system is just in sight. Field tests have also proved that intermittent alkaline injection can help to prevent and/or dissolve silica deposits.
101
to the steam turbine to generate electricity. The bina-ry method uses the geothermal fl uid as a heat source. Heat is exchanged with a medium that has a lower boiling point than water, and then the vaporized me-dium is sent to the turbines to generate the electricity.
High temperature and high pressure geothermal steam are required for the fl ash method of geothermal power generation, in which Fuji Electric has accumu-lated great experience so far, and one issue has been the securing of the geothermal resources suffi cient for power generation.
Figure 1 shows the concept of the scope of the geo-thermal power generation systems for different geo-thermal fl uid temperatures and outputs. The fl ash method is used when the geothermal fl uid temperature is high and the output is large, and the binary method is used when the temperature is low and the output is small.
OutputLargeSmall
High
Low
Geo
ther
mal
flu
id t
empe
ratu
re
Binary method
* RPS Act: “Act on Special Measures Concerning New Energy Use by operators of electric utilities”
Vapor driving turbine: Low boiling point mediumSingle unit capacity: Several 100 kW to several 1,000 kWCharacteristics: RPS Act* is applicable. Suitable for the effective use of low temperature energy.
Flash method(Conventional system)
Vapor driving turbine: Geothermal steamSingle unit capacity: From several 1,000 kWCharacteristics: More efficient than binary method.
Fig.1 Scope of geothermal power generation systems

102 FUJI ELECTRIC REVIEW vol.59 no.2 2013
In order to expand its range of geothermal power generation systems, Fuji Electric has performed de-velopment work for the commercialization of binary power-generating systems. (1) Verifi cation testing of a binary power-generating system using geothermal steam with a rated output of 150 kW and a maximum output of 220 kW was carried out between August 2006 and October 2009 with the cooperation of the Daiwabo Kanko Co., Ltd. Kirishima Kokusai Hotel in Kirishima City, Kagoshima Prefecture. The continuous opera-tion was achieved according to the plan. The results of the verifi cation testing were then incorporated and the commercialization was completed.
One of the issues for geothermal power generation is the securing of geothermal heat sources. To extract the geothermal fl uid that becomes the heat source for geothermal power generation from underground, it is necessary to target a location that has high tempera-ture and high-pressure water in what is called a res-ervoir, and to drill a production well. If the geother-mal fl uid that can be taken from the production well is insuffi cient, or if the amount of heat or fl ow of the geothermal fl uid declines, then it becomes necessary to add another production well. The heat of the earth is generally thought to be an inexhaustible source of heat, but from the point of view of economic effi ciency, it is necessary to regard the geothermal fl uid as a lim-ited resource.
Fuji Electric is promoting geothermal hot water binary power-generating systems for the effi cient gen-eration of electricity using geothermal fl uid. This is the additional installation to existing fl ash type geo-thermal power generation systems of a binary power-generating system that uses reinjection hot water as a heat source. It is therefore called hybrid geothermal power generation. Up until now, the reinjection hot water that remained after the separation of the steam from the geothermal fl uid was returned to the well (reinjection well) while still at a high temperature but unused. This system uses that water as a heat source. Figure 2 shows a conceptual diagram of geothermal hot water binary power-generating systems.
Geothermal hot water binary power-generating
systems are highly economical because they utilize the infrastructure of the existing fl ash type geothermal power generation system, for example, the site, person-nel and power transmission lines. Furthermore, as it is not necessary to drill a new production well, there is low business-related risk that the drilling will fail. However, recovering heat from the reinjection hot wa-ter and lowering the temperature of the reinjection hot water often results in silica scaling and measures to this silica scaling are an issue for consideration. Silica sometimes attaches to the pipes and valves above the ground, but it causes the greatest problems when it at-taches inside the reinjection well and in the geological strata around it, and in some cases the reinjection well can become blocked. If this occurs, then it becomes necessary to dredge the well or to drill a new one, which harms the business.
Fuji Electric considers the problem of silica scal-ing to be a large risk when using geothermal hot water binary power-generating systems, and has worked to develop technologies for silica scaling measures, in par-ticular technologies to evaluate the speed of scale build up and technologies to inhibit and dissolve the scale.
This development work was carried out with the cooperation of the Tohoku Hydropower & Geothermal Energy Co., Inc. as one part of the feasibility study (FS) carried out for a geothermal hot water binary power-generating system at the steam production well pad in the Kakkonda Geothermal Power Plant. It was joint research with the Tohoku Hydropower & Geothermal Energy Co., Inc., JMC Geothermal Engineering Co., Ltd. and Kyushu University.
3. Technologies to Evaluate the Rate of Silica
Scaling Since the geothermal fl uid exists underground in
a high temperature and high-pressure state, it dis-solves many components. The concentration of the fl uid and a drop in temperature occurs when it is taken out of the ground, when it is depressurized and fl ashed (evaporated) above the ground and when the heat is re-covered from the hot water. At this time, silica compo-nents in particular reach a concentration above the sol-ubility for amorphous silica, meaning that they reach a supersaturated state, and the more the concentration progresses, and the lower the temperature falls, the more the risk of silica precipitation increases. It is necessary to perform quantitative evaluations before the additional installation of a geothermal hot water binary power-generating system to evaluate whether the installation will aggravate the rate at which the reinjection well becomes blocked and whether that rate is at an acceptable level.
3.1 Mechanism of silica scaling (1) Characteristics of amorphous silica
When silica precipitates from geothermal hot wa-
Flash method Binary method
Separator
Turbine
Productionwell
Reinjectionwell
Use of reinjection hot water
(Additional installation)
Turbine
Pump
Heatexchanger
Fig.2 Conceptual diagram of geothermal hot water binary power-generating systems

103Technology to Counter Silica Scaling in Binary Power-Generating System Using Geothermal Hot Water
Issu
e: E
nerg
y C
reat
ion
Tech
nolo
gies-
Pow
er P
lant
s an
d N
ew E
nerg
y
ter, it precipitates in an amorphous state. Amorphous silica grows and precipitates in a polymerization reac-tion in the silica supersaturation. Therefore, the silica polymerization reaction rate V is the major factor de-termining the rate of silica precipitation.
The silica polymerization reaction rate V can be simplifi ed and expressed as in Formula (1). The rate increases when the reaction rate constant K increases and when the amorphous silica solubility C e decreases.
V=K (C-Ce)n ........................................................... (1) V : Silica polymerization reaction rate K : Reaction rate constant C : Silica concentration C e : Amorphous silica solubility n : Constant ( n >0)
K and C e increase with higher temperatures and with higher pH values. Therefore, the relationship is such that V will have a maximum value for some value of temperature and pH. In typical geothermal hot wa-ter, the V increases the lower the temperature falls and the higher the pH becomes.
For this reason, the measures generally taken to prevent silica scaling include to prevent the falling of the reinjection temperature and to add sulfuric acid to lower the pH. (2) Mechanism of silica scaling at geothermal power
plants It is common for the formation of silica scale to be
discussed only in terms of the rate of the polymeriza-tion reaction. However, when considering the forma-tion of silica scale within a geothermal power plant, it is necessary to consider the form of the silica at each position in the power plant.
It is often the case that the reinjection well is drilled at a location away from the production well so that the reinjection hot water does not affect the res-ervoir. It is therefore not unusual for it to take sev-eral hours for the hot water to fl ow from the production well to the reinjection well. It is necessary to evaluate the rate of silica scaling in the reinjection well through comprehensive consideration of issues such as how far the polymerization reaction is progressing, how much precipitation as particles there is and whether or not the silica polymerization reaction is progressing in the hot water.
3.2 Method for evaluating the rate of silica scaling
Silica scaling becomes a problem in the reinjection well and particularly in the geological reservoir around the reinjection well. For this reason, reservoir simula-tion for silica scaling testing equipment was developed to evaluate the rate of blocking at these points before-hand.
Figure 3 shows the conceptual diagram of the test-ing equipment and Fig. 4 shows the external appear-ance of the testing equipment.
The reservoir simulation testing equipment is in-
stalled inside a geothermal plant and evaluates the changes in the rate of reinjection well blocking that result from a fall in the hot water temperature. Table 1 shows the correspondence between binary power generation facilities and reservoir simulation testing equipment.
The evaluation of the rate of blocking is performed by monitoring the pressure difference between the entrance to the porous material column and the vari-ous points inside the porous material. In addition, the concentration of silica at various positions inside the retention piping is measured to evaluate the rate of silica concentration decline and therefore the rate of the silica polymerization reaction.
Chemical injection
Hot water
Reinjection line
Separator
Productionwell
Reinjection hot water channel
Reinjectionwell
Test equipment
Heat exchanger
Heat exchanger
Retention pipingRetention time:
1 h
DP Differential pressure gauge
Simulation Simulation
Porous material column
Simulation
Fig.3 Conceptual diagram of reservoir simulation testing equipment
Porous material column
Zirconia beads(diameter 2 mm)
Fig.4 External appearance of the reservoir simulation testing equipment
Table 1 Correspondence between binary power generation facilities and reservoir simulation testing equipment
Binary power generation facilities Reservoir simulation test-ing equipment
Heat exchanger Heat exchanger
Reinjection hot water channel from location of binary power
generation facilities to reservoir near to the reinjection well
Retention piping
Reservoir near to reinjection well Porous material column fi lled with ceramic beads

104 FUJI ELECTRIC REVIEW vol.59 no.2 2013
3.3 Feasibility study at the steam production well pad in
the Kakkonda Geothermal Power Plant Between July and September, 2011, a FS was
implemented for the assessment in advance of the rate of silica scaling that would result if geothermal hot water binary power-generating system facilities were installed at the steam production well pad in the Kakkonda Geothermal Power Plant of Tohoku Hydropower & Geothermal Energy Co., Inc. (2)
The water planned to be used in the geothermal hot water binary power-generating system was used to evaluate the rate of silica scaling using reservoir simu-lation testing equipment. The hot water temperatures used were 120 ° C and 95 ° C, and the total silica concen-tration was 435 ppm. It was confi rmed that the silica polymerization did not progress when the water was maintained at 120 ° C and 95 ° C for 1 hour. In other words, it can be said that during this 1 hour, there is no formation of silica particles and no growth of the silica particles that have already formed. This 1 hour simulates the time required for the hot water to fl ow from the location of the reservoir simulation testing, which is the planned location of the binary power gen-eration facilities, to the geological reservoir around the reinjection well.
The following knowledge about the rate of silica scaling was obtained over the three weeks of reservoir simulation testing.
(a) It is scale in the form of particle aggregation that contributes to the blocking of the reservoir,
and the rate of scaling is not dependent on tem-perature.
(b) It is thought that the reason why the rate of silica scaling is not dependent on temperature is that the main mechanism of the scaling is par-ticle deposition.
(c) The injection of sulfuric acid is generally done to slow the rate of silica polymerization, but it is also thought that it is effective in preventing the attachment of particles.
The test results and the basis for these fi ndings were as shown below. (1) Temperature dependence of the rate of scaling
Figure 5 shows the amount of silica attachment to the porous material column after the completion of the three-week long testing. It can be seen that there was
Distance from the inlet of the porous material column inlet (mm)
0 100 300 400 500 600 700200 800
Am
oun
t of
sca
le a
dhes
ion
per
un
it m
ass
of b
eads
0
0.004
0.003
0.002
0.001
No injection of sulfuric acid (pH 8.1)
After binary installation (95°C)
Before binary installation (120°C)
After binary installation (95°C)
Before binary installation (120°C)
With injection of sulfuric acid (pH 4.9)
Fig.5 Results of reservoir simulation testing
(a) A film of scale deposited throughout the column
(b) Scale in the form of particle aggregation deposited at the entrance to the column
Fig.6 Electron microscope images of the scaling on the beads

105Technology to Counter Silica Scaling in Binary Power-Generating System Using Geothermal Hot Water
Issu
e: E
nerg
y C
reat
ion
Tech
nolo
gies-
Pow
er P
lant
s an
d N
ew E
nerg
y
no difference in the amount of scale adhesion before and after the hot water temperature reduction (120 ° C and 95 ° C) in either of the conditions, namely without the injection of sulfuric acid or with it.
Meanwhile, in the conditions of no injection of sulfuric acid, there was increased scaling near the entrance to the column. Figure 6 shows electron mi-croscope images of the scaling in the porous material column. A fi lm of scale was observed on the surface of the beads throughout the entire porous material col-umn. At the inlet to the column, particle aggregation was observed on the surface of the beads. It is thought that the amount of scale deposition is greater at the entrance to the column because the particles in the hot water aggregate together at the entrance to the column and attach to the beads. Furthermore, in the results of the measurement of the water permeability of the porous material column, it was found that the water permeability is mostly reduced around the inlet of the column. It can be said that it is scale in the form of particle aggregation that contributes to the blocking of the reservoir and that the rate of scaling is not depen-dent on temperature. (2) Mechanism of scaling
As there is no progression of silica polymeriza-tion in the hot water, it is thought that the particles that attached at the entrance to the column were par-ticles that had been formed due to causes other than silica polymerization, for example, particles that were formed in localized concentration of the hot water dur-ing the fl ashing, or particles that came from the pro-duction well. It is believed that the rate of scaling was not dependent on the temperature of the hot water because the main factor in the scaling was that these particles attached near the entrance to the column. (3) Effect of sulfuric acid injection
As shown in Fig. 5, the injection of sulfuric acid greatly reduced the rate of scaling. The injection of sulfuric acid is generally done to slow the rate of silica polymerization, but it is also thought that it is effective in preventing the attachment of particles.
3.4 Possibility of reinjection hot water
The results of the FS at the steam production well pad in the Kakkonda Geothermal Power Plant showed that the rate of the blocking of the geological reser-voir is not dependent on temperature. In other words, they show that silica scaling would not become a major problem if a geothermal hot water binary power-gener-ating system is installed. The reinjection hot water for which a geothermal hot water binary power-generating system is used is often hot water that has a low con-centration of silica originally, and thus it is often the same conditions as at the steam production well pad in the Kakkonda Geothermal Power Plant. In other words, it is often the case that the silica polymeriza-tion stops. Therefore, these results are thought to be relevant generally when geothermal hot water binary
power-generating systems are to be used. Up until now, it has been thought that reducing
the temperature of the reinjection hot water would in-crease the speed of the blocking of the reinjection well. However, it was clarifi ed that within the range of tem-peratures where the silica polymerization is stopped, if the main mechanism of scaling is the attachment of particles, then there is no change in the rate of the blocking.
4. Technologies to Inhibit and Dissolve Silica
Scale Depending on the nature of the reinjection hot wa-
ter, it is also conceivable that there may be cases when the rate of blocking of the reinjection well will be ag-gravated by the use of a geothermal hot water binary power-generating system. Technologies to inhibit and dissolve the silica scale were therefore developed using new methods (3) and verifi ed using reservoir simulation testing equipment.
As described in Chapter 3, it is often the case that sulfuric acid is added to the hot water to inhibit the silica scaling. However, there is concern about the cor-rosion of piping due to this sulfuric acid injection, the amount that can be injected is, therefore, restricted and the effectiveness in inhibiting scaling is limited.
There have also been other attempts to inhibit the silica scaling through methods such as the retention tank method, where the hot water is retained for a cer-tain amount of time to encourage silica particle growth and lower the adhesiveness of the silica particles. Other methods tried include the injection of a scale inhibitor and the removal of the silica from the hot wa-ter. However, these methods cannot be described as generally established technologies due to reasons such as that they are uneconomical or have limited effects depending on the hot water properties.
Fuji Electric therefore focused on the method of alkali injection to inhibit and dissolve the silica scale, which uses the fact that the solubility of silica rises with higher pH levels. This alkali injection has al-ready been considered at some institutions, but has not been put into practical use for mostly the following reasons.
(a) Metal components such as calcium combine with the silica and form scale other than amorphous silica.
(b) The cost of the alkali agent is higher than that of sulfuric acid.
Solutions to these issues were attempted with the following measures and development work was per-formed to make practical use possible.
(a) Use together with an agent to mask the metal components such as calcium.
(b) Intermittent injection of the agent to reduce the amount used.
Figure 7 shows the scale inhibition results when

106 FUJI ELECTRIC REVIEW vol.59 no.2 2013
the alkali injection method is used. If just an alkali agent is injected, then the amount of scaling is greater than when nothing is injected. However, the scaling is suppressed by using an agent to mask the metal com-ponents.
Figure 8 shows the changes over time in the pres-sure differences inside the porous material column when an agent (alkali agent and metal component masking agent) is injected intermittently on reservoir simulation testing equipment. By performing the in-termittent injection of the alkali agent (the periods (1), (2) and (3) on the diagram), the pressure differences
return to those before the scaling, meaning that the scaling that has attached is dissolved and the water permeability recovers.
5. Postscript
This article discussed measures to silica scaling,
which was a major issue for the use of geothermal hot water binary power-generating systems.
Technologies were established to evaluate the rate of silica scaling and to inhibit and dissolve the silica scale and it is believed that the practical use of geo-thermal hot water binary power-generating systems is now in sight. Fuji Electric will continue development centered on these technologies for the establishment of measures to silica scaling in geothermal hot water binary power-generating systems and further geother-mal power generation in general and will contribute to the effective use of geothermal resources.
This development was made possible by the co-operation of the Tohoku Hydropower & Geothermal Energy Co., Inc., for example, in the provision of the fi eld. In addition, this research was performed jointly with Tohoku Hydropower & Geothermal Energy Co., Inc., GMC Geothermal Engineering Co., Ltd., Professor Itoi of the Graduate School of Engineering, Kyushu University and Professor Yokoyama of the Graduate School of Sciences, Kyushu University. We received much valuable advice from them. We would like to ex-press our gratitude here.
Reference (1) Yamada, S. et al. Fuji Electric’s Recent Activities and
Latest Technologies for Geothermal Power Generation. FUJI ELECTRIC REVIEW. 2010, vol.56, no.4, p.118-122.
(2) Kawahara, Y. et al. Laboratory Experiments on Prevention and Dissolution of Silica Deposits in a Porous Column (1): Solid Deposition due to Silica Particle Aggregation and Inhibition by Acid Dosing. Geothermal Resources Council Transactions. 2012, vol. 36, p.867-870.
(3) Fukuda, D. et al. Laboratory Experiments on Inhibition of Silica Particulate Deposition in a Porous Column by Dosing of Chemical Reagents into Reinjection Water (2): Prevention and Dissolution of Silica Deposits by Alkali Dosing. Geothermal Resources Council Transactions. 2012, vol. 36, p.851-854.
Left: Injection of alkali agent onlyCenter: Joint use of alkali agent and agent to mask calciumRight: No agent injection
Fig.7 Results in silica scaling inhibition with the alkali injection method
Time elapsed (h)
0 400 600 800200
Pre
ssu
re d
iffe
ren
ce (
kPa)
Rat
e of
age
nt
inje
ctio
n (
ml/m
in)
0
15
10
0
30
20
15
25
5
105 (3)(2)(1)
Fig.8 Changes in pressure differences inside the porous mate-rial column due to intermittent injection

Issu
e: E
nerg
y C
reat
ion
Tech
nolo
gies-
Pow
er P
lant
s an
d N
ew E
nerg
y
A B S T R A C T
† Power & Social Infrastructure Business Group,Fuji Electric Co., Ltd.
1. Introduction
Combined cycle power plants (CCPP) that use a gas and steam turbine in combination have been used increasingly in recent years in order to increase economic effi ciency at power plants and in response to societal needs for reducing the emissions of green-house gases. Compared to conventional thermal power plants that combust fossil fuels in a boiler, CCPPs are more effi cient, and because they use natural gas as fuel, have lower CO 2 emissions, and the combination of a gas turbine with a small steam turbine enables rapid start up and provides a high level of operability.
The Yoshinoura Thermal Power Station of the Okinawa Electric Power Company, Incorporated, which began operation in November 2012, is a 1-on-1 type CCPP in which the gas turbine, generator and steam turbine are arranged on a single shaft, and uses a single-cylinder reheat steam turbines with axial-fl ow exhaust (91 MW).
The Oman-SUR CCPP, shipped by Daewoo E&C in January 2013, is a 2-on-1 type CCPP confi gured from 2 sets of gas turbines and generators, and 1 set of a steam turbine and a generator, and uses a two-cylinder reheat steam turbines with dual-sided exhaust (330 MW).
This paper outlines the characteristics of the steam turbines for these two CCPPs, and also describes Fuji Electric’s latest technology for steam turbines.
2. Steam Turbine for the Yoshinoura Thermal
Power Station This facility is a single-shaft type combined cy-
IZUMI Sakae † MORIYAMA Takashi † IKEDA Makoto †
Latest Steam Turbine Technologies for Thermal Power Plants
With features such as high power-generating effi ciency and low CO2 emission, combined-cycle power genera-tion, combined with gas turbine and steam turbine, is gaining wider use. For the Yoshinoura Thermal Power Station of the Okinawa Electric Power Company, Incorporated, which is a combined-cycle power generating facility, we sup-plied single-cylinder reheat steam turbines with axial-fl ow exhaust that feature a clutch between the generator and the steam turbine. Also, for SUR power plant in Oman, we supplied two-cylinder reheat steam turbines with dual-sided exhaust that feature exhaust directions are left and right.
As the latest technologies in steam turbines for thermal power plants, we are developing welding technology, USC turbine technologies and technologies to improve reliability of low-pressure blades.
107
cle power generating facility, and is the fi rst facil-ity in which the Okinawa Electric Power Company, Incorporated used LNG as fuel. Installation of the Unit No. 1 exhaust heat recovery boiler began in April 2011, and installation of the gas turbine unit began in July of the same year. The Unit No. 1 began trial op-eration in May 2012, and then started commercial op-eration in November 2012. In addition, the Unit No. 2 began commercial operation in May 2013. Features of the steam turbine used are listed below.
(a) To support a single-shaft type combined cycle system, a clutch for engaging and disengaging with the gas turbine and generator is provided at the end of the steam turbine rotor.
(b) The steam turbine is a compact-size, high, intermediate and low-pressure integrated-type turbine in which high, intermediate and low-pressure turbines are consolidated into a single casing. Figure 1 shows the external view of the
Fig.1 Steam turbine for Yoshinoura Thermal Power Station

108 FUJI ELECTRIC REVIEW vol.59 no.2 2013
stream turbine for the Yoshinoura Thermal Power Station.
2.1 Use of a clutch
In the single-shaft type combined cycle system used at the Yoshinoura Thermal Power Station, the gas turbine, generator and steam turbine rotor are aligned in tandem. Compared to a multi-shaft system in which the gas turbine and the steam turbine each have their own generator, a single-shaft type com-bined cycle system enables the power plant building to be made much smaller in size. Figure 2 shows the single-shaft and multi-shaft confi gurations. With a single-shaft system, the gas turbine and steam turbine are aligned in tandem, with a generator positioned be-tween them.
With combined cycle power generation, the ex-haust heat from the gas turbine is used to supply steam to the steam turbine, and therefore the start timings of the gas turbine and steam turbine are dif-ferent. For this reason, a clutch is used that can tem-porarily engage and disengage the steam turbine.
First, with the clutch in the disengaged state, the gas turbine and generator are started, and at the stage when the steam is ready to be supplied to the steam turbine, the steam turbine valve opens and the steam turbine begins to speed up. Then, after the rotational speed of the steam turbine rotor reaches its rated speed and at the stage when it exceeds the rotational speed of the gas turbine rotor, i.e., when the torque from the steam turbine toward the generator becomes positive, the clutch engages mechanically and the torque from the steam turbine is transmitted to the generator.
Figure 3 shows the clutch structure. The clutch lubricating oil is supplied from the bearings located at both sides of the clutch. The clutch is kept constantly lubricated so that it may be engaged at any time. The lubricating oil also functions as a damper that absorbs mechanical shocks at the time when the clutch engag-es. As a result of the viscosity of the oil in the interior of the clutch, even before opening the valve prior to starting the steam turbine, the rotation of the gas tur-
bine will cause the steam turbine to speed up to about 400 rpm.
2.2 High and intermediate pressure integrated-type tur-
bine Figure 4 is a cross-sectional view and Fig. 5 is
a bird’s-eye view of the steam turbine used at the Yoshinoura Thermal Power Station.
The turbine is composed of a high-pressure section, an intermediate-pressure section and a low-pressure section. The main steam, at high temperature and pressure, fl ows into the high-pressure section of the casing via a main steam valve located on the top of the casing, and the steam, after expanding and complet-ing its work, is discharged through a cold reheat steam pipe. The reheated steam is directed back to the tur-bine via a reheat steam valve located in the middle of the casing. Then, after the steam completes its work at the intermediate-pressure section, it is additionally mixed with the low-temperature steam that has been
GT
GT: Gas turbineST: Steam turbine
Generator
(a) Single-shaft CCPP
(b) Multi-shaft CCPP
STGenerator
Clutch
STGenerator
GT
Fig.2 Single-shaft and multi-shaft CCPP confi gurations
ST rotorGenerator rotor
Oil suppliedfrom ST side
Oil suppliedfromgeneratorside
Clutch(ST rotor side)
Clutch(movable part)
Clutch(generator side)
ST: Steam turbineFlow oflubricating oil Oil reservoir
Area completelysoaked by oil reservoir
Fig.3 Clutch structure
High-pressuresection
Low-pressure steam
Intermediate-pressuresection
Low-pressuresection
Reheat steam inletMain steam valve
Cold reheat steam pipe
Steam flow
Fig.4 Cross-section of steam turbine for Yoshinoura Thermal Power Station

109Latest Steam Turbine Technologies for Thermal Power Plants
Issu
e: E
nerg
y C
reat
ion
Tech
nolo
gies-
Pow
er P
lant
s an
d N
ew E
nerg
y
supplied to the casing, directed to the low-temperature section and discharged in the turbine axial direction to reach the condenser.
So that a turbine conventionally confi gured with two casings can be confi gured with a single casing, the following structure was used.
(a) One set of main steam valves are positioned on the upper side of the turbine casing and one set of reheat steam valves are positioned on the side of the turbine casing.
(b) Because the high-temperature sections are con-centrated in the center, the high-pressure sec-tion and the intermediate-pressure section uti-lize counterfl ow.
(c) By locating the low-pressure steam inlet at the front of the casing and creating a fl ow of steam between inner and outer casings, the structure makes it less likely for a top/bottom tempera-ture difference of the casing.
In the trial operation of the Units No. 1 and No. 2, a good operating state, with minimal vibration and top/bottom temperature difference of the casing, was confi rmed for both continuous operation and start-up/shut-down process.
3. Steam Turbine for the SUR Plant CCPP from
Daewoo E&C This system, a steam turbine that generates power
by utilizing the exhaust heat from two gas turbines to generate steam with an exhaust heat recovery boiler, is composed of two components, a high and intermedi-ate-pressure turbine for the high-pressure and inter-mediate-pressure sections and a low-pressure turbine for the low-pressure section.
Figure 6 shows a bird’s-eye view, Fig. 7 shows an external view and Fig. 8 shows a cross-sectional view of the steam turbine.
The high-temperature high-pressure main steam fl ows through a main steam valve, located at the lower
part of the casing, and into the high-pressure sec-tion. Main steam then expands toward the front of the turbine, and after completing its work, is discharged through a cold reheat steam pipe. Reheat steam fl ows through the reheat steam valve, located at the lower central part of the casing, into the intermediate-pres-sure section. Reheat steam then expands toward the rear of the turbine, and after completing its work, is discharged through cross-over pipe, and then is sup-
Main steam valve
Con-denser
Reheat steam valve
Fig.5 Bird’s-eye view of steam turbine for the Yoshinoura Thermal Power Station
Low-pressure turbine
High and intermediate-pressure turbine
Condenser
Condenser
Crossover pipe
Main steam valve
Reheat steam valve
Fig.6 Bird’s-eye view of steam turbine for SUR plant CCPP
Reheat steam valve
Main steam valve
Main steam valve
Crossover pipe
High and intermediate-pressure turbine
Low-pressure turbine
Low-temperature steam inlet
(b) Side view(a) Front view
Cold reheat steam pipe
Fig.7 Outline view of steam turbine for SUR plant CCPP
High and intermediate-pressure turbine
Low-pressure turbine
Reheat steam inlet
Cold reheat steam exhaust
Low-pressure steam inlet
Low-pressure steam exhaust
High and intermediate-pressure section inner casing
Low-pressure section inner casingLow-pressure section outer casing
High and intermediate-pressure section outer casing
Main steam inlet
Steam flow
Fig.8 Cross-sectional view of steam turbine for SUR plant CCPP

110 FUJI ELECTRIC REVIEW vol.59 no.2 2013
plied to the low-pressure turbine. Low pressure steam is mixed at the midpoint on the crossover pipe. After completing work at the low-pressure turbine, the steam reaches condensers located on either side of the low-pressure turbine.
Features of this turbine are as follows. (a) The largest capacity high and intermediate-
pressure turbine for Fuji Electric (b) Low-pressure turbine with dual-side exhaust
system allows for lower building height
3.1 330 MW high and intermediate-pressure turbine Previously, this class of equipment (330 MW) has
used a three-casing reheat steam turbine, consisting of a high-pressure turbine, an intermediate-pressure tur-bine and a low-pressure turbine. With the Sur CCPP, a more compact size has been realized by combining the high-pressure turbine and intermediate-pressure turbine components together as a two-casing reheat steam turbine. Fuji Electric’s previous maximum ca-pacity of a two-casing reheat turbine was 210 MW, but a larger size has been achieved by adopting the mea-sures described below.
In order to cool the compact inner casing, in a dou-ble casing structure consisting of an inner casing and an outer casing as shown in Fig. 8, the pressure and temperature acting inside the turbine are apportioned so that a more compact volume can be achieved and intermediate-pressure section exhaust steam is fl owed between both casings so that the inner casing can be cooled. Additionally, because the high-pressure ex-haust steam is exhausted with an L-ring structure that does not contact the high-pressure outer casing, lower grade cast steel or cast iron is used as the material of the outer casing. Furthermore, to enhance the com-pactness of the outer casing and facilitate maintenance at the time of regular inspections, main steam valves and reheat steam valves are located at the lower left and right of the high and intermediate-pressure tur-bine as shown in Fig. 7(a).
3.2 Dual-side exhaust type low-pressure turbine
The low-pressure turbine casing consists of a low-pressure inner casing and a low-pressure outer cas-ing. Steam discharged from the intermediate-pressure turbine is introduced via a crossover pipe to the low-pressure inner casing. Then, the steam expands to a vacuum pressure and passes between the low-pressure inner casing and the low-pressure outer casing and is discharged to the condenser. With a conventional structure, the exhaust steam is output to a condenser located directly beneath the turbine. Such a structure, however, has the disadvantage that the large volume condensers located under the turbine fl oor result in a turbine building that has a high height and is more expensive to build. In this system, as shown in Fig. 6, condensers are located on either side of the low-pressure turbine so that the turbine building does not
have to be as tall, and can therefore be constructed less expensively. In developing the low-pressure outer casing for the dual-side exhaust type turbine, we stud-ied how to ensure the same steam fl ow area as with a downward exhaust type and how to reinforce the inner structure so as to be able to withstand vacuum pres-sures, and also reviewed the turbine anchor points and considered a divided approach to improve the ease of maintenance. By applying a proven structure for the low-pressure inner casing, the same level of quality as in a conventional structure is ensured.
4. State-of-the-art Steam Turbine Technologies
4.1 Welding technologies (1) Welding technology for rotor made of dissimilar
materials The material used in the rotor of a single-casing
steam turbine is required to have the opposing charac-teristics of good creep strength at locations exposed to high temperature steam and good toughness at loca-tions exposed to low temperature steam. Previously, 2% Cr steel, which is expensive but high toughness, or 1% Cr steel, which has poor toughness but is inex-pensive, was used according to the magnitude of the centrifugal force acting on the center of the shaft, i.e., the length of low pressure blade or rotational speed. Recently, some plants require the use of longer low-pressure blades for which even 2% Cr steel provides insuffi cient toughness. For this reason, Fuji Electric has developed welding technology for a 1% Cr steel ro-tor having high creep strength at high temperatures and a 3.5% Ni steel rotor having higher toughness than 2% Cr at low temperatures. This technology can also be applied as an alternative to 2% Cr steel rotors for which material manufacturers are limited. Figure 9 shows a steam turbine that uses a rotor made from welded dissimilar materials. (2) Rotor repair welding technology
In aged plants, cracks due to thermal fatigue may,
1% Cr steel rotor
Weld connection
3.5% Ni steel rotor
Fig.9 Steam turbine using rotor made from welded dissimilar materials

111Latest Steam Turbine Technologies for Thermal Power Plants
Issu
e: E
nerg
y C
reat
ion
Tech
nolo
gies-
Pow
er P
lant
s an
d N
ew E
nerg
y
in some cases, be observed on the surface of rotors used at high temperatures. The operation of a turbine in which cracks exist in this state would be extremely dangerous. The manufacture of a new rotor requires that a plant be stopped for an extended period of time and thus results in a tremendous loss of profi t to the customer. In order to minimize the duration of plant stoppage, Fuji Electric has developed weld repair tech-nology for locations in which cracks have occurred. (3) Weld repair technology for cast iron products
Because cast iron does not require complex heat treatment processing and has few material defects, for use at intermediate and low-temperatures where high thermal strength is not required, it is advantageous compared to cast steel in terms of a shorter manufac-turing period and lower cost. With cast iron, however, defect areas are diffi cult to repair by welding and if a defect exceeds the allowable size in an area where strength is required, disposal and remanufacture will be necessary.
Welding tests were conducted on a test sample cut out from the excess material of an actual iron cast-ing, and based upon the results of non-destructive testing, optimal welding conditions were established. The welding tests were performed using two welding methods, gas shielded tungsten arc welding (GTAW) for welding in a narrow range and shielded metal arc welding (SMAW) for welding in a broad range, two welding orientations, downward and horizontal, and three types of fi ller materials, Ni alloys, Fe-Ni alloys and Inconel alloys.
4.2 USC turbine technologies (1) Domestic production of materials for use in USC
turbines In contrast to oil and natural gas that are concen-
trated in regions of political instability, coal is widely distributed over the earth, and thus from an energy-security perspective, coal-fi red power generation is po-sitioned as an important source of power.
On the other hand, coal-fi red power generation has the largest amount of CO 2 emissions among the various types of thermal power generation that use fossil fuels (oil, gas or coal). Therefore in recent years, in the construction of large capacity coal-fi red power generation facilities, ultra super critical (USC) plants that utilize high temperature and higher pressure to achieve higher thermal effi ciency in power generation plants have become mainstream.
In 2002, Fuji Electric worked on a USC plant that used a steam turbine manufactured by Siemens AG and in which the main steam temperature was 600 °C and the reheat steam temperature was 610 °C. At that time, the main material of improved 12% Cr steel that was used in high temperature components was made all in Europe.
Because there are a limited number of suppliers of the main material used in USC plants, the domes-
tic manufacture of USC turbines is considered to be an important factor in facilitating procurement of the main material. In collaboration with domestic materi-als manufacturers, Fuji Electric carried out prototype testing of rotor material and casing material of im-proved 12% Cr steel, established manufacturing tech-nology and methods of evaluating material deteriora-tion and embrittlement, and set domestic production of the main material as a goal. Figure 10 shows a proto-type of a rotor made from improved 12% Cr steel. (2) Remaining life assessment technology
Because of the signifi cant cost and preparation time required for the renewal of a steam turbine in an aged plant, assessment of the remaining life and plans for renewal must be made at appropriate times.
For the 1% Cr steel used in subcritical pressure plants and supercritical pressure plants that have lower steam conditions than in a USC plant, master curves relating to the deterioration characteristics and embrittlement characteristics of the material have already been obtained. On the other hand, for the improved 12% Cr steel used in USC plants, however, master curves relating to deterioration characteris-tics and embrittlement characteristics have not yet been obtained. For this reason, in collaboration with Kagoshima University, Fuji Electric is advancing re-search to obtain master curves, with the goal of estab-lishing basic technology for performing remaining life assessments.
4.3 Technologies for improving the reliability of low-pres-
sure blades (1) Corrosion monitoring technology
It is known that the likelihood for stress corro-sion cracking at the low-pressure blades increases as
*1: Cation conductivity: The electric conductivity of a solution after having passed through a cation exchanger resin whereby the cations were exchanged for hydrogen ions. Cation conductivity is used to detect harmful anion concentrations such as trace quantities of chloride ions, sulfate ions, and the like.
Fig.10 Improved 12% Cr steel prototype rotor

112 FUJI ELECTRIC REVIEW vol.59 no.2 2013
istics, low-pressure blade vibration must be measured under various operating conditions in a power plant. Therefore, we measured the vibration of low-pressure blades in operation. Figure 12 shows a drawing of the installation of a vibration monitoring sensor. By at-taching multiple non-contact type eddy current sensors along the circumference of the stationary blade ring opposite the tip of the low-pressure moving blade, we successfully recorded continuous online measurements of the vibration of individual blades in operation. The sensors are housed in a titanium case so that long-term blade vibration monitoring will be possible.
5. Postscript
After the Great East Japan Earthquake that oc-
curred on March 11, 2011, nuclear power plants in Japan have successively shutdown, and there are as yet no prospects for restarting them. During this pe-riod of prolonged shutdown of nuclear power plants, re-newable energy and combined cycle power generation are seen as the future leaders for power generation.
In the fi eld of coal-fi red power generation, research and development of advanced ultra super critical (A-USC) power generation and integrated gasifi cation combined cycle (IGCC) power generation, which are ca-pable of further reducing CO 2 emissions below the lev-els of USC power generation, are being advanced. Fuji Electric intends to continue to pursue technical devel-opment in order to supply steam turbines that have high levels of performance and operability.
the cation conductivity *1 of the main steam increases. Since the main steam properties are controlled at the boiler side, and because stress corrosion cracking oc-curs at the low-pressure blades which are located far away from the boiler outlet, real-time monitoring of the steam properties inside the turbine and accurate assessment of the risk of stress corrosion cracking are necessary.
For this reason, in collaboration with Tohoku University, Fuji Electric has developed a corrosion monitoring sensor and is conducting fi eld tests. Figure 11 shows a drawing of the installation of a corrosion monitoring sensor. The corrosion monitoring sensor consists of sensors able to measure pH, chloride ion concentration and the corrosion potential, and enables the online monitoring of the corrosive environment at clearance gaps where corrosive components are likely to concentrate. Furthermore, a micro sampling device enables the steam inside a turbine to be sampled and analyzed. (2) Vibration monitoring technology
The vibration characteristics of long low-pressure blades are complex and therefore if unproven low-pres-sure blades are to be used in an actual device, an accel-eration sensor is attached at the time of shop balance testing, and rotation vibration tests are performed to verify the actual characteristics.
However, in contrast to shop balance tests that are conducted in a vacuum chamber at room temperature, the actual conditions in a turbine are a steam envi-ronment of changing temperature, pressure and fl ow rate. Thus, in order to ascertain the actual character-
Monitoring & micro-sampling apparatus
(a) Installation location (b) Sensor configuration
Pipe
Electrometer
Sampling
Condensed water
pH Cl- EcReference electrode
Ir/IrOXAg/AgCl 13Cr
Fig.11 Installation of corrosion monitoring sensor
Stationary blade ring
Eddy current sensor
Fig.12 Installation of vibration monitoring sensor

Issu
e: E
nerg
y C
reat
ion
Tech
nolo
gies-
Pow
er P
lant
s an
d N
ew E
nerg
y
A B S T R A C T
† Power & Social Infrastructure Business Group,Fuji Electric Co., Ltd.
1. Introduction The method of combined cycle power generation
using a gas turbine and a small steam turbine has the advantages of good power generation effi ciency and operability and a low environmental burden. It has therefore been adopted widely in recent years. Furthermore, a rapid start-up is possible with this power generation method. Thus, it is easy to carry out daily start and stop (DSS) operations and it is possible to deal with situations where there is a large differ-ence in demand for power between the daytime and the nighttime hours. It is therefore expected that demand for the method will continue to increase.
The electricity generator that Fuji Electric has designed and built for the Yoshinoura Thermal Power Station Unit No. 1 and Unit No. 2 of the Okinawa Electric Power Company, Incorporated, is an indirectly hydrogen-cooled turbine generator using a global vac-uum pressure impregnation (VPI) insulation system for single-shaft type combined cycle power generation facilities. This article introduces the characteristics of it and the technologies that were applied.
2. Characteristics of Single-Shaft Type
Combined Cycle Power Generation Facilities Combined cycle power generation facilities include
the single-shaft type, where a gas turbine, generator and steam turbine are lined up along one axis, and the multi-shaft type, where the gas turbine power genera-tion facilities and the steam turbine power generation facilities are installed separately. In general, with sin-gle-shaft type power generation facilities, multiple sys-
YAMAZAKI Masaru † NIIKURA Hitoshi † TANIFUJI Satoshi †
Global VPI Insulated Indirectly Hydrogen-Cooled Turbine Generator for Single-Shaft Type Combined Cycle Power Generation Facilities
Fuji Electric has a great deal of experience in air-cooled turbine generators for global VPI insulation systems. We designed and built global VPI indirectly hydrogen-cooled turbine generators for the Yoshinoura Thermal Power Station Unit No. 1 and No. 2 of the Okinawa Electric Power Company, Incorporated. These are double-end drive generators for a single-shaft type, combined cycle power generation facilities that use many of the same basic con-struction and manufacturing methods as air-cooled turbine generators. Using data obtained through experience and results from ventilation analysis and strength analysis, we are achieving optimization and increased reliability.
Through each type of test, we are obtaining results that satisfy performance expectations and we are seeing fa-vorable operating conditions at the power plants.
113
tems are installed and each can be operated indepen-dently. Individual systems can be stopped when the amount of power generation necessary falls and the other systems can be operated at the rated load. This makes it possible to maintain high partial load effi cien-cy for the plant as a whole. Figure 1 shows an example of confi guration of the single-shaft type combined cycle power generation facilities developed jointly by Fuji Electric and Siemens AG.
3. Characteristics of the Power Generator
Table 1 shows the main specifi cations of the gener-
ator and Fig. 2 shows a cross section view. The struc-tures and manufacturing methods used on the stator windings, stator core and rotor windings for this indi-rectly hydrogen-cooled turbine generator are roughly the same as those used for air-cooled turbine genera-tors. This made it possible to achieve high reliability based on the great deal of experience gained in air-cooled turbine generators and by sharing the common technologies and equipment.
3.1 Cooling methods
This generator uses the indirect hydrogen cooling method for the cooling of the stator. The ventilation
Clutch
Steam turbineSlip ring CondenserGeneratorGas turbine
Fig.1 Example of confi guration of single-shaft type combined cycle power generation facilities

114 FUJI ELECTRIC REVIEW vol.59 no.2 2013
path is as shown with the arrows in Fig. 2. Cooling gas is fed to the stator and rotor parts from an axial fan at both ends of the rotor. All the fl ow of the stator cooling gas is from the inner diameter side to the outer diam-eter side.
These cooling and ventilation methods are the same as on air-cooled turbine generators, in which Fuji Electric has a great deal of experience. The design was based on the data obtained from prototype experimen-tal models and actual results. The optimal positioning of cooling ducts and distribution of cooling airfl ow is used to achieve a uniform distribution of temperature on the windings.
In addition, for the rotors, in order to achieve a uniform cooling fl ow in each part of the coil, inlet guide vanes were added to the internal diameter of the re-taining ring support, as shown in Fig. 3. This improves the cooling performance.
3.2 Rotor structure
As shown in Fig. 1, in single-shaft type combined cycle power generation facilities, the gas turbine and steam turbine are positioned at both ends of the gen-erator. The following consideration is therefore made. (1) Bending and torsional vibration response calcula-
tions for the entire shafting Both gas turbine simple cycle*1 and combined cycle
operations are possible on this power generation equip-ment. For both of these methods of operation, con-sideration is made so that a rated rotation speed and critical speed of the generator are not approached and there is suffi cient consideration made for the vibration response. (2) Slip ring shaft material
The generator rotors are double-end driven and the driving torque is transmitted. In addition, it is neces-sary to prepare suffi cient strength to endure short-cir-cuit accidents, and thus the same NiCrMoV steel mate-rial as on the generator shaft was adopted as the slip ring shaft material. (3) Insulating coupling
There is a risk on the rotor axis that the electromo-tive force generated during operations may result in a return current between the main axis, the bearings and the structures connecting the two bearings, and this may interfere with the operation of the genera-tor. Insulation is therefore installed on the bearings to cut off the electrical circuit and prevent a circulation of current fl ow. This time, in order to prevent the cir-culation of current fl ow through the intermediate shaft bearings, an insulating coupling is used in the connec-tion between the slip ring shaft and the intermediate shaft.
3.3 Stator structure
The stator core is supported through the core sup-port plate shown in Fig. 4 on the cylindrical stator frame, which is a pressure vessel. The structure has an appropriate spring effect to suppress the transmis-
Table1 Main specifi cations of 300 MVA indirectly hydrogen-cooled turbine generator
Item Specifi cation
Output 300 MVA
Voltage 16,000 V
Power factor 0.85
Frequency 60 Hz
Coolant Stator: Hydrogen indirectRotor: Hydrogen direct
Hydrogen gas pressure 0.4 MPaG
Coolant gas temperature 43 °C
Speed 3,600 min–1
Excitation Static
Total length 13.1 m
Total mass 325 t
Bearing Core support spring Stator frame
Axialfan
Stator Rotor
Slip ring shaftIntermediate
shaft
Current collector
Steam turbine sideGas turbine side
Fig.2 Cross section diagram of 300 MVA indirectly hydrogen-cooled turbine generator
Inlet guide vane
Fig.3 Inlet guide vane
*1: Simple cycle: An energy system where just power gen-eration is performed with a motor using fuel.

115Global VPI Insulated Indirectly Hydrogen-Cooled Turbine Generator for Single-Shaft Type Combined Cycle Power Generation Facilities
Issu
e: E
nerg
y C
reat
ion
Tech
nolo
gies-
Pow
er P
lant
s an
d N
ew E
nerg
y
sion of electromagnetic vibration from the core to the stator frame.
4. Global VPI Insulation Technology
The stator insulation is performed using the global
VPI insulation technology that Fuji Electric has ac-cumulated in many years of experience and a global VPI insulation system with global VPI manufacturing facilities that are the biggest in Japan and one of the greatest in the world.
Figure 5 shows the global VPI insulated sta-tor. The stator windings and core are impregnated with insulating resin as one whole, the core, windings and wedges are therefore strongly attached and less likely to become loose. This improves the reliabil-ity and makes it possible to reduce maintenance work. Furthermore, as the spaces between the windings and core are fi lled with resin so that there are no gaps, there is the advantage that the heat dissipation from the windings to the core is improved, and the cooling performance is better than with impregnation of the
windings alone. Figure 6 shows the impregnation processing stages
in global VPI insulation. After winding the mica glass tape or other on the conductors as the main insulating material, the windings are inserted into the stator core slot and the specifi ed winding connections are made. Next, the stator core and windings are placed as one into an epoxy resin tank for vacuum pressure impreg-nation. With this process, all the windings are impreg-nated with resin at one time, and consequently it is ex-tremely important for large-scale generators. For this reason, factors such as the viscosity of the resin and the compounding ratio of curing agent are strictly con-trolled, and a monitoring system takes measurements during the impregnation processing of a temperature, degree of vacuum, pressure during pressurization and capacitance of the windings for the constant monitor-ing and control of the status of the resin impregnation.
5. Analysis Technology
5.1 Ventilation analysis
In ventilation analysis, the improvements in hard-ware and software performance in recent years have made it possible to increase the number of elements in the analysis model and it has become possible to calculate complex fl ows such as the cooling ventila-tion in a generator with comparatively high accuracy. Furthermore, it is extremely diffi cult to actually mea-sure the fl ow inside the rotor during operations, but it is now possible to understand the distribution of fl ow and other matters to a high level of accuracy by using thermo-fl uid analysis. Fluid analysis is also used to re-alize optimal ventilation cooling in the design of global VPI insulated indirectly hydrogen-cooled turbine gen-erators.
The following is an example of fl ow analysis on the rotor coil end part. Figure 7 shows a ventilation analy-sis model for the rotor. The outlet part of the axial fan at the shaft end, the space on the inner side of the coil end, the rotor coil cooling duct and air gaps have been modeled. Flow distribution was calculated for the con-
Fig.4 Core support spring
Core
Windings
Expansive insulatingmaterial
Wedge
Resin
Fig.5 Global VPI insulated stator
Vacuumpump
Resin tank
Stator placedin oven andheated
Vacuuming
Transferred toimpregnation tank
Pouring heated resin
Nitrogentank
Resin recovered
PressurereleasedTransferred to
oven
Curing by heating
CompletePressurizedwith nitrogenfor resinimpregnation
Fig.6 Global VPI insulation processes

116 FUJI ELECTRIC REVIEW vol.59 no.2 2013
against repeated stress. Figure 9 shows the retaining ring strength analy-
sis model. The structure of the retaining ring shrink fi t area is very complicated, the strength analysis is therefore performed using a three-dimensional model. In addition, in order to correctly model the state of the stress, consideration was given to the non-linearity of the strain and stress, and the shrink fi t surfaces of the rotor and the retaining ring were taken to be contact elements. Figure 10 shows the results of stress distri-bution analysis as an example of strength analysis at the rotor shaft end.
6. Related Equipment
6.1 Adoption of clutch
In between the generator and steam turbine, there is a clutch installed that can absorb the differential ex-pansion and be automatically attached and removed. This means that the gas turbine and steam turbine can be designed independently for the thrust loading and the difference in thermal expansion that occurs due to changes in temperature during start-up/stop operations. Furthermore, the starting and stopping of the gas turbine is possible with no effect on the steam turbine. Thus the loss at the starting and stopping can be reduced.
6.2 Adoption of static frequency converter (SFC)
The method used for starting up the gas turbine
dition that the rotor rotates at its rated speed. For the boundary conditions for the axial fan part, which is the inlet to the analysis area, and the air gap, which is the outlet, fl ow distribution values calculated separately were used for the analysis. Figure 8 shows an example of the results of ventilation analysis on the rotor coil end part.
5.2 Strength analysis
Strength analysis was performed on the rotor re-taining ring shrink fi t area in order to secure reliabil-ity in frequent start-up/stop operations, which are a characteristic of combined cycle power generation. In order to retain the rotor coil end under the centrifu-gal force during rotation, the rotor-retaining ring is shrink-fi tted to the rotor shaft end with a certain shrink-fi t allowance. When stationary, compressive stress occurs on the shrink fi t part on the rotor shaft end. When rotating, the centrifugal force means that the retaining ring diameter expands and the compres-sive stress is released. Consequently, start-up/stop op-erations mean that the stresses occur repeatedly. For this reason, in addition to avoiding the concentration of stress, consideration was also given to the reliability
Air gap
Inlet part (corresponds to theoutlet of the axial fan)
Space inside coil end
Center of generator
Rotor coil cooling duct
Sub-slot
Fig.7 Ventilation analysis model for the rotor
Gas velocityFast
Slow
Direction of rotation
Shaft end
Near baseof fan
Fig.8 Example of results of ventilation analysis on the rotor coil end part
Shrink fit area(Rotor shaft side)
Rotor shaft end
StressHigh
Low
Fig.10 Results of stress distribution analysis on the rotor shaft end (Stress evaluation part)
Retaining ring
Stress evaluation part
Shrink fit area
Rotor shaft
Fig.9 Strength analysis model of retaining ring

117Global VPI Insulated Indirectly Hydrogen-Cooled Turbine Generator for Single-Shaft Type Combined Cycle Power Generation Facilities
Issu
e: E
nerg
y C
reat
ion
Tech
nolo
gies-
Pow
er P
lant
s an
d N
ew E
nerg
y
In June 2010, the various aspects of performance were verifi ed in a no-load saturation test, three-phase short-circuit test, loss characteristic test, temperature rise test, sudden three-phase short-circuit test and overspeed test. Figure 11 shows a global VPI insulated indirectly hydrogen-cooled turbine generator during factory testing. The factory testing results were good, which satisfi ed the specifi cations and had good agree-ment with the design values.
8. Postscript
This article was centered around the characteris-
tics and technologies of the global VPI insulated indi-rectly hydrogen-cooled turbine generators for single-shaft type combined cycle power generation facilities at the Yoshinoura Thermal Power Station Unit No. 1 and Unit No. 2 of the Okinawa Electric Power Company, Incorporated. Unit No. 1 started trial operations in May 2012 and commercial operations in November, and the status of operations is good. Moreover, com-mercial operations at Unit No. 2 started in May 2013. Fuji Electric will continue to respond to the needs of the market and to carry out technology development to produce high quality and highly reliable turbine gen-erators.
is to use an SFC to drive the generator as a synchro-nous motor. This SFC is made up of a converter and an inverter, and it supplies the generator stator with the voltage and frequency necessary for the starting up and speeding up of the gas turbine. In addition, the generator excitation power supply during the speed-ing up is supplied from an excitation system. The use of this method means that a starting motor is not necessary and the shafting and overall arrangement is simplifi ed. Furthermore, maintenance work is also simplifi ed as the confi guration includes only electrical equipment.
7. Factory Test Results
Fig.11 Global VPI insulated indirectly hydrogen-cooled turbine generator during factory testing

A B S T R A C T
† Power & Social Infrastructure Business Group,Fuji Electric Co., Ltd.
118
1. Introduction The “ Kyoto Protocol ” was adopted at the 3rd
Session of the Conference of the Parties to the U.N. Framework Convention on Climate Change (COP3) in December 1997. It clarifi ed the reduction of green-house gases and a low carbon society became the goal. In order to promote the introduction of photovoltaic power generation, the Japanese government provided support for the installation of large-scale photovoltaic power generation facilities with outputs of 1 MW or greater, which are generally described as mega solar facilities. After the Great East Japan Earthquake in March 2011, the government announced a policy of accelerating the development of renewable energy to secure an alternative energy source to nuclear power generation. Furthermore, after the start of the “Feed-in Tariff Scheme for renewable energy” in July 2012, there have been increasing examples of photovoltaic power generation facilities being constructed by parties other than the electric power companies, for example, ordinary companies or local governments, both for the purpose of selling the power and for their own use.
Fuji Electric has been supplying photovoltaic pow-er generation systems both in Japan and overseas since 1980. This article introduces the company’s tech-nologies for large-scale photovoltaic power generation systems, which are based on that track record.
2. Fuji Electric’s Solutions for Photovoltaic
Power Generation System Fuji Electric has utilized the plant technologies
developed in power generation facilities, transforming
NAKAGAWA Masayuki † XIANG Donghui †
Technology for Large-Scale Photovoltaic Power Generation Systems
The market for photovoltaic power generation systems in Japan is expanding to large-scale photovoltaic power generation (mega solar), and the need for high effi ciency, high reliability, and compact equipment increases. Fuji Electric supplied a package of mechanical and electronic equipment for Abu mega-solar plant of the Okinawa Electric Power Company, Incorporated including devices for a solar power generation system and a remote surveillance con-trol system, which commenced operation in the end of March 2012. We have applied a highly-effi cient, high-capacity power conditioner utilizing the power electronics technology and a large-scale surveillance control system.
We are also developing system-interconnection technologies to resolve issues that would arise in the power grid with large-scale implementation of renewable-energy power production through microgrid verifi cation equipment us-ing stable systems etc. for remote islands.
facilities and factory facilities, and has supplied many photovoltaic power generation systems and verifi cation facilities both within Japan and overseas. The compa-ny is also a world leader in the development and deliv-ery of fi lm-type amorphous solar cells, which are “thin, light and fl exible.”
Figure 1 shows an overview of measures for pho-tovoltaic power generation systems. Fuji Electric per-forms all processes from the selection of solar cells to the design, installation and maintenance of extra-high voltage and high voltage facilities, power grid inter-
Total engineering (installation, construction work, quality assurance, after-sales service, etc.)
Total system design for other principal components (electric equipment, system interconnection, stabilizer, IT, etc.)
PCS
Key technology
™High efficiency (98.5% without power loss for internal control, 1,000 V DC specification)™600 V DC specification series also developed™Substation configuration* that is easy to install
™Grid connection technology™Smart grid control technology™Large-scale plant technology
™Optimal PV module for the system
™Power generation operators overseas and in Japan (public and private sector)
PV module Sales and after-sales service
Substation systemPCS (power conditioner)
* Substation configuration: An integrated structure containing PCS, switchgear and step-up transformer
Total system design for other principal components (electric equipment, system interconnection, stabilizer, IT, etc.)
Total engineering (installation, construction work, quality assurance, after-sales service, etc.)
Fig.1 Measures for photovoltaic power generation systems
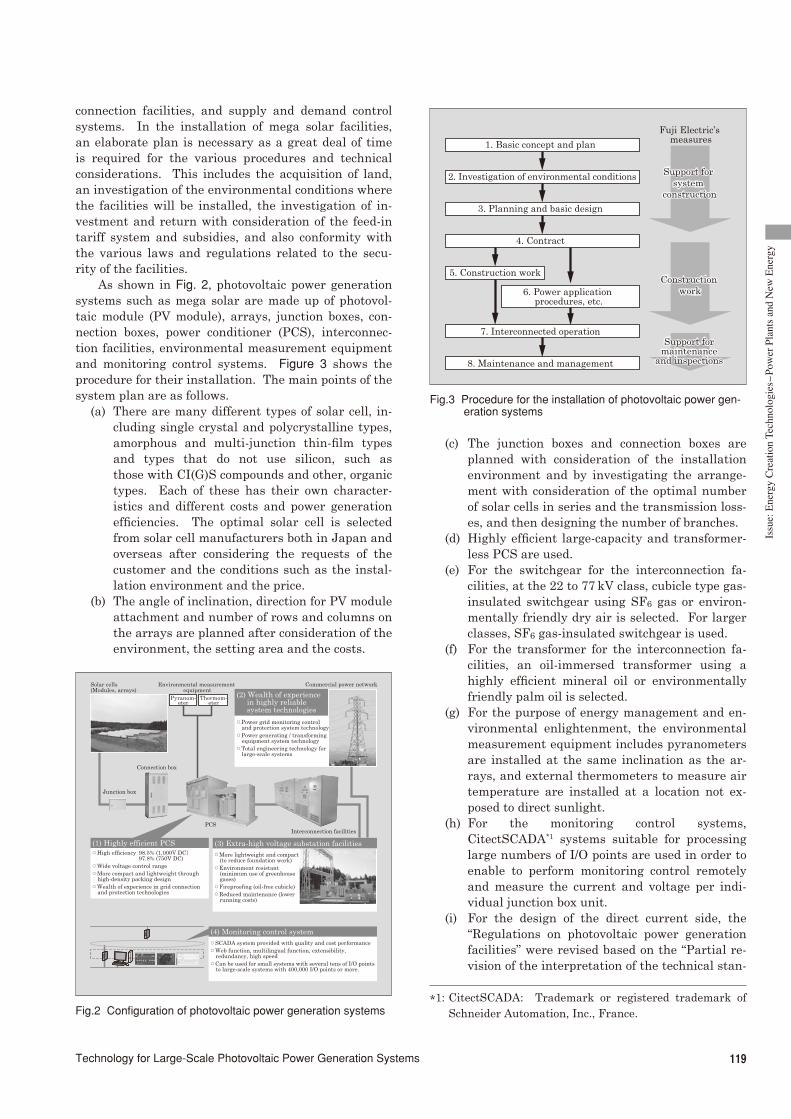
119Technology for Large-Scale Photovoltaic Power Generation Systems
Issu
e: E
nerg
y C
reat
ion
Tech
nolo
gies-
Pow
er P
lant
s an
d N
ew E
nerg
y
connection facilities, and supply and demand control systems. In the installation of mega solar facilities, an elaborate plan is necessary as a great deal of time is required for the various procedures and technical considerations. This includes the acquisition of land, an investigation of the environmental conditions where the facilities will be installed, the investigation of in-vestment and return with consideration of the feed-in tariff system and subsidies, and also conformity with the various laws and regulations related to the secu-rity of the facilities.
As shown in Fig. 2, photovoltaic power generation systems such as mega solar are made up of photovol-taic module (PV module) , arrays, junction boxes , con-nection boxes , power conditioner (PCS), interconnec-tion facilities, environmental measurement equipment and monitoring control systems. Figure 3 shows the procedure for their installation. The main points of the system plan are as follows.
(a) There are many different types of solar cell, in-cluding single crystal and polycrystalline types, amorphous and multi-junction thin-fi lm types and types that do not use silicon, such as those with CI ( G ) S compounds and other, organic types. Each of these has their own character-istics and different costs and power generation effi ciencies. The optimal solar cell is selected from solar cell manufacturers both in Japan and overseas after considering the requests of the customer and the conditions such as the instal-lation environment and the price.
(b) The angle of inclination, direction for PV module attachment and number of rows and columns on the arrays are planned after consideration of the environment, the setting area and the costs.
(c) The junction boxes and connection boxes are planned with consideration of the installation environment and by investigating the arrange-ment with consideration of the optimal number of solar cells in series and the transmission loss-es, and then designing the number of branches.
(d) Highly effi cient large-capacity and transformer-less PCS are used.
(e) For the switchgear for the interconnection fa-cilities, at the 22 to 77 kV class, cubicle type gas-insulated switchgear using SF 6 gas or environ-mentally friendly dry air is selected. For larger classes, SF 6 gas-insulated switchgear is used.
(f) For the transformer for the interconnection fa-cilities, an oil-immersed transformer using a highly effi cient mineral oil or environmentally friendly palm oil is selected.
(g) For the purpose of energy management and en-vironmental enlightenment, the environmental measurement equipment includes pyranometers are installed at the same inclination as the ar-rays, and external thermometer s to measure air temperature are installed at a location not ex-posed to direct sunlight.
(h) For the monitoring control systems, CitectSCADA*1 systems suitable for processing large numbers of I/O points are used in order to enable to perform monitoring control remotely and measure the current and voltage per indi-vidual junction box unit.
(i) For the design of the direct current side, the “Regulations on photovoltaic power generation facilities” were revised based on the “Partial re-vision of the interpretation of the technical stan-
Solar cells (Modules, arrays)
Environmental measurement equipment
Junction box
Connection box
Commercial power network
Pyranom-eter
Thermom-eter
Interconnection facilitiesPCS
™Power grid monitoring control and protection system technology™Power generating / transforming equipment system technology™Total engineering technology for large-scale systems
™High efficiency 98.5% (1,000V DC97.8% (750V DC)
™Wide voltage control range™More compact and lightweight through high-density packing design™Wealth of experience in grid connection and protection technologies
™More lightweight and compact (to reduce foundation work)™Environment resistant (minimum use of greenhouse gases)™Fireproofing (oil-free cubicle)™Reduced maintenance (lower running costs)
™SCADA system provided with quality and cost performance™Web function, multilingual function, extensibility, redundancy, high speed™Can be used for small systems with several tens of I/O points to large-scale systems with 400,000 I/O points or more.
(3) Extra-high voltage substation facilities
(2) Wealth of experience in highly reliable system technologies
(1) Highly efficient PCS
(4) Monitoring control system
Fig.2 Confi guration of photovoltaic power generation systems
1. Basic concept and plan
Support for system
construction
Support for system
construction
Construction work
Construction work
Support for maintenance
and inspections
Support for maintenance
and inspections
Fuji Electric’s measures
2. Investigation of environmental conditions
3. Planning and basic design
4. Contract
5. Construction work
6. Power application procedures, etc.
7. Interconnected operation
8. Maintenance and management
Fig.3 Procedure for the installation of photovoltaic power gen-eration systems
*1: CitectSCADA: Trademark or registered trademark of Schneider Automation, Inc., France.
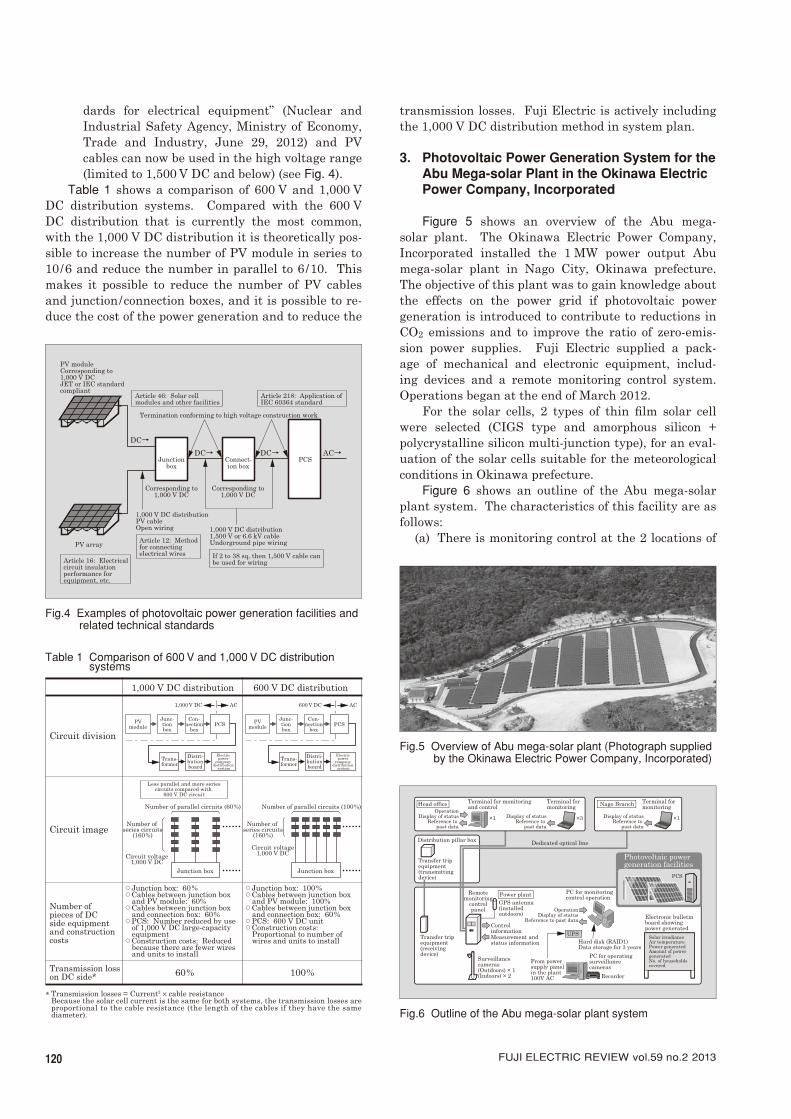
120 FUJI ELECTRIC REVIEW vol.59 no.2 2013
dards for electrical equipment” (Nuclear and Industrial Safety Agency, Ministry of Economy, Trade and Industry, June 29, 2012) and PV cables can now be used in the high voltage range (limited to 1,500 V DC and below) (see Fig. 4).
Table 1 shows a comparison of 600 V and 1,000 V DC distribution systems. Compared with the 600 V DC distribution that is currently the most common, with the 1,000 V DC distribution it is theoretically pos-sible to increase the number of PV module in series to 10/6 and reduce the number in parallel to 6/10. This makes it possible to reduce the number of PV cables and junction / connection boxes , and it is possible to re-duce the cost of the power generation and to reduce the
transmission losses. Fuji Electric is actively including the 1,000 V DC distribution method in system plan.
3. Photovoltaic Power Generation System for the
Abu Mega-solar Plant in the Okinawa Electric Power Company, Incorporated Figure 5 shows an overview of the Abu mega-
solar plant. The Okinawa Electric Power Company, Incorporated installed the 1 MW power output Abu mega-solar plant in Nago City , Okinawa prefecture. The objective of this plant was to gain knowledge about the effects on the power grid if photovoltaic power generation is introduced to contribute to reductions in CO 2 emissions and to improve the ratio of zero-emis-sion power supplies. Fuji Electric supplied a pack-age of mechanical and electronic equipment, includ-ing devices and a remote monitoring control system. Operations began at the end of March 2012.
For the solar cells, 2 types of thin fi lm solar cell were selected (CIGS type and amorphous silicon + polycrystalline silicon multi-junction type), for an eval-uation of the solar cells suitable for the meteorological conditions in Okinawa prefecture.
Figure 6 shows an outline of the Abu mega-solar plant system. The characteristics of this facility are as follows:
(a) There is monitoring control at the 2 locations of
DC→DC→
Junctionbox
Connect-ion box
Corresponding to1,000 V DC
PV array
PV moduleCorresponding to 1,000 V DCJET or IEC standard compliant
1,000 V DC distributionPV cableOpen wiring
Termination conforming to high voltage construction work
1,000 V DC distribution1,500 V or 6.6 kV cableUnderground pipe wiring
Corresponding to1,000 V DC
PCSDC→ AC→
Article 16: Electrical circuit insulation performance for equipment, etc.
Article 46: Solar cell modules and other facilities
Article 218: Application of IEC 60364 standard
Article 12: Method for connecting electrical wires If 2 to 38 sq, then 1,500 V cable can
be used for wiring
Fig.4 Examples of photovoltaic power generation facilities and related technical standards
1,000 V DC distribution 600 V DC distribution
Circuit division
Circuit image
Transmission loss on DC side*
Number of pieces of DC side equipment and construction costs
60% 100%
™Junction box: 60%™Cables between junction box and PV module: 60%™Cables between junction box and connection box: 60%™PCS: Number reduced by use of 1,000 V DC large-capacity equipment™Construction costs: Reduced because there are fewer wires and units to install
™Junction box: 100%™Cables between junction box and PV module: 100%™Cables between junction box and connection box: 60%™PCS: 600 V DC unit™Construction costs: Proportional to number of wires and units to install
* Transmission losses = Current2 × cable resistanceBecause the solar cell current is the same for both systems, the transmission losses are proportional to the cable resistance (the length of the cables if they have the same diameter).
PCSPVmodule
Junc-tionbox
Con-nection
box
Trans-former
Distri-butionboard
Electric power
company distribution
system
Trans-former
Distri-butionboard
Electric power
company distribution
system
1,000 V DC AC
PCSPVmodule
Junc-tionbox
Con-nection
box
600 V DC AC
Junction box
Number of parallel circuits (100%)
Number of series circuits
(160%)
Circuit voltage1,000 V DC
Number of parallel circuits (60%)
Number of series circuits
(160%)
Circuit voltage1,000 V DC
Junction box
Less parallel and more seriescircuits compared with
600 V DC circuit
Table 1 Comparison of 600 V and 1,000 V DC distribution systems
Fig.5 Overview of Abu mega-solar plant (Photograph supplied by the Okinawa Electric Power Company, Incorporated)
GPS antenna (installed outdoors)
Remotemonitoring
controlpanel
Measurement and status information Hard disk (RAID1)
Data storage for 3 years
Control information
OperationDisplay of status
Reference to past data
Dedicated optical line
UPS
From power supply panel in the plant100V AC
Surveillancecameras(Outdoors) × 1(Indoors) × 2
PC for operating surveillance cameras
Recorder
Transfer trip equipment (receiving device)
Solar irradianceAir temperaturePower generatedAmount of power generatedNo. of households covered
Electronic bulletin board showing power generated
PC for monitoringcontrol operationPower plant
PCSP
Photovoltaic power generation facilities
Distribution pillar box
Transfer trip equipment (transmitting device)
OperationDisplay of status
Reference to past data
Display of statusReference to
past data
Display of statusReference to
past data
Head office
×3
Nago Branch
×1×1
Terminal for monitoring and control
Terminal for monitoring
Terminal for monitoring
Fig.6 Outline of the Abu mega-solar plant system

121Technology for Large-Scale Photovoltaic Power Generation Systems
Issu
e: E
nerg
y C
reat
ion
Tech
nolo
gies-
Pow
er P
lant
s an
d N
ew E
nerg
y
the power plant and the head offi ce, and moni-toring at a branch.
(b) Generated power output control and reactive power control have been realized.
(c) It is possible to compare the amount of power generated, etc., for different angles of array in-stallation.
(d) Large-capacity 500kW PCS×2 systems are used.
4. Large-Capacity Power Conditioners The demands placed on mega solar are for a re-
duction of the unit cost per watt for the solar cells, as well as for high reliability and a reduction of the power generation unit price of the PCS, which is a major com-ponent. For this reason, it is necessary for the PCS to realize high effi ciency, reduced total costs and the high reliability necessary for connection to the power sys-tem.
For these reasons, Fuji Electric commercialized the “ PVI1000 Series ” and “ PVI750 Series, ” which realize these aims. Figure 7 shows the external appearance of the PVI1000 Series and Fig. 8 shows the external ap-pearance of the PVI750 Series.
Table 2 shows the PCS specifi cations. The main characteristics are as follows.
(a) An advanced T-type neutral-point-clamped (AT-NPC) 3-level insulated gate bipolar transistor module is used to achieve the global top level ef-fi ciency of 98.5%.(1)
(b) Both the 1,000 kW and 750 kW PCS are substa-tion types that integrate the step-up transform-er and PCS on a common base and they can be installed outdoors. A standard specifi cation and a salt-tolerant specifi cation have been prepared to suit the installation location. Cooling by air conditioner was made unnecessary to reduce in-stallation costs. Cooling is possible with just the built-in fan, and the power supply capacity for cooling is around 2 kW.
(c) To achieve high reliability, a fault ride through
(FRT) function was included as standard.(1)
(d) The AC circuits and DC circuits of the 250 kW unit have been placed in a parallel confi gura-tion, and even if one of the units fails, the Fuji
Fig.7 “PVI1000 Series”
Fig.8 “PVI750 Series”
Table 2 PCS specifi cations
ItemProduct
PVI1000-3/1000
PVI750-3/750
PVI750-3/500
Rated output 1,000 kW 750 kW 500 kW
Max. DC input voltage 1,000 V 750 V 750 V
DC input voltage (MPPT control range)
460 to 850 V 320 to 700 V 320 to 700 V
No. of DC input branch circuits
4(Optional: 24)
4(Optional: 24) 5
PCS output voltage
270 V AC(−12 to +10%)
200 V AC(±10%)
200 V AC(±10%)
Equipment’s max. effi ciency(without power loss for internal
control)
98.5% 97.8% 97.7%
Installation location / method
Outdoor pack-age (built-in PCS + TR +
LBS)
Outdoor pack-age (built-in PCS + TR +
LBS)
Indoors (PCS and DC
input panel) (Separate hous-ing necessary
if installed outdoors)
Cooling method Forced air cool-ing
Forced air cool-ing
Forced air cool-ing (Separate
air conditioning equipment is
necessary)
DimensionsW 6,150×D 2,400×
H 2,830 (mm)
W 6,150×D 2,400×
H 2,830 (mm)
W 2,400×D 900×
H 1,950 (mm)
Mass
About 13,000 kg (including step-up TR + LBS panel)
About 12,200 kg (including step-up TR + LBS panel)
About 2,000 kg (PCS and DC input panel)
Acoustic noise 85 dB or below 85 dB or below 75 dB or below

122 FUJI ELECTRIC REVIEW vol.59 no.2 2013
Electric service personnel can remove the failed unit and operations can continue using the sound units remained.
(e) The 1,000 kW PCS has a maximum DC input voltage of 1,000 V, which is the global standard. Furthermore, as a safety standard for the equip-ment, third-party certifi cation was obtained for IEC 62109 (Safety of power converters for use in photovoltaic power systems).
5. Monitoring Control System for Mega Solar
Monitoring control systems for mega solar play an
important role in the power generation status of the power plant, the early detection of failures on equip-ment such as PV module , connection box and PCS, the understanding of the operating status of the equip-ment and the long term maintenance and operation.
Specifi cally, these include the early discovery of equipment failure through the collection of data and the communications network etc., the improvement of the operating ratio of the power plant through preven-tative maintenance based on equipment trend analysis and also the reduction of maintenance and operation expenses through the reduction of maintenance and inspection work hours at the site. These make a con-tribution to the maximization of profi t for the power generation company.
Fuji Electric’s monitoring control system for pho-tovoltaic power generation plants was developed based on CitectSCADA, a general-purpose SCADA package. For this reason, in addition to being able to support power generation facilities from various manufactur-ers, it also has high reliability and high scalability.
5.1 Monitoring control system confi guration
Figure 9 shows the confi guration of the monitor-ing control system. The remote station (RS) panels
that perform data collection and the communications network equipment are placed in the area of the mega solar installation. A master data collection device and monitoring server are placed in the “Center.” When PCS of Fuji Electric is used, it is possible to integrate the RS panel functions into the PCS.
In addition, the data communications are compli-ant with hardware confi gurations such as Ethernet and RS-485 and open protocols such as TCP/IP and MODBUS. Furthermore, if a wide area network envi-ronment is used, it is also possible to perform monitor-ing control from a remote location.
5.2 Characteristics of monitoring control system The monitoring control system is built based on
the highly functional monitoring control SCADA pack-age (CitectSCADA), and it has the following character-istics.
(a) CitectSCADA has been accepted widely in vari-ous fi elds such as social infrastructure and in-dustry. It already has a track record of over 50,000 licenses supplied around the world and it is highly reliable.
(b) It is designed for web servers and for display servers, and has high speed, extensibility and redundancy.
(1) High speed Data communications are continually op-
timized and unnecessary communications are reduced so that, even on large-scale systems, it achieves high-speed data collection and display.
(2) Extensibility The measurement signals can be increased
from 75 points to 400,000 points and various systems from small-scale to large-scale confi gu-rations can be supported.
(3) Redundancy In the construction of communications and
servers, completely redundant confi gurations are possible with just simple settings. This real-izes a safe system on which operations will not be damaged even if a problem occurs with the network or a server.
(c) The fi ve functions of I/O, alarms, trends, dis-plays and reports can be split into multiple serv-ers to fi t the scale of the system, and various systems up to extremely large-scale system can be realized.
(d) The web function and multilingual function make it possible to obtain information on the photovoltaic power generation system at any time and from any location around the world.
5.3 Functional Structure of Monitoring Control System
The main targets monitored by the monitoring con-trol system are as follows:
(a) System interconnection facilities (b) PCS
Photovoltaic power generation facilities
System interconnection
facilities
Remote monitoring control area
Photovoltaic power generation plant
Extra-high voltage and high voltage incoming panel
AI: Signal line
AI: Signal line
RS-485
(Pu
rch
asin
g po
wer
)
(Sel
lin
g po
wer
)
RS panel RS panel RS panel RS panel
Center
Monitoring server
Pyra-nometer
Pyra-nometer
Thermom-eter
Thermom-eter
PC for remote monitoring control (CitectSCADA)
Network (WAN/VPN/FOMA network)
MODBUS etc.
Photovoltaic power generation facilities
Master data collection device
Fig.9 Monitoring control system confi guration

123Technology for Large-Scale Photovoltaic Power Generation Systems
Issu
e: E
nerg
y C
reat
ion
Tech
nolo
gies-
Pow
er P
lant
s an
d N
ew E
nerg
y
companies for a restriction of the generated output. It is possible to fl exibly confi gure these various extension functions.
6. Measures for Microgrids
The output of photovoltaic power generation and
other renewable energies is unstable because it is af-fected by environmental conditions such as the solar radiation and temperature at the place of installation. In the future, when there is large-scale connection of these to the power grid, there is concern that there may be adverse effects on the power grid, for example, from the generation of surplus power, voltage fl uctua-tions and frequency fl uctuations. Solutions must be found to these issues.
Fuji Electric has realized the balanced operation of diesel power generation together with renewable energies such as photovoltaic power generation and wind power generation with systems using a stabi-lizer with storage batteries and capacitors for remote islands power systems in the Kyushu Electric Power Company, Incorporated and The Okinawa Electric Power Company, Incorporated. These systems are verifi cation facilities for microgrids aiming to reduce CO 2 and lower the cost of power generation.(2) The proliferation of the technologies verifi ed is expected as they are systems that absorb the changes in demand and the fl uctuations in output from renewable energy sources in the region by having facilities to store the electric power, and as they are also systems that are kind to the network and do not affect the existing elec-tric power. At the same time, these technologies can be utilized as system interconnection technology for mega solar.
7. Postscript Mega solar is a system of power generation that
contributes to the prevention of global warming and the protection of the global environment, and it is ex-pected that its proliferation will continue for the time being through the “Feed-in Tariff Scheme for renew-able energy.” We will utilize the technologies we have accumulated so far in distribution system control and microgrids, and will work at large-scale photovoltaic power generation that considers the effects on the power network. We will also continue to develop and apply new technologies to offer systems that match the requirements of the market.
Reference (1) Fujii, K. et al. “PVI1000”: Outdoor High-Effi ciency
Power Conditioners for Mega Solar Projects. FUJI ELECTRIC REVIEW. 2012, vol.58, no.4, p.202-206.
(2) Kojima, T., Fukuya, Y. Microgrid System for Isolated Islands. FUJI ELECTRIC REVIEW. 2011, vol.57, no.4, p.124-129.
(c) Photovoltaic power generation facilities ( Junction boxes and connection boxes ) (d) Meteorological and other environmental data
Table 3 shows the standard monitoring screens and the main functions. Figure 10 shows examples of moni-toring screens.
Fuji Electric’s monitoring control system has the standard monitoring control functions and optional functions to meet the individual requirements of cus-tomers. Examples of this include linking with other systems through the automatic generation of CSV fi les and control of the number of PCS units, which is per-formed to respond to requests from the electric power
Table 3 Standard monitoring screens and main functions
Standard monitoring screens Main functions
Wide area monitoring overview
Individual area overviewSkeleton monitoring screen
Power generation status monitoring screen
Meteorological data screenTrend monitoring screenAlarm monitoring screen
Web functionMultilingual function
Process analyst functionSecurity function
Mail sending functionReporting function (Annual, monthly and daily reports)
Function for linking to other systems
(a) Wide area monitoring overview
(b) Skeleton monitoring screen
Fig.10 Example of monitoring screens

A B S T R A C T
† Corporate R&D Headquarters, Fuji Electric Co., Ltd.
124
1. Introduction The introduction of renewable energy is about to
be accelerated by the “Feed-in Tariff Scheme for re-newable energy,” which was initiated in July 2012. Although conventional wind power generation was mainly done on land, development of offshore wind power generation has accelerated because it has few restrictions in terms of increasing capacity to improve power generation effi ciency and selecting from avail-able installation locations, and because the wind condi-tions offshore are stable. For large-volume introduc-tion of wind power generation in the future, it is be-coming essential to improve power quality. Therefore, this paper describes a power conditioner (PCS) that alleviates changes in the amount of wind power gen-eration and contributes to higher power quality, and it also describes circuit technology and control technology on converters for wind power generation.
2. PCS for Power Stabilization
2.1 Structure of wind power generation system with stor-
age battery The basic structure of a wind power generation
system with a storage battery is indicated in Fig. 1. This system is a method of converting the output of a wind power generator to direct current via an AC/DC converter, which is connected to a synchronous genera-tor, and interconnecting to a system by conversion to alternating current via a DC/AC converter. In wind power generation, the amount of power generated is in proportion to the cube of the wind speed; therefore, only a subtle fl uctuation in wind speed causes a large fl uctuation in the amount of electric power generated.
UMEZAWA Kazuyoshi † UEHARA Fukashi † YAMADA Toshiya †
The Circuit and Control Technology in the Power Conditioner and Converter for Wind Turbine Systems
Because the generating power of wind turbines fl uctuates according to changes in wind speed, this affects sys-tem voltage. To enable large-scale implementation of wind turbines, power system supply quality is demanded. Power conditioning subsystems are available for stabilizing power as a means to compensate for fl uctuations in pow-er supply. Using an AT-NPC 3-level conversion circuit, we have greatly reduced switching loss in IGBT devices and also, by halving harmonic components, we have reached 98.1% effi ciency, the highest in the industry. Moreover, we have achieved power supply quality suffi cient for grid connection by incorporating a fault ride through function so that the system continues to operate without disconnecting even if there is a drop in system voltage due to lightning strike or other causes.
There is a concern about prompting voltage fl uctua-tions or frequency fl uctuations in power grids, which would lead to deterioration in electric power quality, when the number of wind power systems increases in the future. A PCS for electrical power stabiliza-tion eliminates such concern. For an electrical power storage section, select a lead-acid battery, lithium ion battery, or other type of battery according to the use. Electric power fl uctuations in wind power generation are stabilized by means of controlling battery charging and electric discharging of the electrical power storage section by using a DC/AC converter.
2.2 PCS for electrical power stabilization “PVI750-3/500”
Figure 2 indicates the external appearance of PCS for electrical power stabilization, “PVI750-3/500.” (1) System structure
PVI750-3/500 is comprised of two 250 kW invert-ers (see Fig. 3). In order to replace and maintain stor-age batteries individually, two secondary-side direct
PMSG AC/DC DC/AC
System
Power generation
Converter forwind power generation
Electricalpower
storageDC/AC
Electricdischarge
Batterycharging
Power conditioner forelectrical power stabilization
Electrical powerfluctuation
*PMSG:Permanent Magnet Synchronous Generator
Electricalpower leveling
Absorption of electricalpower fluctuation
Fig.1 Basic structure of wind power generation system with storage battery

125The Circuit and Control Technology in the Power Conditioner and Converter for Wind Turbine Systems
Issu
e: E
nerg
y C
reat
ion
Tech
nolo
gies-
Pow
er P
lant
s an
d N
ew E
nerg
y
current input breakers are connected to one direct cur-rent link. During start up, it is possible to complete start-up without generating a rush current in the sys-tem by interconnecting to the system by turning the contactor on while each inverter outputs the voltage, which was synchronized with the system.
The power unit of the inverter is comprised of an IGBT module of an advanced T-type neutral-point-clamped (AT-NPC) 3-level, fuse, and LCL fi lter (see Fig. 4). Although a 3-level converter circuit has al-ready been proposed in the 1980s, it did not become
popular because it was not possible to increase the withstand voltage of the insulated gate bipolar transis-tor (IGBT) element. However, there is a merit that the number of element passages of output current can be reduced and as a result, conductor loss can be reduced in the inverter that does not require elements to be connected in series.
Fuji Electric made practical use of the AT-NPC 3-level IGBT module (1) in which reverse-blocking IGBT (RB-IGBT) (2) is applied to the switch that connects the direct current intermediate and AC output, which re-quires reverse withstand voltage. As a result, we pro-duced a 3-level inverter comprised of the same number of modules as the existing 2-level inverter and it was possible to achieve a highly effi cient inverter without making the circuit complicated. (2) Specifi cations
Table 1 shows the specifi cations of PVI750-3/500. The range of the direct current voltage corresponds to 750 V DC, with which construction at low voltage is possible, and the AC voltage output by the PCS is 200 V. In addition, Fig. 5 indicates the effi ciency curve. By using a conversion circuit for which an AT-NPC
Fig.2 “PVI750-3/500”
Power conditioner
Dir
ect
curr
ent
inpu
t
-~
-~
Inverter 1
Inverter 2
DCinput
breaker
ACoutputbreaker
DCinput
breaker
Powerunit 1
Powerunit 2
ACfilter
Electro-magneticcontactorfor system
LBSHigh-
voltageTR
Power grid
for com-mercial
use
Fig.3 System structure of “PVI750-3/500”
AT-NPC3-levelIGBT module
+
+
RB-IGBT
Fig.4 Power unit and fi lter circuit
Table 1 Specifi cations of “PVI750-3/500”
Item Specifi cations
Capacity 500 kVA
DC voltage range 310 to 750 V
Maximum input current 1,600 A
AC voltage 200 V (−10 to +10%)
Frequency 50/60 Hz
Power-factor 0.99
Harmonic distortion factor 5% or below
Highest effi ciency* 98.10%
EU effi ciency* 97.80%
Maximum value of internal power capac-ity 900 W
Stand-by loss 130 W
* Indicate IEC-61683 effi ciency tolerance, excluding internal power source
Load factor (%)
0 20 40 60 80 100
100
98
96
94
92
90
88
Eff
icie
ncy
(%
)
500 V 700 V320 V
Fig.5 Effi ciency curve

126 FUJI ELECTRIC REVIEW vol.59 no.2 2013
3-level IGBT module is applied, the switching loss of the power unit was signifi cantly reduced. Furthermore, by halving the harmonic contained in the pulse width modulation (PWM) waveform that the inverter outputs reduced by one half compared to conventional products, fi lter loss was reduced and the highest effi ciency in the industry of 98.1% (according to IEC-61683 effi ciency tolerance, excluding internal power supply) was achieved. (3) Characteristics (FRT performance and inverter
control method) An fault ride through (FRT) function, which is
becoming a prerequisite for new energy sources, is mounted on PVI750-3/500 as standard. The FRT function is used to allow for continuous operation by enabling the inverter to output a three-phase current within the specifi ed range (within the instantaneous voltage drop time and voltage drop required in each country) and suppress electric power fl uctuation of the system even if system three-phase short-circuit and two-phase short-circuit occur. This FRT function be-came mandatory in the EU and USA and it is manda-tory for devices that are to be introduced from FY2013 in Japan. In addition, the residual voltage and con-tinuation time required as an FRT function differ de-pending on the country. As a result, in order to enable continuous operation even with 0% of residual voltage, it became possible for the controlled source to select either external supply or self-supply from the system. Power fl ickers that last no more than one second are backed up by an internal condenser and there is an option to be able to have continuous time of FRT that exceeds one second. As a result, it has become possible to achieve the requirements from both cost and specifi -cation aspects.
The FRT function of operational verifi cation was performed with a control verifi cation machine (10 kW). By putting residual voltage 0% constantly into a gate lock state and by performing 0 A control, operation is continued. As shown in Fig. 6, it was confi rmed that at residual voltage 20%, spasmodic gate lock no lon-ger occurs from 6 ms after occurrence of instantaneous voltage drop and it is possible to output a rated current after about 2 cycles. By doing so, it is confi rmed that
PCS can continue operating when an instantaneous voltage drop occurs.
3. Converter for Wind Power Generation
Figure 7 indicates the structure when a wind pow-
er generator is a multi-winding type. Two converter boards of 1,500 kVA are connected in parallel.
A converter board is comprised of 3-parallel DC/AC converters as a water cooling power unit of 500 kVA, chopper, and resistance for energy consump-tion. This chopper is used to control the DC/AC con-verter so that the direct current intermediate voltage does not go up at times such as when a system ab-normality occurs. A water cooling power unit has a plug-in structure and there are three in parallel, and the converter board consists of two boards in parallel. Therefore, maintainability was improved and when a failure occurs, it is possible to operate with the sound section; as a result, operating ratio was improved. Table 2 indicates the specifi cations of a converter for wind power generation
3.1 Water cooling power unit
Water cooling power unit that uses IGBT
Time (s)
0.00 0.02 0.04 0.06 1.00 1.02 1.04
AC
vol
tage
(V
)A
C c
urr
ent
(A)
200
V/D
IV25
A/D
IV
U-V phase
V-W phase
W-U phase
V phaseW phaseU phase
0 position
Fig.6 Operation verifi cation wave of FRT function
PMSG
AC/DC converter DC/AC converter
Chopper
Resistance500 kW
power unit Converterpanel
*PMSG:Permanent Magnet Synchronous Generator
Fig.7 Wind power generation system (synchronous power generator)
Table 2 Specifi cations of converter for wind power generation
Item Specifi cations
Capacity 1,500 kVA×2 (3,000 kVA)
Rated effective power 1,350 kW
Rated reactive power 650 kVar
Rated voltage 690 V
Rated current 1,255 A
Frequency 50/60 Hz
Power-factor 0.99
Harmonic distortion 5% or below
Highest effi ciency 97.20%
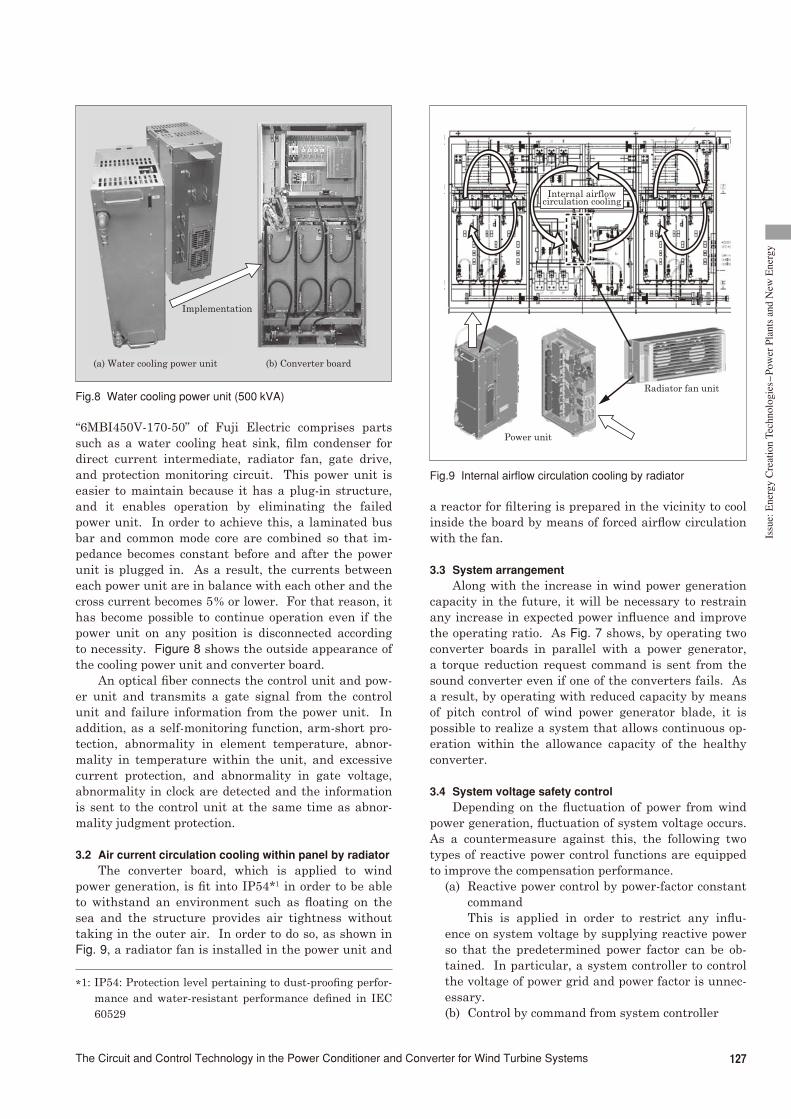
127The Circuit and Control Technology in the Power Conditioner and Converter for Wind Turbine Systems
Issu
e: E
nerg
y C
reat
ion
Tech
nolo
gies-
Pow
er P
lant
s an
d N
ew E
nerg
y
a reactor for fi ltering is prepared in the vicinity to cool inside the board by means of forced airfl ow circulation with the fan.
3.3 System arrangement
Along with the increase in wind power generation capacity in the future, it will be necessary to restrain any increase in expected power infl uence and improve the operating ratio. As Fig. 7 shows, by operating two converter boards in parallel with a power generator, a torque reduction request command is sent from the sound converter even if one of the converters fails. As a result, by operating with reduced capacity by means of pitch control of wind power generator blade, it is possible to realize a system that allows continuous op-eration within the allowance capacity of the healthy converter.
3.4 System voltage safety control
Depending on the fl uctuation of power from wind power generation, fl uctuation of system voltage occurs. As a countermeasure against this, the following two types of reactive power control functions are equipped to improve the compensation performance.
(a) Reactive power control by power-factor constant command This is applied in order to restrict any infl u-
ence on system voltage by supplying reactive power so that the predetermined power factor can be ob-tained. In particular, a system controller to control the voltage of power grid and power factor is unnec-essary. (b) Control by command from system controller
“6MBI450V-170-50” of Fuji Electric comprises parts such as a water cooling heat sink, fi lm condenser for direct current intermediate, radiator fan, gate drive, and protection monitoring circuit. This power unit is easier to maintain because it has a plug-in structure, and it enables operation by eliminating the failed power unit. In order to achieve this, a laminated bus bar and common mode core are combined so that im-pedance becomes constant before and after the power unit is plugged in. As a result, the currents between each power unit are in balance with each other and the cross current becomes 5% or lower. For that reason, it has become possible to continue operation even if the power unit on any position is disconnected according to necessity. Figure 8 shows the outside appearance of the cooling power unit and converter board.
An optical fi ber connects the control unit and pow-er unit and transmits a gate signal from the control unit and failure information from the power unit. In addition, as a self-monitoring function, arm-short pro-tection, abnormality in element temperature, abnor-mality in temperature within the unit, and excessive current protection, and abnormality in gate voltage, abnormality in clock are detected and the information is sent to the control unit at the same time as abnor-mality judgment protection.
3.2 Air current circulation cooling within panel by radiator
The converter board, which is applied to wind power generation, is fi t into IP54* 1 in order to be able to withstand an environment such as fl oating on the sea and the structure provides air tightness without taking in the outer air. In order to do so, as shown in Fig. 9, a radiator fan is installed in the power unit and
(a) Water cooling power unit
Implementation
(b) Converter board
Fig.8 Water cooling power unit (500 kVA)
Power unit
Radiator fan unit
Internal airflowcirculation cooling
Fig.9 Internal airfl ow circulation cooling by radiator
*1: IP54: Protection level pertaining to dust-proofi ng perfor-mance and water-resistant performance defi ned in IEC60529
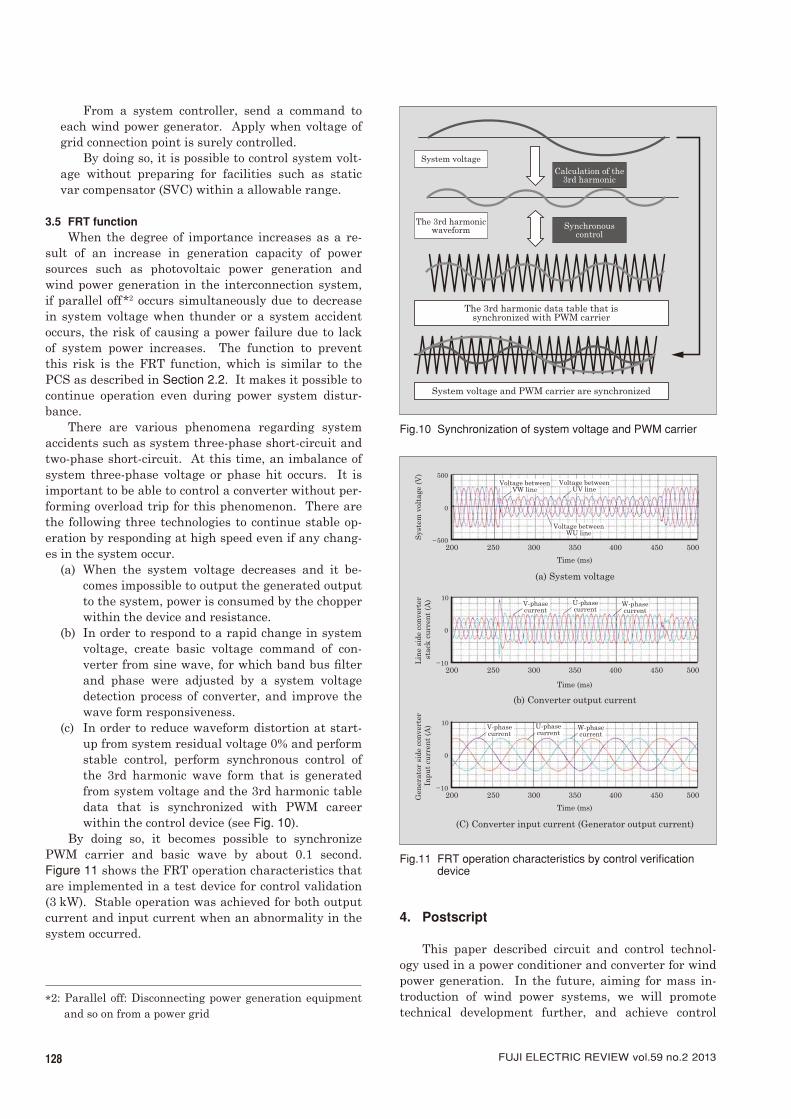
128 FUJI ELECTRIC REVIEW vol.59 no.2 2013
4. Postscript This paper described circuit and control technol-
ogy used in a power conditioner and converter for wind power generation. In the future, aiming for mass in-troduction of wind power systems, we will promote technical development further, and achieve control
From a system controller, send a command to each wind power generator. Apply when voltage of grid connection point is surely controlled.
By doing so, it is possible to control system volt-age without preparing for facilities such as static var compensator (SVC) within a allowable range.
3.5 FRT function
When the degree of importance increases as a re-sult of an increase in generation capacity of power sources such as photovoltaic power generation and wind power generation in the interconnection system, if parallel off* 2 occurs simultaneously due to decrease in system voltage when thunder or a system accident occurs, the risk of causing a power failure due to lack of system power increases. The function to prevent this risk is the FRT function, which is similar to the PCS as described in Section 2.2. It makes it possible to continue operation even during power system distur-bance.
There are various phenomena regarding system accidents such as system three-phase short-circuit and two-phase short-circuit. At this time, an imbalance of system three-phase voltage or phase hit occurs. It is important to be able to control a converter without per-forming overload trip for this phenomenon. There are the following three technologies to continue stable op-eration by responding at high speed even if any chang-es in the system occur.
(a) When the system voltage decreases and it be-comes impossible to output the generated output to the system, power is consumed by the chopper within the device and resistance.
(b) In order to respond to a rapid change in system voltage, create basic voltage command of con-verter from sine wave, for which band bus fi lter and phase were adjusted by a system voltage detection process of converter, and improve the wave form responsiveness.
(c) In order to reduce waveform distortion at start-up from system residual voltage 0% and perform stable control, perform synchronous control of the 3rd harmonic wave form that is generated from system voltage and the 3rd harmonic table data that is synchronized with PWM career within the control device (see Fig. 10).
By doing so, it becomes possible to synchronize PWM carrier and basic wave by about 0.1 second. Figure 11 shows the FRT operation characteristics that are implemented in a test device for control validation (3 kW). Stable operation was achieved for both output current and input current when an abnormality in the system occurred.
System voltage and PWM carrier are synchronized
The 3rd harmonic data table that issynchronized with PWM carrier
The 3rd harmonicwaveform
System voltage
Synchronouscontrol
Calculation of the3rd harmonic
Fig.10 Synchronization of system voltage and PWM carrier
*2: Parallel off: Disconnecting power generation equipment and so on from a power grid
(a) System voltage
500
0
–500Sys
tem
vol
tage
(V
)
Time (ms)
200 250 300 350 450400 500
(b) Converter output current
10
0
–10Lin
e si
de c
onve
rter
sta
ck c
urr
ent
(A)
Time (ms)
200 250 300 350 450400 500
(C) Converter input current (Generator output current)
10
0
–10
Gen
erat
or s
ide
con
vert
er
Inpu
t cu
rren
t (A
)
Time (ms)
200 250 300 350 450400 500
V-phasecurrent
U-phasecurrent
W-phasecurrent
Voltage betweenWU line
Voltage betweenVW line
Voltage betweenUV line
V-phasecurrent
U-phasecurrent
W-phasecurrent
Fig.11 FRT operation characteristics by control verifi cation device

129The Circuit and Control Technology in the Power Conditioner and Converter for Wind Turbine Systems
Issu
e: E
nerg
y C
reat
ion
Tech
nolo
gies-
Pow
er P
lant
s an
d N
ew E
nerg
y
Reference (1) Yatsu, M. et al. “A Study of High Effi ciency UPS
Using Advanced Three-level Topology.” PCIM Europe Conference, 2010.
(2) Nakazawa, H. et al. “Hybrid isolation process with deep diffusion and V-groove for reverse blocking IGBTs.” ISPSD, 2011.
technology and power conversion circuit technology.
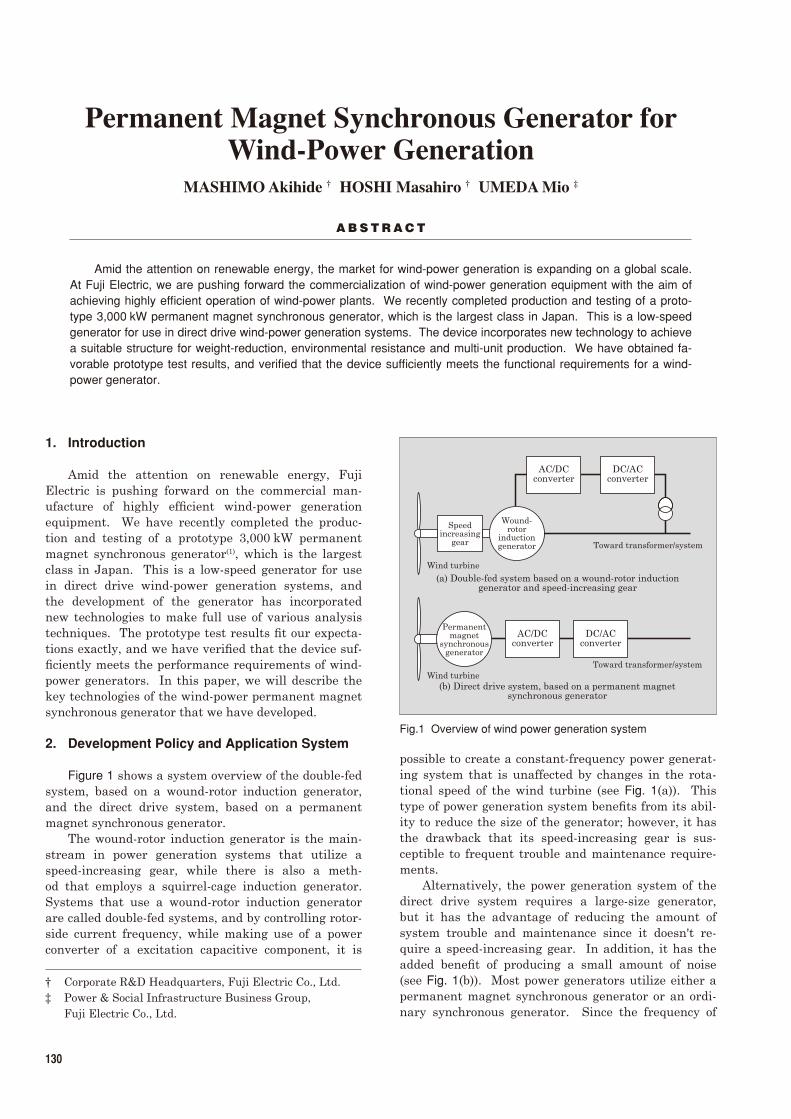
A B S T R A C T
† Corporate R&D Headquarters, Fuji Electric Co., Ltd. ‡ Power & Social Infrastructure Business Group,
Fuji Electric Co., Ltd.
130
1. Introduction Amid the attention on renewable energy, Fuji
Electric is pushing forward on the commercial man-ufacture of highly effi cient wind-power generation equipment. We have recently completed the produc-tion and testing of a prototype 3,000 kW permanent magnet synchronous generator (1) , which is the largest class in Japan. This is a low-speed generator for use in direct drive wind-power generation systems, and the development of the generator has incorporated new technologies to make full use of various analysis techniques. The prototype test results fi t our expecta-tions exactly, and we have verifi ed that the device suf-fi ciently meets the performance requirements of wind-power generators. In this paper, we will describe the key technologies of the wind-power permanent magnet synchronous generator that we have developed.
2. Development Policy and Application System
Figure 1 shows a system overview of the double-fed
system, based on a wound-rotor induction generator, and the direct drive system, based on a permanent magnet synchronous generator.
The wound-rotor induction generator is the main-stream in power generation systems that utilize a speed-increasing gear, while there is also a meth-od that employs a squirrel-cage induction generator. Systems that use a wound-rotor induction generator are called double-fed systems, and by controlling rotor-side current frequency, while making use of a power converter of a excitation capacitive component, it is
MASHIMO Akihide † HOSHI Masahiro † UMEDA Mio ‡
Permanent Magnet Synchronous Generator for Wind-Power Generation
Amid the attention on renewable energy, the market for wind-power generation is expanding on a global scale. At Fuji Electric, we are pushing forward the commercialization of wind-power generation equipment with the aim of achieving highly effi cient operation of wind-power plants. We recently completed production and testing of a proto-type 3,000 kW permanent magnet synchronous generator, which is the largest class in Japan. This is a low-speed generator for use in direct drive wind-power generation systems. The device incorporates new technology to achieve a suitable structure for weight-reduction, environmental resistance and multi-unit production. We have obtained fa-vorable prototype test results, and verifi ed that the device suffi ciently meets the functional requirements for a wind-power generator.
possible to create a constant-frequency power generat-ing system that is unaffected by changes in the rota-tional speed of the wind turbine (see Fig. 1(a)). This type of power generation system benefi ts from its abil-ity to reduce the size of the generator; however, it has the drawback that its speed-increasing gear is sus-ceptible to frequent trouble and maintenance require-ments.
Alternatively, the power generation system of the direct drive system requires a large-size generator, but it has the advantage of reducing the amount of system trouble and maintenance since it doesn't re-quire a speed-increasing gear. In addition, it has the added benefi t of producing a small amount of noise (see Fig. 1(b)). Most power generators utilize either a permanent magnet synchronous generator or an ordi-nary synchronous generator. Since the frequency of
Speedincreasing
gear
(a) Double-fed system based on a wound-rotor inductiongenerator and speed-increasing gear
(b) Direct drive system, based on a permanent magnetsynchronous generator
Wound-rotor
inductiongenerator Toward transformer/system
Permanentmagnet
synchronousgenerator
Toward transformer/system
Wind turbine
Wind turbine
AC/DCconverter
DC/ACconverter
AC/DCconverter
DC/ACconverter
Fig.1 Overview of wind power generation system

131Permanent Magnet Synchronous Generator for Wind-Power Generation
Issu
e: E
nerg
y C
reat
ion
Tech
nolo
gies-
Pow
er P
lant
s an
d N
ew E
nerg
y
the output power of the generator varies depending on the changes of the rotational speed of the wind tur-bine, a power converter for the capacitive component is required. On the other hand, since power is supplied through the converter, it becomes possible to respond to a wide range of wind speeds. This produces many operating advantages, such as improvements in the power generation effi ciency in low wind speed ranges(2), in particular. Many wind power generators are of-ten installed at a site. Herefore, our development ef-forts have resulted in the adoption of a structure that is especially suited for highly effi cient production of large-size generators. In order to obtain performance suitable for wind power generators, we carried out our development according to the following policy:
(a) Adoption of a structure suitable for multi-unit production
(b) Reduction of weight and external dimensions in consideration of land transport
(c) Insulating structure that is environmentally re-sistant
3. Specifi cation and Structure of Prototype
3.1 Specifi cation of prototype
The external appearance of the prototype is shown in Fig. 2, and the specifi cations in Table 1. The output of the generator is in 3,000 kW class, which is the larg-est class in Japan. The rotational frequency is 15 min -
1 assuming a general rotational speed for this class of wind turbines. Furthermore, a rotary shaft structure was adopted so that testing could be undertaken in a factory. The structure enabled direct connection to the drive unit. In addition, the basic design of the pe-ripheral structure was carried out using a structure that assumed a connection with the actual wind tur-bine, and after this, insertion to the structure of the prototype was performed. Cooling is performed by air-cooling to the frame surface and internals, with fi ns attached to the frame surface under the assumption of external placement in direct connection to the wind turbine. The entire mass of the prototype has seen a signifi cant reduction, resulting in a weight of 75 t. In general, the size of an electrical rotating machine is proportional to the magnitude of the torque, but with regard to the mass per magnitude of torque, it has a value that is smaller by one order of magnitude when compared with water turbine generators.
3.2 Structure of the prototype
In accordance with our development policy, we ad-opted the following characteristic structures in order to achieve weight reduction and improve manufacturing effi ciency. (1) Structure of stator
The outer shape of the stator exceeded a diameter of 4 m, and this gave us some concern as we proceeded to the next phase of the production process. We were worried that production effi ciency might suffer from large parts being positioned in a wide space. In order to solve this problem, we used a split iron core for the stator and proceeded to assemble each split core and windings. Finally, we mounted the split core to the in-ner diameter of the stator frame and utilized a manu-facturing technique for assemblage to a cylindrical stator. Split core structures are commonly employed in large-diameter generators such as water turbine generators. Since the width of the winding pitch is large and the windings can span between different split cores, the insertion of some of the windings was performed after the cores were assembled.
By adopting the concentrated winding method described below for the windings of the prototype, we were able to completely deal with each split core, achieving a state wherein all of the windings were in-corporated into the cores. Figure 3 shows a comparison between conventional distributed winding coils and the relationship of split cores and coils. (2) Structure of winding
As mentioned previously, the concentrated winding method that has been adopted for the stator winding is a method that is often employed in compact rotating machines such as servomotors. Usually, round enamel coated wire is often used.
Since the prototype is a large capacity unit, con-centrated winding was performed while using rect-angular copper wire. As shown in Fig. 4, the winding
Fig.2 3,000 kW permanent magnet synchronous generator prototype for wind-power generation
Table 1 Specifi cation of 3,000 kW permanent magnet synchronous generator prototype for wind-power generation
Item Specifi cations
Output 3,000 kW
Rotational speed 15 min–1
Voltage 690 V
Effi ciency 94.7%
Cooling system Frame surface + internal cooling
Temperature rise F class

132 FUJI ELECTRIC REVIEW vol.59 no.2 2013
pitch of traditional distributed windings is wide and results in a diamond winding. This, in turn, creates excess loss (copper loss) at the part of the coil end that protrudes from the stator core. Alternatively, since concentrated winding can shorten the dimensions of the coil end, the overall length of the power generator can be reduced and the amount of copper loss created at the coil end can be decreased. When the stator core has the same length with regards to the distributed winding, the total length can be reduced by about 150 mm, and it is estimated that loss can also be decreased by approximately 6%. (3) Structure of rotor
The structure of the rotor is the so-called surface permanent magnet (SPM) structure, wherein a per-manent magnet is installed to the surface of the ro-tor. The permanent magnet makes use of a sintered magnet of a high-energy neodymium-iron-boron com-position. When installing to the rotor after magneti-zation, operability will be signifi cantly reduced due to the large suction force. In order to improve this, we employed a method for the structure in which mul-
tiple non-magnetized magnets were attached to an iron magnet pole mounting plate, allowing for the as-sembly of a single magnetic pole, and we, thereafter, made installation to the rotor after magnetization with the single magnetic pole. By using this method, the magnetized fl ux, which entered the air from the mag-netic surface, passed through the circuit that spans the surface on the opposite side via the magnetic pole mounting plate, which consists of a magnetic material. Therefore, rather than directly installing the magne-tized magnet to the rotor, we were able to improve op-erability by reducing the amount of fl ux surrounding the rotor, which, in turn, lowered the amount of suc-tion force. Figure 5 shows that scattering is prevented even in the case that the magnet chips or breaks down. This is accomplished by covering the outer-shell of the magnetic poles with a stainless steel cover plate. Confi guration for a single pole of the generator is made by connecting several of these magnetic poles in the di-rection of the rotor axis.
In addition, cogging torque occurs between the magnet and the core, as a characteristic type of torque pulsation that is created by the permanent magnet unit. As a countermeasure to this, cogging torque was reduced by shifting each of the magnet poles of the single pole to a predetermined angle, thus creating a skew-like positioning. Electromagnetic fi eld analysis was used to verify that cogging torque did not present a problem by comparing it with rated torque and en-suring that it was suffi ciently low. (4) Structure testing for reducing weight
In order to reduce the weight of the generator, the shape confi guration of each part was determined by carrying out structural design via the fi nite element method. As one example of the analysis, Fig. 6 shows the analysis results pertaining to the deformation of the rotor relative to the load of the wind turbine.
Shape confi gurations used for the analysis are structures determined under the assumption of a fi xed shaft according to the installation situation of the wind turbine. The prototype has a different struc-
Coil end spanning split
(b) Distributed winding (conventional)
(a) Concentrated winding
Split point
Coil end
Split point
Fig.3 Core split and coil relationship
Possible toreduce coilend length
(b) Diamond winding (conventional)
(a) Concentrated winding
Fig.4 Winding comparison
Fig.5 Rotor pole (cover attached)

133Permanent Magnet Synchronous Generator for Wind-Power Generation
Issu
e: E
nerg
y C
reat
ion
Tech
nolo
gies-
Pow
er P
lant
s an
d N
ew E
nerg
y
ture. Since a magnet exists on the surface of the rotor, suction is always exerted between the gaps of the ro-tors. In addition , since suction may change depend-ing on whether variation exists in the gaps, analysis was undertaken while giving attention to the changes in suction due to deformations. By using the analysis results, we were able to develop an optimized structure contributing to weight reduction.
3.3 Ventilation and cooling structure
Since improvements in cooling performance greatly contribute to miniaturization, the cooling method of the prototype was carefully designed.
There are no gear units between the hubs of di-rect drive generators, and as a result, they do not need to be installed in the nacelle. Therefore, air that passes through the wind turbine can be used as cool-ing air to cool down the surface of the generator frame.
However, in the case of cooling the frame surface, since thermal resistance is high due to the core and structur-al materials between the windings (i.e., the main heat-ing part) and the frame surface (i.e., the heat radiation part), cooling performance is slightly inferior to inte-rior recirculation air cooling in the vicinity of the coil. As a result of this, we were able to improve the cooling performance for the prototype by implementing a hy-brid cooling system that prioritizes outer-shell cooling, while simultaneously ventilating the interior of the power generator. Figure 7 shows the cooling structure.
The outer-shell fi ns were installed and the air in-side the generator was designed to fl ow through air gaps as well as the vents installed for the core. As confi rmed in the design stage by using a thermal fl uid analysis, the cooling effect obtained a torque density (torque per unit of capacity) of close to 1.5 to 2 times with regards to rotating machines of the general-type outer-shell cooling system .
3.4 Insulation performance
The rated voltage of the prototype is 690 V, but in order to connect to the system via a pulse width modu-lation (PWM) control power converter, it is necessary to consider the surge voltage that is generated from the pulse power supply and the DC intermediate volt-age of the power converter, while also making prepa-ration of insulation specifi cations for higher voltage classes. The DC intermediate voltage is 1,150 V, so a maximum of 2 times the voltage is needed when con-sidering the surge voltage. Therefore, insulation with a withstand voltage of 2,300 V is required.
It is not easy to repair wind power generators when problems occur because they are installed at high altitude locations that are a good distance from the ground. Therefore, the insulation system must be highly reliable. Furthermore, wind power generators are often installed near the shore or close to forests, and since these are environments that are susceptible to high levels of condensation, a system with a high
Higher
Lower
Load point
Rotor
Fixed shaft
Deformation
Fig.6 Results of rotor deformation analysis via a fi xed shaft model
Fin for frame surface cooling
Cooling air to the core teeth vent
Cooling air to the air gap
Fig.7 Flow of cooling air
Time (h)
0 100 700300200 500 600400
106
105
104
103
102
10
1
Fig.8 Insulation resistance and time characteristics (submer-sion test results)
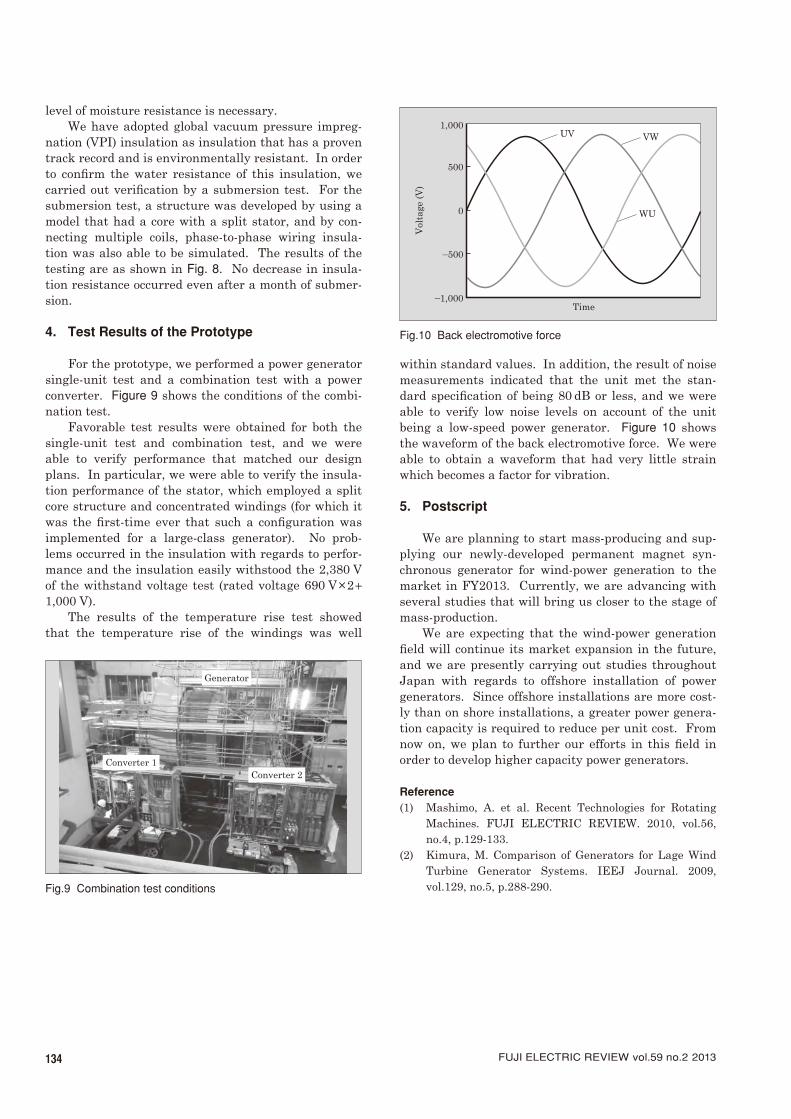
134 FUJI ELECTRIC REVIEW vol.59 no.2 2013
level of moisture resistance is necessary. We have adopted global vacuum pressure impreg-
nation (VPI) insulation as insulation that has a proven track record and is environmentally resistant. In order to confi rm the water resistance of this insulation, we carried out verifi cation by a submersion test. For the submersion test, a structure was developed by using a model that had a core with a split stator, and by con-necting multiple coils, phase-to-phase wiring insula-tion was also able to be simulated. The results of the testing are as shown in Fig. 8. No decrease in insula-tion resistance occurred even after a month of submer-sion.
4. Test Results of the Prototype
For the prototype, we performed a power generator
single-unit test and a combination test with a power converter. Figure 9 shows the conditions of the combi-nation test.
Favorable test results were obtained for both the single-unit test and combination test, and we were able to verify performance that matched our design plans. In particular, we were able to verify the insula-tion performance of the stator, which employed a split core structure and concentrated windings (for which it was the fi rst-time ever that such a confi guration was implemented for a large-class generator). No prob-lems occurred in the insulation with regards to perfor-mance and the insulation easily withstood the 2,380 V of the withstand voltage test (rated voltage 690 V ×2+1,000 V).
The results of the temperature rise test showed that the temperature rise of the windings was well
within standard values. In addition, the result of noise measurements indicated that the unit met the stan-dard specifi cation of being 80 dB or less, and we were able to verify low noise levels on account of the unit being a low-speed power generator. Figure 10 shows the waveform of the back electromotive force. We were able to obtain a waveform that had very little strain which becomes a factor for vibration.
5. Postscript
We are planning to start mass-producing and sup-
plying our newly-developed permanent magnet syn-chronous generator for wind-power generation to the market in FY2013. Currently, we are advancing with several studies that will bring us closer to the stage of mass-production.
We are expecting that the wind-power generation fi eld will continue its market expansion in the future, and we are presently carrying out studies throughout Japan with regards to offshore installation of power generators. Since offshore installations are more cost-ly than on shore installations, a greater power genera-tion capacity is required to reduce per unit cost. From now on, we plan to further our efforts in this fi eld in order to develop higher capacity power generators.
Reference (1) Mashimo, A. et al. Recent Technologies for Rotating
Machines. FUJI ELECTRIC REVIEW. 2010, vol.56, no.4, p.129-133.
(2) Kimura, M. Comparison of Generators for Lage Wind Turbine Generator Systems. IEEJ Journal. 2009, vol.129, no.5, p.288-290.
Generator
Converter 2Converter 1
Fig.9 Combination test conditions
Time
Vol
tage
(V
)
1,000
500
0
–500
–1,000
UV VW
WU
Fig.10 Back electromotive force

Issu
e: E
nerg
y C
reat
ion
Tech
nolo
gies-
Pow
er P
lant
s an
d N
ew E
nerg
y
A B S T R A C T
† Power & Social Infrastructure Business Group,Fuji Electric Co., Ltd.
1. Introduction Since the Great East Japan Earthquake in March
2011, there has been increasing expectation with re-gards to improved power supply security and distrib-uted power sources. In addition, biomass power gen-eration has come to be widely studied since the start of the “Feed-in Tariff Scheme for renewable energy” in July 2012.
Fuji Electric began selling its 100 kW fuel cells in 1998, and since then, the fuel cells have accumulated a track record of usage at a wide range of sites. The fuel cells have often been used for utility gas, but they have also been used for sewage digester gas (i.e., bio-gas) at two sites, which utilize a total of 6 fuel cells. From 2010, we started offering our latest model, the “FP-100i,” to the market. In addition, we have also devel-oped and made delivery to Germany a model that uses the cathode exhaust gas (low-oxygen concentration air) of the fuel cells as a new application.
This paper discusses the development of fuel cells adapted to meet new markets including power-source security use, small-scale sewage treatment plant use as well as EU standard specifi ed with the CE mark.
2. Fuel Cells for Power-Source Security
Figure 1 provides an overview of Fuji Electric’s fuel
cells that correspond to power-source security needs. Diesel generators, which can be put into operation in a short period of time, have been most often used as emergency power generators at times of system fault or blackout due to natural disasters. Although they are economical to implement, they have the drawback
KOSHI Kazuaki † KURODA Kenichi † HORIUCHI Yoshimi †
Development of Fuel Cells Adapted to Meet New Needs
Since the Great East Japan Earthquake, there has been broad investigation into the improvement of the quality of power-source security through introduction of 100 kW fuel cells, which are a highly effi cient form of distributable power, and into the use of fuel cells for sewage digester gas power generation, which is a form of renewable energy.
Utilizing technology for switching to independent power during power outages and technology for converting to LP gas, Fuji Electric has developed fuel cells with improved power security and installed them in the Kawasaki Factory. Fuji Electric is also developing fuel cells adapted to meet new needs, such as fuel cells that can operate on both sewage digester gas and utility gas for small-scale sewage treatment plants and fuel cells that meets the CE marking requirements for the EU.
135
of being noisy, emitting exhaust gas, and providing low-effi ciency equipment utilization. Fuji Electric’s 100 kW fuel cells allow for normal operation of equip-ment since they are cogeneration systems that are always clean, highly effi cient and environmentally friendly. They utilize a technology for switching to grid-independent mode during time of blackouts, and they provide the power required to operate the most specifi c loads. Thus, it is possible to increase the re-serve of emergency power supply sources by using die-sel power generators etc., as emergency power sources for emergency loads, while also utilizing fuel cells to supply power to other specifi c loads. In addition, in the event that utility gas supply stoppages occur, the fuel cells can be used to switchover to LP gas reserves for continued operation of services. (1) Switching from grid-connected operation to grid-
independent operation Figure 2 shows an example of switching to grid-
independent operation. If a blackout occurs in the grid-connected operation mode, parallel off*1 is au-tomatically made from the grid, and shift to standby operation mode. At such a time, the fuel cells can be used stand-alone to supply power, and because the generated power is consumed inside in the fuel cells, grid-independent operation mode can start in about 30 seconds from the time of blackout detection. Furthermore, during grid-independent operation mode, rotating machines, in which inrush current occurs, can be activated through overcurrent and overload protec-tion functions as well as limiter functions. A constant state of process connection can be maintained as is even when a load increases or decreases during grid-independent operation. This contributes to creating a
*1: Parallel off : Disconnecting power generation equipment and so on from a power grid
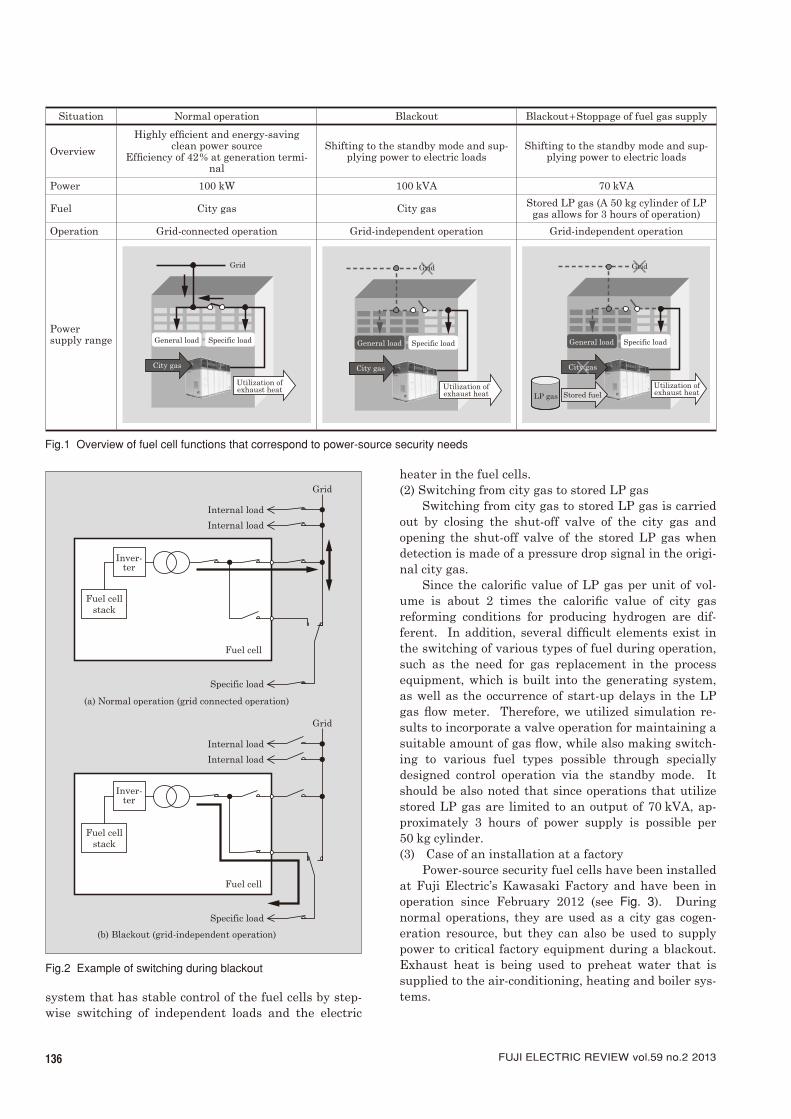
136 FUJI ELECTRIC REVIEW vol.59 no.2 2013
system that has stable control of the fuel cells by step-wise switching of independent loads and the electric
heater in the fuel cells. (2) Switching from city gas to stored LP gas
Switching from city gas to stored LP gas is carried out by closing the shut-off valve of the city gas and opening the shut-off valve of the stored LP gas when detection is made of a pressure drop signal in the origi-nal city gas.
Since the calorifi c value of LP gas per unit of vol-ume is about 2 times the calorifi c value of city gas reforming conditions for producing hydrogen are dif-ferent. In addition, several diffi cult elements exist in the switching of various types of fuel during operation, such as the need for gas replacement in the process equipment, which is built into the generating system, as well as the occurrence of start-up delays in the LP gas fl ow meter. Therefore, we utilized simulation re-sults to incorporate a valve operation for maintaining a suitable amount of gas fl ow, while also making switch-ing to various fuel types possible through specially designed control operation via the standby mode. It should be also noted that since operations that utilize stored LP gas are limited to an output of 70 kVA, ap-proximately 3 hours of power supply is possible per 50 kg cylinder. (3) Case of an installation at a factory
Power-source security fuel cells have been installed at Fuji Electric’s Kawasaki Factory and have been in operation since February 2012 (see Fig. 3). During normal operations, they are used as a city gas cogen-eration resource, but they can also be used to supply power to critical factory equipment during a blackout. Exhaust heat is being used to preheat water that is supplied to the air-conditioning, heating and boiler sys-tems.
Fig.1 Overview of fuel cell functions that correspond to power-source security needs
Situation Normal operation Blackout Blackout+Stoppage of fuel gas supply
Overview
Highly effi cient and energy-saving clean power source
Effi ciency of 42% at generation termi-nal
Shifting to the standby mode and sup-plying power to electric loads
Shifting to the standby mode and sup-plying power to electric loads
Power 100 kW 100 kVA 70 kVA
Fuel City gas City gas Stored LP gas (A 50 kg cylinder of LP gas allows for 3 hours of operation)
Operation Grid-connected operation Grid-independent operation Grid-independent operation
Power supply range
Grid
General load Specific load
Utilization ofexhaust heat
City gas
General load Specific load
City gas
Grid
Utilization ofexhaust heat Stored fuel LP gas
General load Specific load
City gas
Grid
Utilization ofexhaust heat
(b) Blackout (grid-independent operation)
(a) Normal operation (grid connected operation)
Fuel cellstack
Inver-ter
Grid
Internal load
Internal load
Specific load
Fuel cell
Fuel cellstack
Inver-ter
Grid
Internal load
Internal load
Specific load
Fuel cell
Fig.2 Example of switching during blackout

137Development of Fuel Cells Adapted to Meet New Needs
Issu
e: E
nerg
y C
reat
ion
Tech
nolo
gies-
Pow
er P
lant
s an
d N
ew E
nerg
y
3. Fuel Cells for Small-Scale Sewage Treatment Plants Sewage treatment plants exist for the conservation
of the water quality of public water resources. They collect the domestic wastewater that is discharged from each household, and then, purify the wastewater so that it can be returned to rivers and oceans. Dirt or grime that is removed during water purifi cation is referred to as sewage sludge. In order to reduce and stabilize the amount of sewage sludge, anaerobic diges-tion treatment is performed to decompose organic ma-terials in an oxygen absent state, and as a result, sew-age digester gas is generated, which acts a principal ingredient for methane gas.
Currently, anaerobic digestion treatment of sew-age sludge is being performed at approximately 260 sewage treatment plants throughout Japan. The total amount of sewage digestion gas produced annually is about 260 million cubic meters. Most of this amount is
used as auxiliary heating fuel for heating sludge diges-tion tanks and for performing sludge combustion; how-ever, digester gas power generation systems are still in the small minority. However, in the aftermath of the Great East Japan Earthquake, expectations have been increasing with regards to sewage digester gas power generation as a way to secure power supply sources during a time of disaster, and this has been especially true since the start of the “Feed-in Tariff Scheme for Renewable Energy” in 2012.
Sewage digester gas is composed of 60% methane and 40% CO2, and approximately 1,200 m3 of sewage digester gas is required per day in order to ensure the rated operation of a 100 kW fuel cell. About half of the sewage treatment plants that produce sewage di-gester gas are small-scale facilities that do not meet the per day production requirements mentioned above. Therefore, in order to install 100 kW fuel cells at these sewage treatment plants, we have developed a power generation system that works in combination with util-ity gas and can be used at plants that do not produce enough sewage digester gas.
The power generation system produces energy based on sewage digester gas, and falls back on city gas only when there is an insuffi cient amount of sew-age digester gas to produce the required amount of power needed. Figure 4 provides an overview of the gas mixing operation.
In February 2012, this power generation sys-tem was installed at a sewage treatment plant in the city of Osaka as a power generator for the “Breakthrough by Dynamic Approach in Sewage High Technology Project” (B-DASH Project) of the Ministry of Land, Infrastructure, Transport and Tourism. Demonstration testing has been ongoing since April 2012. Demonstration projects related to energy man-agement systems that utilize the ultrahigh solids-
Fig.3 Fuel cells installed at Fuji Electric’s Kawasaki Factory
Gas
flo
w r
ate
sett
ing
valu
e (N
m3 /
h)
Time
105
25
0
Gen
erat
ed p
ower
(kW
)
30 minutes
30 minutes
Upper limit on sewage digester gas flow rate
Generated power setting value
Remote loadchanging command
Upper limitcommand on
remote sewagedigester gas
Sewage digester gas Sewage digester gas
Load changing rate : 30 105 kW per (approximately) 30 minutes
City gas
Fig.4 Overview of gas mixing operation

138 FUJI ELECTRIC REVIEW vol.59 no.2 2013
liquid separation technology of the B-DASH project aim at creating sewage treatment plants that can generate a self-suffi cient amount of energy. This is ac-complished by implementing a system that combines the use of three break-through technologies including “ultrahigh solids-liquid separation,” “high effi ciency high-temperature digestion” and a “smart power gen-eration system.” Among the types of systems for smart power generation, fuel cells are used as power sources in hybrid-type power generators that combine the use of sewage digester gas and city gas.
4. CE Mark Compliant Fuel Cells
4.1 State of cogeneration in the global market
Figure 5 shows the penetration rate of cogen-eration in the global market. The EU and the United States are both outpacing Japan with respect to their cogeneration penetration rate. Natural gas is being increasingly used in the EU as a means of securing energy and alleviating climate change problems. In particular, natural gas cogeneration is being set forth as a substantial and popular assistance measure since it is one of the few technologies that is immediately ef-fective toward energy conservation and savings. As a popular assistance measure, it provides initial cost assistance (cogeneration, heat infrastructure subsi-dies, grants and tax incentives) and running cost as-sistance (electricity purchasing and tax incentives for fuel costs).
4.2 German market and low-concentration oxygen air sup-
ply Fuji Electric is expanding its business in the
German market in partnership with the German com-pany N2telligence GmbH. The German market is characterized by the following two points: (1) Generous support measures by the German gov-
ernment Germany plans to abolish its nuclear power plants.
However, conventional coal-fi red thermal power sta-tion have to be renewed, and thus they are diffi cult to
complement those. Therefore, expectations are high with respect to renewable energies and natural gas cogeneration as a means of backing up power output fl uctuations. The German government revised the Combined Heat and Power (CHP) Law in 2009, and has set forth a target to achieve a 25% increase in its cogeneration utilization ratio by 2020. Hydrogen-based infrastructures are also becoming more popular, and there is high anticipation regarding the use of hy-drogen fuel cells. (2) Popularization of fi re prevention system based on
low-concentration oxygen atmosphere Fire prevention systems that utilize a low-concen-
tration oxygen atmosphere inside buildings such as data centers and warehouses in order to prevent the outbreak of fi res are becoming popular in Germany. Generally, since supply of such an atmosphere to the inside of a room is done by separating nitrogen from the air by a nitrogen generator, capital investment is required; in addition to this cost, other issues also be-come a factor including compressors, etc., which oper-ate by consuming a large amount of energy.
Unlike gas engines that generate power through combustion of fuel and air, fuel cells generate electric-ity by an electrochemical reaction of oxygen in the air and fuel which are separated by an electrolyte. With regards to the air that is supplied by the fuel cell, since only the oxygen in the air is selectively consumed, the air that is discharged has a low-concentration oxy-gen that does not contain harmful fl ue gas. This low-oxygen concentration air is supplied to the inside of a room, and as a result, a low-concentration oxygen atmosphere is created. Therefore, initial costs and running costs required for nitrogen generators can be reduced. The German company N2telligence GmbH has developed a fi re prevention system that utilizes low-concentration oxygen air produced by fuel cells, and they are selling their system under the concept of “Quattro Generation,” a system that provides 4 addi-tional values in relation to electricity, hot water, cold water and low-concentration oxygen air.
In order to contribute to the development of
Cog
ener
atio
n r
atio
(%
) pe
r to
tal
amou
nt
of g
ener
ated
pow
er
FranceUK Germany USA Japan
10
15
20
5
0
Source: Drawing based on “The International CHP/DHC Collaborative” http://www.iea.org/chp/
Fig.5 Penetration rate of cogeneration (2005) Fig.6 Fuel cell installed at Wismar

139Development of Fuel Cells Adapted to Meet New Needs
Issu
e: E
nerg
y C
reat
ion
Tech
nolo
gies-
Pow
er P
lant
s an
d N
ew E
nerg
y
Quattro Generation, Fuji Electric started implement-ing demonstration operations in 2010 at the Wismar testing site of N2telligence GmbH. In 2011, we devel-oped a model for the EU that is the CE mark compli-ant, and in July 2012, we made delivery of Unit 1 to Mercedes-Benz building (Hamburg). Figure 6 shows the installation at the Wismar testing site, and Fig. 7 shows the installation at Hamburg.
4.3 CE mark compliance
T he CE mark is required for selling products to the EU. The CE mark was established under the frame-work of a unifi ed law by the EU in order to ensure the free fl ow of products within the EU. Alternatively, products that do not have the CE mark will be denied customs clearance and will not be able to be exported. In order to receive the CE mark on a product, a com-pliance assessment is performed on the product in ac-cordance with applicable EC directives. A declaration of conformity is required to be carried out based solely on the responsibility of the product manufacturer. EN regulations are used to determine if compliance is made to the applicable EC directives.
Fuels cells are different than general electrical products and they also have the aspects of a small chemical plant. At the same time, the applicable EC directives and conformity regulations cover a lot of ground with respect to electrical products and machin-ery. Since there was no precedent, we received the co-operation of a public institution to conduct a study on the applicable EC directives and EN regulations. The result of the study was that our product was applicable
to several EC directives including the machinery direc-tive, electromagnetic compatibility directive, pressure equipment directive and safety directive for devices that are used in an atmosphere that has potential for explosion.
Fuel cells for use in Japan are designed based on the “Electricity Business Act,” technical stan-dards for thermal power generation equipment, techni-cal standards for electrical equipment, and Japanese Industrial Standards (JIS). In order to export the fuel cells to the EU, we revised the design based on Japanese regulations, while making enhancements to conform to and accommodate additional international regulations. Risk assessment through hazard analysis is critically important with regards to the CE mark compliance. Infl ammable gas leaks were particularly considered as signifi cant events with the greatest pos-sible impact, and thus we changed a part of the design to better meet international regulations. In addition, we also implemented risk assessment with regards to user maintenance work and enhanced measures to pre-vent shocks and injury from occurring. Based on these measures, we issued a self declaration of the CE mark compliance after receiving confi rmation from the public institution in March 2011.
When we delivered the fi rst product for the EU, the fuel cell was accommodated with several additional de-vices as a result of revising the Japanese market based design for fuel cells. We are currently working on a design that is especially dedicated for the EU and are planning on commencing sales in fi scal 2013.
5. Postscript
Even in the Great East Japan Earthquake, 100 kW
fuel cells continued operation. One hundred kilowatt fuel cells are expected to gain increasing popularity in the future as a highly effi cient distributed power source, since they are capable of grid-independent op-eration during times of disaster as well as provide a fuel switching option when working in combination with city gas and LP gas.
Fuji Electric is dedicated in its efforts to apply its cultivated technologies and fuel cell functionalities to continually enhance the range of application of its products and improve user benefi ts, while also con-tributing to prevention of global warming and environ-mental conservation.
Fig.7 Fuel cell installed at Hamburg

A B S T R A C T
† Power & Social Infrastructure Business Group,Fuji Electric Co., Ltd.
140
1. Introduction Fukushima Daiichi Nuclear Power Station ac-
cident, caused by the Great East Japan Earthquake, has resulted in leakage of radioactive materials and contamination of the environment. The released ra-dioactive materials are mainly cesium, which adheres to soil and woodlands. The government is planning to decontaminate certain areas so that the radiation dose from radioactive materials released by this accident becomes 1 mSv or less annually. *1
In the decontamination plan, the authorities are reviewing how to scrape away and decontaminate the top few centimeters of soil in contaminated fi elds of rice and other crops. Doing so will generate a large amount of soil as contaminated waste. This soil (origi-nal soil) is to be temporarily placed in an appropriate location and is planned to be disposed of permanently after being placed in interim storage. However, the area to decontaminate is very wide and in order to store all this soil, an extensive area is necessary. As a result, there is a diffi cult issue to overcome in terms of securing such an area and decontamination work is making slow progress.
The scraped off original soil is not all contami-nated, and thus separating highly-contaminated parts from the total amount of soil removed for decontami-nation makes it possible to reduce the volume of soil
JINZA Keisuke † TOMIZUKA Chiaki †
Technology for Dry Decontamination and Volume Reduction of Contaminated Dirt
The Fukushima Dai-ichi Nuclear Power Station accident, caused by The Great East Japan Earthquake, has re-sulted in leakage of radioactive materials and contamination of the environment. Separating highly-contaminated dirt from the total amount of dirt removed for decontamination makes it possible to reduce the volume of dirt that needs to be stored.
In cooperation with Ube Machinery Corporation, Ltd., Fuji Electric developed technology for dry decontamination and volume reduction of contaminated dirt. This technology combines the dry sorting and grinding equipment used in general industry with a radiation measurement device, enabling mass processing. Verifi cation tests using actual contaminated dirt have demonstrated that radiation levels are reduced to less than half after crushing and separation.
that needs to be stored. Accordingly, Fuji Electric has developed dry decontamination and volume reduction technology for contaminated soil. This paper describes the characteristics and demonstration of this technol-ogy.
2. Characteristics of Technology for Dry
Decontamination of Contaminated Soil and Volume Reduction According to public and private research institu-
tions, it is reported that soil contamination caused by radioactive cesium is concentrated in a few centimeters of the surface layer and among the soil, most of the ra-dioactive cesium is adhered to the grain section such as clay and silt.
In cooperation with Ube Machinery Corporation Ltd., Fuji Electric developed technology for dry decon-tamination and volume reduction of contaminated soil.
2.1 Dry decontamination and volume reduction process
fl ow The processing fl ow based on this technology is de-
scribed in Fig. 1. The point of this technology is section A and the details are as follows:
(a) Grinding superfi cial coarse particle by mill Grind the soil, which has become coarse parti-
cles superfi cially as a result of the grain hardening, by using the mill. (b) Peel-off of grain
Strip off the grain that is adhered to the surface of the coarse particles by means of grinding using a mill. (c) Grinding surface layer of coarse particles
Strip off the surface layer of coarse particles to which the radioactive cesium is adhered by means of grinding using a mill.
*1: “Act on Special Measures pertaining to measures against contamination of environment by released ra-dioactive substances due to the accident of nuclear pow-er station caused by The Great East Japan Earthquake that occurred in March 11, 2011” issued in August 2011

141Technology for Dry Decontamination and Volume Reduction of Contaminated Dirt
Issu
e: E
nerg
y C
reat
ion
Tech
nolo
gies-
Pow
er P
lant
s an
d N
ew E
nerg
y
(d) Dry classifi cation Sort the grains by grain diameter by means of
dry classifi cation. With t his series of processes, soil is classifi ed
into soil which has high contamination and soil wh ich has low contamination.
2.2 Characteristics of dry decontamination and volume
reduction process This technology has been developed by combining
proven dry classifi cation and grinding equipment used in general industry with a radiation measurement de-vice, enabling mass processing of soil. The characteris-tics are as follows: (1) Method of processing that does not require water
and chemicals Compared to the soil wet processing method, for
which prior research has been conducted for volume re-duction of contaminated dirt, water and chemicals are not used; therefore, the cost and effort for secondary waste processing is eliminated. In addition, because chemical treatment and high-temperature treatment are not performed, the original characteristics of the original soil are not easily lost. (2) Classifi cation treatment, volume reduction and
space-saving of storage location Dry classifi cation technology allows the volume
reduction process to be performed appropriately for various types of soil because it is possible to set an arbitrary classifi cation threshold for reuse of soil. Applicability for soil in paddy fi elds, to which it is dif-fi cult to apply the wet process, was demonstrated by a basic test.
The volume of the soil which is categorized into soil to be stored as contaminated waste is expected to be reduced further by deairing and compressing it. As a result, it is possible to aim at reducing the amount of space needed for storage. (3) Ensuring safety and security by whole quantity
measurement of radioactive concentration of reus-able soil
With the soil monitor for which Fuji Electric ap-plied the principle of the "Food radiation measurement system" that Fuji Electric has already commercialized,
the whole quantity of radioactive concentration of reus-able low contaminated soil is measured continuously.
Although it takes a few days to obtain the result when outsourcing analysis of radioactive concentra-tion, effi cient operation can be performed with this technology because the measurement result can be ob-tained in real time. This technology is so effective that even when changing settings by condition of classifi ca-tion according to the type of soil and decontamination method, an operator can immediately confi rm how much radioactive concentration has changed. (4) Low cost
A trial calculation of the process cost was made by considering the initial cost and running cost. This technology does not require contamination water treat-ment and secondary waste disposal cost; therefore, it lowers the costs to between one thirds and one fourth the amount of the wet decontamination method.
3. Dry Decontamination and Volume Reduction
Plant
For a dry decontamination and volume reduction plant, two types are planned: movable type and sta-tionary type.
As for the movable-type plant, by mounting the necessary devices on trailers, it will be possible to move the plant to the required location. Since instal-lation and removal of the plant are easy, we expect it will be possible to gain understanding from local people and facilitate the decontamination work. We assume it will be applied in relatively high radiation dose areas because the equipment confi guration aims for a decomposition effect. A conceptual image of the movable plant is shown in Fig. 2 and the process fl ow is shown in Fig. 3.
As for the stationary-type plant, we assume it will be used to decontaminate a large volume of soil in relatively low radiation dose areas because the equip-ment confi guration aims for throughput and volume reduction. Figure 4 shows a conceptual image of a stationary-type plant and Table 1 shows the specifi ca-
A
Original soil (soil withremoved surface layer)
Drying
Cracking, grinding,classifying
Whole quantityradioactivity inspection
Storage facility
Large grain diameter
Small grain diameter
Reuse
Contaminatedsoil
Fig.1 Dry decontamination and volume reduction process fl ow
Fig.2 Conceptual image of movable-type plant
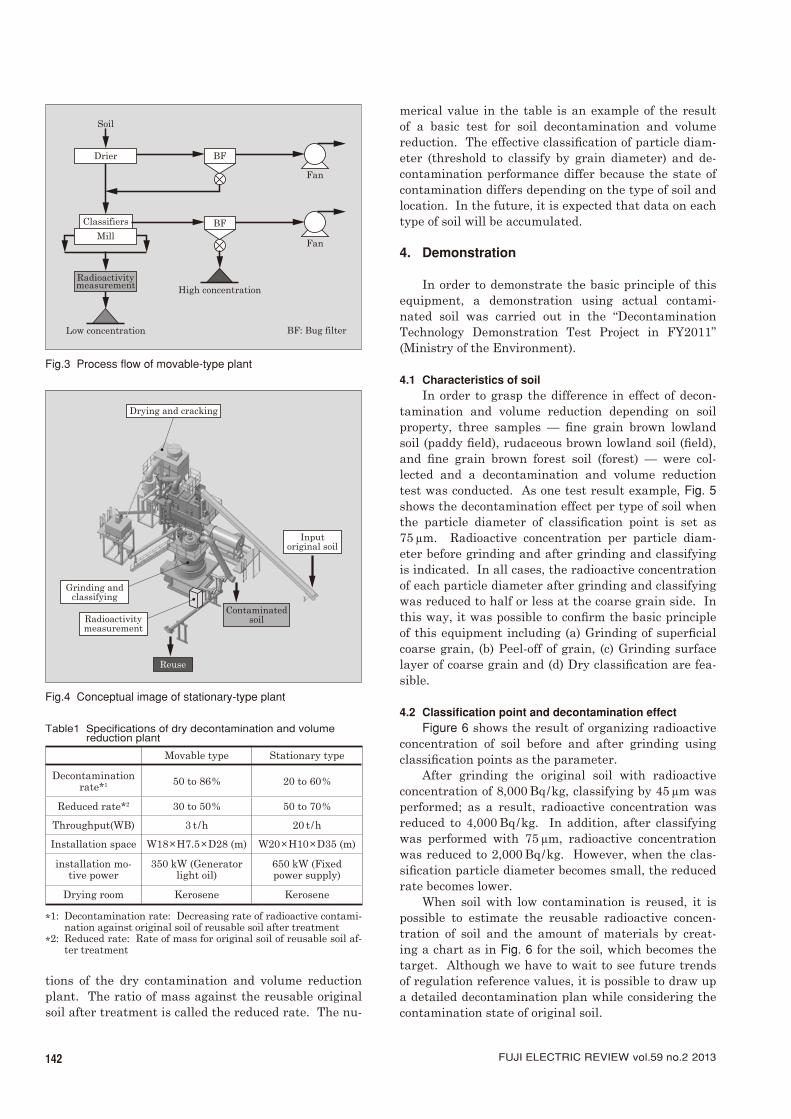
142 FUJI ELECTRIC REVIEW vol.59 no.2 2013
tions of the dry contamination and volume reduction plant. The ratio of mass against the reusable original soil after treatment is called the reduced rate. The nu-
merical value in the table is an example of the result of a basic test for soil decontamination and volume reduction. The effective classifi cation of particle diam-eter (threshold to classify by grain diameter) and de-contamination performance differ because the state of contamination differs depending on the type of soil and location. In the future, it is expected that data on each type of soil will be accumulated.
4. Demonstration
In order to demonstrate the basic principle of this
equipment, a demonstration using actual contami-nated soil was carried out in the “Decontamination Technology Demonstration Test Project in FY2011” (Ministry of the Environment).
4.1 Characteristics of soil
In order to grasp the difference in effect of decon-tamination and volume reduction depending on soil property, three samples — fi ne grain brown lowland soil (paddy fi eld), rudaceous brown lowland soil (fi eld), and fi ne grain brown forest soil (forest) — were col-lected and a decontamination and volume reduction test was conducted. As one test result example, Fig. 5 shows the decontamination effect per type of soil when the particle diameter of classifi cation point is set as 75 μm. Radioactive concentration per particle diam-eter before grinding and after grinding and classifying is indicated. In all cases, the radioactive concentration of each particle diameter after grinding and classifying was reduced to half or less at the coarse grain side. In this way, it was possible to confi rm the basic principle of this equipment including (a) Grinding of superfi cial coarse grain, (b) Peel-off of grain, (c) Grinding surface layer of coarse grain and (d) Dry classifi cation are fea-sible.
4.2 Classifi cation point and decontamination effect
Figure 6 shows the result of organizing radioactive concentration of soil before and after grinding using classifi cation points as the parameter.
After grinding the original soil with radioactive concentration of 8,000 Bq/kg, classifying by 45 μm was performed; as a result, radioactive concentration was reduced to 4,000 Bq/kg. In addition, after classifying was performed with 75 μm, radioactive concentration was reduced to 2,000 Bq/kg. However, when the clas-sifi cation particle diameter becomes small, the reduced rate becomes lower.
When soil with low contamination is reused, it is possible to estimate the reusable radioactive concen-tration of soil and the amount of materials by creat-ing a chart as in Fig. 6 for the soil, which becomes the target. Although we have to wait to see future trends of regulation reference values, it is possible to draw up a detailed decontamination plan while considering the contamination state of original soil.
Drier
Classifiers
Mill
Radioactivitymeasurement
Soil
BF
BF
Fan
Fan
BF: Bug filter
High concentration
Low concentration
Fig.3 Process fl ow of movable-type plant
Reuse
Contaminatedsoil
Inputoriginal soil
Radioactivitymeasurement
Grinding andclassifying
Drying and cracking
Fig.4 Conceptual image of stationary-type plant
Table1 Specifi cations of dry decontamination and volume reduction plant
Movable type Stationary type
Decontamination rate*1 50 to 86% 20 to 60%
Reduced rate*2 30 to 50% 50 to 70%
Throughput(WB) 3 t/h 20 t/h
Installation space W18×H7.5×D28 (m) W20×H10×D35 (m)
installation mo-tive power
350 kW (Generator light oil)
650 kW (Fixed power supply)
Drying room Kerosene Kerosene
*1: Decontamination rate: Decreasing rate of radioactive contami-nation against original soil of reusable soil after treatment
*2: Reduced rate: Rate of mass for original soil of reusable soil af-ter treatment

143Technology for Dry Decontamination and Volume Reduction of Contaminated Dirt
Issu
e: E
nerg
y C
reat
ion
Tech
nolo
gies-
Pow
er P
lant
s an
d N
ew E
nerg
y
5. Future Development
By adding processes for deairing, compressing and
solidifying soil with a high radioactive concentration after decomposition treatment (see Fig. 7), further vol-ume reduction can be expected. As a result, a further reduction in the space necessary for temporary storage at the interim storage facility can be expected. In or-der to evaluate the comprehensive effect of dry decon-tamination, it is necessary to grasp the volume reduc-tion effect by deairing, compressing, and solidifying.
6. Postscript
This paper described technology for dry decon-
tamination and volume reduction of contaminated soil caused by radioactive substances. In the future, we will develop technologies that can contribute towards recovery and restoration from the Great East Japan Earthquake and Fukushima Daiichi Nuclear Power Station accident.
Fuji Electric has conducted the demonstration as “Decontamination Technology Demonstration Test Project in FY2011” of the Ministry of Environment under Fuji Furukawa Engineering & Construction Co., Ltd. We express our gratitude to the Ministry of Environment and the Japan Atomic Agency, which provided us with guidance.
Rad
ioac
tive
con
cen
trat
ion
(B
q/kg
)
After grinding and classifyingBefore grinding0
12,000
10,000
8,000
6,000
4,000
2,000
0 to 3232 to 45
Particle diameter of soil (μm)
45 to 75
75 to 150150 to 300300 to 600
600 to 1,200Whole
(a) Fine grain brown lowland soil (paddy field)
Rad
ioac
tive
con
cen
trat
ion
(B
q/kg
)
After grinding and classifyingBefore grinding0
6,000
5,000
4,000
3,000
2,000
1,000
(b) Rudaceous brown lowland soil (field)
Rad
ioac
tive
con
cen
trat
ion
(B
q/kg
)
After grinding and classifyingBefore grinding0
50,000
40,000
30,000
20,000
10,000
(c) Fine grain brown forest soil (forest)
Fig.5 Decontamination effect for each soil (particle diameter of classifi cation point 75 µm)
Soil concentration after grinding (Bq/kg)
0 2,000 6,0004,000 8,000
Ori
gin
al s
oil c
once
ntr
atio
n (
Bq/
kg)
0
10,000
8,000
6,000
4,000
2,000
Result of 32 μmclassification32 μm average
Result of 45 μmclassification45 μm average
75 μm average
Result of 75 μmclassification
Fig.6 Decontamination effect by classifi cation point (fi ne grain brown lowland soil: paddy fi eld)
Store by stuffing into a flexible container bag
Soil afterdecontamination
Briquette shape with consideration given to usability and storing characteristics is selectable.
Raw material hopper
Screw conveyor(deairing and compressing)
Briquetting machine(solidification)
Fig.7 Example of volume reduction fl ow of high dose soil


AmericaFuji Electric Corp. of America
Sales of electrical machinery and equipment, semiconductor devices, drive control equipment, and devices
Tel +1-732-560-9410URL http://www.americas.fujielectric.com/
Fuji Electric Brazil-Equipamentos de Energia Ltda *Sales of inverters, semiconductors, and power distribution
Tel +55-11-2283-5991URL http://www.americas.fujielectric.com/portugues
AsiaFuji Electric Asia Pacifi c Pte. Ltd.
Sales of electrical distribution and control equipment, drive control equipment, and semiconductor devices
Tel +65-6533-0010 URL http://www.fujielectric.com/asia/company/offi ces/fap.html
Fuji Electric (Thailand) Co., Ltd. *Sales and engineering of electric substation equipment, control panels, and other electric equipment
Tel +66-2-210-0615
Fuji Electric Power Supply (Thailand) Co., Ltd.Manufacture and sales of small- to medium-size UPS and internal power supplies
Tel +66-0-2909-5998
Fuji Electric Vietnam Co.,Ltd.Sales of electrical distribution and control equipment and drive control equipment
Tel +84-4-3935-1593
Fuji Furukawa E&C (Vietnam) Co., Ltd. *Engineering and construction of mechanics and electrical works
Tel +84-4-3755-5067
PT Fuji Electric Indonesia *Sales of inverters, servos, UPS, tools, and other component products
Tel +62 21 398-43211
Fuji Electric India Pvt. Ltd. *Sales of drive control equipment and semiconductor devices
Tel +91-22-4010 4870 URL http://www.fujielectric.co.in
Fuji Electric Philippines, Inc.Manufacture of semiconductor devices
Tel +63-2-844-6183
Fuji Electric Semiconductor (Malaysia) Sdn. Bhd.Manufacture of semiconductor devices
Tel +60-4-494-5800 URL http://www.fujielectric.com.my/
Fuji Electric (Malaysia) Sdn. Bhd.Manufacture of magnetic disk and aluminum substrate for magnetic disk
Tel +60-4-403-1111 URL http://www.fujielectric.com.my/
Fuji Furukawa E&C (Malaysia) Sdn. Bhd. *Engineering and construction of mechanics and electrical works
Tel +60-3-4297-5322
Fuji Electric Taiwan Co., Ltd.Sales of semiconductor devices, electrical distribution and control equipment, and drive control equipment
Tel +886-2-2511-1820
Fuji Electric Korea Co., Ltd.Sales of power distribution and control equipment, drive control equip-ment, rotators, high-voltage inverters, electronic control panels, medium- and large-sized UPS, and measurement equipment
Tel +82-2-780-5011 URL http://www.fujielectric.co.kr/
Fuji Electric Middle East Branch Offi cePromotion of electrical products for the electrical utilities and the indus-trial plants
Tel +973-17 564 569
EuropeFuji Electric Europe GmbH
Sales of electrical/electronic machinery and components Tel +49-69-6690290 URL http://www.fujielectric.com/europe/company/offi ces/fee.html
Fuji Electric France S.A.SManufacture and sales of measurement and control devices
Tel +33-4-73-98-26-98 URL http://www.fujielectric.fr/
ChinaFuji Electric (China) Co., Ltd.
Sales of locally manufactured or imported products in China, and export of locally manufactured products
Tel +86-21-5496-1177 URL http://www.fujielectric.com.cn/
Shanghai Fuji Electric Switchgear Co., Ltd.Manufacture and sales of switching equipment, monitoring control appliances, and related facilities and products
Tel +86-21-5718-1234 URL http://www.fujielectric.com.cn/sfswgr/
Shanghai Fuji Electric Transformer Co., Ltd.Manufacture and sales of molded case transformers
Tel +86-21-5718-7705 URL http://www.fujielectric.com.cn/sfswgr/
Wuxi Fuji Electric FA Co., Ltd.Manufacture and sales of low/high-voltage inverters, temperature controllers, gas analyzers, and UPS
Tel +86-510-8815-2088
Fuji Electric (Changshu) Co., Ltd.Manufacture and sales of electromagnetic contactors and thermal relays
Tel +86-512-5284-5642 URL http://www.csfe.com.cn/
Fuji Electric (Zhuhai) Co., Ltd.Manufacture and sales of industrial electric heating devices
Tel +86-756-7267-861
Fuji Electric (Shenzhen) Co., Ltd.Manufacture and sales of photoconductors and semiconductor devices
Tel +86-755-2734-2910 URL http://www.szfujielectric.com.cn/FUJIWebSite/index.html
Fuji Electric Dalian Co., Ltd.Manufacture of low-voltage circuit breakers
Tel +86-411-8762-2000
Fuji Electric Motor (Dalian) Co., Ltd.Manufacture of industrial motors
Tel +86-411-8763-6555
Dailan Fuji Bingshan Vending Machine Co.,Ltd. Development, manufacture, sales, servicing, overhauling, and installa-tion of vending machines, and related consulting
Tel +86-411-8754-5798
Fuji Electric (Hangzhou) Software Co., Ltd.Development of vending machine-related control software and develop-ment of management software
Tel +86-571-8821-1661 URL http://www.fujielectric.com.cn/fhs/cn/
Zhejiang Innovation Fuji Technology Co., Ltd. *Design, development, and services pertaining to software
Tel +86-571-8827-0011 URL http://www.fujielectric.com.cn/sif/
Fuji Electric FA (Asia) Co., Ltd.Sales of electrical distribution and control equipments
Tel +852-2311-8282 URL http://www.fea.hk/
Fuji Electric Hong Kong Co., Ltd.Sales of semiconductor devices and photoconductors
Tel +852-2664-8699 URL http://www.szfujielectric.com.cn/hkeng/company/index.htm
Hoei Hong Kong Co., Ltd.Sales of electrical/electronic components
Tel +852-2369-8186 URL http://www.hoei.com.hk/
Overseas Subsidiaries* Non-consolidated subsidiaries

Printed on recycled paper