energy (e - ces.vic.gov.au
TRANSCRIPT

ENERGY (E) SCIENTIFIC ASSESSMENTS Part III

Traditional Owners
The Commissioner for Environmental Sustainability
proudly acknowledges Victoria’s Aboriginal community
and their rich culture and pays respect to their Elders
past and present.
We acknowledge Aboriginal people as Australia’s first
peoples and as the Traditional Owners and custodians
of the land and water on which we rely. We recognise and
value the ongoing contribution of Aboriginal people and
communities to Victorian life, and how this enriches us.
We embrace the spirit of reconciliation, working towards
the equality of outcomes and ensuring an equal voice.
ISBN: 978-0-6485069-1-1

Energy
BackgroundVictoria has a high-energy, high-carbon economy.
The state’s modern economy and society depends
on a continuous flow of affordable and reliable
energy. Energy powers the state’s businesses,
homes and transportation systems. It lights,
heats and cools Victorians’ buildings; powers their
appliances and information and communications
systems; cooks and cools their food; and pumps
their water and sewerage. It is an essential factor of
production, producing and transforming materials
for the state’s manufacturing and industrial
sectors.1,2 The history of energy production and
consumption in Victoria has shaped its cities,
industries and broader economy.
An abundance of cheap energy fuelled Victoria’s
20th-century economic development. Low-cost
electricity allowed the state to develop heavy
industries like aluminium smelting and steel
production from the 1960s and become one of
Australia’s pre-eminent manufacturing centres.3,4
Long periods of cheap energy during the 20th
century – combined with policy choices on building
standards, urban planning and transport – helped
to keep Victoria’s energy-use efficiency at a
comparatively low level compared to citizens of
other Organisation for Economic Co-operation
and Development (OECD) nations.5,6 For7 example,
the energy efficiency of Victoria’s building stock is
low when compared to world best practice8,9 and
Victoria’s low urban population density ensures
Victorians use considerably more energy for
transport per capita than citizens of most other
OECD nations.10 Overall, Victoria’s per capita
energy consumption in 2015 was higher than the
Australian national average and higher than that
of most other OECD nations, particularly when
Victoria’s relatively mild climate and low heating
loads are taken into account (see Table E.1).
1. Grubb M 2014, ‘Planetary Economics’, Routledge, London, United Kingdom.
2. Ayers RU, Ayers EH 2009, ‘Crossing the energy divide’, Pearson FT Press, London United Kingdom.
3. Productivity Commission 2003, ‘Trends in Australian Manufacturing’, Canberra, Australia https://www.pc.gov.au/research/completed/man-ufacturing/tiam.pdf Accessed 4 December 2018.
4. The McKell Institute Victoria, ‘The Place to Make: The Future of Manufacturing in Victoria’, Melbourne, Victoria https://mckellinstitute.org.au/app/uploads/McKell_VIC_Manufacturing_SPREADS_WEB.pdf Accessed 4 December 2018.
5. IEA 2017, ‘Energy Efficiency 2017’, Paris, France.6. American Council for an Energy-Efficient Economy 2018, ‘The 2018
International Energy Efficiency Scorecard’.7. 78. IEA 2017, ‘Energy efficiency indicators’, Paris, France.9. Sustainability Victoria 2015, ‘Energy Efficiency Upgrade Potential of
Existing Victorian Houses’, Melbourne, Victoria https://www.sustaina-bility.vic.gov.au/About-Us/Publications/Retrofit-Trial-Energy-Efficien-cy-Upgrade-Potential Accessed 4 December 2018. 10. Demographia 2018, ‘World Urban Areas 14th Annual Edition: 201804’.
SCIENTIFIC ASSESSMENTS Part III Energy

Victorian State of the Environment 2018 Scientific Assessments (E)
Figure E.1 Per capita energy use in Victoria, compared to OECD nations, 201511,12,13
Victoria’s energy is primarily sourced from the
combustion of fossil fuels, with which the state is
richly endowed. Victoria has some of the world’s
largest deposits of brown coal, in the Gippsland
Basin,14 alongside oil and gas reserves in the
Gippsland, Bass and Otway Basins.15,16,17 Access to
these fossil fuel reserves helped keep Victorian
energy prices low during the latter half of the
20th century. However, low-cost brown coal has
also left Victoria with a legacy of dependence on
high-emissions brown coal-fired generators and
a much higher carbon intensity of electricity than
other developed nations whose past investments
in electricity generation focused on nuclear and/or
hydroelectricity.
Victoria’s continued dependence on energy
from fossil fuels has significant human health
and environmental impacts including local air
pollution (see Air chapter) and diversion of water
flows for electricity generation. However, the most
significant long-term environmental and human
health issue arising from the state’s dependence
on energy from fossil fuels is the impact on
Victoria’s greenhouse gas emissions and their
contribution to climate change (see Climate
Change Impacts chapter).18,19,20,21,22 In 2016, Victoria’s
net greenhouse gas emissions were around 115 Mt
CO2-e (carbon dioxide equivalent). Emissions from
energy, including fuel combustion and fugitive
emissions, contributed around 103 Mt of CO2-e, or
90% of this total (Figure E.2), representing almost
one-quarter of Australia’s total emissions from
energy.23
11. IEA 2017, ‘CO2 Emissions from Fuel Combustion’, Paris, France.
12. Australian Bureau of Statistics 2018, ‘3101.0 - Australian Demographic Statistics, Dec 2017 issue’, Canberra, Australia.
13. Australia Department of the Environment and Energy 2017, ‘Australian Energy Updated 2017’, Canberra, Australia.
14. Geoscience Australia, ‘Brown Coal’, Canberra, Australia http://www.ga.gov.au/data-pubs/data-and-publications-search/publications/aimr/brown-coal Accessed 4 December 2018.
15. Geoscience Australia 2012, ‘Shaping a Nation: A Geology of Australia’, ANU Press.
16. Geoscience Australia, ‘Australian Energy Resource Assessment’, Can-berra, Australia http://aera.ga.gov.au/ Accessed 4 December 2018.
17. DEDJTR, ‘Petroleum’, Melbourne, Victoria http://earthresources.vic.gov.au/earth-resources/victorias-earth-resources/petroleum Accessed 4 December 2018.
18. Hughes L, McMichael T 2011, ‘The Critical Decade: Climate Change and Health’, Climate Commission Secretariat (Department of Climate Change, Canberra, Australia.
19. Climate Council and Climate and Health Alliance 2014, ‘Climate Council: Joint Statement on the Health Effects of Coal in Austral-ia’, http://www.climatecouncil.org.au/uploads/800f051ad0cb-47d1554179635d9f4070.pdf Accessed 4 December 2018.
20. Preston BL, Jones RN 2006, ‘Climate change impacts on Australia and the benefits of early action to reduce global greenhouse gas emissions’, CSIRO, Aspendale, Victoria.
21. Garnaut R, 2008, ‘The Garnaut climate change review’, Cambridge University Press, Cambridge, United Kingdom.
22. Garnaut R, 2011, ‘The Garnaut review 2011: Australia in the global response to climate change’, Cambridge University Press, Cambridge, United Kingdom.
SCIENTIFIC ASSESSMENTS Part III Energy

Figure E.2 Victorian energy GHG emissions compared to Victorian
total GHG emissions24
In 2015, Victoria’s per capita greenhouse gas
emissions from energy were higher than the
Australian average, which was itself the highest in
the OECD (Figure E.3).
Figure E.3 Per capita energy emissions in Victoria, compared to OECD nations,
201525,26,27
23. Australian Department of the Environment and Energy, ‘AustralianGreenhouse Emissions Information System’, Canberra, Australia http://ageis.climatechange.gov.au Accessed 4 December 2018.
24. Ibid.25. IEA, ‘CO
2 Emissions from Fuel Combustion’, Paris, France.
26. Australian Bureau of Statistics 2018, ‘3101.0 - Australian Demographic Statistics, Dec 2017 issue’, Canberra, Australia.
27. Australian Department of the Environment and Energy, ‘AustralianGreenhouse Emissions Information System’, Canberra, Australia http://ageis.climatechange.gov.au Accessed 4 December 2018.
SCIENTIFIC ASSESSMENTS Part III Energy

Victorian State of the Environment 2018 Scientific Assessments (E)
Challenges
Greenhouse Gas Emissions from Energy
Meeting Victoria’s climate change mitigation goals
requires a large-scale energy transition. Victoria’s
energy system is by far the most significant source
of the state’s greenhouse gas emissions, producing
around 90% of the total in 2016. Consequently,
reducing greenhouse gas emissions from energy
is Victoria’s principal challenge to meeting its
greenhouse gas emissions reduction goals.
The Victorian Climate Change Act 2017 (the Act)
explicitly acknowledges the Paris Agreement’s 2015
goal of:
... holding the increase in the global average temperature to well below 2°C above pre-industrial levels and to pursue efforts to limit the temperature increase to 1.5°C above pre-industrial levels recognizing that this would significantly reduce the risks and impacts of climate change.28
In recognition of the responsibility of signatory
nations to take strong mitigation action, the
Act commits Victoria to a long-term emissions
reduction target of net-zero greenhouse gas
emissions by 2050. With this Act, the Victorian
Government seeks to begin ‘decisive, long-term
action’ that helps Victoria ‘achieve an orderly
and just transition to a net-zero greenhouse gas
emissions economy and remain prosperous and
liveable’.29
Victoria will require an almost complete
transformation of its energy system away from the
current dominance of fossil fuels to low- and zero-
emissions energy resources if it is to transition to
a net-zero greenhouse gas emissions economy by
2050. At present, this energy transition remains
in its early stages. As Figure E.4 shows, Victoria’s
emissions intensity of energy has remained
reasonably stable since 1990 with small rises
during the mid-2000s declining to just above 1990
levels by 2016. Victoria’s per capita energy use
and per capita CO2-e emissions from energy have
declined from their mid-2000s high to around
90% of their 1990 level. However, total energy use
and total CO2-e emissions from energy remained
around 30% higher in 2016 than they were in 1990,
although there have been recent small declines in
both these measures despite population growth.
The closure of Hazelwood power station’s 1.6 GW
of brown-coal-fired power generation in 2017
will likely have further reduced Victoria’s overall
energy emissions.
Breaking Victoria’s energy emissions into sectors
presents a more complex picture (see Figure E.5),
but one that confirms Victoria’s energy transition
remains in its early stages. Electricity emissions,
which represented over 50% of Victoria’s total
emissions in 2016, have dropped from their 2012
peak but remain close to 35% above their 1990
levels. Transport emissions, which represented
around 20% of Victoria’s total emissions in 2016,
continue to cl imb at a faster rate than population
growth as do those from the grouping of other
energy emissions (including commercial, industrial
and residential), which represent around 8%
of Victoria’s total. Only energy sector fugitive
emissions and emissions from manufacturing
and construction are lower than their 1990 levels.
Together these two groups make up around 8% of
Victoria’s total emissions.
28. United Nations 2015, ‘Paris Agreement’, https://unfccc.int/sites/de-fault/files/english_paris_agreement.pdf Accessed 4 December 2018.
29. Office of the Chief Parliamentary Counsel Victoria 2017, ‘Climate Change Act 2017’, Melbourne, Victoria http://www.legislation.vic.gov.au/Domino/Web_Notes/LDMS/PubStatbook.nsf/f932b66241ecf1b-7ca256e92000e23be/05736C89E5B8C7C0CA2580D50006FF95/$-FILE/17-005aa%20authorised.pdf Accessed 4 December 2018.
SCIENTIFIC ASSESSMENTS Part III Energy

Figure E.4 Victorian population, energy use and energy emissions, changes
1990 to 201630,31,32
Figure E.5 Energy emissions by sector 1990 to 2016 with population growth33
30. Australian Bureau of Statistics 2018, ‘3101.0 - Australian Demographic Statistics, Dec 2017 issue’, Canberra, Australia.
31. Australian Department of the Environment and Energy, ‘AustralianGreenhouse Emissions Information System’, Canberra, Australia http://ageis.climatechange.gov.au Accessed 4 December 2018.
32. Australia Department of the Environment and Energy 2017, ‘Australian Energy Updated 2017’, Canberra, Australia.
33. Australian Department of the Environment and Energy, ‘AustralianGreenhouse Emissions Information System’, Canberra, Australia http://ageis.climatechange.gov.au Accessed 4 December 2018.
SCIENTIFIC ASSESSMENTS Part III Energy

Victorian State of the Environment 2018 Scientific Assessments (E)
The Scale of Victoria’s Energy Transition in an International Context
Like the energy systems of most Australian
states and many other countries, the majority of
Victoria’s energy system was built over the past
century on the premise of ongoing, cheap energy
from fossil fuel combustion. The task of shifting a
large, complex energy system from a deep reliance
on fossil fuels to a net-zero-emissions future over
the next 30 years has no historical precedent.34
Challenges exist across the technological,
institutional, market, social and policy domains
of Victoria’s energy system because settings
that work well for a fossil fuel system tend not
to be well-suited for a low- or net-zero-carbon
energy future.35 Figure 6 illustrates the magnitude
of Victoria’s energy transition challenge in an
international context.
Figure E.6 Victoria’s energy transition challenge to 205036,37,38,39
Attaining a Net-zero Electricity System Before 2050
Victoria’s electricity system produced over 50%
of Victoria’s total emissions in 2016. Given the
size of its contribution to state emissions and
the challenges in decarbonising other sectors,
particularly transport (~20% of total), the electricity
system will need to lead Victoria’s economy-wide
emissions reductions. Decarbonisation of the
electricity system also provides a platform for the
future decarbonisation, through electrification
from a low- or net-zero-carbon grid, of many
currently non-electric, end-use energy services in
transport, heating, industry and manufacturing.40,41
Victoria has a wealth of resources for renewable
electricity generation, with a number of renewable
energy zones (REZs) identified by the Australian
Energy Market Operator as suitable for future
development because they are locations where
high-quality renewable resources overlap with
34. Millar RJ, Fuglestvedt JS, Friedlingstein P, Rogelj J, Grubb MJ, Mat-thews HD, Skeie RB, Forster PM, Frame DJ, Allen MR 2017, ‘Emission budgets and pathways consistent with limiting warming to 1.5 C’, Nature Geoscience, 10, pp. 741-747.
35. Seto KC, Davis SJ, Mitchell RB, Stokes EC, Unruh G, Urge-Vorsatz D 2016, ‘Carbon lock-in: types, causes, and policy implications’, Annual Review of Environment and Resources, 41, pp. 425–452.
36. IEA, ‘CO2 Emissions from Fuel Combustion’, Paris, France.
37. Australian Bureau of Statistics 2018, ‘3101.0 - Australian Demographic Statistics, Dec 2017 issue’, Canberra, Australia.
38. Australian Department of the Environment and Energy, ‘AustralianGreenhouse Emissions Information System’, Canberra, Australia http://ageis.climatechange.gov.au Accessed 4 December 2018.
39. Australia Department of the Environment and Energy 2017, ‘Australian Energy Updated 2017’, Canberra, Australia.
40. IEA 2017, ‘Energy Technology Perspectives 2017’, Paris, France.41. IEA 2017, ‘Real-world policy packages for sustainable energy transi-
tions’, Paris, France.42. Australian Energy Market Operator 2018, ‘Integrated System Plan’,
Melbourne, Victoria https://www.aemo.com.au/-/media/Files/Elec-tricity/NEM/Planning_and_Forecasting/ISP/2018/Integrated-Sys-tem-Plan-2018_final.pdf Accessed 4 December 2018.
SCIENTIFIC ASSESSMENTS Part III Energy

existing network capacity (Figure E.7).42 Renewable
electricity generation in Victoria has increased
significantly in recent years, growing from 9% in
2010–11 to nearly 19% in 2017–18.43 This growth has
been driven by a combination of high-quality wind
and solar resources, state and federal renewable
energy targets, declining costs for renewable
energy technologies, and growing community
support for renewable energy. In Victoria, over
1.6 GW of new large-scale, variable renewables
is in place, another 8.5 GW has been proposed
and further investment is likely to meet Victoria’s
legislated renewable energy targets of 25% of
Victoria’s electricity from renewable energy by
2020 and 40% by 2025.44,45 Rooftop photovoltaics
(PV) in Victoria is projected to expand from a
capacity of around 1.2 GW in early 2018 to 4–6 GW
in 2035-36.46,47,48
Figure E.7 Australian Energy Market Operator’s renewable
energy zones in Victoria
(data source: Australian Energy Market Operator)
The strong uptake of renewable energy in Victoria
is reflected across the National Electricity Market
(NEM), in which Victoria participates. NEM market
conditions have already changed enough that
renewable generation technologies are the major
class of new entrants.49 The costs of renewables
and battery storage, at both large and small
scales, continue to decline. Customers with solar
– and more recently with solar and batteries
– are becoming producers and consumers of
electricity, changing the way distribution networks
are managed. The small-scale local production
of electricity combined with improved energy
efficiency and demand reductions leads to flat
or declining demand for grid-supplied electricity
across the NEM.50
43. Note that these figures were calculated using the National Electricity Market Review: ‘Metered Generation (As Generated)’ extracted 3 July 2018 and from data provided by DELWP.
44. Australian Energy Market Operator, ‘Generator Information Page’, Melbourne, Victoria http://www.aemo.com.au/Electricity/Nation-al-Electricity-Market-NEM/Planning-and-forecasting/Generation-in-formation Accessed 12 September 2018.
45. Office of the Chief Parliamentary Counsel Victoria 2017, ‘Renewable Energy (Jobs and Investment) Act 2017’, Melbourne, Victoria http://www.legislation.vic.gov.au/Domino/Web_Notes/LDMS/PubStatbook.nsf/51dea49770555ea6ca256da4001b90cd/F9B4F84D96E4E65A-CA2581D2001B3DC7/$FILE/17-056aa%20authorised.pdf Accessed 4 December 2018.
46. Clean Energy Regulator, ‘Postcode data for small-scale installations’, Canberra, Australia http://www.cleanenergyregulator.gov.au/RET/Forms-and-resources/postcode-data-for-small-scale-installations Accessed 11 September 2018.
47. Australian Energy Market Commission 2018, ‘Annual Market Perfor-mance Review 2017: Final report’, Sydney South, New South Wales https://www.aemc.gov.au/sites/default/files/2018-03/Final%20report.pdf Accessed 4 December 2018.
48. Australian Energy Market Operator 2016, ‘National Electricity Forecasting Report: for the National Electricity Market’, Melbourne, Victoria.
49. Simshauser P 2018, ‘On intermittent renewable generation & the stability of Australia’s National Electricity Market’, Energy Economics, 72, pp. 1-19.
50. Australian Energy Market Operator 2018, ‘Integrated System Plan’, Melbourne, Victoria https://www.aemo.com.au/-/media/Files/Elec-tricity/NEM/Planning_and_Forecasting/ISP/2018/Integrated-Sys-tem-Plan-2018_final.pdf Accessed 4 December 2018.
SCIENTIFIC ASSESSMENTS Part III Energy

Victorian State of the Environment 2018 Scientific Assessments (E)
Along with the growth of renewable electricity
generation, since 2014 Victoria has also recently
seen the retirement of three high-emissions
brown-coal-fired generators (Anglesea, Morwell
and Hazelwood) with a combined capacity of
nearly 2GW.51
Despite these closures, the carbon intensity
of Victoria’s electricity system is likely to be
significantly higher than the best-performing
Australian and international jurisdictions for
many years because of continuing emissions from
Victoria’s existing emissions-intensive electricity
generators. Recent Australian Energy Market
Operator (AEMO) projections, which use brown-
coal-fired power station retirement dates based
on Victorian Government licensing decisions,
suggest that by 2030, brown coal could still be
used to generate around 50% of electricity in
Victoria, and by 2040, brown coal generation could
still provide 33% of electricity generated. This is
a similar proportion to all electricity projected to
be generated from wind in Victoria in the same
year.52,53,54 There is a variability associated with
producing electricity generation projections, which
is demonstrated by Deloitte Access Economics
estimating brown coal will account for 68% of
Victorian electricity generation by 2030 (which is
higher than the 50% estimated by AEMO).55 AEMO’s
modelling projects that electricity generated from
renewable sources in Victoria will double from
2018–19 to 2032–33 (from around 26% to 57%).
However, growth then flattens and electricity
from renewable sources increases by less than 10
percentage points from 2032–33 to 2039–40 (see
Figure E.8).56
The timing of retirement for Victoria’s brown-
coal-fired power stations remains uncertain and
is subject to a complex range of commercial and
financial factors.58 AGL have stated that it plans
to close Loy Yang power station and mine in 2048.
The ongoing operation of coal-fired generation to
provide a third of electricity generated in Victoria
into the late 2040s would likely present challenges
to meeting the state’s net-zero-emissions target
by 2050.59 Victoria’s continued reliance on coal to
generate electricity is in contrast to those OECD
nations that in 2017 had proportions of electricity
generated by fossil fuel combustion considerably
lower than AEMO projections for Victoria in 2040,
including France (<12%), Sweden (<9%) and New
Zealand (<19%).60
51. Australian Energy Market Operator, ‘Generator Information Page’, Melbourne, Victoria http://www.aemo.com.au/Electricity/Nation-al-Electricity-Market-NEM/Planning-and-forecasting/Generation-in-formation Accessed 20 June 2018.
52. Australian Energy Market Operator 2018, ‘Integrated System Plan’, Melbourne, Victoria https://www.aemo.com.au/-/media/Files/Elec-tricity/NEM/Planning_and_Forecasting/ISP/2018/Integrated-Sys-tem-Plan-2018_final.pdf Accessed 4 December 2018.
53. Australian Energy Market Operator, ‘AEMO Map’, http://www.aemo.com.au/aemo/apps/visualisations/map.html Accessed 11 September2018.
54. DEDJTR, ‘Latrobe Valley Mine Rehabilitation: Factsheet June 2018’, http://earthresources.vic.gov.au/__data/assets/pdf_file/0005/1668092/Latrobe-Valley-Mine-Rehabilitation-Factsheet.pdf Accessed 4 December 2018.
55. Deloitte Access Economics 2018, ‘Megatrends and the Victorian Envi-ronment’, Melbourne Victoria.
56. Australian Energy Market Operator, ‘AEMO Map’, neutral scenario, http://www.aemo.com.au/aemo/apps/visualisations/map.html Ac-cessed 11 September 2018.
58. Australian Energy Market Operator 2018, ‘Integrated System Plan’, Melbourne, Victoria https://www.aemo.com.au/-/media/Files/Elec-tricity/NEM/Planning_and_Forecasting/ISP/2018/Integrated-Sys-tem-Plan-2018_final.pdf Accessed 4 December 2018.
59. AGL Energy Limited 2017, ‘Rehabilitation: AGL’s Approach to rehabili-tation of power generation infrastructure’, http://agl2017.reportonline.com.au/sites/agl2017.reportonline.com.au/files/rehabilitation_report.pdf Accessed 4 December 2018.
60. IEA, ‘Electricity Information 2018’, Paris, France.
SCIENTIFIC ASSESSMENTS Part III Energy

Figure E.8 AEMO Integrated System Plan electricity generation outlook projections for
Victoria to 204057
57. Ibid.
SCIENTIFIC ASSESSMENTS Part III Energy

Victorian State of the Environment 2018 Scientific Assessments (E)
Table E.1 Energy system decarbonisation challenges – electricity
Fossil-fuelled system legacy Transformation challenges
Electricity transmission and
distribution networks built to take
electricity from a small number
of large, centrally controlled,
dispatchable fossil-fuelled
generators to passive consumers
whose electricity demands are
assumed to grow over time.61,62
Electricity markets designed
around centrally controlled,
dispatchable fossil-fuelled
generators providing power and
essential system security services
(for example, frequency control
and inertia).
Electricity generation and use represents Victoria’s largest
emissions reduction opportunity with substantial potential
for decarbonisation with existing, proven, low- or zero-carbon
technologies. However, technical, institutional, financial and
market structure challenges need to be addressed to get the
electricity sector to low- or net-zero emissions while maintaining
system security and reliability as well as affordability for
consumers. The following actions are needed:
• NEM reform to ensure the smooth integration of high
proportions of variable renewable generation and distributed
energy resources (including provision of system security
services and ensuring liquidity of electricity financial
markets) as well as incentives for new generation capacity
entry at the right time and in the right location
• new and upgraded transmission networks to link Victoria’s
REZs with its major load centres
• upgraded distribution networks to manage and increase the
integration and participation of distributed energy resources
including demand response, small-scale solar and storage in
energy markets
• system operators with visibility and possibly some control of
small-scale distributed energy resources as well as a possible
future need for Distributed System Operator/Distributed
Market Operator
• ensuring the smooth withdrawal of major coal-fired
generators from the market
• substantially increasing transmission, distribution and
end-use efficiencies – Australia currently ranks poorly
on international measures of energy efficiency and these
national rankings are likely to apply equally well to Victoria.63
Additional Energy Sector Transformation Challenges
A number of additional challenges for the
transformation of Victoria’s energy sector towards
a net-zero-emissions future are outlined further in
Table E.1 to Table E.3 below.
61. Australian Energy Market Operator 2018, ‘AEMO observations: Oper-ational and market challenges to reliability and security in the NEM’, Melbourne, Victoria https://www.aemo.com.au/-/media/Files/Media_Centre/2018/AEMO-observations.pdf Accessed 4 December 2018.
62. Australian Energy Market Operator 2018, ‘Integrated System Plan’, Melbourne, Victoria https://www.aemo.com.au/-/media/Files/Elec-tricity/NEM/Planning_and_Forecasting/ISP/2018/Integrated-Sys-tem-Plan-2018_final.pdf Accessed 4 December 2018.
63. American Council for an Energy-Efficient Economy 2018, ‘The 2018 International Energy Efficiency Scorecard’.
SCIENTIFIC ASSESSMENTS Part III Energy

Table E.2 Energy system decarbonisation challenges – transport
Fossil-fuelled system legacy Transformation challenges
Transport systems built to
prioritise road transport using
internal combustion engines
(including road and fuel
distribution infrastructure) and
ongoing investment that prioritises
road transport. (Road transport
makes up 90% of total transport
energy emissions.)
Land-use planning historically
performed on assumptions of
near universal access to personal,
motorised road transport with
consequent urban sprawl and
comparatively long trip distances
by international standards.
Energy use in transportation makes a substantial contribution to
Victoria’s GHG emissions. Victoria per capita transport emissions
are significantly higher than the OECD average.64,65 Victorian
cars, like those of the rest of Australia, are significantly more
emissions-intensive than those of most other OECD nations.66
Challenges for the transition of Victoria’s transport sector to a
net-zero emissions future include:
• Lack of binding emissions or fuel efficiency standards to
improve the carbon efficiency of motorised transport
• Although the electrification of end-use energy services
in transport is a key decarbonisation pathway,67,68
electrification of passenger and freight (particularly ‘last
mile’) transport69,70 can only make important contributions to
meeting Victoria’s net-zero emissions goals once substantial
reductions in the carbon intensity of electricity production
have occurred
• Other low- or zero-carbon energy technologies for
transport, for example the use of hydrogen as a fuel or the
manufacture of low- and zero- carbon liquid fuels, are not yet
commercially available at scale71
• Transitioning Victoria’s internal combustion engine (ICE)
transport fleet to low- or net-zero-carbon energy is likely to
take decades (the average age of Victorian motor vehicles is
10 years72)
• Significant investments in improved infrastructure will be
needed, for example refuelling infrastructure for non-ICE
vehicles, increased public and active transport investments73
and changes to land use such as increased urban densities in
activity centres well serviced by public and active transport.
64. IEA, ‘CO2 Emissions from fuel combustion 2017’, Paris, France.65. Australian Department of the Environment and Energy, ‘Australian
Greenhouse Emissions Information System’, Canberra, Australia http://ageis.climatechange.gov.au Accessed 4 December 2018.
66. National Transport Commission 2017, ‘Carbon Dioxide Emissions Intensity for New Australian Light Vehicles 2016’, Melbourne, Victoria https://www.ntc.gov.au/Media/Reports/(35220AEE-C4EA-9AC6-1BB6-88D8C66D80F5).pdf Accessed 4 December 2018.
67. IEA 2017, ‘Energy Technology Perspectives 2017’, Paris, France.
68. IEA 2017, ‘Real-world policy packages for sustainable energy transi-tions’, Paris, France.
69. Energeia 2018, Australian Electric Vehicle Market Study: Prepared for ARENA and CEFC.
70. Australian Energy Market Operator 2016, ‘AEMO Insights: Electric Vehicles’, Melbourne, Victoria.
71. Keith DW, Holmes G, St. Angelo D, Heidel K 2018, ‘A Process for Captur-ing CO2 from the Atmosphere’, Joule, 2(8), pp. 1573-1594.
72. Australian Bureau of Statistics 2018, ‘9309.0 Motor Vehicle Census, Australia, 31 Jan 2018’, Canberra, Australia.
73. Climate Council of Australia Limited 2018, ‘Waiting for the greenlight: transport solutions to climate change’, Potts Point, New South Wales.
SCIENTIFIC ASSESSMENTS Part III Energy

Victorian State of the Environment 2018 Scientific Assessments (E)
Fossil-fuelled system legacy Transformation challenges
Low energy efficiency building
stock built on assumptions about
ongoing access to abundant and
cheap energy (primarily gas) for
heating.
Industrial and manufacturing
technologies and systems built
around access to abundant and
cheap electricity, oil and gas.
This is a more challenging area likely to require many specific
solutions. Electrification of heating in buildings and other non-
electricity energy end-uses in industry and manufacturing is
an important option to drive decarbonisation where substantial
reductions in the carbon intensity of electricity production have
occurred,74,75 as are improved energy efficiency standards for
buildings. Options may also exist for decarbonisation pathways
for Victoria’s gas networks.76,77,78 Understanding the carbon
intensity of consumption of imported goods and services may be
an important long-term goal for further decarbonising Victoria’s
economy and society.
Around 10% of Victoria’s remaining 2016 emissions do not come from energy sources. The majority
of these emissions come from non-energy agricultural emissions with the remainder coming from
industrial processes and waste. Land use, land-use change and forestry (LULUCF) sinks reduced
Victoria’s emissions by roughly 10 Mt CO2-e in 2016 from what they would be if LULUCF sinks are not
included in this total emissions calculation.
Table E.3 Energy system decarbonisation challenges – other sectors
Table E.4 Energy system decarbonisation challenges – non-energy emissions
74. IEA 2017, ‘Energy Technology Perspectives 2017’, Paris, France.75. IEA 2017, ‘Real-world policy packages for sustainable energy transi-
tions’, Paris, France.76. Energy Networks Australia 2017, ‘Decarbonising Australia’s gas net-
works’, Melbourne, Victoria.77. Energy Networks Australia 2017, Vision 2050: Reliable, secure energy
and cost-effective carbon reduction’, Melbourne, Victoria.78. Deloitte Access Economics 2017, ‘Decarbonising Australia’s gas distri-
bution networks’, Canberra, Australia.
SCIENTIFIC ASSESSMENTS Part III Energy

Fossil Fuel Futures in Victoria
A transition away from fossil fuels as Victoria’s
primary energy source is likely to relocate energy
industries within Victoria, reduce the value of fossil
fuel energy assets (unless commercially viable,
low-carbon alternative uses can be found), and
alter the role of energy technologies in Victoria’s
energy system. These changes will present
many challenges and opportunities to Victoria’s
workforce, businesses and communities.
The global carbon budget that remains if the
world is to meet the Paris targets requires that
a significant proportion of the world’s fossil fuel
reserves are not burnt.79,80 This has consequences
for Victoria’s future exploitation of existing
reserves, particularly brown coal. The Victorian
Government’s Statement on Future Uses of Brown
Coal states that future, high-value alternative uses
of brown coal will only be supported and allowed
by the Victorian Government where proponents
can demonstrate operations are viable in a low-
emission future economy and where a strong
emissions standard can be met.
Carbon capture and storage (CCS) will be required
for commercial-scale brown coal projects
to achieve this outcome. One example is the
Hydrogen Energy Supply Chain pilot project.81
Success of the commercial project is conditional
on the hydrogen being produced with near-zero
greenhouse gas emissions and a CCS solution
being available. While the success of this project
would enhance the potential for hydrogen to
play a role in the decarbonisation of both the
transport and electricity sectors, the International
Energy Agency (IEA) has recently assessed CCS
technology development as currently too slow
to be on a trajectory to contribute meaningfully
to the Paris Agreement’s goals. 82 It remains
unclear whether CCS will develop sufficiently as
a cost-effective technology that would allow the
continued exploitation of fossil fuels such as brown
coal in a net-zero emissions future.83,84 Victoria
continues to investigate a CCS network via the
CarbonNet Project.
Victorian Government Action in the Energy Transition
In recognition of the overarching Climate Change
Act target, the Victorian Government has also
committed to 15–20% emissions reduction on 2005
levels by 2020, and emissions reductions from
government operations by 30% below 2015 levels
by 2020, which will largely be met by changing
government energy use. Further interim targets
to take the state to net-zero by 2050 will come
into effect from 2021. Alongside the Victorian
Renewable Energy Targets (VRETs), the state
has committed to a major energy efficiency and
productivity strategy, which has an aspirational
goal of improving energy productivity by 50%
on 2015 levels by 2030.85 Other specific Victorian
Government actions are detailed in the next
section (linked to the relevant indicators).
79. Millar RJ, Fuglestvedt JS, Friedlingstein P, Rogelj J, Grubb MJ, Mat-thews HD, Skeie RB, Forster PM, Frame DJ, Allen MR 2017, ‘Emission budgets and pathways consistent with limiting warming to 1.5 C’, Nature Geoscience, 10, pp. 741-747.
80. Meinshausen M, Meinshausen N, Hare W, Raper SCB, Frieler K, Knutti R, Frame DJ, Allen MR 2009, ‘Greenhouse-gas emission targets for limiting global warming to 2 °C’, Nature, 458, pp. 1158–1162.
81. Victorian State Government 2016, ‘Latrobe Valley Set To Be World Leader On Hydrogen’, Melbourne, Victoria, https://www.premier.vic.gov.au/latrobe-valley-set-to-be-world-leader-on-hydrogen/ Ac-cessed 4 December 2018.
82. IEA 2017, ‘Energy Technology Perspectives 2017’, Paris, France.83. Haszeldine RS, Flude S, Johnson G, Scott V 2018, ‘Negative emissions
technologies and carbon capture and storage to achieve the Paris Agreement commitments’, Philosophical Transactions of the Royal Society A, 376(20160447) pp. 1-23.
84. Marshall JP 2016, ‘Disordering fantasies of coal and technology: Car-bon capture and storage in Australia’, Energy Policy, 99, pp. 288-298.
85. DELWP 2017, ‘Energy Efficiency and Productivity Strategy’, East Melbourne, Victoria https://www.energy.vic.gov.au/__data/assets/pdf_file/0030/89292/Energy-Efficiency-and-Productivity-Strategy-Web.pdf Accessed 4 December 2018.
SCIENTIFIC ASSESSMENTS Part III Energy

Victorian State of the Environment 2018 Scientific Assessments (E)
Current Victorian Government Settings: Legislation, Policy, Programs
Energy Consumption and Electricity
The Victorian Government has been supporting
Victoria’s energy transition by increasing the
supply of renewable energy and subsequently
reducing Victoria’s reliance on fossil fuels. Key
Victorian Government actions to support the
state’s energy transition include:
• allocating $122 million in the 2017–18 Victorian
budget for projects to upgrade energy
systems86
• legislating for an emissions reduction target of
net-zero greenhouse gas emissions by the year
2050, in the Climate Change Act 2017.87 Interim
targets to assist with the end target will come
into effect from 2021.
• working towards VRETs (to generate 25% of
Victoria’s electricity from renewable energy
by 2020 and 40% by 2025), legislated in the
Renewable Energy (Jobs and Investment) Act
2017.88 The government’s work on these targets
includes $146 million in investment through the
Renewable Energy Action Plan.89
• using the government’s energy purchasing
power to source renewable energy certificates
from new wind and solar farms in Victoria
– bringing forward around 351 MW of new
renewable capacity, including 35 MW to match
the electricity used by Melbourne’s tram
network.90
• entering a support agreement with Neoen
Australia to deliver the 200 MW Bulgana Green
Power Hub project, a major new wind farm with
battery storage in Stawell. The wind farm is
due to be completed by late 2019.91
• launching the Victorian Renewable Energy
Auction Scheme, Australia’s largest ever
reverse auction, for up to 650 MW of new
renewable energy generation.92 This Scheme
supports Victoria to achieve the VRETs.
• requiring Victorian electricity retailers to offer
a minimum feed-in tariff (a minimum rate that
electricity retailers must pay) to households
and small businesses for clean electricity
exported to the grid93
• releasing the New Energy Technologies –
Sector Strategy (2016) which aims to position
Victoria to capture new jobs arising from the
energy sector’s transformation and includes
$20 million for a New Energy Jobs Fund94
• developing the Energy Efficiency and
Productivity Strategy (2017), which outlines $55
million of investment in new and expanded
action on energy efficiency and includes an
aspirational energy productivity target of 50%
improvement in Victoria’s energy productivity
from 2015 to 203095
• legislating energy savings targets under the
Victorian Energy Efficiency Target Act 200796
86. DELWP 2017, ‘Victorian Budget 2017/18 Factsheet: Energy’, East Melbourne https://www2.delwp.vic.gov.au/__data/assets/pdf_file/0026/63827/Budget-2017-18-Fact-Sheet-Energy-.pdf Accessed 4 December 2018.
87. Office of the Chief Parliamentary Counsel Victoria 2017, ‘Climate Change Act 2017’, Melbourne, Victoria http://www.legislation.vic.gov.au/Domino/Web_Notes/LDMS/PubStatbook.nsf/f932b66241ecf1b-7ca256e92000e23be/05736C89E5B8C7C0CA2580D50006FF95/$-FILE/17-005aa%20authorised.pdf Accessed 4 December 2018.
88. Office of the Chief Parliamentary Counsel Victoria 2017, ‘Renewable Energy (Jobs and Investment) Act 2017’, Melbourne, Victoria http://www.legislation.vic.gov.au/Domino/Web_Notes/LDMS/PubStatbook.nsf/51dea49770555ea6ca256da4001b90cd/F9B4F84D96E4E65A-CA2581D2001B3DC7/$FILE/17-056aa%20authorised.pdf Accessed 4 December 2018.
89. DELWP 2017, ‘Renewable Energy Action Plan’, East Melbourne, Victoria https://www.energy.vic.gov.au/__data/assets/pdf_file/0014/74012/Web-pdf-Renewable-Energy-Action-Plan.pdf Accessed 4 December 2018.
90. DELWP, ‘Government renewable energy purchasing’, East Melbourne, Victoria https://www.energy.vic.gov.au/renewable-energy/victori-as-renewable-energy-roadmap/government-renewable-energy-pur-chasing Accessed 4 December 2018.
91. Victorian State Government 2018, ‘Construction begins on Bulgana green power hub’, Melbourne, Victoria https://www.premier.vic.gov.au/wp-content/uploads/2018/05/180516-Construction-Begins-On-Bul-gana-Green-Power-Hub.pdf Accessed 4 December 2018.
92. DELWP, ‘Victorian Renewable Energy Auction Scheme’, East Mel-boune, Victoria https://www.energy.vic.gov.au/__data/assets/pdf_file/0014/80510/VRET-fact-sheet-Auction.pdf Accessed 4 December2018.
93. Essential Services Commission 2018, ‘Minimum electricity feed-in tariffs to apply from 1 July 2018’, Melbourne, Victoria https://www.esc.vic.gov.au/sites/default/files/documents/minimum-electricity-feed-in-tariffs-to-apply-from-1-July-2018-final-decision-20180227.pdf Accessed 4 December 2018.
94. DEDJTR 2016, ‘New Energy Technologies: sector strategy’, Mel-bourne, Victoria https://www.energy.vic.gov.au/__data/assets/pdf_file/0033/73779/New_Energy_Technology_Strategy_-_web_ver-sion_-_20160308.PDF Accessed 4 December 2018.
95. DELWP 2017, ‘Energy Efficiency and Productivity Strategy’, East Melbourne, Victoria https://www.energy.vic.gov.au/__data/assets/pdf_file/0030/89292/Energy-Efficiency-and-Productivity-Strategy-Web.pdf Accessed 4 December 2018.
96. Office of the Chief Parliamentary Counsel Victoria 2007, ‘Victorian Energy Efficiency Target Act 2007’, Melbourne, Victoria http://www.legislation.vic.gov.au/Domino/Web_Notes/LDMS/PubStatbook.nsf/f932b66241ecf1b7ca256e92000e23be/05736C89E5B8C7C0CA2580D-50006FF95/$FILE/17-005aa%20authorised.pdf Accessed 4 Decem-ber 2018.
SCIENTIFIC ASSESSMENTS Part III Energy

• strengthening the Victorian Energy Upgrades
program, which, since 2009, has supported
approximately 1.8 million households and
80,000 businesses to undertake energy
efficiency activities – saving over 46 million
tonnes of greenhouse gas emissions97
• allocating $33 million to improve the energy
efficiency of government buildings through
the Greener Government Buildings program,
which is anticipated to save 25,000 tonnes of
greenhouse gas emissions annually98
• assisting Victorian businesses to get expert
advice on saving energy and to make capital
investments to improve gas efficiency through
Sustainability Victoria’s $6.1 million Boosting
Business Productivity program99
• supporting 50 poorly performing commercial
buildings and tenancies to implement energy
efficiency improvements through the Better
Commercial Buildings grants program100
• supporting the Victorian households most in
need to undertake energy upgrades through
the $17 million Home Energy Assist program101
• implementing the $25 million Energy Storage
Initiative, which includes funding for two large-
scale storage facilities in western Victoria
– one in Ballarat connected to the Ballarat
Terminal Station and another connected to the
Gannawarra Solar Farm.102
97. DELWP, ‘Victorian Energy Upgrades’, East Melbourne, Melbourne https://www.energy.vic.gov.au/energy-efficiency/victorian-ener-gy-upgrades Accessed 4 December 2018.
98. Victorian State Government 2016, ‘Greener Government Buildings to Save $100 million’, Melbourne, Victoria https://www.premier.vic.gov.au/greener-government-buildings-to-save-100-million/ Accessed 4 December 2018.
99. Sustainability Victoria, ‘Grants for Businesses’, Melbourne, Victoria https://www.sustainability.vic.gov.au/business/efficient-business-op-erations/boosting-business-productivity Accessed 4 December 2018.
100. Sustainability Victoria, ‘Better Commercial Buildings’, Melbourne, Vic-toria https://www.sustainability.vic.gov.au/betterbuildings Accessed 4 December 2018.
101. DELWP, ‘Home Energy Assist Program, Victoria State Government’, East Melbourne, Victoria, https://www.victorianenergysaver.vic.gov.au/get-help-with-your-bills/concessions-and-rebates/home-ener-gy-assist-program Accessed 4 December 2018.
102. DELWP 2018, ‘Renewable Energy Technology: energy storage - large-scale batteries, East Melbourne, Victoria https://www.energy.vic.gov.au/__data/assets/pdf_file/0016/123406/Large-scale-battery-stor-age-fact-sheet.pdf Accessed 4 December 2018.
• boosting energy productivity through the
National Energy Productivity Plan 2015–2030,
a COAG-led national plan to achieve a
40% improvement in energy productivity in
Australia by 2030.103
103. COAG Energy Council 2015, ‘National Energy Productivity Plan 2015-2030’, Canberra, Australia http://www.coagenergycouncil.gov.au/sites/prod.energycouncil/files/publications/documents/National%20Energy%20Productivity%20Plan%20release%20version%20FINAL_0.pdf Accessed 4 December 2018.
SCIENTIFIC ASSESSMENTS Part III Energy

Victorian State of the Environment 2018 Scientific Assessments (E)
Transport and Energy
The Commonwealth and Victorian Governments
are investing over $38 billion in road and rail
transport infrastructure projects to improve the
reliability and efficiency of the Victorian transport
system.104 The extent to which these projects will
change Victoria’s transport energy use or the
carbon intensity of transport is not clear. Many of
Victoria’s major transport infrastructure projects
involve extending or improving freeways; these
are likely to support and encourage increased use
of internal combustion engine (ICE) vehicles as
Victoria’s primary transport option.
The Parliament of Victoria Economy and
Infrastructure Committee published the report
from their Inquiry into Electric Vehicles in
May 2018.105 This was not associated with any
project funding, however, it provided important
background information on the potential future for
electric vehicles in Victoria.
104. Transport for Victoria 2018, ‘Overview of current projects’, Melbourne, Victoria https://transport.vic.gov.au/our-transport-future/our-pro-jects Accessed 4 December 2018.
105. Parliament of Victoria 2018, ‘Inquiry into electric vehicles’, Melbourne, Victoria https://parliament.vic.gov.au/909-eic/inquiry-into-elec-tric-vehicles Accessed 4 December 2018.
SCIENTIFIC ASSESSMENTS Part III Energy

Victorian State of the Environment 2018 Scientific Assessments (E)
Energy Consumption
Summary of Energy Indicators
Total energy consumption in Victoria increased
by 29% from 1989–90 to 2015–16, however
consumption has been relatively stable since
2005–06. Energy consumption per capita has
decreased since reaching a peak in 2005–06.
However, the data suggests that energy
consumption has not yet decoupled from
population and economic growth.
Victoria’s energy system is highly fossil-fuel
dependant. Despite a small decrease in energy
consumption from fossil fuels since 2008–09,
energy sourced from the burning of fossil fuels
provides over 96% of all energy consumed in
Victoria in 2015–16. The share of consumption from
renewable energy has doubled in this period, but
the total share of renewables remains small (<4%)
when compared to the consumption of energy from
fossil fuels.
Greenhouse gas emissions associated with the
energy sector reflect Victoria’s heavy reliance
on fossil fuels for energy. In 2016, emissions from
energy accounted for 90% of Victoria’s total
greenhouse gas emissions. Energy emissions
remain well above 1990 levels, despite generally
decreasing since 2012.
SCIENTIFIC ASSESSMENTS Part III Energy

Overall Energy Consumption
WASTE
ENERGY
Indicator StatusUNKNOWN POOR FAIR GOOD
Data Quality
W:01 Total Waste Generation
DATA QUALITY
Good
W:02 Generation of municipal waste per capita
DATA QUALITY
Good
W:03 Total Waste Generated
DATA QUALITY
Good
W:04 Diverson Rate
DATA QUALITY
Good
W:05 Litter and Illegal Dumping
DATA QUALITY
Poor
W:06 Total Hazardous Waste managed and reported
DATA QUALITY
Fair
Indicator Status UNKNOWN POOR FAIR GOOD
Data Quality
E:01 Energy use per capita
DATA QUALITY
Good
E:02 Total energy consumption byfuel
DATA QUALITY
Good
E: 03 Consumption of renewable energy as a share of total energyconsumption DATA QUALITY
Good
Trend
Trend
SectorEnergy consumption
1989–90
Energy consumption
2015–16
Difference
1989–90 to 2015–16
PJ Share (%) PJ Share (%) PJ
Agriculture 10.4 0.9 15.5 1.1 5.1
Mining 25.8 2.3 30.1 2.1 4.3
Manufacturing 226.3 20.6 205.7 14.5 −20.6
Electricity generation 377.5 34.3 511.1 36.1 133.6
Construction 9.8 0.9 4.8 0.3 −5.0
Transport 260.2 23.7 367.1 25.9 106.9
Commercial (b) 46.2 4.2 101.3 7.1 55.1
Residential 124.2 11.3 170.9 12.1 46.7
Other (c) 19.4 1.8 10.3 0.7 −9.1
Total 1,099.8 100.0 1,416.9 100.0 317.1
Victoria’s total energy consumption increased by
29% (317 petajoules (PJ)) between 1989–90 and
2015–16 (Table E.5). Total energy consumption
reached a peak in 2011–12 at 1,448 PJ (Figure E.10).
Energy consumption per capita has remained
relatively stable over the period, decreasing
by around 8.6% since 1990 (Figure E.4). Energy
efficiency improvements have helped to reduce per
capita consumption, however, these improvements
are not accelerating at the rate required to drive a
substantial decrease in total energy consumption.
This has implications for Victoria’s total
greenhouse gas emissions particularly given the
majority of Victoria’s energy is currently supplied
by fossil fuels.
Table E.5 Victoria’s energy consumption by sector, difference between 1989–90 and 2015–16106
106. Department of Environment and Energy 2017, ‘Australian Energy Statistics 2017’, Canberra, Australia.
Data Custodian DEE
SCIENTIFIC ASSESSMENTS Part III Energy

Victorian State of the Environment 2018 Scientific Assessments (E)
WASTE
ENERGY
Indicator StatusUNKNOWN POOR FAIR GOOD
Data Quality
W:01 Total Waste Generation
DATA QUALITY
Good
W:02 Generation of municipal waste per capita
DATA QUALITY
Good
W:03 Total Waste Generated
DATA QUALITY
Good
W:04 Diverson Rate
DATA QUALITY
Good
W:05 Litter and Illegal Dumping
DATA QUALITY
Poor
W:06 Total Hazardous Waste managed and reported
DATA QUALITY
Fair
Indicator Status UNKNOWN POOR FAIR GOOD
Data Quality
E:01 Energy use per capita
DATA QUALITY
Good
E:02 Total energy consumption byfuel
DATA QUALITY
Good
E: 03 Consumption of renewable energy as a share of total energyconsumption DATA QUALITY
Good
Trend
Trend
Energy Consumption by Fuel Source
WASTE
ENERGY
Indicator StatusUNKNOWN POOR FAIR GOOD
Data Quality
W:01 Total Waste Generation
DATA QUALITY
Good
W:02 Generation of municipal waste per capita
DATA QUALITY
Good
W:03 Total Waste Generated
DATA QUALITY
Good
W:04 Diverson Rate
DATA QUALITY
Good
W:05 Litter and Illegal Dumping
DATA QUALITY
Poor
W:06 Total Hazardous Waste managed and reported
DATA QUALITY
Fair
Indicator StatusUNKNOWN POOR FAIR GOOD
Data Quality
E:01 Energy use per capita
DATA QUALITY
Good
E:02 Total energy consumption by fuel
DATA QUALITY
Good
E: 03 Consumption of renewable energy as a share of total energy consumption DATA QUALITY
Good
Trend
Trend
Energy consumption in Victoria has remained
relatively flat since 2005–06 (Figure E.9). Brown
coal is the primary fuel consumed for energy
in Victoria, accounting for 44% of total energy
consumption in 2015–16 (Table E.6). This is almost
entirely used for electricity generation. Since
2011–12, consumption of coal has decreased by
11% (77 PJ). These reductions are associated with
a reduction in total electricity generation from
brown coal due to the closure of coal-fired power
stations in Victoria.107 The latest Australian Energy
Statistics fuel consumption data for Victoria does
not include the closure of Hazelwood power station
which occurred in 2017. However, as outlined in
Table E.7, additional electricity-only data sets
show that brown-coal-fired electricity generation
in Victoria decreased from 90% of the state’s
electricity generation in 2010–11 to 75% in 2017–18.
This includes a 15% decrease between 2016–17 and
2017–18, as a result of the closure of the Hazelwood
power station.
Figure E.9 Proportion of Victoria’s energy consumption by fuel type108
107. Australian Energy Market Operator, ‘Generator Information Page’, Melbourne, Victoria http://www.aemo.com.au/Electricity/Nation-al-Electricity-Market-NEM/Planning-and-forecasting/Generation-in-formation Accessed 20 June 2018.
108. Department of Environment and Energy 2017, ‘Australian Energy Statistics 2017: Table C3’, Canberra, Australia. Note there is a 1%–2% statistical discrepancy in these figures.
Data Custodian DEE
Data Custodian DEE
SCIENTIFIC ASSESSMENTS Part III Energy

Fuel type
Energy consumption 2008–09
Energy consumption 2015–16
Difference 2008–09 to 2015–16
PJ Share (%) PJ Share (%) PJ
Coal 695.2 48.9 617.8 43.6 −77.4
Oil 430.8 30.3 480.3 33.9 49.5
Gas 280.4 19.7 284.2 20.1 3.8
Renewables 27.5 1.9 55.1 3.9 27.6
Total 1,421.0 100.0 1,416.9 100.0 −4.1
The decrease in consumption of brown coal
has been offset by an increase in consumption
of renewables and a minor increase in gas
consumption (Table E.6). Renewable energy
accounted for 4% of Victoria’s energy consumption
in 2015–16, increasing from 2% in 2008–09 (Figure
E.9). While trending up, renewable energy still
accounts for a small amount of total energy
consumption in Victoria. For comparison, in
2015–16 over 10 times more energy was consumed
from coal than renewable sources (Table E.6).
However, as more renewables become available in
Victoria’s energy system in response to the state’s
Renewable Energy Target and declining cost of
renewable technology, consumption of energy from
renewable sources is expected to increase.
Table E.6 Victoria’s energy consumption by fuel type, difference between 2008–09 and 2015–16109
Oil is the second largest fuel consumed for energy
in Victoria, accounting for 34% of Victoria’s
total energy consumption in 2015–16 (Table E.6).
This includes crude oil, liquefied petroleum gas
(LPG) and refined products, which are primarily
used for fuel in the transport sector. This sector
has experienced an increase in total energy
consumption which can account for some of the
increase in oil consumption. Refer to the Energy in
transport section (below) for further details.
Natural gas comprised 20% of Victoria’s energy
consumption in 2015–16 (Table E.6). This is primarily
used for space heating, industry and other non-
domestic uses – such as in hospitals where it
accounts for around 50% of total energy use.110 The
share of gas consumption in Victoria has remained
stable over the period.
109. Ibid.
110. DHHS 2017, ‘Annual Report 2016-17’, Melbourne, Victoria https://dhhs.vic.gov.au/sites/default/files/documents/201710/DHHS-annual-re-port-2016-17_20171016.pdf Accessed 4 December 2018.
SCIENTIFIC ASSESSMENTS Part III Energy

Victorian State of the Environment 2018 Scientific Assessments (E)
Energy Consumption by Industry ENERGY
TRANSPORT
Indicator Status UNKNOWN POOR FAIR GOOD
Data Quality
E:04 Total net energy consumption by industry sector
DATA QUALITY
Fair
E:05 Total electricity consumption
DATA QUALITY
Good
E:06 Total electricity generation by fuel
DATA QUALITY
Good
E:07 Share of renewable energy generation of total electricitygeneration DATA QUALITY
Good
E:08 Energy used in the transportsector
DATA QUALITY
Good
E:09 Per capita transport energy use
DATA QUALITY
Good
Indicator StatusUNKNOWN POOR FAIR GOOD
Data Quality
T:01 Travel demand
DATA QUALITY
Good
T:02 Greenhouse gas emission and emission intensities from transport
DATA QUALITY
Good
T:03 Air pollution from transport
DATA QUALITY
Poor
Fair for motor vehicles and
Unknown for rail and shipping
Trend
Trend
Energy consumption across industry sectors
has followed a similar pattern to total energy
consumption in Victoria, generally increasing
between 1989–90 and 2015–16 (Figure E.10).
All sectors have an increased total energy
consumption, with the exception of manufacturing,
construction and other. The decrease in
manufacturing energy consumption can be linked
to the decline of manufacturing in the Victorian
economy over the period.
Electricity generation, transport and
manufacturing are the largest energy-consuming
sectors, accounting for over three-quarters of
total energy consumption in Victoria in 2015–16. As
identified in the Background section, these sectors
contribute significantly to Victoria’s total GHG
emissions due to the dominance of fossil fuels in
Victoria’s energy system. Each sector is discussed
in the Electricity, Energy in transport and Other
energy sections below.
Figure E.10 Energy consumption by industry sector in Victoria, 1989–90 to 2015–16111
111. Department of Environment and Energy 2017, ‘Australian Energy Statistics 2017: Table E3’, Canberra, Australia.
ENERGY
TRANSPORT
Indicator StatusUNKNOWN POOR FAIR GOOD
Data Quality
E:04 Total net energy consumptionby industry sector
DATA QUALITY
Fair
E:05 Total electricity consumption
DATA QUALITY
Good
E:06 Total electricity generation by fuel
DATA QUALITY
Good
E:07 Share of renewable energy generation of total electricitygeneration DATA QUALITY
Good
E:08 Energy used in the transportsector
DATA QUALITY
Good
E:09 Per capita transport energy use
DATA QUALITY
Good
Indicator StatusUNKNOWN POOR FAIR GOOD
Data Quality
T:01 Travel demand
DATA QUALITY
Good
T:02 Greenhouse gas emission and emission intensities from transport
DATA QUALITY
Good
T:03 Air pollution from transport
DATA QUALITY
Poor
Fair for motor vehicles and
Unknown for rail and shipping
Trend
Trend
Data Custodian DEE
SCIENTIFIC ASSESSMENTS Part III Energy

ENERGY
TRANSPORT
Indicator Status UNKNOWN POOR FAIR GOOD
Data Quality
E:04 Total net energy consumptionby industry sector
DATA QUALITY
Fair
E:05 Total electricity consumption
DATA QUALITY
Good
E:06 Total electricity generation by fuel
DATA QUALITY
Good
E:07 Share of renewable energy generation of total electricitygeneration DATA QUALITY
Good
E:08 Energy used in the transportsector
DATA QUALITY
Good
E:09 Per capita transport energy use
DATA QUALITY
Good
Indicator StatusUNKNOWN POOR FAIR GOOD
Data Quality
T:01 Travel demand
DATA QUALITY
Good
T:02 Greenhouse gas emission and emission intensities from transport
DATA QUALITY
Good
T:03 Air pollution from transport
DATA QUALITY
Poor
Fair for motor vehicles and
Unknown for rail and shipping
Trend
Trend
ENERGY
TRANSPORT
Indicator StatusUNKNOWN POOR FAIR GOOD
Data Quality
E:04 Total net energy consumptionby industry sector
DATA QUALITY
Fair
E:05 Total electricity consumption
DATA QUALITY
Good
E:06 Total electricity generation by fuel
DATA QUALITY
Good
E:07 Share of renewable energy generation of total electricitygeneration DATA QUALITY
Good
E:08 Energy used in the transportsector
DATA QUALITY
Good
E:09 Per capita transport energy use
DATA QUALITY
Good
Indicator StatusUNKNOWN POOR FAIR GOOD
Data Quality
T:01 Travel demand
DATA QUALITY
Good
T:02 Greenhouse gas emission and emission intensities from transport
DATA QUALITY
Good
T:03 Air pollution from transport
DATA QUALITY
Poor
Fair for motor vehicles and
Unknown for rail and shipping
Trend
Trend
Electricity
Summary of Indicators
The electricity sector in Victoria continues to be
heavily supplied by coal, which contributes 75%
of total electricity generation in 2017–18. However,
an increasing proportion of electricity is being
supplied by renewable sources, increasing from 9%
of total generation in 2010–11 to 19% in 2017–18.
This trend is reflected in the changes in Victoria’s
emissions from electricity. Emissions were
increasing until 2011 and have declined since,
however, they remain well above 1990 levels.
Victoria’s electricity system is a major contributor
to the state’s total emissions, producing over 50%
of total emissions in 2016.
Consumption of Electricity
Victoria’s total electricity consumption increased
by around 28% (10,666 GWh) between 1989–90
and 2015–16 (Figure E.11). This has occurred with
two main peaks, in 2001–02 (53,091 GWh) and
2009–10 (54,606 GWh). Over the past five years,
consumption has not increased and has been
declining marginally; however, it remains well
above 1989–90 levels.
Data Custodian DEE
SCIENTIFIC ASSESSMENTS Part III Energy

Victorian State of the Environment 2018 Scientific Assessments (E)
Figure E.11 Total annual electricity consumption, Victoria, 1989–90 to 2015–16112
The change in electricity consumption over the
period is predominately due to population and
economic growth combined with increasing
offsets by small-scale, distributed generation
and energy efficiency, which are likely to stabilise
overall demand for grid-supplied electricity.113
Stable demand for grid-supplied energy
despite population growth will assist Victoria’s
energy transformation, particularly if the grid is
increasingly supplied from renewable sources.
112. Department of Environment and Energy 2017, ‘Australian Energy Statistics 2017: Table L’, Canberra, Australia.
113. Australian Energy Market Operator 2017, Electricity Forecasting In-sights: for the national electricity market, Melbourne, Victoria https://www.aemo.com.au/-/media/Files/Electricity/NEM/Planning_and_Forecasting/EFI/2017-Electricity-Forecasting-Insights.pdf Accessed 4 December 2018.
SCIENTIFIC ASSESSMENTS Part III Energy

Electricity Generation by FuelENERGY
TRANSPORT
Indicator Status UNKNOWN POOR FAIR GOOD
Data Quality
E:04 Total net energy consumptionby industry sector
DATA QUALITY
Fair
E:05 Total electricity consumption
DATA QUALITY
Good
E:06 Total electricity generation by fuel
DATA QUALITY
Good
E:07 Share of renewable energy generation of total electricitygeneration DATA QUALITY
Good
E:08 Energy used in the transportsector
DATA QUALITY
Good
E:09 Per capita transport energy use
DATA QUALITY
Good
Indicator StatusUNKNOWN POOR FAIR GOOD
Data Quality
T:01 Travel demand
DATA QUALITY
Good
T:02 Greenhouse gas emission and emission intensities from transport
DATA QUALITY
Good
T:03 Air pollution from transport
DATA QUALITY
Poor
Fair for motor vehicles and
Unknown for rail and shipping
Trend
Trend
ENERGY
TRANSPORT
Indicator StatusUNKNOWN POOR FAIR GOOD
Data Quality
E:04 Total net energy consumptionby industry sector
DATA QUALITY
Fair
E:05 Total electricity consumption
DATA QUALITY
Good
E:06 Total electricity generation by fuel
DATA QUALITY
Good
E:07 Share of renewable energy generation of total electricity generation DATA QUALITY
Good
E:08 Energy used in the transportsector
DATA QUALITY
Good
E:09 Per capita transport energy use
DATA QUALITY
Good
Indicator StatusUNKNOWN POOR FAIR GOOD
Data Quality
T:01 Travel demand
DATA QUALITY
Good
T:02 Greenhouse gas emission and emission intensities from transport
DATA QUALITY
Good
T:03 Air pollution from transport
DATA QUALITY
Poor
Fair for motor vehicles and
Unknown for rail and shipping
Trend
Trend
Electricity generation in Victoria decreased
between 2010–11 and 2017–18 by 15% (8.77 TWh).
This decrease primarily occurred between 2016–17
and 2017–18 where generation decreased by 11%
(6.35 TWh) due to the closure of the Hazelwood
power station (Figure E.12).
Figure E.12 Victoria’s annual electricity generation by fuel type, 2010–11 to 2017–18114
114. Note that these figures were calculated using the National Electricity Market Review: ‘Metered Generation (As Generated)’ extracted 3 July 2018 and from data provided by DELWP.
Data Custodian DELWP, NEM Review, Metered Generation and DELWP estimates
Data Custodian DELWP, NEM Review, Metered
Generation and DELWP estimates
SCIENTIFIC ASSESSMENTS Part III Energy

Victorian State of the Environment 2018 Scientific Assessments (E)
Brown coal remains the major fuel source for
electricity generation in Victoria, consisting of
75% of Victoria’s total electricity generation in
2017–18. Electricity generation from brown coal has
decreased by 29% (14.8 TWh) between 2010–11 and
2017–18, a decrease which has been partially offset
by increases in electricity generation from gas and
renewables (Table E.7).
The proportion of electricity generation from
renewable sources has been gradually increasing,
providing approximately 19% of Victoria’s
electricity generation in 2017–18. This represents
almost double the generation between 2010–11 and
2017–18.
Electricity generation
2010–11
Electricity generation
2017–18
Difference
2010–11 to
2017–18
TWh Share (%) TWh Share (%) TWh
Non-renewable sources
Coal 50.92 89.5 36.11 75.0 −14.82
Gas 0.72 1.3 2.98 6.2 2.26
Total Non-renewable sources 51.64 90.8 39.09 81.2 −12.56
Renewable sources
Hydro 3.44 6.0 2.65 5.5 -0.78
Wind 1.26 2.2 4.22 8.8 2.96
Biomass 0.34 0.6 0.71 1.5 0.37
Solar 0.21 0.4 1.45 3.0 1.24
Total Renewable sources 5.24 9.2 9.04 18.8 3.79
Total generation 56.89 100.0 48.12 100.0 −8.77
Table E.7 Annual electricity generation in Victoria by fuel type, difference between 2010–11 and 2017–18115
115. Ibid.
SCIENTIFIC ASSESSMENTS Part III Energy
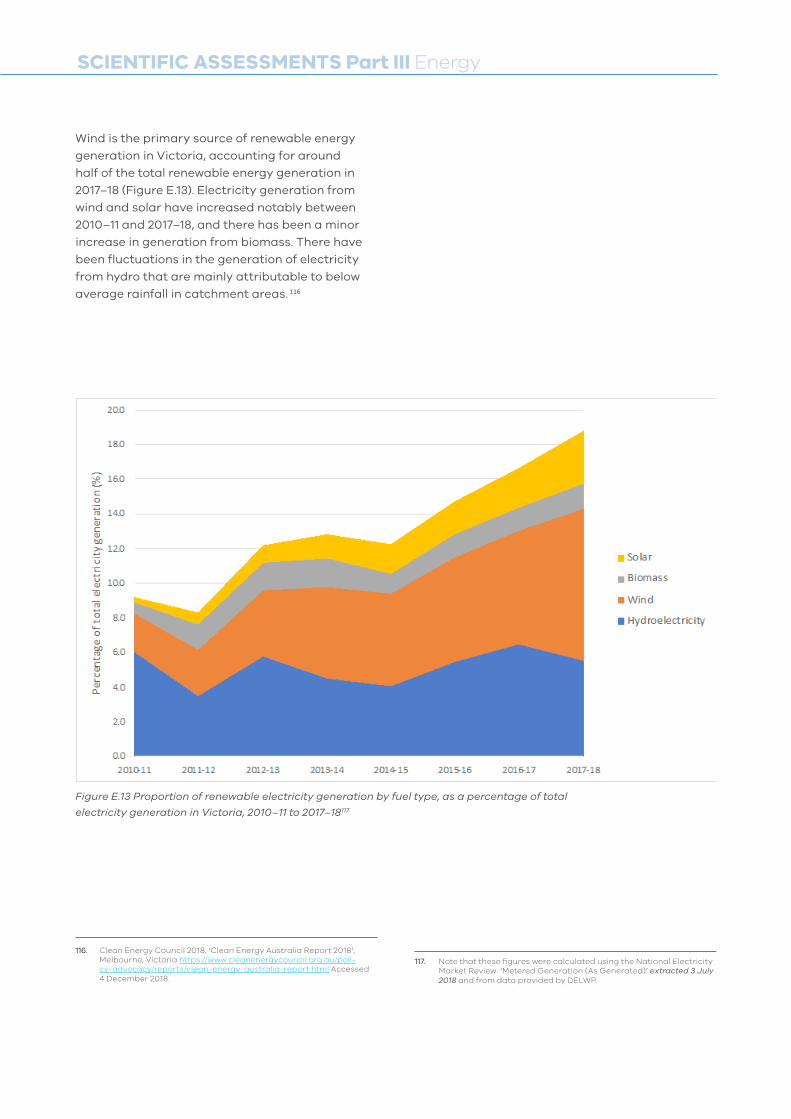
Wind is the primary source of renewable energy
generation in Victoria, accounting for around
half of the total renewable energy generation in
2017–18 (Figure E.13). Electricity generation from
wind and solar have increased notably between
2010–11 and 2017–18, and there has been a minor
increase in generation from biomass. There have
been fluctuations in the generation of electricity
from hydro that are mainly attributable to below
average rainfall in catchment areas. 116
Figure E.13 Proportion of renewable electricity generation by fuel type, as a percentage of total
electricity generation in Victoria, 2010–11 to 2017–18117
116. Clean Energy Council 2018, ‘Clean Energy Australia Report 2018’, Melbourne, Victoria https://www.cleanenergycouncil.org.au/poli-cy-advocacy/reports/clean-energy-australia-report.html Accessed4 December 2018.
117. Note that these figures were calculated using the National Electricity Market Review: ‘Metered Generation (As Generated)’ extracted 3 July 2018 and from data provided by DELWP.
SCIENTIFIC ASSESSMENTS Part III Energy

Victorian State of the Environment 2018 Scientific Assessments (E)
2007 2008 2009 2010 2011 2012 2013 2014 2015 2016 2017
Per year (MW) 1.09 2.84 13.33 58.98 142.09 206.64 135.33 172.91 151.15 146.14 196.1
Cumulative Total (MW) (a) 1.09 3.93 17.26 76.24 218.33 424.97 560.3 733.21 884.36 1,030.5 1,226.6
Rooftop solar PV capacity in Victoria has grown
significantly over the past decade. The total
installed capacity in 2017 was around 1,227 MW
(Table E.8). Victoria has the third largest installed
capacity in Australia, behind Queensland and
New South Wales.118 In Victoria, solar PV uptake
peaked in 2012, with around 206 MW installed
due to the rapid decline in the cost of solar PV
installation supported by high feed-in tariffs (Table
E.8). Installed capacity rose again in 2017, due to
significant cost reductions that have made larger
PV systems more affordable to households and
a growing level of uptake from the commercial
sector. 119 The average Australian solar PV system
size has increased from 1.28 kW in 2009 to 6.27 kW
in 2017. 120
Table E.8 Annual installed capacity of small-scale solar PV in Victoria, 2007–2017121
(a) Total includes pre-2007 installations
Figure E.14 Cumulative capacity of small-scale solar PV installations in Victoria, 2007–2017122
118. Clean Energy Council 2018, ‘Clean Energy Australia Report 2018’, Melbourne, Victoria https://www.cleanenergycouncil.org.au/poli-cy-advocacy/reports/clean-energy-australia-report.html Accessed4 December 2018.
119. Jacobs Group (Australia) Pty Limited 2017, ‘Projections of uptake of small-scale systems’, Melbourne, Victoria https://www.aemo.com.au/-/media/Files/Electricity/WEM/Planning_and_Forecasting/ESO-O/2017/2017-WEM-ESOO-Methodology-Report---Projections-of-Up-take-of-Small-scale-Systems.pdf Accessed 4 December 2018.
120. Clean Energy Council 2018, ‘Clean Energy Australia Report 2018’, Melbourne, Victoria https://www.cleanenergycouncil.org.au/poli-cy-advocacy/reports/clean-energy-australia-report.html Accessed4 December 2018.
121. Ibid.122. Ibid.
SCIENTIFIC ASSESSMENTS Part III Energy

Electricity emissions, which represented over 50%
of Victoria’s total emissions in 2016, have dropped
from their 2012 peak but remain close to 33% above
their 1990 levels (Figure E.15).
Figure E.15 Annual emissions from public electricity in Victoria, 1990–2016123,124
123. Australian Department of the Environment and Energy, ‘AustralianGreenhouse Emissions Information System’, Canberra, Australia http://ageis.climatechange.gov.au Accessed 4 December 2018.
124. Australian Government Department of the Environment and Energy 2018, ‘National Inventory Report 2016: Volume 1’, Canberra, Australia http://www.environment.gov.au/system/files/resources/02bcfbd1-38b2-4e7c-88bd-b2b7624051da/files/national-inventory-re-port-2016-volume-1.pdf Accessed 4 December 2018.
SCIENTIFIC ASSESSMENTS Part III Energy

Victorian State of the Environment 2018 Scientific Assessments (E)
Energy in TransportENERGY
TRANSPORT
Indicator Status UNKNOWN POOR FAIR GOOD
Data Quality
E:04 Total net energy consumptionby industry sector
DATA QUALITY
Fair
E:05 Total electricity consumption
DATA QUALITY
Good
E:06 Total electricity generation by fuel
DATA QUALITY
Good
E:07 Share of renewable energy generation of total electricitygeneration DATA QUALITY
Good
E:08 Energy used in the transportsector
DATA QUALITY
Good
E:09 Per capita transport energy use
DATA QUALITY
Good
Indicator StatusUNKNOWN POOR FAIR GOOD
Data Quality
T:01 Travel demand
DATA QUALITY
Good
T:02 Greenhouse gas emission and emission intensities from transport
DATA QUALITY
Good
T:03 Air pollution from transport
DATA QUALITY
Poor
Fair for motor vehicles and
Unknown for rail and shipping
Trend
Trend
ENERGY
TRANSPORT
Indicator StatusUNKNOWN POOR FAIR GOOD
Data Quality
E:04 Total net energy consumptionby industry sector
DATA QUALITY
Fair
E:05 Total electricity consumption
DATA QUALITY
Good
E:06 Total electricity generation by fuel
DATA QUALITY
Good
E:07 Share of renewable energy generation of total electricitygeneration DATA QUALITY
Good
E:08 Energy used in the transport sector
DATA QUALITY
Good
E:09 Per capita transport energy use
DATA QUALITY
Good
Indicator StatusUNKNOWN POOR FAIR GOOD
Data Quality
T:01 Travel demand
DATA QUALITY
Good
T:02 Greenhouse gas emission and emission intensities from transport
DATA QUALITY
Good
T:03 Air pollution from transport
DATA QUALITY
Poor
Fair for motor vehicles and
Unknown for rail and shipping
Trend
TrendEnergy use in the transport sector has steadily
increased in Victoria, which has partially driven
the increase in consumption of energy from oil. The
vast majority of the energy use in the transport
sector is associated with road transportation,
which is heavily fossil fuel dependant and
contributes a significant amount to Victoria’s
transport emissions – around 90% in 2016.
There are major opportunities in the road
transport sector in Victoria to reduce emissions
through both fuel efficiency and fuel switching
(from fossil fuels to renewable energy). This must
occur within the broader context of the rapid
transformation of Victoria’s energy system to
ensure that there is no lag between fuel switching
and supply from renewable sources.
Energy Consumption by the Transport Sector
As highlighted in the Energy Consumption section
(Table E.5), the transport sector was Victoria’s
second largest energy consuming sector,
accounting for 26% of total energy consumption
in 2015–16. Energy consumption in this sector has
steadily increased by 44% (112.4 PJ) between 1989–
90 and 2015–16, primarily due to the increased
transport demands of a growing population.
Energy Use by Fuel Type
Fossil fuels provide energy for most transport
in Victoria. Petrol was the primary fuel type
consumed by the transport sector, accounting
for 41% of total energy consumption in 2015–16
(Table E.9). There was a minor decrease in total
consumption of petrol between 1989–90 and
2015–16; however, the share of petrol notably
decreased. This was partially offset by an increase
in diesel consumption, which accounted for 34%
of consumption, increasing by 73.6 PJ in 2015–16.
Other fuel types increased between 1989–90 and
2015–16 including biofuels; however, these are very
minor compared to petrol and diesel consumption
(Figure E.16).
Data Custodian Department of Environment and Energy, National Greenhouse Gas Inventory
Data Custodian DEE, National Greenhouse Gas Inventorys Inventory
SCIENTIFIC ASSESSMENTS Part III Energy

Energy consumption
1989–90
Energy consumption
2015–16
Difference
1989–90 to 2015–16
PJ Share (%) PJ Share (%) PJ
LPG 14.4 5.7 25.8 7.0 11.4
Petrol 152.9 60.0 151.1 41.2 −1.8
Diesel 51.0 20.0 124.6 33.9 73.6
Electricity 1.1 0.4 3.3 0.9 2.2
Natural gas 0.4 0.2 2.1 0.6 1.7
Liquid/gas biofuels 0.0 0.0 0.3 0.1 0.3
Other 34.9 13.7 59.9 16.3 25.0
Total 254.7 100.0 367.1 100.0 112.4
Table E.9 Energy consumption in the transport sector by fuel type, Victoria, difference between 1989–90 and
2015–16125
Figure E.16 Energy consumption in the transport sector by fuel type, Victoria, 1989–90 to
2015–16126
125. Department of Environment and Energy 2017, ‘Australian Energy Statistics 2017: Table F3’, Canberra, Australia. Note that ‘Other’ includes fuel oil, lubricants and greases, and aviation fuel (gasoline and turbine fuel).
126. Department of Environment and Energy 2017, ‘Australian Energy Statistics 2017: Table F’, Canberra, Australia.
SCIENTIFIC ASSESSMENTS Part III Energy

Victorian State of the Environment 2018 Scientific Assessments (E)
Consumption by Transport Subsector
Energy consumption in the transport sector is
largely associated with road transport (Figure
E.17). Petrol is the primary source of energy for
the road transport sector, accounting for 51% of
fuel consumption in that sector. This is followed
by diesel consumption with 40% of road transport
energy consumption. The sprawling nature of
Victorian cities has led to high household vehicle
ownership and longer distances between activities
and services, which exacerbates Victoria’s reliance
on road transport.
Figure E.17 Total fuel consumption by transport subsector, Victoria, 1989–90 to 2015–16127
Per Capita Transport Energy Use
Per capita transport energy use has remained
relatively stable since 1989–90, at around 60 GJ
per person. It has varied by little more than 10
percentage points over the entire period. However,
per capita use needs to decline along with
substantial fuel switching in order to reduce the
transport sector’s contribution to Victoria’s GHG
emissions.
127. Ibid.
SCIENTIFIC ASSESSMENTS Part III Energy

Figure E.18 Per capita transport energy use, Victoria, 1989–90 to 2015–16128,129
Emissions From the Transport Sector
Transport emissions represent around 20% of
Victoria’s total emissions in 2016. This is primarily
associated with the use of cars, light commercial
vehicles and heavy trucks (Figure E.19). There are
significant emissions reduction opportunities
associated with improving the fuel efficiency of
Victoria’s ICE road transport fleet. There are also
longer-term opportunities – shifting Victoria’s
road transport fleet to electric vehicles powered by
renewable sources.
128. Department of Environment and Energy 2017, ‘Australian Energy Statistics 2017: Table E3’, Canberra, Australia.
129. Australian Bureau of Statistics 2017, ‘3101.0 - Australian Demograph-ic Statistics, Jun 2017’, Canberra, Australia http://www.abs.gov.au/AUSSTATS/[email protected]/DetailsPage/3101.0Jun%202017?OpenDocument Accessed 4 December 2018.
SCIENTIFIC ASSESSMENTS Part III Energy

Victorian State of the Environment 2018 Scientific Assessments (E)
Figure E.19 Energy emissions from the transport sector by type of transport, 2009–2016130
Emissions per capita from transport have
remained stable between 2009 and 2016, despite
an increase in Victoria’s population (Figure E.20).
Figure E.20 highlights the lack of progress in fuel
efficiency and fuel switching to low or zero-carbon
alternatives in the transport sector compared to
the energy sector as a whole.
Figure E.20 Transport sector emissions per capita
compared to total energy sector and overall emissions
between 2009 and 2016131,132
130. Australian Department of the Environment and Energy, ‘AustralianGreenhouse Emissions Information System’, Canberra, Australia http://ageis.climatechange.gov.au Accessed 4 December 2018.
131. Ibid.132. Australian Bureau of Statistics 2017, ‘3101.0 - Australian Demograph-
ic Statistics, Jun 2017’, Canberra, Australia http://www.abs.gov.au/AUSSTATS/[email protected]/DetailsPage/3101.0Jun%202017?OpenDocument Accessed 4 December 2018.
SCIENTIFIC ASSESSMENTS Part III Energy

Other Energy Sectors
This area includes all the remaining sectors,
including manufacturing, construction, commercial
and residential. Emissions reductions in this area
will be challenging as each sector is likely to require
many specific solutions. Industry-related data is
not available at the level required to be able to
make sound judgements on the drivers of change
in each sector. In some cases, emissions reduction
may be driven by industries closing down in
Victoria rather than efficiencies.
Further work will need to be completed to
understand the factors influencing change in these
sectors in order to develop appropriate indicators,
for example AEMO’s recent study on the effects of
energy efficiency policies and programs on energy
usage.133
133. Pitt & Sherry 2016, ‘Estimating the Effects of Energy Efficiency Policies and Programs on Usage of Electricity and Gas’, https://www.aemo.com.au/-/media/Files/Electricity/NEM/Planning_and_Forecast-ing/NEFR/2016/Estimating-the-Effects-of-Energy-Efficiency-Poli-cies-and-Programs-on-Usage-of-Electricity-and-Gas.pdf Accessed 4 December 2018.
SCIENTIFIC ASSESSMENTS Part III Energy

Victorian State of the Environment 2018 Scientific Assessments (E)
Future Focus
Monitoring and Reporting on the Targets for Victoria’s Energy Transition
In 2017, Victoria passed the Climate Change Act
2017, which explicitly acknowledges the 2015 Paris
Agreement’s goal of “holding the increase in the
global average temperature to well below 2°C
above pre-industrial levels and to pursue efforts
to limit the temperature increase to 1.5°C above
pre-industrial levels recognizing that this would
significantly reduce the risks and impacts of
climate change”.134
In addition to legislating Victoria’s 2050 net-
zero emissions target, the Climate Change Act
2017 requires the Premier and relevant Minister
to establish five-yearly interim targets to keep
Victoria on track to meeting the 2050 target. The
Climate Change Act requires the Minister to obtain
expert advice on options for the interim targets,
indicative trajectories for Victoria to 2050 based
on interim target options, and efficient and cost-
effective opportunities for achieving the interim
targets. Interim emissions targets for the 2021–
2025 and 2026–2030 periods must be set on or
before 31 March 2020.135
Reducing greenhouse gas emissions from energy
is Victoria’s principal challenge to meet its
greenhouse gas emissions reduction goals. The
Independent Expert Panel constituted under
the Climate Change Act to provide advice on
interim emissions reduction targets has identified
opportunities to achieve emissions reductions
through an energy transition in electricity
generation, transport, industry and the built
environment. Major opportunities include shifting
to zero- and low-carbon electricity generation,
electrification of energy services (combined
with low-carbon electricity) and increasing end-
use efficiencies.136 Measuring progress against
emissions targets and associated policies including
the Victorian Renewable Energy Targets and the
Energy Efficiency and Productivity Strategy will
require appropriate indicators.
The integration of high concentrations of
distributed energy resources (including rooftop
solar and small-scale battery storage) into
Victoria’s electricity system requires distribution
networks to become “smarter”,137,138 integrating ICT
to allow network operators to better understand
local, low-voltage network conditions and provide
signals or incentives to individual resources to
respond and provide system support.139
Similarly, Victoria’s transport infrastructure
will need to change to meet the challenge of
substantial emissions reductions from reducing
its reliance on fossil fuel combustion for energy.
These changes range from increased availability
of charging infrastructure for electric vehicles
(or refuelling infrastructure for other fuels like
hydrogen), which is an important enabler for a low-
carbon fleet transition, to the broader adoption
and integration of low-emissions urban planning
principles like those found in the Green Building
Council’s Green Star Communities.140
Victoria’s buildings and industry energy use
will also need to change rapidly to enable the
transition to a net-zero emissions future. This
includes substantially increasing the energy
efficiency of building stock as well as the efficiency
of industrial processes and their electrification.
Recommendation 15: That DELWP establish a set of indicators, and implement measures to collect appropriate data, to track the impact of energy emissions reduction to meet interim targets set under the Climate Change Act 2017. The reporting will need to include tracking the transition of Victoria’s grid, transport and industry infrastructure to support a low-carbon, high-renewables future.
134. United Nations 2015, ‘Paris Agreement’, https://unfccc.int/sites/de-fault/files/english_paris_agreement.pdf Accessed 4 December 2018.
135. Office of the Chief Parliamentary Counsel Victoria 2017, ‘Climate Change Act 2017’, Melbourne, Victoria http://www.legislation.vic.gov.au/Domino/Web_Notes/LDMS/PubStatbook.nsf/f932b66241ecf1b-7ca256e92000e23be/05736C89E5B8C7C0CA2580D50006FF95/$-FILE/17-005aa%20authorised.pdf Accessed 4 December 2018.
136. DELWP 2017, ‘Independent Expert Panel: Interim Emissions Reduction Targets for Victoria (2021-2030)’, East Melbourne, Victoria https://www.climatechange.vic.gov.au/__data/assets/pdf_file/0019/121924/Issues-Paper_28-03-2018.pdf Accessed 4 December 2018.
137. Australian Energy Market Operator 2018, ‘Integrated System Plan’, Melbourne, Victoria https://www.aemo.com.au/-/media/Files/Elec-tricity/NEM/Planning_and_Forecasting/ISP/2018/Integrated-Sys-tem-Plan-2018_final.pdf Accessed 4 December 2018.
138. Australian Energy Market Operator and Energy Networks Australia 2018, ‘Open Energy Networks: consultation paper’, https://www.ener-gynetworks.com.au/sites/default/files/open_energy_networks_con-sultation_paper.pdf Accessed 4 December 2018.
139. Ibid.140. Green Building Council of Australia, ‘Neighbourhoods and commu-
nity’, Barangaroo, New South Wales https://new.gbca.org.au/green-star/rating-system/communities/ Access 4 December 2018.
SCIENTIFIC ASSESSMENTS Part III Energy

Data Capability to Track Impact of Victoria’s Energy Transition on Consumers and Markets
Victorian consumers are likely to play an
increasingly important role in the energy sector
during Victoria’s transition to its net-zero emissions
target. As the extensive (and largely unanticipated)
investment Victorian consumers have made in
rooftop PV over the last decade shows, energy
consumers can no longer be assumed to be
passive purchasers of energy with choices limited
to purchasing energy-using devices—from cars to
heaters and washing machines—and choosing a
supplier of electricity, gas or liquid fuels.
Victoria’s almost complete smart meter coverage
makes engaging active consumers possible, with
or without distributed energy resources. However,
consumer education and consumer trust are
essential for gaining the engagement required
for the efficient and effective coordination of
demand-side resources, which can include broad
behaviour change that alters the demand for
energy services.141,142
Further, changes are likely to be required for
the National Electricity Market to assist the
transition to a low-emissions electricity system.
When the NEM was established there was no
variable renewable generation supplying its
regions, and the Finkel Review described the
NEM as “a market for different times”.143 Victoria
will need to work with the other NEM states and
the Commonwealth Government to assist the
NEM evolve to incorporate high proportions
of variable renewables and distributed energy
resources.144,145,146
Governance arrangements, in particular consumer
protection measures will need to be extended to
cover new energy products and business models
to ensure that consumers understand the risks of
participation in new markets and engaging with
new types of energy business (e.g. distributed
energy resource aggregators).147 New institutions
(such as distributed system and distributed
market operators) may also be required to operate
distribution system level markets and coordinate
and dispatch resources.148
Recommendation 16: That DELWP implement measures to collect data and track the impact of the transition to a low-emissions electricity system on:
• consumer sentiment and behaviour
• investment in distributed, low- and zero-emissions electricity generation
• the associated markets, governance andbusiness models.
141. Eyre N, Darby SJ, Grünewald P, McKenna E, Ford R 2018, ‘Reaching a 1.5° C target: socio-technical challenges for a rapid transition to low-carbon electricity systems’, Philosophical Transactions of the Royal Society A, 376(2119).
142. Darby S, Liddell C, Hills D, Drabble D 2015, ‘Smart Metering Early Learning Project: Synthesis report’, Department of Energy & Climate Change, London, United Kingdom.
143. Finkel A, Moses K, Munro C, Effeney T, O’Kane M 2017, ‘Independent Review into the Future Security of the National Electricity Market: Blueprint for the Future’, Commonwealth of Australia, Canberra, Australia.
144. Ibid.145. Nelson T, Orton F, Chappel T 2017, ‘Electricity market design in a
decarbonised energy system’, working paper.146. Pollitt MG, Anaya KL 2016, ‘Can current electricity markets cope with
high shares of renewables? A comparison of approaches in Germany, the UK and the State of New York’, Energy Journal, 37(1), pp. 1–21.
147. Orton F, Nelson T, Pierce M, Chappel T 2017, ‘Chapter 14 - Access Rights and Consumer Protections in a Distributed Energy System’, in Innovation and Disruption at the Grid’s Edge, Academic Press, Cam-bridge, United States.
148. Perez-Arriaga I, Jenkins JD, Batlle CA 2017, ‘Regulatory framework for an evolving electricity sector: Highlights of the MIT utility of the future study’, Economics of Energy & Environmental Policy, 6, pp. 1–22.
SCIENTIFIC ASSESSMENTS Part III Energy

Victorian State of the Environment 2018 Scientific Assessments (E)
Accounting for the Environment
The System of Environmental-Economic
Accounting (SEEA) energy accounts typically
present information in physical terms (PJ), but
monetary valuations can also be applied to
various energy stocks and flows. Two main types
of accounts capture relevant energy information
in a systematic way – flow accounts and asset
accounts.
Energy flow accounts record physical flows of
energy from (i) the initial extraction or capture
of energy resources from the environment into
the economy (energy from natural inputs); (ii) the
flows of energy within the economy in the form of
the supply and use of energy by industries and
households (energy products); and (iii) the flow of
energy losses.
Energy from natural inputs include mineral
and energy resources (for example: oil, natural
gas, coal, uranium) and inputs from renewable
energy sources (for example: solar, wind, hydro,
geothermal).
These accounts identify the flows between the
environment and the economy, and can be used
to show the many ways and multiple times that a
natural input can be transformed, supplied to the
economy, used in production processes, consumed
by final users or returned to the environment.
Energy flow accounts allow for a consistent
monitoring of the supply and use of energy by
energy type and by industry. Indicators of energy
intensity, efficiency and productivity can be
derived from the accounts in combination with
monetary information. This sort of information
could be useful, for example, in assessing Victoria’s
progress towards targeted 50% improvement in
energy productivity from 2015 levels by 2030.149
Paired with information from the System
of National Accounts, the latest Australian
Environmental-Economics Accounts, released in
June 2018 by the ABS, have shown a decoupling of
economic activity and energy use within Australia,
with industry gross value add rising 28% over
the period 2006–07 to 2015–2016, while energy
consumption increased by only 6% over the same
period.
Figure E.21 Victoria industry gross value add vs energy consumption
Index: 2008–09 = 100
149. DELWP 2017, ‘Energy Efficiency and Productivity Strategy’, East Melbourne, Victoria https://www.energy.vic.gov.au/__data/assets/pdf_file/0030/89292/Energy-Efficiency-and-Productivity-Strategy-Web.pdf Accessed 4 December 2018.
SCIENTIFIC ASSESSMENTS Part III Energy

Figure E.21 shows a similar story for Victoria, with
industry gross value add rising 17% over the period
2008–09 to 2015–16, while energy consumption
remained relatively stable.150,151
Energy asset accounts measure the quantity of
mineral and energy resources and changes in
these resources over an accounting period. These
accounts can be compiled in physical terms,
which provide valuable information about energy
resource availability; or, they can be compiled in
monetary terms to show the contribution to, and
the depletion of, natural capital reserves of energy
resources.
Flows of extraction, depletion and discoveries
are central to the energy asset account. Since
these assets cannot be renewed on any human
timescale, there is use in understanding the rate
at which these assets are extracted and depleted,
the overall availability of these assets, and the
sustainability (dependence) of the industries that
exploit them.
There is a direct linkage to be made between the
energy accounts and the air quality accounts.
The main residuals that flow from the energy
sector as a result of economic activity (such as
air pollutants) are captured in the air emissions
accounts. There is also a link to the water accounts,
as surface and groundwater flows are diverted for
electricity generation and oil and gas extraction.
For Victoria, 90% of direct greenhouse gas
emissions come from the energy sector, having
direct links to climate change analysis and policy.
Linking the air and energy accounts allows
relevant physical (such as energy input and output
and emissions) and monetary (such as taxes
and expenditure) information to be compared,
by industry. This has the potential to provide
information to design, measure and monitor
policy instruments that will help Victoria reach
its net-zero-emissions target by 2050 and VRETs
(currently 25% by 2020 and 40% by 2025).
150. Australian Bureau of Statistics, ‘5220.0 Australian National Accounts:State Accounts’, Canberra, Australia.
151. Department of Environment and Energy 2017, ‘Australian Energy Statistics 2017: Table C3’, Canberra, Australia.
SCIENTIFIC ASSESSMENTS Part III Energy