energy-efficient and qos aware surplus resource allocation...
TRANSCRIPT
Energy-Efficient and QoS Aware SurplusResource Allocation in OFDMA Systems
Mohammad Reza Sabagh
Submitted for the Degree ofDoctor of Philosophy
from theUniversity of Surrey
Institute for Communication Systems (ICS)Faculty of Engineering and Physical Sciences
University of SurreyGuildford, Surrey GU2 7XH, U.K.
July 2017
c©Mohammad Reza Sabagh 2017

Abstract
There has recently been a real demand to design and deploy mobile communication networks that consume significantly less energy compared to the existing s ystems. The main thrust of this research focuses on investigation of the impacts of radio resource allocation schemes in the current state-of-the-art Orthogonal Frequency Division Multiple Access (OFDMA) systems on energy efficiency (EE) o f m odern Radio A ccess N etworks ( RANs), as w ell a s design of effective solutions to reduce RAN energy consumption in such networks.
Due to data traffic fluctuation of communication networks, there are often many unused radio resource blocks in OFDMA systems. Efficient allocation of these surplus resource blocks can lead to considerable energy savings. One of the key objectives of this thesis is to exploit this opportunity by designing practical and effective radio resource allocation techniques that exploit fundamental trade-off between energy consumption and bandwidth by reducing energy consumption of the RAN while providing the required quality of service (QoS) for the network users. The basic concept here is to exploit fluctuations of data traffic in the network.
Specifically, a novel energy e fficient re source al location te chnique, fo r low load tr affic con-ditions is proposed. This technique is then applied to three bespoke scheduling schemes, namely Round Robin (RR), Best Channel Quality Indicator (BCQI), and Proportional Fair (PF) for performance assessment. Comprehensive evaluation of the proposed scheduling schemes demonstrates that adopting the proposed resource allocation technique significantly enhances the performance of RAN in terms of energy consumption in comparison with the conventional schemes such as the three aforementioned schedulers.
Finding an optimal method for surplus resource allocation is firstly modelled as an optimisa-tion problem which is subsequently solved using dynamic programming. In this context, a Knapsack Problem (KP) is adopted to find an optimal solution for a single-cell s cenario. The proposed heuristic method is simulated using Equal Power (EP) and Water Filling (WF) algo-rithms for surplus resource allocation. It is shown that the optimal solution is achieved using the WF algorithm leading to an EE saving of 60% compared to the greedy KP solution, whilst significantly lower computational complexity.
The optimality of the proposed algorithm is evaluated in a multi-cell scenario to take into account realistic assumptions, which is more suitable for practical systems as interference of neighbouring cells are also considered. In this case, it is shown that the optimality of the proposed algorithm is valid and similar levels of energy saving can be achieved.
Moreover, Cooperative Multi Point (CoMP) operation leading to interference mitigation and a coordinated resource allocation is considered to assess the optimality of the proposed algo-rithm. In this regard, two algorithms for assigning the surplus radio resources in OFDMA systems are proposed where a Multiple Choice bounded Knapsack problem (MCBKP) was de-fined to find the optimum values for bandwidth expansion of the scheduled users in each time slot. In addition to lower computational complexity and guaranteeing QoS, the percentage of energy saving by employing the optimum algorithm is 46%.

Acknowledgements
The greatest adoration to God, not only because of his permanent support through my entirelife, but moreover because he is worthy of worship and praise. Thank Allah, who gave me thecapability, both mentally and physically, to accomplish my studies.
I am heartily thankful to my supervisors, Dr. Mehrdad Dianati and Prof. Rahim Tafazolli, forthe guidance, encouragement and support that they have provided me with.
I am grateful to my friends and colleagues in the Institute for Communication Systems (ICS)for their continue support and encouragement, especially Dr. Konstantinos Katsaros and Dr.Hosein Peyvandi.
My cordial thanks to Dr. Mehri Mehrjoo from the University of Sistan and Baluchestan for herkind support, cooperation and research collaboration.
I would also like to express my gratitude to my parents and my family for all their motivationand support with their immense love throughout my life, and last but not least my sincerethanks to my wife for her patience, continuous help, and understanding throughout my studies.Actually, her love has given me the strength I needed to overcome the difficult moments.

Declaration
I confirm that the submitted work is my own work and that I have clearly identified and fullyacknowledged all material that is entitled to be attributed to others (whether published or un-published) using the referencing system set out in the programme handbook. I agree that theUniversity may submit my work to means of checking this, such as the plagiarism detectionservice Turnitin UK. I confirm that I understand that assessed work that has been shown to havebeen plagiarised will be penalized.
Mohammad Reza Sabagh
v
Contents
Declaration v
1 Introduction 1
1.1 Scope . . . . . . . . . . . . . . . . . . . . . . . . . . . . . . . . . . . . . . . 1
1.2 Challenges and Motivations . . . . . . . . . . . . . . . . . . . . . . . . . . . . 6
1.3 Research Objectives . . . . . . . . . . . . . . . . . . . . . . . . . . . . . . . . 7
1.4 Research Contributions . . . . . . . . . . . . . . . . . . . . . . . . . . . . . . 8
1.5 Thesis Overview . . . . . . . . . . . . . . . . . . . . . . . . . . . . . . . . . 9
1.6 List of Publications . . . . . . . . . . . . . . . . . . . . . . . . . . . . . . . . 10
2 Background and Literature Review 11
2.1 OFDM and OFDMA . . . . . . . . . . . . . . . . . . . . . . . . . . . . . . . 11
2.2 State of the Art . . . . . . . . . . . . . . . . . . . . . . . . . . . . . . . . . . 12
2.3 3GPP LTE Technical Specification . . . . . . . . . . . . . . . . . . . . . . . . 17
2.3.1 LTE Network Architecture . . . . . . . . . . . . . . . . . . . . . . . . 18
2.4 Power Consumption Modelling . . . . . . . . . . . . . . . . . . . . . . . . . . 19
2.4.1 Arnold (Alcatel-Lucent) Model . . . . . . . . . . . . . . . . . . . . . 20
2.4.2 Deruyck Model . . . . . . . . . . . . . . . . . . . . . . . . . . . . . . 22
2.4.3 EARTH Project Model . . . . . . . . . . . . . . . . . . . . . . . . . . 22
2.5 EE Metrics . . . . . . . . . . . . . . . . . . . . . . . . . . . . . . . . . . . . 23
2.6 Coordinated Multi Point (CoMP) . . . . . . . . . . . . . . . . . . . . . . . . . 23
2.7 Optimisation problems . . . . . . . . . . . . . . . . . . . . . . . . . . . . . . 25
2.7.1 Convex Optimisation Problem . . . . . . . . . . . . . . . . . . . . . . 25
2.7.2 Concave Maximisation Problem . . . . . . . . . . . . . . . . . . . . . 26
2.7.3 Integer Programming Problem . . . . . . . . . . . . . . . . . . . . . . 26
2.7.4 Knapsack Problem . . . . . . . . . . . . . . . . . . . . . . . . . . . . 27
2.7.5 Complexity Analysis . . . . . . . . . . . . . . . . . . . . . . . . . . . 31
2.8 Summary . . . . . . . . . . . . . . . . . . . . . . . . . . . . . . . . . . . . . 31
vi
Contents vii
3 Buffer and Channel Aware Energy Efficient Scheduler 32
3.1 System Model . . . . . . . . . . . . . . . . . . . . . . . . . . . . . . . . . . . 33
3.2 Principal Scheduling Schemes . . . . . . . . . . . . . . . . . . . . . . . . . . 35
3.2.1 RR Scheduler . . . . . . . . . . . . . . . . . . . . . . . . . . . . . . . 36
3.2.2 PF Scheduling . . . . . . . . . . . . . . . . . . . . . . . . . . . . . . 37
3.2.3 BCQI scheduler . . . . . . . . . . . . . . . . . . . . . . . . . . . . . . 37
3.3 Energy Consumption Model . . . . . . . . . . . . . . . . . . . . . . . . . . . 38
3.4 The Proposed Scheduling Scheme Methodology . . . . . . . . . . . . . . . . . 39
3.5 Performance Evaluation and Simulation Results . . . . . . . . . . . . . . . . . 45
3.6 Summary . . . . . . . . . . . . . . . . . . . . . . . . . . . . . . . . . . . . . 51
4 A Novel Energy Efficient and QoS Aware Resource Block Allocation in OFDMASystems in Single-Cell Scenario 54
4.1 System Model . . . . . . . . . . . . . . . . . . . . . . . . . . . . . . . . . . . 55
4.2 Principle of Bandwidth-EE Trade-off . . . . . . . . . . . . . . . . . . . . . . . 56
4.3 EE Metric in Schedulers . . . . . . . . . . . . . . . . . . . . . . . . . . . . . 57
4.3.1 Energy consumption rate before bandwidth expansion . . . . . . . . . 57
4.3.2 Energy Consumption Rate after Bandwidth Expansion . . . . . . . . . 59
4.4 Optimisation Problem . . . . . . . . . . . . . . . . . . . . . . . . . . . . . . . 60
4.4.1 Classic Scheduler Formulation . . . . . . . . . . . . . . . . . . . . . . 61
4.4.2 The proposed Scheme Formulation . . . . . . . . . . . . . . . . . . . 62
4.4.3 Optimal Solution for Bandwidth Expansion Coefficient . . . . . . . . . 63
4.4.4 Finding the Optimum Values for Transmitted Power, Power Consump-tion, and ECR . . . . . . . . . . . . . . . . . . . . . . . . . . . . . . . 64
4.5 Complexity Analysis . . . . . . . . . . . . . . . . . . . . . . . . . . . . . . . 65
4.6 Performance Evaluation and Simulation Results . . . . . . . . . . . . . . . . . 65
4.7 Summary . . . . . . . . . . . . . . . . . . . . . . . . . . . . . . . . . . . . . 79
5 Novel Energy Efficient and QoS Aware Resource Block Allocation Algorithms inOFDMA Systems with CoMP 80
5.1 System model . . . . . . . . . . . . . . . . . . . . . . . . . . . . . . . . . . . 81
5.2 Multi-Cell without CoMP (N-CoMP) . . . . . . . . . . . . . . . . . . . . . . 81
5.2.1 Proposed solution . . . . . . . . . . . . . . . . . . . . . . . . . . . . . 82
5.3 Multi-Cell with CoMP . . . . . . . . . . . . . . . . . . . . . . . . . . . . . . 83
5.3.1 EE metric in schedulers . . . . . . . . . . . . . . . . . . . . . . . . . 85
viii Contents
5.3.1.1 Energy consumption rate before bandwidth expansion . . . . 85
5.3.1.2 Energy consumption rate after bandwidth expansion . . . . . 86
5.3.2 Optimisation Problem . . . . . . . . . . . . . . . . . . . . . . . . . . 87
5.3.3 Proposed solutions . . . . . . . . . . . . . . . . . . . . . . . . . . . . 88
5.4 Complexity Analysis . . . . . . . . . . . . . . . . . . . . . . . . . . . . . . . 91
5.5 Performance Evaluation and Simulation Results . . . . . . . . . . . . . . . . . 92
5.6 Summary . . . . . . . . . . . . . . . . . . . . . . . . . . . . . . . . . . . . . 100
6 Conclusion and Future Work 101
6.1 Major Research Contributions . . . . . . . . . . . . . . . . . . . . . . . . . . 101
6.2 Future Work . . . . . . . . . . . . . . . . . . . . . . . . . . . . . . . . . . . . 102
A Algorithms for Single-Cell Scenario 104
B Algorithms for Multi-Cell Scenario with and without CoMP 108
C VoIP Traffic Model 111
Bibliography 113
List of Figures
1.1 Cellular Networks Global Carbon Footprint 2007-2020 [1] . . . . . . . . . . . 2
1.2 Breakdown of power consumption in a typical cellular network (adopted from [2]) 3
1.3 Growth in BSs in developing regions 2007-2012 (GSMA Research) [3] . . . . 3
1.4 Power consumption dependency on relative linear output power in all BS types [1] 4
1.5 Functional Split between eNodeB and EPC (adopted from [4]) . . . . . . . . . 5
1.6 Temporal traffic load variations over 24 hours measured from an urban UMTSRNC [3] . . . . . . . . . . . . . . . . . . . . . . . . . . . . . . . . . . . . . . 7
2.1 An Overall Architecture of LTE release 8 Network [4] . . . . . . . . . . . . . 18
2.2 Radio Resource Structure in 3GPP LTE . . . . . . . . . . . . . . . . . . . . . 19
2.3 Power Consumption Breakdown in Different Types of BS [5] . . . . . . . . . . 21
2.4 BS cooperation: inter-site and intra-site CoMP . . . . . . . . . . . . . . . . . 24
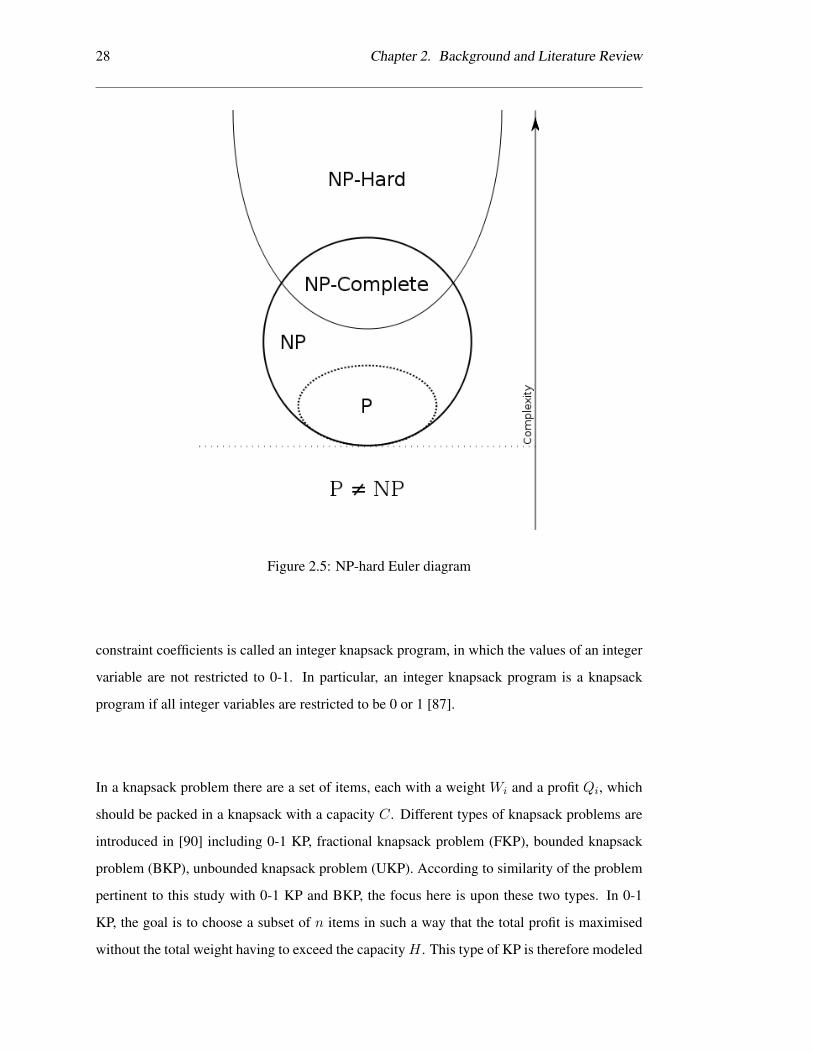
2.5 NP-hard Euler diagram . . . . . . . . . . . . . . . . . . . . . . . . . . . . . . 28
2.6 Theoretical transformed number of items from BKP to 0-1 KP . . . . . . . . . 30
3.1 A general OFDMA scheduling framework . . . . . . . . . . . . . . . . . . . . 34
3.2 Path Loss, Shadowing and Multi-path versus Distance [6] . . . . . . . . . . . . 35
3.3 RR Scheduler Flowchart . . . . . . . . . . . . . . . . . . . . . . . . . . . . . 36
3.4 PF Scheduler Flowchart . . . . . . . . . . . . . . . . . . . . . . . . . . . . . . 37
3.5 BCQI Scheduler Flowchart . . . . . . . . . . . . . . . . . . . . . . . . . . . . 38
3.6 BLER-SNR Curve for Different CQI Values [7] . . . . . . . . . . . . . . . . . 40
3.7 Flowchart of RR and EERR Scheduler . . . . . . . . . . . . . . . . . . . . . . 43
3.8 Flowchart of energy efficient scheme (Reallocation of vacant PRBs) . . . . . . 44
3.9 Flowchart of BCQI and EEBCQI Scheduler . . . . . . . . . . . . . . . . . . . 46
3.10 Flowchart of PF and EEPF Scheduler . . . . . . . . . . . . . . . . . . . . . . 47
3.11 Average energy consumption versus number of users with 25 PRBs . . . . . . 48
3.12 Average energy consumption versus number of users with 50 PRBs . . . . . . 49
ix
x List of Figures
3.13 Average energy consumption versus number of users with different number ofPRBs (6,12,75,100) . . . . . . . . . . . . . . . . . . . . . . . . . . . . . . . . 50
3.14 Ratio of the energy consumption of EE schedulers to their relevant principalschedulers by adopting the proposed scheme with 25 PRBs . . . . . . . . . . . 50
3.15 Ratio of the energy consumption of EE schedulers to their relevant principalschedulers by adopting the proposed scheme with 50 PRBs . . . . . . . . . . . 51
3.16 Packet drop ratio versus number of users in various types of schedulers with 25PRBs . . . . . . . . . . . . . . . . . . . . . . . . . . . . . . . . . . . . . . . 52
3.17 Packet drop ratio versus number of users in various types of schedulers with 50PRBs . . . . . . . . . . . . . . . . . . . . . . . . . . . . . . . . . . . . . . . 52
4.1 System Model of Simulation . . . . . . . . . . . . . . . . . . . . . . . . . . . 56
4.2 Theoretical ECR versus SNR for different bandwidth expansion coefficient (α) 64
4.3 Comparison of transmitted power among ten users based on different powerallocation algorithms . . . . . . . . . . . . . . . . . . . . . . . . . . . . . . . 69
4.4 Comparison of α in scenario 1 in terms of power allocation algorithms andbuffer status . . . . . . . . . . . . . . . . . . . . . . . . . . . . . . . . . . . . 69
4.5 Comparison of α in scenario 2 in terms of power allocation algorithms andbuffer status . . . . . . . . . . . . . . . . . . . . . . . . . . . . . . . . . . . . 70
4.6 Comparison of α in scenario 3 in terms of power allocation algorithms andbuffer status . . . . . . . . . . . . . . . . . . . . . . . . . . . . . . . . . . . . 71
4.7 Comparison of ECR among three scenarios based on different power allocationalgorithms regardless of buffer status . . . . . . . . . . . . . . . . . . . . . . . 72
4.8 Comparison of ECR among three scenarios based on different power allocationalgorithms regarding buffer status . . . . . . . . . . . . . . . . . . . . . . . . 72
4.9 Comparison of ECR (µ joule/bit) the proposed algorithm (Option 4) amongthree scenarios based on different percentage of critical buffers . . . . . . . . . 73
4.10 Comparison of average α over 1000 TTI for different PRBs and number ofusers=200 . . . . . . . . . . . . . . . . . . . . . . . . . . . . . . . . . . . . . 75
4.11 Comparison of average α over 1000 TTI for different PRBs and number ofusers=200 from closer view . . . . . . . . . . . . . . . . . . . . . . . . . . . . 76
4.12 Comparison of ECR over 1000 TTI for different PRBs and number of users=200 77
4.13 Comparison of average α over 1000 TTI for different PRBs and number ofusers=1000 . . . . . . . . . . . . . . . . . . . . . . . . . . . . . . . . . . . . 77
4.14 Comparison of ECR over 1000 TTI for different PRBs and number of users=1000 78
4.15 Comparison of PDR over 1000 TTI among schedulers . . . . . . . . . . . . . . 78
5.1 Multi-cell scenario in low load traffic situation without CoMP . . . . . . . . . 81
5.2 Multi-cell scenario in low load traffic situation with CoMP . . . . . . . . . . . 84
List of Figures xi
5.3 Flowchart of the modified proposed energy-efficient algorithm in CoMP situa-tions . . . . . . . . . . . . . . . . . . . . . . . . . . . . . . . . . . . . . . . . 90
5.4 Flowchart of the modified proposed energy-efficient algorithm in CoMP situa-tions . . . . . . . . . . . . . . . . . . . . . . . . . . . . . . . . . . . . . . . . 91
5.5 Comparison of total transmission power among three scenarios based on dif-ferent power allocation algorithms and buffer status with N-CoMP . . . . . . . 94
5.6 Comparison of total transmission power among three scenarios based on dif-ferent power allocation algorithms and buffer status with CoMP . . . . . . . . 95
5.7 Comparison of total ECR among three scenarios based on different power al-location algorithms and buffer status with N-CoMP . . . . . . . . . . . . . . . 97
5.8 Comparison of total ECR among three scenarios based on different power al-location algorithms and buffer status with CoMP . . . . . . . . . . . . . . . . 97
5.9 Comparison of PDR improvement . . . . . . . . . . . . . . . . . . . . . . . . 99
C.1 2-state voice activity model [7] . . . . . . . . . . . . . . . . . . . . . . . . . . 112
List of Tables
2.1 LTE Bandwidth/Resource Configuration [4] . . . . . . . . . . . . . . . . . . . 20
2.2 Power Consumption Parameters of the Macro Site [8] . . . . . . . . . . . . . . 21
2.3 Power Model Parameters for Different Types of BS [9] . . . . . . . . . . . . . 22
3.1 AMC and TBS Mapping Table [10] . . . . . . . . . . . . . . . . . . . . . . . 41
3.2 AMC Mapping Table [7] . . . . . . . . . . . . . . . . . . . . . . . . . . . . . 42
3.3 Main parameters of simulation . . . . . . . . . . . . . . . . . . . . . . . . . . 45
4.1 Main parameters of simulation . . . . . . . . . . . . . . . . . . . . . . . . . . 66
4.2 AMC Mapping Table [4] . . . . . . . . . . . . . . . . . . . . . . . . . . . . . 67
4.3 SNR distribution of users as an example . . . . . . . . . . . . . . . . . . . . . 68
4.4 Comparison of relative optimality gap (%) in power allocation algorithms re-gardless of buffer status . . . . . . . . . . . . . . . . . . . . . . . . . . . . . 74
4.5 Comparison of relative optimality gap (%) in power allocation algorithms re-garding the buffer status . . . . . . . . . . . . . . . . . . . . . . . . . . . . . . 75
5.1 Main parameters of simulation . . . . . . . . . . . . . . . . . . . . . . . . . . 92
5.2 User Characteristics . . . . . . . . . . . . . . . . . . . . . . . . . . . . . . . . 93
5.3 Load factor scenarios . . . . . . . . . . . . . . . . . . . . . . . . . . . . . . . 93
5.4 Different options in terms of power allocation and buffer allocation algorithms . 94
5.5 Comparison of relative optimality gap (%) in N-CoMP among different scenar-ios and options . . . . . . . . . . . . . . . . . . . . . . . . . . . . . . . . . . 98
5.6 Comparison of relative optimality gap (%) in CoMP among different scenariosand options . . . . . . . . . . . . . . . . . . . . . . . . . . . . . . . . . . . . 98
C.1 Traffic models in LTE network [7, 11] . . . . . . . . . . . . . . . . . . . . . . 111
xii
List of Tables xiii
List of AcronymsAMC Adaptive Modulation CodingARQ Automatic Repeat requestAWGN Additive White Gaussian NoiseBB Base BandBCQI Best Channel Quality IndicatorBIP Binary IPBKP Bounded Knapsack ProblemBLER Block Error RatesBS Base StationBSI Buffer State InformationCA Carrier AggregationC-RAN Cloud-based Radio Access NetworkcmW Centimeter WaveCO CoolingCoMP Cooperative Multi PointCP Cyclic PrefixCQI Channel Quality IndicatorCSI Channel State InformationDC Dual ConnectivityECR Energy Consumption RateEE Energy EfficiencyEEBCQI Energy Efficient Best Channel Quality IndicatorEEE Effective Energy EfficiencyEEPF Energy Efficient Proportional FairEERR Energy Efficient Round RobineNodeB Evolved NodeBEPC Evolved Packet coreEP Equal PowerE-UTRAN Evolved Universal Terrestrial Radio Access NetworkFEC Forward Error CorrectionFKP Fractional Knapsack ProblemHetNet Heterogeneous NetworkICI Inter-Cell InterferenceICIC Inter-Cell Interference CoordinationILP Integer linear ProgrammingIP Integer ProgrammingISI Inter Symbol InterferenceITU International Telecommunication UnionKKT Karush Kuhn TuckerKP Knapsack ProblemLTE Long Term EvolutionLTE-A Long Term Evolution AdvancedMAC Medium Access ControlMCBKP Multiple Choice bounded Knapsack ProblemMCS Modulation and Coding SchemeMIESM Mutual Information Effective SNR MappingMIMO Multiple-Input Multiple-outputMINLP Mixed Integer nonlinear ProgrammingMIP Mixed Integer Programming ProblemsMISO Multiple-Input Single-Output
xiv List of Tables
List of AcronymsMME Mobility Management EntitiesmmW Millimeter WaveMNO Mobile Network OperatorN-CoMP Non-Coordinated Multi PointNLP Non Linear ProgrammingNOMA Non Orthogonal Multiple AccessNP Non-deterministic Polynomial-timeOFDMA Orthogonal Frequency Division Multiple AccessPA Power AmplifierPDCP Packet Data Convergence ProtocolPDR Packet Drop RatioPF Proportional FairPRB Physical Resource BlocksPS AC/DC Power SupplyPUCCH Physical Uplink Control ChannelQoS Quality of ServiceRAN Radio Access NetworkRAT Radio Access TechnologyRLC Radio Link ControlRR Round RobinRRA Radio Resource AllocationRRC Radio Resource ControlSC Small CellS-GW Serving GatewaySIMO Single-Input Multiple-OutputSINR Signal to Interference and Noise RatioSISO Single Input Single OutputSON Self Organizing NetworkTBS Transport Block SizeTTI Transmission Time IntervalUE User EquipmentUKP Unbounded Knapsack ProblemVAF Voice Activity FactorVRP Virtual Resource PoolingVoIP Voice over IPWCDMA Wideband Code Division Multiple AccessWF Water Filling
List of Tables xv
List of Symbolsαi Bandwidth expansion coefficient for user iβ The efficiency coefficient of the transceiver at the BSγmin Minimum SNR thresholdγi The required SNR of user i in accordance with MCS level index before
bandwidth expansionγi The required SNR of user i in accordance with MCS level index after
bandwidth expansionECij The overall energy consumption rate of user i on PRB j after bandwidth
expansionP Ti Transmitted power after bandwidth expansionλ Wavelength` load conditionρ Load factorµPA PA efficiencyν0 Probability of inactiveness statesν1 Probability of activeness statesbi Maximum number of each knapsack itemBj Bandwidth on PRB jBLi Buffer length of user iBLm Maximum allowable buffer lengthCij Explains that which available PRBs are assigned to which user before
bandwidth expansiond Distance between the user and the BSdij Distance of user i from BS jECij The overall energy consumption rate of user i on PRB j before band-
width expansionFij Fading components of user i on PRB jGlij Free space lossGij Channel gainGr Transmitter gainGt Receiver gainH The maximum capacity of knapsackL System loss unrelated to propagationLi Path loss in dB at user iM The number of available PRBs in each TTIN The number of active users in each TTIn Number of available knapsack itemsN0 Noise spectral densityNc Number of cooperative cellsNL Number of active linkNPApSec Number of PAs per sectorNSector Number of Sectorsp Additional pilot densityPCij Total power consumption of the BS for user i on PRB j
PC Total instantaneous power consumption in the BS

xvi List of Tables
List of SymbolsPR Received signal powerP T Instantaneous radiated power for the BS antennaP Tij Radiated power for the BS antenna for user i on PRB jPin Required input powerPlink Power consumption due to backhaulingPmax Maximum RF output power at maximum load conditionPout Required output powerPS Static power consumed by the rest of BS elementsP0 Power consumption at the minimum possible output powerQi profit of item i in knapsack problemq CSI signaling due to CoMPRij Channel capacity for a point to point communication system over an
AWGN channel for user i on PRB jRBij The ratio of Rij to BjRk The link capacity of each coordinated cell in bits per secondRtotal Total achievable data rate among coordinated cellsSi,j Loss due to fast fading in dB at user iTc Constant time of moving average filteringUSPO Signal processing overheadWi Knapsack weight vectorXi Binary variable, and presents an index for selecting the item iYC Cooling lossYPSBB Battery Backup and power supply lossz Path loss exponent
Chapter 1
Introduction
1.1 Scope
A major cause of global warming is the greenhouse effect of the Earth due to increase of
carbon dioxide (CO2) gas, which looks like an umbrella cloud and keeps heat of the sun inside
Earth’s atmosphere. Human activities such as using vehicles for transportation and raising
number of factories have contributed to a dramatic increase of CO2 gas emission which cannot
be absorbed by plants in the same rate that it produce. Telecommunication industries in the
world, producing about 183 million tons of CO2, which is equivalent to %7.0 of its global
production [1].
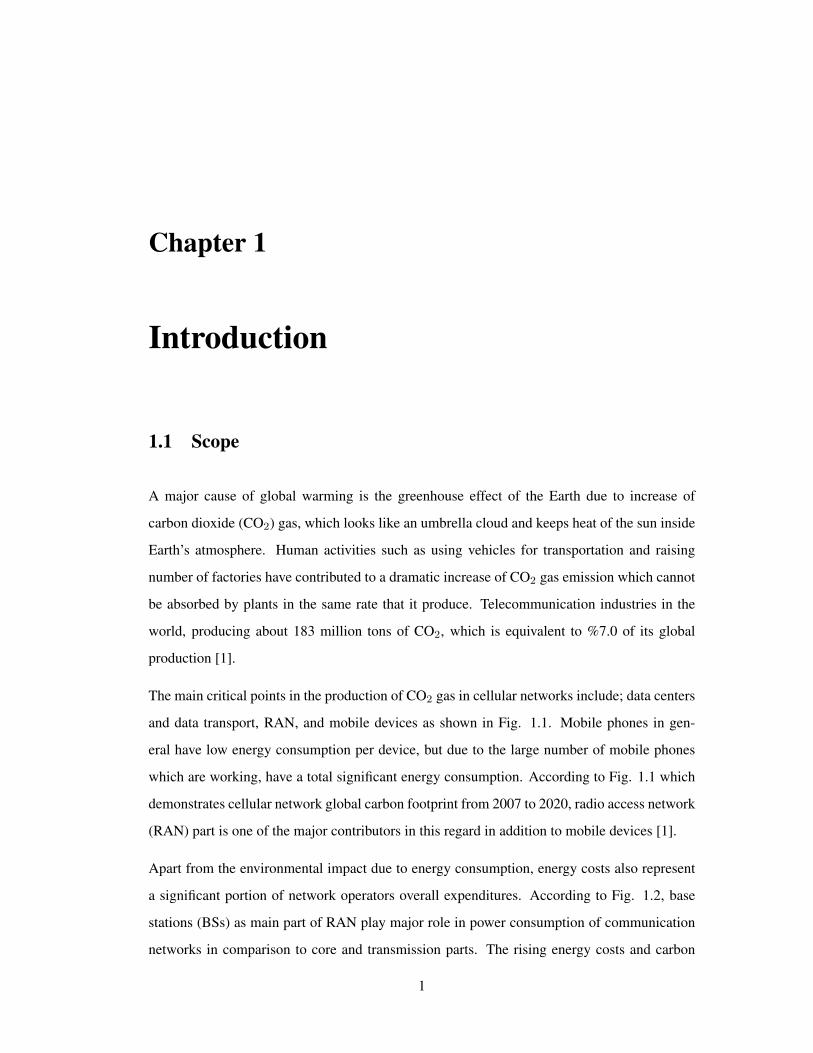
The main critical points in the production of CO2 gas in cellular networks include; data centers
and data transport, RAN, and mobile devices as shown in Fig. 1.1. Mobile phones in gen-
eral have low energy consumption per device, but due to the large number of mobile phones
which are working, have a total significant energy consumption. According to Fig. 1.1 which
demonstrates cellular network global carbon footprint from 2007 to 2020, radio access network
(RAN) part is one of the major contributors in this regard in addition to mobile devices [1].
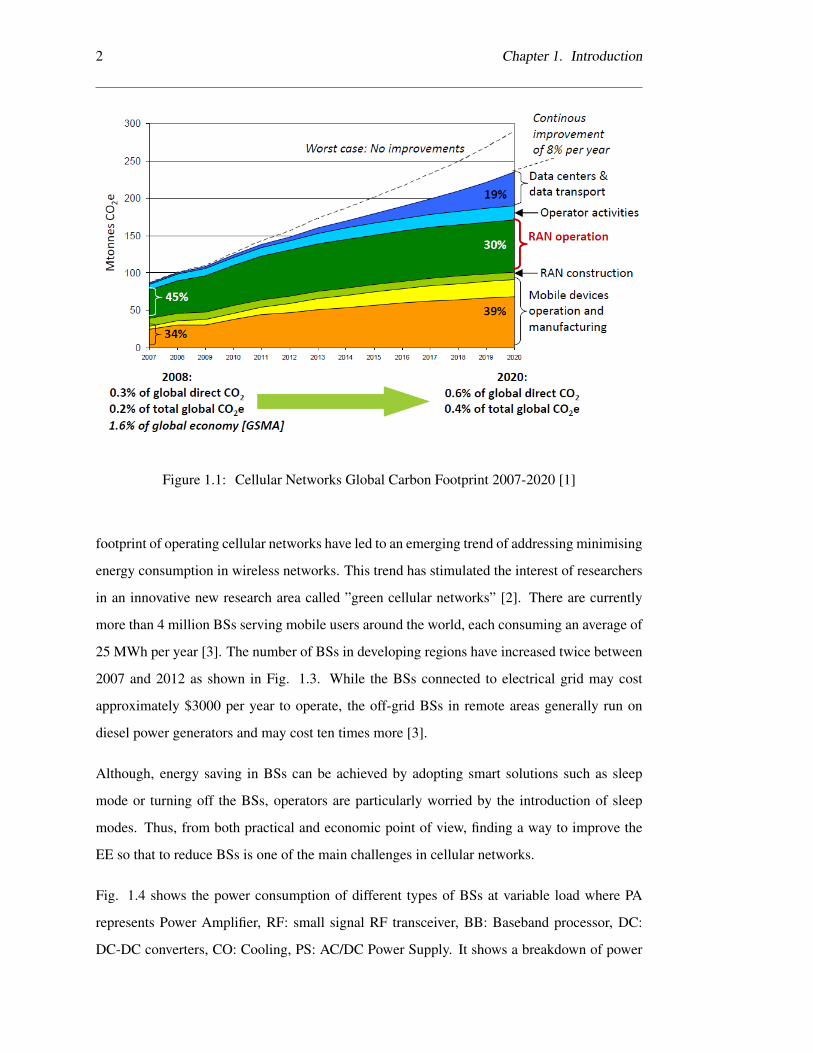
Apart from the environmental impact due to energy consumption, energy costs also represent
a significant portion of network operators overall expenditures. According to Fig. 1.2, base
stations (BSs) as main part of RAN play major role in power consumption of communication
networks in comparison to core and transmission parts. The rising energy costs and carbon
1
2 Chapter 1. Introduction
Figure 1.1: Cellular Networks Global Carbon Footprint 2007-2020 [1]
footprint of operating cellular networks have led to an emerging trend of addressing minimising
energy consumption in wireless networks. This trend has stimulated the interest of researchers
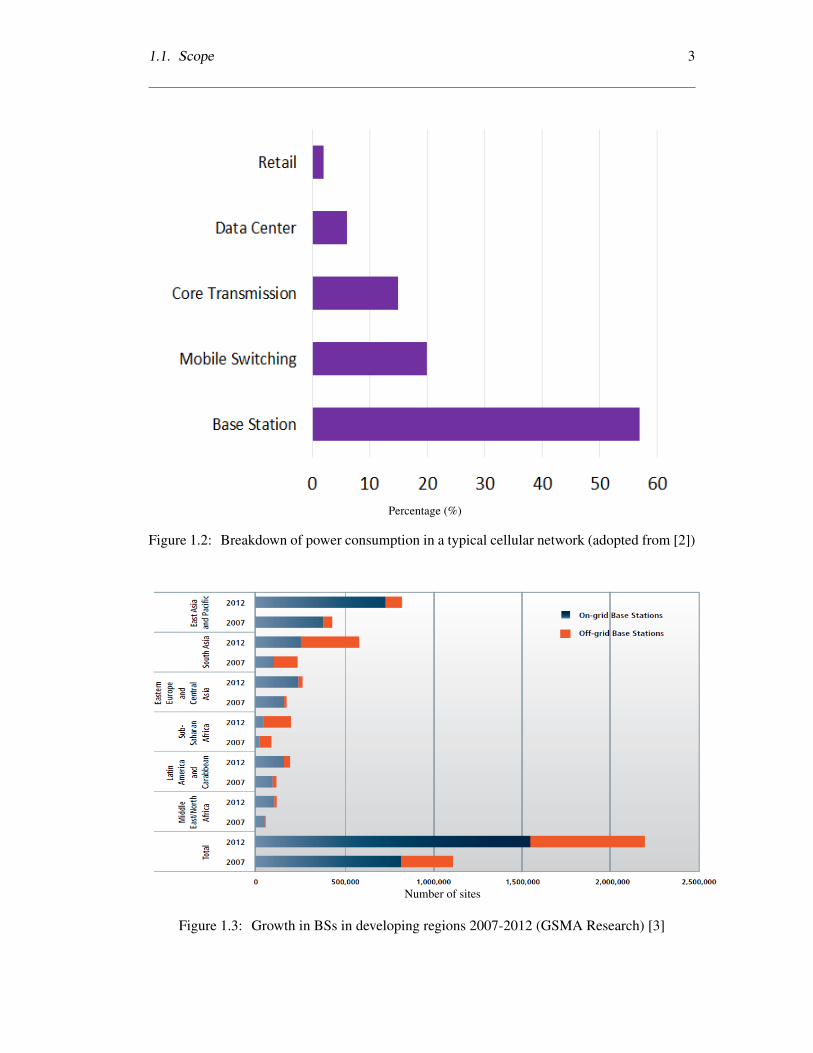
in an innovative new research area called ”green cellular networks” [2]. There are currently
more than 4 million BSs serving mobile users around the world, each consuming an average of
25 MWh per year [3]. The number of BSs in developing regions have increased twice between
2007 and 2012 as shown in Fig. 1.3. While the BSs connected to electrical grid may cost
approximately $3000 per year to operate, the off-grid BSs in remote areas generally run on
diesel power generators and may cost ten times more [3].
Although, energy saving in BSs can be achieved by adopting smart solutions such as sleep
mode or turning off the BSs, operators are particularly worried by the introduction of sleep
modes. Thus, from both practical and economic point of view, finding a way to improve the
EE so that to reduce BSs is one of the main challenges in cellular networks.
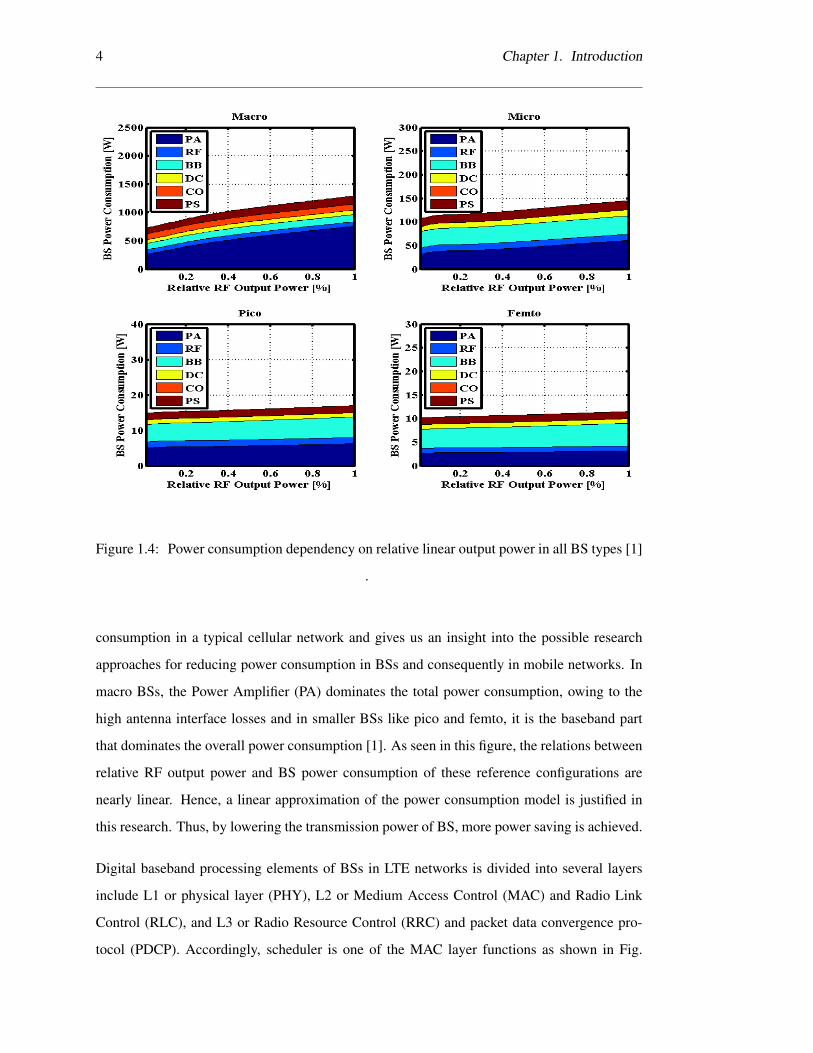
Fig. 1.4 shows the power consumption of different types of BSs at variable load where PA
represents Power Amplifier, RF: small signal RF transceiver, BB: Baseband processor, DC:
DC-DC converters, CO: Cooling, PS: AC/DC Power Supply. It shows a breakdown of power
1.1. Scope 3
Percentage (%)
Figure 1.2: Breakdown of power consumption in a typical cellular network (adopted from [2])
Number of sites
Figure 1.3: Growth in BSs in developing regions 2007-2012 (GSMA Research) [3]
4 Chapter 1. Introduction
Figure 1.4: Power consumption dependency on relative linear output power in all BS types [1]
.
consumption in a typical cellular network and gives us an insight into the possible research
approaches for reducing power consumption in BSs and consequently in mobile networks. In
macro BSs, the Power Amplifier (PA) dominates the total power consumption, owing to the
high antenna interface losses and in smaller BSs like pico and femto, it is the baseband part
that dominates the overall power consumption [1]. As seen in this figure, the relations between
relative RF output power and BS power consumption of these reference configurations are
nearly linear. Hence, a linear approximation of the power consumption model is justified in
this research. Thus, by lowering the transmission power of BS, more power saving is achieved.
Digital baseband processing elements of BSs in LTE networks is divided into several layers
include L1 or physical layer (PHY), L2 or Medium Access Control (MAC) and Radio Link
Control (RLC), and L3 or Radio Resource Control (RRC) and packet data convergence pro-
tocol (PDCP). Accordingly, scheduler is one of the MAC layer functions as shown in Fig.
1.1. Scope 5
PHY
MAC
RLC
PDCP
RRC
Dynamic Resource
Allocation (Scheduler)
eNodeB Measurement
Configuration and
Provision
Radio Admission
Control
Connection Mobility
Control
RB Control
Inter Cell RRM
eNodeB
Packet
Filtering
UE IP Address
AllocationMobility
anchoring
EPS Bearer Control
Idle State Mobility
Handling
NAS Security
Internet
E-UTRAN EPC
S-GW P-GW
MME
S1
Figure 1.5: Functional Split between eNodeB and EPC (adopted from [4])
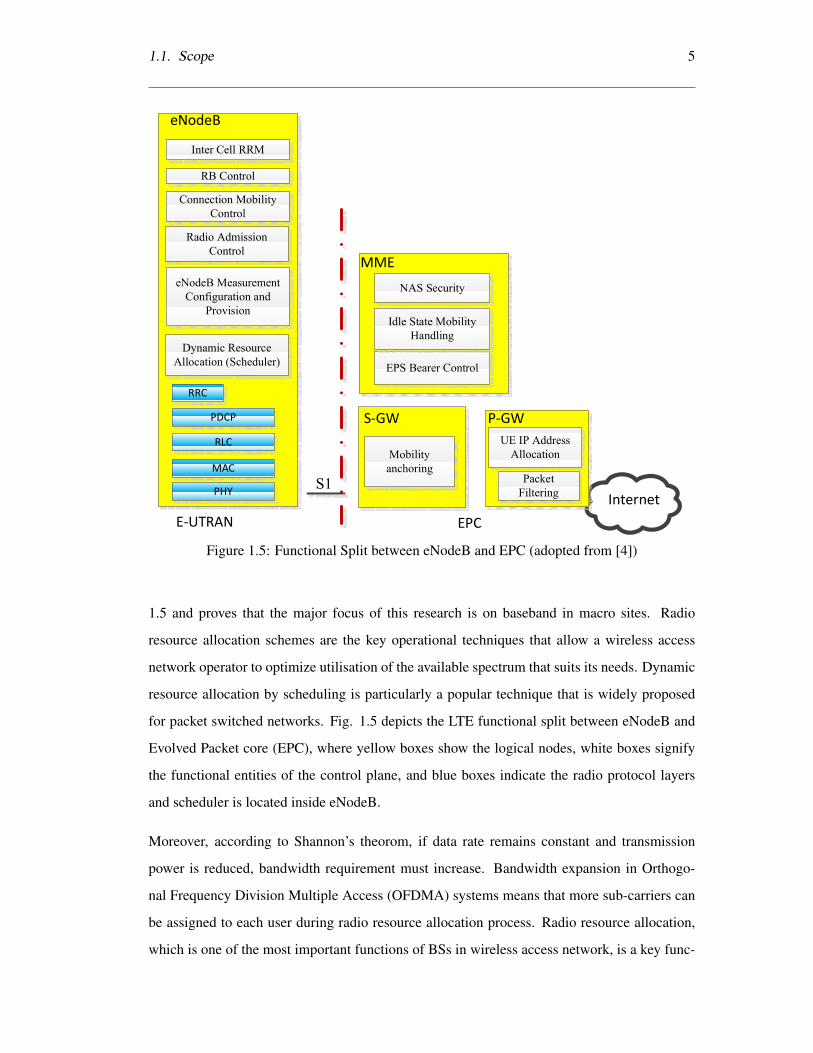
1.5 and proves that the major focus of this research is on baseband in macro sites. Radio
resource allocation schemes are the key operational techniques that allow a wireless access
network operator to optimize utilisation of the available spectrum that suits its needs. Dynamic
resource allocation by scheduling is particularly a popular technique that is widely proposed
for packet switched networks. Fig. 1.5 depicts the LTE functional split between eNodeB and
Evolved Packet core (EPC), where yellow boxes show the logical nodes, white boxes signify
the functional entities of the control plane, and blue boxes indicate the radio protocol layers
and scheduler is located inside eNodeB.
Moreover, according to Shannon’s theorom, if data rate remains constant and transmission
power is reduced, bandwidth requirement must increase. Bandwidth expansion in Orthogo-
nal Frequency Division Multiple Access (OFDMA) systems means that more sub-carriers can
be assigned to each user during radio resource allocation process. Radio resource allocation,
which is one of the most important functions of BSs in wireless access network, is a key func-
6 Chapter 1. Introduction
tion to reduce power consumption in each BS. Thus, designing energy efficient scheduling
algorithms, which can also guarantee QoS requirements, is a non-trivial and important chal-
lenge, particularly in OFDMA systems.
1.2 Challenges and Motivations
Energy saving has become a popular research theme in recent years. In this regard, a number
of metrics for performance evaluation have been suggested. Energy Consumption Rate (ECR)
is an index widely used for evaluation of EE which indicates the quantity of energy consumed
per each bit (Joule/bit). Due to the emergence of new services in wireless networks, the aim
has now been shifted towards providing not only better quality of service (QoS) but also lower
ECR.
Moreover, most of the existing radio resource allocation techniques for OFDMA systems with
affordable complexity perform scheduling of the users based on the available radio resources
and neglect the impact of traffic load while in off-peak occasions some radio resources re-
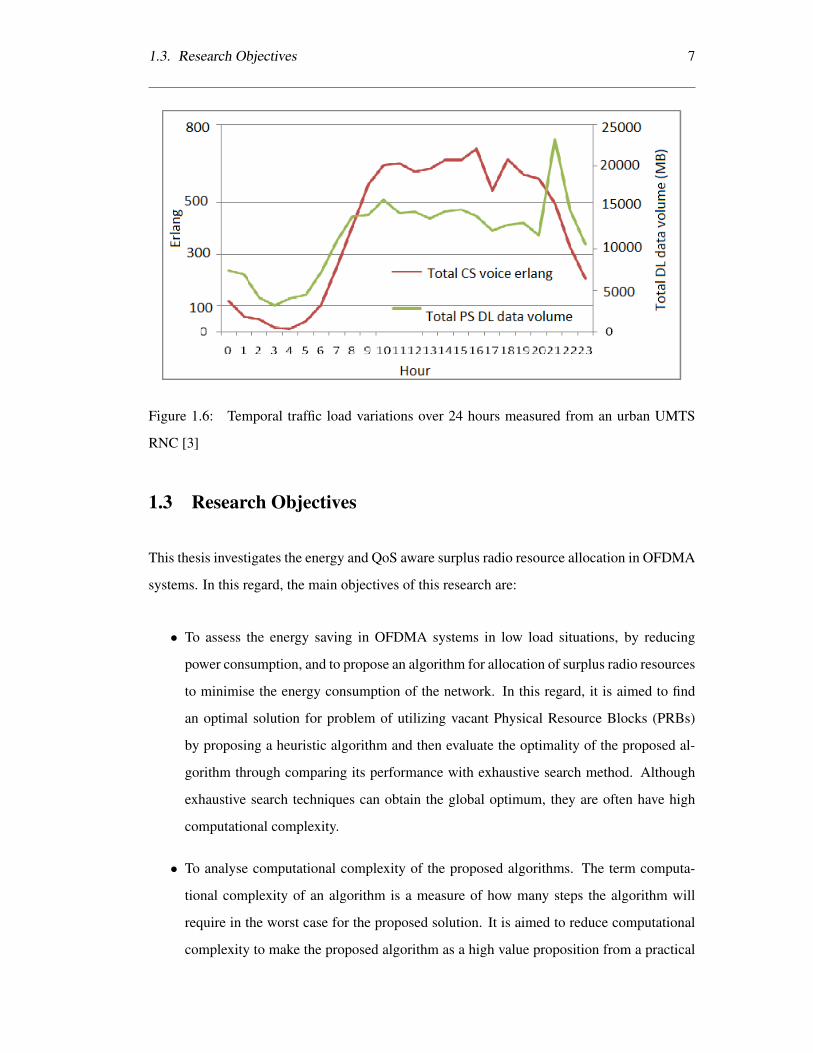
mained unused. Due to the fluctuation of the demand as depicted in Fig. 1.6, there is a sig-
nificant opportunity to exploit unused bandwidth during low load network condition to reduce
energy consumption. This figure illustrates a 24-hour fluctuation of traffic load measured from
a commercial Wideband Code Division Multiple Access (WCDMA) network as an example
in an urban area in both circuit-switched (CS) voice traffic (Erlang) and packet-switched (PS)
data volume [3]. It is seen that first 5-6 hours in a day experience much smaller traffic load
compared to busy hours. During off-peak hours, which more resource are available in compar-
ison to busy hours, the operators can adopt the proposed scheme to reduce energy consumption
in wireless networks and accordingly increase their revenue. Motivated by this fact, research
on low traffic situations is necessary.
To avoid combinational optimisation and complexity, surplus resource allocation problem is
formulated as an Integer Programming (IP), which contains integer variable and adds novelty
to this research by proposing a heuristic algorithm.
1.3. Research Objectives 7
Figure 1.6: Temporal traffic load variations over 24 hours measured from an urban UMTS
RNC [3]
1.3 Research Objectives
This thesis investigates the energy and QoS aware surplus radio resource allocation in OFDMA
systems. In this regard, the main objectives of this research are:
• To assess the energy saving in OFDMA systems in low load situations, by reducing
power consumption, and to propose an algorithm for allocation of surplus radio resources
to minimise the energy consumption of the network. In this regard, it is aimed to find
an optimal solution for problem of utilizing vacant Physical Resource Blocks (PRBs)
by proposing a heuristic algorithm and then evaluate the optimality of the proposed al-
gorithm through comparing its performance with exhaustive search method. Although
exhaustive search techniques can obtain the global optimum, they are often have high
computational complexity.
• To analyse computational complexity of the proposed algorithms. The term computa-
tional complexity of an algorithm is a measure of how many steps the algorithm will
require in the worst case for the proposed solution. It is aimed to reduce computational
complexity to make the proposed algorithm as a high value proposition from a practical
8 Chapter 1. Introduction
point of view.
• To investigate the QoS performance in terms of packet drop ratio due to buffer overflow.
So, a buffer aware adaptive resource allocation scheme for OFDMA systems is proposed
for guaranteeing QoS in low load traffic conditions. Specifically, the priorities of the
users data buffers in the BS are ranked by their remaining life time or their buffer length.
The scheme allocates unused radio resources according to Channel Quality Indicator
(CQI) feed back with the uplink by taking users’ buffer status into account to avoid
buffer overflow.
1.4 Research Contributions
In accordance with the objectives of the thesis, our contributions have been summarized as
follows:
• The proposed scheduling algorithm adopts a strategy based on observation of the out-
standing demands in the data buffers. It exploits the random fluctuations of the demand
to employ the actual number of information bit transmitted per time slot from the BS,
whenever the empty resource block is found in each time slot. The scheduler operates
to reduce the payload of the transmission, reducing the coding rate. This allows the
transmitter to reduce energy per time slot. However, the system is always allowed to
operate at full transmission bandwidth, i.e. all resource blocks are always occupied.
This allows the scheduler to use transmission power for the resource by reducing energy
consumption whenever possible. In other words, the bandwidth is traded off for energy,
whenever possible. This strategy is implemented based on the adaptive modulation and
coding (AMC) facility of the 3GPP standards. Using the proposed scheme, three relevant
energy efficient schedulers are introduced. The results of performance analysis demon-
strate the superior performance of the proposed scheme in terms of energy consumption
of the network.
• An optimisation problem is introduced and evaluated for single-cell scenarios to find the
optimal solution in terms of energy consumption. The problem is formulated as a Knap-
sack optimisation problem and resulting in a novel solution as dynamic programming.
1.5. Thesis Overview 9
Two power allocation methods, equal power and water filling, are also incorporated into
the model to show the flexibility of the solution. The model is expanded to include multi-
cell scenarios. Moreover, the concept of Coordinated Multi Point (CoMP) is included
in the model to find the optimal bandwidth expansion coefficient by considering various
load factors of the cells participating in CoMP. The resulting algorithm is then compared
with the exhaustive search method to prove its optimality.
• Using the proposed heuristic scheme, a method of optimisation has been provided to
reduce the computational complexity. This fact has been achieved using dynamic pro-
gramming, sorting the users based on the received signal to noise ratio, for which the
highest one is allocated the first surplus resource block. The analytical model is com-
pared with the exhaustive search results. It is demonstrated that the proposed scheme has
low computational complexity.
• Finally, a method of provisioning quality of service in terms of packet drop ratio has
been investigated. The method is based on allocation of vacant resource blocks to the
users with a critical buffers. If the quality of service conditions are satisfied, then the
remaining resources are utilised for other users with no critical buffers. In other words,
it assigns the empty resource blocks to the most critical buffer to extend its bandwidth
and calculate modulation and coding scheme (MCS) levels to reduce power and energy
consumption. If there is no critical buffer in a time slot, it assigns the rest of resources in
respect to their EE.
1.5 Thesis Overview
This thesis is organised in five chapters as follows. A brief overview of literature review and
background is discussed in chapter 2. In Chapter 3, the main idea of the proposed energy
efficient scheduling algorithm is presented and is applied to three principle schedulers to define
three new energy efficient schedulers. In chapter 4, the bandwidth expansion coefficient is
modelled as an optimisation problem in single-cell scenario and heuristic algorithm by adopting
Knapsack Problem (KP) is proposed. In Chapter 5, the idea is expanded to multi-cell scenario
to check the validity of the algorithm. In addition, the idea is applied to CoMP operation
10 Chapter 1. Introduction
and the algorithm is modified by introducing two new algorithms for finding optimal and near
optimal solution by adopting Multiple Choice Bounded Knapsack Problem (MCBKP) solution.
Finally, the main concluding remarks besides our proposed future work are given in chapter 6.
1.6 List of Publications
The outcome of this work is summarized in the publications listed below:
1. Journal Paper: M.R. Sabagh, M. Dianati, R. Tafazolli, and M. Mehrjoo. ”Energy efficient
and quality of service aware resource block allocation in OFDMA systems”. Communi-
cations, IET, 9(12):14791492, 2015.
2. Journal Paper: M.R. Sabagh, M. Dianati, R. Tafazolli, and M. Mehrjoo. ”Novel Energy
Efficient and QoS Aware Resource Block Allocation Algorithms in Low Load Multi-Cell
Scenario with CoMP Operation in OFDMA Systems”, (submitted to IEEE TVT)
3. Patent: X. Xiuqiang, M. Dianati, and M.R Sabagh. ”Resource distribution method and
device”, December 4 2013. CN Patent App. CN 201,210,162,180.
4. Conference Paper: M.R. Sabagh, M. Dianati, M.A. Imran, and R. Tafazolli. ”A heuristic
energy efficient scheduling scheme for VoIP in 3GPP LTE networks”. In Communica-
tions Workshops (ICC), 2013 IEEE International Conference on, pages 413418, June
2013.
5. Poster Presentation: M.R. Sabagh, M. Dianati, R. Tafazolli, and M. Mehrjoo. ”Energy
Efficient Allocation of Unused Radio Resources in OFDMA Systems”, EUCNC 2015,
Paris.
Achievements number 1 and 5 reflect on the findings presented in Chapter 4 and achievement 2
refers to the bulk of the study provided in Chapter 5, followed by achievements 3 and 4 which
refer to the outcome of the research conducted in Chapter 3.
Chapter 2
Background and Literature Review
In this chapter, the state of the art radio resource allocation techniques are reviewed and their
applications to light traffic conditions in single-cell and multi-cell scenarios are discussed.
Additionally, a general overview of OFDMA systems and technical specification of Long Term
Evolution (LTE) which adopts the OFDMA in downlink are discussed. Furthermore, some
power consumption modeling of BSs are presented. Also, since the information about traffic
models, EE metrics, Coordinated Multi Point (CoMP), and integer programming problem helps
us gain insights on the cellular networks performance, the rest of this chapter is dedicated to
these topics.
2.1 OFDM and OFDMA
OFDM systems divide frequency bandwidth into many narrow band subcarriers with uniformly
spaced zero crossing at 15 kHz intervals and transmit them in parallel. In this system, each of
the subcarriers is modulated with digital modulation schemes such as QPSK, 16QAM, 64QAM
in regarding to their signal quality. Thus, each OFDM symbol is a linear combination of
the instantaneous subcarriers’ signal. In OFDM system, there are two main characteristics;
first, Cyclic Prefix (CP) is used to reduce Inter Symbol Interference (ISI); then, there is no
interference among adjacent subcarriers. In this system, the entire bandwidth is assigned to
each user for a period and the resources cannot be shared among users.
11
12 Chapter 2. Background and Literature Review
OFDMA in spite of OFDM benefits from sharing the bandwidth among multiple users at each
time according to bandwidth requirement of each user. This issue is the main concept of energy
saving by using those empty resources to prepare an energy efficient system in light traffic
condition. 3GPP LTE is a good example, which adopts OFDMA for multiplexing scheme in
downlink.
2.2 State of the Art
Due to the global warming and shortage of energy resources, EE is becoming an increasingly
important feature in communication systems. A vast amount of research has been previously
carried out with regards to EE and green communication. [1, 4, 5, 12–15].
For EE evaluation of different BSs, definition of power consumption model of wireless access is
necessary. A number of power consumption models of BS in 3GPP LTE networks are proposed
in [1,8,9,16–21] which will be discussed in detail. In these studies, different models have been
introduced to show the relationship between power consumption and transmission power of
BSs for evaluation of EE in wireless networks.
The main concept of scheduling is the allocation of each PRB to the appropriate user that has
the best performance according to the defined utility function or metrics. In general, there are
two different types of schedulers; channel aware and channel unaware. Conventional Round
Robin is an example of channel unaware, and Proportional Fair (PF) and Best Channel Quality
Indicator (BCQI) are channel aware. In [22]- [23] some of these schedulers in DL have been
discussed and their performances from different point of view such as throughput, fairness,
and Quality of Service (QoS) requirement have been compared. Besides the channel condition,
buffer status is also included in scheduling decision [24].
In [25], a comprehensive survey on scheduling algorithms has been provided. It categorizes
schedulers to time and frequency opportunistic in the uplink and downlink. Despite 3GPP
Release 6 HSDPA, which uses time opportunistic schedulers, 3GPP LTE uses both frequency
and time by adopting FDMA techniques. Although both time and frequency schedulers can
be used in the uplink and downlink. The main difference of them is that in uplink, it is not
needed to report channel quality status. These schedulers were defined to maximise some
2.2. State of the Art 13
objective function such as overall system throughput or fairness-sensitive metrics with regards
to or regardless of channel quality status feedback. For instance, Round Robin (RR), which is
a basic scheduler is blind to channel variations but has maximum fairness. The performances
of different aspects of schedulers in various scenarios for diverse services such as VoIP, web
browsing have been discussed in this survey.
In [26], some scheduling techniques such as Proportional Fair (PF) and Best Channel Quality
Indicator (BCQI) are discussed and a new scheduler, which used Mutual Information Effective
SNR Mapping (MIESM) for calculation of the average CQI value is proposed and its perfor-
mance is compared with other schedulers.
Some schedulers were discussed for IEEE 802.16 network [27], and a novel scheduler for
non-real-time polling service based on the cross layer scheme, which consider both Automatic
Repeat request (ARQ) mechanism at the media access control layer and the adaptive modula-
tion and coding technique at the physical layer.
The bulk of the existing work on resource allocation and scheduling focus on the traditional
performance parameters such as throughput and fairness for several schemes, as given in [2]-
[28]. They evaluated the variations of some principle techniques such as Round Robin (RR),
Best Channel Quality Indicator (BCQI), Proportional Fair (PF), and other schemes. However,
EE of scheduling schemes in presence of surplus resource blocks has not been adequately
addressed by the existing studies, to the best of our knowledge. Nonetheless, some aspects
of energy efficient scheduling schemes are investigated in [29], which seek to reduce energy
consumption of transmission over Additive White Gaussian Noise (AWGN) channels while
maintaining QoS for users by using mathematical algorithms. Performance evaluation of some
principal schedulers in multi-cell scenario in terms of EE have been investigated in [30].
Some principle ideas were given in [23]- [31], which assume increase of packet transmission
duration for the reduction of transmission power by using several numerical algorithms for
offline and online scheduling. These studies mostly consider optimum energy scheduling for
single carrier systems. Some of the recent proposed schedulers [32, 33], evaluated in the next
subsections, are based on trading off bandwidth for EE without considering buffer state. Moti-
vated by this demand, this study aims to provide an insight on introducing an energy efficient
scheduler by taking both channel and buffer state into account to save further energy in light
14 Chapter 2. Background and Literature Review
traffic situation.
In [34], the performance of schedulers, including throughput, fairness, and QoS requirement
have been investigated in downlink OFDMA systems.
Some of the recent proposed schedulers which are discussed in the previous sections ( [32]
and [33]) are based on trading off bandwidth for EE without considering the buffer status,
which has a significant impact on the QoS provision. In [32], the authors propose a score
based scheduling algorithm and evaluate the performance of their scheme in terms of energy
consumption and throughput. In [33], the authors propose a radio resource allocation strategy
in order to reduce the power consumption of BS in terms of Joule/bit. Nonetheless, those
references provide neither analytical framework nor QoS analysis with respect to buffer status
for their proposed schemes.
Analytical modeling of resource allocation in OFDMA systems has also been investigated by
some of the recent studies. A good survey of the related work in this aspect can be found in [35].
This survey paper points out that the problem of radio resource allocation (RRA) is a non
linear programming (NLP) problem that can be analytically solved by some techniques such
as Lagrange multiplier approach. However, owing to high computational complexity of the
optimal solutions, suboptimal algorithms have been developed in the literature. Different from
the surveyed approaches in [35], the authors in [36] consider the RRA problem as an integer
linear programming (ILP), and propose a fast optimal algorithm based on the branch and bound
search method. In [37] fair weights have been suggested for scheduling heterogeneous traffic
in the downlink of OFDMA systems. Lagrange dual decomposition method is adopted to find
the optimal solution of the utility based objective function of the RRA problem. As a result,
the authors propose an opportunistic fair scheduling which allocates the resources according
to the fair weights. In [38], the RRA is investigated in both uplink and downlink of OFDMA
systems in terms of EE. In downlink, the problem is considered as maximisation of overall
EE, which is strictly quasi-concave. At first, the authors provide an optimal solution and then
develop a low-complexity suboptimal solution by exploring the inherent structure and property
of the energy-efficient design. In [39], energy efficient radio resource allocation problem in
downlink OFDMA systems is addressed. The problem is assumed as mixed integer non-linear
programming (MINLP), and different iterative method is proposed to solve the Karush Kuhn
2.2. State of the Art 15
Tucker (KKT) conditions of the corresponding non-convex problem.
In the existing cellular networks, multiple BSs operate in overlapping coverage areas to assign
the available radio resources among the user equipment (UE). The concept of multi-cell Radio
Resource Allocation (RRA) has been subject to much development in recent years. A detailed
discussion on this topic has been provided in [40–42] which aim to improve the data rate and
spectral efficiency subject to predefined constraints such as transmitted power in both uplink
or downlink of OFDMA systems.
Despite single-cell scenario, Inter-Cell Interference (ICI) is one of the major issues in multi-cell
cellular access networks in which a UE typically receives relatively strong signals from more
than one BS, especially in cell edges. Recently, finding an efficient algorithm for radio resource
allocation in multi-cell, while proposing a mechanism to eliminate inter-cell interference has
been considered. Some techniques such as frequency reuse which assigns different frequencies
to cell edge area and cental area are introduced in this context [43]. Another promising tech-
nique is Inter-Cell Interference Coordination (ICIC) by adopting CoMP, where two or more
BSs (BSs) from different cells are coordinated to send similar services to one user simultane-
ously, via a high speed backhaul link (X2 interface) as highlighted in [44] and [45].
CoMP has been considered as a powerful technique for Long Term Evolution Advanced (LTE-
A) to improve spectral efficiency and throughput especially for users at cell edges by mitigating
the interference from different transmission points. Different types of coordinated or collab-
orative scheduling schemes in multi-cell environments such as central, semi-distributed, and
totally distributed coordination are proposed in [46–50]. In multi-cell CoMP operations, addi-
tional backhaul connections between cooperating sites as well as additional signal processing
at the BSs are required owing to cooperation of BSs. Therefore, the major concern is to tradeoff
between gains in the average cell throughput obtained from CoMP techniques and increased
power consumption of BSs. Different power consumption models are investigated in [51–53].
Energy Efficient (EE) resource allocation while utilising CoMP has been recently studied
[54–58]. RRA in this context aims to find an optimal radio resource algorithm while max-
imising the EE performance of the entire cellular network during transmissions. In [59], the
Cloud-based Radio Access Network (C-RAN) architecture as well as different CoMP strate-
gies to the multi-cell systems are introduced, and green advantages of C-RAN and cooperation
16 Chapter 2. Background and Literature Review
details of CoMP in terms of EE are analysed. In [60], the QoS, power allocation and RRA
are addressed simultaneously by proposing a novel and efficient Multi Objective based Carrier
Aggregation (CA) Scheduling algorithm in LTE-A network. Since the operators are generally
interested in a balance between the energy minimisation and capacity maximisation, in [61],
the use of Multi-stream carrier aggregation is adopted to minimize the energy consumption in
a multi-layer Heterogeneous Network (HetNet) in 5G wireless systems by multi-objective op-
timization modelling. Furthermore, power allocation problem for maximising EE in downlink
CoMP systems with non-orthogonal multiple access (NOMA) in 5G network is investigated
in [62], and EE maximisation problems for the three schemes under the constraints of min-
imum users data rate and maximum BS transmit power are formulated and the results are
compared with OFDMA systems. In [63], the problem of power consumption minimisation in
HetNets of China Mobile by implementing dynamic switching operation in BSs is evaluated,
and two algorithms were proposed to find the solution. Moreover, the energy and cost effi-
ciency of a HetNet that is a cooperation result of many mobile network operators (MNOs) are
studied in [64]. Each MNO is owner of a HetNet, composed of BSs and small cells (SCs) and
they cooperate by sharing their infrastructure and by switching off a part of it. BS type and
traffic load constitute switching off criteria and a roaming cost based user association scheme
is used to roam traffic to neighbouring BSs. By reducing the costs, the MNOs are motivated
to maintain their sharing agreement instead of following a non-cooperative tactic. In addition,
the multi-Radio Access Technology (RAT) cooperation energy saving scheme was developed
in [65] to effectively improve the energy efficiency of the network in the way of self organizing
Network (SON) by identifying and coordinating cells with overlapping coverage to achieve
network energy-savings. When the traffic load meets the threshold, its traffic is transferred to
the compensating cell and shut down the energy saving cell. The uplink of a hybrid HetNet
with femtocells overlaid on a macrocell by selecting the frequency band either from the sub-6
GHz and the millimeter Wave is assumed in [66], and a two layer game theoretic framework is
formulated to maximise EE while optimising the network resources. In [67], QoS in terms of
delay is studied in HetNet, and the power allocation based on noncooperative scheme is pro-
posed to mitigate the interference and increase the EE in small cells. In [68], a new EE model
with circuit power consumption in downlink massive multiple-input multiple-output (MIMO)
systems is proposed, and the impact of the number of transmit antennas and the transmit power
2.3. 3GPP LTE Technical Specification 17
on EE is evaluated. Resource pooling and cooperation is introduced in [69] to reduce the power
consumption of cellular networks and save significant amounts of energy and consequently re-
duce the greenhouse gas emissions generated by cellular communications. An EE and delay
aware cross layer resource allocation in SISO wireless communication networks is presented
in [70] by applying effective energy efficiency (EEE) instead of EE which is the ratio of the
system effective capacity over the total power consumption. A modified C-RAN architecture,
namely hybrid cloud RAN, where baseband functionalities can be virtualised and split at sev-
eral conceivable points is proposed in [71]. Each split option results in two-level deployment
of the processing functions through a transport layer called midhaul. The interaction of EE and
midhaul bandwidth consumption when baseband functions are centralized at the edge cloud vs
central cloud is evaluated.
The concept of buffer awareness in RRA and its association with EE has been discussed in
[72–74]. In light and moderate traffic conditions in wireless networks which constitute 50%
of daily traffic as shown in [75], once radio resources are allocated by schedulers, some radio
resources remain free. Hence, there is an opportunity for substantial energy savings in off-
peak traffic situations. Finding an optimum solution for the allocation of surplus resources in a
multi-cell scenario while minimising the energy consumption rate (ECR) is the objective of this
study. In [76], a Knapsack Problem (KP) for single-cell scenario is adopted. Here, the idea is
extended to multi-cell where Multiple Choice Bounded Knapsack Problem (MCBKP) [77–82]
is introduced for finding the optimal solution.
The following subsections provide a detailed review of the energy efficient radio resource allo-
cation (RRA) concepts in Long Term Evolution (LTE) networks. Primarily, a brief overview of
the technical specification of 3GPP LTE as an example of OFDMA. Then, several power con-
sumption models and EE metrics are presented followed by scheduling techniques in OFDMA
systems and energy efficient scheduling algorithms.
2.3 3GPP LTE Technical Specification
Long Term Evolution (LTE) radio access technology, which was based on the first release
of the 3rd Generation Partnership Project (3GPP Rel-8), was extended in release 9 and 10.
18 Chapter 2. Background and Literature Review
Rel-10 often refers to LTE-Advanced to extend the performance of radio access to meet all
the requirements, which are defined by International Telecommunication Union (ITU). 3GPP
technical specification series are categorized into five major areas as follows [4]: 1- TS 36.101-
176 which standardise user and BS equipment requirement; 2- TS 36.201-216 which give
Physical layer specification and TS 36.814 that gives further advancement in physical layer
aspects; 3- TS 36.300-361 explain Layer 2 and 3, which are Medium Access Control (MAC),
Radio Link Control (RLC), and Radio Resource Control (RRC); 4- TS 36.401-465 introduce
BS and mobile terminal entities; 5- TS 36.508-579 explain conformance testing procedures.
The standards of category 1, 2, and 3, and brief overviews of these standards are given in next
subsections.
2.3.1 LTE Network Architecture
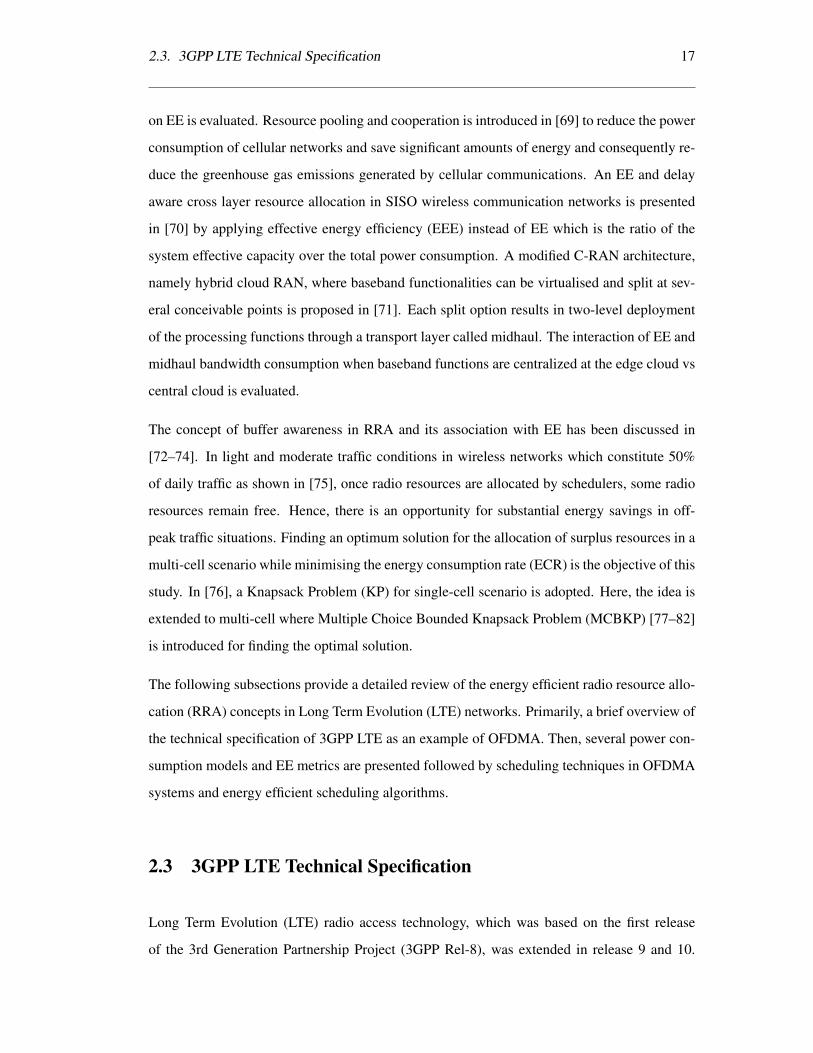
An overall architecture of LTE network based on release 8 is shown in Fig. 2.1. The Evolved
Universal Terrestrial Radio Access Network (E-UTRAN) NodeBs (eNodeBs) are connected to
each other through X2 interface and by S1 interface to Mobility Management Entities (MME)
and Serving Gateway (S-GW).
X2
X2X2
eNB
eNB
eNB
MME/
S-GW
S1S1S1 S1
MME/
S-GW
Figure 2.1: An Overall Architecture of LTE release 8 Network [4]
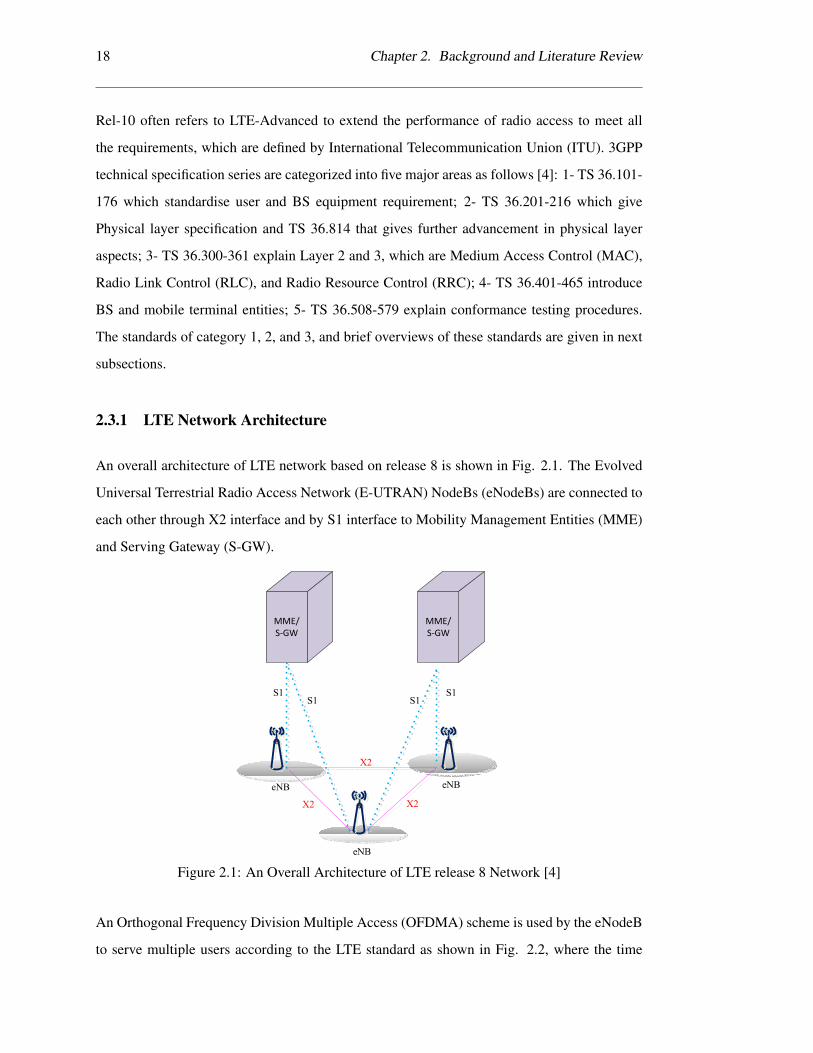
An Orthogonal Frequency Division Multiple Access (OFDMA) scheme is used by the eNodeB
to serve multiple users according to the LTE standard as shown in Fig. 2.2, where the time
2.4. Power Consumption Modelling 19
TTI (1ms) TTI (1ms) TTI (1ms)
12su
b-ca
rrie
rs12
sub-
carr
iers
12su
b-ca
rrie
rs
Figure 2.2: Radio Resource Structure in 3GPP LTE
and frequency of the channel are divided into multiple PRBs. The time axis is divided into
frames with durations of 10 ms. Each frame consists of 10 Transmission Time Interval (TTI)
of duration of 1 ms, which is also known as a sub-frame. Each TTI has two time slots of 0.5
ms, equivalent to the transmission time of 6 or 7 OFDM symbols [4].
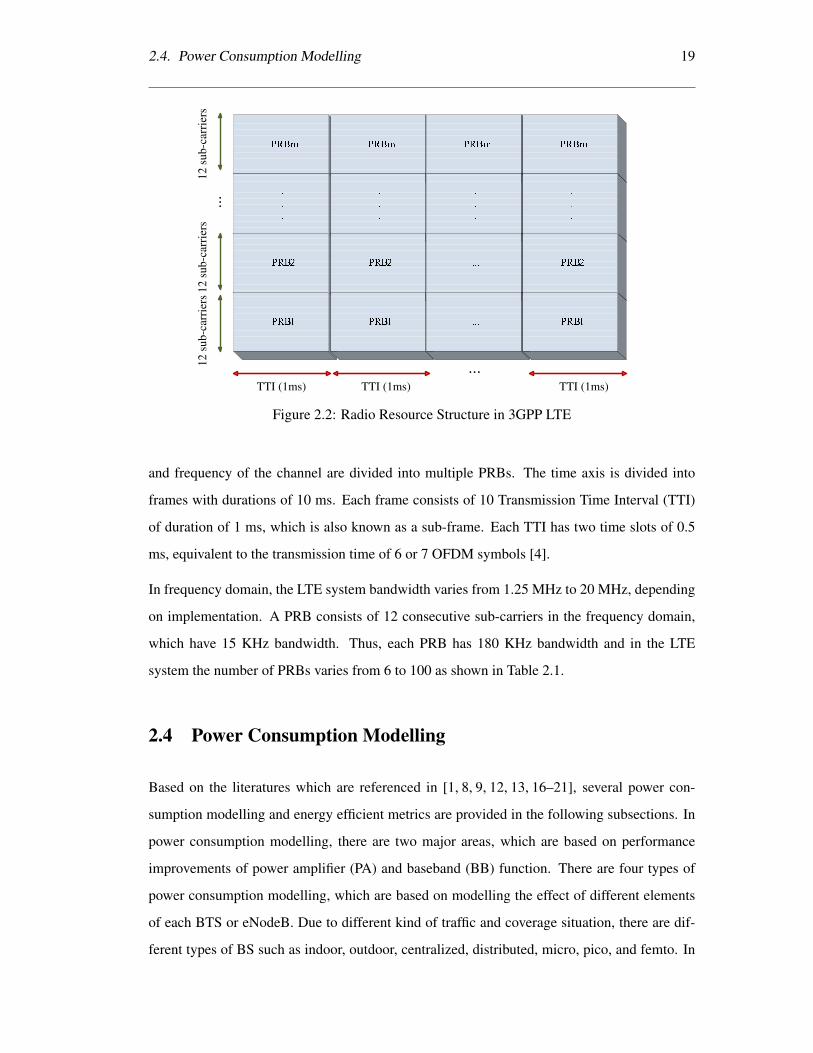
In frequency domain, the LTE system bandwidth varies from 1.25 MHz to 20 MHz, depending
on implementation. A PRB consists of 12 consecutive sub-carriers in the frequency domain,
which have 15 KHz bandwidth. Thus, each PRB has 180 KHz bandwidth and in the LTE
system the number of PRBs varies from 6 to 100 as shown in Table 2.1.
2.4 Power Consumption Modelling
Based on the literatures which are referenced in [1, 8, 9, 12, 13, 16–21], several power con-
sumption modelling and energy efficient metrics are provided in the following subsections. In
power consumption modelling, there are two major areas, which are based on performance
improvements of power amplifier (PA) and baseband (BB) function. There are four types of
power consumption modelling, which are based on modelling the effect of different elements
of each BTS or eNodeB. Due to different kind of traffic and coverage situation, there are dif-
ferent types of BS such as indoor, outdoor, centralized, distributed, micro, pico, and femto. In
20 Chapter 2. Background and Literature Review
Table 2.1: LTE Bandwidth/Resource Configuration [4]
System
Bandwidth(MHz) 1.25 2.5 5 10 15 20
Sub-carriers
Bandwidth(KHz) 15 15 15 15 15 15
PRB
Bandwidth(KHz) 180(15*12) 180(15*12) 180(15*12) 180(15*12) 180(15*12) 180(15*12)
FFT
Size 128 256 512 1024 1536 2048
Number of
Available PRBs 6 12 25 50 75 100
each of these types, there are a number of common elements and other extra components. For
example, indoor sites must have an external cooling system in a container or room, its power
consumption does not include in the BS power consumption modelling and for outdoor sites,
cooling system or climate control is included, and it affects the power consumption of the BS.
Another part of BS that attracted research is baseband function [1]- [12]. The aim is to find out
power hungry blocks and baseband functions for saving more energy, as a result of less power
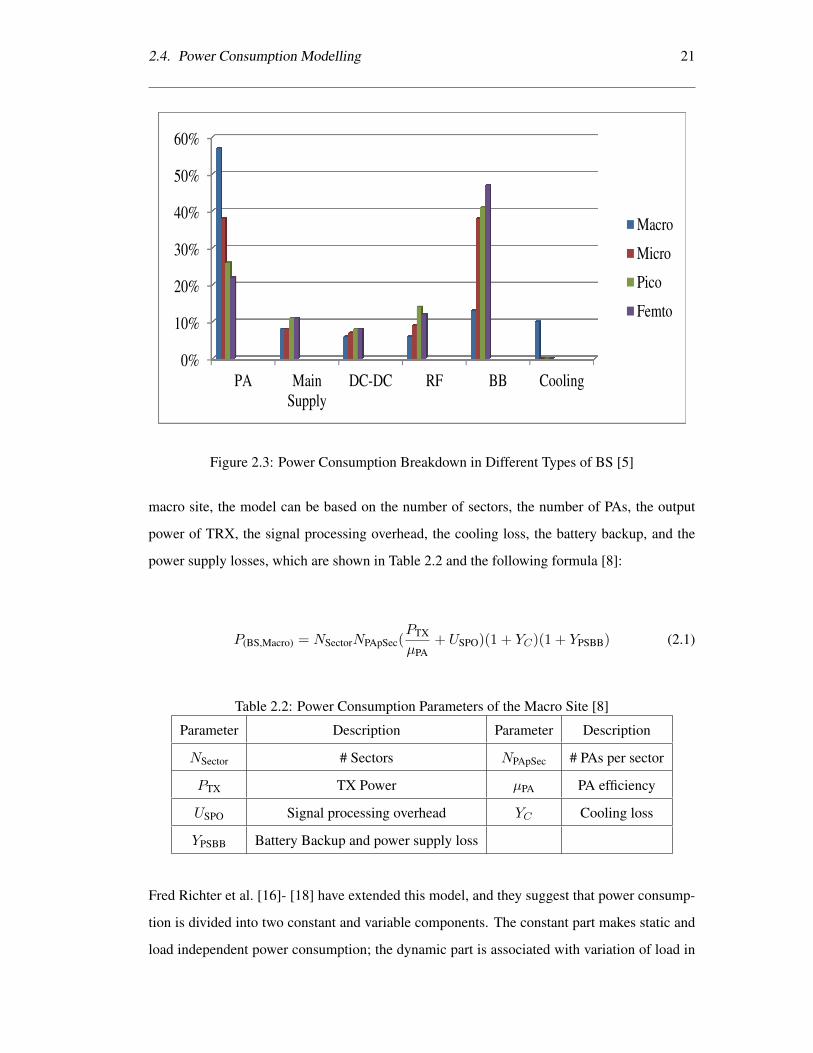
consumption will be gained. In [13] power consumption breakdown for different types of BS
have been discussed and summarised as shown in Fig. 2.3. It shows that PA is the major part
in the macro and micro sites, and BB is the dominant part in pico and femto sites. In the next
sub section, several models are presented.
2.4.1 Arnold (Alcatel-Lucent) Model
This model can be used for both macro and micro sites. In this model, power consumption is
divided into two parts, which are constant or variable. The constant parts make static power
consumption, and dynamic part will be affected by variation of power consumption of some el-
ements in the different load situations of the BS. Each site’s signal can be broadcasted via some
sectors and in each of them, there is some similar equipment such as feeder, antenna which are
not included in this model. However, the PA of each sector can be different. Therefore, in the
2.4. Power Consumption Modelling 21
0%
10%
20%
30%
40%
50%
60%
PA Main
Supply
DC-DC RF BB Cooling
Macro
Micro
Pico
Femto
Figure 2.3: Power Consumption Breakdown in Different Types of BS [5]
macro site, the model can be based on the number of sectors, the number of PAs, the output
power of TRX, the signal processing overhead, the cooling loss, the battery backup, and the
power supply losses, which are shown in Table 2.2 and the following formula [8]:
P(BS,Macro) = NSectorNPApSec(PTX
µPA+ USPO)(1 + YC)(1 + YPSBB) (2.1)
Table 2.2: Power Consumption Parameters of the Macro Site [8]
Parameter Description Parameter Description
NSector # Sectors NPApSec # PAs per sector
PTX TX Power µPA PA efficiency
USPO Signal processing overhead YC Cooling loss
YPSBB Battery Backup and power supply loss
Fred Richter et al. [16]- [18] have extended this model, and they suggest that power consump-
tion is divided into two constant and variable components. The constant part makes static and
load independent power consumption; the dynamic part is associated with variation of load in
22 Chapter 2. Background and Literature Review
distinct conditions.
2.4.2 Deruyck Model
This model [20, 21] can be used for both macro and micro sites. It describes the relation
between average radiated power and input power of macro and micro BSs using the aforemen-
tioned power consumption model. For macro site, it can be written as the following expression:
PC = βP T + PS (2.2)
where β is dependent on all of the elements of the aforementioned model except the signal
processing and the other part, which is independent of transmit power and accounted as PS .
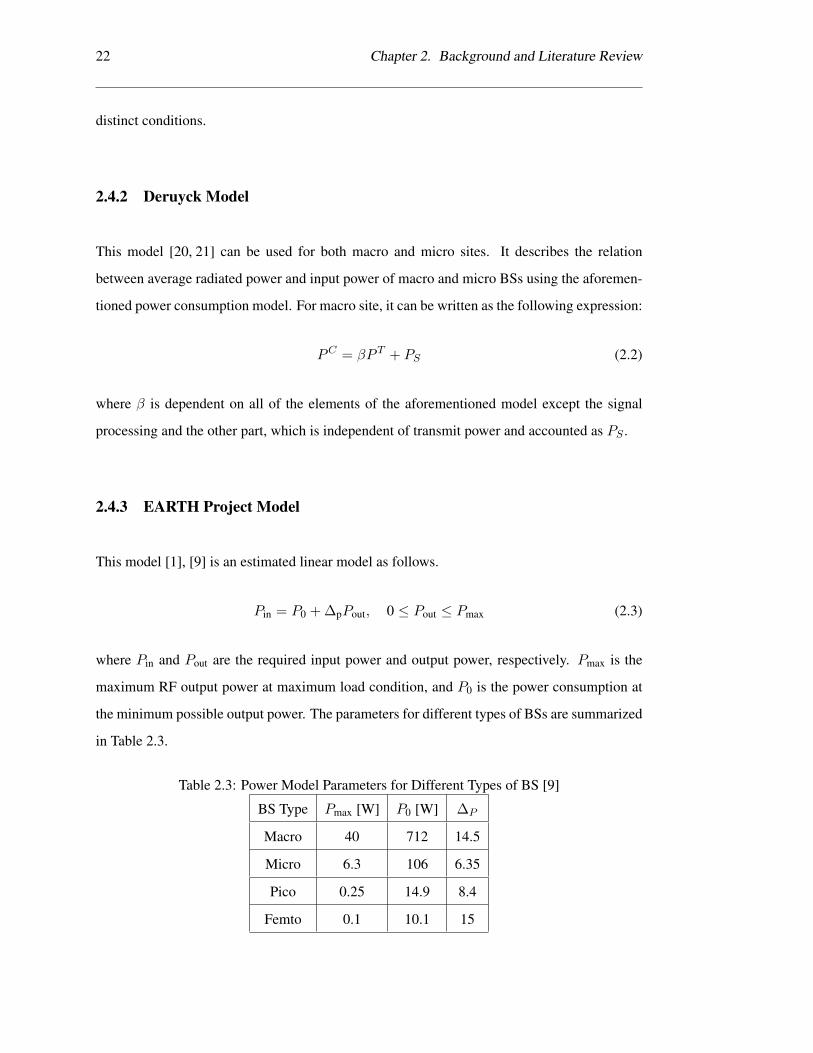
2.4.3 EARTH Project Model
This model [1], [9] is an estimated linear model as follows.
Pin = P0 + ∆pPout, 0 ≤ Pout ≤ Pmax (2.3)
where Pin and Pout are the required input power and output power, respectively. Pmax is the
maximum RF output power at maximum load condition, and P0 is the power consumption at
the minimum possible output power. The parameters for different types of BSs are summarized
in Table 2.3.
Table 2.3: Power Model Parameters for Different Types of BS [9]
BS Type Pmax [W] P0 [W] ∆P
Macro 40 712 14.5
Micro 6.3 106 6.35
Pico 0.25 14.9 8.4
Femto 0.1 10.1 15
2.5. EE Metrics 23
2.5 EE Metrics
In this section, a brief overview of EE or energy consumption metrics is presented [83, 84].
According to these references, three types of metrics have been defined as follows;
1. Energy Consumption Rate (ECR) or energy per bit: It can be derived from the ratio of
the average network power to the average data rate, and can be formulated as following:
ECR =P
R(Joule/bit) (2.4)
2. Power per area unit, which is defined as division of the average network power usage by
the coverage area of the network and can be measured by Watt per m2 (W/m2).
3. Energy Reduction Gain (ERG) in percentage: It shows the percentage of saved energy
in each network and is formulated as follows:
ERG = 1− ECRTest
ECRRef% (2.5)
where ECRRef is the ECR value in case of fixed transmit power and ECRTest is the ECR
value in operation case with required transmit power.
2.6 Coordinated Multi Point (CoMP)
Third Generation Partnership Project (3GPP) has completed a study on coordinated multi point
transmission and reception techniques in Release 11 to facilitate cooperative communications
across multiple transmission and reception points (e.g., cells) for the Long Term Evolution Ad-
vanced (LTE-A) system as shown in Fig. 2.4. In CoMP operation, multiple points coordinate
with each other in such a way that the transmission signals from/to other points do not incur
serious interference or even can be exploited as a meaningful signal. The trend of increasing
demand for high quality of service at the user terminal or user equipment (UE), coupled with
the shortage of wireless spectrum, requires more advanced wireless communication techniques
to mitigate intercell interference and increase the cell edge throughput.
Coordinated multipoint (CoMP) transmission and reception techniques utilise multiple transmit
and receive antennas from multiple antenna site locations, which may or may not belong to the
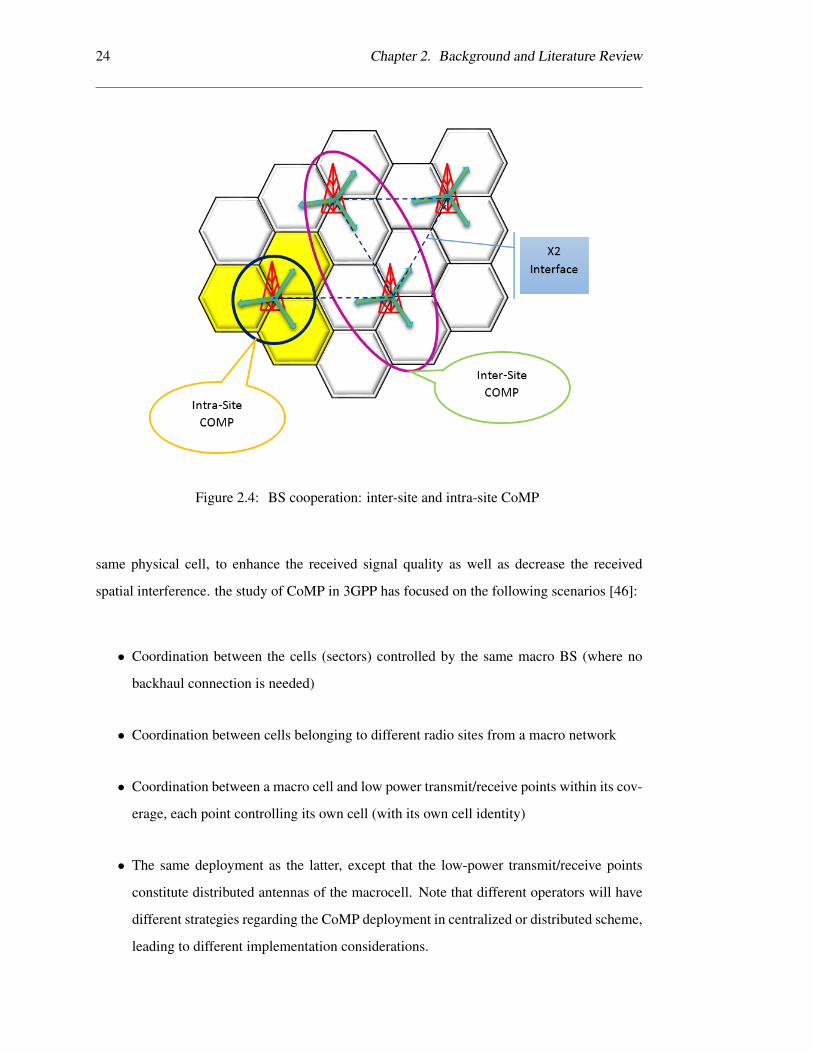
24 Chapter 2. Background and Literature Review
Figure 2.4: BS cooperation: inter-site and intra-site CoMP
same physical cell, to enhance the received signal quality as well as decrease the received
spatial interference. the study of CoMP in 3GPP has focused on the following scenarios [46]:
• Coordination between the cells (sectors) controlled by the same macro BS (where no
backhaul connection is needed)
• Coordination between cells belonging to different radio sites from a macro network
• Coordination between a macro cell and low power transmit/receive points within its cov-
erage, each point controlling its own cell (with its own cell identity)
• The same deployment as the latter, except that the low-power transmit/receive points
constitute distributed antennas of the macrocell. Note that different operators will have
different strategies regarding the CoMP deployment in centralized or distributed scheme,
leading to different implementation considerations.
2.7. Optimisation problems 25
2.7 Optimisation problems
The general format of optimisation problem is given as follows [85]:
minimise f0(x),
subject to: fi(x) ≤ 0, i = 1, 2, ...,m (2.6)
hi(x) = 0, i = 1, 2, ..., p
where x∈Rn is the optimisation variable and the function f0 : Rn→R stands for the objective
function or cost function. The inequalities fi(x) ≤ 0 are called inequality constraints, and
the corresponding functions fi : Rn → R are called the inequality constraint functions. The
equations hi(x) = 0 are called the equality constraints, and the functions hi : Rn → R are the
equality constraint functions. If there are no constraints (i.e., m = p = 0) the problem 2.6 is
unconstrained. The goal is to find an optimal value of x that minimises f0(x) among all x that
satisfy the conditions fi(x) ≤ 0, i = 1, . . . ,m, and hi(x) = 0, i = 1, . . . , p. If x∗ is feasible
and f0(x∗) = p∗, then x is an optimal point, or solves the problem 2.6. If there exists an optimal
point for the problem 2.6, the optimal value is achieved, and the problem is solvable otherwise
the optimal value is not attained.
2.7.1 Convex Optimisation Problem
A convex optimisation problem is one of the form [85]:
minimise f0(x),
subject to: fi(x) ≤ 0, i = 1, 2, ...,m (2.7)
aTi (x) = bi, i = 1, 2, ..., p
where f0, . . . , fm are convex functions. Comparing 2.7 with the general standard form
problem 2.6, the convex problem has three additional requirements; the objective function
must be convex, the inequality constraint functions must be convex, and the equality constraint
functions hi(x) = aTi x− bi must be affine.
26 Chapter 2. Background and Literature Review
A function f is convex if the domain of f , Df , is a convex set, i.e., (1 − t)x + ty ∈ Df for
every x, y ∈ Df and t ∈ [0, 1], and f(θx+ (1− θ)y) ≤ θf(x) + (1− θ) f(y) for every x, y
∈ Df and 0 ≤ θ ≤ 1.
A fundamental property of convex optimisation problems is that any locally optimal point is
also (globally) optimal.
2.7.2 Concave Maximisation Problem
An optimisation problem is nonconvex if either the feasible region or the objective function be
nonconvex. Concave maximisation problem is modelled as follows [85]:
maximise f0(x),
subject to: fi(x) ≤ 0, i = 1, 2, ...,m (2.8)
aTi (x) = bi, i = 1, 2, ..., p
As a convex optimisation problem if the objective function f0 is concave, and the inequality
constraint functions f1, . . . , fm are convex. This concave maximisation problem is readily
solved by minimising the convex objective function f0.
Despite convex optimisation problems, which optimum solution is achieved, there is no sug-
gested algorithm for non-convex optimisation problems to find an optimum solution. There-
fore, non-convex optimisation problems are usually solved for a near optimal solution.
2.7.3 Integer Programming Problem
Integer linear programming refers to mathematical programming with discrete variables and
linearities in the objective function and constraints. If some of the variables in the problem
are not restricted to be integer or binary variables, they are called mixed integer programming
problems (MIP). In other words, MIP is an optimisation problem that combines continuous and
discrete variables while Integer programming (IP) adopt only integer variables. The general
form of an integer linear program (ILP) is expressed as follows [86, 87]:
2.7. Optimisation problems 27
maximisen∑j=1
cjXj ,
subject to:n∑i=1
aijxj ≤ ri, i = 1, 2, ...,m (2.9)
xj ≥ 0, j = 1, 2, ..., n
xj : integer.
For the sake of simplicity, the term ”programming problem” is sometimes replaced by program
and thus an integer programming problem is also called an integer program. If no continuous
variables are present, the MIP reduces to pure IP. If no integer-restricted variables are exist the
MIP reduces to a linear program (LP). A LP is also obtained by relaxing or ignoring the integer
requirements in a given MIP. Thus, the resulting LP is called the LP relaxation of a given IP. An
integer program in which the integer variables are restricted to be 0 or 1 is called a 0-1 (binary)
integer program, or binary IP (BIP).
The theory of computational complexity involves classifying problems according to their in-
herent tractability or intractability that is, whether they are easy or hard to solve. This classi-
fication scheme includes the well-known classes P which stands for Polynomial time and NP
is referred as Non-deterministic Polynomial time; the terms NP-complete and NP-hard are re-
lated to the NP classes. NP-hard is the class of decision problems to which all problems in NP
can be reduced to in polynomial time. In computational complexity theory, non-deterministic
polynomial-time (NP) is a class of problems. There are also more difficult problems than those
in NP. Such problems have been named NP-hard, i.e. they belong to the NP-Complete class or
are harder than any problems in this class as depicted in Fig. 2.5 [88, 89].
Since integer linear programming is NP-hard, many problem instances are hard to deal with,
thus heuristic algorithms must be used instead.
2.7.4 Knapsack Problem
A BIP with a single constraint, whose objective function and constraint coefficients are all
positive, is called a knapsack problem (KP). An IP with a single constraint and all positive
28 Chapter 2. Background and Literature Review
Figure 2.5: NP-hard Euler diagram
constraint coefficients is called an integer knapsack program, in which the values of an integer
variable are not restricted to 0-1. In particular, an integer knapsack program is a knapsack
program if all integer variables are restricted to be 0 or 1 [87].
In a knapsack problem there are a set of items, each with a weight Wi and a profit Qi, which
should be packed in a knapsack with a capacity C. Different types of knapsack problems are
introduced in [90] including 0-1 KP, fractional knapsack problem (FKP), bounded knapsack
problem (BKP), unbounded knapsack problem (UKP). According to similarity of the problem
pertinent to this study with 0-1 KP and BKP, the focus here is upon these two types. In 0-1
KP, the goal is to choose a subset of n items in such a way that the total profit is maximised
without the total weight having to exceed the capacityH . This type of KP is therefore modeled
2.7. Optimisation problems 29
as follows:
maximisen∑i=1
QiXi,
subject to:n∑i=1
WiXi ≤ H, (2.10)
Xi ∈ {0, 1} and integer i=1,..,n ,
whereXi is a binary variable, and presents an index for selecting the item i. If bounded amount
of each item is selected, then there is a bounded knapsack problem. In contrast with 0-1 KP, in
BKP each item can be selected more than one time. The main format of BKP is defined by the
following:
maximisen∑i=1
PiXi,
subject to:n∑i=1
WiXi ≤ C, (2.11)
0 ≤ Xi ≤ bi and integer i=1,..,n ,
where C, Wi, Pi, bi, and n are the maximum capacity of knapsack, weight vector, profit,
maximum number of each item, and number of available items, respectively. Different tech-
niques are proposed to solve knapsack problems. For solving the BKP, a transformed function
is introduced in order to transform BKP to an equivalent 0-1 KP and then solve it efficiently
through a specialised algorithm. By transformation of BKP to 0-1 KP, each item is replaced by
a transformed number as follows:
n =
N∑i=1
dlog2(bi + 1)e. (2.12)
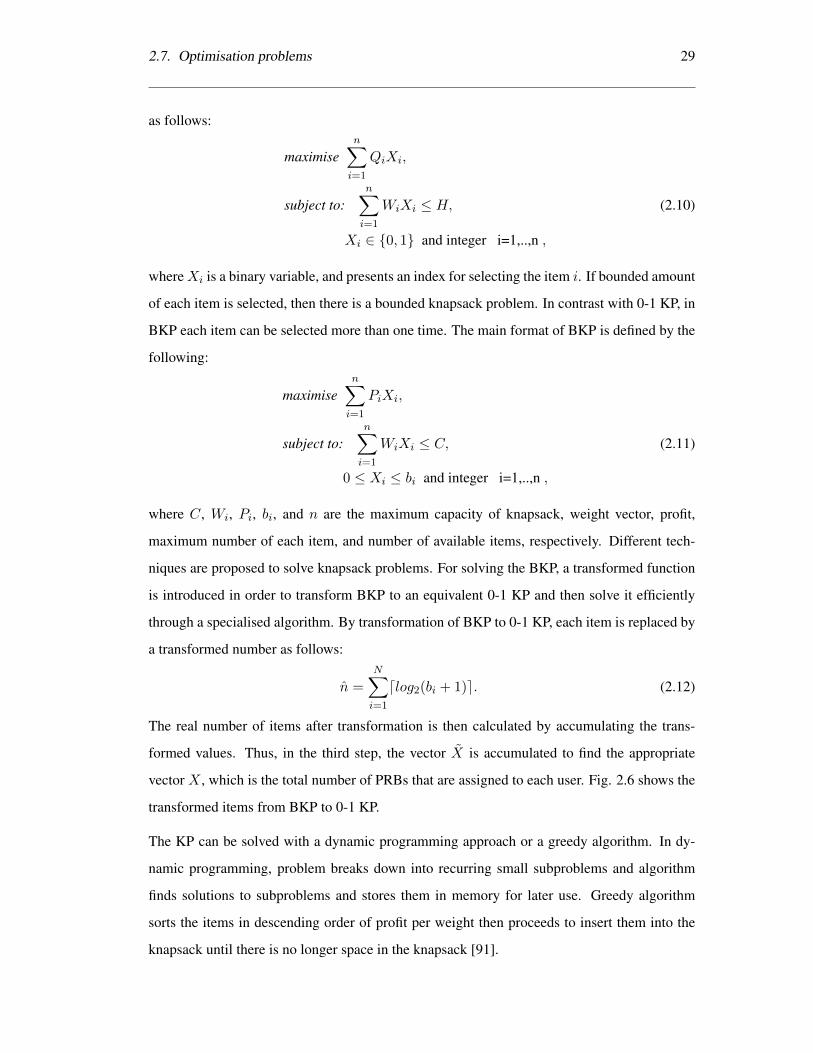
The real number of items after transformation is then calculated by accumulating the trans-
formed values. Thus, in the third step, the vector X is accumulated to find the appropriate
vector X , which is the total number of PRBs that are assigned to each user. Fig. 2.6 shows the
transformed items from BKP to 0-1 KP.
The KP can be solved with a dynamic programming approach or a greedy algorithm. In dy-
namic programming, problem breaks down into recurring small subproblems and algorithm
finds solutions to subproblems and stores them in memory for later use. Greedy algorithm
sorts the items in descending order of profit per weight then proceeds to insert them into the
knapsack until there is no longer space in the knapsack [91].
30 Chapter 2. Background and Literature Review
0 5 10 15 20 25 30 35 400
1
2
3
4
5
6
7
number of items in BKP (bi)
Tran
sfor
med
num
bero
fite
ms
from
BK
Pto
0-1
KP
(n)
Figure 2.6: Theoretical transformed number of items from BKP to 0-1 KP
Different types of knapsack problems are introduced in [77] such as 0-1 KP, bounded knapsack
problem (BKP), unbounded knapsack problem (UKP), and Multiple Choice Bounded Knap-
sack Problem (MCBKP). The MCKP is considered as an extension of the classical knapsack
problem in which items are distributed on n disjointed groups G = (G1 ∪ G2 ∪... ∪ Gn). The
variable Xij is equal to 1 when the item j of the group Gi is selected, and is 0 otherwise. The
MCBKP consists of selecting bounded items of each group without violating the knapsack ca-
pacity C in order to maximise the total profit of the selected items [78]. The main format of
the the MCBKP is defined as the following:
maximisen∑i=1
|Gi|∑j=1
PijXij ,
subject to:n∑i=1
|Gi|∑j=1
WijXij ≤ C, j = 1, ...,m (2.13)
0 ≤ Xij ≤ bij , (i = 1, .., n), (j = 1, .., |Gi|)
Xij : integer,
where C, Wij , Pij , bij , and n are the maximum capacity of knapsack, weight vector, profit,
maximum number of each item, and number of available groups. The variable Xij is equal to
2.8. Summary 31
1 when the item j of the group Gi is selected, 0 otherwise. Different techniques are proposed
to solve the knapsack problems. For solving the MCBKP, a transformed function is introduced
to transform the MCBKP to an equivalent 0-1 MCKP, then solve it efficiently through a greedy
algorithm. By transformation of the MCBKP to a 0-1 MCKP, each item is replaced by a
transformed number as follows:
nj =n∑i=1
dlog2(bij + 1)e, ∀ j = 1, ..., |Gi|. (2.14)
2.7.5 Complexity Analysis
The time complexity of an algorithm quantifies the amount of time taken by an algorithm to run
as a function of the length of the string representing the input. Big O notation in an algorithm
gives an approximate idea about the time it may take to run the algorithm , or rate of growth
and how efficient the algorithm is. It is also called the upper bound of time complexity of the
algorithm [92]. In 0-1 KP, the complexity is O(n*W), where n is the number of items, and
W is the maximum weight of items. In greedy algorithm based on maximisation of profit to
weight, there is an additional complexity owing to sorting by O[n*log(n)]. So, the complexity
in 0-1 greedy knapsack is O[(n*W)+(n*log(n))]. The greedy BKP is slightly more complex
and increases to O[(n*W)+(n*log(n))], where n is the transformed number of items [91].
2.8 Summary
To summarize, owing to an important role of EE in wireless technologies, most of the proposed
algorithms have tried to reduce power and energy in access network area. Consequently, energy
efficient scheduling has remained as a popular topic in recent studies. Different from those
categories, the present work aims to investigate EE of some well-known principle scheduling
schemes that are used in a variety of proposals. In addition, a novel enhancement is proposed
which contributes to energy conscious operation of wireless access networks. In Chapter 3, the
proposed algorithm is discussed more in detail.
Chapter 3
Buffer and Channel Aware Energy
Efficient Scheduler
Energy consumption in BSs and downlink transmission seems to be a major area that signifi-
cant conservation can be achieved. The focus of this study is radio resource management and
allocation functions for the downlink of 3GPP LTE, which is envisaged to be the most promis-
ing access for the future mobile networks. In this chapter, first, EE of well known and principal
scheduling schemes, RR, BCQI, and PF is evaluated. Then, a novel energy efficient scheme in
low load traffic conditions is proposed. The proposed scheme trades off bandwidth for energy
whenever possible depending on the load of the network. By applying this approach on the
principal schedulers, three relevant energy efficient schedulers for Voice over IP (VoIP) traffic,
namely, Energy Efficient Round Robin (EERR), Energy Efficient Best Channel Quality Indi-
cator (EEBCQI), and Energy Efficient Proportional Fair (EEPF) are introduced. The results
of performance analysis, which are based on the specifications of the downlink of 3GPP LTE
(Long Term Evolution) demonstrate the superior performance of the proposed scheme in terms
of energy consumption of the network, while providing required Quality of Service (QoS) for
the users.
The contributions of this chapter are twofold: first, we study EE of a number of principal
scheduling schemes such as RR, BCQI, and PF through comprehensive system level simula-
tions; then, we propose a novel scheduling scheme for transmission of VoIP traffic over the
downlink of an OFDMA system, similar to 3GPP LTE standard specifications. The proposed
32
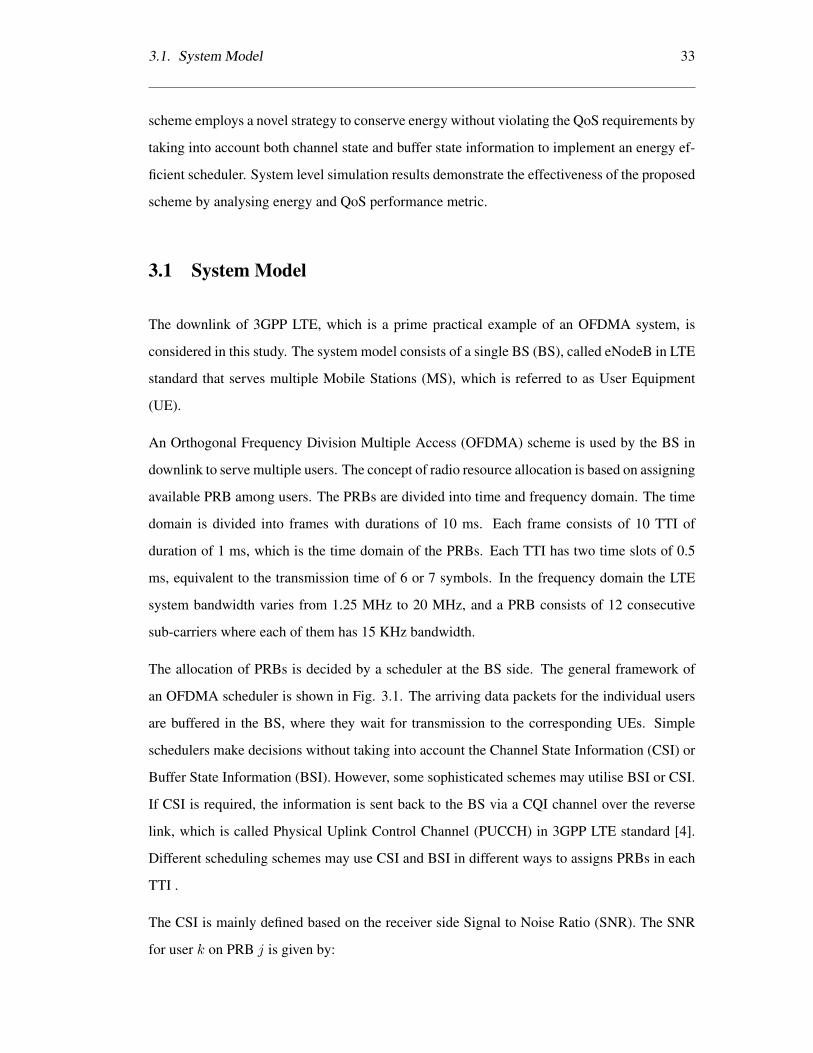
3.1. System Model 33
scheme employs a novel strategy to conserve energy without violating the QoS requirements by
taking into account both channel state and buffer state information to implement an energy ef-
ficient scheduler. System level simulation results demonstrate the effectiveness of the proposed
scheme by analysing energy and QoS performance metric.
3.1 System Model
The downlink of 3GPP LTE, which is a prime practical example of an OFDMA system, is
considered in this study. The system model consists of a single BS (BS), called eNodeB in LTE
standard that serves multiple Mobile Stations (MS), which is referred to as User Equipment
(UE).
An Orthogonal Frequency Division Multiple Access (OFDMA) scheme is used by the BS in
downlink to serve multiple users. The concept of radio resource allocation is based on assigning
available PRB among users. The PRBs are divided into time and frequency domain. The time
domain is divided into frames with durations of 10 ms. Each frame consists of 10 TTI of
duration of 1 ms, which is the time domain of the PRBs. Each TTI has two time slots of 0.5
ms, equivalent to the transmission time of 6 or 7 symbols. In the frequency domain the LTE
system bandwidth varies from 1.25 MHz to 20 MHz, and a PRB consists of 12 consecutive
sub-carriers where each of them has 15 KHz bandwidth.
The allocation of PRBs is decided by a scheduler at the BS side. The general framework of
an OFDMA scheduler is shown in Fig. 3.1. The arriving data packets for the individual users
are buffered in the BS, where they wait for transmission to the corresponding UEs. Simple
schedulers make decisions without taking into account the Channel State Information (CSI) or
Buffer State Information (BSI). However, some sophisticated schemes may utilise BSI or CSI.
If CSI is required, the information is sent back to the BS via a CQI channel over the reverse
link, which is called Physical Uplink Control Channel (PUCCH) in 3GPP LTE standard [4].
Different scheduling schemes may use CSI and BSI in different ways to assigns PRBs in each
TTI .
The CSI is mainly defined based on the receiver side Signal to Noise Ratio (SNR). The SNR
for user k on PRB j is given by:
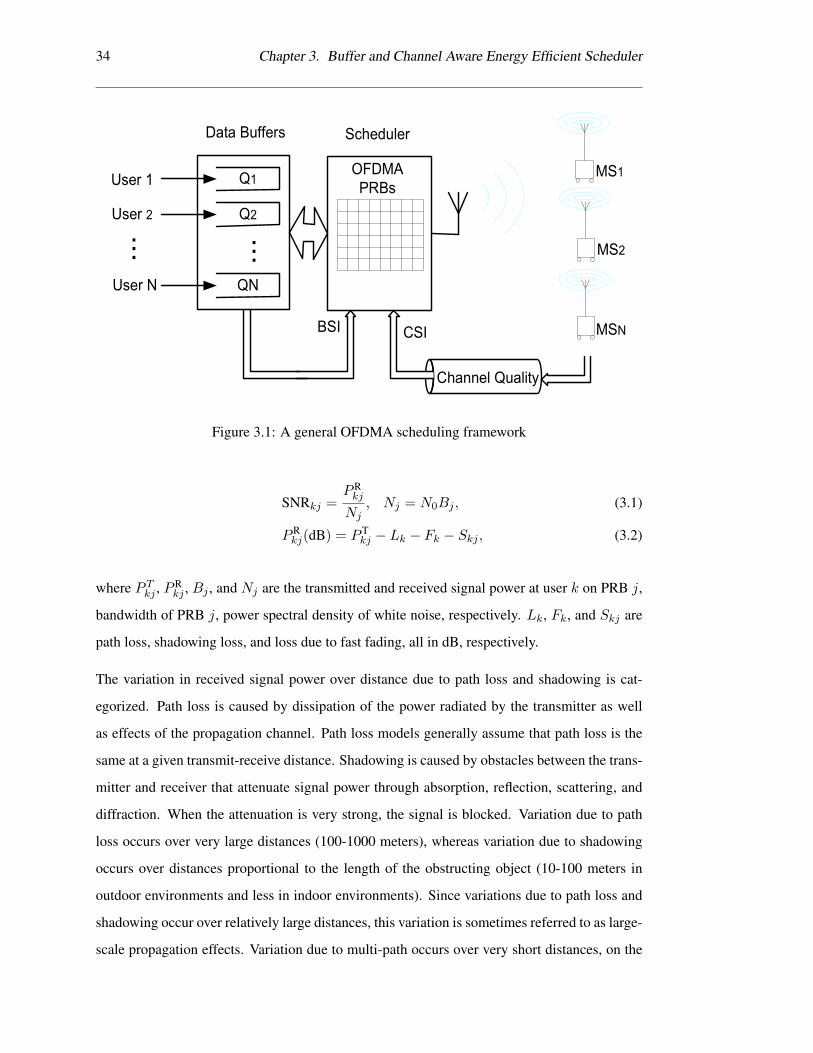
34 Chapter 3. Buffer and Channel Aware Energy Efficient Scheduler
Q1User 1
Q2User 2
QNUser N
Data Buffers Scheduler
...
...
MS1
Channel Quality
CSI
MS2
MSN
OFDMA
PRBs
BSI
Figure 3.1: A general OFDMA scheduling framework
SNRkj =PRkj
Nj, Nj = N0Bj , (3.1)
PRkj(dB) = P T
kj − Lk − Fk − Skj , (3.2)
where P Tkj , PRkj , Bj , and Nj are the transmitted and received signal power at user k on PRB j,
bandwidth of PRB j, power spectral density of white noise, respectively. Lk, Fk, and Skj are
path loss, shadowing loss, and loss due to fast fading, all in dB, respectively.
The variation in received signal power over distance due to path loss and shadowing is cat-
egorized. Path loss is caused by dissipation of the power radiated by the transmitter as well
as effects of the propagation channel. Path loss models generally assume that path loss is the
same at a given transmit-receive distance. Shadowing is caused by obstacles between the trans-
mitter and receiver that attenuate signal power through absorption, reflection, scattering, and
diffraction. When the attenuation is very strong, the signal is blocked. Variation due to path
loss occurs over very large distances (100-1000 meters), whereas variation due to shadowing
occurs over distances proportional to the length of the obstructing object (10-100 meters in
outdoor environments and less in indoor environments). Since variations due to path loss and
shadowing occur over relatively large distances, this variation is sometimes referred to as large-
scale propagation effects. Variation due to multi-path occurs over very short distances, on the
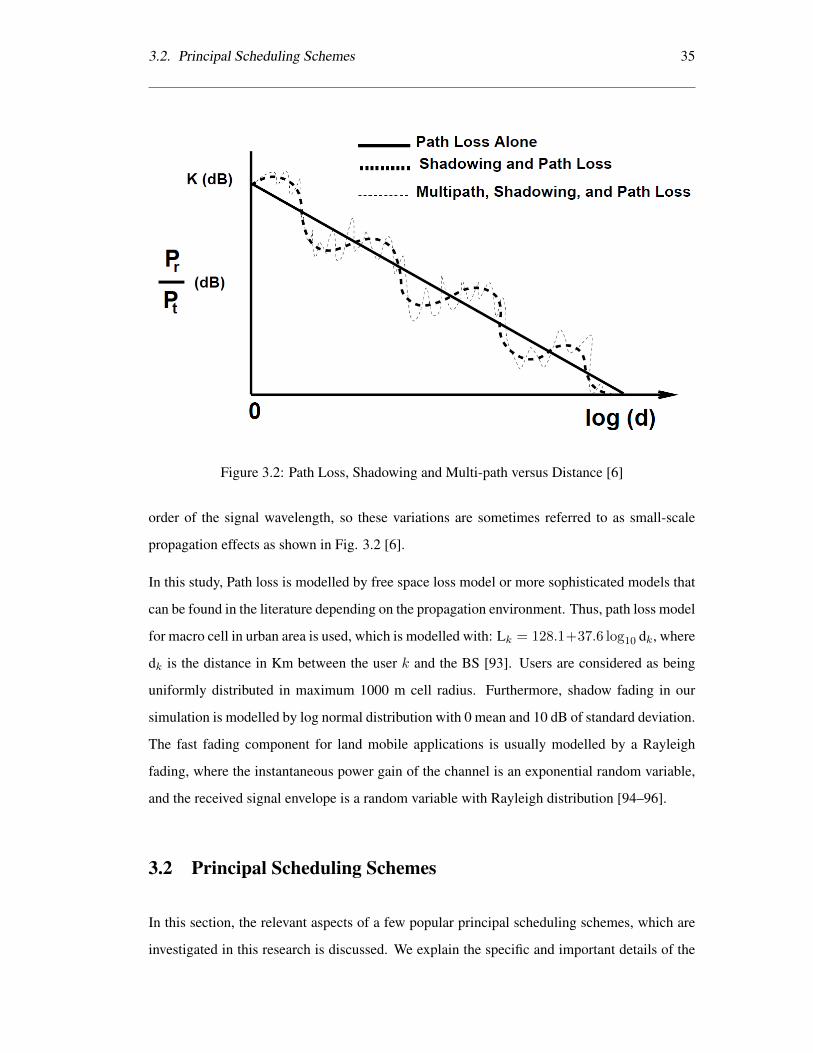
3.2. Principal Scheduling Schemes 35
Figure 3.2: Path Loss, Shadowing and Multi-path versus Distance [6]
order of the signal wavelength, so these variations are sometimes referred to as small-scale
propagation effects as shown in Fig. 3.2 [6].
In this study, Path loss is modelled by free space loss model or more sophisticated models that
can be found in the literature depending on the propagation environment. Thus, path loss model
for macro cell in urban area is used, which is modelled with: Lk = 128.1+37.6 log10 dk, where
dk is the distance in Km between the user k and the BS [93]. Users are considered as being
uniformly distributed in maximum 1000 m cell radius. Furthermore, shadow fading in our
simulation is modelled by log normal distribution with 0 mean and 10 dB of standard deviation.
The fast fading component for land mobile applications is usually modelled by a Rayleigh
fading, where the instantaneous power gain of the channel is an exponential random variable,
and the received signal envelope is a random variable with Rayleigh distribution [94–96].
3.2 Principal Scheduling Schemes
In this section, the relevant aspects of a few popular principal scheduling schemes, which are
investigated in this research is discussed. We explain the specific and important details of the
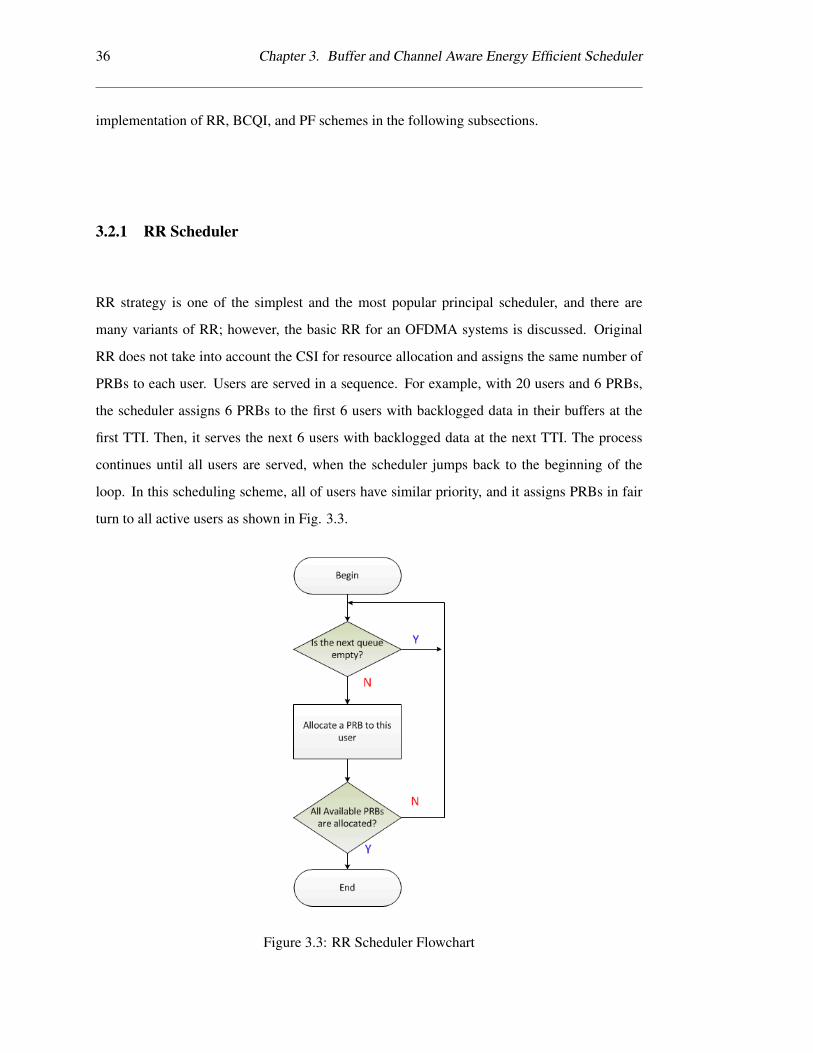
36 Chapter 3. Buffer and Channel Aware Energy Efficient Scheduler
implementation of RR, BCQI, and PF schemes in the following subsections.
3.2.1 RR Scheduler
RR strategy is one of the simplest and the most popular principal scheduler, and there are
many variants of RR; however, the basic RR for an OFDMA systems is discussed. Original
RR does not take into account the CSI for resource allocation and assigns the same number of
PRBs to each user. Users are served in a sequence. For example, with 20 users and 6 PRBs,
the scheduler assigns 6 PRBs to the first 6 users with backlogged data in their buffers at the
first TTI. Then, it serves the next 6 users with backlogged data at the next TTI. The process
continues until all users are served, when the scheduler jumps back to the beginning of the
loop. In this scheduling scheme, all of users have similar priority, and it assigns PRBs in fair
turn to all active users as shown in Fig. 3.3.
Figure 3.3: RR Scheduler Flowchart
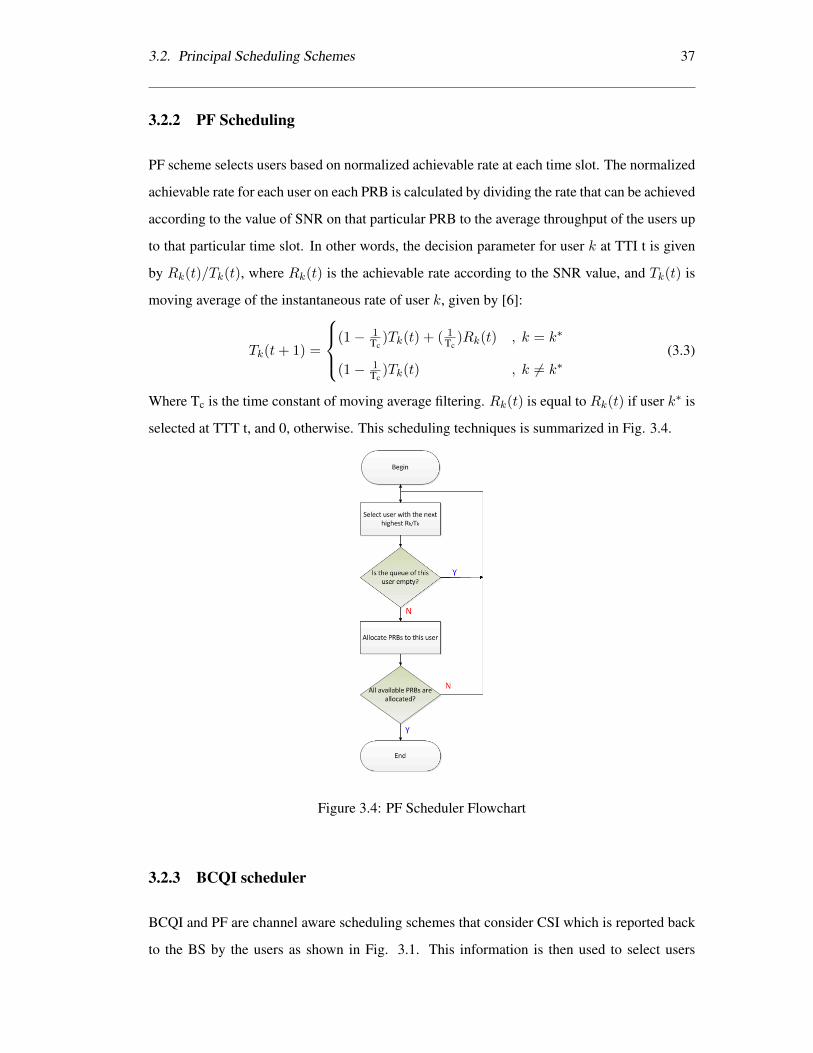
3.2. Principal Scheduling Schemes 37
3.2.2 PF Scheduling
PF scheme selects users based on normalized achievable rate at each time slot. The normalized
achievable rate for each user on each PRB is calculated by dividing the rate that can be achieved
according to the value of SNR on that particular PRB to the average throughput of the users up
to that particular time slot. In other words, the decision parameter for user k at TTI t is given
by Rk(t)/Tk(t), where Rk(t) is the achievable rate according to the SNR value, and Tk(t) is
moving average of the instantaneous rate of user k, given by [6]:
Tk(t+ 1) =
(1− 1
Tc)Tk(t) + ( 1
Tc)Rk(t) , k = k∗
(1− 1Tc
)Tk(t) , k 6= k∗(3.3)
Where Tc is the time constant of moving average filtering. Rk(t) is equal to Rk(t) if user k∗ is
selected at TTT t, and 0, otherwise. This scheduling techniques is summarized in Fig. 3.4.
Figure 3.4: PF Scheduler Flowchart
3.2.3 BCQI scheduler
BCQI and PF are channel aware scheduling schemes that consider CSI which is reported back
to the BS by the users as shown in Fig. 3.1. This information is then used to select users
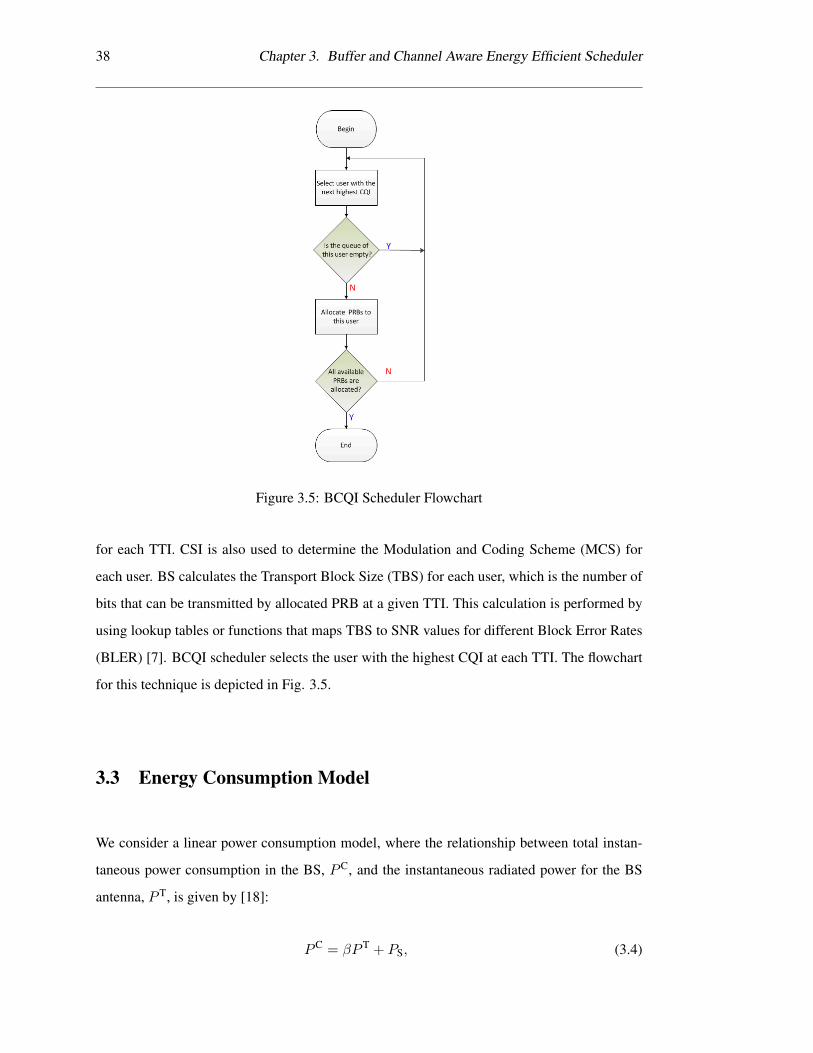
38 Chapter 3. Buffer and Channel Aware Energy Efficient Scheduler
Figure 3.5: BCQI Scheduler Flowchart
for each TTI. CSI is also used to determine the Modulation and Coding Scheme (MCS) for
each user. BS calculates the Transport Block Size (TBS) for each user, which is the number of
bits that can be transmitted by allocated PRB at a given TTI. This calculation is performed by
using lookup tables or functions that maps TBS to SNR values for different Block Error Rates
(BLER) [7]. BCQI scheduler selects the user with the highest CQI at each TTI. The flowchart
for this technique is depicted in Fig. 3.5.
3.3 Energy Consumption Model
We consider a linear power consumption model, where the relationship between total instan-
taneous power consumption in the BS, PC, and the instantaneous radiated power for the BS
antenna, P T, is given by [18]:
PC = βP T + PS, (3.4)
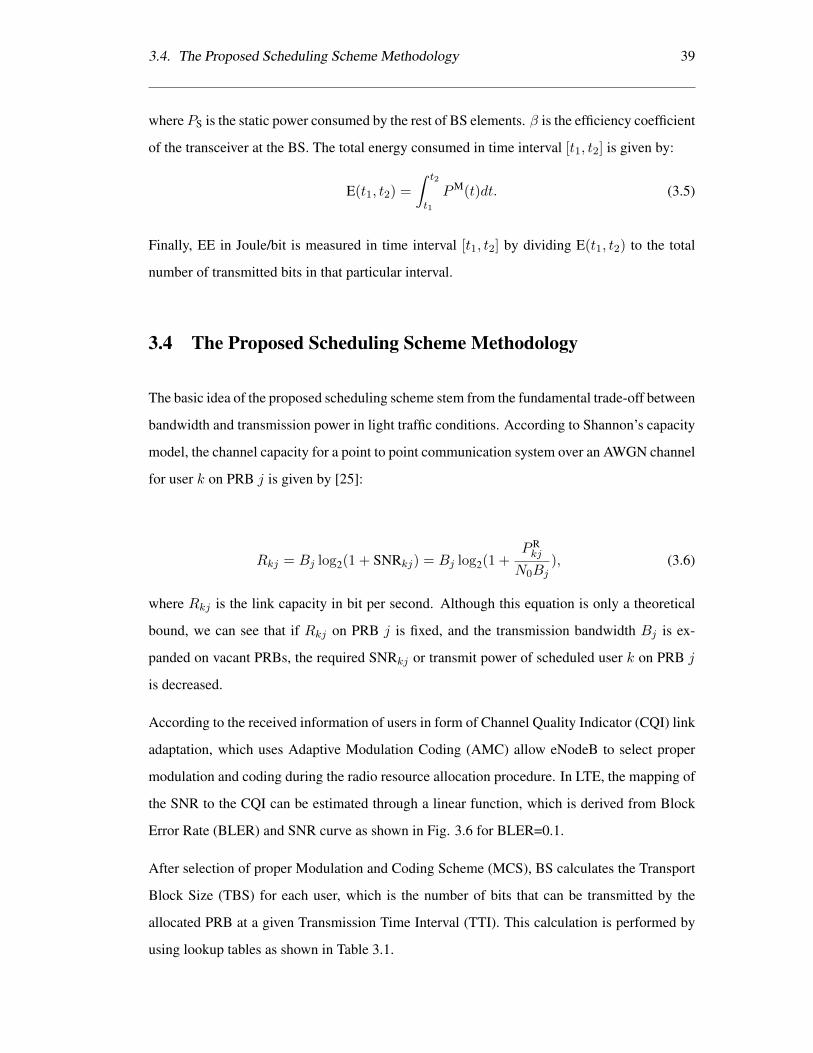
3.4. The Proposed Scheduling Scheme Methodology 39
where PS is the static power consumed by the rest of BS elements. β is the efficiency coefficient
of the transceiver at the BS. The total energy consumed in time interval [t1, t2] is given by:
E(t1, t2) =
∫ t2
t1
PM(t)dt. (3.5)
Finally, EE in Joule/bit is measured in time interval [t1, t2] by dividing E(t1, t2) to the total
number of transmitted bits in that particular interval.
3.4 The Proposed Scheduling Scheme Methodology
The basic idea of the proposed scheduling scheme stem from the fundamental trade-off between
bandwidth and transmission power in light traffic conditions. According to Shannon’s capacity
model, the channel capacity for a point to point communication system over an AWGN channel
for user k on PRB j is given by [25]:
Rkj = Bj log2(1 + SNRkj) = Bj log2(1 +PRkj
N0Bj), (3.6)
where Rkj is the link capacity in bit per second. Although this equation is only a theoretical
bound, we can see that if Rkj on PRB j is fixed, and the transmission bandwidth Bj is ex-
panded on vacant PRBs, the required SNRkj or transmit power of scheduled user k on PRB j
is decreased.
According to the received information of users in form of Channel Quality Indicator (CQI) link
adaptation, which uses Adaptive Modulation Coding (AMC) allow eNodeB to select proper
modulation and coding during the radio resource allocation procedure. In LTE, the mapping of
the SNR to the CQI can be estimated through a linear function, which is derived from Block
Error Rate (BLER) and SNR curve as shown in Fig. 3.6 for BLER=0.1.
After selection of proper Modulation and Coding Scheme (MCS), BS calculates the Transport
Block Size (TBS) for each user, which is the number of bits that can be transmitted by the
allocated PRB at a given Transmission Time Interval (TTI). This calculation is performed by
using lookup tables as shown in Table 3.1.
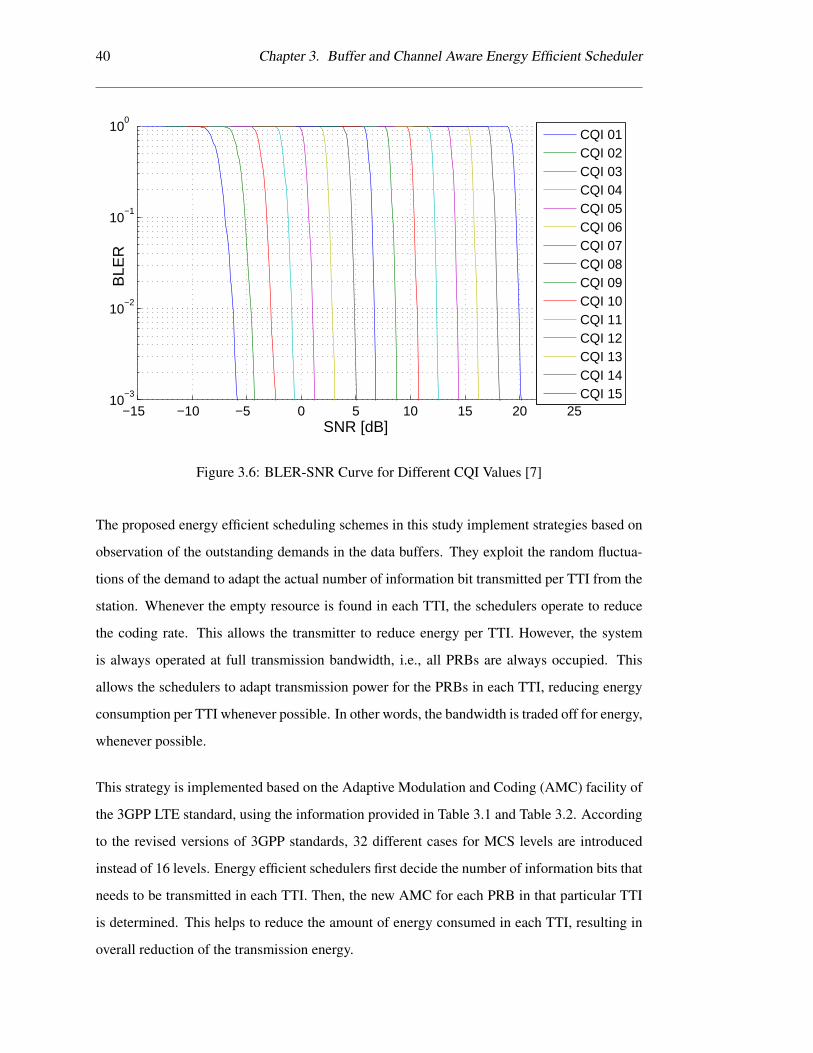
40 Chapter 3. Buffer and Channel Aware Energy Efficient Scheduler
−15 −10 −5 0 5 10 15 20 2510
−3
10−2
10−1
100
BLE
R
SNR [dB]
CQI 01CQI 02CQI 03CQI 04CQI 05CQI 06CQI 07CQI 08CQI 09CQI 10CQI 11CQI 12CQI 13CQI 14CQI 15
Figure 3.6: BLER-SNR Curve for Different CQI Values [7]
The proposed energy efficient scheduling schemes in this study implement strategies based on
observation of the outstanding demands in the data buffers. They exploit the random fluctua-
tions of the demand to adapt the actual number of information bit transmitted per TTI from the
station. Whenever the empty resource is found in each TTI, the schedulers operate to reduce
the coding rate. This allows the transmitter to reduce energy per TTI. However, the system
is always operated at full transmission bandwidth, i.e., all PRBs are always occupied. This
allows the schedulers to adapt transmission power for the PRBs in each TTI, reducing energy
consumption per TTI whenever possible. In other words, the bandwidth is traded off for energy,
whenever possible.
This strategy is implemented based on the Adaptive Modulation and Coding (AMC) facility of
the 3GPP LTE standard, using the information provided in Table 3.1 and Table 3.2. According
to the revised versions of 3GPP standards, 32 different cases for MCS levels are introduced
instead of 16 levels. Energy efficient schedulers first decide the number of information bits that
needs to be transmitted in each TTI. Then, the new AMC for each PRB in that particular TTI
is determined. This helps to reduce the amount of energy consumed in each TTI, resulting in
overall reduction of the transmission energy.
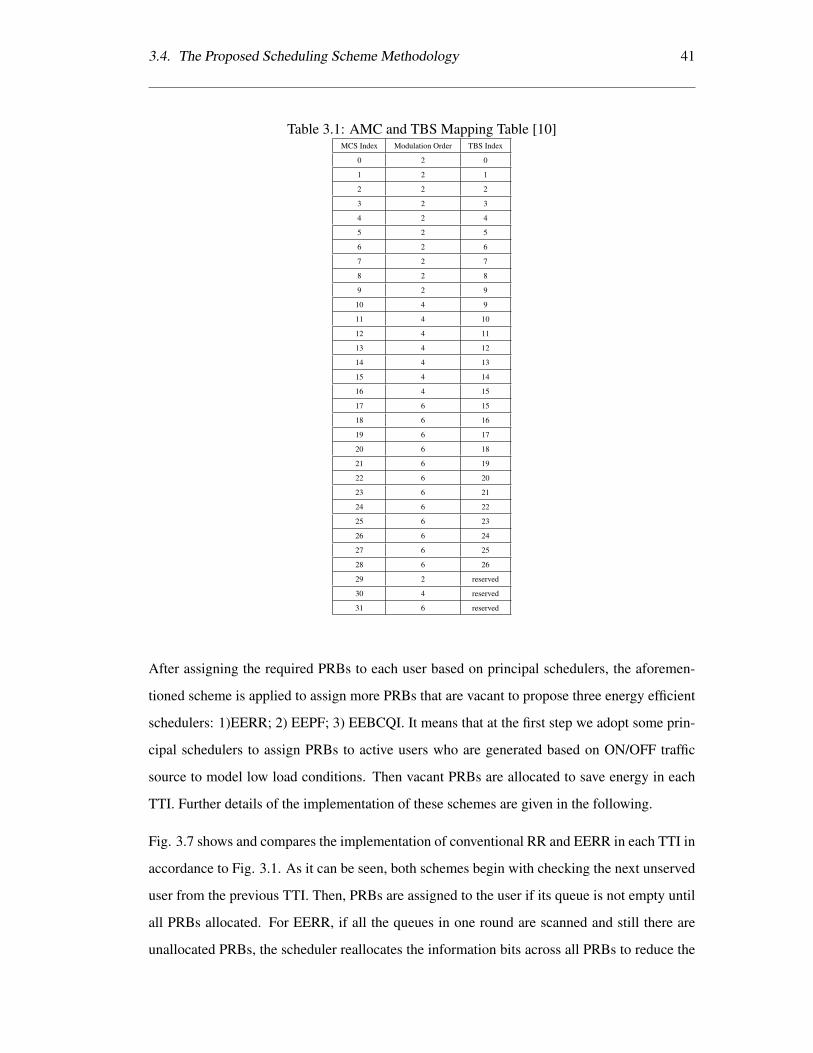
3.4. The Proposed Scheduling Scheme Methodology 41
Table 3.1: AMC and TBS Mapping Table [10]MCS Index Modulation Order TBS Index
0 2 0
1 2 1
2 2 2
3 2 3
4 2 4
5 2 5
6 2 6
7 2 7
8 2 8
9 2 9
10 4 9
11 4 10
12 4 11
13 4 12
14 4 13
15 4 14
16 4 15
17 6 15
18 6 16
19 6 17
20 6 18
21 6 19
22 6 20
23 6 21
24 6 22
25 6 23
26 6 24
27 6 25
28 6 26
29 2 reserved
30 4 reserved
31 6 reserved
After assigning the required PRBs to each user based on principal schedulers, the aforemen-
tioned scheme is applied to assign more PRBs that are vacant to propose three energy efficient
schedulers: 1)EERR; 2) EEPF; 3) EEBCQI. It means that at the first step we adopt some prin-
cipal schedulers to assign PRBs to active users who are generated based on ON/OFF traffic
source to model low load conditions. Then vacant PRBs are allocated to save energy in each
TTI. Further details of the implementation of these schemes are given in the following.
Fig. 3.7 shows and compares the implementation of conventional RR and EERR in each TTI in
accordance to Fig. 3.1. As it can be seen, both schemes begin with checking the next unserved
user from the previous TTI. Then, PRBs are assigned to the user if its queue is not empty until
all PRBs allocated. For EERR, if all the queues in one round are scanned and still there are
unallocated PRBs, the scheduler reallocates the information bits across all PRBs to reduce the
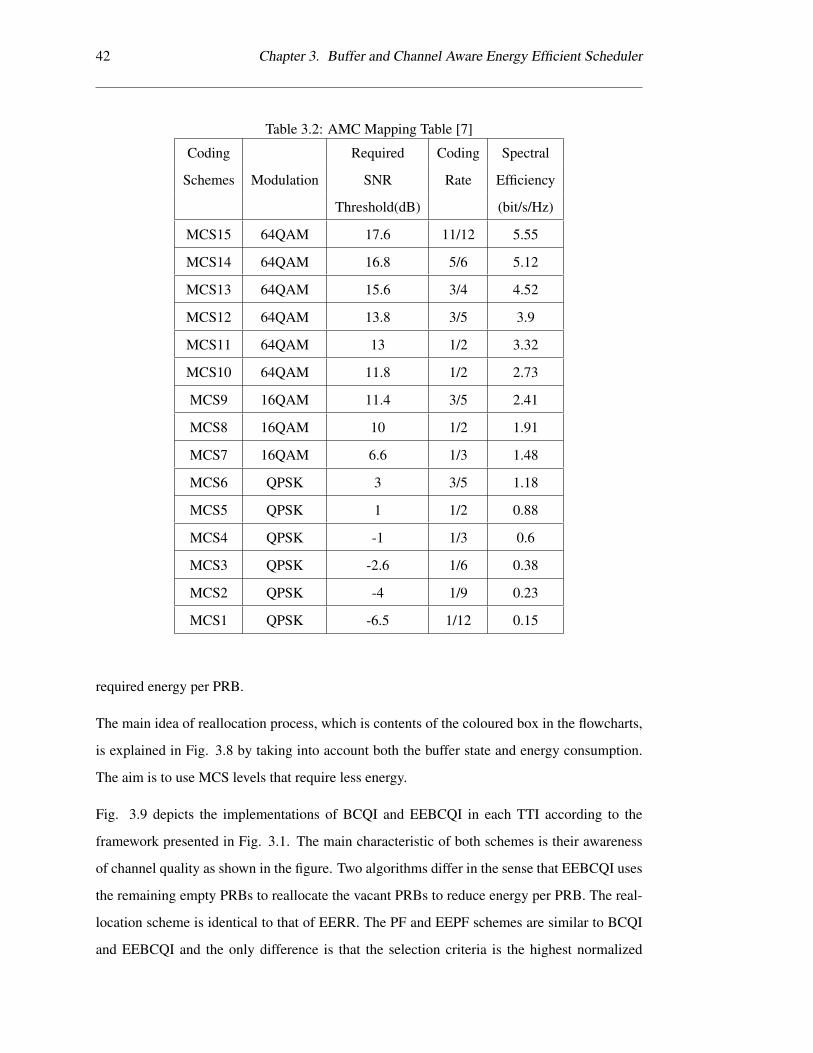
42 Chapter 3. Buffer and Channel Aware Energy Efficient Scheduler
Table 3.2: AMC Mapping Table [7]
Coding Required Coding Spectral
Schemes Modulation SNR Rate Efficiency
Threshold(dB) (bit/s/Hz)
MCS15 64QAM 17.6 11/12 5.55
MCS14 64QAM 16.8 5/6 5.12
MCS13 64QAM 15.6 3/4 4.52
MCS12 64QAM 13.8 3/5 3.9
MCS11 64QAM 13 1/2 3.32
MCS10 64QAM 11.8 1/2 2.73
MCS9 16QAM 11.4 3/5 2.41
MCS8 16QAM 10 1/2 1.91
MCS7 16QAM 6.6 1/3 1.48
MCS6 QPSK 3 3/5 1.18
MCS5 QPSK 1 1/2 0.88
MCS4 QPSK -1 1/3 0.6
MCS3 QPSK -2.6 1/6 0.38
MCS2 QPSK -4 1/9 0.23
MCS1 QPSK -6.5 1/12 0.15
required energy per PRB.
The main idea of reallocation process, which is contents of the coloured box in the flowcharts,
is explained in Fig. 3.8 by taking into account both the buffer state and energy consumption.
The aim is to use MCS levels that require less energy.
Fig. 3.9 depicts the implementations of BCQI and EEBCQI in each TTI according to the
framework presented in Fig. 3.1. The main characteristic of both schemes is their awareness
of channel quality as shown in the figure. Two algorithms differ in the sense that EEBCQI uses
the remaining empty PRBs to reallocate the vacant PRBs to reduce energy per PRB. The real-
location scheme is identical to that of EERR. The PF and EEPF schemes are similar to BCQI
and EEBCQI and the only difference is that the selection criteria is the highest normalized
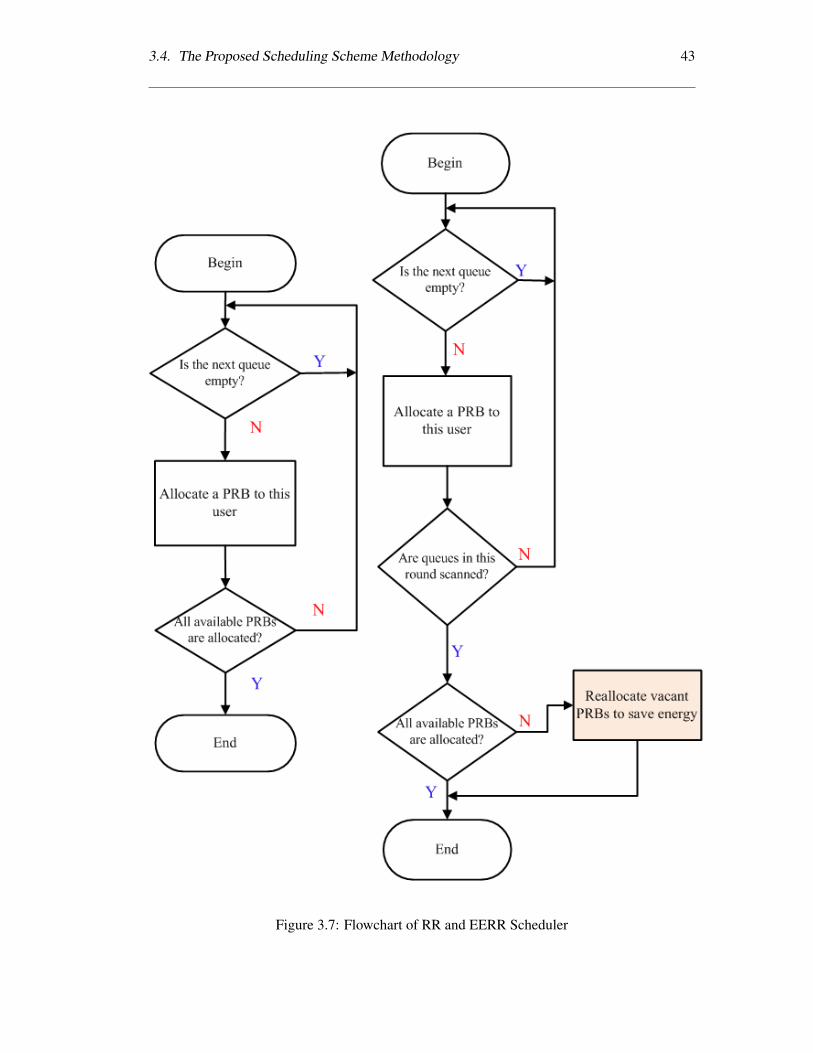
3.4. The Proposed Scheduling Scheme Methodology 43
Figure 3.7: Flowchart of RR and EERR Scheduler
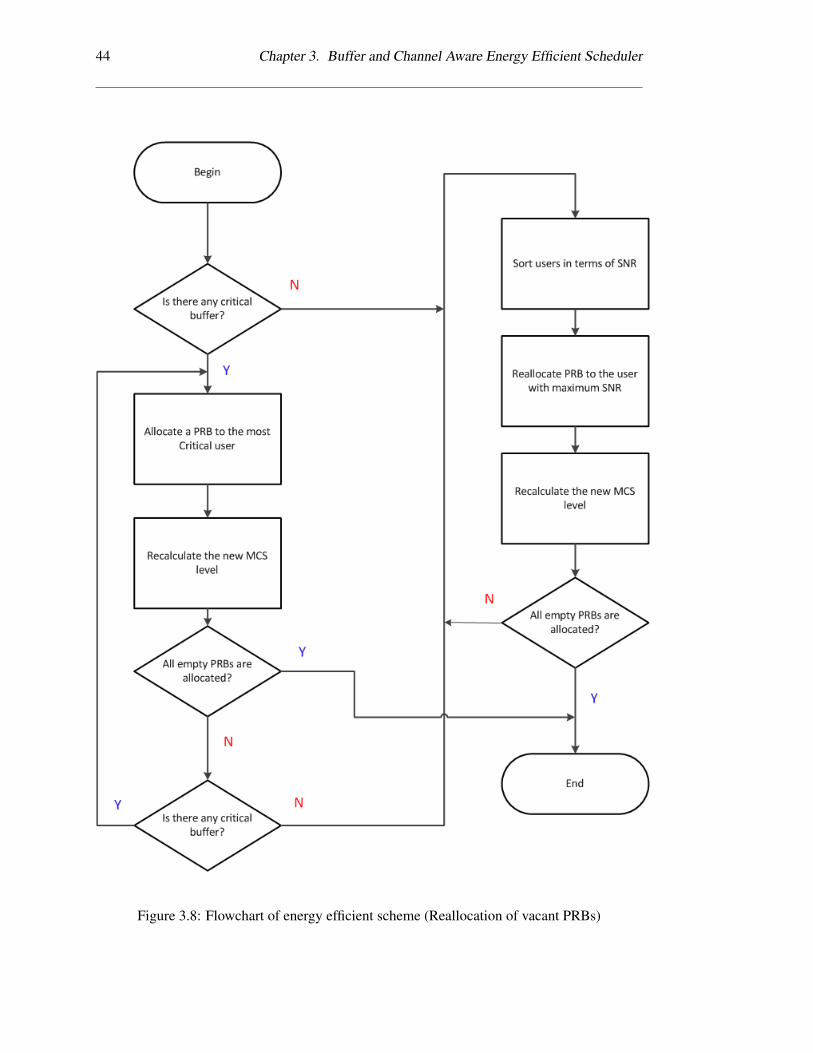
44 Chapter 3. Buffer and Channel Aware Energy Efficient Scheduler
Figure 3.8: Flowchart of energy efficient scheme (Reallocation of vacant PRBs)
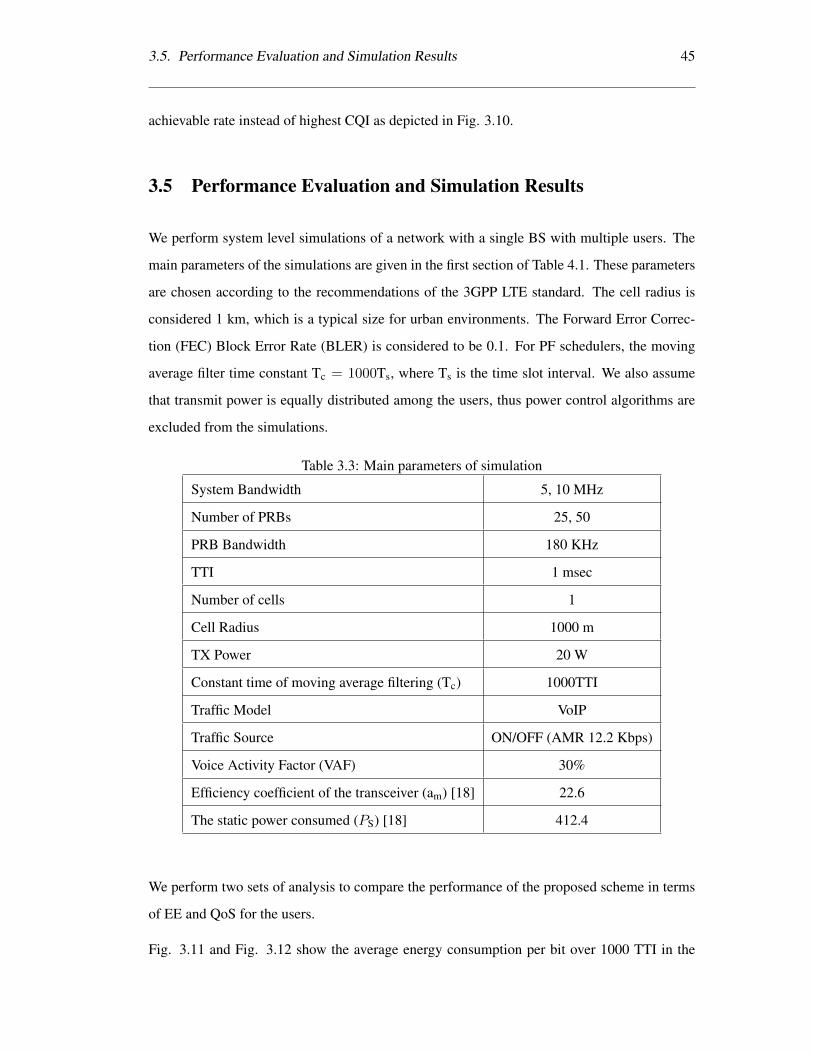
3.5. Performance Evaluation and Simulation Results 45
achievable rate instead of highest CQI as depicted in Fig. 3.10.
3.5 Performance Evaluation and Simulation Results
We perform system level simulations of a network with a single BS with multiple users. The
main parameters of the simulations are given in the first section of Table 4.1. These parameters
are chosen according to the recommendations of the 3GPP LTE standard. The cell radius is
considered 1 km, which is a typical size for urban environments. The Forward Error Correc-
tion (FEC) Block Error Rate (BLER) is considered to be 0.1. For PF schedulers, the moving
average filter time constant Tc = 1000Ts, where Ts is the time slot interval. We also assume
that transmit power is equally distributed among the users, thus power control algorithms are
excluded from the simulations.
Table 3.3: Main parameters of simulation
System Bandwidth 5, 10 MHz
Number of PRBs 25, 50
PRB Bandwidth 180 KHz
TTI 1 msec
Number of cells 1
Cell Radius 1000 m
TX Power 20 W
Constant time of moving average filtering (Tc) 1000TTI
Traffic Model VoIP
Traffic Source ON/OFF (AMR 12.2 Kbps)
Voice Activity Factor (VAF) 30%
Efficiency coefficient of the transceiver (am) [18] 22.6
The static power consumed (PS) [18] 412.4
We perform two sets of analysis to compare the performance of the proposed scheme in terms
of EE and QoS for the users.
Fig. 3.11 and Fig. 3.12 show the average energy consumption per bit over 1000 TTI in the
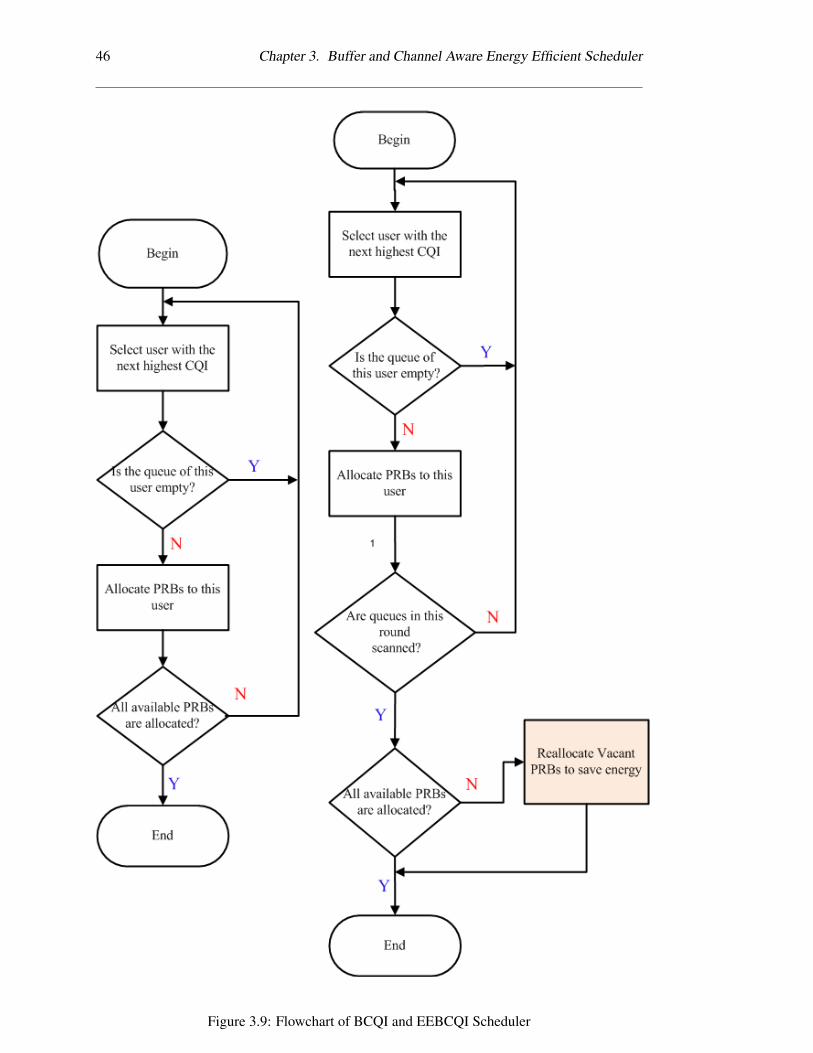
46 Chapter 3. Buffer and Channel Aware Energy Efficient Scheduler
Figure 3.9: Flowchart of BCQI and EEBCQI Scheduler
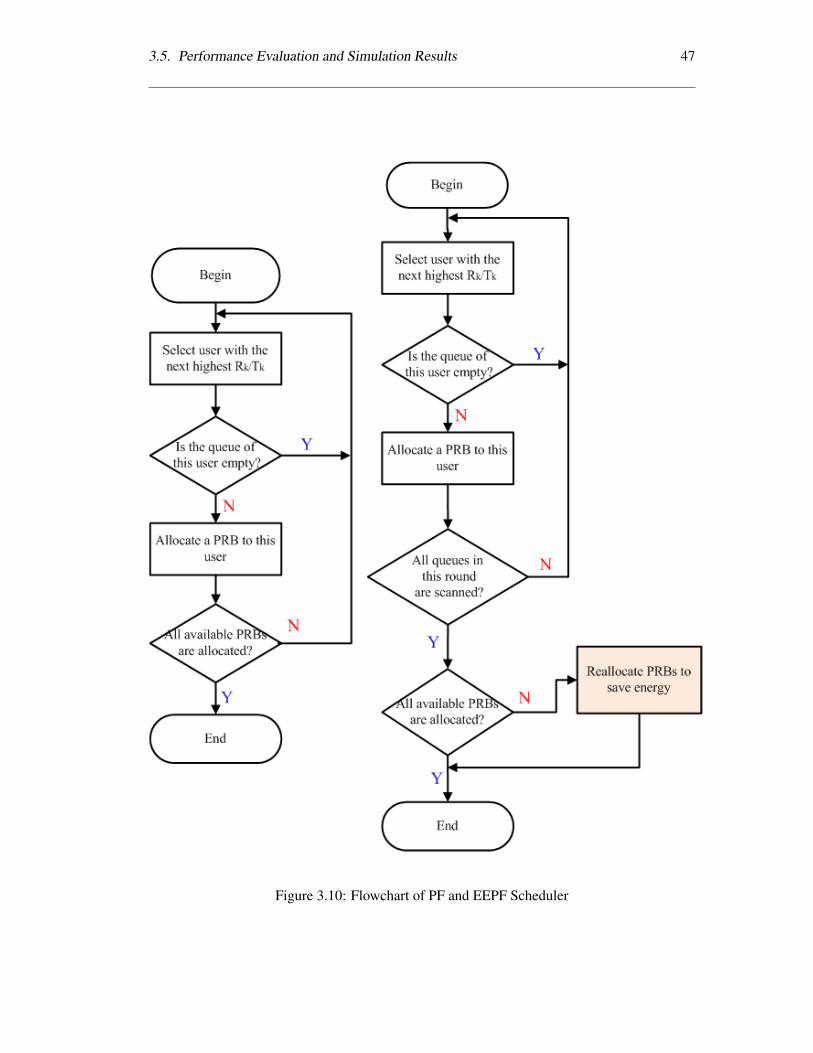
3.5. Performance Evaluation and Simulation Results 47
Figure 3.10: Flowchart of PF and EEPF Scheduler
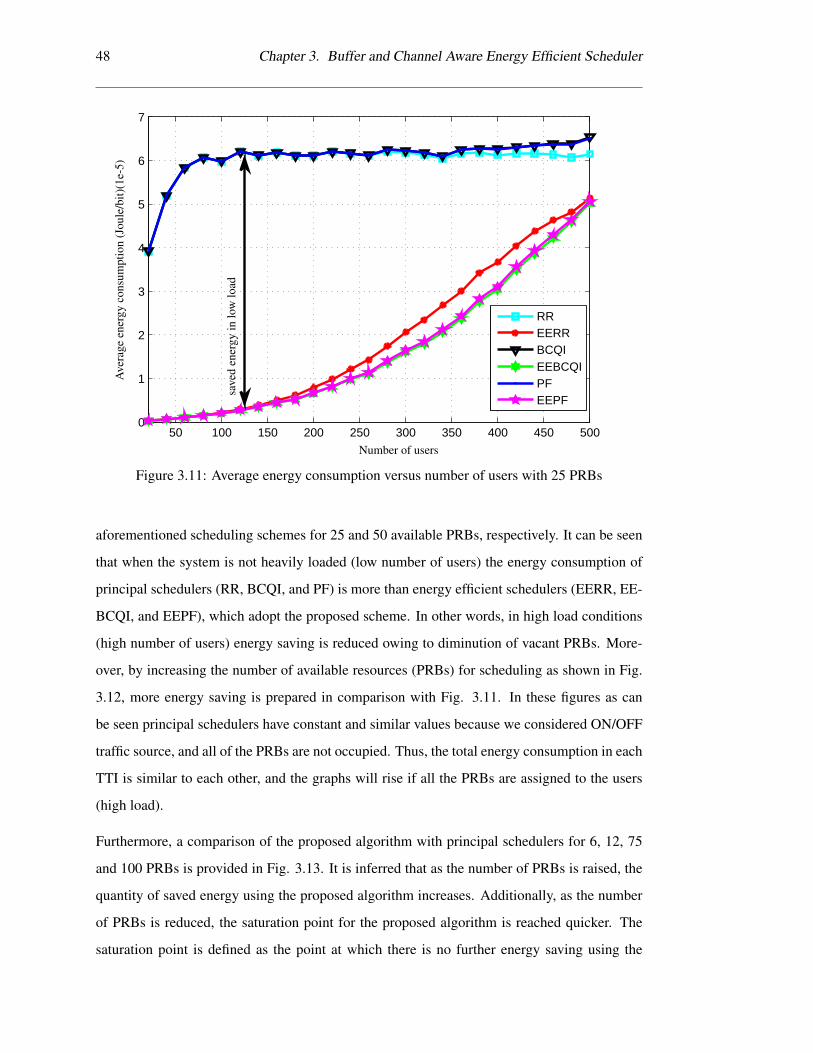
48 Chapter 3. Buffer and Channel Aware Energy Efficient Scheduler
50 100 150 200 250 300 350 400 450 5000
1
2
3
4
5
6
7
RREERRBCQIEEBCQIPFEEPF
save
den
ergy
inlo
wlo
ad
Number of users
Ave
rage
ener
gyco
nsum
ptio
n(J
oule
/bit)
(1e-
5)
Figure 3.11: Average energy consumption versus number of users with 25 PRBs
aforementioned scheduling schemes for 25 and 50 available PRBs, respectively. It can be seen
that when the system is not heavily loaded (low number of users) the energy consumption of
principal schedulers (RR, BCQI, and PF) is more than energy efficient schedulers (EERR, EE-
BCQI, and EEPF), which adopt the proposed scheme. In other words, in high load conditions
(high number of users) energy saving is reduced owing to diminution of vacant PRBs. More-
over, by increasing the number of available resources (PRBs) for scheduling as shown in Fig.
3.12, more energy saving is prepared in comparison with Fig. 3.11. In these figures as can
be seen principal schedulers have constant and similar values because we considered ON/OFF
traffic source, and all of the PRBs are not occupied. Thus, the total energy consumption in each
TTI is similar to each other, and the graphs will rise if all the PRBs are assigned to the users
(high load).
Furthermore, a comparison of the proposed algorithm with principal schedulers for 6, 12, 75
and 100 PRBs is provided in Fig. 3.13. It is inferred that as the number of PRBs is raised, the
quantity of saved energy using the proposed algorithm increases. Additionally, as the number
of PRBs is reduced, the saturation point for the proposed algorithm is reached quicker. The
saturation point is defined as the point at which there is no further energy saving using the
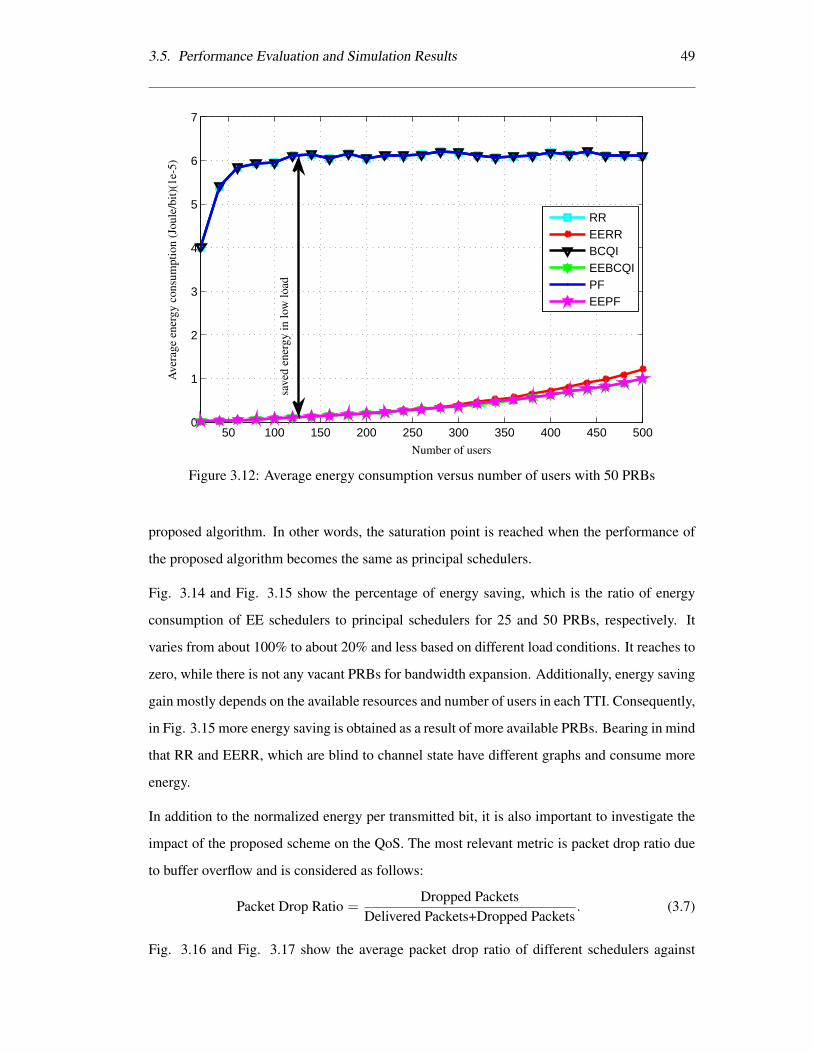
3.5. Performance Evaluation and Simulation Results 49
50 100 150 200 250 300 350 400 450 5000
1
2
3
4
5
6
7
RREERRBCQIEEBCQIPFEEPF
save
den
ergy
inlo
wlo
ad
Number of users
Ave
rage
ener
gyco
nsum
ptio
n(J
oule
/bit)
(1e-
5)
Figure 3.12: Average energy consumption versus number of users with 50 PRBs
proposed algorithm. In other words, the saturation point is reached when the performance of
the proposed algorithm becomes the same as principal schedulers.
Fig. 3.14 and Fig. 3.15 show the percentage of energy saving, which is the ratio of energy
consumption of EE schedulers to principal schedulers for 25 and 50 PRBs, respectively. It
varies from about 100% to about 20% and less based on different load conditions. It reaches to
zero, while there is not any vacant PRBs for bandwidth expansion. Additionally, energy saving
gain mostly depends on the available resources and number of users in each TTI. Consequently,
in Fig. 3.15 more energy saving is obtained as a result of more available PRBs. Bearing in mind
that RR and EERR, which are blind to channel state have different graphs and consume more
energy.
In addition to the normalized energy per transmitted bit, it is also important to investigate the
impact of the proposed scheme on the QoS. The most relevant metric is packet drop ratio due
to buffer overflow and is considered as follows:
Packet Drop Ratio =Dropped Packets
Delivered Packets+Dropped Packets. (3.7)
Fig. 3.16 and Fig. 3.17 show the average packet drop ratio of different schedulers against
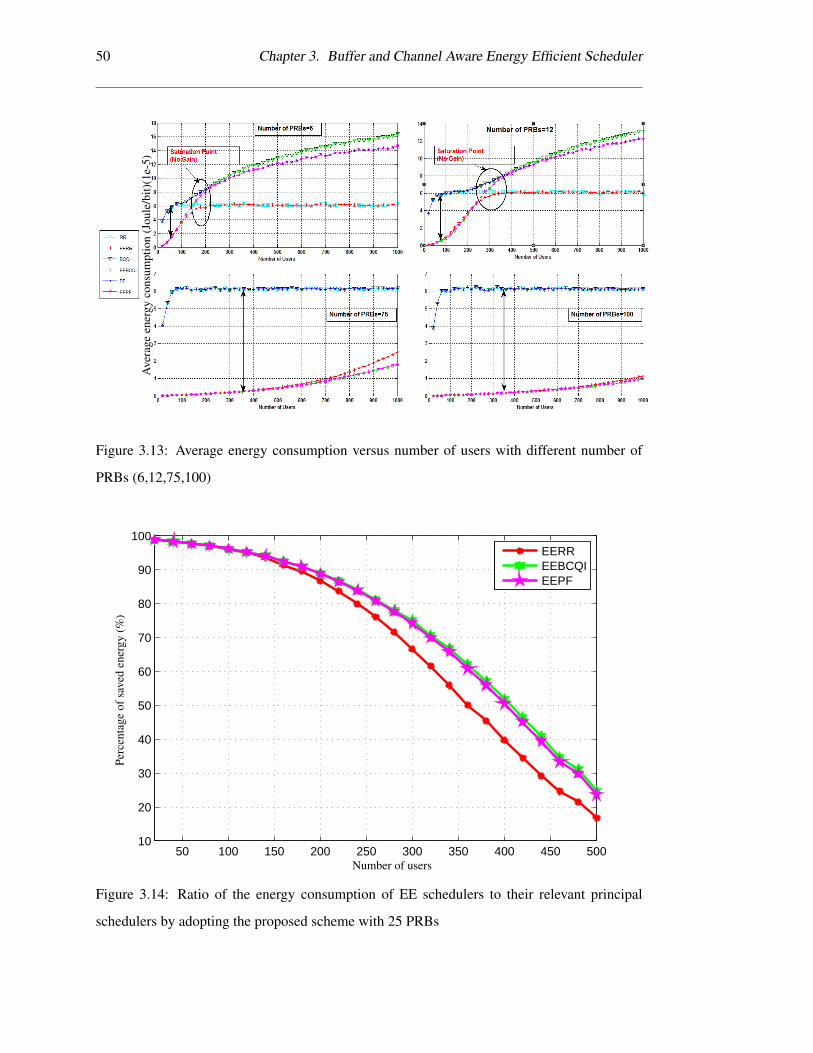
50 Chapter 3. Buffer and Channel Aware Energy Efficient Scheduler
Ave
rage
ener
gyco
nsum
ptio
n(J
oule
/bit)
(1e-
5)
Figure 3.13: Average energy consumption versus number of users with different number of
PRBs (6,12,75,100)
50 100 150 200 250 300 350 400 450 50010
20
30
40
50
60
70
80
90
100
EERREEBCQIEEPF
Number of users
Perc
enta
geof
save
den
ergy
(%)
Figure 3.14: Ratio of the energy consumption of EE schedulers to their relevant principal
schedulers by adopting the proposed scheme with 25 PRBs
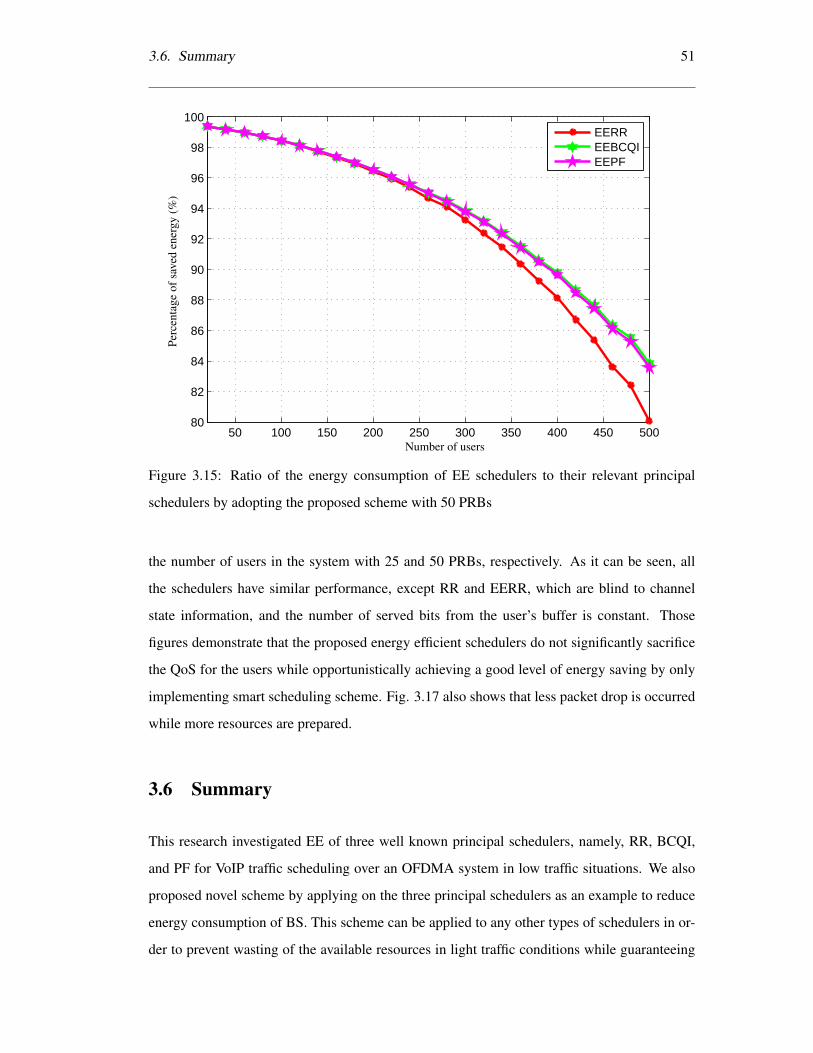
3.6. Summary 51
50 100 150 200 250 300 350 400 450 50080
82
84
86
88
90
92
94
96
98
100
EERREEBCQIEEPF
Number of users
Perc
enta
geof
save
den
ergy
(%)
Figure 3.15: Ratio of the energy consumption of EE schedulers to their relevant principal
schedulers by adopting the proposed scheme with 50 PRBs
the number of users in the system with 25 and 50 PRBs, respectively. As it can be seen, all
the schedulers have similar performance, except RR and EERR, which are blind to channel
state information, and the number of served bits from the user’s buffer is constant. Those
figures demonstrate that the proposed energy efficient schedulers do not significantly sacrifice
the QoS for the users while opportunistically achieving a good level of energy saving by only
implementing smart scheduling scheme. Fig. 3.17 also shows that less packet drop is occurred
while more resources are prepared.
3.6 Summary
This research investigated EE of three well known principal schedulers, namely, RR, BCQI,
and PF for VoIP traffic scheduling over an OFDMA system in low traffic situations. We also
proposed novel scheme by applying on the three principal schedulers as an example to reduce
energy consumption of BS. This scheme can be applied to any other types of schedulers in or-
der to prevent wasting of the available resources in light traffic conditions while guaranteeing
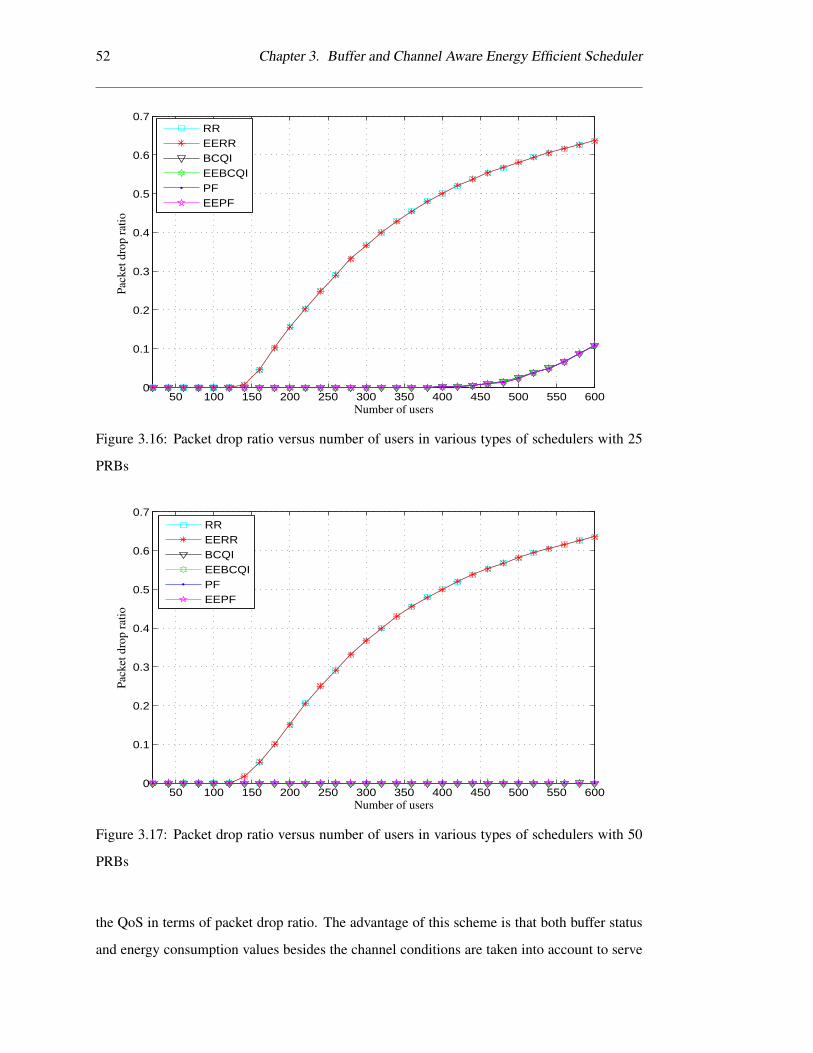
52 Chapter 3. Buffer and Channel Aware Energy Efficient Scheduler
50 100 150 200 250 300 350 400 450 500 550 6000
0.1
0.2
0.3
0.4
0.5
0.6
0.7
RREERRBCQIEEBCQIPFEEPF
Number of users
Pack
etdr
opra
tio
Figure 3.16: Packet drop ratio versus number of users in various types of schedulers with 25
PRBs
50 100 150 200 250 300 350 400 450 500 550 6000
0.1
0.2
0.3
0.4
0.5
0.6
0.7
RREERRBCQIEEBCQIPFEEPF
Number of users
Pack
etdr
opra
tio
Figure 3.17: Packet drop ratio versus number of users in various types of schedulers with 50
PRBs
the QoS in terms of packet drop ratio. The advantage of this scheme is that both buffer status
and energy consumption values besides the channel conditions are taken into account to serve
3.6. Summary 53
the empty resources in each TTI. According to the aforementioned results, by implementation
of the proposed scheme in the principal schedulers, and introducing the relevant energy effi-
cient schedulers (EERR, EEBCQI, EEPF), significant energy saving and superior performance
during low traffic situations are achieved.
Chapter 4
A Novel Energy Efficient and QoS
Aware Resource Block Allocation in
OFDMA Systems in Single-Cell
Scenario
The proposed scheme has been studied through a simulation in system level with three sched-
ulers. The results of the simulation have also been discussed in that chapter. In this chapter,
however, an analytical model for the proposed scheme to find an optimal solution is formu-
lated. To this end, this chapter is a complementary study for the proposed scheme considering
the mathematical optimisation problem into account. In addition, a heuristic algorithm for as-
signing the surplus radio resources in OFDMA systems in single-scenario is proposed. In low
traffic situations in wireless networks as demonstrated in Fig. 1.6, once radio resources are al-
located by schedulers, some radio resources remain free. This algorithm trades off bandwidth
for EE while lowering the transmitted power from the BS. In other words, the spare bandwidth
at each time slot is deployed for transmitting the scheduled traffic over an expanded bandwidth,
while the overall data rate remains constant. A heuristic algorithm is suggested to find the opti-
mum values for bandwidth expansion of the scheduled users in each time slot. The performance
of the proposed algorithm compared with that of an exhaustive search algorithm shows that the
54
4.1. System Model 55
proposed algorithm finds near optimal values while benefiting from low complexity.
In [97], the idea of the proposed algorithm is generally discussed as a patent and in [98], the
performance of energy efficient schedulers, which adopt the proposed algorithm, is compared
with some classic schedulers. In addition, the RRA problem is modeled as an integer program-
ming (IP), and the optimal solution using the classic knapsack problem (KP) [76] is proposed.
Then, the solution of classic knapsack problem is modified, and a low-complexity and near
optimal heuristic solution is suggested. Furthermore, in order to evaluate the optimality of
the proposed heuristic solution, an exhaustive-search based technique is implemented for a
number of representative scenarios to obtain the optimal RRA solutions. Comparison of the
results demonstrates that the proposed heuristic scheme achieves near optimal solution with a
low computational complexity. Comprehensive performance analysis of the proposed scheme
is provided by both simulations and analytical results. It is demonstrated that the proposed
scheme outperforms the existing classic benchmark schemes in terms of EE and QoS provi-
sion, especially in terms of packet dropping ratio.
4.1 System Model
The system model consists of a single BS that serves multiple mobile stations (MS) in downlink
of 3GPP LTE as depicted in Fig. 4.1, which is a prime practical example of OFDMA systems.
In the last chapter, the proposed scheme has been studied through a simulation in system level
with three schedulers. In this chapter, however, we formulate an analytical model for the
proposed scheme to find an optimal solution.
In the following sections, firstly, the principle of bandwidth-EE trade-off is discussed. Next,
energy consumption rate which is one of the major EE metrics, is introduced. Then, the op-
timisation problem is defined and the proposed algorithm for finding the optimum solution
of bandwidth expansion coefficient by adopting the knapsack problem is suggested. Finally,
complexity analysis of the proposed algorithm is investigated.
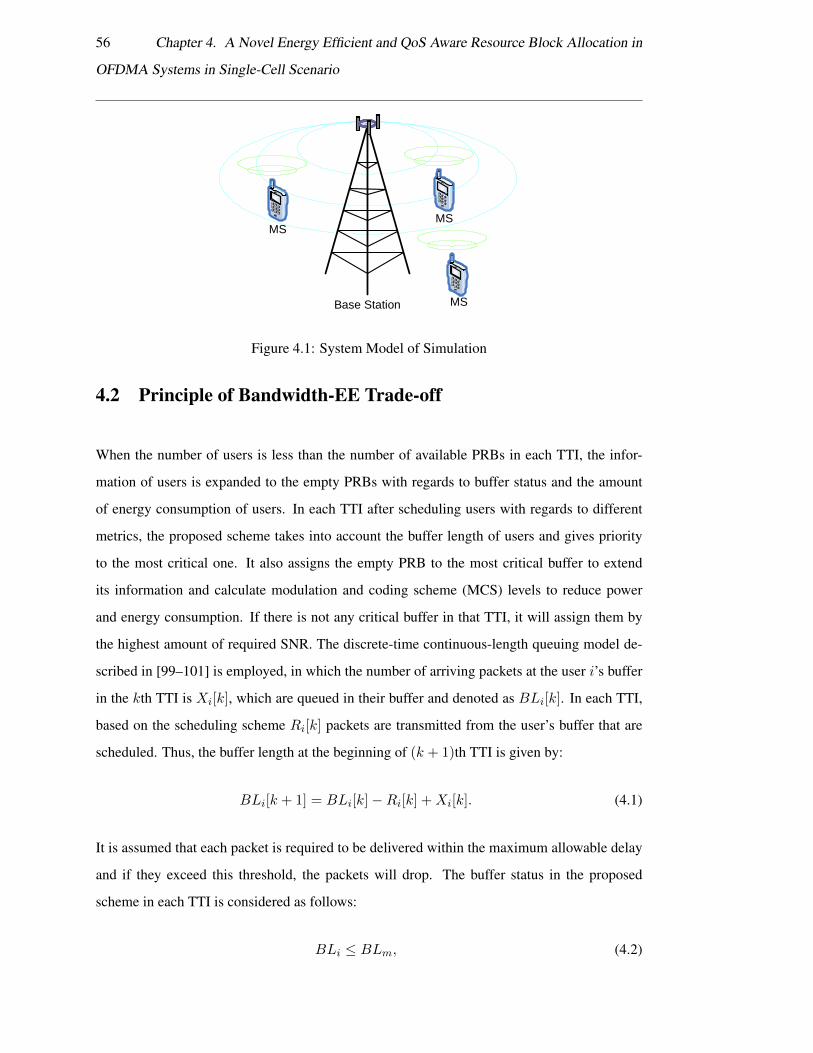
56 Chapter 4. A Novel Energy Efficient and QoS Aware Resource Block Allocation in
OFDMA Systems in Single-Cell Scenario
Base Station
MSMS
MS
Figure 4.1: System Model of Simulation
4.2 Principle of Bandwidth-EE Trade-off
When the number of users is less than the number of available PRBs in each TTI, the infor-
mation of users is expanded to the empty PRBs with regards to buffer status and the amount
of energy consumption of users. In each TTI after scheduling users with regards to different
metrics, the proposed scheme takes into account the buffer length of users and gives priority
to the most critical one. It also assigns the empty PRB to the most critical buffer to extend
its information and calculate modulation and coding scheme (MCS) levels to reduce power
and energy consumption. If there is not any critical buffer in that TTI, it will assign them by
the highest amount of required SNR. The discrete-time continuous-length queuing model de-
scribed in [99–101] is employed, in which the number of arriving packets at the user i’s buffer
in the kth TTI is Xi[k], which are queued in their buffer and denoted as BLi[k]. In each TTI,
based on the scheduling scheme Ri[k] packets are transmitted from the user’s buffer that are
scheduled. Thus, the buffer length at the beginning of (k + 1)th TTI is given by:
BLi[k + 1] = BLi[k]−Ri[k] +Xi[k]. (4.1)
It is assumed that each packet is required to be delivered within the maximum allowable delay
and if they exceed this threshold, the packets will drop. The buffer status in the proposed
scheme in each TTI is considered as follows:
BLi ≤ BLm, (4.2)
4.3. EE Metric in Schedulers 57
where BLi and BLm are the buffer length of user i and maximum allowable buffer length,
respectively. The arriving packets of the users will drop if the users’ buffer length exceeds the
predefined maximum allowable buffer length.
4.3 EE Metric in Schedulers
In this section, a brief overview of a major EE metric is provided, which is defined as energy
consumption rate (ECR) or energy per bit. It can be derived from the ratio of the average
network power to the average data rate, and can be formulated by the following:
EC =P
R(Joule/bit). (4.3)
An OFDMA transmission in a single cell is considered with a set of J={1, . . . , M} PRBs and
a set of U={1, . . . , n} users for single input single output (SISO), and the power is distributed
equally among PRBs. The ECR is calculated in two cases for classic schedulers and energy
efficient schedulers, which are given in the next subsections.
4.3.1 Energy consumption rate before bandwidth expansion
According to Shannon’s capacity model for a point to point communication system over an
additive white Gaussian noise (AWGN) channel between a transmitter and a receiver, the ideal
achievable rate for user i on PRB j in kth TTI is given by:
Rij [k] = Bj log2(1 + γij [k]) = Bj log2
(1 +
PRij [k]
N0Bj
), (4.4)
PRij[k] = P Tij [k]Gij [k], Gij [k] = Glij [k]Fij [k], (4.5)
where Rij [k] is the link capacity in bits per second; Bj is the channel bandwidth in Hertz;
γij [k] is the signal to noise power ratio at the input of the detector at the receiver side; PRij [k]
is the power of the received signal and N0 is the noise spectral density. Gij [k], Glij [k], and
Fij [k] are the channel gain, the free space loss, and fading components of user i on PRB j,
respectively. For the sake of simplicity of expressions, the effects of fading and index k are
ignored. Hence, the following expression is obtained:
Gij = Glij =GrGtλ
2
(4π)2dzijL, (4.6)
58 Chapter 4. A Novel Energy Efficient and QoS Aware Resource Block Allocation in
OFDMA Systems in Single-Cell Scenario
where Gr, Gt, λ, dij , z, and L are the transmitter and receiver gain, wavelength, distance of
user i from BS, path loss exponent, and system loss unrelated to propagation, respectively. The
following formula can also be obtained from (4.4):
P Tij = N0Bj
(2R
Bij − 1
Gij
), RBij =
RijBj
, (4.7)
where RBij is defined as the ratio of Rij to Bj in order to simplify the equations. According to
(4.3), ECij , which is the overall energy consumption rate of user i on PRB j is given by:
ECij =PCijRij
, (4.8)
where PCij is the total power consumption of the BS. A linear power consumption model is
considered, where the relationship between PCij and the radiated power for the BS antenna,
P Tij , is given by:
PCij = βP Tij + PS , (4.9)
where PS is the static power consumed by the rest of BS elements and β is the efficiency
coefficient of the transceiver at the BS. By substituting (4.7) and (4.9) in (4.8) the following
expression is derived:
ECij =βP Tij + PS
Rij=
βN0Bj
(2RBij−1Gij
)+ PS
Rij,
=βN0
(2R
Bij − 1
)RBijGij
+PSRij
. (4.10)
In (4.10), there are two components, which model the effects of energy consumption of trans-
mitting and circuit parts of BS, respectively. The transmitting part is dependent on data rate
and bandwidth, while the circuit part is simply relevant to data rate. According to (4.6), Gij is
a function of the distance between user i and the BS in the cell. So, (4.10) shows that overall
energy consumption is a function of data rate, distance of users from a BS, and available band-
width. The aforementioned formulae are for user i over PRB j. Moreover, (4.10) is modified
for users that are scheduled based on classic schedulers schemes in each TTI for the available
4.3. EE Metric in Schedulers 59
PRBs. Thus, the radio resource allocation indicator is defined as follows:
Cij =
1, user i is assigned to PRB j,
0, otherwise,
N∑i=1
Cij ≤ 1,∀j ∈ J. (4.11)
In OFDMA systems, ECR for the scheduled users in kth TTI can be accumulated in the fol-
lowing form:
EC =
PS + βN∑i=1
M∑j=1
P TijCij
N∑i=1
M∑j=1
RijCij
, (4.12)
where N is the number of active users which has been generated based on the voice activity
factor (VAF) to model the light traffic situation for investigating the EE. It must be noted that
average values of ECR are calculated based on averaging over all TTIs.
4.3.2 Energy Consumption Rate after Bandwidth Expansion
The basic idea of the energy efficient scheduling scheme stems from the fundamental trade-off
between bandwidth and transmission power. According to (4.4), although this equation is only
a theoretical bound, we can see that if Rij is kept constant and the transmission bandwidth
is increased, the required SNR or transmitted power can be decreased to preserve transmitted
energy based on calculation of new MCS level. In other words, the lower MCS level through
bandwidth expansion the lower the received SNR. Therefore, the data rate is maintained, while
the bandwidth is expanded with the coefficient of αi, so that the relevant equations for energy
efficient scheme can be derived similar to (4.10) as follows:
ECij =βN0
(2R
Bij − 1
)RBijGij
+PSRij
, (4.13)
RBij =Rij
Bi, Rij = Rij , Bi = αiBi. (4.14)
According to (4.12), the overall energy consumption rate for an energy efficient scheme in
60 Chapter 4. A Novel Energy Efficient and QoS Aware Resource Block Allocation in
OFDMA Systems in Single-Cell Scenario
each TTI is given by:
EC =
PS + βN∑i=1
M∑j=1
P TijCij
N∑i=1
M∑j=1
RijCij
. (4.15)
According to the aforementioned equations, the required SNR of the scheduled user i in each
TTI after bandwidth expansion is derived as follows:
Ri = Ri,
B log2(1 + γi) = B log2(1 + γi), B = αiB (4.16)
γi =(αi√
1 + γi − 1),
where γi and γi are the required SNR of user i related to MCS level index after and before
bandwidth expansion, respectively.
Subsequently, the transmitted power ratio of scheduled user i in each TTI is given as follows:
P TiP Ti
=αi(αi√
1 + γi − 1)
γi, (4.17)
where P Ti and P Ti are transmitted power after and before bandwidth expansion, respectively.
For instance, in equal distribution of power among users, P Ti for each user is obtained from
division of total power to the number of scheduled users. Therefore, the total transmit power
after bandwidth expansion in each TTI over all PRBs is given by:
P T =
N∑i=1
P Ti . (4.18)
According to (4.9), power consumption after expansion in each TTI is given as follows:
PC = βP T + PS . (4.19)
4.4 Optimisation Problem
So far, the bandwidth expansion coefficient (αi) for user i has been introduced as showing the
number of assigned PRBs to each user in each TTI. The goal here is to find the optimal value
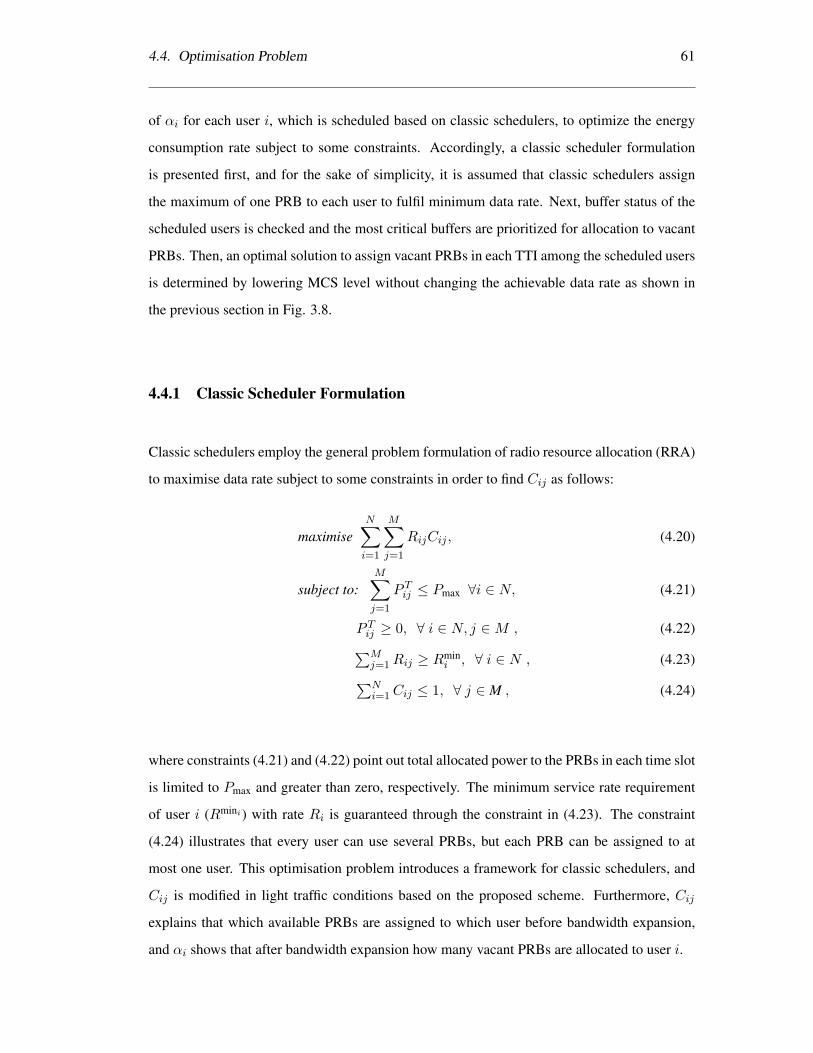
4.4. Optimisation Problem 61
of αi for each user i, which is scheduled based on classic schedulers, to optimize the energy
consumption rate subject to some constraints. Accordingly, a classic scheduler formulation
is presented first, and for the sake of simplicity, it is assumed that classic schedulers assign
the maximum of one PRB to each user to fulfil minimum data rate. Next, buffer status of the
scheduled users is checked and the most critical buffers are prioritized for allocation to vacant
PRBs. Then, an optimal solution to assign vacant PRBs in each TTI among the scheduled users
is determined by lowering MCS level without changing the achievable data rate as shown in
the previous section in Fig. 3.8.
4.4.1 Classic Scheduler Formulation
Classic schedulers employ the general problem formulation of radio resource allocation (RRA)
to maximise data rate subject to some constraints in order to find Cij as follows:
maximiseN∑i=1
M∑j=1
RijCij , (4.20)
subject to:M∑j=1
P Tij ≤ Pmax ∀i ∈ N, (4.21)
P Tij ≥ 0, ∀ i ∈ N, j ∈M , (4.22)∑Mj=1Rij ≥ Rmin
i , ∀ i ∈ N , (4.23)∑Ni=1Cij ≤ 1, ∀ j ∈ M , (4.24)
where constraints (4.21) and (4.22) point out total allocated power to the PRBs in each time slot
is limited to Pmax and greater than zero, respectively. The minimum service rate requirement
of user i (Rmini) with rate Ri is guaranteed through the constraint in (4.23). The constraint
(4.24) illustrates that every user can use several PRBs, but each PRB can be assigned to at
most one user. This optimisation problem introduces a framework for classic schedulers, and
Cij is modified in light traffic conditions based on the proposed scheme. Furthermore, Cij
explains that which available PRBs are assigned to which user before bandwidth expansion,
and αi shows that after bandwidth expansion how many vacant PRBs are allocated to user i.
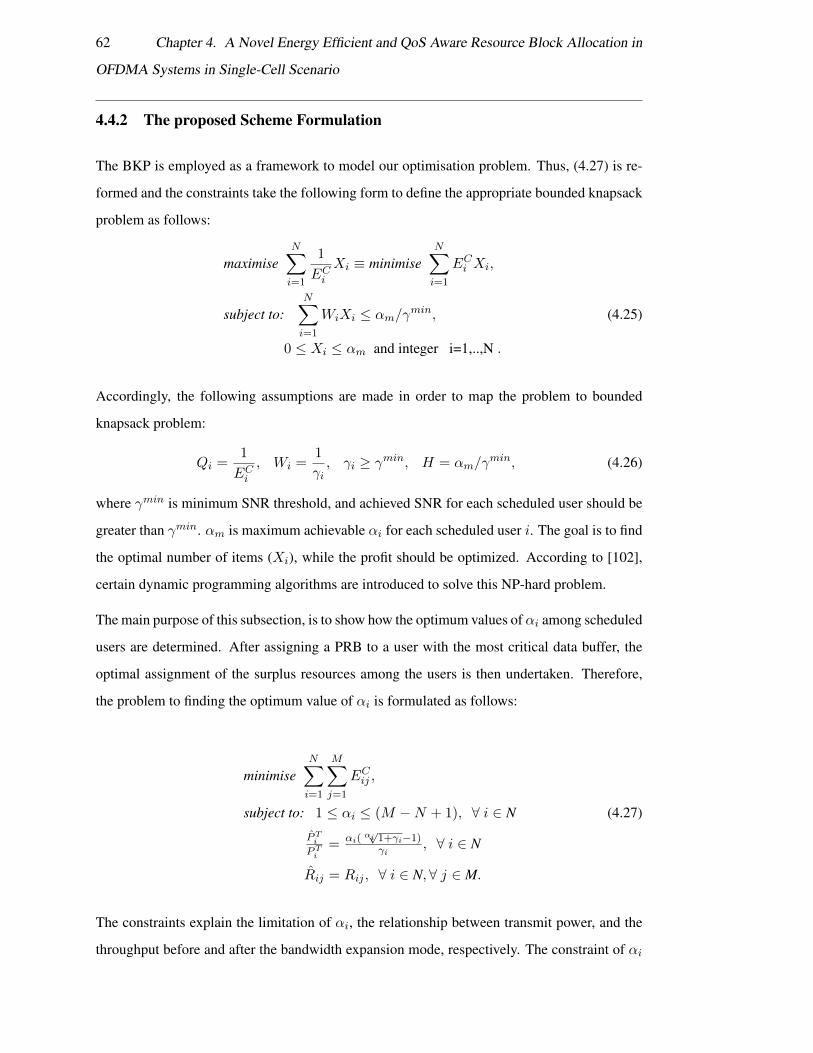
62 Chapter 4. A Novel Energy Efficient and QoS Aware Resource Block Allocation in
OFDMA Systems in Single-Cell Scenario
4.4.2 The proposed Scheme Formulation
The BKP is employed as a framework to model our optimisation problem. Thus, (4.27) is re-
formed and the constraints take the following form to define the appropriate bounded knapsack
problem as follows:
maximiseN∑i=1
1
ECiXi ≡ minimise
N∑i=1
ECi Xi,
subject to:N∑i=1
WiXi ≤ αm/γmin, (4.25)
0 ≤ Xi ≤ αm and integer i=1,..,N .
Accordingly, the following assumptions are made in order to map the problem to bounded
knapsack problem:
Qi =1
ECi, Wi =
1
γi, γi ≥ γmin, H = αm/γ
min, (4.26)
where γmin is minimum SNR threshold, and achieved SNR for each scheduled user should be
greater than γmin. αm is maximum achievable αi for each scheduled user i. The goal is to find
the optimal number of items (Xi), while the profit should be optimized. According to [102],
certain dynamic programming algorithms are introduced to solve this NP-hard problem.
The main purpose of this subsection, is to show how the optimum values of αi among scheduled
users are determined. After assigning a PRB to a user with the most critical data buffer, the
optimal assignment of the surplus resources among the users is then undertaken. Therefore,
the problem to finding the optimum value of αi is formulated as follows:
minimiseN∑i=1
M∑j=1
ECij ,
subject to: 1 ≤ αi ≤ (M −N + 1), ∀ i ∈ N (4.27)
PTiPTi
= αi(αi√1+γi−1)γi
, ∀ i ∈ N
Rij = Rij , ∀ i ∈ N, ∀ j ∈ M.
The constraints explain the limitation of αi, the relationship between transmit power, and the
throughput before and after the bandwidth expansion mode, respectively. The constraint of αi
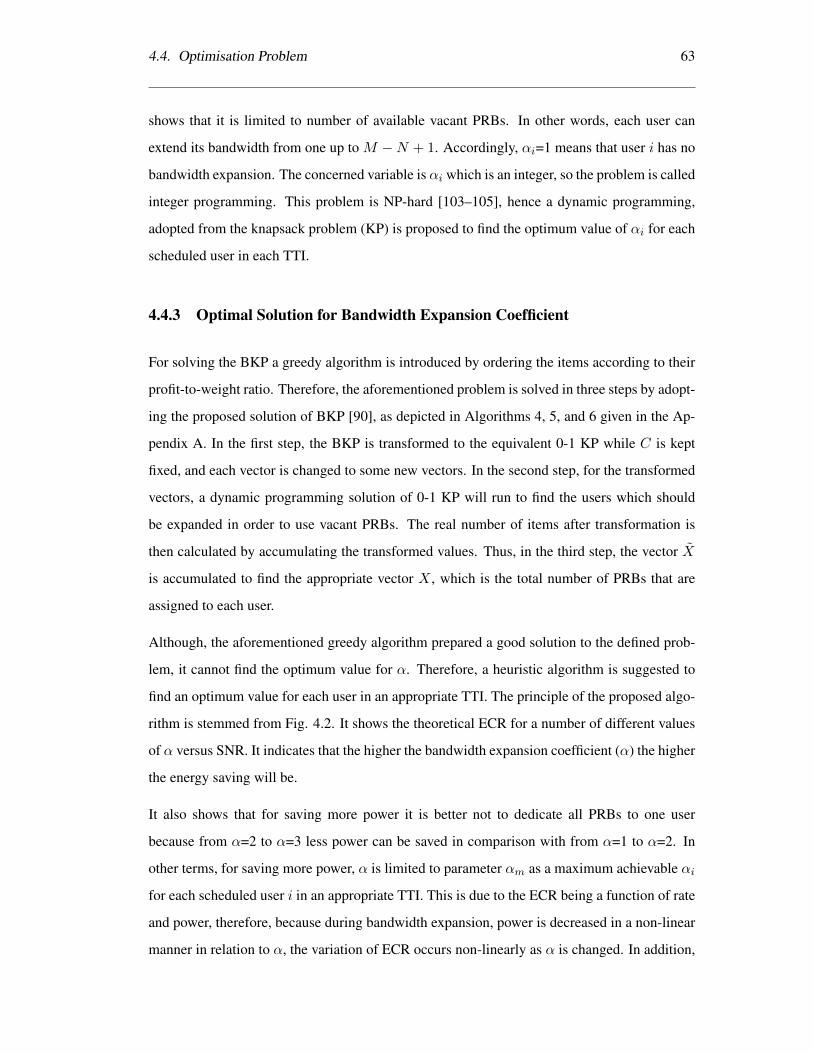
4.4. Optimisation Problem 63
shows that it is limited to number of available vacant PRBs. In other words, each user can
extend its bandwidth from one up to M −N + 1. Accordingly, αi=1 means that user i has no
bandwidth expansion. The concerned variable is αi which is an integer, so the problem is called
integer programming. This problem is NP-hard [103–105], hence a dynamic programming,
adopted from the knapsack problem (KP) is proposed to find the optimum value of αi for each
scheduled user in each TTI.
4.4.3 Optimal Solution for Bandwidth Expansion Coefficient
For solving the BKP a greedy algorithm is introduced by ordering the items according to their
profit-to-weight ratio. Therefore, the aforementioned problem is solved in three steps by adopt-
ing the proposed solution of BKP [90], as depicted in Algorithms 4, 5, and 6 given in the Ap-
pendix A. In the first step, the BKP is transformed to the equivalent 0-1 KP while C is kept
fixed, and each vector is changed to some new vectors. In the second step, for the transformed
vectors, a dynamic programming solution of 0-1 KP will run to find the users which should
be expanded in order to use vacant PRBs. The real number of items after transformation is
then calculated by accumulating the transformed values. Thus, in the third step, the vector X
is accumulated to find the appropriate vector X , which is the total number of PRBs that are
assigned to each user.
Although, the aforementioned greedy algorithm prepared a good solution to the defined prob-
lem, it cannot find the optimum value for α. Therefore, a heuristic algorithm is suggested to
find an optimum value for each user in an appropriate TTI. The principle of the proposed algo-
rithm is stemmed from Fig. 4.2. It shows the theoretical ECR for a number of different values
of α versus SNR. It indicates that the higher the bandwidth expansion coefficient (α) the higher
the energy saving will be.
It also shows that for saving more power it is better not to dedicate all PRBs to one user
because from α=2 to α=3 less power can be saved in comparison with from α=1 to α=2. In
other terms, for saving more power, α is limited to parameter αm as a maximum achievable αi
for each scheduled user i in an appropriate TTI. This is due to the ECR being a function of rate
and power, therefore, because during bandwidth expansion, power is decreased in a non-linear
manner in relation to α, the variation of ECR occurs non-linearly as α is changed. In addition,
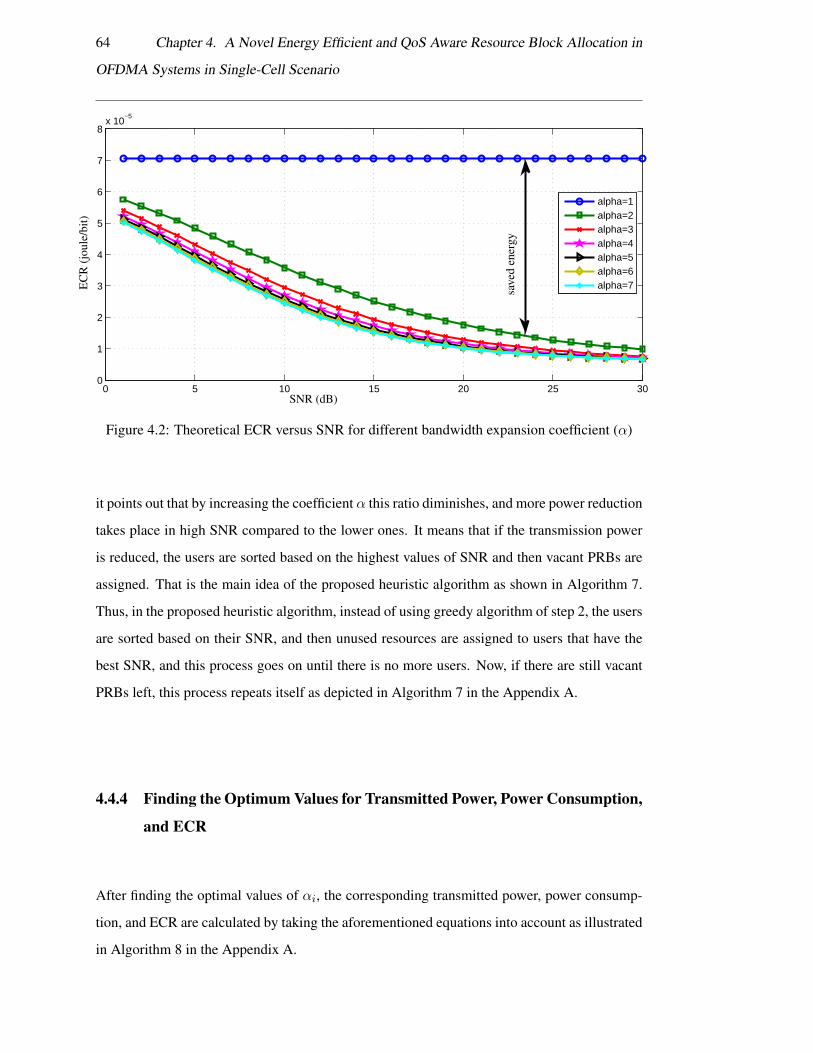
64 Chapter 4. A Novel Energy Efficient and QoS Aware Resource Block Allocation in
OFDMA Systems in Single-Cell Scenario
0 5 10 15 20 25 300
1
2
3
4
5
6
7
8x 10
−5
alpha=1alpha=2alpha=3alpha=4alpha=5alpha=6alpha=7sa
ved
ener
gy
SNR (dB)
EC
R(j
oule
/bit)
Figure 4.2: Theoretical ECR versus SNR for different bandwidth expansion coefficient (α)
it points out that by increasing the coefficient α this ratio diminishes, and more power reduction
takes place in high SNR compared to the lower ones. It means that if the transmission power
is reduced, the users are sorted based on the highest values of SNR and then vacant PRBs are
assigned. That is the main idea of the proposed heuristic algorithm as shown in Algorithm 7.
Thus, in the proposed heuristic algorithm, instead of using greedy algorithm of step 2, the users
are sorted based on their SNR, and then unused resources are assigned to users that have the
best SNR, and this process goes on until there is no more users. Now, if there are still vacant
PRBs left, this process repeats itself as depicted in Algorithm 7 in the Appendix A.
4.4.4 Finding the Optimum Values for Transmitted Power, Power Consumption,
and ECR
After finding the optimal values of αi, the corresponding transmitted power, power consump-
tion, and ECR are calculated by taking the aforementioned equations into account as illustrated
in Algorithm 8 in the Appendix A.
4.5. Complexity Analysis 65
4.5 Complexity Analysis
In the proposed heuristic scheme, merely a function is run to sort the users based on the re-
ceived SNR, which is O[n*log(n)]. So that, it benefits from lower complexity in comparison
with the other types of knapsack problems. The proposed algorithm is also compared with
exhaustive search [106] to show the optimality of the heuristic algorithm. It shows that ex-
haustive search has a high computational complexity O(2n), and its complexity also increases
exponentially with the number of users, whereas the proposed scheme in Algorithm 7, lowers
the computational complexity.
4.6 Performance Evaluation and Simulation Results
System level simulations of a network with a single BS and multiple users are performed.
The main parameters of the simulations are given in Table 4.1. The acceptable Block Error
Rate (BLER) is considered to be 0.1. The users are distributed uniformly. It is also assumed
that perfect CSI exists at both BS and users. The required SNR based on AMC mapping
table is provided in Table 4.2. The implementation of wireless environment is based on 3GPP
LTE standard [107]. Simulation results and performance evaluation in terms of EE and QoS
provisioning are given in this section.
Generally, for implementation of bandwidth expansion four scenarios may arise when assign-
ing M number of PRBs to N number of users in each TTI:
1. M > 2N
2. M = 2N
3. N < M < 2N
4. M ≤ N
In the last scenario, there is no vacant PRB, so this scenario is excluded and the rest of scenarios
are discussed in the performance evaluation to check the optimality of the proposed algorithm.
Therefore, three scenarios are defined, and in each scenario seven options are presented to
compare their performance as follows:
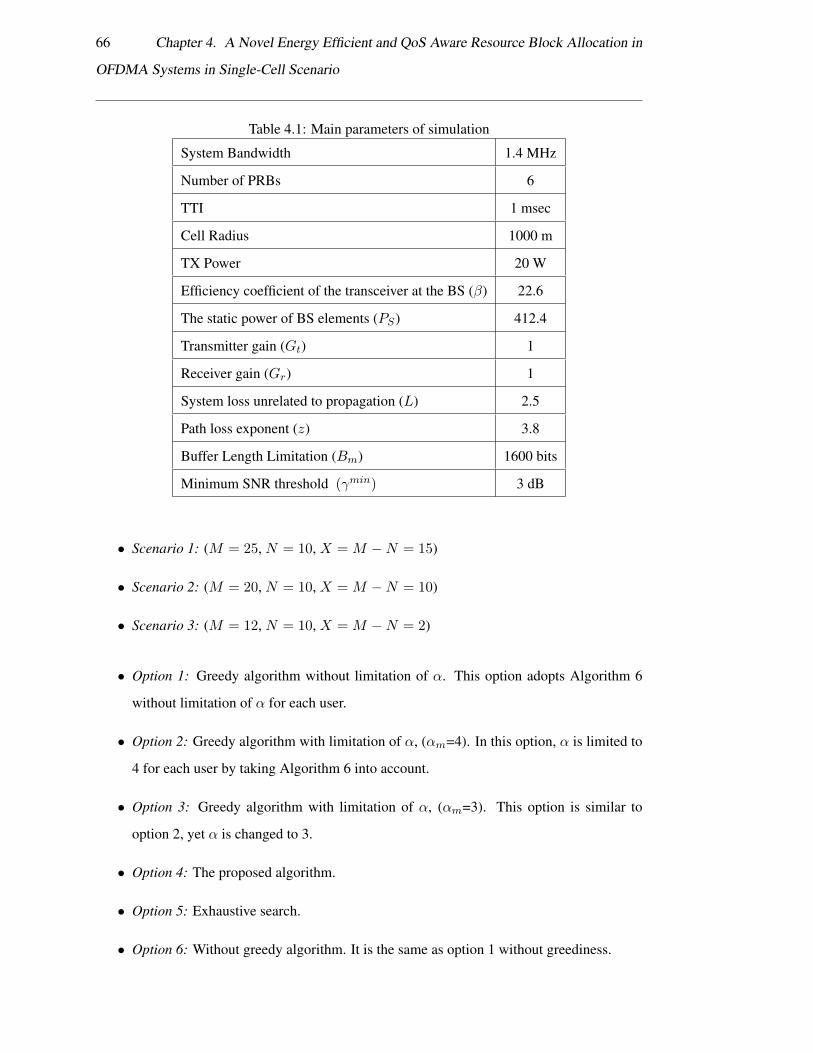
66 Chapter 4. A Novel Energy Efficient and QoS Aware Resource Block Allocation in
OFDMA Systems in Single-Cell Scenario
Table 4.1: Main parameters of simulation
System Bandwidth 1.4 MHz
Number of PRBs 6
TTI 1 msec
Cell Radius 1000 m
TX Power 20 W
Efficiency coefficient of the transceiver at the BS (β) 22.6
The static power of BS elements (PS) 412.4
Transmitter gain (Gt) 1
Receiver gain (Gr) 1
System loss unrelated to propagation (L) 2.5
Path loss exponent (z) 3.8
Buffer Length Limitation (Bm) 1600 bits
Minimum SNR threshold (γmin) 3 dB
• Scenario 1: (M = 25, N = 10, X = M −N = 15)
• Scenario 2: (M = 20, N = 10, X = M −N = 10)
• Scenario 3: (M = 12, N = 10, X = M −N = 2)
• Option 1: Greedy algorithm without limitation of α. This option adopts Algorithm 6
without limitation of α for each user.
• Option 2: Greedy algorithm with limitation of α, (αm=4). In this option, α is limited to
4 for each user by taking Algorithm 6 into account.
• Option 3: Greedy algorithm with limitation of α, (αm=3). This option is similar to
option 2, yet α is changed to 3.
• Option 4: The proposed algorithm.
• Option 5: Exhaustive search.
• Option 6: Without greedy algorithm. It is the same as option 1 without greediness.
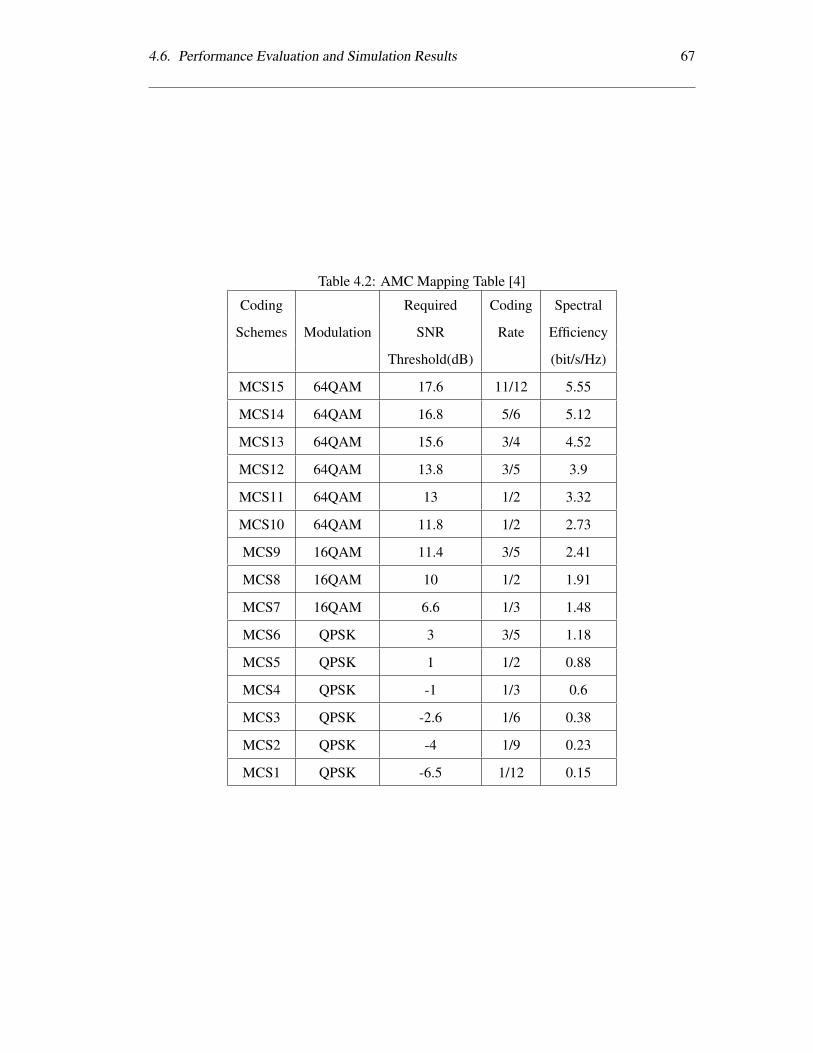
4.6. Performance Evaluation and Simulation Results 67
Table 4.2: AMC Mapping Table [4]
Coding Required Coding Spectral
Schemes Modulation SNR Rate Efficiency
Threshold(dB) (bit/s/Hz)
MCS15 64QAM 17.6 11/12 5.55
MCS14 64QAM 16.8 5/6 5.12
MCS13 64QAM 15.6 3/4 4.52
MCS12 64QAM 13.8 3/5 3.9
MCS11 64QAM 13 1/2 3.32
MCS10 64QAM 11.8 1/2 2.73
MCS9 16QAM 11.4 3/5 2.41
MCS8 16QAM 10 1/2 1.91
MCS7 16QAM 6.6 1/3 1.48
MCS6 QPSK 3 3/5 1.18
MCS5 QPSK 1 1/2 0.88
MCS4 QPSK -1 1/3 0.6
MCS3 QPSK -2.6 1/6 0.38
MCS2 QPSK -4 1/9 0.23
MCS1 QPSK -6.5 1/12 0.15
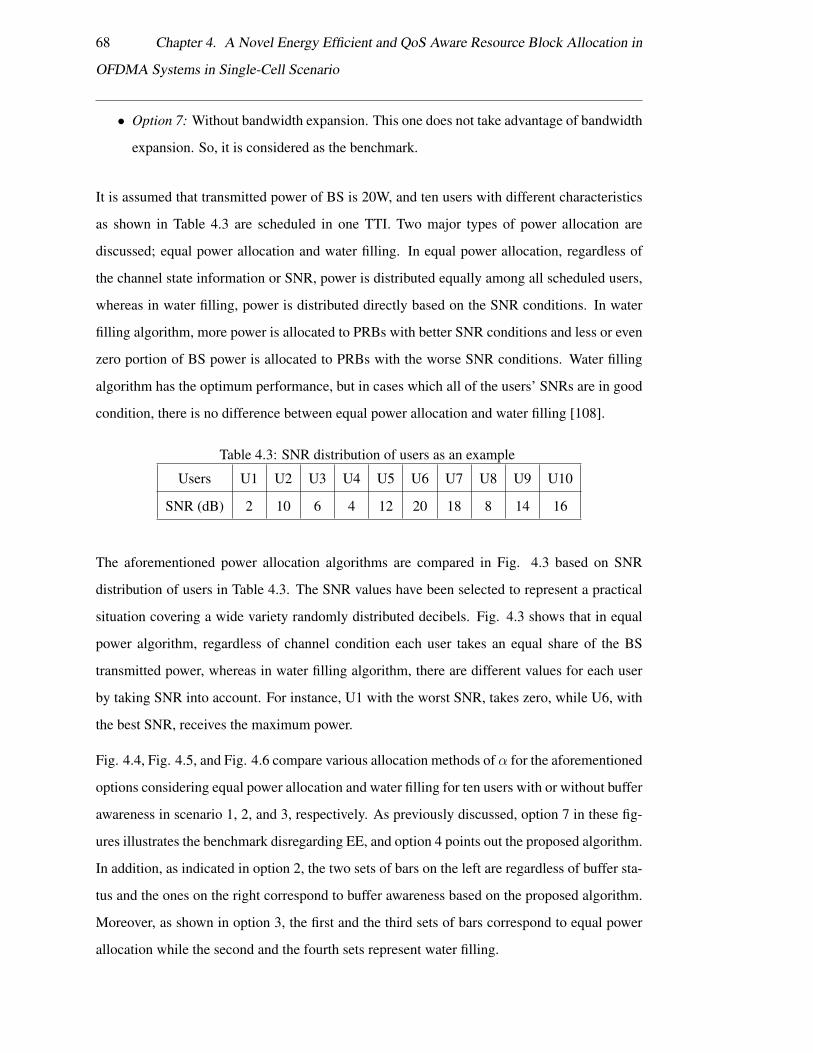
68 Chapter 4. A Novel Energy Efficient and QoS Aware Resource Block Allocation in
OFDMA Systems in Single-Cell Scenario
• Option 7: Without bandwidth expansion. This one does not take advantage of bandwidth
expansion. So, it is considered as the benchmark.
It is assumed that transmitted power of BS is 20W, and ten users with different characteristics
as shown in Table 4.3 are scheduled in one TTI. Two major types of power allocation are
discussed; equal power allocation and water filling. In equal power allocation, regardless of
the channel state information or SNR, power is distributed equally among all scheduled users,
whereas in water filling, power is distributed directly based on the SNR conditions. In water
filling algorithm, more power is allocated to PRBs with better SNR conditions and less or even
zero portion of BS power is allocated to PRBs with the worse SNR conditions. Water filling
algorithm has the optimum performance, but in cases which all of the users’ SNRs are in good
condition, there is no difference between equal power allocation and water filling [108].
Table 4.3: SNR distribution of users as an example
Users U1 U2 U3 U4 U5 U6 U7 U8 U9 U10
SNR (dB) 2 10 6 4 12 20 18 8 14 16
The aforementioned power allocation algorithms are compared in Fig. 4.3 based on SNR
distribution of users in Table 4.3. The SNR values have been selected to represent a practical
situation covering a wide variety randomly distributed decibels. Fig. 4.3 shows that in equal
power algorithm, regardless of channel condition each user takes an equal share of the BS
transmitted power, whereas in water filling algorithm, there are different values for each user
by taking SNR into account. For instance, U1 with the worst SNR, takes zero, while U6, with
the best SNR, receives the maximum power.
Fig. 4.4, Fig. 4.5, and Fig. 4.6 compare various allocation methods of α for the aforementioned
options considering equal power allocation and water filling for ten users with or without buffer
awareness in scenario 1, 2, and 3, respectively. As previously discussed, option 7 in these fig-
ures illustrates the benchmark disregarding EE, and option 4 points out the proposed algorithm.
In addition, as indicated in option 2, the two sets of bars on the left are regardless of buffer sta-
tus and the ones on the right correspond to buffer awareness based on the proposed algorithm.
Moreover, as shown in option 3, the first and the third sets of bars correspond to equal power
allocation while the second and the fourth sets represent water filling.
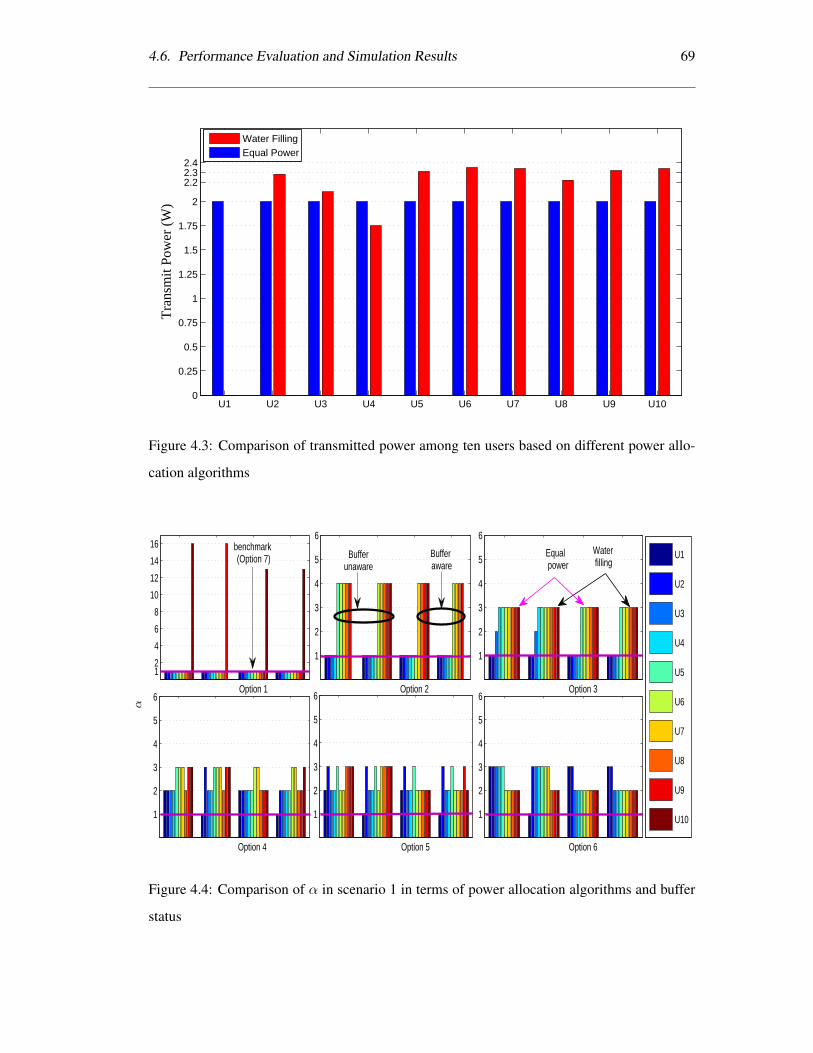
4.6. Performance Evaluation and Simulation Results 69
U1 U2 U3 U4 U5 U6 U7 U8 U9 U100
0.25
0.5
0.75
1
1.25
1.5
1.75
2
2.22.32.4
Tra
nsm
it Po
wer
(W
)
Water FillingEqual Power
Figure 4.3: Comparison of transmitted power among ten users based on different power allo-
cation algorithms
Option 1
12
4
6
8
10
12
14
16
Option 4
1
2
3
4
5
6
Option 2
1
2
3
4
5
6
Option 3
1
2
3
4
5
6
Option 5
1
2
3
4
5
6
Option 6
1
2
3
4
5
6
U1
U2
U3
U4
U5
U6
U7
U8
U9
U10
Buffer unaware
Water filling
Equal power
benchmark (Option 7) Buffer
aware
α
Figure 4.4: Comparison of α in scenario 1 in terms of power allocation algorithms and buffer
status
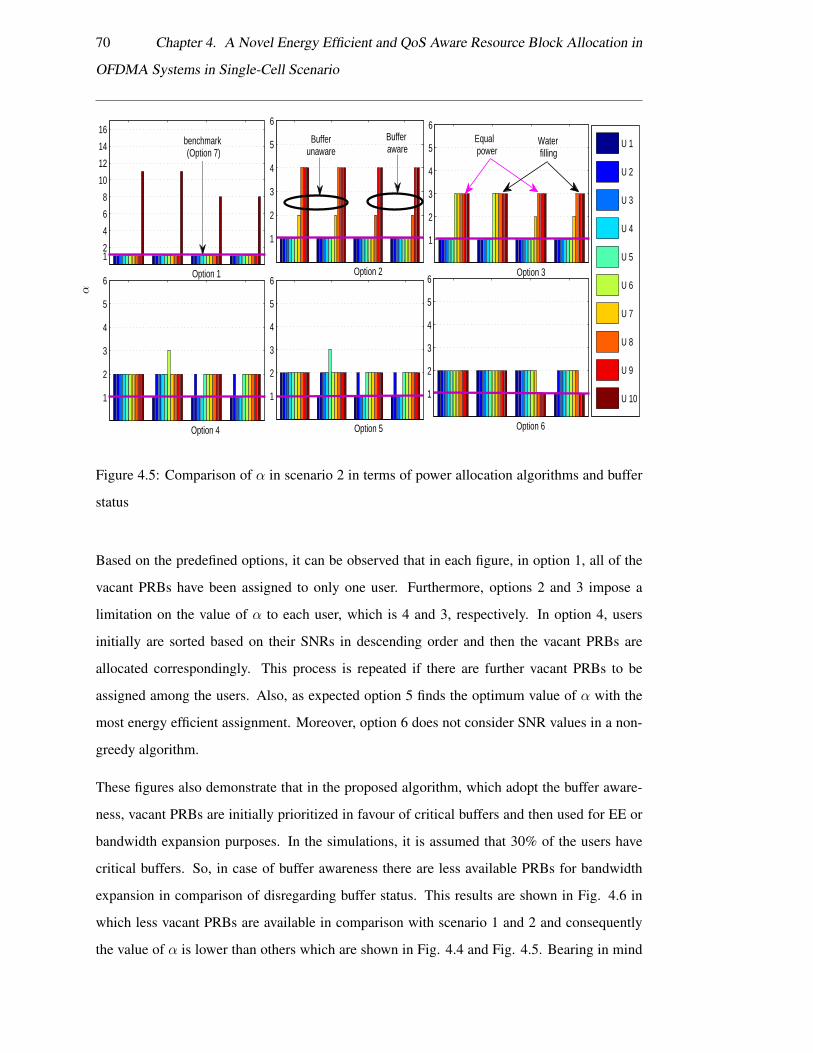
70 Chapter 4. A Novel Energy Efficient and QoS Aware Resource Block Allocation in
OFDMA Systems in Single-Cell Scenario
Option 1
12
4
6
8
10
12
14
16
Option 2
1
2
3
4
5
6
Option 5
1
2
3
4
5
6
Option 6
1
2
3
4
5
6
Option 3
1
2
3
4
5
6
Option 4
1
2
3
4
5
6
U 1
U 2
U 3
U 4
U 5
U 6
U 7
U 8
U 9
U 10
Water filling
Buffer aware
Buffer unaware
Equal power
benchmark (Option 7)
α
Figure 4.5: Comparison of α in scenario 2 in terms of power allocation algorithms and buffer
status
Based on the predefined options, it can be observed that in each figure, in option 1, all of the
vacant PRBs have been assigned to only one user. Furthermore, options 2 and 3 impose a
limitation on the value of α to each user, which is 4 and 3, respectively. In option 4, users
initially are sorted based on their SNRs in descending order and then the vacant PRBs are
allocated correspondingly. This process is repeated if there are further vacant PRBs to be
assigned among the users. Also, as expected option 5 finds the optimum value of α with the
most energy efficient assignment. Moreover, option 6 does not consider SNR values in a non-
greedy algorithm.
These figures also demonstrate that in the proposed algorithm, which adopt the buffer aware-
ness, vacant PRBs are initially prioritized in favour of critical buffers and then used for EE or
bandwidth expansion purposes. In the simulations, it is assumed that 30% of the users have
critical buffers. So, in case of buffer awareness there are less available PRBs for bandwidth
expansion in comparison of disregarding buffer status. This results are shown in Fig. 4.6 in
which less vacant PRBs are available in comparison with scenario 1 and 2 and consequently
the value of α is lower than others which are shown in Fig. 4.4 and Fig. 4.5. Bearing in mind
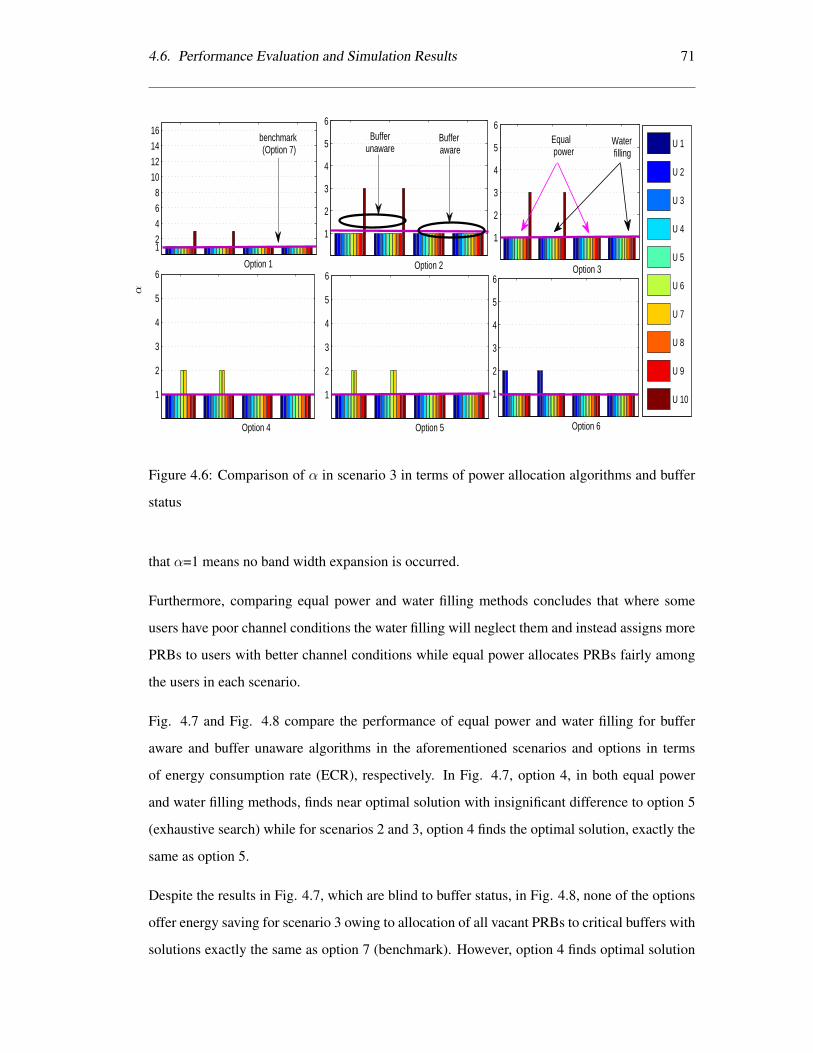
4.6. Performance Evaluation and Simulation Results 71
Option 1
12
4
6
8
10
12
14
16
Option 5
1
2
3
4
5
6
Option 4
1
2
3
4
5
6
Option 2
1
2
3
4
5
6
Option 3
1
2
3
4
5
6
Option 6
1
2
3
4
5
6
U 1
U 2
U 3
U 4
U 5
U 6
U 7
U 8
U 9
U 10
Water filling
benchmark (Option 7)
Equal power
Buffer aware
Buffer unaware
α
Figure 4.6: Comparison of α in scenario 3 in terms of power allocation algorithms and buffer
status
that α=1 means no band width expansion is occurred.
Furthermore, comparing equal power and water filling methods concludes that where some
users have poor channel conditions the water filling will neglect them and instead assigns more
PRBs to users with better channel conditions while equal power allocates PRBs fairly among
the users in each scenario.
Fig. 4.7 and Fig. 4.8 compare the performance of equal power and water filling for buffer
aware and buffer unaware algorithms in the aforementioned scenarios and options in terms
of energy consumption rate (ECR), respectively. In Fig. 4.7, option 4, in both equal power
and water filling methods, finds near optimal solution with insignificant difference to option 5
(exhaustive search) while for scenarios 2 and 3, option 4 finds the optimal solution, exactly the
same as option 5.
Despite the results in Fig. 4.7, which are blind to buffer status, in Fig. 4.8, none of the options
offer energy saving for scenario 3 owing to allocation of all vacant PRBs to critical buffers with
solutions exactly the same as option 7 (benchmark). However, option 4 finds optimal solution
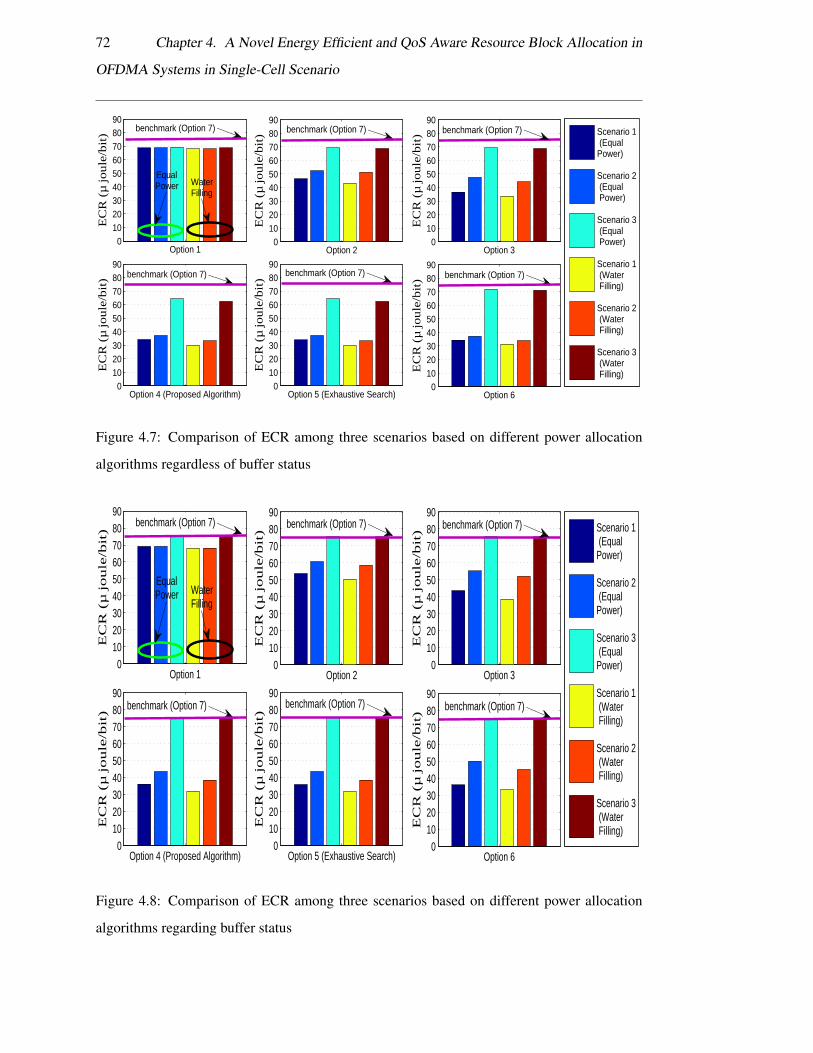
72 Chapter 4. A Novel Energy Efficient and QoS Aware Resource Block Allocation in
OFDMA Systems in Single-Cell Scenario
Option 20
102030405060708090
EC
R (
µ jo
ule
/bit)
Option 5 (Exhaustive Search)0
102030405060708090
E
CR
(µ
jo
ule
/bit)
Option 30
102030405060708090
EC
R (
µ jo
ule
/bit)
Option 60
102030405060708090
EC
R (
µ jo
ule
/bit)
Option 10
102030405060708090
EC
R (
µ jo
ule
/bit)
Option 4 (Proposed Algorithm)0
102030405060708090
EC
R (
µ jo
ule
/bit)
Scenario 1 (EqualPower)
Scenario 2 (Equal Power)
Scenario 3 (Equal Power)
Scenario 1 (Water Filling)
Scenario 2 (Water Filling)
Scenario 3 (Water Filling)
benchmark (Option 7)benchmark (Option 7)
benchmark (Option 7)benchmark (Option 7)
benchmark (Option 7)
EqualPower
benchmark (Option 7)
WaterFilling
Figure 4.7: Comparison of ECR among three scenarios based on different power allocation
algorithms regardless of buffer status
Option 20
102030405060708090
EC
R (
µ jo
ule
/bit)
Option 5 (Exhaustive Search)0
102030405060708090
EC
R (
µ jo
ule
/bit)
Option 30
102030405060708090
EC
R (
µ jo
ule
/bit)
Option 60
102030405060708090
EC
R (
µ jo
ule
/bit)
Option 10
102030405060708090
EC
R (
µ jo
ule
/bit)
Option 4 (Proposed Algorithm)0
102030405060708090
EC
R (
µ jo
ule
/bit)
Scenario 1 (EqualPower)
Scenario 2 (EqualPower)
Scenario 3 (EqualPower)
Scenario 1 (Water Filling)
Scenario 2 (Water Filling)
Scenario 3 (Water Filling)
benchmark (Option 7)benchmark (Option 7)
benchmark (Option 7)benchmark (Option 7)
benchmark (Option 7)
benchmark (Option 7)
WaterFilling
EqualPower
Figure 4.8: Comparison of ECR among three scenarios based on different power allocation
algorithms regarding buffer status
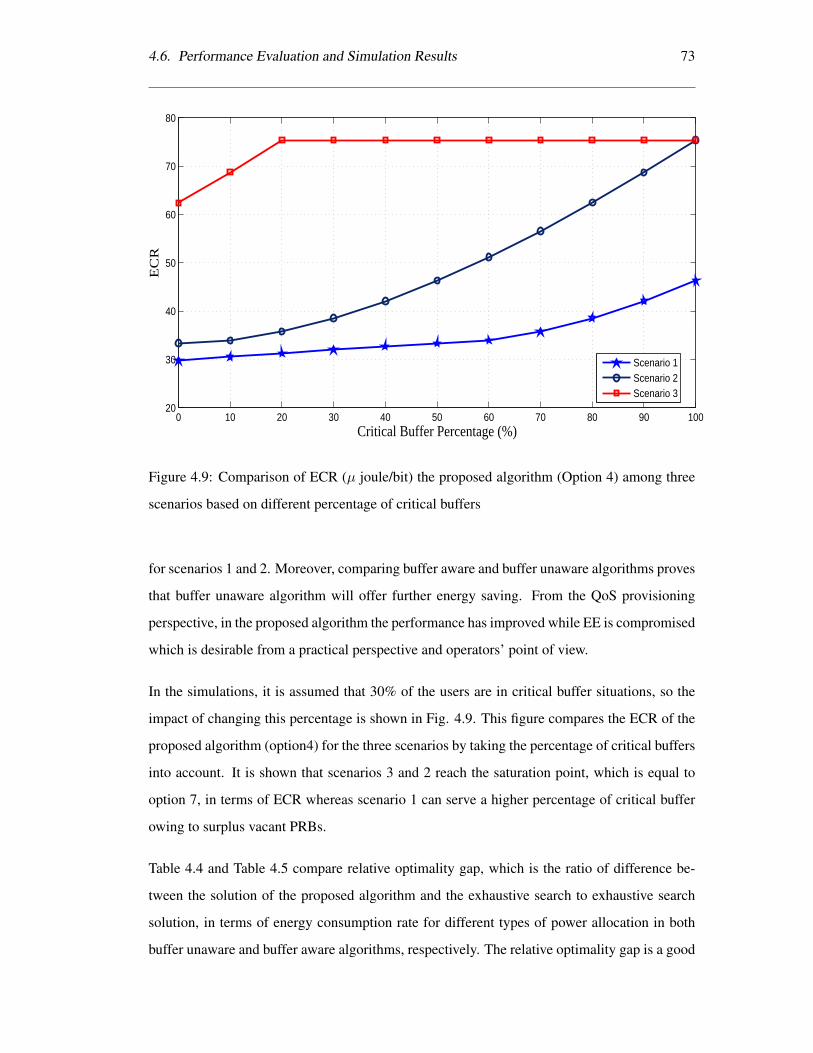
4.6. Performance Evaluation and Simulation Results 73
0 10 20 30 40 50 60 70 80 90 10020
30
40
50
60
70
80
Critical Buffer Percentage (%)
EC
R
Scenario 1Scenario 2Scenario 3
Figure 4.9: Comparison of ECR (µ joule/bit) the proposed algorithm (Option 4) among three
scenarios based on different percentage of critical buffers
for scenarios 1 and 2. Moreover, comparing buffer aware and buffer unaware algorithms proves
that buffer unaware algorithm will offer further energy saving. From the QoS provisioning
perspective, in the proposed algorithm the performance has improved while EE is compromised
which is desirable from a practical perspective and operators’ point of view.
In the simulations, it is assumed that 30% of the users are in critical buffer situations, so the
impact of changing this percentage is shown in Fig. 4.9. This figure compares the ECR of the
proposed algorithm (option4) for the three scenarios by taking the percentage of critical buffers
into account. It is shown that scenarios 3 and 2 reach the saturation point, which is equal to
option 7, in terms of ECR whereas scenario 1 can serve a higher percentage of critical buffer
owing to surplus vacant PRBs.
Table 4.4 and Table 4.5 compare relative optimality gap, which is the ratio of difference be-
tween the solution of the proposed algorithm and the exhaustive search to exhaustive search
solution, in terms of energy consumption rate for different types of power allocation in both
buffer unaware and buffer aware algorithms, respectively. The relative optimality gap is a good
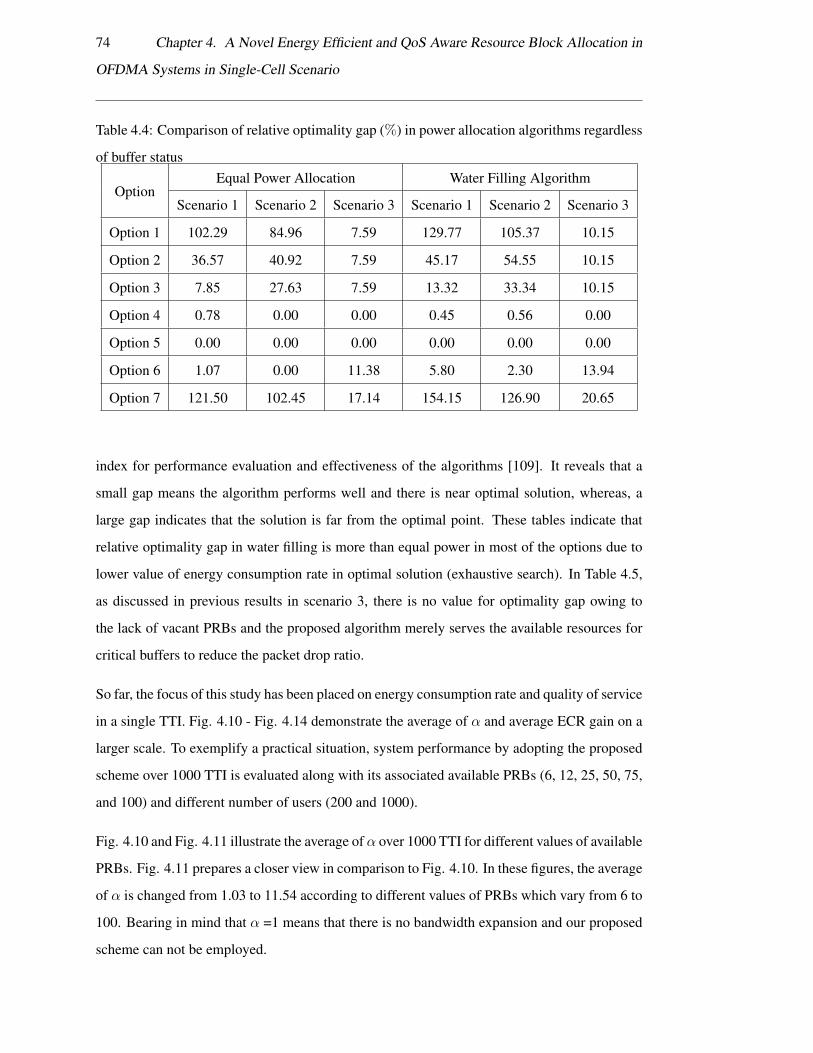
74 Chapter 4. A Novel Energy Efficient and QoS Aware Resource Block Allocation in
OFDMA Systems in Single-Cell Scenario
Table 4.4: Comparison of relative optimality gap (%) in power allocation algorithms regardless
of buffer status
OptionEqual Power Allocation Water Filling Algorithm
Scenario 1 Scenario 2 Scenario 3 Scenario 1 Scenario 2 Scenario 3
Option 1 102.29 84.96 7.59 129.77 105.37 10.15
Option 2 36.57 40.92 7.59 45.17 54.55 10.15
Option 3 7.85 27.63 7.59 13.32 33.34 10.15
Option 4 0.78 0.00 0.00 0.45 0.56 0.00
Option 5 0.00 0.00 0.00 0.00 0.00 0.00
Option 6 1.07 0.00 11.38 5.80 2.30 13.94
Option 7 121.50 102.45 17.14 154.15 126.90 20.65
index for performance evaluation and effectiveness of the algorithms [109]. It reveals that a
small gap means the algorithm performs well and there is near optimal solution, whereas, a
large gap indicates that the solution is far from the optimal point. These tables indicate that
relative optimality gap in water filling is more than equal power in most of the options due to
lower value of energy consumption rate in optimal solution (exhaustive search). In Table 4.5,
as discussed in previous results in scenario 3, there is no value for optimality gap owing to
the lack of vacant PRBs and the proposed algorithm merely serves the available resources for
critical buffers to reduce the packet drop ratio.
So far, the focus of this study has been placed on energy consumption rate and quality of service
in a single TTI. Fig. 4.10 - Fig. 4.14 demonstrate the average of α and average ECR gain on a
larger scale. To exemplify a practical situation, system performance by adopting the proposed
scheme over 1000 TTI is evaluated along with its associated available PRBs (6, 12, 25, 50, 75,
and 100) and different number of users (200 and 1000).
Fig. 4.10 and Fig. 4.11 illustrate the average of α over 1000 TTI for different values of available
PRBs. Fig. 4.11 prepares a closer view in comparison to Fig. 4.10. In these figures, the average
of α is changed from 1.03 to 11.54 according to different values of PRBs which vary from 6 to
100. Bearing in mind that α =1 means that there is no bandwidth expansion and our proposed
scheme can not be employed.
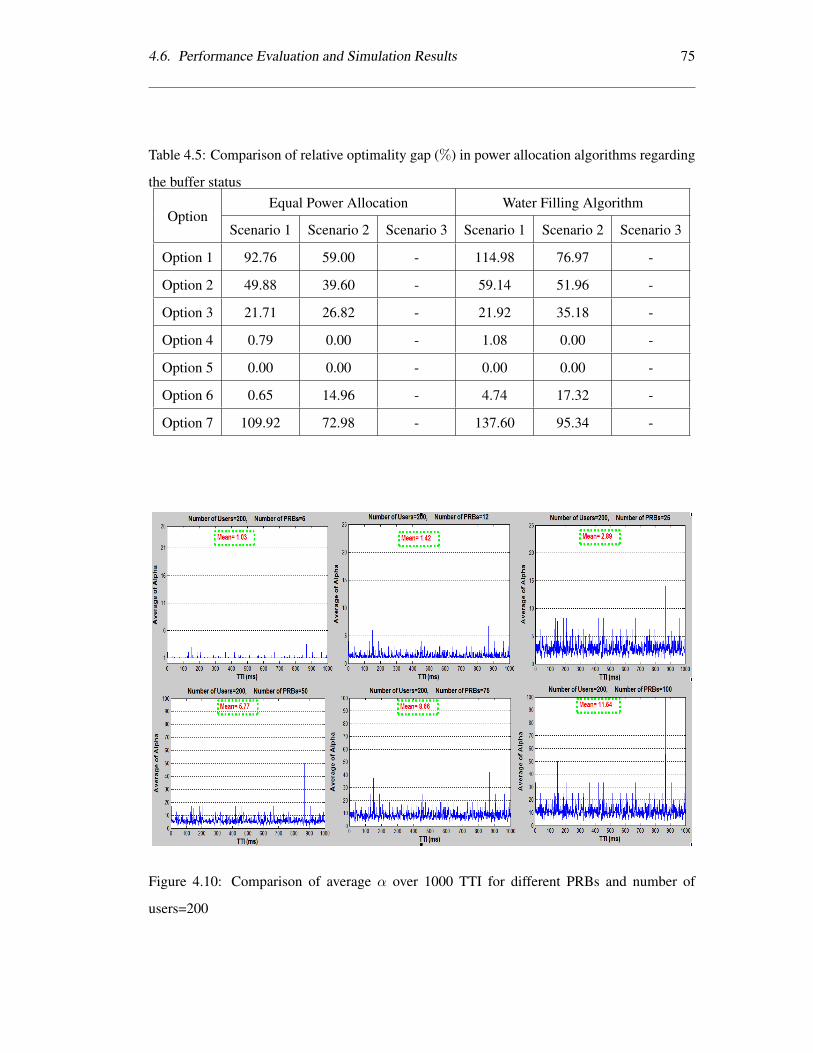
4.6. Performance Evaluation and Simulation Results 75
Table 4.5: Comparison of relative optimality gap (%) in power allocation algorithms regarding
the buffer status
OptionEqual Power Allocation Water Filling Algorithm
Scenario 1 Scenario 2 Scenario 3 Scenario 1 Scenario 2 Scenario 3
Option 1 92.76 59.00 - 114.98 76.97 -
Option 2 49.88 39.60 - 59.14 51.96 -
Option 3 21.71 26.82 - 21.92 35.18 -
Option 4 0.79 0.00 - 1.08 0.00 -
Option 5 0.00 0.00 - 0.00 0.00 -
Option 6 0.65 14.96 - 4.74 17.32 -
Option 7 109.92 72.98 - 137.60 95.34 -
Figure 4.10: Comparison of average α over 1000 TTI for different PRBs and number of
users=200
76 Chapter 4. A Novel Energy Efficient and QoS Aware Resource Block Allocation in
OFDMA Systems in Single-Cell Scenario
Figure 4.11: Comparison of average α over 1000 TTI for different PRBs and number of
users=200 from closer view
Fig. 4.12 shows average ECR gain according to the α values in the aforementioned figures.
It points out that in lower available PRBs less gain is achieved whereas in higher number
of available PRBs more gain is obtained (from 1.82% to about 70%). It confirms that after
changing α from 4 to greater values the gain in ECR is not improved according to the result of
Fig. 4.2.
Fig. 4.13 and Fig. 4.14 illustrate the similar analysis for 1000 users instead of 200 users
for different PRBS over 1000 TTI. In Fig. 4.13, in three cases which have lower number of
available PRBs α is equal to one and there is no ECR gain consequently. In Fig. 4.14, there is
less ECR gain in comparison to light traffic conditions.
In addition to the EE metric, it is also important to investigate the impact of the proposed
scheduling scheme in terms of the QoS. By taking finite buffer length into consideration, the
schedulers will drop a packet if the packet waiting time exceeds the designated buffer length
limitation. The index for evaluation of QoS is the packet drop ratio (PDR) and computed as
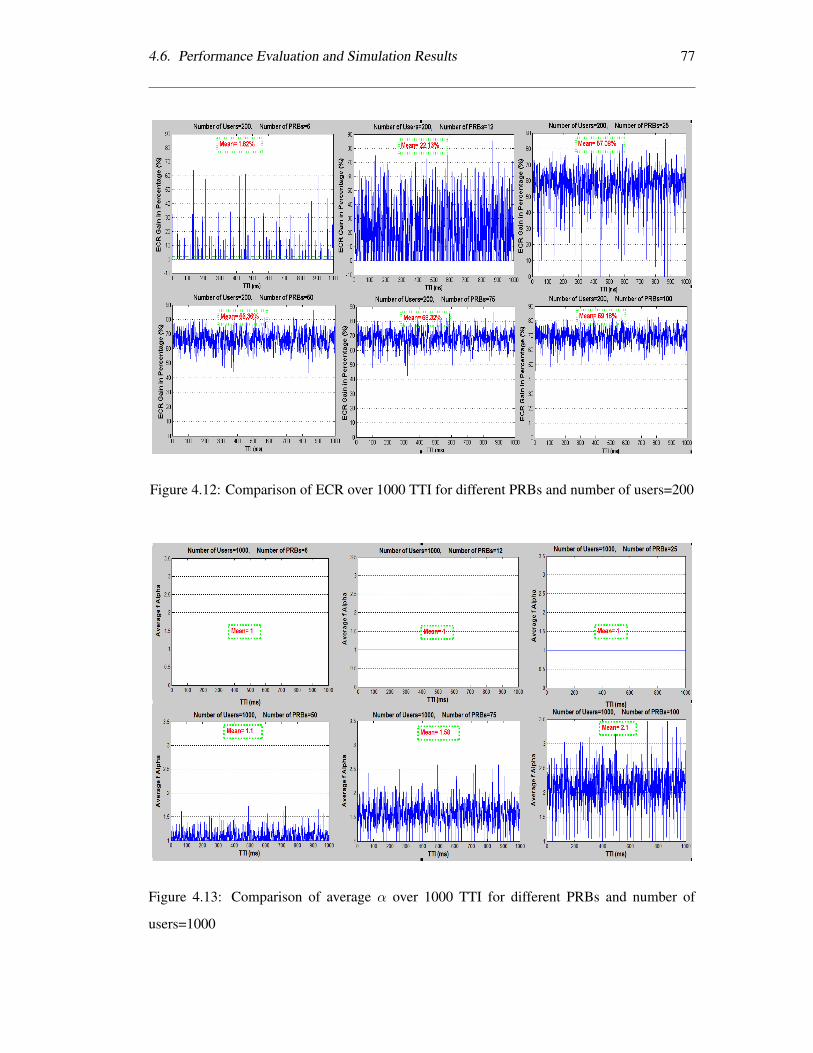
4.6. Performance Evaluation and Simulation Results 77
Figure 4.12: Comparison of ECR over 1000 TTI for different PRBs and number of users=200
Figure 4.13: Comparison of average α over 1000 TTI for different PRBs and number of
users=1000
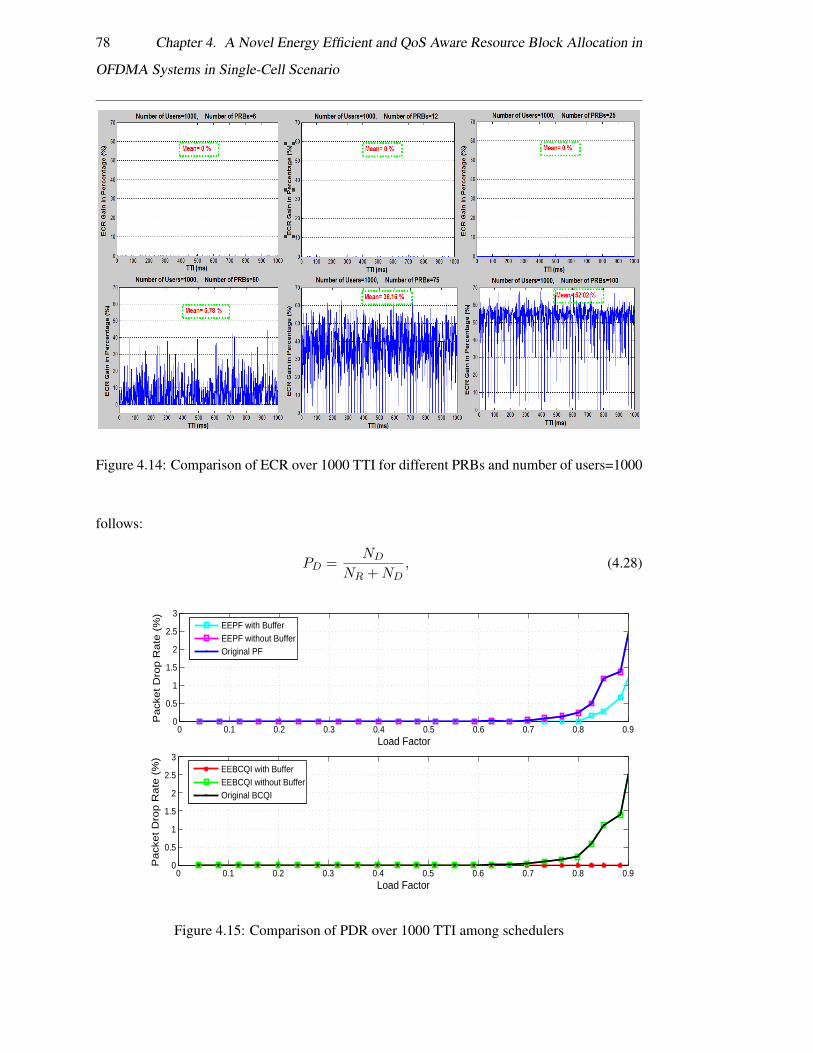
78 Chapter 4. A Novel Energy Efficient and QoS Aware Resource Block Allocation in
OFDMA Systems in Single-Cell Scenario
Figure 4.14: Comparison of ECR over 1000 TTI for different PRBs and number of users=1000
follows:
PD =ND
NR +ND, (4.28)
0 0.1 0.2 0.3 0.4 0.5 0.6 0.7 0.8 0.90
0.5
1
1.5
2
2.5
3
Load Factor
Pa
cke
t D
rop
Ra
te (
%)
EEPF with BufferEEPF without BufferOriginal PF
0 0.1 0.2 0.3 0.4 0.5 0.6 0.7 0.8 0.90
0.5
1
1.5
2
2.5
3
Load Factor
Pa
cke
t D
rop
Ra
te (
%)
EEBCQI with BufferEEBCQI without BufferOriginal BCQI
Figure 4.15: Comparison of PDR over 1000 TTI among schedulers
4.7. Summary 79
where PD, ND, andNR are packet dropping ratio, the number of dropped packets, and number
of delivered packets, respectively. PDR will be affected by both buffer length and available
radio resources (PRBs).
Furthermore, Fig. 4.15 indicates that EEBCQI with buffer awareness offers no packet drop
ratio irrespective of the load factor in comparison with EEPF with buffer awareness. The main
reason is that EEBCQI serves more bits from buffers and consequently buffers are depleted
sooner according to selection of users based on higher channel quality. Besides, in both sched-
ulers no reduction in PDR is observed when buffer awareness is considered. Therefore, the
proposed algorithm with buffer awareness not only provides lower ECR but also offers a better
quality of service in terms of PDR.
4.7 Summary
In this chapter, a novel scheme is proposed in light traffic situations to improve energy con-
sumption from the BS side, and reduce packet drop ratio in the downlink of OFDMA systems.
The assignment of vacant PRBs is formulated as an optimisation problem, and solved by adopt-
ing the greedy BKP. Then, a heuristic algorithm is proposed to find the near optimal solution
according to insight on finding optimum values of α among the scheduled users. By applying
the proposed scheme on two classic schedulers, two appropriate energy efficient schedulers
EEBCQI, and EEPF are introduced. Their performances in terms of EE and QoS provision are
compared. It has also been shown that the proposed scheme has low computational complexity
in comparison with the exhaustive search whilst preparing near optimal solution. Moreover,
the scheme achieves significant energy saving and superior performance during light traffic
situations while guaranteeing the QoS.
Chapter 5
Novel Energy Efficient and QoS Aware
Resource Block Allocation Algorithms
in OFDMA Systems with CoMP
This chapter investigates energy efficient allocation of the surplus radio resource blocks in
OFDMA systems in multi-cell scenario while considering the status of the users’ data buffers
in order to reduce packet drop ratio due to overflow. Further to chapter 4 where we discussed
single-cell approach, the idea is adopted in multi-cell to investigate its performance in Non-
CoMP (N-CoMP) and CoMP operations. Some major aspects of our proposed method are
highlighted as follows. First, the proposed method has lower complexity and is time-efficient
which make it appealing in practice. Second, in our investigation, vacant PRBs are dedicated
to critical buffers initially to guarantee QoS, in terms of drop ratio, and then the remaining
resources are used for EE. This adds a practical dimension to our investigation which led to
it being filed as a patent [97, 98]. Finally, most of the resource allocation problems have been
formulated as Mixed Integer Programming (MIP) problems whereas our problem is formulated
as a Multiple Choice Bounded Knapsack Problem (MCBKP) which is an Integer Programming
(IP) problem and adds novelty to this research.
80
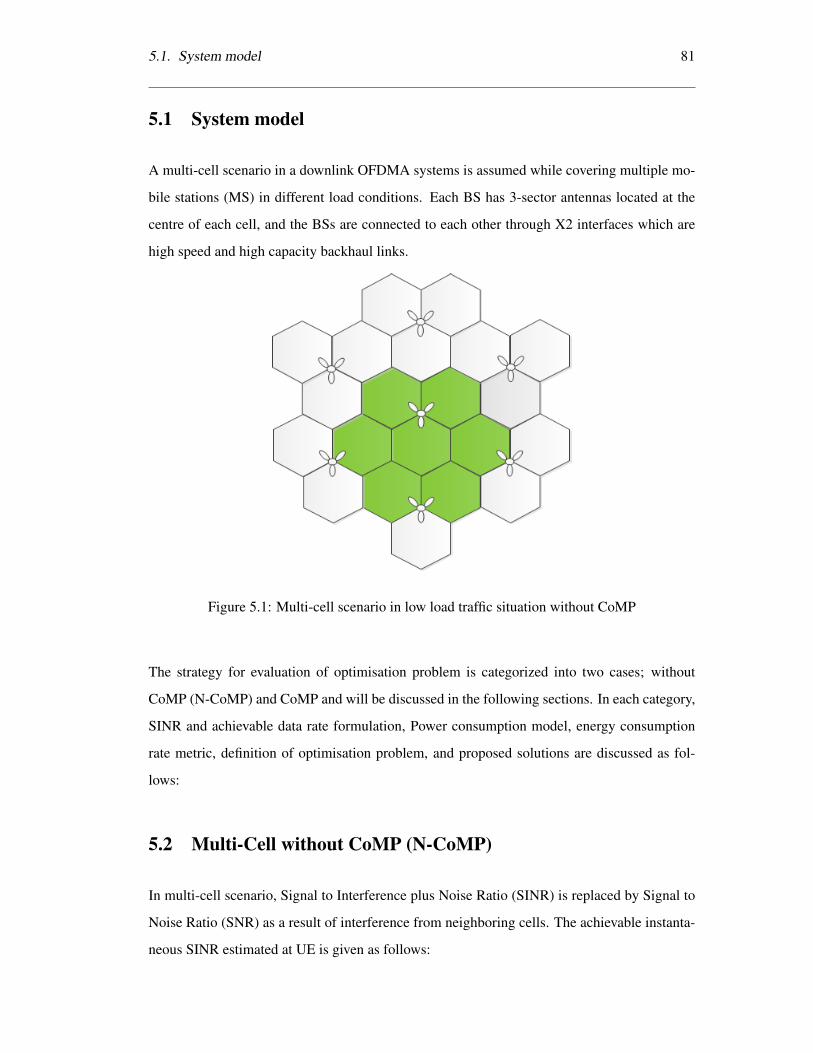
5.1. System model 81
5.1 System model
A multi-cell scenario in a downlink OFDMA systems is assumed while covering multiple mo-
bile stations (MS) in different load conditions. Each BS has 3-sector antennas located at the
centre of each cell, and the BSs are connected to each other through X2 interfaces which are
high speed and high capacity backhaul links.
Figure 5.1: Multi-cell scenario in low load traffic situation without CoMP
The strategy for evaluation of optimisation problem is categorized into two cases; without
CoMP (N-CoMP) and CoMP and will be discussed in the following sections. In each category,
SINR and achievable data rate formulation, Power consumption model, energy consumption
rate metric, definition of optimisation problem, and proposed solutions are discussed as fol-
lows:
5.2 Multi-Cell without CoMP (N-CoMP)
In multi-cell scenario, Signal to Interference plus Noise Ratio (SINR) is replaced by Signal to
Noise Ratio (SNR) as a result of interference from neighboring cells. The achievable instanta-
neous SINR estimated at UE is given as follows:
82 Chapter 5. Novel Energy Efficient and QoS Aware Resource Block Allocation Algorithms
in OFDMA Systems with CoMP
SINR = γ =P rserving
K∑i=1
Pi + Pnoise
, (5.1)
where P rserving stands for the average received power of the serving cell. The sum in denomina-
tor is over all K interfering cells. Pi and Pnoise denote the received interfering power of the ith
interferer and the noise power in the entire transmission bandwidth, respectively.
5.2.1 Proposed solution
A similar approach to the greedy algorithm for sing-cell scenario [76] is defined for multi-cell
without taking CoMP into account and it is applied as depicted in Algorithm 1 in order to find
an optimal solution for the assignment of surplus resources to optimise the ECR in each cell
individually. As it can be observed, the priority in this algorithm is given to users with higher
SINR instead of SNR in comparison with single-cell scenario.
5.3. Multi-Cell with CoMP 83
Algorithm 1 Heuristic algorithm for finding optimum bandwidth expansion coefficient in N-
CoMP Multi-cell for individual cells1: Input: N , M
2: Output: αi
3: Z ←M −N ,
4: while (There is a user with critical buffer) OR (Z > 0) do
5: Z ← Z − 1,
6: Allocate a vacant PRB to the user with the worst critical buffer
7: end while
8: The rest of surplus PRBs are assigned based on the ranking of users’ SINR in descending
order
9: if Z > 0 then
10: while Z > 0 do
11: Assign one vacant PRB to the user who has the best SINR
12: Z ← Z − 1
13: end while . More than one PRB can be assigned to the scheduled users
14: else
15: No bandwidth expansion
16: end if . At most one unused PRB is assigned to each user
5.3 Multi-Cell with CoMP
CoMP has been introduced as a promising technique for the LTE-A standard to improve spec-
trum efficiency, increase data rate and enhance the effective coverage area, especially for cell
edge users and reduce interference by exploiting the interference signals from different trans-
mission points as illustrated in Fig. 5.2.
In the N-CoMP scenario, interference is caused from all of the neighbors of each cell which are
distributed around the cell, while in the CoMP scenario, there are two source of interference:
intra cluster interference and inter cluster interference. Inside a cluster, when a PRB is used by
each cell, it will not be used by any other cell in the same cluster, hence intra cluster interference
is mitigated. The interference received from the neighbouring cluster is due to the reuse of
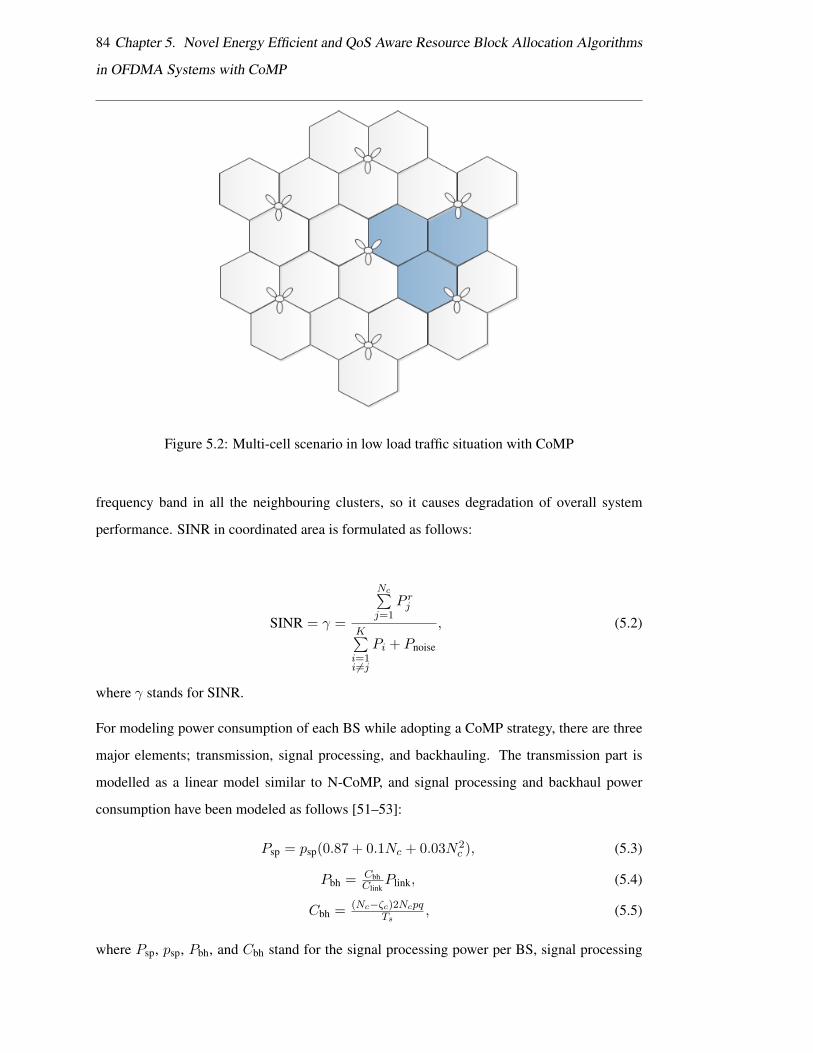
84 Chapter 5. Novel Energy Efficient and QoS Aware Resource Block Allocation Algorithms
in OFDMA Systems with CoMP
Figure 5.2: Multi-cell scenario in low load traffic situation with CoMP
frequency band in all the neighbouring clusters, so it causes degradation of overall system
performance. SINR in coordinated area is formulated as follows:
SINR = γ =
Nc∑j=1
P rj
K∑i=1i 6=j
Pi + Pnoise
, (5.2)
where γ stands for SINR.
For modeling power consumption of each BS while adopting a CoMP strategy, there are three
major elements; transmission, signal processing, and backhauling. The transmission part is
modelled as a linear model similar to N-CoMP, and signal processing and backhaul power
consumption have been modeled as follows [51–53]:
Psp = psp(0.87 + 0.1Nc + 0.03N2c ), (5.3)
Pbh = CbhClink
Plink, (5.4)
Cbh = (Nc−ζc)2NcpqTs
, (5.5)
where Psp, psp, Pbh, and Cbh stand for the signal processing power per BS, signal processing
5.3. Multi-Cell with CoMP 85
power per sector, the power consumption due to backhauling, and average backhaul require-
ment per BS, respectively. Clink and Plink are assumed as wireless micro wave link capacity
of 100 Mbit per second and a power dissipation of 50 Watt for each link. Nc, p, q denote
the cluster size of cooperating BSs, additional pilot density, and CSI signaling due to CoMP,
respectively. Ts is equal to 66.7 µsec which is the symbol period of the OFDMA subcarrier.
Bearing in mind that cooperating cells which are belonging to the same BSs do not need back-
haul infrastructure. Regarding this fact ζc denotes the maximum number of cells within the
cooperation cluster being located at the same site [76].
5.3.1 EE metric in schedulers
ECR including CoMP impact is formulated similar to N-CoMP as depicted in (2.3) and (2.5).
5.3.1.1 Energy consumption rate before bandwidth expansion
Similar to (2.5), the ideal achievable rate for user i on PRB j in each TTI is [76]:
Rij = Bj log2(1 + γij)
Rk =N∑i=1
M∑j=1
Rij ,
Rtotal =Nc∑k=1
Rk, (5.6)
According to (2.3), ECij , which is the overall energy consumption rate of user i on PRB j is
given by:
ECij =PCijRij
, (5.7)
where PCij is the total power consumption of each BS. According to aforementioned power
consumption model, total power consumption per BS is given by:
PCij = βP Tij + PS + Psp + Pbh. (5.8)
86 Chapter 5. Novel Energy Efficient and QoS Aware Resource Block Allocation Algorithms
in OFDMA Systems with CoMP
By substituting (5.8) in (5.7) the following expression is derived:
ECij =βP Tij + PS + Psp + Pbh
Rij=
βN0Bj
(2RBij−1Gij
)+ (PS + Psp + Pbh)
Rij,
=βN0
(2R
Bij − 1
)RBijGij
+PS + Psp + Pbh
Rij. (5.9)
According to (5.6), total ECR in CoMP operation among Nc cooperative cells is given as
follows:
ECtotal =PCtotalRtotal
=
Nc∑k=1
N∑i=1
M∑j=1
PCij (k)
Nc∑k=1
N∑i=1
M∑j=1
Rij(k)
. (5.10)
Hence, N and M stand for total number of users and total number of available PRBs among
Nc cooperative cells.
5.3.1.2 Energy consumption rate after bandwidth expansion
The relevant equations for the energy efficient scheme can be derived similar to (??):
ECij =βN0
(2R
Bij − 1
)RBijGij
+PS + Psp + Pbh
Rij, (5.11)
RBij =Rij
Bi, Rij = Rij , Bi = αiBi. (5.12)
According to (??), the overall energy consumption rate for an energy efficient scheme in each
TTI is given by:
EC =
(PS + Psp + Pbh) + βN∑i=1
M∑j=1
P TijCij
N∑i=1
M∑j=1
RijCij
. (5.13)
Subsequently, the transmitted power ratio of scheduled user i in each TTI is given as follows:
P TiP Ti
=αi(αi√
1 + γi − 1)
γi, (5.14)
5.3. Multi-Cell with CoMP 87
where P Ti and P Ti are transmitted power after and before bandwidth expansion, respectively.
According to the aforementioned equations, the required SINR of the scheduled user i in each
TTI after bandwidth expansion is derived:
γi =(αi√
1 + γi − 1), (5.15)
where γi and γi are the required SINR of user i in accordance with MCS level index after and
before bandwidth expansion, respectively.
According to (C.2), power consumption after expansion in each TTI is given as follows:
PC = βP T + PS + Psp + Pbh, (5.16)
where P T is the total transmit power after bandwidth expansion in each TTI over all PRBs,
when equal power is allocated to all users.
5.3.2 Optimisation Problem
The goal is to find an optimal way to assign vacant PRBs among multiple cells that contribute
in CoMP operation. We model this based on Multiple Choice Knapsack Problem (MCKP) by
modifying the constraint from binary to bounded.
In each cell i the number of available PRBs, number of available users, and number of vacant
PRBS are represented by Mi, Ni, and Zi, respectively. Load factor (ρ) which is the ratio of the
assigned PRBs to the total number of available PRBs. It shows that the bandwidth expansion
will occur while the value is less than one (ρ < 1).
Therefore, the optimisation problem in CoMP operation among Nc BSs by taking MCBKP
into consideration is expressed as follows:
maximiseN∑i=1
|Nc|∑j=1
1
ECijXij ≡ minimise
n∑i=1
|Nc|∑j=1
ECijXij ,
subject to:n∑i=1
|Nc|∑j=1
WijXij ≤ αm/γmin, (5.17)
0 ≤ Xij ≤ bij , (i = 1, .., N), (j = 1, .., Nc)
Xij : integer,
88 Chapter 5. Novel Energy Efficient and QoS Aware Resource Block Allocation Algorithms
in OFDMA Systems with CoMP
whereN and αm stand for total number of users in all cooperated cells and number of available
surplus PRBs (M−N) in each cell. The problem is NP-hard and can be solved with a dynamic
programming approach or a greedy algorithm. In dynamic programming, problem breaks down
into recurring small subproblems and algorithm finds solutions to subproblems and stores them
in memory for later use. Greedy algorithm sorts the items in descending order of profit per
weight then proceeds to insert them into the knapsack until there is no longer space in the
knapsack.
5.3.3 Proposed solutions
In multi-cell CoMP scenario, two greedy algorithms, Algorithm 2 and 3, are proposed which
find near-optimal and optimal solution for the problem. In Algorithm 2, not only the SINR is
taken into account for resource allocation (same as N-CoMP) but also the load factor of cells
contributing to the CoMP operation are considered. In fact, if there are cells with full load
factor, they are excluded from the process of bandwidth expansion. Fig. 5.3 and Algorithm
2 show the process of obtaining sub optimal solution for bandwidth expansion coefficient in
Multi-cell CoMP operation.
On the contrary to Algorithm 2, Algorithm 3 does not consider load factor of cooperative cells
for finding the optimal solution. In other words, it tries to find an optimal solution by preparing
cooperation among all the contributed cells regardless of their load situation and distributes
the vacant PRBs among the users of all the coordinated cells. Fig. 5.4 and Algorithm 3 show
the process of obtaining an optimal solution for bandwidth expansion coefficient in Multi-cell
CoMP operation.
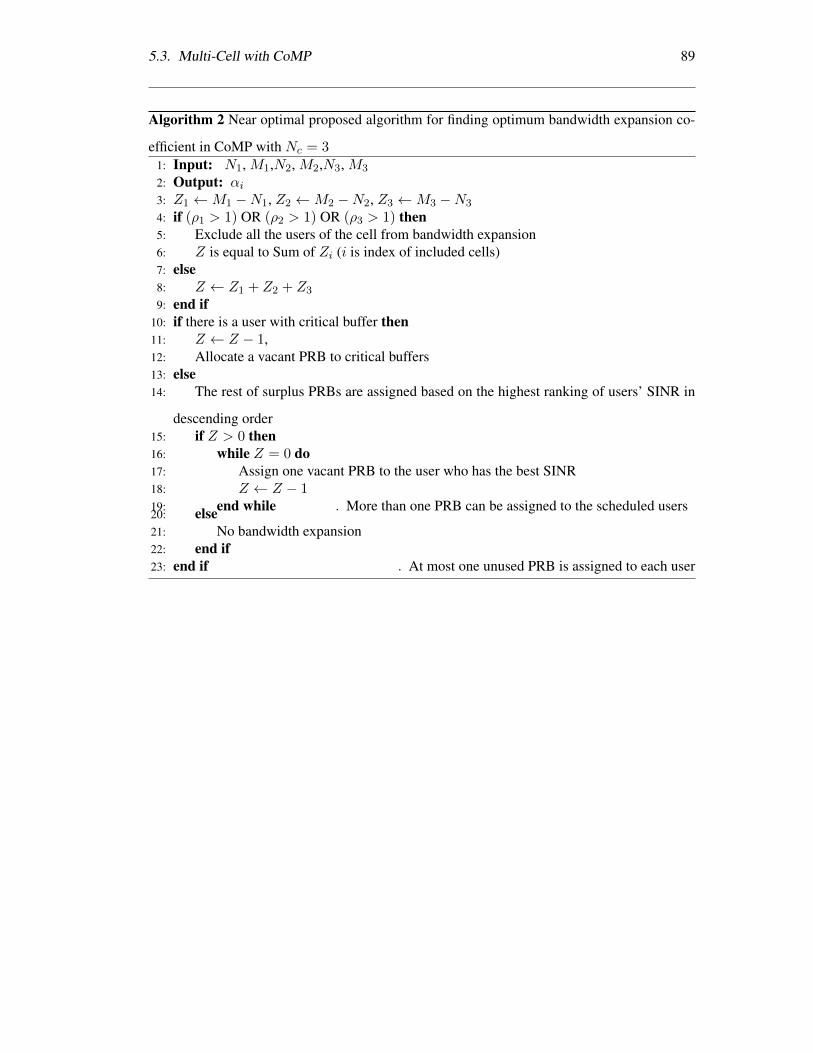
5.3. Multi-Cell with CoMP 89
Algorithm 2 Near optimal proposed algorithm for finding optimum bandwidth expansion co-
efficient in CoMP with Nc = 31: Input: N1, M1,N2, M2,N3, M3
2: Output: αi3: Z1 ←M1 −N1, Z2 ←M2 −N2, Z3 ←M3 −N3
4: if (ρ1 > 1) OR (ρ2 > 1) OR (ρ3 > 1) then5: Exclude all the users of the cell from bandwidth expansion6: Z is equal to Sum of Zi (i is index of included cells)7: else8: Z ← Z1 + Z2 + Z3
9: end if10: if there is a user with critical buffer then11: Z ← Z − 1,12: Allocate a vacant PRB to critical buffers13: else14: The rest of surplus PRBs are assigned based on the highest ranking of users’ SINR in
descending order15: if Z > 0 then16: while Z = 0 do17: Assign one vacant PRB to the user who has the best SINR18: Z ← Z − 119: end while . More than one PRB can be assigned to the scheduled users20: else21: No bandwidth expansion22: end if23: end if . At most one unused PRB is assigned to each user
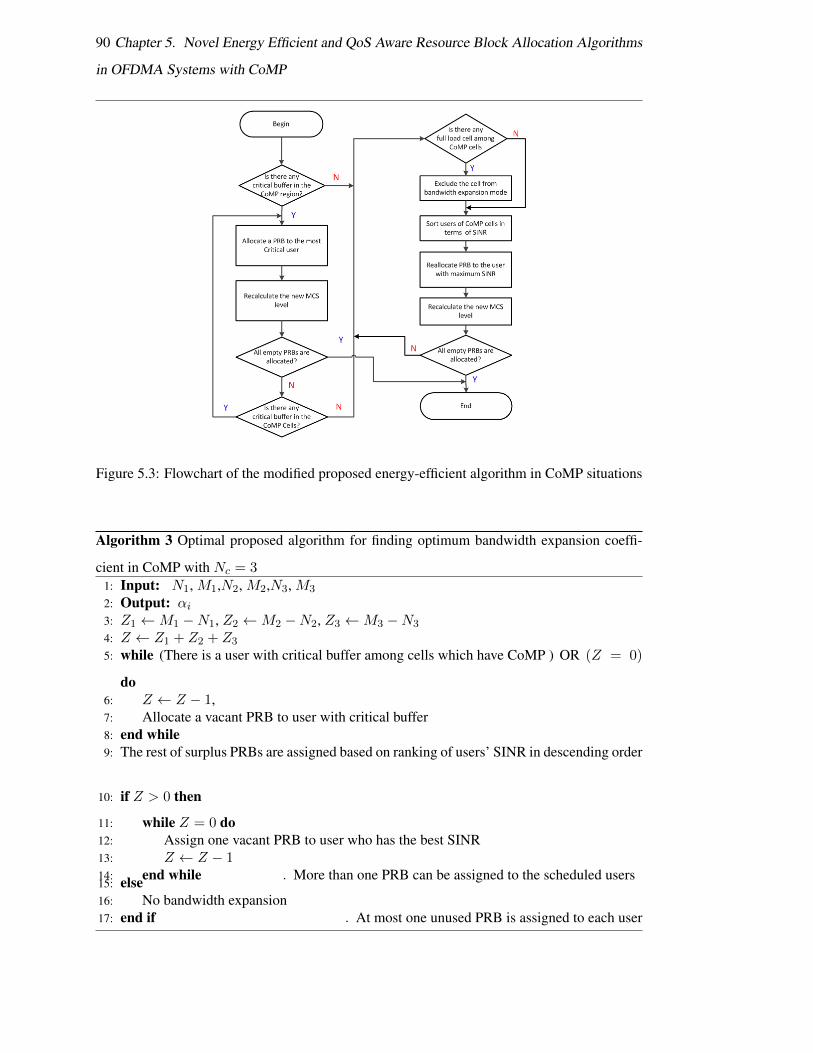
90 Chapter 5. Novel Energy Efficient and QoS Aware Resource Block Allocation Algorithms
in OFDMA Systems with CoMP
Figure 5.3: Flowchart of the modified proposed energy-efficient algorithm in CoMP situations
Algorithm 3 Optimal proposed algorithm for finding optimum bandwidth expansion coeffi-
cient in CoMP with Nc = 31: Input: N1, M1,N2, M2,N3, M3
2: Output: αi3: Z1 ←M1 −N1, Z2 ←M2 −N2, Z3 ←M3 −N3
4: Z ← Z1 + Z2 + Z3
5: while (There is a user with critical buffer among cells which have CoMP ) OR (Z = 0)
do6: Z ← Z − 1,7: Allocate a vacant PRB to user with critical buffer8: end while9: The rest of surplus PRBs are assigned based on ranking of users’ SINR in descending order
10: if Z > 0 then
11: while Z = 0 do12: Assign one vacant PRB to user who has the best SINR13: Z ← Z − 114: end while . More than one PRB can be assigned to the scheduled users15: else16: No bandwidth expansion17: end if . At most one unused PRB is assigned to each user

5.4. Complexity Analysis 91
Figure 5.4: Flowchart of the modified proposed energy-efficient algorithm in CoMP situations
5.4 Complexity Analysis
According to the complexity analysis of single-cell scenario in [76], in the proposed heuristic
scheme, a function is run to sort the users based on the received SINR, which is O[n*log(n)].
The proposed algorithm is also compared with an exhaustive search [106] to show the opti-
mality of the heuristic algorithm. It shows that an exhaustive search has a high computational
complexity O(2n), and its complexity also increases exponentially with the number of users,
whereas the proposed algorithms, lower the computational complexity. This complexity per-
sists in N-CoMP multi-cell scenario which is executed in each individual cell. In CoMP op-
eration, this complexity is modified to O[N*log(N )], where N is the transformed number of
total users of all cells that contribute in CoMP operation.
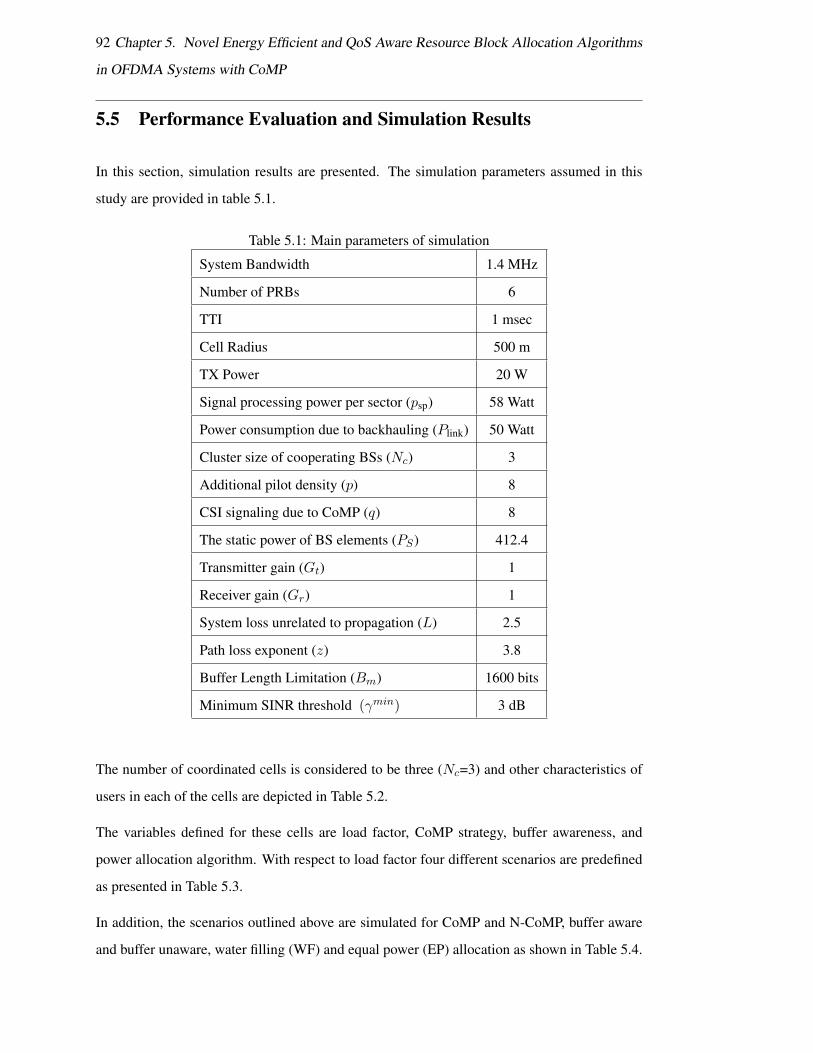
92 Chapter 5. Novel Energy Efficient and QoS Aware Resource Block Allocation Algorithms
in OFDMA Systems with CoMP
5.5 Performance Evaluation and Simulation Results
In this section, simulation results are presented. The simulation parameters assumed in this
study are provided in table 5.1.
Table 5.1: Main parameters of simulation
System Bandwidth 1.4 MHz
Number of PRBs 6
TTI 1 msec
Cell Radius 500 m
TX Power 20 W
Signal processing power per sector (psp) 58 Watt
Power consumption due to backhauling (Plink) 50 Watt
Cluster size of cooperating BSs (Nc) 3
Additional pilot density (p) 8
CSI signaling due to CoMP (q) 8
The static power of BS elements (PS) 412.4
Transmitter gain (Gt) 1
Receiver gain (Gr) 1
System loss unrelated to propagation (L) 2.5
Path loss exponent (z) 3.8
Buffer Length Limitation (Bm) 1600 bits
Minimum SINR threshold (γmin) 3 dB
The number of coordinated cells is considered to be three (Nc=3) and other characteristics of
users in each of the cells are depicted in Table 5.2.
The variables defined for these cells are load factor, CoMP strategy, buffer awareness, and
power allocation algorithm. With respect to load factor four different scenarios are predefined
as presented in Table 5.3.
In addition, the scenarios outlined above are simulated for CoMP and N-CoMP, buffer aware
and buffer unaware, water filling (WF) and equal power (EP) allocation as shown in Table 5.4.
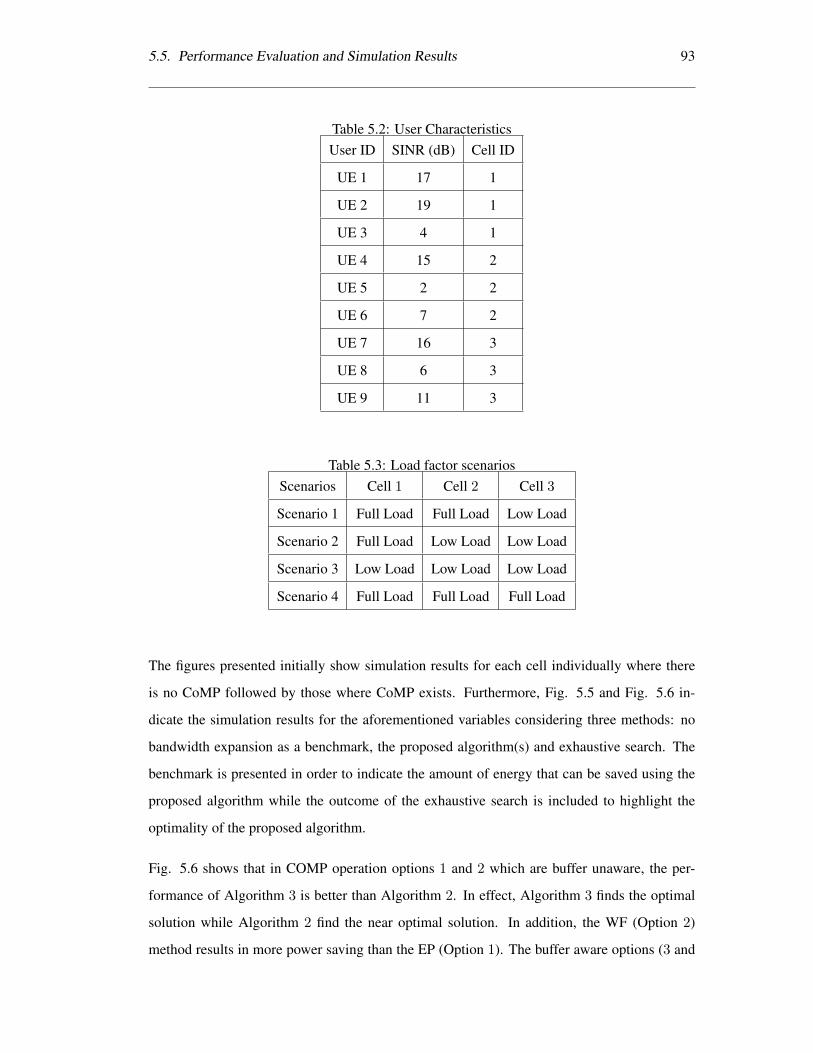
5.5. Performance Evaluation and Simulation Results 93
Table 5.2: User CharacteristicsUser ID SINR (dB) Cell ID
UE 1 17 1
UE 2 19 1
UE 3 4 1
UE 4 15 2
UE 5 2 2
UE 6 7 2
UE 7 16 3
UE 8 6 3
UE 9 11 3
Table 5.3: Load factor scenariosScenarios Cell 1 Cell 2 Cell 3
Scenario 1 Full Load Full Load Low Load
Scenario 2 Full Load Low Load Low Load
Scenario 3 Low Load Low Load Low Load
Scenario 4 Full Load Full Load Full Load
The figures presented initially show simulation results for each cell individually where there
is no CoMP followed by those where CoMP exists. Furthermore, Fig. 5.5 and Fig. 5.6 in-
dicate the simulation results for the aforementioned variables considering three methods: no
bandwidth expansion as a benchmark, the proposed algorithm(s) and exhaustive search. The
benchmark is presented in order to indicate the amount of energy that can be saved using the
proposed algorithm while the outcome of the exhaustive search is included to highlight the
optimality of the proposed algorithm.
Fig. 5.6 shows that in COMP operation options 1 and 2 which are buffer unaware, the per-
formance of Algorithm 3 is better than Algorithm 2. In effect, Algorithm 3 finds the optimal
solution while Algorithm 2 find the near optimal solution. In addition, the WF (Option 2)
method results in more power saving than the EP (Option 1). The buffer aware options (3 and
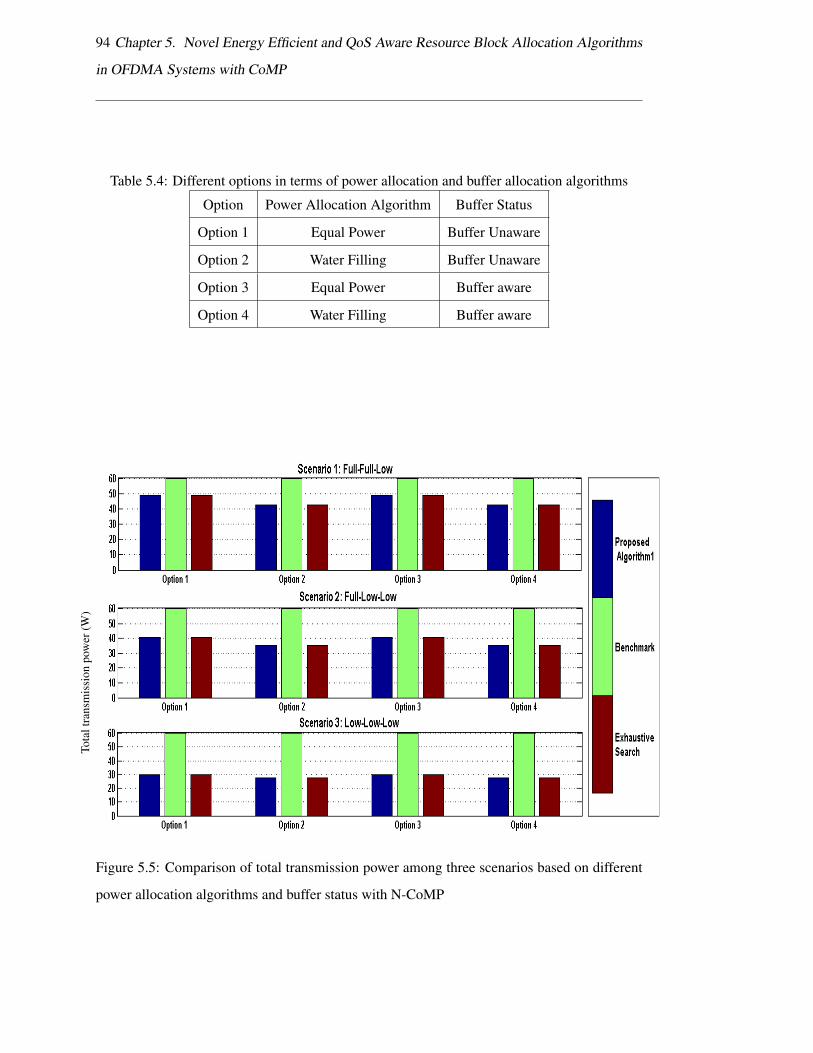
94 Chapter 5. Novel Energy Efficient and QoS Aware Resource Block Allocation Algorithms
in OFDMA Systems with CoMP
Table 5.4: Different options in terms of power allocation and buffer allocation algorithms
Option Power Allocation Algorithm Buffer Status
Option 1 Equal Power Buffer Unaware
Option 2 Water Filling Buffer Unaware
Option 3 Equal Power Buffer aware
Option 4 Water Filling Buffer aware
Tota
ltra
nsm
issi
onpo
wer
(W)
Figure 5.5: Comparison of total transmission power among three scenarios based on different
power allocation algorithms and buffer status with N-CoMP
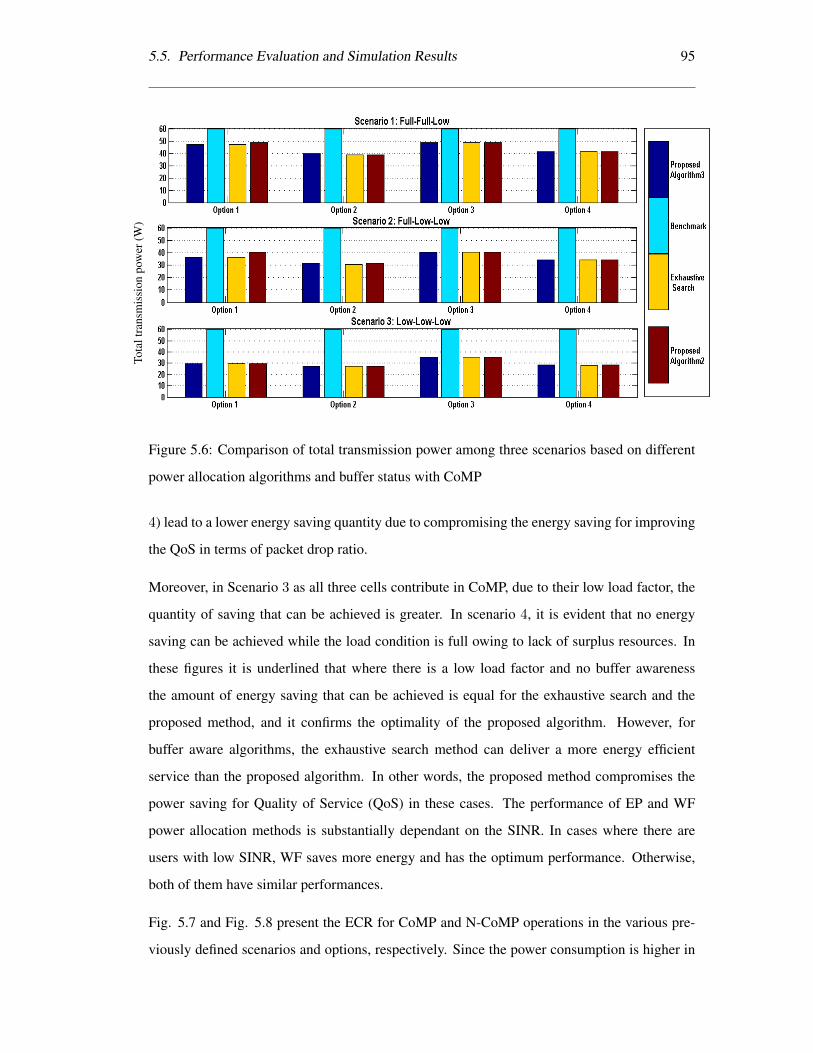
5.5. Performance Evaluation and Simulation Results 95
Tota
ltra
nsm
issi
onpo
wer
(W)
Figure 5.6: Comparison of total transmission power among three scenarios based on different
power allocation algorithms and buffer status with CoMP
4) lead to a lower energy saving quantity due to compromising the energy saving for improving
the QoS in terms of packet drop ratio.
Moreover, in Scenario 3 as all three cells contribute in CoMP, due to their low load factor, the
quantity of saving that can be achieved is greater. In scenario 4, it is evident that no energy
saving can be achieved while the load condition is full owing to lack of surplus resources. In
these figures it is underlined that where there is a low load factor and no buffer awareness
the amount of energy saving that can be achieved is equal for the exhaustive search and the
proposed method, and it confirms the optimality of the proposed algorithm. However, for
buffer aware algorithms, the exhaustive search method can deliver a more energy efficient
service than the proposed algorithm. In other words, the proposed method compromises the
power saving for Quality of Service (QoS) in these cases. The performance of EP and WF
power allocation methods is substantially dependant on the SINR. In cases where there are
users with low SINR, WF saves more energy and has the optimum performance. Otherwise,
both of them have similar performances.
Fig. 5.7 and Fig. 5.8 present the ECR for CoMP and N-CoMP operations in the various pre-
viously defined scenarios and options, respectively. Since the power consumption is higher in
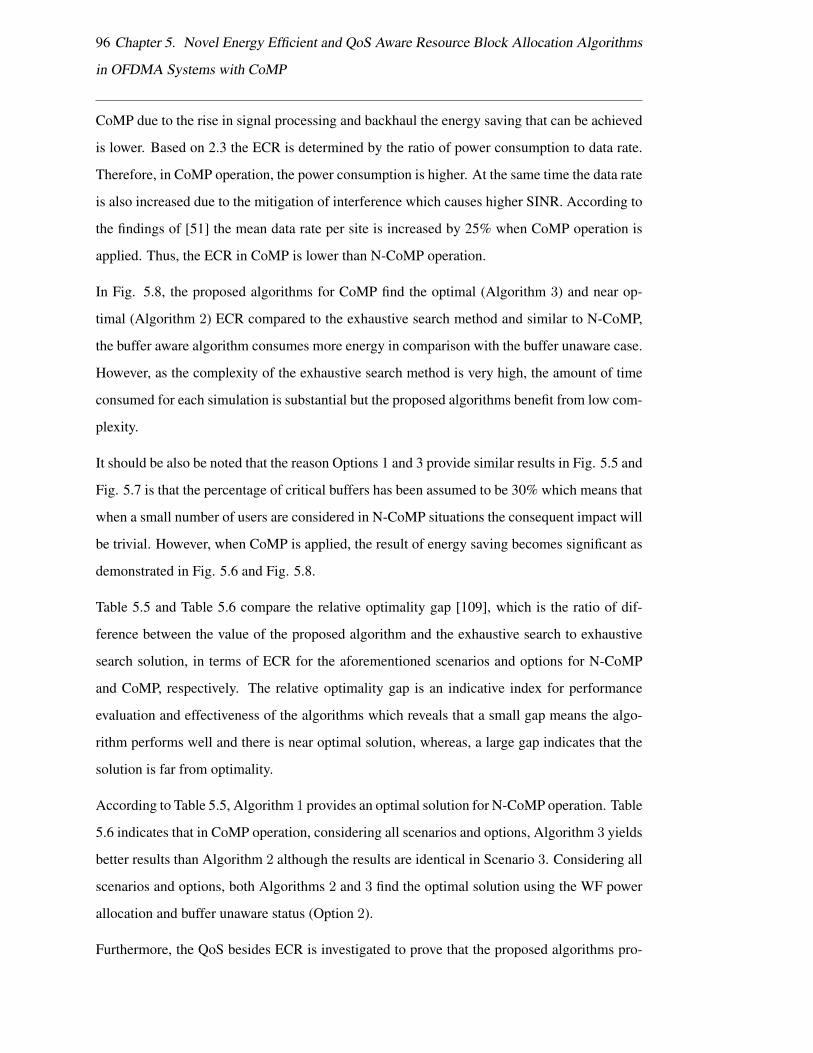
96 Chapter 5. Novel Energy Efficient and QoS Aware Resource Block Allocation Algorithms
in OFDMA Systems with CoMP
CoMP due to the rise in signal processing and backhaul the energy saving that can be achieved
is lower. Based on 2.3 the ECR is determined by the ratio of power consumption to data rate.
Therefore, in CoMP operation, the power consumption is higher. At the same time the data rate
is also increased due to the mitigation of interference which causes higher SINR. According to
the findings of [51] the mean data rate per site is increased by 25% when CoMP operation is
applied. Thus, the ECR in CoMP is lower than N-CoMP operation.
In Fig. 5.8, the proposed algorithms for CoMP find the optimal (Algorithm 3) and near op-
timal (Algorithm 2) ECR compared to the exhaustive search method and similar to N-CoMP,
the buffer aware algorithm consumes more energy in comparison with the buffer unaware case.
However, as the complexity of the exhaustive search method is very high, the amount of time
consumed for each simulation is substantial but the proposed algorithms benefit from low com-
plexity.
It should be also be noted that the reason Options 1 and 3 provide similar results in Fig. 5.5 and
Fig. 5.7 is that the percentage of critical buffers has been assumed to be 30% which means that
when a small number of users are considered in N-CoMP situations the consequent impact will
be trivial. However, when CoMP is applied, the result of energy saving becomes significant as
demonstrated in Fig. 5.6 and Fig. 5.8.
Table 5.5 and Table 5.6 compare the relative optimality gap [109], which is the ratio of dif-
ference between the value of the proposed algorithm and the exhaustive search to exhaustive
search solution, in terms of ECR for the aforementioned scenarios and options for N-CoMP
and CoMP, respectively. The relative optimality gap is an indicative index for performance
evaluation and effectiveness of the algorithms which reveals that a small gap means the algo-
rithm performs well and there is near optimal solution, whereas, a large gap indicates that the
solution is far from optimality.
According to Table 5.5, Algorithm 1 provides an optimal solution for N-CoMP operation. Table
5.6 indicates that in CoMP operation, considering all scenarios and options, Algorithm 3 yields
better results than Algorithm 2 although the results are identical in Scenario 3. Considering all
scenarios and options, both Algorithms 2 and 3 find the optimal solution using the WF power
allocation and buffer unaware status (Option 2).
Furthermore, the QoS besides ECR is investigated to prove that the proposed algorithms pro-
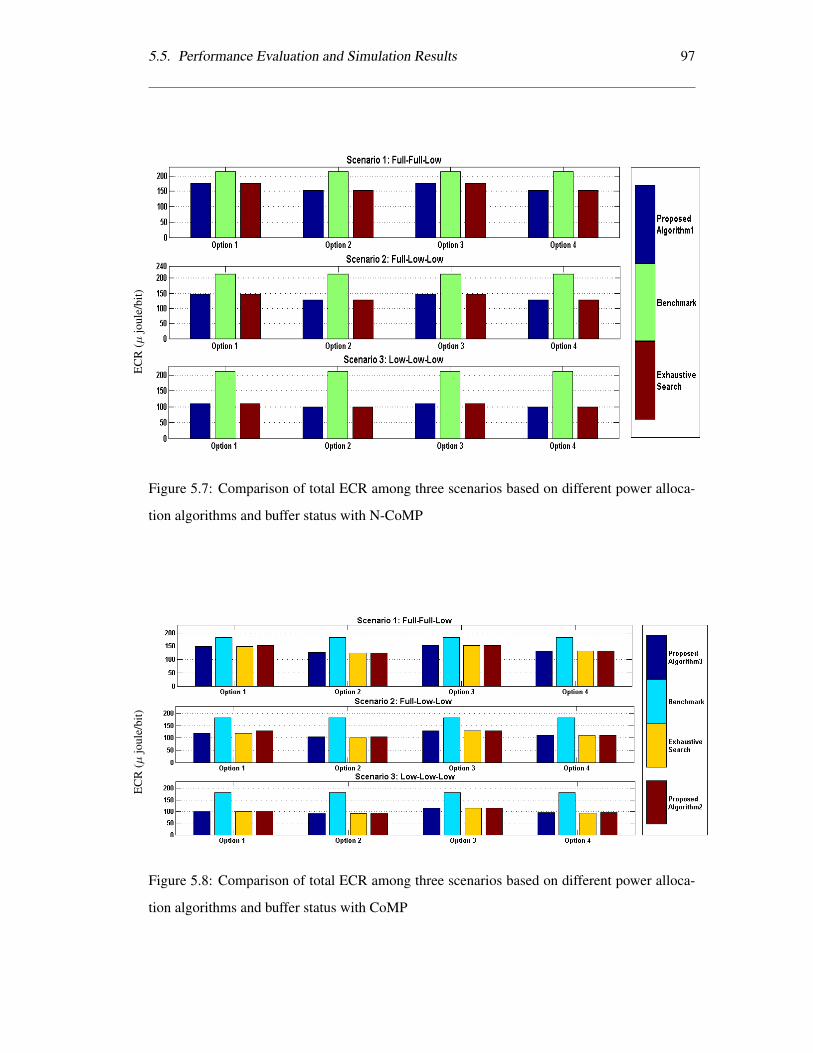
5.5. Performance Evaluation and Simulation Results 97
EC
R(µ
joul
e/bi
t)
Figure 5.7: Comparison of total ECR among three scenarios based on different power alloca-
tion algorithms and buffer status with N-CoMP
EC
R(µ
joul
e/bi
t)
Figure 5.8: Comparison of total ECR among three scenarios based on different power alloca-
tion algorithms and buffer status with CoMP
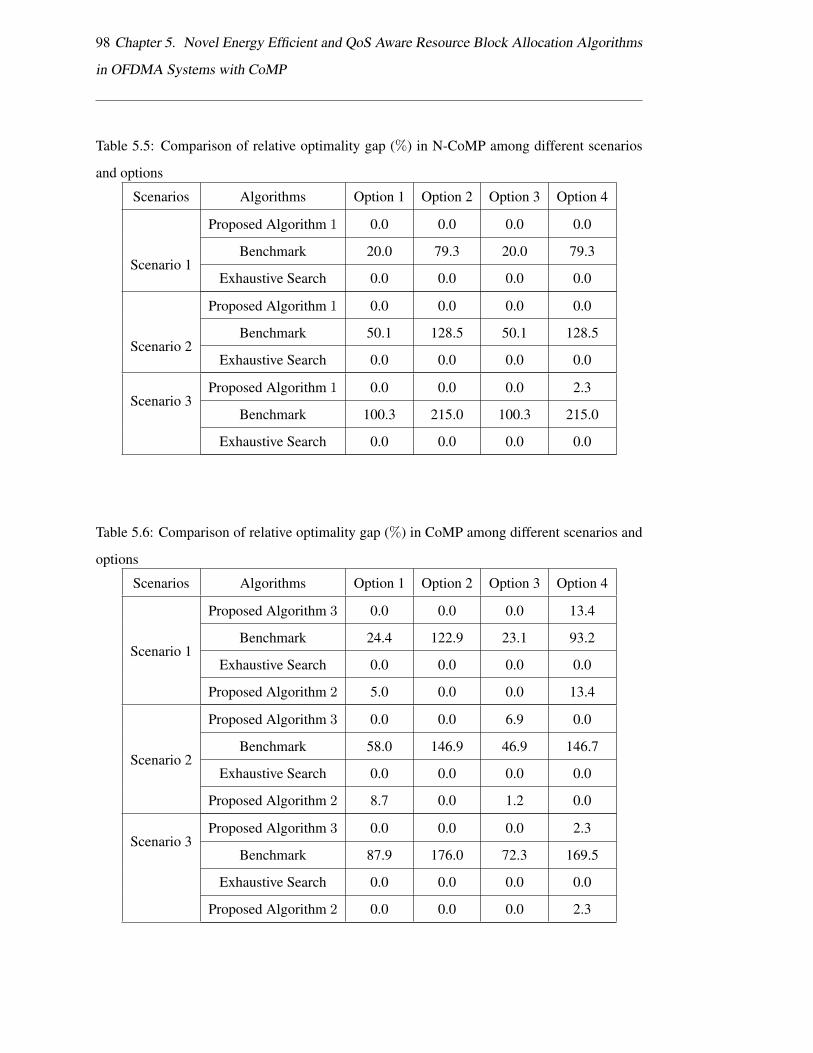
98 Chapter 5. Novel Energy Efficient and QoS Aware Resource Block Allocation Algorithms
in OFDMA Systems with CoMP
Table 5.5: Comparison of relative optimality gap (%) in N-CoMP among different scenarios
and options
Scenarios Algorithms Option 1 Option 2 Option 3 Option 4
Scenario 1
Proposed Algorithm 1 0.0 0.0 0.0 0.0
Benchmark 20.0 79.3 20.0 79.3
Exhaustive Search 0.0 0.0 0.0 0.0
Scenario 2
Proposed Algorithm 1 0.0 0.0 0.0 0.0
Benchmark 50.1 128.5 50.1 128.5
Exhaustive Search 0.0 0.0 0.0 0.0
Scenario 3Proposed Algorithm 1 0.0 0.0 0.0 2.3
Benchmark 100.3 215.0 100.3 215.0
Exhaustive Search 0.0 0.0 0.0 0.0
Table 5.6: Comparison of relative optimality gap (%) in CoMP among different scenarios and
options
Scenarios Algorithms Option 1 Option 2 Option 3 Option 4
Scenario 1
Proposed Algorithm 3 0.0 0.0 0.0 13.4
Benchmark 24.4 122.9 23.1 93.2
Exhaustive Search 0.0 0.0 0.0 0.0
Proposed Algorithm 2 5.0 0.0 0.0 13.4
Scenario 2
Proposed Algorithm 3 0.0 0.0 6.9 0.0
Benchmark 58.0 146.9 46.9 146.7
Exhaustive Search 0.0 0.0 0.0 0.0
Proposed Algorithm 2 8.7 0.0 1.2 0.0
Scenario 3Proposed Algorithm 3 0.0 0.0 0.0 2.3
Benchmark 87.9 176.0 72.3 169.5
Exhaustive Search 0.0 0.0 0.0 0.0
Proposed Algorithm 2 0.0 0.0 0.0 2.3
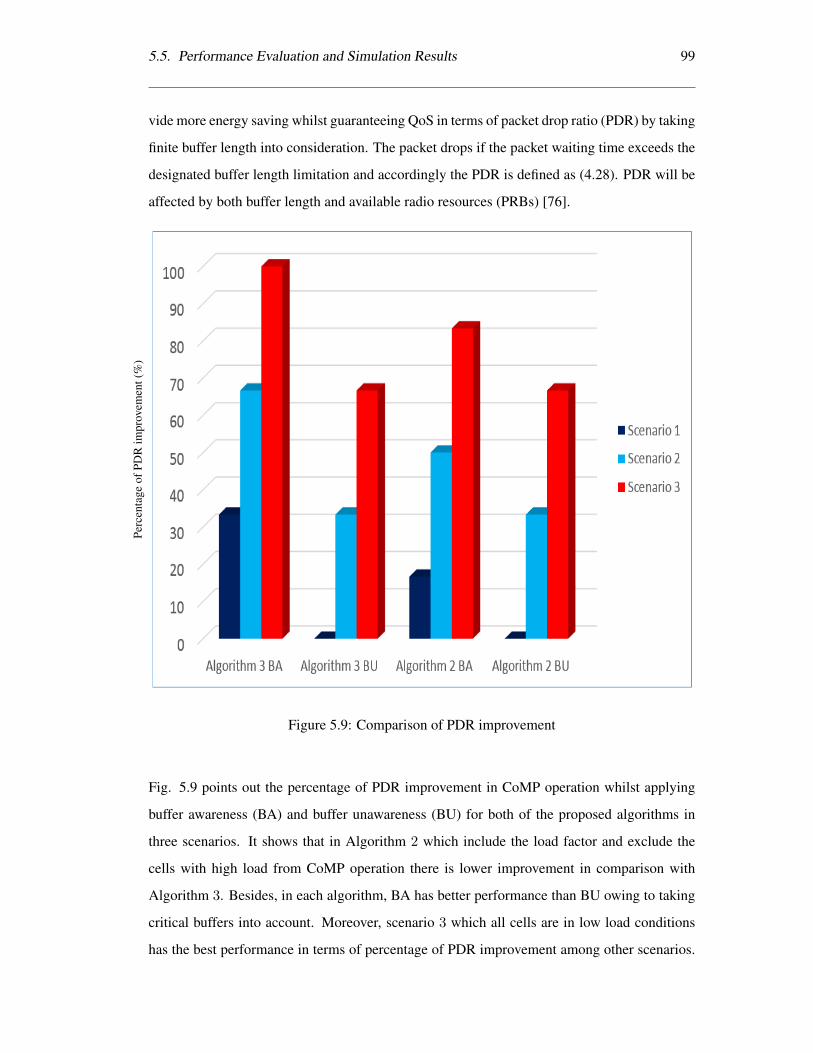
5.5. Performance Evaluation and Simulation Results 99
vide more energy saving whilst guaranteeing QoS in terms of packet drop ratio (PDR) by taking
finite buffer length into consideration. The packet drops if the packet waiting time exceeds the
designated buffer length limitation and accordingly the PDR is defined as (4.28). PDR will be
affected by both buffer length and available radio resources (PRBs) [76].
Perc
enta
geof
PDR
impr
ovem
ent(
%)
Figure 5.9: Comparison of PDR improvement
Fig. 5.9 points out the percentage of PDR improvement in CoMP operation whilst applying
buffer awareness (BA) and buffer unawareness (BU) for both of the proposed algorithms in
three scenarios. It shows that in Algorithm 2 which include the load factor and exclude the
cells with high load from CoMP operation there is lower improvement in comparison with
Algorithm 3. Besides, in each algorithm, BA has better performance than BU owing to taking
critical buffers into account. Moreover, scenario 3 which all cells are in low load conditions
has the best performance in terms of percentage of PDR improvement among other scenarios.
100 Chapter 5. Novel Energy Efficient and QoS Aware Resource Block Allocation
Algorithms in OFDMA Systems with CoMP
Therefore, the proposed algorithm with buffer awareness not only provides lower ECR but also
offers a better quality of service in terms of PDR.
5.6 Summary
This study aimed to find an optimum solution that can determine the bandwidth expansion co-
efficient in light traffic circumstances while minimising energy consumption as well as main-
taining QoS. Previously, an optimal algorithm was proposed for a single-cell scenario. This
was expanded in the current investigation to include multi-cell scenarios. The simulation re-
sults and performance analysis confirm that the optimality of the previous solution is still valid
in multi-cell scenarios with N-CoMP operation. However, the solution was modified in order
to achieve optimality in CoMP operation by introducing two new algorithms which include
(Algorithm 2) and exclude (Algorithm 3) the load factor of the cells involved in CoMP opera-
tion. The exhaustive search method was employed to compare the performance of the proposed
algorithms and it confirms that the proposed algorithm (Algorithm 3) has optimal performance
in CoMP operation as well.
Additionally, these algorithms benefit from buffer awareness to grant a high level of QoS in
terms of packet drop ratio. Simulation results and performance evaluation highlight that the
proposed algorithms provide a near optimal (Algorithm 2) and optimal (Algorithm 3) solu-
tion for the bandwidth expansion coefficient by minimising ECR in CoMP operation whilst
benefiting from low complexity.
Chapter 6
Conclusion and Future Work
The predominant objective of this study was to propose a comprehensive energy efficient radio
resource management scheme that ensure QoS in light traffic scenarios. An innovative schedul-
ing scheme in OFDMA systems applied to the downlink of 3GPP LTE network was developed.
The scheme incorporates consideration of channel and buffer state in order to implement an
energy efficient scheduling for arrival packets while the drop rate remains constant.
6.1 Major Research Contributions
Firstly, the EE of three well known principal schedulers, namely, RR, BCQI, and PF for VoIP
traffic scheduling over an OFDMA system in low load situations was investigated. A novel
scheme was implemented on three principal schedulers as an example to reduce energy con-
sumption of the BS. This scheme can be applied to any other types of schedulers in order to
prevent wasting of the available resources in light traffic conditions while guaranteeing the
QoS in terms of packet drop ratio. The advantage of this scheme is that both buffer status and
energy consumption values besides the channel conditions are taken into account to serve the
empty resources in each TTI. According to the aforementioned results, by implementation of
the proposed scheme in the principal schedulers, and introducing the relevant energy efficient
schedulers (EERR, EEBCQI, EEPF), significant energy savings and superior performance dur-
ing low traffic situations are achieved.
101
102 Chapter 6. Conclusion and Future Work
Furthermore, this study aimed to find an optimum solution that can determine the bandwidth
expansion coefficient in light traffic circumstances while minimising energy consumption as
well as maintaining QoS. A novel scheme was proposed in light traffic situations to improve
energy consumption from the BS side in single cell scenario, and reduce packet drop ratio in the
downlink of OFDMA systems. The assignment of vacant PRBs is formulated as an optimisa-
tion problem, and solved by adopting the greedy BKP. Then, a heuristic algorithm is proposed
to find the near optimal solution according to insight on finding optimum values of α among
the scheduled users. The analytical and simulation results conclude that instead of assigning
more vacant PRBs to one user with the best SNR, it is better to sort users in terms of SNR,
then assign a vacant PRBS in turn to each scheduled user until all unused PRBs are utilised.
By applying the proposed scheme on two classic schedulers, two appropriate energy efficient
schedulers EEBCQI, and EEPF are introduced. Their performances in terms of EE and QoS
provision were compared. The proposed scheme by taking buffer status into account achieves
significant energy saving and superior performance during light traffic situations while guaran-
teeing the QoS. In addition, the proposed scheme benefits from low computational complexity
in comparison with the exhaustive search while achieving near optimal solution.
Finally, according to the algorithm which was proposed for single cell scenario, this was ex-
pected in the current investigation to include multi-cell scenarios. The simulation results and
performance analysis confirm that the optimality of the previous solution is still valid in multi-
cell scenarios with N-CoMP operation. However, the solution was modified in order to achieve
optimality in CoMP operation by introducing two new algorithms. The exhaustive search
method was acquired to prove the performance of the proposed algorithms. The proposed
algorithms benefit from buffer awareness to grant a high level of QoS in terms of packet drop
ratio. Simulation results and performance evaluation point out that the proposed algorithms
provide an optimal and near optimal solution for the bandwidth expansion coefficient while
minimising ECR in both CoMP and N-CoMP operations and benefiting from low complexity.
6.2 Future Work
Further development of resource allocation in OFDMA systems requires study of many criteria
in this concept. The following points are suggested for further improvement of the current
6.2. Future Work 103
status of research.
• The multi-cell modelling in this study is based upon consideration of macro sites. This
context can be further developed by considering micro, pico, femto sites in HetNet. Fur-
ther savings in terms of energy consumption are expected to be achieved since there
are more vacant resources to be allocated specifically when CoMP operation can be de-
ployed in HetNet, the proposed algorithm can lead to further energy saving. This would
be particularly appealing when there are a large number of resources to be allocated
availability of a high number of small sites. However, these savings must be quantified
which requires further modelling, analysis and optimisation.
• In the present study, single-input single-output (SISO) systems are employed. Hence,
considering the impact of single-input multiple-output (SIMO), multiple-input single-
output (MISO) and MIMO systems can provide a more realistic insight to the practical
application of the proposed algorithms. Additionally, investigation of the emerging 5G
technologies such as Massive-MIMO and beam-forming based on the proposed algo-
rithms can present a more comprehensive understanding of the optimality of the pro-
posed algorithms.
• The development of WiFi offloading techniques offers operators to further optimise their
RRA. Thus, in high traffic circumstances operators can transfer a proportion of their
traffic load to their previously installed WiFi networks leading to the availability of more
resources. The simultaneous implementation of the proposed algorithms in this study
along with the WiFi offloading capabilities can be worthwhile.
• According to emerging 5G technologies in wireless networks, finding solutions for power
and scheduling problems using the proposed algorithm to maximise system EE while
considering NOMA of each user in each smaller time slot can is an exciting prospect.
Moreover, given the capability of both fronthaul and access links to simultaneously use
millimeter wave (mmW) and centimeter wave (cmW) bands in 5G, a new horizon for
future research is presented considering the proposed algorithms for surplus resource
allocation in low load situations.

Appendix A
Algorithms for Single-Cell Scenario
Algorithm 4 Dynamic programming for transformation of BKP to 0-1 KP (Step 1)1: Input: N , M , γi, ECi
2: Output: n, γi, ECi3: Initialize n← 0, n← N , a← (M −N)
4: for i← 1 : n do
5: b← 0, k ← 1
6: repeat
7: if b+ k > a then
8: k = a− b
9: end if
10: n← n+ 1
11: ECi (n)← kECi
12: γi(n)← kγi
13: b← b+ k
14: k ← 2k
15: until b = a
16: end for
104
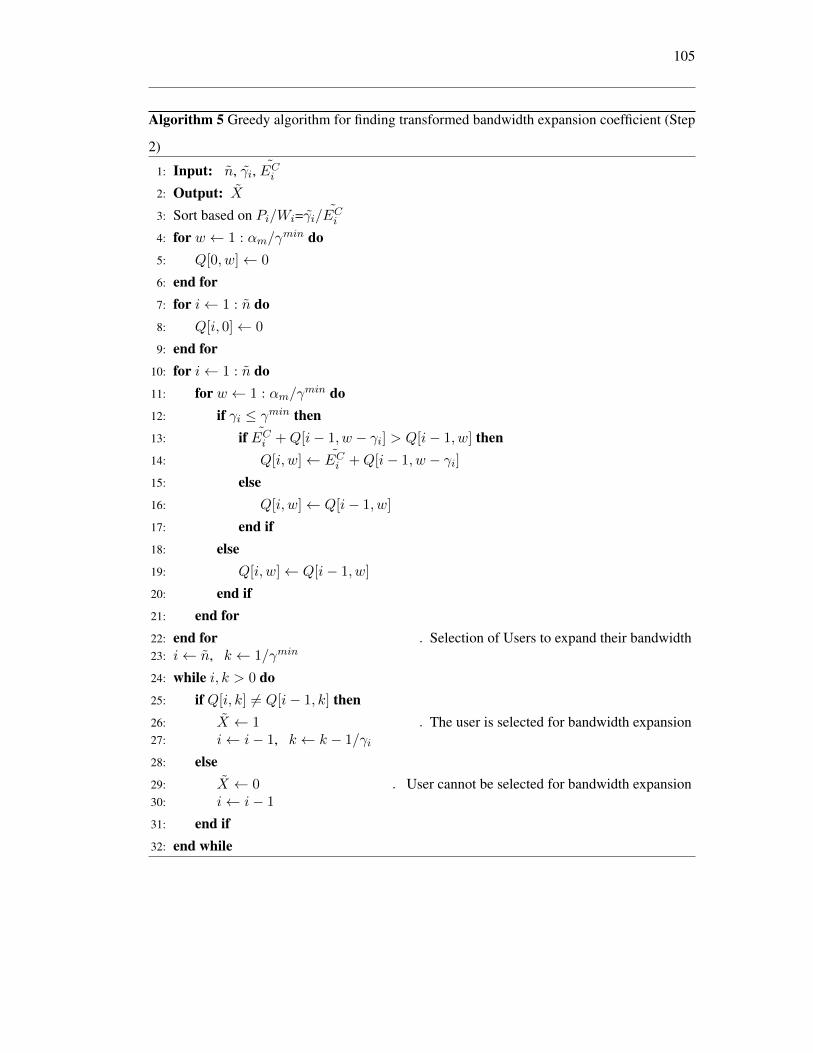
105
Algorithm 5 Greedy algorithm for finding transformed bandwidth expansion coefficient (Step
2)
1: Input: n, γi, ECi2: Output: X3: Sort based on Pi/Wi=γi/ECi4: for w ← 1 : αm/γ
min do5: Q[0, w]← 0
6: end for7: for i← 1 : n do8: Q[i, 0]← 0
9: end for10: for i← 1 : n do11: for w ← 1 : αm/γ
min do12: if γi ≤ γmin then13: if ECi +Q[i− 1, w − γi] > Q[i− 1, w] then14: Q[i, w]← ECi +Q[i− 1, w − γi]15: else16: Q[i, w]← Q[i− 1, w]
17: end if18: else19: Q[i, w]← Q[i− 1, w]
20: end if21: end for22: end for . Selection of Users to expand their bandwidth23: i← n, k ← 1/γmin
24: while i, k > 0 do25: if Q[i, k] 6= Q[i− 1, k] then26: X ← 1 . The user is selected for bandwidth expansion27: i← i− 1, k ← k − 1/γi
28: else29: X ← 0 . User cannot be selected for bandwidth expansion30: i← i− 1
31: end if32: end while
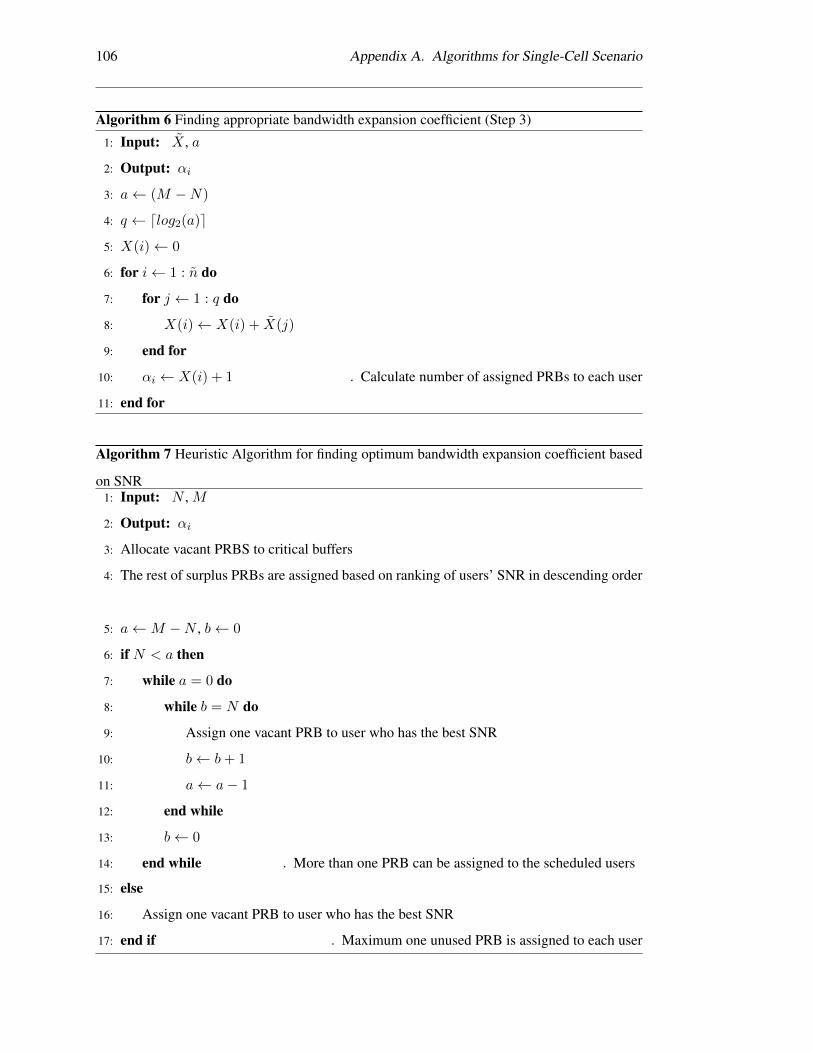
106 Appendix A. Algorithms for Single-Cell Scenario
Algorithm 6 Finding appropriate bandwidth expansion coefficient (Step 3)
1: Input: X , a
2: Output: αi
3: a← (M −N)
4: q ← dlog2(a)e
5: X(i)← 0
6: for i← 1 : n do
7: for j ← 1 : q do
8: X(i)← X(i) + X(j)
9: end for
10: αi ← X(i) + 1 . Calculate number of assigned PRBs to each user
11: end for
Algorithm 7 Heuristic Algorithm for finding optimum bandwidth expansion coefficient based
on SNR1: Input: N , M
2: Output: αi
3: Allocate vacant PRBS to critical buffers
4: The rest of surplus PRBs are assigned based on ranking of users’ SNR in descending order
5: a←M −N , b← 0
6: if N < a then
7: while a = 0 do
8: while b = N do
9: Assign one vacant PRB to user who has the best SNR
10: b← b+ 1
11: a← a− 1
12: end while
13: b← 0
14: end while . More than one PRB can be assigned to the scheduled users
15: else
16: Assign one vacant PRB to user who has the best SNR
17: end if . Maximum one unused PRB is assigned to each user
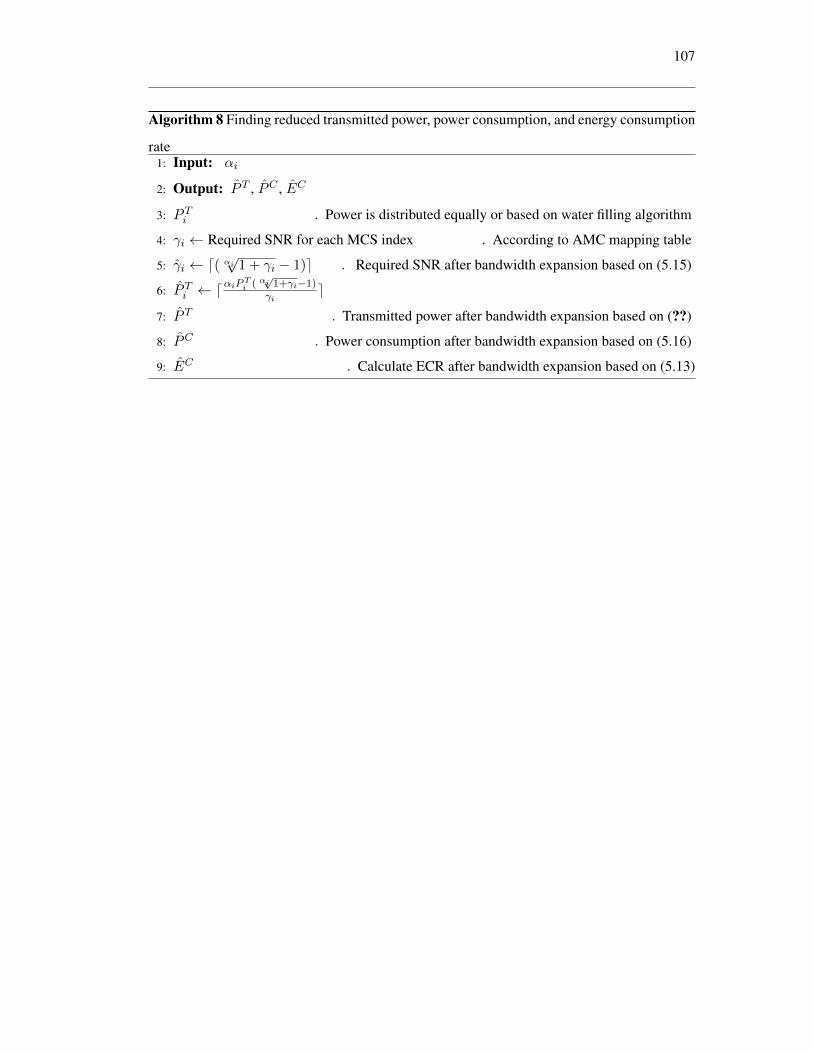
107
Algorithm 8 Finding reduced transmitted power, power consumption, and energy consumption
rate1: Input: αi
2: Output: P T , PC , EC
3: P Ti . Power is distributed equally or based on water filling algorithm
4: γi ← Required SNR for each MCS index . According to AMC mapping table
5: γi ← d( αi√
1 + γi − 1)e . Required SNR after bandwidth expansion based on (5.15)
6: P Ti ← dαiP
Ti ( αi√1+γi−1)
γie
7: P T . Transmitted power after bandwidth expansion based on (??)
8: PC . Power consumption after bandwidth expansion based on (5.16)
9: EC . Calculate ECR after bandwidth expansion based on (5.13)
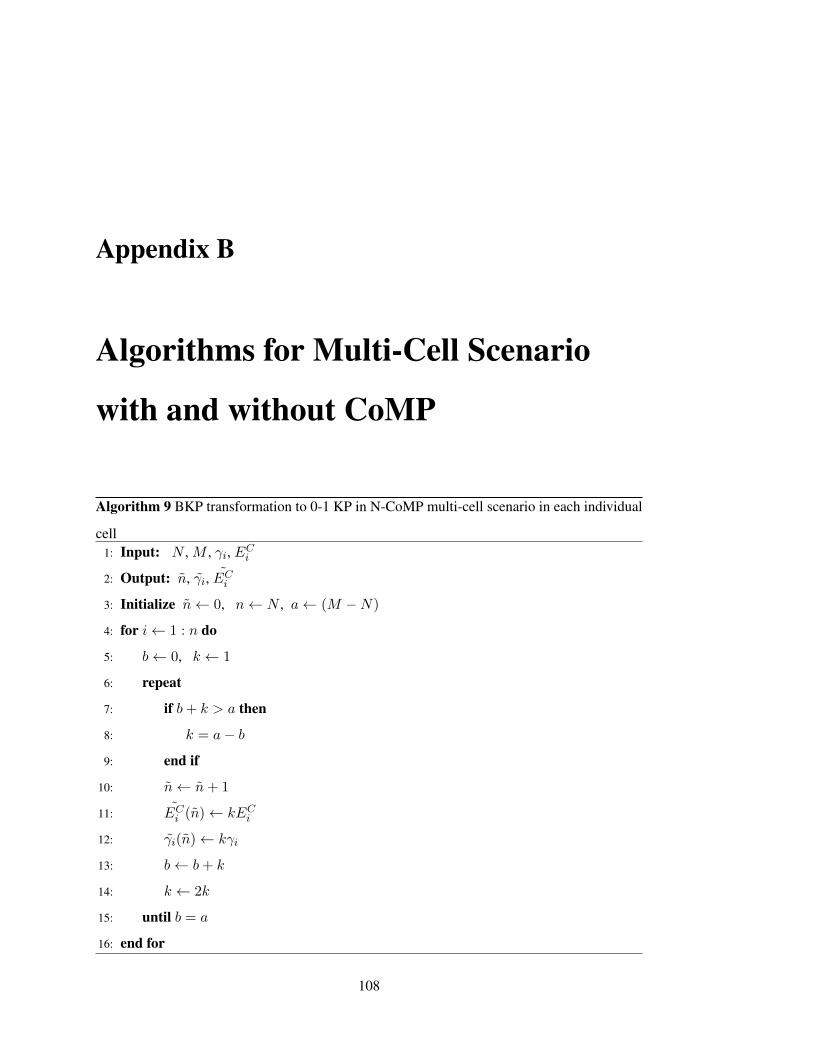
Appendix B
Algorithms for Multi-Cell Scenario
with and without CoMP
Algorithm 9 BKP transformation to 0-1 KP in N-CoMP multi-cell scenario in each individual
cell1: Input: N , M , γi, ECi
2: Output: n, γi, ECi3: Initialize n← 0, n← N , a← (M −N)
4: for i← 1 : n do
5: b← 0, k ← 1
6: repeat
7: if b+ k > a then
8: k = a− b
9: end if
10: n← n+ 1
11: ECi (n)← kECi
12: γi(n)← kγi
13: b← b+ k
14: k ← 2k
15: until b = a
16: end for
108
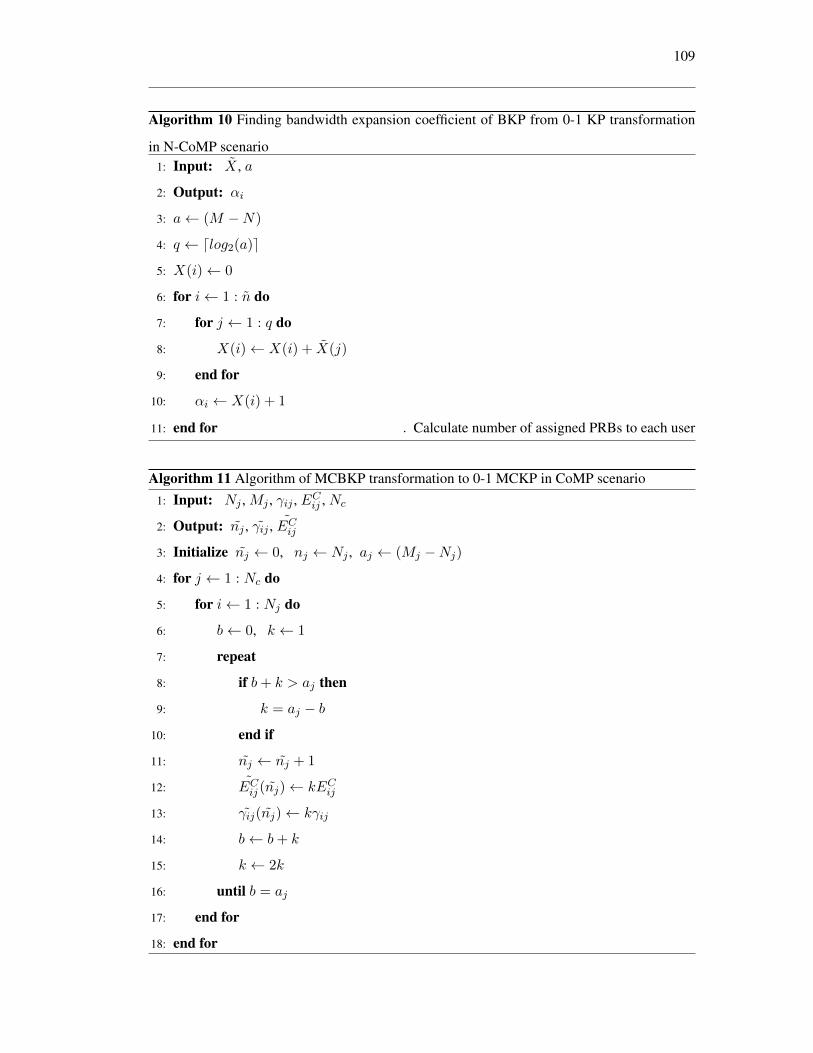
109
Algorithm 10 Finding bandwidth expansion coefficient of BKP from 0-1 KP transformation
in N-CoMP scenario1: Input: X , a
2: Output: αi
3: a← (M −N)
4: q ← dlog2(a)e
5: X(i)← 0
6: for i← 1 : n do
7: for j ← 1 : q do
8: X(i)← X(i) + X(j)
9: end for
10: αi ← X(i) + 1
11: end for . Calculate number of assigned PRBs to each user
Algorithm 11 Algorithm of MCBKP transformation to 0-1 MCKP in CoMP scenario1: Input: Nj , Mj , γij , ECij , Nc
2: Output: nj , γij , ECij3: Initialize nj ← 0, nj ← Nj , aj ← (Mj −Nj)
4: for j ← 1 : Nc do
5: for i← 1 : Nj do
6: b← 0, k ← 1
7: repeat
8: if b+ k > aj then
9: k = aj − b
10: end if
11: nj ← nj + 1
12: ECij (nj)← kECij
13: γij(nj)← kγij
14: b← b+ k
15: k ← 2k
16: until b = aj
17: end for
18: end for

110 Appendix B. Algorithms for Multi-Cell Scenario with and without CoMP
Algorithm 12 Finding bandwidth expansion coefficient of MCBKP from 0-1 MCKP transfor-
mation in CoMP scenario1: Input: Xij , aj , Nc
2: Output: αij
3: for j ← 1 : Nc do
4: q ← dlog2(aj)e
5: X(ij)← 0
6: for i← 1 : nj do
7: for k ← 1 : q do
8: X(ij)← X(ij) + X(k)
9: end for
10: αij ← X(ij) + 1
11: end for
12: end for . Calculate number of assigned PRBs to each user
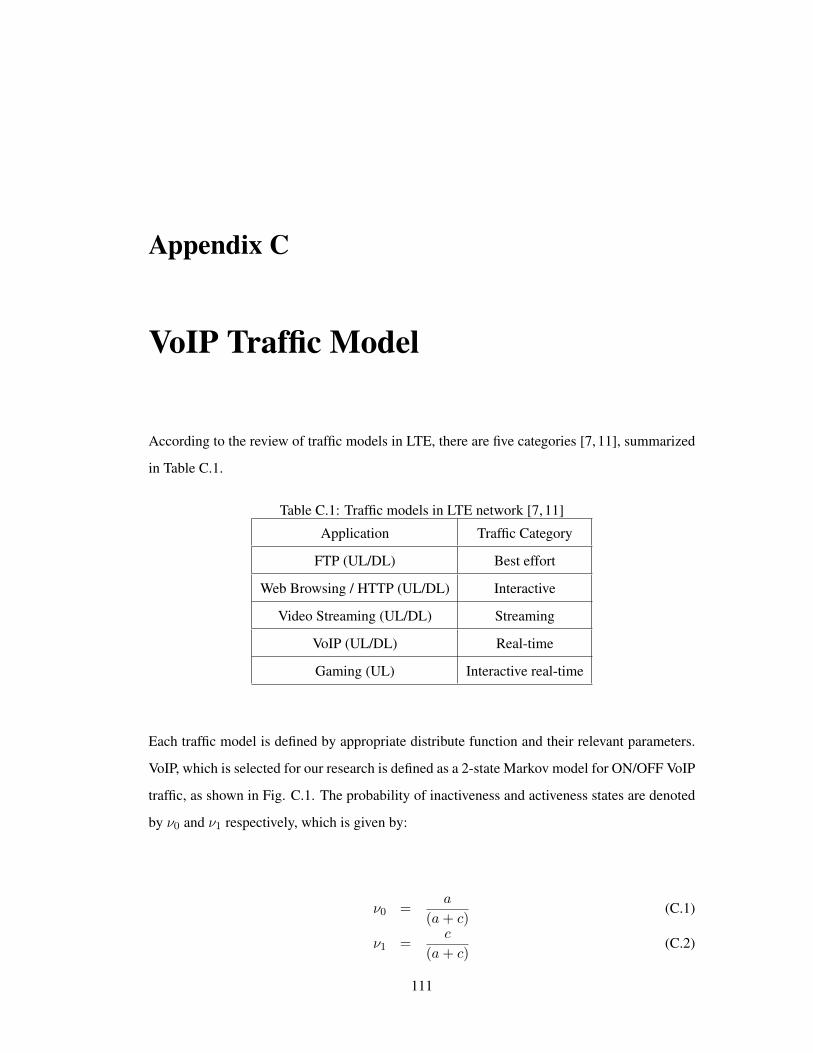
Appendix C
VoIP Traffic Model
According to the review of traffic models in LTE, there are five categories [7, 11], summarized
in Table C.1.
Table C.1: Traffic models in LTE network [7, 11]
Application Traffic Category
FTP (UL/DL) Best effort
Web Browsing / HTTP (UL/DL) Interactive
Video Streaming (UL/DL) Streaming
VoIP (UL/DL) Real-time
Gaming (UL) Interactive real-time
Each traffic model is defined by appropriate distribute function and their relevant parameters.
VoIP, which is selected for our research is defined as a 2-state Markov model for ON/OFF VoIP
traffic, as shown in Fig. C.1. The probability of inactiveness and activeness states are denoted
by ν0 and ν1 respectively, which is given by:
ν0 =a
(a+ c)(C.1)
ν1 =c
(a+ c)(C.2)
111
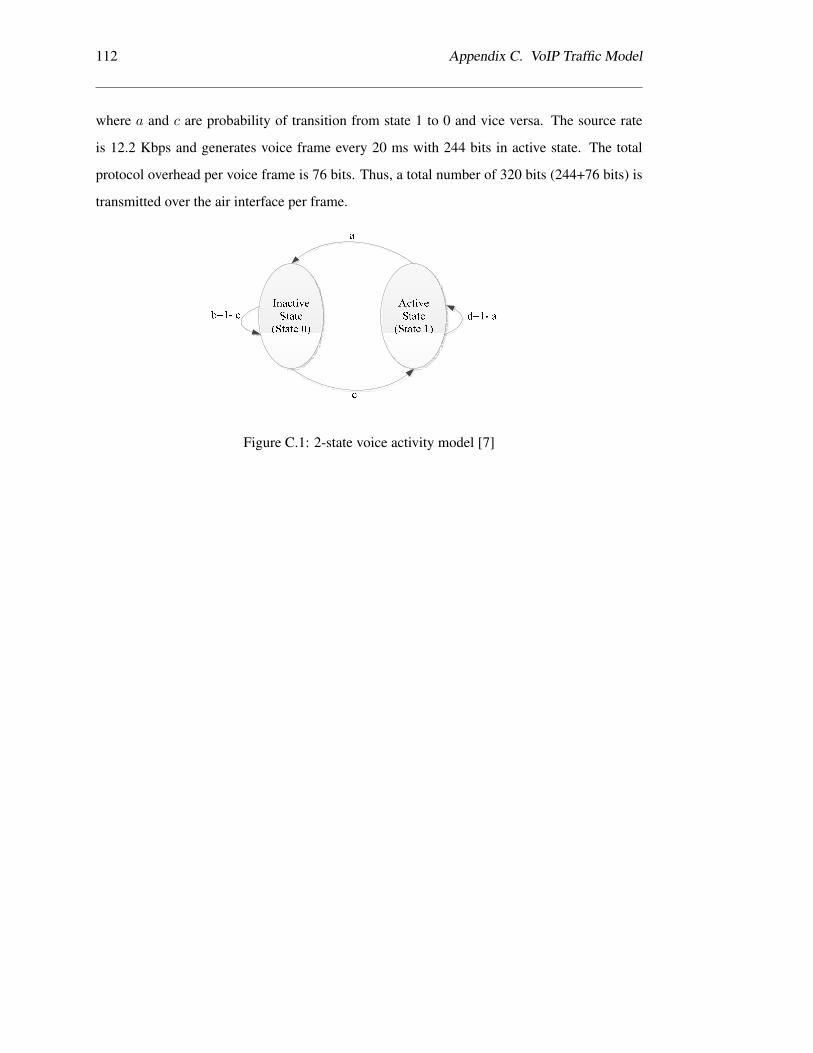
112 Appendix C. VoIP Traffic Model
where a and c are probability of transition from state 1 to 0 and vice versa. The source rate
is 12.2 Kbps and generates voice frame every 20 ms with 244 bits in active state. The total
protocol overhead per voice frame is 76 bits. Thus, a total number of 320 bits (244+76 bits) is
transmitted over the air interface per frame.
Figure C.1: 2-state voice activity model [7]
Bibliography
[1] Energy Aware Radio and NeTwork TecHnologies (EARTH) Project. online at: https:
//www.ict-earth.eu/ [Accessed:2013].
[2] Z. Hasan, H. Boostanimehr, and V.K. Bhargava. Green Cellular Networks: A Sur-
vey, Some Research Issues and Challenges. Communications Surveys Tutorials, IEEE,
13(4):524–540, 2011.
[3] Green Power for Mobile, GSMA, Community Power Using Mo-
bile to Extend the Grid. online at: http://www.gsma.com/
mobilefordevelopment/wp-content/uploads/2012/05/
Community-Power-Using-Mobile-to-Extend-the-Grid-January-2010.
pdf.
[4] D. Feng, C. Jiang, G. Lim, L. J. Cimini, G. Feng, and G. Y. Li. A survey of
energy-efficient wireless communications. IEEE Communications Surveys Tutorials,
15(1):167–178, First 2013.
[5] H.K. Boyapati, R.V.R. Kumar, and S. Chakrabarti. Energy consumption assessment
in LTE baseband of eNodeB and guidelines for green baseband subsystems. In India
Conference (INDICON), 2010 Annual IEEE, pages 1 –4, dec. 2010.
[6] Andrea Goldsmith and Anas Nin. Wireless Communications, year = 2005.
[7] 3GPP TSG-RAN1 #48 R1-070674. LTE physical layer framework for performance
verification. Technical report, 2007.
[8] O. Arnold, F. Richter, G. Fettweis, and O. Blume. Power consumption modeling of
113
114 Bibliography
different base station types in heterogeneous cellular networks. In Future Network and
Mobile Summit, 2010, pages 1 –8, june 2010.
[9] M A Imran and Project Partners. Energy efficiency analysis of the reference sys-
tems, areas of improvements and target breakdown. Technical report, 2011. online
at: https://bscw.ict-earth.eu/pub/bscw.cgi/d31515/EARTH_WP2_
D2.3.pdf [Accessed:2016].
[10] 3GPP TS 136.213 . LTE; Evolved Universal Terrestrial Radio Access (E-UTRA);
Physical layer procedures (3GPP TS 36.213 version 8.8.0 Release 8). online at:
urlwww.etsi.org/deliver/etsi-ts/ts-136213v080800p.pdf.
[11] 3GPP TR 25.814 . Physical layer aspect for evolved Universal Terrestrial Radio Access
(UTRA). online at: urlhttp://www.3gpp.org/ftp/Specs/html-info/25814.htm.
[12] O. Adigun and C. Politis. Energy efficiency analysis for MIMO transmission schemes in
LTE. In Computer Aided Modeling and Design of Communication Links and Networks
(CAMAD), 2011 IEEE 16th International Workshop on, pages 77 –81, june 2011.
[13] Tao Chen, Honggang Zhang, Zhifeng Zhao, and Xianfu Chen. Towards green wireless
access networks. In Communications and Networking in China (CHINACOM), 2010 5th
International ICST Conference on, pages 1 –6, aug. 2010.
[14] Luis Suarez, Loutfi Nuaymi, and Jean-Marie Bonnin. An overview and classification
of research approaches in green wireless networks. EURASIP J. Wireless Comm. and
Networking, 2012:142, 2012.
[15] H.K. Boyapati, R.V.R. Kumar, and S. Chakrabarti. Energy consumption assessment in
LTE baseband of eNodeB and guidelines for green baseband subsystems. In Proc. of
India Conference (INDICON), 2010 Annual IEEE, pages 1 –4, dec. 2010.
[16] Fred Richter, Albrecht J. Fehske, Patrick Marsch, and Gerhard P. Fettweis. Traffic De-
mand and Energy Efficiency in Heterogeneous Cellular Mobile Radio Networks. In
Vehicular Technology Conference (VTC 2010-Spring), 2010 IEEE 71st, pages 1 –6, may
2010.
Bibliography 115
[17] F. Richter, A.J. Fehske, and G.P. Fettweis. Energy Efficiency Aspects of Base Station
Deployment Strategies for Cellular Networks. In Vehicular Technology Conference Fall
(VTC 2009-Fall), 2009 IEEE 70th, pages 1 –5, sept. 2009.
[18] A.J. Fehske, F. Richter, and G.P. Fettweis. Energy Efficiency Improvements through
Micro Sites in Cellular Mobile Radio Networks. In GLOBECOM Workshops, 2009
IEEE, pages 1 –5, 30 2009-dec. 4 2009.
[19] ETSI. TS 102 706 V1.1.1 (2009-08) Environmental Engineering (EE) Energy Efficiency
of Wireless Access Network Equipment. Technical report.
[20] M. Deruyck, W. Vereecken, E. Tanghe, W. Joseph, M. Pickavet, L. Martens, and P. De-
meester. Comparison of power consumption of mobile WiMAX, HSPA and LTE access
networks. In Telecommunications Internet and Media Techno Economics (CTTE), 2010
9th Conference on, pages 1 –7, june 2010.
[21] M. Deruyck, W. Vereecken, E. Tanghe, W. Joseph, M. Pickavet, L. Martens, and P. De-
meester. Power consumption in wireless access network. In Wireless Conference (EW),
2010 European, pages 924 –931, april 2010.
[22] Xiliang Zhong and Cheng-Zhong Xu. Delay-constrained energy-efficient wireless
packet scheduling with QoS guarantees. In Global Telecommunications Conference,
2005. GLOBECOM ’05. IEEE, volume 6, pages 5 pp. –3340, dec. 2005.
[23] Wanshi Chen, M.J. Neely, and U. Mitra. Energy Efficient Scheduling with Individual
Packet Delay Constraints: Offline and Online Results. In INFOCOM 2007. 26th IEEE
International Conference on Computer Communications. IEEE, pages 1136 –1144, may
2007.
[24] Yan Lin and Guangxin Yue. Channel-Adapted and Buffer-Aware Packet Scheduling in
LTE Wireless Communication System. In Wireless Communications, Networking and
Mobile Computing, 2008. WiCOM ’08. 4th International Conference on, pages 1 –4,
oct. 2008.
[25] Raymond Kwan and Cyril Leung. A Survey of Scheduling and Interference Mitigation
in LTE. Journal of Electrical and Computer Engineering, 2010:10, 2010.
116 Bibliography
[26] S. Schwarz, C. Mehlfuhrer, and M. Rupp. Low complexity approximate maximum
throughput scheduling for LTE. In Signals, Systems and Computers (ASILOMAR), 2010
Conference Record of the Forty Fourth Asilomar Conference on, pages 1563 –1569, nov.
2010.
[27] Fen Hou, J. She, Pin-Han Ho, and Xuemin Shen. A flexible resource allocation and
scheduling framework for non-real-time polling service in IEEE 802.16 networks. Wire-
less Communications, IEEE Transactions on, 8(2):766 –775, feb. 2009.
[28] M. Dianati, X. Shen, and S. Naik. A new fairness index for radio resource allocation
in wireless networks. In Wireless Communications and Networking Conference, 2005
IEEE, volume 2, pages 712 – 717 Vol. 2, march 2005.
[29] M. Mehrjoo, M.K. Awad, M. Dianati, and X.S. Shen. Design of Fair Weights for Het-
erogeneous Traffic Scheduling in Multichannel Wireless Networks. Communications,
IEEE Transactions on, 58(10):2892 –2902, october 2010.
[30] Dario Sabella, Marco Caretti, and Roberto Fantini. Energy Efficiency Evaluation of
State of the Art Packet Scheduling algorithms for LTE. Wireless Conference- Sustain-
able Wireless Technologies (European Wireless), pages 1 –4, April 2011.
[31] E. Uysal-Biyikoglu, B. Prabhakar, and A. El Gamal. Energy-efficient packet transmis-
sion over a wireless link. Networking, IEEE/ACM Transactions on, 10(4):487 – 499,
aug 2002.
[32] S. Videv and H. Haas. Energy-Efficient Scheduling and Bandwidth-Energy Efficiency
Trade-Off with Low Load. In Communications (ICC), 2011 IEEE International Confer-
ence on, pages 1 –5, june 2011.
[33] C. Han and S. Armour. Energy efficient radio resource management strategies for green
radio. Communications, IET, 5(18):2629 –2639, 16 2011.
[34] M. Dianati, X. Shen, and S. Naik. A new fairness index for radio resource allocation in
wireless networks. In Proc. of Wireless Communications and Networking Conference,
2005 IEEE, volume 2, pages 712 – 717 Vol. 2, March 2005.
Bibliography 117
[35] S. Sadr, A. Anpalagan, and K. Raahemifar. Radio Resource Allocation Algorithms for
the Downlink of Multiuser OFDM Communication Systems. Communications Surveys
Tutorials, IEEE, 2009.
[36] Zhiwei Mao and Xianmin Wang. Efficient optimal and suboptimal radio resource allo-
cation in OFDMA system. Wireless Communications, IEEE Transactions on, 7(2):440–
445, 2008.
[37] M. Mehrjoo, M.K. Awad, M. Dianati, and Xuemin Shen. Design of Fair Weights for
Heterogeneous Traffic Scheduling in Multichannel Wireless Networks. Communica-
tions, IEEE Transactions on, 58(10):2892–2902, 2010.
[38] Cong Xiong, G.Y. Li, Shunqing Zhang, Yan Chen, and Shugong Xu. Energy-Efficient
Resource Allocation in OFDMA Networks. Communications, IEEE Transactions on,
60(12):3767–3778, 2012.
[39] Yuning Wang, Jianhua Zhang, and Ping Zhang. Energy-efficient power and subcarrier
allocation in multiuser OFDMA networks. In Communications (ICC), 2014 IEEE Inter-
national Conference on, pages 5492–5496, June 2014.
[40] M. Moretti, A. Todini, and A. Baiocchi. Distributed radio resource allocation for the
downlink of multi-cell OFDMA radio systems. In Teletraffic Congress (ITC), 2010 22nd
International, pages 1–7, Sept 2010.
[41] F. Capozzi, G. Piro, L.A. Grieco, G. Boggia, and P. Camarda. Downlink Packet Schedul-
ing in LTE Cellular Networks: Key Design Issues and a Survey. Communications Sur-
veys Tutorials, IEEE, 15(2):678–700, Second 2013.
[42] Huiling Zhu and Jiangzhou Wang. Performance Analysis of Chunk-Based Resource
Allocation in Multi-Cell OFDMA Systems. Selected Areas in Communications, IEEE
Journal on, 32(2):367–375, February 2014.
[43] E. Pateromichelakis, M. Shariat, A. Ul Quddus, and R. Tafazolli. On the Evolution
of Multi-Cell Scheduling in 3GPP LTE / LTE-A. Communications Surveys Tutorials,
IEEE, 15(2):701–717, Second 2013.
118 Bibliography
[44] Thien-Toan Tran, Yoan Shin, and Oh-Soon Shin. Overview of enabling technologies for
3GPP LTE-advanced. EURASIP Journal on Wireless Communications and Networking,
2012(1):1–12, 2012.
[45] Mohamad Yassin, Mohamed A. AboulHassan, Samer Lahoud, Marc Ibrahim, Dany
Mezher, Bernard Cousin, and Essam A. Sourour. Survey of ICIC Techniques in LTE
Networks under Various Mobile Environment Parameters. Wireless Networks, pages
1–16, 2015.
[46] R. Irmer, H. Droste, P. Marsch, M. Grieger, G. Fettweis, S. Brueck, H.-P. Mayer,
L. Thiele, and V. Jungnickel. Coordinated multipoint: Concepts, performance, and field
trial results. Communications Magazine, IEEE, 49(2):102–111, February 2011.
[47] M. Sawahashi, Y. Kishiyama, A. Morimoto, D. Nishikawa, and M. Tanno. Coordinated
multipoint transmission/reception techniques for LTE-advanced [Coordinated and Dis-
tributed MIMO]. IEEE Wireless Communications, 17(3):26–34, June 2010.
[48] A. Papadogiannis, E. Hardouin, and D. Gesbert. A Framework for Decentralising Multi-
Cell Cooperative Processing on the Downlink. In GLOBECOM Workshops, 2008 IEEE,
pages 1–5, Nov 2008.
[49] Xiujun Zhang, Yin Sun, Xiang Chen, Shidong Zhou, Jing Wang, and Ness B. Shroff.
Distributed Power Allocation for Coordinated Multipoint Transmissions in Distributed
Antenna Systems. Wireless Communications, IEEE Transactions on, 12(5):2281–2291,
May 2013.
[50] Ling Zhang, Xiangming Wen, Ting Xu, Zhaoming Lu, Jun Zhao, and Shenghua He.
Coordinated Scheduling in Downlink Multi-Cell OFDMA Networks. In Vehicular Tech-
nology Conference (VTC Fall), 2014 IEEE 80th, pages 1–5, Sept 2014.
[51] A.J. Fehske, P. Marsch, and G.P. Fettweis. Bit per Joule efficiency of cooperating base
stations in cellular networks. In GLOBECOM Workshops (GC Wkshps), 2010 IEEE,
pages 1406–1411, Dec 2010.
[52] O.T. Eluwole and M. Lohi. Coordinated multipoint power consumption modeling for
Bibliography 119
energy efficiency assessment in LTE/LTE-advanced cellular networks. In Telecommuni-
cations (ICT), 2012 19th International Conference on, pages 1–6, April 2012.
[53] O. Onireti, F. Heliot, and M.A. Imran. Trade-off between Energy Efficiency and Spec-
tral Efficiency in the uplink of a linear cellular system with uniformly distributed user
terminals. In Personal Indoor and Mobile Radio Communications (PIMRC), 2011 IEEE
22nd International Symposium on, pages 2407–2411, Sept 2011.
[54] Korhan Cengiz and Tamer Dag. A review on the recent energy-efficient approaches
for the Internet protocol stack. EURASIP Journal on Wireless Communications and
Networking, 2015(1):1–22, 2015.
[55] E. Katranaras, M.A. Imran, and M. Dianati. Energy-aware clustering for multi-cell
joint transmission in LTE networks. In Communications Workshops (ICC), 2013 IEEE
International Conference on, pages 419–424, June 2013.
[56] J.B. Rao and A.O. Fapojuwo. A Survey of Energy Efficient Resource Management
Techniques for Multicell Cellular Networks. Communications Surveys Tutorials, IEEE,
16(1):154–180, First 2014.
[57] L. Venturino, A. Zappone, C. Risi, and S. Buzzi. Energy-Efficient Scheduling and Power
Allocation in Downlink OFDMA Networks With Base Station Coordination. Wireless
Communications, IEEE Transactions on, 14(1):1–14, Jan 2015.
[58] Kazi Mohammed Saidul Huq, Shahid Mumtaz, Firooz B. Saghezchi, Jonathan Ro-
driguez, and Rui L. Aguiar. Energy efficiency of downlink packet scheduling in CoMP.
Transactions on Emerging Telecommunications Technologies, 26(2):131–146, 2015.
[59] Y. Sun, Y. Zhong, and J. Li. Performance comparison of coordinated multi-point trans-
mission strategies in C-RAN. In 2016 IEEE International Conference on Electronic
Information and Communication Technology (ICEICT), pages 93–96, Aug 2016.
[60] S. Chaudhuri, I. Baig, and D. Das. QoS aware downlink scheduler for a carrier aggrega-
tion LTE-Advance network with efficient carrier power control. In 2016 IEEE Annual
India Conference (INDICON), pages 1–6, Dec 2016.
120 Bibliography
[61] E. Chavarria-Reyes, I. F. Akyildiz, and E. Fadel. Energy-Efficient Multi-Stream Carrier
Aggregation for Heterogeneous Networks in 5G Wireless Systems. IEEE Transactions
on Wireless Communications, 15(11):7432–7443, Nov 2016.
[62] Z. Liu, G. Kang, L. Lei, N. Zhang, and S. Zhang. Power Allocation for Energy Effi-
ciency Maximization in Downlink CoMP Systems with NOMA. In 2017 IEEE Wireless
Communications and Networking Conference (WCNC), pages 1–6, March 2017.
[63] J. He, C. Xu, S. Bian, Z. Shao, J. Song, Y. Li, and I. Chih-Lin. Energy efficient bss
switching in heterogeneous networks: An operator’s perspective. In 2016 IEEE Wireless
Communications and Networking Conference, pages 1–6, April 2016.
[64] M. Oikonomakou, A. Antonopoulos, L. Alonso, and C. Verikoukis. Evaluating cost
allocation imposed by cooperative switching off in multi-operator shared hetnets. IEEE
Transactions on Vehicular Technology, PP(99):1–1, 2017.
[65] J. He, X. Wang, S. Bian, and C. L. I. A cooperation energy saving scheme in self-
organizing hetnets. In 2016 IEEE Globecom Workshops (GC Wkshps), pages 1–5, Dec
2016.
[66] H. Munir, S. A. Hassan, H. Pervaiz, Q. Ni, and L. Musavian. Energy efficient resource
allocation in 5g hybrid heterogeneous networks: A game theoretic approach. In 2016
IEEE 84th Vehicular Technology Conference (VTC-Fall), pages 1–5, Sept 2016.
[67] H. Zhang, M. Sun, K. Long, M. Sheng, and V. C. M. Leung. Supermodular game based
energy efficient power allocation in heterogeneous small cell networks. In 2017 IEEE
International Conference on Communications (ICC), pages 1–5, May 2017.
[68] S. Dong, Y. Wang, L. Jiang, and Y. Chen. Energy efficiency analysis with circuit power
consumption in downlink large-scale multiple antenna systems. In 2016 IEEE 83rd
Vehicular Technology Conference (VTC Spring), pages 1–5, May 2016.
[69] M. Klape, C. A. Grazia, and M. Casoni. Reducing cellular networks power consumption:
The role of resource pooling and cooperation. In 2017 14th International Conference on
Telecommunications (ConTEL), pages 107–114, June 2017.
Bibliography 121
[70] M. Sinaie, A. Zappone, E. A. Jorswieck, and P. Azmi. A novel power consumption
model for effective energy efficiency in wireless networks. IEEE Wireless Communica-
tions Letters, 5(2):152–155, April 2016.
[71] X. Wang, A. Alabbasi, and C. Cavdar. Interplay of energy and bandwidth consumption
in cran with optimal function split. In 2017 IEEE International Conference on Commu-
nications (ICC), pages 1–6, May 2017.
[72] Y. Wang, G. Yue, S. Rangarajan, R. Sankar, and S. Morgera. Buffer-aware packet
scheduling in downlink multiuser systems. In Personal Indoor and Mobile Radio Com-
munications (PIMRC), 2013 IEEE 24th International Symposium on, pages 1495–1500,
Sept 2013.
[73] Long Bao Le, D. Niyato, E. Hossain, Dong In Kim, and Dinh Thai Hoang. QoS-Aware
and Energy-Efficient Resource Management in OFDMA Femtocells. Wireless Commu-
nications, IEEE Transactions on, 12(1):180–194, January 2013.
[74] G. Song, Ye Li, L.J. Cimini, and H. Zheng. Joint channel-aware and queue-aware
data scheduling in multiple shared wireless channels. In Wireless Communications and
Networking Conference, 2004. WCNC. 2004 IEEE, volume 3, pages 1939–1944 Vol.3,
March 2004.
[75] A Alsharif Mohammed H. A Nordin Rosdiadee A Ismail Mahamod Behjati, Mehran.
Energy Efficient and High Capacity Tradeoff in Distributed Antenna System for a Green
Cellular Network. Journal of Computer Networks and Communications, 2015(2):9
pages, 2015.
[76] M.R. Sabagh, M. Dianati, R. Tafazolli, and M. Mehrjoo. Energy efficient and quality
of service aware resource block allocation in OFDMA systems. Communications, IET,
9(12):1479–1492, 2015.
[77] Silvano Martello and Paolo Toth. Knapsack Problems: Algorithms and Computer Im-
plementations. John Wiley & Sons, Inc., New York, NY, USA, 1990.
[78] Amine Lamine, Mahdi Khemakhem, and Habib Chabchoub. Knapsack Problems in-
volving dimensions, demands and multiple choice constraints: generalization and trans-
122 Bibliography
formations between formulations. International Journal of Advanced Science and Tech-
nology, 46:71–94, 2012.
[79] Kathrin Klamroth and Margaret M. Wiecek. Dynamic programming approaches to the
multiple criteria knapsack problem. Naval Research Logistics, pages 57–76, 2000.
[80] M Jalali Varnamkhasti. Overview of the algorithms for solving the multidimensional
knapsack problems. Advanced Studies in Biology, 4(1):37–47, 2012.
[81] A. Sbihi. A best first search exact algorithm for the Multiple-choice Multidimensional
Knapsack Problem. Journal Of Combinatorial Optimization, 13(4):337–351, May 2007.
[82] Lu Wang, Zhong Zhou, and Wei Wu. Traffic Pattern Prediction and Spectrum Allocation
with Multiple Channel Width in Cognitive Cellular Networks. International Journal of
Distributed Sensor Networks, 2014:1–11, 2014.
[83] Z. Hasan, H. Boostanimehr, and V.K. Bhargava. Green Cellular Networks: A Sur-
vey, Some Research Issues and Challenges. Communications Surveys Tutorials, IEEE,
13(4):524 –540, quarter 2011.
[84] Jianhua He, P. Loskot, T. O’Farrell, V. Friderikos, S. Armour, and J. Thompson. Energy
efficient architectures and techniques for Green Radio access networks. In Communica-
tions and Networking in China (CHINACOM), 2010 5th International ICST Conference
on, pages 1 –6, aug. 2010.
[85] Stephen Boyd and Lieven Vandenberghe. Convex Optimization. Cambridge University
Press, New York, NY, USA, 2004.
[86] Alexander Schrijver. Theory of Linear and Integer Programming. John Wiley & Sons,
Inc., New York, NY, USA, 1986.
[87] R.G. Batson D.S. Chen and Y. Dang. Applied Integer Programming: Modeling and
Solution. John Wiley & Sons, Inc., New York, NY, USA, 2011.
[88] H. Paul Williams. Logic and Integer Programming. Springer Publishing Company,
Incorporated, 1st edition, 2009.
Bibliography 123
[89] Gerhard J. Woeginger. Combinatorial Optimization Eureka, You Shrink !. Springer-
Verlag New York, Inc., 2003.
[90] David Pisinger. Algorithms for Knapsack Problems, 1995.
[91] David Pisinger. Algorithms for Knapsack Problems, 1995, PhD Thesis.
[92] R. Vaz, V. Shah, A. Sawhney, and R. Deolekar. Automated big-o analysis of algorithms.
In 2017 International Conference on Nascent Technologies in Engineering (ICNTE),
pages 1–6, Jan 2017.
[93] 3GPP TR 25.814 . Physical layer aspect for evolved Universal Terrestrial Radio
Access (UTRA). [Online]. Available: http://www.3gpp.org/ftp/Specs/
html-info/25814.htm.
[94] Christian Mehlfuhrer, Martin Wrulich, Josep Colom Ikuno, Dagmar Bosanska, and
Markus Rupp. Simulating the Long Term Evolution Physical Layer. In 17th European
Signal Processing Conference, 2009.
[95] Christian Mehlfhrer, Josep Colom Ikuno, Michal Łimko, Stefan Schwarz, Martin
Wrulich, and Markus Rupp. The Vienna LTE Simulators Enabling Reproducibility in
Wireless Communications Research. EURASIP Journal on Advances in Signal Process-
ing, 29, 2011.
[96] G. Piro, L.A. Grieco, G. Boggia, F. Capozzi, and P. Camarda. Simulating LTE Cellular
Systems: An Open-Source Framework. Vehicular Technology, IEEE Transactions on,
60(2):498 –513, feb. 2011.
[97] X. Xiuqiang, M. Dianati, and M.R Sabagh. Resource distribution method and device,
December 4 2013. CN Patent App. CN 201,210,162,180.
[98] M.R. Sabagh, M. Dianati, M.A. Imran, and R. Tafazolli. A heuristic energy efficient
scheduling scheme for VoIP in 3GPP LTE networks. In Communications Workshops
(ICC), 2013 IEEE International Conference on, pages 413–418, June 2013.
[99] P. Parag, S. Bhashyam, and R. Aravind. A subcarrier allocation algorithm for OFDMA
using buffer and channel state information. In Proc. of Vehicular Technology Conference,
2005. VTC-2005-Fall. 2005 IEEE 62nd, volume 1, pages 622–625, 2005.
124 Bibliography
[100] Peng Cheng, Guanding Yu, Zhaoyang Zhang, and Peiliang Qiu. A Cross-Layer Fair
Resource Allocation Algorithm for OFDMA Systems. In Proc. of Communications,
Circuits and Systems Proceedings, 2006 International Conference on, volume 2, pages
1342–1346, 2006.
[101] Attahiru Sule Alfa. Queueing Theory for Telecommunications - Discrete Time Modelling
of a Single Node System. Springer, 2010.
[102] Thomas H. Cormen, Clifford Stein, Ronald L. Rivest, and Charles E. Leiserson. Intro-
duction to Algorithms. McGraw-Hill Higher Education, 2nd edition, 2001.
[103] C. Blair. Theory of Linear and Integer Programming (Alexander Schrijver). SIAM
Review, 30(2):325–326, 1988.
[104] J. Nocedal and S. J. Wright. Numerical Optimization. Springer, New York, 2nd edition,
2006.
[105] Stephen Boyd and Lieven Vandenberghe. Convex Optimization. Cambridge University
Press, New York, NY, USA, 2004.
[106] Jrg Nievergelt. Exhaustive search, combinatorial optimization and enumeration: Explor-
ing the potential of raw computing power. In Proc. of SOFSEM 2000, number 1963 in
LNCS, pages 18–35. Springer, 2000.
[107] 3GPP Specification series. online at: http://www.3gpp.org/ftp/Specs/
html-info/36-series.htm.
[108] David Tse and Pramod Viswanath. Fundamentals of Wireless Communications , 2004.
[109] D. Bertsimas, D.A. Iancu, and P.A. Parrilo. A Hierarchy of Near-Optimal Policies
for Multistage Adaptive Optimization. Automatic Control, IEEE Transactions on,
56(12):2809–2824, Dec 2011.