energy efficiency: a kenya power perspective
TRANSCRIPT

ENERGY EFFICIENCY FROM THE KENYA
POWER PERSPECTIVE
AFRICA CARBON EXCHANGE (ACX) ENERGY EFFICIENCY WORKSHOPAPRIL 24-25th 2013
Eng. Margaret Kanini
Senior Engineer, Demand Side Management
Kenya Power
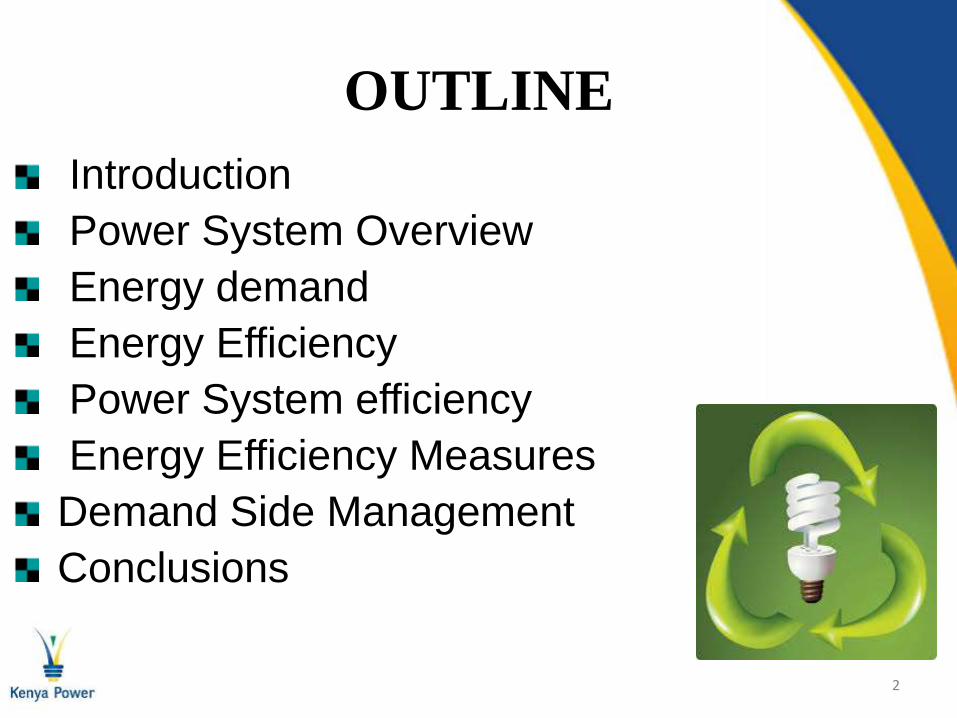
OUTLINE
Introduction
Power System Overview
Energy demand
Energy Efficiency
Power System efficiency
Energy Efficiency Measures
Demand Side Management
Conclusions
2

INTRODUCTION
Kenya Power is a public utility
Company responsible for:
Power purchase
Transmission
Distribution and retail sales of
electricity in Kenya
3

4
(Kenya Power)

5
Kenya Power’s Contribution to the Economy
Increasing population access to electricity from the current
29% to a targeted 40% by 2020.
Planning and implementation of distribution reinforcement
and upgrade projects.
Procurement of adequate power generation capacity from
diverse sources;
and maintaining a minimum reserve margin of 15% (and
preferably 30%).
Promotion of green energy investments.
Improving power supply quality and reliability.
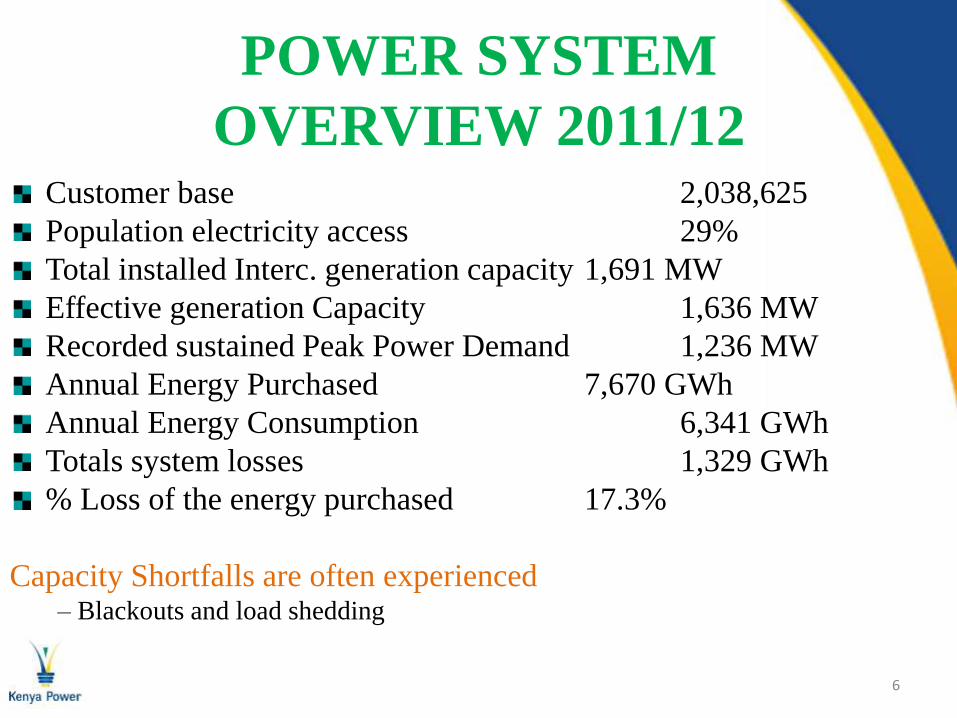
POWER SYSTEM
OVERVIEW 2011/12Customer base 2,038,625
Population electricity access 29%
Total installed Interc. generation capacity 1,691 MW
Effective generation Capacity 1,636 MW
Recorded sustained Peak Power Demand 1,236 MW
Annual Energy Purchased 7,670 GWh
Annual Energy Consumption 6,341 GWh
Totals system losses 1,329 GWh
% Loss of the energy purchased 17.3%
Capacity Shortfalls are often experienced – Blackouts and load shedding
6

Hydro, 3,451 , 46%
Thermal, 2,569 , 34%
Geothermal, 1,498 , 20%
Wind, 15 , 0%
Solar, 0.3 , 0%
Imports, 37 , 0%
GENERATION BY SOURCE
GWh 2011/12
7

Projected Growth in Demand
7,749 7,919
8,578
9,801
11,059
-
2,000
4,000
6,000
8,000
10,000
12,000
2012/13 2013/14 2014/15 2015/16 2016/17
Ene
rgy
De
man
d (
GW
h)
8

Meeting future power demand
Build more generation capacity
Purchase electricity from other utilities
(import)
Transmission and distribution
improvements
Energy Efficiency and Demand Side
Management programs
9
-
500
1,000
1,500
2,000
2,500
3,000
3,500
4,000
4,500
5,000
2012/13 2013/14 2014/15 2015/16 2016/17
Ene
rgy
(GW
h)
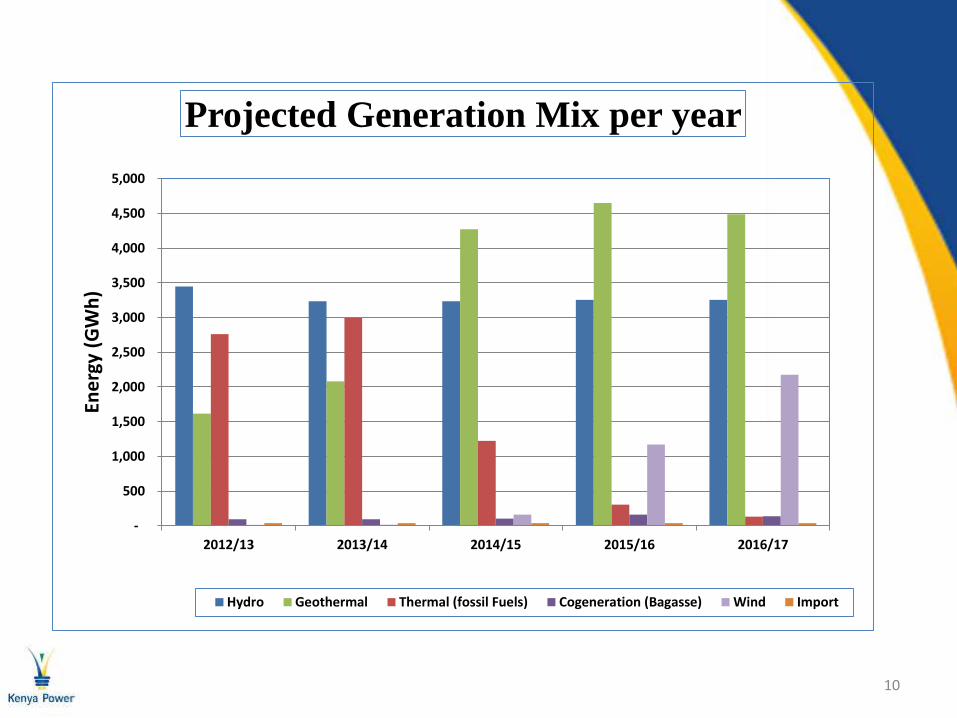
Projected Generation Mix per year
Hydro Geothermal Thermal (fossil Fuels) Cogeneration (Bagasse) Wind Import
10
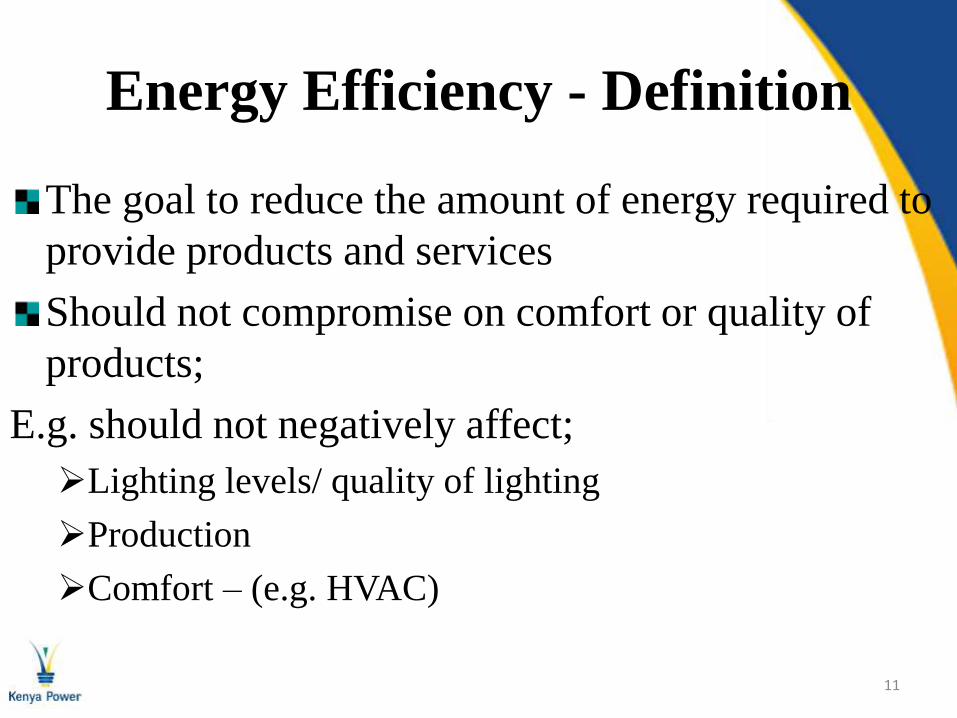
Energy Efficiency - Definition
The goal to reduce the amount of energy required to
provide products and services
Should not compromise on comfort or quality of
products;
E.g. should not negatively affect;
Lighting levels/ quality of lighting
Production
Comfort – (e.g. HVAC)
11

Why Energy Efficiency?
High Energy Prices
Energy efficiency will lower energy bills
Insecurity of Supply
Future energy supplies uncertain due to depletion of
major energy sources; e.g. fuel wood and fossil fuels as
demand rises
Adverse environmental and health impacts
Climate change as a result of GHG emissions due to
energy use
12

Why Energy Efficiency?—(2)
Energy efficiency is a valuable resource
Reduces the need for more energy generation
capacity expansion
Reduces system Losses
Saves customers money
Creates jobs
Reduces pollution and greenhouse gases
13
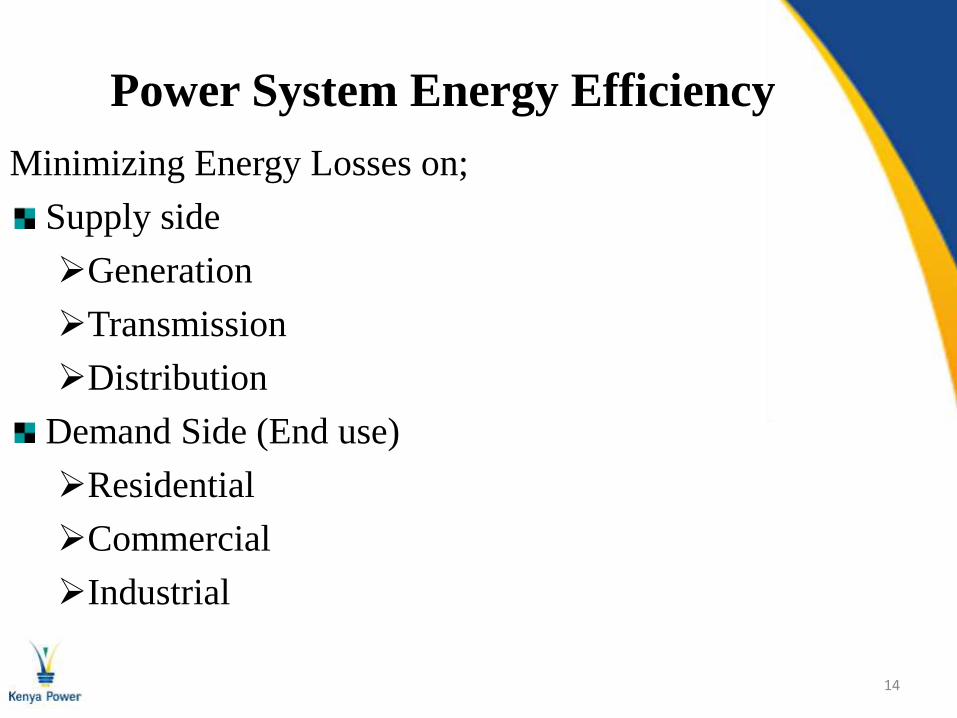
Power System Energy Efficiency
Minimizing Energy Losses on;
Supply side
Generation
Transmission
Distribution
Demand Side (End use)
Residential
Commercial
Industrial
14

5,347 5,697
6,169 6,385 6,489 6,692
7,303 7,670
4,379 4,580
5,065 5,322 5,432 5,624
6,123 6,341
-
1,000
2,000
3,000
4,000
5,000
6,000
7,000
8,000
9,000
2004/5 2005/6 2006/7 2007/8 2008/9 2009/10 2010/11 2011/12
Ene
rgy
(GW
h)
Energy Purchased Vs Sales
Energy Purchased Energy Sold
Energy Efficiency on the supply side
15

81.9%
80.4%
82.1%
83.4%
83.7%
84.0%83.8%
82.7%
78.0%
79.0%
80.0%
81.0%
82.0%
83.0%
84.0%
85.0%
2004/5 2005/6 2006/7 2007/8 2008/9 2009/10 2010/11 2011/12
Dis
trib
uti
on
Eff
icie
ncy
(%
)
Distribution efficiency
Energy Efficiency on the supply side -------(2)
16

Losses on the supply side
Power losses have two components;
technical losses and
non-technical losses (Commercial losses).
Electric power transmission and distribution
losses include;
losses in transmission between sources of supply and
points of distribution
distribution to consumers, including pilferage.
17

Losses on the supply side -(2)Technical losses occur naturally and are dependent on the system
characteristics.
Electricity Demand (I)
Physical characteristics of conductor (wire) –(R)
Magnetizing currents in equipment
Corona losses due to bad weather – Transmission lines
Power Plant Auxiliary losses – Fans, pumps, blowers
Non technical losses are caused by actions external to the power
system and occur from basically;
Electricity theft,
Inaccuracies in metering equipment
18
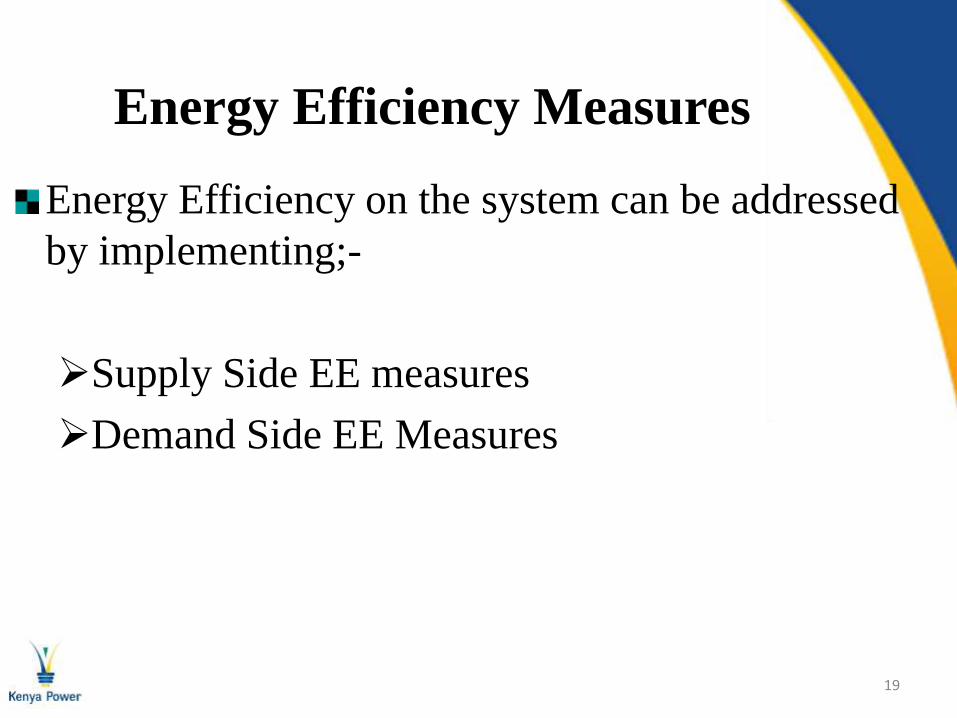
Energy Efficiency Measures
Energy Efficiency on the system can be addressed
by implementing;-
Supply Side EE measures
Demand Side EE Measures
19

Supply Side Energy Efficiency
MeasuresUse of conductor with less resistance, e.g. bigger conductor is able
to pass high currents with less resistance
Reduce the length of MV power lines - build more sub transmission
substations (132/66, 132/33, 66/33, 66/11, etc)
Locate distribution transformers near the load centres
Use transformers with less losses (specify at the procurement stage)
Ensure proper design of transmission lines to minimize corona
losses
Procure & Install low loss equipment
Construct new lines and substations to cater for load growth
20

Loss reduction– Supply side options
System reinforcement to cater for growing load through the Energy Sector Recovery Project (ESRP) since 2004/5;
Establishment of more primary substations to reduce the length of distribution lines
Line reconductoring to upgrade thin conductor with thick conductor
Specifications for low loss equipment
Transformer relocation to load centres
Capacitor installations on transmission & distribution lines and substations to improve system power factor
21
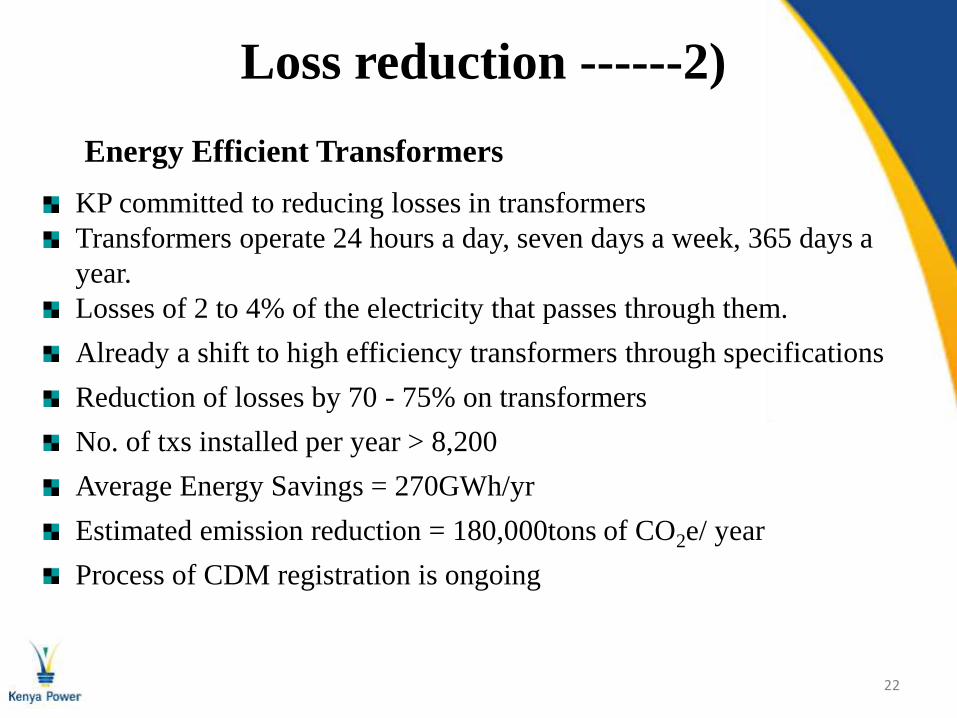
Loss reduction ------2)
KP committed to reducing losses in transformers
Transformers operate 24 hours a day, seven days a week, 365 days a
year.
Losses of 2 to 4% of the electricity that passes through them.
Already a shift to high efficiency transformers through specifications
Reduction of losses by 70 - 75% on transformers
No. of txs installed per year > 8,200
Average Energy Savings = 270GWh/yr
Estimated emission reduction = 180,000tons of CO2e/ year
Process of CDM registration is ongoing
22
Energy Efficient Transformers

23
Ordinary Vs Energy Efficient Txs
Ordinary Tx Energy Efficient Tx

Non Technical Losses
Prepaid Metering
Automatic Meter reading (AMR)
Intensified inspections to disconnect unauthorized connections
Ring fencing - for identification of areas of losses
24

Energy Losses at the end use
Wastage of primary energy input in industries range from 10%
- 30% ( GEF-KAM Project – 2001)
There are numerous energy efficiency opportunities
surrounding us;
No Cost,
Low Cost and
High Cost
Improvement of efficiency of energy use including heating,
lighting, AC, office equipment, motors and industrial
processes, etc is necessary
25

Energy Losses at the end use …..2)
Improvements involve use of new more efficient
technologies as well as better operating practices.
Example, improved operation of heating,
ventilation and AC in commercial buildings can
cut electric bills by 10-15% with no capital
investment; - cleaning air filters, lubrication and
proper function of controls.
26

End Use EE Challenges
Inadequate awareness on benefits of EE
Consumer apathy – consumers not embracing
energy efficiency due to negative attitude
Inadequate resources - financial & technical
Lack of standardization of appliances and equipment
Inadequate incentives for EE
27

Kenya Power, besides providing
electricity offers services that assists
customer to manage their electricity bills
through DSM.
DSM involves influencing the amount
and timing of electricity usage by customers.
Demand Side Management (DSM) & Energy Efficiency
28

Demand Side Management
The amount of electricity is
reduced by improving the technical
and operational efficiency with
which customers use electricity.
Timing of electricity is influenced
by direct load control programs -
Interruptible tariff in place for water
heating; to manage demand at critical
times.
29

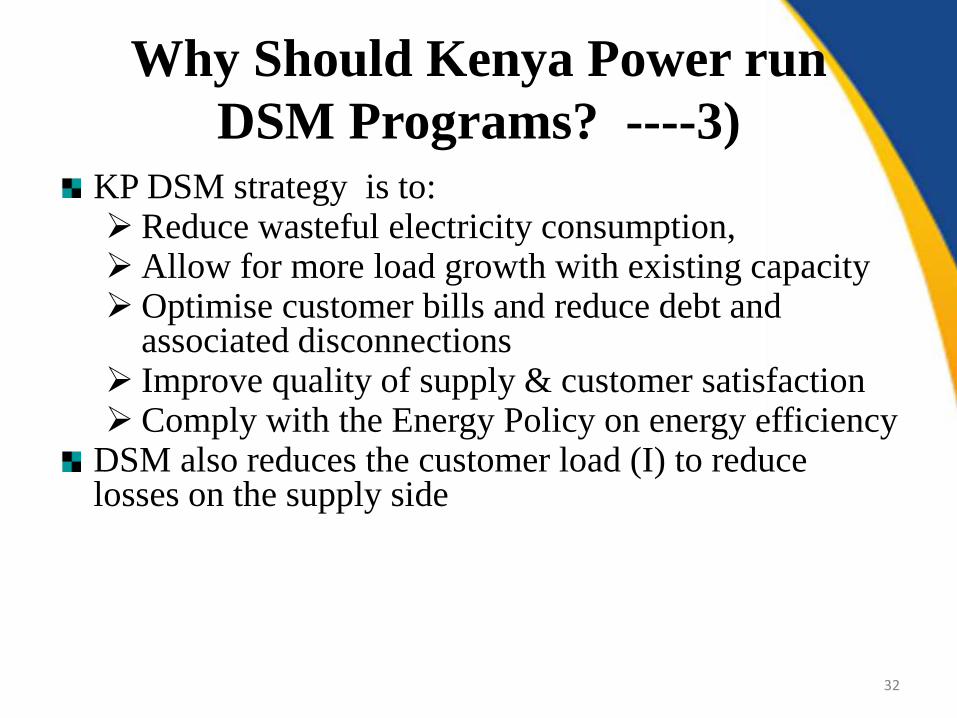
Why Should Kenya Power run
DSM Programs?
How can a company
encourage its
customers to use
less of its product?
30

31
Why Should Kenya Power run
DSM Programs? ------2)
Electricity is an essential
commodity,
Is not adequate
Expensive to produce
and distribute.
Regulated.
Why Should Kenya Power run
DSM Programs? ----3)
KP DSM strategy is to: Reduce wasteful electricity consumption,Allow for more load growth with existing capacity Optimise customer bills and reduce debt and
associated disconnections Improve quality of supply & customer satisfaction Comply with the Energy Policy on energy efficiency
DSM also reduces the customer load (I) to reduce losses on the supply side
32

0.00
200.00
400.00
600.00
800.00
1000.00
1200.00
1400.00
LO
AD
, M
W
TIME OF DAY
DAILY LOAD CURVES
National Gen.Demand
NairobiRegion
Coast Region
West Region
Mt. KenyaRegion
Figure Load Curves - 10th May 2011; Source NCC, KPLC
Load Profile
33

Kenya Power & DSM
DSM provides resources that cost effectively substitute for power plants
Direct load control programs and interruptible rates provides same type of services that a combustion turbine does, but at a lower cost.
Energy Efficiency programs are often low cost alternatives to the construction and operation of base load power plants.
Thus DSM is a resource analogous to power plants Often referred to as a virtual power plant
Some utilities consider it in planning for future demand alongside other considerations for meeting customer needs (IRP concept).
34
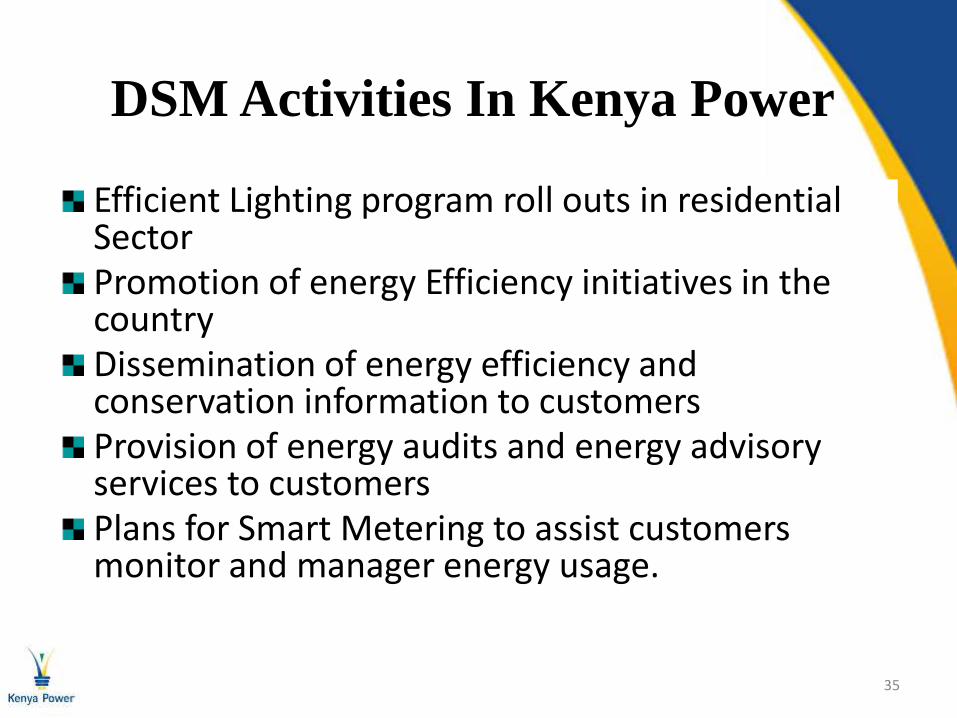
DSM Activities In Kenya Power
Efficient Lighting program roll outs in residential SectorPromotion of energy Efficiency initiatives in the countryDissemination of energy efficiency and conservation information to customersProvision of energy audits and energy advisory services to customersPlans for Smart Metering to assist customers monitor and manager energy usage.
35

Efficient lighting (CFL) roll out
Pilot financed by the Government in 2009/10,
implemented by Kenya Power.
Involved distribution of 1.25Million CFLs to
residential customers countrywide
Cost of the Project KES 500 Million
Impact:
Peak Demand Reduction 48 MW
Energy savings 61GWh/Yr
Energy Cost savings KSh72M/Yr
Reduction in fuel Costs KSh872M/Yr
Avoided gen. expansion KSh 5 bn
GHG emission abated 55,000tons CO2/
year).
36
Compare this to building a 48 MW power plant!!

37
Launch of the Pilot CFL Project in 2010

Efficient lighting (CFL) roll outs
---2)Plans to roll out a further 3.3 Million CFLs to households in 2012/2013.
Financing – GoK/ AFD and CDM
Program to benefit about 1 million low income households across the country
Program has been registered with the CDM
CDM revenues to be used in enhancing customer growth (Stima loan revolving fund).
38

Planned Project Impact
Impact:
Peak Demand Reduction 130MW
Energy savings 180GWh/ year
Energy Cost savings KSh 197million/ yr
Reduction in fuel Costs KSh 2.4 Billion
Avoided gen. expansion KSh 15 billion
GHG emission abated 120,000tons CO2/ year)
Efficient Lighting (CFL) roll outs ---
3)
39

Support of Energy Efficiency Initiatives
Kenya Power supports various initiatives in energy efficiency;
Prime sponsor of the Energy Management Awards
Supports KAM in the technical evaluation of the EE projects participating in the EMA awards
Participation in the ongoing S&L Program in development of MEPS & labels for selected appliances and equipment.
40

Energy Efficiency Campaigns
EE awareness campaigns on energy efficiency through;
Road Shows
Fliers/ posters/ booklets
Barazas
Trade fairs (shows)
Radio/ Television
Bill boards
41
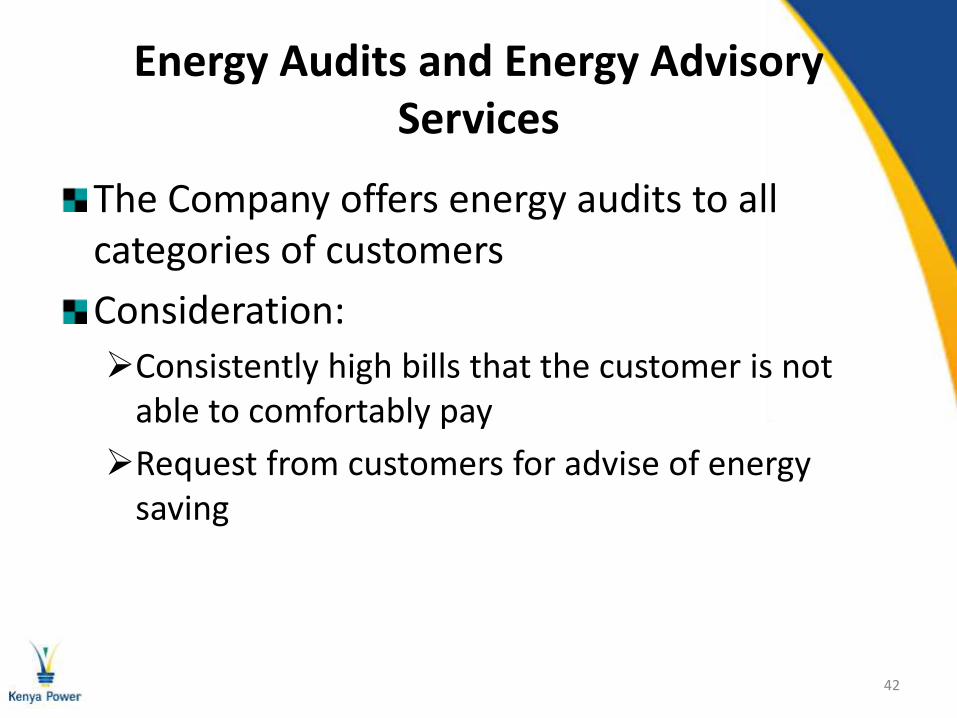
Energy Audits and Energy Advisory Services
The Company offers energy audits to all categories of customers
Consideration:
Consistently high bills that the customer is not able to comfortably pay
Request from customers for advise of energy saving
42
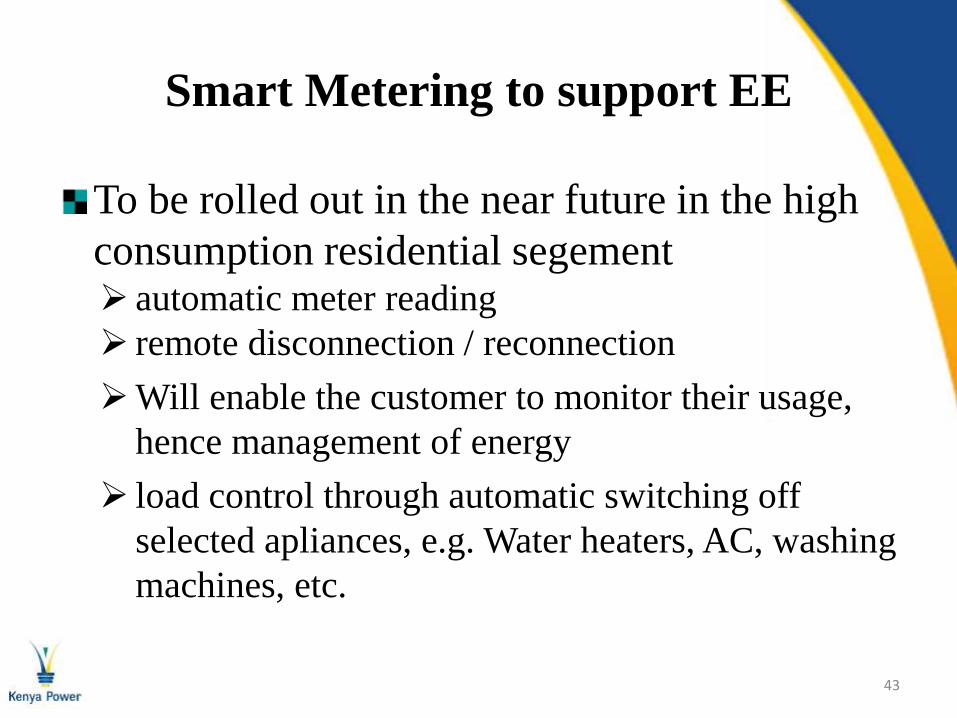
Smart Metering to support EE
To be rolled out in the near future in the high
consumption residential segement automatic meter reading
remote disconnection / reconnection
Will enable the customer to monitor their usage,
hence management of energy
load control through automatic switching off
selected apliances, e.g. Water heaters, AC, washing
machines, etc.
43
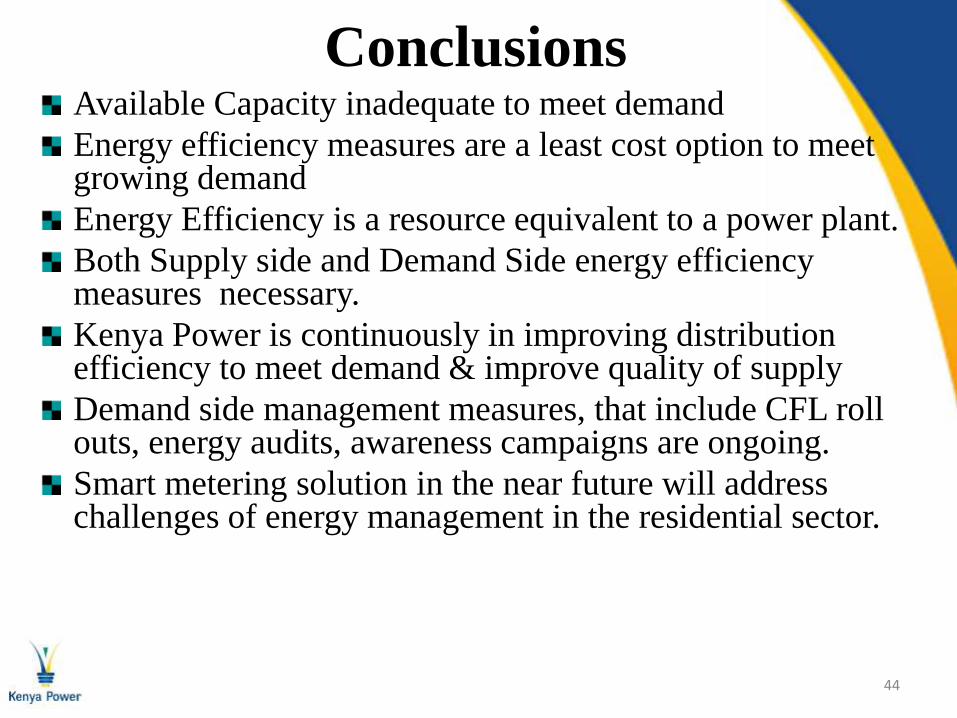
ConclusionsAvailable Capacity inadequate to meet demand
Energy efficiency measures are a least cost option to meet growing demand
Energy Efficiency is a resource equivalent to a power plant.
Both Supply side and Demand Side energy efficiency measures necessary.
Kenya Power is continuously in improving distribution efficiency to meet demand & improve quality of supply
Demand side management measures, that include CFL roll outs, energy audits, awareness campaigns are ongoing.
Smart metering solution in the near future will address challenges of energy management in the residential sector.
44

45
END
THANK YOU