energy efficiency & renewable energy - thomson reuters
TRANSCRIPT

1 | Energy Efficiency and Renewable Energy eere.energy.gov
Energy Efficiency & Renewable Energy: Challenges, Opportunities, Impacts
Sam BaldwinChief Science Officer
Office of Energy Efficiency and Renewable Energy, U.S. Department of Energy
Jeff DowdEvaluation Team Lead
Office of Energy Efficiency and Renewable Energy, U.S. Department of Energy
Understanding Federal R&D ImpactThomson‐ReutersWashington, DCMarch 19, 2013

22
OverviewChallenges
• Economy—economic development and growth; energy imports• Security—foreign energy dependence, energy availability• Environment—local (particulates, water), regional (acid rain), global (GHGs)
What role can EE & RE serve in meeting these Challenges?• Efficiency: Buildings, Industry, Transport• Renewable Fuels• Renewable Electricity
Speed and Scale
What role can Evaluation serve?• Peer Review• Impact Evaluation

33
Nations that HAVE oil(% of Global Reserves*)
Saudi Arabia 26%Iraq 11Kuwait 10Iran 9UAE 8Venezuela 6Russia 5Mexico 3Libya 3China 3Nigeria 2U.S. 2
Nations that NEED oil(% of Global Consumption)
U.S. 24. %China 8.6Japan 5.9Russia 3.4India 3.1Germany 2.9Canada 2.8Brazil 2.6S. Korea 2.6Mexico 2.4France 2.3Italy 2.0Total 85 MM Bbl/daySource: EIA International Energy Annual; *Conventional Oil
The Oil Problem

44
Oil Supply and Demand?
0
5
10
15
20
25
30
1950 1960 1970 1980 1990 2000 2010 2020 2030 2040
Million Ba
rrels pe
r Day
YEARSource: EIA, AEO 2007, AEO 2012Source: EIA, AEO 2007, AEO 2012Source: EIA, AEO 2007, AEO 2012
IMPORTS
Total Demand, AEO 2007
Total Demand AEO 2013
Domestic Supply, AEO 2007
Domestic Supply AEO 2013
New Oil

55
Resources and Supply Projections
0
100
200
300
400
500
1900 1910 1920 1930 1940 1950 1960 1970 1980 1990 2000Decade
Bill
ion
Bar
rels
Discovery of Giant Oil Fields by DecadeFredrik Robelius, Uppsala Universitet
New oil supply by type in the new policies scenarioIEA World Energy Outlook 2012, Fig. 3.15

66
Unconventional Resources
• Constraints: Cost; Energy; Water; AtmosphereSource: IEA, World Energy Outlook 2008, part B, Figure 9.10

77
Potential Impacts of GHG Emissions• Temperature Increases
o Ice Loss from Glaciers, Ocean Thermal Expansion, and Sea Level Rise
o Ecological Zone Shifts … and Extinctions
o Agricultural Zone Shifts … and Productivity
Source: Hoegh‐Guldberg, et al, Science, V.318, pp.1737, 14 Dec. 2007
• Ocean Acidification
• Precipitation Changes and Water Availability
o Agricultural Productivityo Wildfire Increases

88
Inter‐Academy Panel Statement On Ocean Acidification
1 June 2009• Signed by the National Academies of Science of 70 nations:
o Argentina, Australia, Bangladesh, Brazil, Canada, China, France, Denmark, Greece, India, Japan, Germany, Mexico, Pakistan, Spain, Taiwan, U.K., U.S…..
• “The rapid increase in CO2 emissions since the industrial revolution has increased the acidity of the world’s oceans with potentially profound consequences for marine plants and animals, especially those that require calcium carbonate to grow and survive, and other species that rely on these for food.”
o Change to date of pH decreasing by 0.1, a 30% increase in hydrogen ion activity.
• “At current emission rates, models suggest that all coral reefs and polar ecosystems will be severely affected by 2050 or potentially even earlier.”
o At 450 ppm, only 8% of existing tropical and subtropical coral reefs in water favorable to growth; at 550 ppm, coral reefs may be dissolving globally.
• “Marine food supplies are likely to be reduced with significant implications for food production and security in regions dependent on fish protein, and human health and well‐being.”
o Many coral, shellfish, phytoplankton, zooplankton, & the food webs they support
• “Ocean acidification is irreversible on timescales of at least tens of thousands of years.”

99
Aiguo Dai, “Drought under global warming: a review”, Wiley InterDisciplinary Review: Climate Change, 2010; http://onlinelibrary.wiley.com/doi/10.1002/wcc.81/pdfAiguo Dai, “Increased drought under global warming in observations and models”, Nature Climate Change V.3, Jan. 2013, pp.52‐58.
Extreme Drought
Drought?

1010
Northeast BlackoutNew York City August 2003
Kristina Hamachi LaCommare, and Joseph H. Eto, LBNL
Power System Interruptions
Hurricane KatrinaAugust 2005
Midwest & Mid‐AtlanticDerechoJune 2012
1111
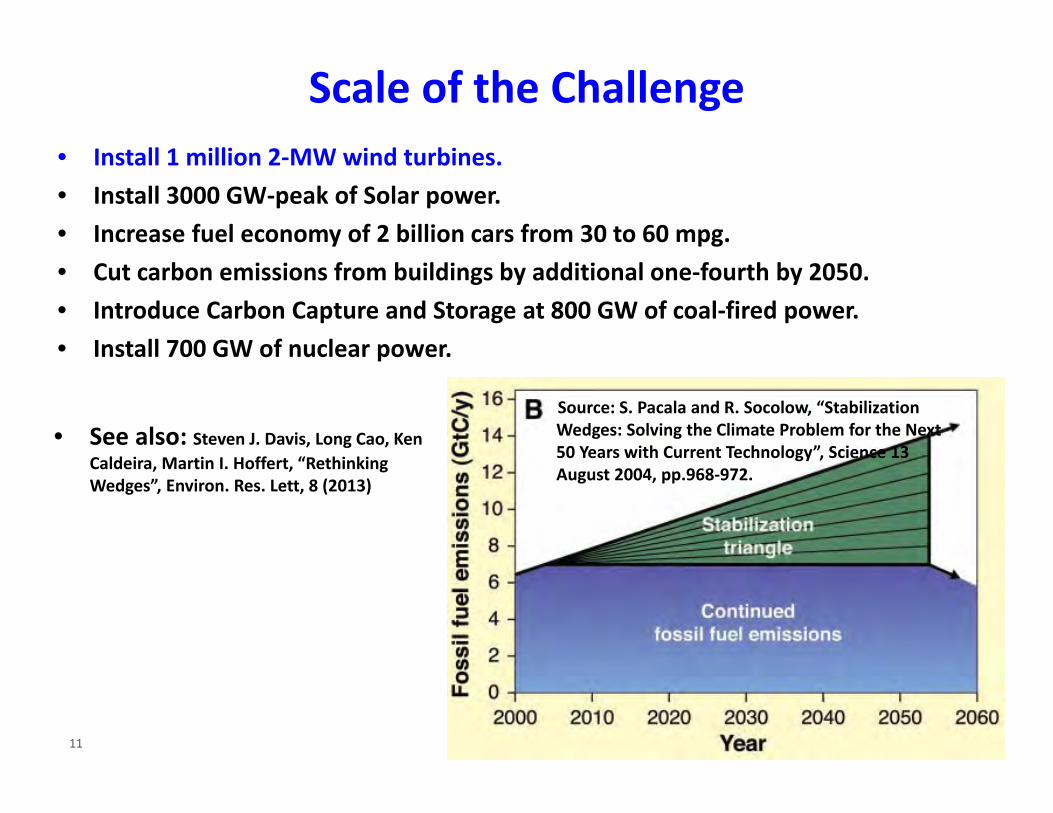
Scale of the Challenge• Install 1 million 2‐MW wind turbines.• Install 3000 GW‐peak of Solar power. • Increase fuel economy of 2 billion cars from 30 to 60 mpg.• Cut carbon emissions from buildings by additional one‐fourth by 2050.• Introduce Carbon Capture and Storage at 800 GW of coal‐fired power.• Install 700 GW of nuclear power.
Source: S. Pacala and R. Socolow, “Stabilization Wedges: Solving the Climate Problem for the Next 50 Years with Current Technology”, Science 13 August 2004, pp.968‐972.
• See also: Steven J. Davis, Long Cao, Ken Caldeira, Martin I. Hoffert, “Rethinking Wedges”, Environ. Res. Lett, 8 (2013)

1212
Time Constants• Political consensus building ~ 3-30+ years• Technical R&D ~10+ • Production model ~ 4+ • Financial ~ 2++ • Market penetration ~10++ • Capital stock turnover
– Cars ~ 15 – Appliances ~ 10-20– Industrial Equipment ~ 10-30/40+– Power plants ~ 40+ – Buildings ~ 80 – Urban form ~100’s
• Lifetime of Greenhouse Gases ~10’s‐1000’s• Reversal of Land Use Change ~100’s• Reversal of Extinctions Never
Speed and Scale

1313
Can EE & RE Meet These Challenges?
• Extending Current Options o Fossil/CCSo Nuclear
• Efficiencyo Buildingso Industryo Transportationo Smart End‐Use Equipment (dispatched w/ PV)o Plug‐In Hybrids/Smart Charging Stations
• Renewable Energy & Energy Storageo Biomasso Geothermalo Hydropowero Ocean Energyo Solar Photovoltaics / Smart Grid / Battery Storageo Solar Thermal / Thermal Storage / Natural Gaso Wind / Compressed Air Energy Storage / Natural Gas
• Transmission Infrastructureo Smart Grid
HOW FAR?HOW FAST? HOW WELL?
AT WHAT COST?BEST PATHWAYS?
BEST USE OF TAXPAYER FUNDS!

1414
Public Accountability Drives Program Evaluation
• OMB/OSTP:– OMB guidance on Increased Emphasis on Program Evaluation in Federal
Agencies: “…. evaluations can help the Administration and Congress determine how to spend taxpayer dollars effectively and efficiently…..”
– OSTP/OMB calls for R&D agencies to conduct evaluations and strengthen capacity
– OMB Performance Rating Assessment Tool (PART), 2003-2008; set expectations for periodic systematic evaluations to demonstrate results
• President:– ARRA unprecedented requirements for transparency & accountability, 2009
– Executive Order 13450: Improving Government Program Performance, November 2007; agencies shall spend tax payers dollars efficiently & effectively
• Congress:– House Committee Reports HEWD, 2008/2009/etc., calls for reporting on ROI
– “The Committee directs the Department to quantify and track the progress and impact of the substantial investments the Committee has made in the Energy Efficiency and Renewable Energy portfolio.”
– Assistant Secretary David Danielson, Testimony before HEWD, 2013-03-14
• And this is simply Good Management Practice

1515
NRC Review: Energy Research at DOE: Was It Worth It?
Energy Efficiency and Fossil Energy Research 1978‐2000
• Frameworko Economic; Environment; Security; Knowledgeo Realized; Projected; Options
• Impacts Analysiso Counterfactual with Five‐Year Ruleo Allow five‐year forward projection
• Findingso $1.6 B of RD&D Investment reviewedo Electronic Ballasts: $ 15 Bo Low‐E Windows: $ 8 Bo Refrigerator Compressors: $ 7 Bo SubTotal $30 B (1999$)
Realized Options KnowledgeEconomicEnvironmentalSecurity

1616
EERE Progress• Merit Review
– Federal Register notice establishing qualification guidelines– Established Central Database of Reviewers– Workshop with Association of Public & Land-Grant Universities on Best Practices, 2010
• In-Progress Peer Review– Ten minimum requirements: Frequency; Scope; Evaluation Criteria (Quality, Productivity,
Accomplishments, Relevance, Management); Documentation; etc. – Evaluation of Impact of In-Progress Peer Review: Hydrogen Program--$27M/$1.8M
• Stage-Gate Review– Strategic Fit; Feasibility; Market
Need and Attractiveness; Financials
• Impact Evaluations:• Completed more than 20 impact evaluation studies since 2008
• Benefit-Cost Analysis; Historical tracing; Bibliometrics; Econometrics; Statistics; etc.• Completed 5 knowledge diffusion impact studies– More than 90% of DOE’s retrospective impact evaluations conducted since 2008
have been done by EERE. Several EERE program evaluation resource guides have been made available to Federal Evaluators (Govt-wide) by GAO.
– http://www1.eere.energy.gov/ba/pba/performance_evaluation.html– http://www1.eere.energy.gov/analysis/pe_plans_reports.html
IMPACT Realized Projected OptionsEconomicEnvironmentalSecurityKnowledge

1717
Building EnvelopeWindows, Walls, Floors
Building Systems(“whole‐systems”)Design toolsSystem IntegrationBenchmarking(EnergyStar, LEED)
On‐Site Power SystemsBuilding Integrated PhotovoltaicsFuel Cells
Building EquipmentSpace conditioningLightsAppliancesSmart Controls
Low‐Energy Buildings(Buildings use ~40% of all energy, ~70% of electricity)
Reduce total building energy use by 60–70 percentHighly efficient, cost‐effective solid‐state lighting technologies, advanced windows and space heating and cooling technologies. Source: BTP
1818
18
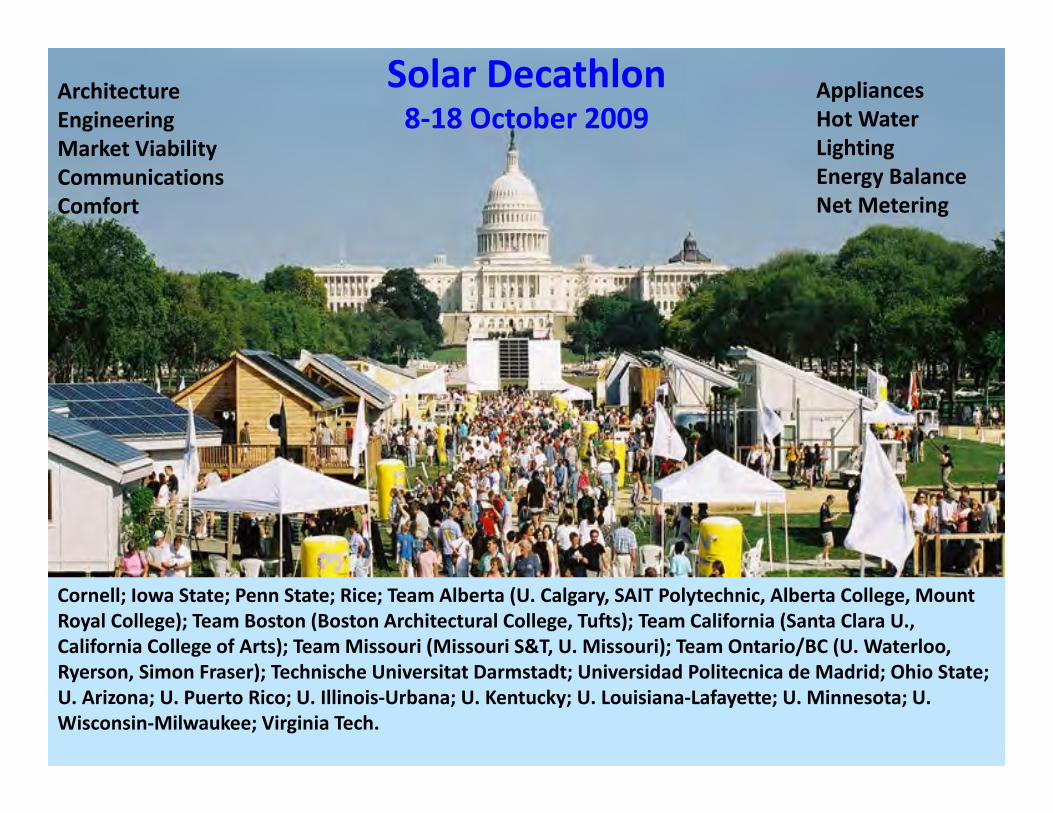
Solar Decathlon8‐18 October 2009
Cornell; Iowa State; Penn State; Rice; Team Alberta (U. Calgary, SAIT Polytechnic, Alberta College, Mount Royal College); Team Boston (Boston Architectural College, Tufts); Team California (Santa Clara U., California College of Arts); Team Missouri (Missouri S&T, U. Missouri); Team Ontario/BC (U. Waterloo, Ryerson, Simon Fraser); Technische Universitat Darmstadt; Universidad Politecnica de Madrid; Ohio State; U. Arizona; U. Puerto Rico; U. Illinois‐Urbana; U. Kentucky; U. Louisiana‐Lafayette; U. Minnesota; U. Wisconsin‐Milwaukee; Virginia Tech.
ArchitectureEngineeringMarket ViabilityCommunicationsComfort
AppliancesHot WaterLightingEnergy BalanceNet Metering
1919
19
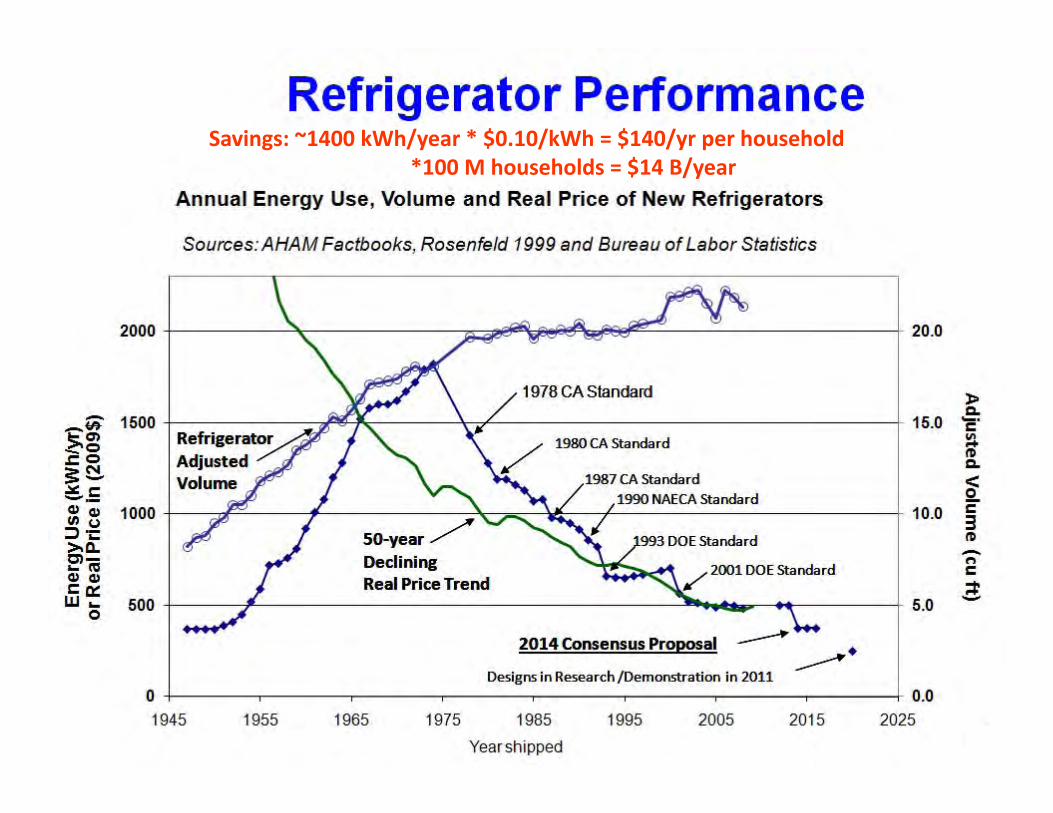
Savings: ~1400 kWh/year * $0.10/kWh = $140/yr per household *100 M households = $14 B/year

2020
Vehicle Combustion Engine R&D B‐C Study
• Vehicle R&D: Plug-In Hybrids
• R&D costs, 1986-2007: $931 million (2008$)• Cluster of Technologies in Vehicle Combustion Sub-program on heavy-duty
diesels: - laser diagnostic and optical engine technologies; combustion modeling- Not examined: emission control technologies; thermoelectrics; other
• Effect of EERE R&D in the 2 selected areas: fuel efficiency gain of 4.5%o Save 17.6 billion gallons of diesel fuel from 1995 through 2007, worth $34.5B (2008$)o Reduce emissions 177.3 MMTCO2, 0.063 tons NOx; 3.0 tons PM; 0.096 tons Sox;
saving $35.7 B o Security Benefits: Reduce imports equivalent of ~420 Million Barrels, 1% of imports
1995-2007o Knowledge Benefits: Foundation for 12+ important technologies in combustion;
advances in ion mobility spectrometry
Source: Ruegg & Jordan, 2010

2121
Wind Resources
• Highest quality wind resources are located in the Central states and offshore• Combined onshore and offshore (fixed‐bottom) resource is ~10,000 GW

2222
Typical Rotor Diameters
.75 MW 1.5 MW 2.5 MW 3.5 MW 5 MW
50m (164 ft)
66m (216 ft)
85m (279 ft)
100m (328 ft)747
120m (394 ft)
Boeing
Wind Power
GE Wind 1.5 MW
Source: EERE/WTP
The total economic benefits were $9.9 billion (2008$) on $1.2 B invested in: • Turbulence models; • Wind tunnel experiments of
turbine aerodynamics; • Blade materials; • Airfoil design codes; • Demonstration and testing.

2323
Cumulative Installed PV(through 2009)
Germany9,785 MW
Spain3,386 MW
Japan2,633 MW
Rest of World2,374 MW
U.S.1,650 MW
Rest of E.U. 1,333 MW
Italy 1,167 MW China 305 MW
France 272 MW
Can Solar Energy Meet the Challenge?
Source: EERE/SETP, Goldstein
• Solar technologies have enormous resource potential: ~80,000 GW for utility PV, ~700 GW for rooftop PV, and ~37,000 GW for CSP

2424
Highlights from Solar• The economic benefits were $18.7 billion
(2008$) on $3.7B examined of program investment in: Crystalline silicon PV module technologies, Thin Film PV module technologies, Manufacturing technologies, Technology infrastructure for measurement, characterization, and reliability. (A. O’Connor, R. Loomis, F. Braun, “Retrospective Benefit-Cost Evaluation of DOE Investment in Photovoltaic Energy Systems”, August 2010, USDOE/EERE)
• Patent Analysis: DOE supported research linked to 30% of the patent families for the top PV innovators from 1974-2008. (Ruegg, R., Thomas, P. (2011) Linkages form DOE’s Solar Photovoltaic R&D to Commercial Renewable Power from Solar Energy.Washington, D.C.: USDOE/EERE
• Efficiency Records: Separate Solar Program estimates are that roughly 57% of the world record cell efficiencies from 1975-2011 were made by researchers supported by the DOE.
• Incubator $60M $1.6B VC investment

2525

2626
Concentrating Solar Thermal Power
Systems in placeo 354 MW Trough, 1984‐1990, ~14¢/kWho 1 MW Trough, Arizona, 2006o 64 MW Trough, Nevada, 2007o 5 MW Kimberlina Linear Fresnel, CA
2008o Much more in planning, construction…
Cost Reduction Potentialo CSP costs ~8 cents/kWh w RD&D.
– Scale‐up ~37%– Volume Production ~21%– Technology Development ~42%
Direct‐Normal Solar Resource for the Southwest U.S.
Map and table courtesy of NREL
Filters:Transmission>6.75kWh/m2dEnvironment X Land Use XSlope < 1%
State Land Area (mi2)
Solar Capacity
(MW)
Solar Generation
Capacity (GWh)
AZ 13,613 1,742,461 4,121,268CA 6,278 803,647 1,900,786CO 6,232 797,758 1,886,858NV 11,090 1,419,480 3,357,355NM 20,356 2,605,585 6,162,729TX 6,374 815,880 1,929,719UT 23,288 2,980,823 7,050,242
Total 87,232 11,165,633 26,408,956

2727
Geothermal Resources and Technologies
• U.S. capacity is ~3,086 MW; ~7,000 MW under study
Geothermal Data: http://www.scientificamerican.com/article.cfm?id=new-geothermal-data-system
The net economic benefits were $35.8 billion (2008$), on the reviewed program investment of $1.4B in:• Polycrystalline diamond compact (PDC) drill bit;• Binary cycle power plant technology;• TOUGH series of reservoir models;• High-temperature geothermal well cements.

2828
28
May or may nothave benefits; Not yet examined
Known to havebenefits; Not yet examined
Known to not have benefits; Not examined
Known and quantified
Total Benefits* >$350B
Economic returns analyzed to date
•Biomass
•Building Technologies
•FEMP
•Fuel Cell Technologies
•Geothermal Technologies
• Industrial Technologies
•Solar Energy Technologies
•Vehicle Technologies
•Weatherization and Intergovernmental
•Wind and Water Power
Total Public Investment$50 Billion*
a All dollars are expressed in 2008 inflation-adjusted dollars, not discounted.b $326B net benefits = $350B total benefits - $24 investment in six programs.* Preliminary
$ Billion
(200
8$)
•Building Technologies
•Geothermal Technologies
• Industrial Technologies
•Solar Energy Technologies
•Vehicle Technologies
•Wind and Water Power
Public investment in six EERE programs
$24 Billion*
Selected for
Review
• BTP subprograms• GTP subprograms• ITP• SETP subprogram• VTP subprogram• Wind subprograms
Investment in specific technologies evaluated
$9 Billion*Selected
for Evaluation

2929
29
EERE Patent Analyses: Summary MetricsMeasure Wind program SETP solar PV GTP VTP combustion
engine R&DVTP energy storage R&D
Period Covered Mid‐1970s through 2008a
% of other patents in field linked to EERE‐attributed patents; and citation rate
25% 30% 21%
‐‐
(Citation rate:2.35)
18%
(Citation rate:2.17)
EERE rank & otherorganization rank
EERE #1 (United Technologies, #2)
EERE #1 (BP Solar & ECD,also #1)
EERE #2 (Chevron, #1)
EERE #2 (Nissan, #1)
EERE #2 (Matsushita, #1)
High impact DOE‐attributedpatents & citation index (CI)b
• Retractable rotor blades (CI=6.90)
• Variable speed wind turbine (CI=6.58)
• Doubly fed generator control system
• Fabricating nanostructures & nanowires (CI=27.04)
• Nondestructive method for detecting defects (CI=6.48)
• Drilling using high pressure fluids (CI=6.08)
• Kalina cycle (CI=5.14)
• Drilling horizontal holes from a vertical bore
• HCCI engine (CI=8.51)
• Fuel injection (CI=6.05)
• Ion mobility spectrometer (CI=5.41)
• Ultracapacitor (CI=4.65)
• Lithium ion (CI=4.55)
• Carbon foams (CI=5.82)
a The beginning data series for the 5 studies are somewhat variable, though they each aim to examine the period from the mid‐1970s through 2008. b The Citation Index (CI) is a normalized measure derived by dividing the number of citations received by a patent by the mean number of citations received by peer patents from the same issue year and technology as indicated by its Patent Office Classification (POC).

3030
Renewable Electricity SystemsPhotovoltaics
Concentrating Solar Power (CSP)
Distributed GenerationDemand ResponseDistributed StorageSmart Grid
Plug‐in Hybrids
Wind
• Energy Intensity• Site Specificity• Variability & Uncertainty• System Integration
Geothermal
Hydropower BioPower

3131
RE Futures Modeling Framework
Technology cost & performanceResource availabilityDemand projectionDemand-side technologiesGrid operationsTransmission costs
ITI Projection (by Black & Veatch)
ETI Projections (by Tech Teams)
Flexible Resources
End-Use Electricity
System Operations
Transmission
GridView(by ABB Inc.)
(hourly production cost)
rooftop PVpenetration
2050 mixof generators
does it balancehourly?
ImplicationsGHG Emissions
Water UseLand Use
Direct Costs
Capacity & Generation 2010‐2050
Only currently commercial technologies were modeled, with incremental and evolutionary improvements.
Renewable Electricity Futures Study (2012):Hand, M.M.; Baldwin, S.; DeMeo, E.; Reilly, J.M.; Mai, T.; Arent, D.; Porro, G.; Meshek, M.; Sandor, D., editors. Lead authors include: Mai, T.; Sandor, D.; Wiser, R.; Brinkman, G.; Heath, G.; Augustine, C.; Bain, R.; Chapman, J.; Denholm, P.; Drury, E.; Hall, D.; Lantz, E.; Margolis, R.; Thresher, R.; Hostick, D.; Belzer, D.; Hadley, S.; Markel, T.; Marnay, C.; Milligan, M.; Ela, E.; Hein, J.; Schneider, T.; et al.‐ A U.S. DOE sponsored collaboration among more than 110 individuals from about 35 organizations.

3232
ReEDS OutputsBaseline scenario 80% RE‐ITI scenario
• Renewable generation sources could supply 80% of U.S. Electricity in 2050• Operational challenges (curtailment, forecast, reserves) grow with deployment of VRE• Transmission expansion can be significant with high RE targets • Storage deployment grows with increasing RE targets

3333
Summer Peak
SpringOff‐Peak
Baseline 80% RE‐ITI Case
Electricity supply and demand can be balanced in every hour of the year in each region with 80% electricity from renewables*
*Full reliability analysis not conducted in RE Futures
3434
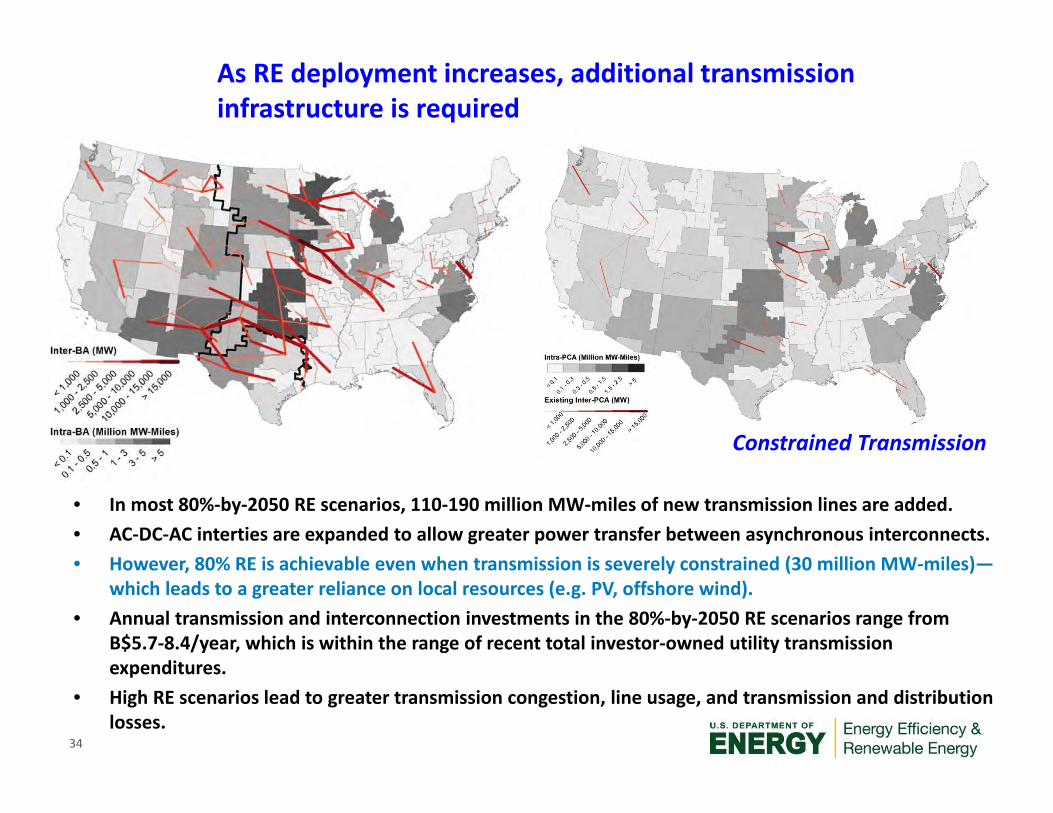
As RE deployment increases, additional transmission infrastructure is required
• In most 80%‐by‐2050 RE scenarios, 110‐190 million MW‐miles of new transmission lines are added.• AC‐DC‐AC interties are expanded to allow greater power transfer between asynchronous interconnects.• However, 80% RE is achievable even when transmission is severely constrained (30 million MW‐miles)—
which leads to a greater reliance on local resources (e.g. PV, offshore wind).• Annual transmission and interconnection investments in the 80%‐by‐2050 RE scenarios range from
B$5.7‐8.4/year, which is within the range of recent total investor‐owned utility transmission expenditures.
• High RE scenarios lead to greater transmission congestion, line usage, and transmission and distribution losses.
80% RE‐ITI scenario Constrained Transmission

3535
Incremental cost associated with high RE generation is comparable to published cost estimates of other clean energy scenarios
• Incremental cost reflects replacement of existing generation plants with new generators and additional balancing requirements (combustion turbines, storage, and transmission) compared to baseline scenario (continued evolution of today’s conventional generation system)
• Improvement in cost and performance of RE technologies is the most impactful level in reducing the incremental cost
• Cost is less sensitive to the assumed electric system constraints (transmission, flexibility, RE resource access)
$0
$20
$40
$60
2010 2020 2030 2040 2050
Rea
l 200
9$/M
Wh
Core 80% RE (ReEDS) EIA 2009cEPA 2009a EIA 2010bEPA 2010 EIA 2011a
EIA 2011b
Increase in retail electricity price relative to reference/baseline
Source: Renewable Electricity Futures (2012)
-$20 -$10 $0 $10 $20
Fossil-HTI
Higher Fossil Fuel
Lower Fossil Fuel
High Demand
Constr. Res.
Constr. Flex.
Constr. Trans.
80% RE-NTI
Difference in 2050 Electricity Price Relative to 80% RE-ITI
[Real 2009$/MWh]
80% RE-ETI

3636
80% renewable electricity in 2050 could lead to:• ~ 80% reduction in GHG emissions (combustion-only and full life-cycle)• ~ 50% reduction in electric sector water use (withdrawals and
consumption)
High RE Reduces Emissions and Water Use

3737
RE Land Use Implications
• Area requirements:o Gross estimate for RE Futures
scenarios: < 3% of US land areao About half used for biopowero Majority of remainder for wind, but
only about 5% is actually disturbed
• Siting issues:o Permitting processes vary with technology and locationo Wildlife and habitat disturbance concernso Public engagement for generation and transmission—landscape, noise
* USDA 2010, ** Denholm & Margolis 2008
80% RE scen
arios
Gross Land Use Comparisons (000 km2)
Biomass 44‐88
All Other RE 52‐81
All Other RE, disrupted 4‐10Transmission & Storage 3‐19
Total Contiguous U.S. 7,700Major Roads** 50Golf Courses ** 10
* USDA 2010, 2012 ** Denholm & Margolis 2008

3838
Clean Energy to Secure America’s Future
“We have a choice. We can remain the world's leading importer of oil, or we can become the world's leading exporter of clean energy. We can hand over the jobs of the future to our competitors, or we can confront what they have already recognized as the great opportunity of our time: the nation that leads the world in creating new sources of clean energy will be the nation that leads the 21st century global economy. That's the nation I want America to be." – President Obama,
Nellis Air Force Base, Nevada, 5/27/09

3939
2010 2050
A Transformation of the U.S. Electricity System
• RE generation from technologies that are commercially available today, in combination with a more flexible electric system, is more than adequate to supply 80% of total U.S. electricity generation in 2050—while meeting electricity demand on an hourly basis in every region of the country.
• The abundance and diversity of U.S. renewable energy resources can support multiple combinations of renewable technologies to achieve high levels of renewable electricity use, and result in deep reductions in electric sector greenhouse gas emissions and water use.
http://rpm.nrel.gov/refhighre/dispatch/dispatch.html
For more informationhttp://[email protected]