energy efficiency education
TRANSCRIPT

SAVING ENERGY TEACHER GUIDESecondary
2019-2020
ENERGY EFFICIENCY EDUCATION
Brought to you by:
We spark curiosity about energy.

2 ©2019 The NEED Project www.NEED.org Ohio Energy Project www.ohioenergy.org
ENERGY EFFICIENCY EDUCATION
Welcome to Ohio Energy Project’s (OEP) EnergyEfficiency Program – providing teachers the training,curriculum, and hands-on laboratory equipment tohelp spark curiosity about energy in the classroom.
Through an innovative school laboratory approach,students receive a free Energy Efficiency Kit to helpeducate their families, friends, and communities about responsible energy usage. By installing the efficiency measures provided to them in their own homes or throughout their communities, students are leading the next generation of energy consumers and saving both energy and money. Upon completion of this program, students are asked to fill out an installation survey, which is completely anonymous, to report on the measures most useful to them.
Our energy efficiency education partners generouslyprovide this program at no cost to schools, educators,and families in their service territories. Those partnersinclude:
� AEP Ohio� Columbia Gas of Ohio� Dayton Power & Light� Ohio’s Electric Cooperatives� Vectren, A CenterPoint Energy Company
Energy Data Used in MaterialsMost statistics and data contained within these materials are derived from the U.S. Energy Information Administration. Data is collected and updated annually where available. Where annual updates are not available, the most current, complete data year is accessed. For access to data, visit www.eia.gov.
Ohio’s Learning StandardsAll curriculum is aligned to Ohio’s Learning Standards.These standards reflect what all students should knowand be able to do to become scientifically literate citizens. These standards equip students with knowledge and skills for the 21st century workforce and higher education. For more information on how the curriculum aligns to your standards, visit:www.ohioenergy.org.
Program HistorySince 2009, many of Ohio’s electric and gas utilities have partnered with OEP to deliver innovative education programs for Ohio’s educators and free energy efficiency kits for Ohio families. The installation of these measures have been claimed as savings to the Public Utilities Commission of Ohio as part of the utilities’ residential efficiency plans.
Who We AreThe Ohio Energy Project (OEP) is a nonprofit organization that has been energizing classrooms since 1984. Serving the Buckeye State, we are committed to inspiring leadership and energy innovation in students and teachers.
Our Education PartnerOEP partners with the National Energy Education Development (NEED) Project to design an innovative, succinct, and user-friendly curriculum ready for the classroom. The mission of NEED is to promote an energy conscious and educated society by creating effective networks of students, educators, business, government and community leaders to design and deliver objective, multi-sided energy education programs.

©2019 The NEED Project www.NEED.org Ohio Energy Project www.ohioenergy.org 32 ©2019 The NEED Project www.NEED.org Ohio Energy Project www.ohioenergy.org
SAVING ENERGY
Table of Contents �Program Overview 4
�Pre-Poll 5
�Lesson 1: What is Energy? A Review 6
�Lesson 2: Thermal Energy 19
�Lesson 3: Electrical Energy 36
�Lesson 4: Energy as a System 56
�Lesson 5: What We Have Learned 71
�Post-Poll 72
SECONDARY TEACHER GUIDE
BASIC MATERIALS• Water Flow Bag
• Hot Water Temperature Gauge
• Weather Stripping
AEP/Columbia Gas of Ohio
and AEP Only• Aerator Bath/Kitchen
• LED bulb - 9W(2), 11W(1)
• Nightlight
• Plumber’s Tape
• Refrigerator/Freezer Thermometer
• Scratch and Sniff (only AEP/Columbia Gas of Ohio)
• Showerhead
COH Only• Aerator Bath/Kitchen
• LED Bulb
• Plumber's Tape
• Scratch and Sniff
• Showerhead
DPL/Vectren• Aerator Bath (2)/Kitchen
• Thermostat Temperature Guide
• LED bulb (2)
• Nightlight
• Plumber’s Tape
• Refrigerator/Freezer Thermometer
• Scratch and Sniff
• Showerhead
Ohio's Electric Cooperatives• Door Sweep
• Draft Stoppers
• Thermostat Temperature Guide
• LED bulb (2)
• Nightlight
• Refrigerator/Freezer Thermometer
Efficiency Kit Materials*Students receive all materials listed below “Basic Materials” and thematerials below their utility sponsor.
ALUMNI TEACHERS General
• Teacher & Student Guides
Lesson One• Gram Scale • Hanging Balance Scale
Lesson Three• Light Meter
Lesson Four• Hygrometer • Infrared Thermometer
CLASSROOM MATERIALS
2019-2020 New Teacher Materials• NEED Infobooks • Teacher & Student Guides
Energy 101• Baseload Balance
• Energy Source Match Up
Lesson One: What is Energy? A Review• Gram Scale
• Hanging Balance Scale
Lesson Two: Thermal Energy• Insulation Containers
• Testing Containers
Lesson Three: Electrical Energy• Goose Neck Lamps
• Light Meter
Lesson Four: Energy as a System• Hygrometer
• LCD Thermometers
• Hot Water Temperature Gauges
• Energy Flows
• Safety Sort
• Digital Thermometers
• IL, CFL, LED Bulbs
• Kill A Watt® Meters
• Infrared Thermometer
• Flow Meter Bags
*Some materials may be used for multiple lessons.
• Paper Clips

4 ©2019 The NEED Project www.NEED.org Ohio Energy Project www.ohioenergy.org
Program Overview
Materials Overview
OEP Web Login: Name = teacher email as of 9/1 Password = teacher last name
Checklist
LESSON MATERIALS1. What is Energy? A Review NEED Infobooks Energy 101
Gram Scale Hanging Balance Scale
2. Thermal Energy Insulation Containers Digital ThermometersTesting Containers
3. Electrical Energy Goose Neck Lamps IL Bulbs CFL Bulbs LED BulbsDigital Thermometers Light MeterKill A Watt® Meters
4. Energy as a System Digital Thermometers Light MeterInfrared Thermometer Flow Meter Bags
HygrometerKill A Watt® MetersLCD ThermomtersHot Water Temp. Gauges
TASK DUE DATE COMMENTConfirm Student Count September Confirm early to receive kits in a timely
manner
Student Kits Shipped October/November Count kits as soon as received
Teach Lessons September – March Teach lessons as best fits your classroom
Home Installation Survey April 15 (no extension available) Take the online survey or mail in paper copies
Teacher Evaluation April 15 (no extension available) Stipends mailed prior to end of school year
Pre & Post Scores April 15 (no extension available) Provide average scores for pre and post polls on your teacher evaluation
NEED Portfolio (optional) *required to attend Youth Energy Celebration
April 15 Document efficiency activities as you teach to create a PowerPoint portfolio
Youth Energy Celebration (optional) May Student accomplishments are recognized at luncheon

©2019 The NEED Project www.NEED.org Ohio Energy Project www.ohioenergy.org 54 ©2019 The NEED Project www.NEED.org Ohio Energy Project www.ohioenergy.org
Energy Efficiency Pre-Poll1. ______________ is an example of a form of energy.
a. Thermal b. Biomass c. LED d. Lumens
2. What unit measures power?
a. Inch b. Foot-candle c. Watt d. Work
3. Which energy sector includes schools?
a. Transportation b. Industrial c. Commercial d. Residential
4. Energy ________ refers to a behavior that reduces energy usage.
a. Conservation b. Efficiency c. Transformation d. Awareness
5. ________ refers to the capacity of an insulating material to resist heat flow.
a. Building Envelope b. R-Value c. Weatherization d. System
6. Of the following, which is the largest consumer of water?
a. Thermoelectric Power Plant b. Residential Homes c. Restaurants d. Schools
7. The _________ is a nationwide network of transmission lines.
a. Transformer b. Substation c. Distribution Line d. Grid
8. What label ensures consumers that a product saves energy?
a. Energy Star b. EnergyGuide c. Energy Smart d. Energy Aware
9. On average, schools use 17% of their electricity consumption to do what?
a. Cook Food b. Operate Computers c. Light Buildings d. Heat Rooms
10. Which of the following is a career involved with the energy industry?
a. Recycling Coordinator b. LEED Construction c. Mechanical Engineer d. All

6 ©2019 The NEED Project www.NEED.org Ohio Energy Project www.ohioenergy.org
Lesson 1: What is Energy? A Review
t Overview This lesson is a review of basic energy concepts and is divided into four mini lessons. These mini lessons include energy forms and sources, measuring energy, energy economics, and energy efficiency and conservation.
Depending on the prior knowledge of your students, you may want to spend additional time on these topics using the Energy Infobooks available at www.NEED.org for primary, elementary, intermediate, and secondary reading levels.
Objectives:Students will be able to:� identify the forms and sources of energy;� identify and use various units of measure while studying energy; � explain how various sectors of the economy use energy and identify how production and consumption of energy has changed
throughout history in the United States;� differentiate between energy efficiency and energy conservation and provide examples of each.
OEP Provided Materials �NEED Infobooks �Gram Scale �Energy 101 �Hanging Balance Scale
Procedure1. Distribute one Student and Family Guide to each student.
2. Read over the Message to Families with students and have them share with the adults in their household prior to conducting the unit.
3. Administer the pre-poll and find the average score. Save this score to report on your teacher evaluation at the end of the program.
4. Introduce the unit as a study of energy — what it is, where we get it, how we use it, and ways we can conserve it.
1Student Guide Lessons
Lesson 1A: Energy Forms & Sources1. Review the forms of energy, energy transformations, and the sources of energy.
2. Go to the Forms and Sources of Energy worksheet in the Student and Family Guide. Instruct students to use their knowledge of the forms and sources as well as the provided chart to fill out the worksheet.
Lesson 1B: Measuring Energy1. Review the provided energy definitions and units of measure.
2. Go to the Human Power activity in the Student and Family Guide and have students complete the lab.
Pre-Poll Answer Key1. a 2. c 3. c 4. a 5. b 6. a 7. d 8. a 9. c 10. d
LESSON PLAN
Teacher Provided Materials � 1 - 2 Liter bottle� Pole (such as 1" dowel rod) � Thin Rope � Meter S tick
� Stopwatch

©2019 The NEED Project www.NEED.org Ohio Energy Project www.ohioenergy.org 76 ©2019 The NEED Project www.NEED.org Ohio Energy Project www.ohioenergy.org
Lesson 1C: Energy Economics1. Review the sectors of the economy and their consumption of energy.
2. Go to the Energy through the Decades worksheet in the Student and Family Guide. Instruct students to use the provided energytimeline and provided charts to complete the worksheet.
Lesson 1D: Energy Efficiency and Conservation1. Review the information on energy efficiency and energy conservation.
2. Go to the Efficiency vs. Conservation worksheet in the Student and Family Guide. Instruct students to use their knowledge ofefficiency and conservation to complete the worksheet.
2Supplemental LessonsBaseload Balance� Locate the activity in Energy 101 and refer to the instruction sheet.
� Have students explore the concept of balancing the demand and generation of electricity.
Energy Flows� Locate the activity in Energy 101 and refer to the instruction sheet.
� Have students trace the energy flow for each energy source.
Energy Source Match Up� Locate the activity in Energy 101 and refer to the instruction sheet.
� Have students explore the different sources of energy by forming a group to identify the safety, availability, economics, and environmental issues associated with their sources.
+Home and Community Action1. Distribute any kit items associated with the lesson and have students install these measures at home or within their community.
2. Have students complete the questions regarding their kit items on the Home & Community worksheet in the Student and FamilyGuide.
3. Have students complete the Web Quest online by visiting various local government and utility websites.
4. Review the Related Careers with students and discuss what pathways students may pursue after graduation.

8 ©2019 The NEED Project www.NEED.org Ohio Energy Project www.ohioenergy.org
What Is Energy?Energy allows us to do the things we do every day.
Transportation, cooking, even the functioning of your body are
all dependent upon energy. Energy changes forms, can be stored,
and is almost always in flux.
Energy is defined as the ability to do work or produce change.
When energy is stored, we refer to it as potential energy. When it
is currently in use, it is called kinetic energy.
Forms of EnergyEnergy is found in different forms, such as light, heat, sound, and
motion. There are many forms of energy, but they can all be put
into two categories: potential and kinetic.
POTENTIAL ENERGY Potential energy is stored energy and the energy of position, or gravitational potential energy. There are several forms of potential energy.
� Chemical energy is energy stored in the bonds of atoms and molecules. It is the energy that holds these particles together. Biomass, petroleum, natural gas, propane, and the foods we eat are examples of stored chemical energy.
�Elastic energy is energy stored in objects by the application of a force. Compressed springs and stretched rubber bands are examples of elastic energy.
�Nuclear energy is energy stored in the nucleus of an atom; it is the energy that holds the nucleus together. The energy can be released when the nuclei are combined or split apart. Nuclear power plants split the nuclei of uranium atoms in a process called fission. The sun combines the nuclei of hydrogen atoms in a process called fusion.
�Gravitational potential energy is the energy of position or place. A rock resting at the top of a hill contains gravitational potential energy because of its position. Hydropower, such as water in a reservoir behind a dam, is an example of gravitational potential energy.
KINETIC ENERGY Kinetic energy is motion; it is the motion of waves, electrons, atoms, molecules, substances, and objects.
Forms of Energy
Chemical Energy
Elastic Energy
NuclearEnergy
GravitationalPotential Energy
ElectricalEnergy
RadiantEnergy
ThermalEnergy
MotionEnergy
SoundEnergy
POTENTIAL KINETIC
�Electrical energy is the movement of electrons. Everything is made of tiny particles called atoms. Atoms are made of even smaller particles called electrons, protons, and neutrons. Applying a force can make some of the electrons move. Electrons moving through a wire are called electricity. Lightning is another example of electrical energy.
� Radiant energy is electromagnetic energy that travels in vertical (transverse) waves. Radiant energy includes visible light, x-rays, gamma rays, and radio waves. Solar energy is an example of radiant energy.
�Thermal energy, or heat, is the internal energy in substances; it is the vibration and movement of the atoms and molecules within a substance. The more thermal energy in a substance, the faster the atoms and molecules vibrate and move. Geothermal energy is an example of thermal energy.
�Motion energy is the movement of objects and substances from one place to another. Objects and substances move when an unbalanced force is applied according to Newton’s Laws of Motion. Wind is an example of motion energy.
�Sound energy is the movement of energy through substances in longitudinal (compression/rarefaction) waves. Sound is produced when a force causes an object or substance to vibrate; the energy is transferred through the substance in a longitudinal wave.
Background Information: What is Energy? A ReviewLESSON 1A: Forms and Sources

©2019 The NEED Project www.NEED.org Ohio Energy Project www.ohioenergy.org 98 ©2019 The NEED Project www.NEED.org Ohio Energy Project www.ohioenergy.org
Energy TransformationsThe Law of Conservation of Energy says that energy is neither created nor destroyed.
When we use energy, we do not use it completely — we change its form. That’s really what we mean when we say we are using energy. We are changing one form of energy into another. A car engine burns gasoline, converting the chemical energy in the gasoline to motion energy that makes the car move. Old-fashioned windmills changed the kinetic energy of the wind into motion energy to grind grain. Solar cells change radiant energy into electrical energy. Energy changes form but the total energy in the system remains the same.
Sources of EnergyWe use many different energy sources to do work for us. They are classified into two groups — renewable and nonrenewable.
RENEWABLE ENERGYRenewable energy sources are replenished in a short period of time.
� Biomass is any organic matter that can be used as an energy source, such as wood, crops, and yard waste.
� Geothermal energy is heat from within the earth.
� Hydropower is energy that comes from the force of moving water.
� Solar energy is radiant energy from the sun.
�Wind is energy from moving air.
NONRENEWABLE ENERGYNonrenewable energy sources are limited since it takes a very long time to replenish their supply.
�Coal is a solid, black fossil fuel formed from the remains of plants that lived and died millions of years ago.
�Natural Gas is a colorless, odorless fossil fuel made mostly of methane.
�Petroleum is a fossil fuel that looks like a black liquid. It is also known as crude oil.
�Propane is a fossil fuel refined from natural gas and petroleum.
�Uranium is the fuel used by most nuclear power plants. During nuclear fission, atoms are split apart to form smaller atoms, which releases energy.
Petroleum 37%Uses: transportation,manufacturing - Includes Propane
Biomass 4.9%Uses: electricity, heating, transportation
NONRENEWABLE, 89.5%
U.S. Energy Consumption by Source, 2016
RENEWABLE, 10.4%
Hydropower 2.5%Uses: electricity
Natural Gas 29.2%Uses: electricity, heating,manufacturing - Includes Propane
Geothermal 0.2%Uses: electricity, heating
Coal 14.6%Uses: electricity, manufacturing
Wind 2.2%Uses: electricity
Uranium 8.7%Uses: electricity
Propane Uses: heating, manufacturing
Solar 0.6%Uses: electricity, heating
Data: Energy Information Administration**Total does not equal 100% due to independent rounding.
*Propane consumption is included in petroleum and natural gas �gures.

10 ©2019 The NEED Project www.NEED.org Ohio Energy Project www.ohioenergy.org
RENEWABLEBiomass _______________________
Hydropower _______________________
Wind _______________________
Solar _______________________
Geothermal _______________________
NONRENEWABLEPetroleum _______________________
Coal _______________________
Natural Gas _______________________
Uranium _______________________
Propane _______________________
What percentage of the nation’s energy is provided by each form of energy?
Chemical _____
Nuclear _____
Motion_____
Thermal _____
Radiant _____
What percentage of the nation’s energy is provided
By nonrenewables? ______
By renewables? ______
In the United States we use a variety of resources to meet our energy needs. Use the information below to analyze how each energy source is stored and delivered.
Look at the U.S. Energy Consumption by Source graphic below and calculate the percentage of the nation’s energy use that each form of energy provides.
Using the information from the Forms of Energy section and the graphic below, determine how energy is stored or delivered in each of the sources of energy. Remember, if the source of energy must be burned, the energy is stored as chemical energy.
1
2
Forms and Sources of Energy
**Total does not add up to 100% due to independent rounding.Data: Energy Information Administration
BIOMASS 4.9%Uses: heating, electricity,transportation
COAL 14.6%Uses: electricity,manufacturing
GEOTHERMAL 0.2%Uses: heating, electricity
HYDROPOWER 2.5%Uses: electricity
PETROLEUM 37%Uses: transportation,manufacturing - includes propane
PROPANE Uses: heating,manufacturing
URANIUM 8.7%Uses: electricity
WIND 2.2%Uses: electricity
SOLAR 0.6%Uses: heating, electricity
RENEWABLENONRENEWABLE
U.S. Energy Consumption by Source, 2016
NATURAL GAS 29.2%Uses: heating, manufacturing, electricity - includes propane
*Propane consumption is included in petroleum and natural gas totals.
ANSWER KEY
Chemical
Chemical
Chemical
Nuclear
Chemical
Chemical
Mechanical
Mechanical
Radiant
Thermal
85.7%
8.7%
4.7%
0.2%
0.6%
89.5%
10.4%
LESSON 1A

©2019 The NEED Project www.NEED.org Ohio Energy Project www.ohioenergy.org 1110 ©2019 The NEED Project www.NEED.org Ohio Energy Project www.ohioenergy.org
Lesson 1B: Measuring Energy
The following are common terms that pertain to energy. You may recognize a few of these terms and formulas as you progress through this guidebook.
Term Definition Formula(if applicable)
Unit(if applicable)
Energy The ability to do work or produce change.
Work A force causing the movement of an object. = force x distance JoulePower The rate at which work is done. = work / avg. time Watt
Mass The amount of matter in an object.
Force The push or pull on an object that causes it to accelerate.
= mass x acceleration (a=9.81 m/s2)
Newton
Joule The amount of energy exerted when a force of one newton is applied over one meter.
Watt Unit of power; one watt is equal to one joule of work done per second.
Kilowatt 1,000 watts. = watt(s) x 1000
Kilowatt-hour The amount of electricity used in one hour. = kilowatt(s) / # of hours
Foot-candle Measurement of light intensity; the illuminance of one square foot surface from a uniform light source.
Volt Unit of electric potential; often referred to as a "push" that causes electric charges to move.
= current x resistance
Ampere Standard unit of electric current. = watts / volts
Lumen The measure of brightness from a light source.
BTU (British Thermal Unit)
The amount of heat required to raise the temperature of one pound of water by one degree Fahrenheit.
Therm A unit of heat equal to 100,000 BTUs. = BTU(s) x 100,000
Quad A unit of energy equal to 1 quadrillion (1015) BTUs.*Quadrillion = 10,000,000,000,000,000
= BTU(s) x 1015

12 ©2019 The NEED Project www.NEED.org Ohio Energy Project www.ohioenergy.org
ANSWER KEY
Human PowerPurposeWork and power are important energy concepts and both are defined on the previous page. The goal of this experiment is to
get familiar with these concepts.
Materials� Scale� Stopwatch� 1 - 2 Liter bottle filled with water
Procedure1. Find the mass of the bottle of water in kilograms and record on the chart below.
2. Attach one end of the rope to the bottle and the other end of the rope to the middle of the pole.
3. Measure the distance of the rope from the pole to the bottle and record on the chart below.
4. Have each person hold the pole horizontally so that the bottle is suspended in air. Twist the pole so the rope winds around it, lifting the bottle. Time how fast each person can wind the rope to bring the bottle all the way up to the pole. Record your data in seconds.
5. Repeat so that each person has 3 tries.
6. Using the given mass for your bottle, calculate Force using the chart below.
7. Use the chart to calculate average time for each person, work, and power in watts
Person Mass (kg) Force (N) = mass x
acceleration(a = 9.81 m/s2)
Distance (m) Time (sec) Average Time (sec)
Work (Joule)= force x
distance
Power (Watts)= work ÷ avg.
time
? Questions1. What does it mean if one person has a higher value for power?
2. How many of you would it take to light a 60W bulb?
� Meter Stick� Pole (such as 1” dowel rod)� Thin rope
1.
2.
3.1.2.
3.
1.
2.
3.
LESSON 1B
Jess .5 4.9 116.5
1716
16.5 4.9 .3
A higher value for power means that the person had a quicker average time as the work (force and distance) remained the same for everyone.
Answers will vary. Students will find this answer by dividng 60W by their calculated power above.

©2019 The NEED Project www.NEED.org Ohio Energy Project www.ohioenergy.org 1312 ©2019 The NEED Project www.NEED.org Ohio Energy Project www.ohioenergy.org
Lesson 1C: Energy EconomicsImagine how much energy you use every day. You wake up to an electric alarm clock and charge your cell phone. You take a shower with water warmed by a hot water heater using electricity or natural gas. You listen to music on your device as you catch the bus to school. And that’s just some of the energy you use to get you through the first part of your day!
Every day, the average American uses about as much energy as is stored in a little more than seven gallons of gasoline. That’s every person, every day. Over a course of one year, the sum of this energy is equal to a little more than 2,500 gallons of gasoline per person. This use of energy is called energy consumption.
The U.S. Department of Energy uses categories to classify energy users — residential, commercial, industrial, transportation, and electric power generation. These categories are called the sectors of the economy.
Residential/Commercial SectorThe residential sector includes houses, apartments, and other places where people live. The commercial sector includes schools, businesses, and hospitals. The residential and commercial sectors are put together because they use energy for similar tasks — for heating, air conditioning, water heating, lighting, and operating appliances. Schools use energy a little differently than homes. By far, the greatest energy users in schools are space heating and cooling, making up almost half the energy used in schools. The other big energy users are ventilation, water heating, lighting, and computing.
Transportation SectorAmericans make up about 4.3 percent of the world’s population, yet we own nearly 16 percent of the world’s automobiles. The transportation sector of the economy accounts for more than 28 percent of total energy use. America is a country on the move. For model year 2016, the average motor vehicle uses 665 gallons of gasoline every year. You can achieve 10 percent fuel savings by improving your driving habits and keeping your car properly maintained. Over the life of a vehicle, your family can save a lot of money on gas by choosing a fuel-efficient model.
Industrial SectorManufacturing the goods we use every day consumes an enormous amount of energy. The industrial sector of the economy consumes about one-fifth of the nation’s energy. In industry, energy efficiency and conservation are driven by economics — money. Manufacturers know that they must keep their product costs low so people will buy them.
Since energy is one of the biggest costs in many industries, manufacturers must use as little energy as possible. Their demand for energy efficient equipment has resulted in many new technologies in the last decades. Consumers can have an effect on industrial energy use through the product choices we make and what we do with the packaging and the products we no longer use.
Electric Power GenerationThe electric power sector includes electricity generation facilities and power plants. All of the other sectors consume electricity generated by the electric power sector. The electric power sector consumed 38.71 percent of the total energy supply in 2016, more than any of the other sectors, with a total of 37.71 quads.
RESIDENTIAL 6.2%Top Residential Sources: Natural Gas Biomass Petroleum
INDUSTRIAL 22.0%Top Industrial Sources: Natural Gas Petroleum Propane
COMMERCIAL 4.5%Top Commercial Sources: Natural Gas Petroleum Propane
TRANSPORTATION 28.5%Top Transportation Sources: Petroleum Biomass Natural Gas
U.S. Energy Consumption by Sector, 2016
Data: Energy Information Administration*Total does not equal 100% due to independent rounding.
The residential, commercial, and industrial sectors use electricity. This graph depicts their energy source consumption outside of electricity.
ELECTRIC POWER 38.7%Top Electric Power Sources: Coal Naturals Gas Uranium
U.S. School Energy Consumption
Space Heating 35.51%
Cooling 10.81%
Ventilation 8.08%
Water Heating 8.08%
Other 9.98%
Computing 9.26%
O�ce Equipment 2.49%
Refrigeration 4.75%
Cooking 1.78%
Lighting 9.26%
Data: EIA Commercial Building Energy Survey

14 ©2019 The NEED Project www.NEED.org Ohio Energy Project www.ohioenergy.org
STUDENT WORKSHEET
Energy Through the DecadesIn the United States, energy production and consumption have changed over time. Due to technological advancements, a growing population, and the shifting social and political climates, these changes have transformed the energy landscape over the last five decades. Let’s explore how and why below.
Directions: Study the timeline and charts below to answer the questions in the spaces provided on the next page.
Timeline
1970s
�1970 – Environmental Protection Agency (EPA) created.
�1977– Department of Energy created.
�1978– U.S. Department of Energy (DOE) funding for geothermal research and development was increased substantially.
1980s
�1982 – First solar-thermal power plant opened in California.
�1986– The Perry power plant in Ohio became the 100th U.S. nuclear power plant in operation.
�1989– High efficiency PV cells developed.
1990s
�1990– Iraq invades Kuwait causing crude oil price increase.
�1992– President Bush issues Executive Order 12780, which stimulates waste reduction, recycling, and the buying of recycled goods in all federal agencies.
�1999– First hybrid electric vehicle, powered by both a rechargeable battery and gasoline, becomes available in the U.S.
2000s
�2000– EPA establishes a link between global climate change and solid waste management, noting that waste reduction and recycling can help reduce greenhouse gas emissions.
�2005– Energy Policy Act promotes the use of coal through clean coal technologies.
�2006– The U.S. ranks among the top 4 countries in the world for hydroelectric generation, along with China, Canada, and Brazil, generating 44% of the world’s electricity from hydropower.
2010s
�2011– Natural gas fracking booms in Ohio as the use of horizontal drilling in conjunction with hydraulic fracturing begins.
�2016– Wind power surpasses hydropower to become nation’s leading renewable resource.
�2017– Renewable energy production and consumption reach record highs at 11 quadrillion Btu.
LESSON 1C: Energy Economics

©2019 The NEED Project www.NEED.org Ohio Energy Project www.ohioenergy.org 1514 ©2019 The NEED Project www.NEED.org Ohio Energy Project www.ohioenergy.org
ANSWER KEY
Basic Energy Information - United States
DATE POPULATION CHANGE PER DECADE
PRODUCTION (IN QUADS)
CHANGE PER DECADE
CONSUMPTION (IN QUADS)
CHANGE PER DECADE
1970 205,100,000 X 63.5 X 67.8 X
1980 227,200,000 22,100,000 67.2 3.7 78.1 10.3
1990 249,600,000 22,400,000 70.7 3.5 84.5 6.4
2000 282,200,000 32,600,000 71.3 0.6 98.8 14.3
2010 309,100,000 26,900,000 75.0 3.7 98.0 -0.8
2017 325,700,000 16,600,000 88.1 13.1 97.7 -0.3
Energy Production By Source (Quadrillion Btu) - United States
DATE COAL NATURAL GAS PETROLEUM URANIUM (NUCLEAR)
RENEWABLES
1970 14.6 21.7 20.4 0.2 4.1
1980 18.6 19.9 18.2 2.7 5.4
1990 22.5 18.3 15.6 6.1 6.0
2000 22.7 19.7 12.4 7.9 6.1
2010 22.1 22.1 11.7 8.4 8.1
2017 15.6 28.3 19.5 8.4 11.2
Energy Consumption By Source (Quadrillion Btu) - United States
DATE COAL NATURAL GAS PETROLEUM URANIUM (NUCLEAR)
RENEWABLES
1970 12.3 21.8 29.5 0.2 4.1
1980 15.4 20.2 34.2 2.7 5.4
1990 19.2 19.6 33.6 6.1 6.0
2000 22.6 23.8 38.3 7.9 6.1
2010 20.8 24.5 36.0 8.4 8.0
2017 13.9 28.0 36.2 8.4 11.0
Questions1. Calculate the changes per decade in Population, Energy Production, and Energy Consumption by completing the Basic Energy
Information chart above.
See chart above.
2. What event(s) may have led to the steady rise of renewable energy production and consumption?
1989 High efficiency PV cells, 1999 hybrid electric vehicle, 2000 global climate change, etc.
3. Has our consumption ever outweighed our production of energy? Explain how this can occur.
Yes. U.S. imports some energy from around the globe allowing for larger consumption.
4. Pick an event from the timeline and describe its relationship to the tables above. How was this event significant to our productionand/or consumption of energy?
Answers will vary.
5. Add an event to the energy timeline above. How was this event significant to our production and/or consumption of energy?
Answers will vary.
Data: EIA
LESSON 1C

16 ©2019 The NEED Project www.NEED.org Ohio Energy Project www.ohioenergy.org
Lesson 1D: Energy Efficiency and Conservation
EfficiencyEnergy efficiency is the amount of useful energy you get from a system. A perfect, energy efficient machine would change all the energy put into it into useful work – a technological impossibility today. Converting one form of energy into another form always involves a loss of usable energy.
When we discuss energy efficiency, we really are talking about the machines or equipment we are using to complete a task. It might be a washing machine, a light bulb, or your family’s vehicle, but they’re all some kind of device that does work for us. If we say we are being more energy efficient, we are using devices that use less energy to perform the work. For example, a heavy-duty pickup truck and a small sedan will both carry two people to work. However, the small sedan will use less fuel to do so, so it is more efficient. The ENERGY STAR® program identifies which devices are most efficient. We discuss this program further in Lesson 3.
Energy ConservationWhen discussing how much energy we use, conservation refers to how we behave while using that energy. For example, the owners of the most efficiently built home can still waste energy if they leave the lights on and the refrigerator door open while pouring a glass of milk. People who have older, less efficient appliances can still save energy by using them wisely. Energy conservation refers to the things we choose to do that use less energy.
Did You Know?Some buildings right here in Ohio are working to become LEED certified. What does this mean and why should we care? LEED (Leadership in Energy and Environmental Design) certification is a commonly used green building certification throughout the U.S. Green buildings are known to use fewer resources, reduce waste, and minimize environmental impacts in their regions. Talk about energy efficiency! To learn more about green buildings and LEED certification, visit the U.S. Green Building Council’s website at www.new.usgbc.org.
London Middle School of Madison County, OH is one of the many LEED certified schools in Ohio.

©2019 The NEED Project www.NEED.org Ohio Energy Project www.ohioenergy.org 1716 ©2019 The NEED Project www.NEED.org Ohio Energy Project www.ohioenergy.org
ANSWER KEY
Efficiency vs. Conservation 1. Choose a sector of the economy. Create a fictitious scenario
from that sector that describes good energy efficiency but badenergy conservation.
2. Choose a sector of the economy different from what you usedin number 1. Create a fictitious scenario from that sector thatdescribes bad energy efficiency but good energy conservation.
3. Re-read the two scenarios you created in numbers 1 and 2 above. Using evidence from the text, explain which scenario you believe would have the greatest impact on our total energy use as a nation if everyone in that sector employed it. Explain your reasoning well.
GOOD ENERGY EFFICIENCY BUT BAD ENERGY CONSERVATION
BAD ENERGY EFFICIENCY BUT GOOD ENERGY CONSERVATION
* Answers will vary.
* Answers will vary.
* Answers will vary.
LESSON 1D

18 ©2019 The NEED Project www.NEED.org Ohio Energy Project www.ohioenergy.org
Energy in Action:1. What energy sources are used to generate electricity for your home and community?
2. Share your knowledge about safety when it comes to using energy in your home and community.
3. Describe how you can apply the concepts of efficiency and conservation to your everyday life.
Web Quest:1. Identify one of the LEED platinum schools in Ohio (not pictured in the guide) and describe how they were able to achieve thisstatus.
2. Confirm your local utility partner(s) on the cover of your student guide or with your teacher and record below.
3. Visit your utility partner’s website and search for information regarding the following:
a. Safety
i. List 3 important safety tips to share with your family regarding energy.
Career Connections:LEED Project Manager – Oversee the construction of LEED certified green building projects.
Conservation Scientist – Monitor land quality of forests, parks, rangelands, and other natural resources.
Power Dispatcher – Monitor and operate equipment that regulates and/or distributes electricity or steam.
Recycling Coordinator – Oversee curbside and drop - off recycling programs for private firms and local governments.
Earth Driller – Heavy equipment operator skilled in extracting natural resources.
Green Construction Carpenter – Construct and repair buildings, roads, bridges, and other structures.
Home & Community
STUDENT WORKSHEET
LESSON 1

©2019 The NEED Project www.NEED.org Ohio Energy Project www.ohioenergy.org 1918 ©2019 The NEED Project www.NEED.org Ohio Energy Project www.ohioenergy.org
Lesson 2: Thermal Energy
t Overview This lesson provides an in-depth look at thermal energy and how it is used. The lesson begins with a discussion on thermal energy, thermal energy transfer, and heat vs. temperature.
Part A: After reviewing the basics of thermal energy, this lesson explores the concepts of heating and cooling and how different factors contribute to the heating and cooling systems of a building.
Part B: Beyond heating and cooling, this lesson explores water and how it is treated, transported, and used.
Objectives:Students will be able to:� identify the three types of thermal transfer;� identify and discuss the various elements that contribute to a building’s heating and cooling system and regulation;� identify, compare, and discuss insulative materials;� discuss the ways in which schools use water and how that water is moved to and from the school;� identify and discuss ways of using and conserving water;� identify and discuss energy efficient tools and conservation behaviors pertaining to thermal energy.
OEP Provided MaterialsLesson 2A:� Insulation Containers� Digital Thermometers� Testing ContainersLesson 2B:� Water Conservation Survey
Energy Efficiency Kit Materials �Water Flow Bag �Hot Water Temperature Gauge �Weather Stripping �Aerators (if applicable) �Showerheads (if applicable)
Procedure
Lesson 2A: Heating and Cooling1. Introduce the topic of thermal energy and explain what it is and how it is transferred. Discuss how we use thermal energy in our
everyday lives.
2. Discuss with students how your school acts as a prime example of how a space must be designed for a comfortable heating andcooling environment.
3. Review insulation and R-values and discuss their importance to a space.
4. Introduce the Insulation Investigation and assign students to small groups.
5. Explain that this lab activity will test different insulating materials to see what best works at resisting thermal energy transfer.
6. Ask students to name some types of building insulation. Are there other types of insulation that may be used or found in homes built long ago? Think sod, straw, etc.
7. Give each small group two insulation containers and an insulating material (either of your choosing or of the students’). Onecontainer will be tested with the insulating material and the other will act as the control tested without insulation.
LESSON PLAN
Teacher Provided MaterialsLesson 2A:� Insulation SamplesLesson 2B:� 2 Quart Cardboard Container
� Beaker or Cup� Sewing Needle or Pushpin� mL M easuring Cup
�Plumber’s Tape (if applicable) �Scratch and Sniff (if applicable) �Door Sweep (if applicable) �Draft Stoppers (if applicable) �Thermostat Temperature Guide (if applicable)

20 ©2019 The NEED Project www.NEED.org Ohio Energy Project www.ohioenergy.org
8. Instruct students to follow the Insulation Investigation steps to complete the lab and record their findings on the provided chart.
9. After each group completes their chart, share each group’s temperature change data with the class. Discuss the best and worstinsulators. Be sure to include topics such as dependent variables, independent variables, and controls in your discussion.
10. Introduce The Value of an R-Value worksheet to students.
11. Instruct students to use the provided graphic to answer the questions about insulation.
Lesson 2B: Water1. Introduce the topic of water. Discuss how we use water in our everyday lives and how the treatment, transportation, and heating of
water all contribute to energy usage.
2. Introduce the Water Conservation activity. As a class, complete the Down the Drain activity to see how much water is wasted whena faucet drips.
3. Instruct students to use the Personal Water Use Survey to record their water usage over the next 24 hours. Have students record the time spent using water and estimate the number of gallons of water they use for each activity provided on the chart.
4. During the next class period, discuss with students the results of their surveys.
5. Hold up an empty gallon container to allow students to visualize what a gallon of water looks like. Discuss with students the actual gallons of water used for each activity on the chart.
6. Instruct students to brainstorm some water conservation behaviors for each activity and record them on the chart.
7. Instruct students to use the Personal Water Use Survery to record their water usage over the next 24 hours.
8. During the next class period, discuss the students’ new results.
Home and Community Action1. Distribute any kit items associated with the lesson and have students install these measures at home or within their community.
2. Have students complete the questions regarding their kit items on the Home & Community worksheet in the Student and Family Guide.
3. Have students complete the Web Quest online by visiting various local government and utility websites.
4. Review the Related Careers with students and discuss what pathways students may pursue after graduation.

©2019 The NEED Project www.NEED.org Ohio Energy Project www.ohioenergy.org 2120 ©2019 The NEED Project www.NEED.org Ohio Energy Project www.ohioenergy.org
What exactly is thermal energy? Thermal energy is the internal energy within a substance that causes its particles to move. The more thermal energy an object has, the faster its particles – its atoms and molecules – are moving. As you might expect, the molecules in a block of ice (solid) are just vibrating in place while the molecules in a glass of water (liquid) are moving around each other. The ice molecules have less thermal energy than the water molecules do, and they are held in place. If you boil water, the molecules in the steam (gas) have enough thermal energy to break free from each other and move around independently.
As long as you are comparing the solid, liquid, and gaseous state of the same substance, it is safe to say solids have the least amount of thermal energy and gases have the most. However, because different substances have the ability to retain different amounts of thermal energy, it is not always the case. For example, a gram of ice will have more thermal energy than a gram of oxygen gas. The amount of thermal energy a substance can retain is called its specific heat capacity, and it is different for each element or compound. Substances with a high specific heat capacity require a lot of thermal energy to increase in temperature, but they also can hold that energy for a longer time. Glass, water, and ceramics have high specific heat capacities. A substance with a lower specific heat capacity will heat up quickly and cool down quickly. Specific heat capacity factors into whether a substance is used to transfer thermal energy to heat a space.
Thermal energy is transferred via three mechanisms: conduction, convection, and radiation. Conduction occurs when thermal energy is transferred from one object in direct contact with another object. In order for conduction to be feasible, the substance being used to transfer the energy must be a good conductor. In general, metals are good thermal conductors and non-metals are not. That is why cookware is often made of metals like copper, iron, and stainless steel. Metals typically have low specific heat capacities, which is a desired quality in this case because the purpose is not to heat the cooking pot, but to transfer the heat from the burner to the food inside the pot.
Convection transfers thermal energy by heating a fluid, then circulating that fluid. The fluid must have a specific heat capacity large enough to make convection a worthwhile way to heat a space. Water has a very high specific heat capacity, and makes an excellent fluid for convection. The water is heated in a boiler, then circulated through pipes or tubes, releasing some of its energy and returning to the boiler at a lower temperature. Air does not have as high a specific heat capacity as water, but because it is easy to circulate air with fans, it is used in forced-air heating systems.
Background Information: Thermal EnergyLESSON 2
Heat ≠ TemperatureMeasuring the temperature of something does not directly tell you how much thermal energy that object has. However, it does give you an idea of how much thermal energy the atoms or molecules in that object might have. High temperatures tell us that the particles have more energy, on average. Low temperatures indicate that the particles have less energy. Thermal energy is dependent on the temperature and mass of the substance.
RADIATION
CONDUCTION
CONVECTION
Radiation is the third mechanism for transferring thermal energy, and it does not require the assistance of a substance like steel or water. Rather, the thermal energy is emitted from the hot object in waves. You have experienced radiation if you’ve ever sat around a fire on a cool evening, toasting marshmallows or warming your hands. The thermal energy source is the combustion of the wood and paper on the fire, and you can feel the thermal energy radiating outward from the fire.

22 ©2019 The NEED Project www.NEED.org Ohio Energy Project www.ohioenergy.org
LESSON 2A: Heating and Cooling Heating and Cooling SystemsHeating and cooling systems use more energy than any other systems in residential and commercial buildings. Natural gas and electricity are usually used to heat, and electricity is used to cool. The energy sources that power these heating and cooling systems contribute carbon dioxide emissions to the atmosphere. Using these systems wisely can reduce environmental emissions.
With all heating and air conditioning systems, you can save energy and money too, by having proper insulation, sealing air leaks, maintaining the equipment, and practicing energy-saving behaviors.
When we build schools, homes, and office buildings, significant thought is put into how the inside of the building will remain comfortable for the occupants – the people inside. The materials selected must be able to keep warm air from mixing with cool air; they must be good insulators, and limit the transfers of thermal energy.
Programmable ThermostatsProgrammable thermostats automatically control the temperature of buildings for time of day and can save energy and money. During heating seasons, for example, they lower the temperature of a building when no one is using it. When people are active in the building, the thermostat automatically raises the temperature. These controls are available for commercial buildings, from as simple as one programmable thermostat to a whole system of temperature sensors connected to a computer, depending on the building’s size. Many newer schools and those that have been upgraded with new heating systems have a central computer that monitors the temperature in each room and adjusts the heating system accordingly.
PROGRAMMABLE THERMOSTAT
Insulation and WeatherizationAir leaking into or out of a building wastes energy. Insulation prevents thermal energy transfer to keep the interior room comfortable and separated from the exterior air. Building owners can reduce heating and cooling costs by investing in proper insulation and weatherization products.
The parts of the building that separate indoors from outdoors construct the building envelope. The walls, floor, roof, doors, and windows are parts of the building envelope system. Their purpose is to keep the interior of the building a comfortable, healthy place to work or learn while allowing access into and out of the building.
The space above the ceiling, below the floor, and within walls is filled with insulation, which prevents thermal energy transfer. Insulation is graded by its R-value, which is an abbreviation for its resistance to thermal energy transfer. Different materials have different R-values, and the amount of insulation needed in total R-value varies according to the climate in which you live. Industry professionals calculate the R-value per inch thickness of different materials and builders install the appropriate thickness of locally-available materials to provide the proper amount of insulation. The materials used in buildings in your area depend on what is easily available and how many people are trained in their installation.
INSULATION
Image courtesy of Owens Corning

©2019 The NEED Project www.NEED.org Ohio Energy Project www.ohioenergy.org 2322 ©2019 The NEED Project www.NEED.org Ohio Energy Project www.ohioenergy.org
Doors and WindowsSome air leaks occur around and through the doors and windows. Doors should seal tightly and have door sweeps at the bottom to prevent air leaks. Insulated storm doors provide added barriers to leaking air. School entryways with two sets of doors are designed to keep cold air from blasting inside during the winter and outside during the summer. Both sets of doors should always be kept closed.
Most buildings have more windows than doors. Caulk or seal any cracks around the windows and make sure they seal tightly. With older windows, install storm windows or sheets of clear plastic to create added air barriers. Insulated blinds also help to prevent air flow — during heating seasons, open them on sunny days and close them at night. During cooling seasons, close them during the day to keep out the sun.
The number of panes of glass in a window is important, too. Single-pane windows are not well insulated; double- or triple-pane glass has an insulating space between the glass that allows light in but keeps thermal energy from transferring across the window.
MoistureMoisture is a term used to describe water in both liquid and vapor form. Like heat and air, it is important to have the right amount of moisture in a building. Most moisture indoors exists as water vapor. The amount of water vapor in the air plays an important role in determining our health and comfort.
Humidity is a measurement of the total amount of water vapor in the air. It is measured with a tool called a hygrometer. Relative humidity measures the amount of water vapor in the air compared to the amount of water vapor the air is able to hold. The relative humidity depends on the temperature of the air.
Think of air as a moisture sponge. See the next page for a visual. Warm air can hold more moisture because the atoms and molecules are moving faster and are more spread out. Warm air is like a bigger sponge. Cool air holds less moisture because the particles are spaced closer together. Cool air is like a smaller sponge. Imagine the sponge can increase or decrease in size as the temperature changes. If you add 100 mL of water to a small sponge, it might be completely saturated – it is holding all of the moisture it can hold. If that sponge expands, but no more moisture is added, it is no longer saturated, and is now holding a fraction of the water that it could potentially hold.
The correct humidity level can also help promote a healthy indoor environment. Humidity levels should be kept between 30% and 60%. Using a dehumidifier in the summer and a humidifier in the winter can help condition the air to maintain appropriate humidity levels.
SINGLE DOUBLE TRIPLEoften has storm
window, screen, or combination
space between glass may be gas-�lled
glass may be low-E type with coatings
space between glass may be gas-�lled
glass may be low-E type with coatings
LEAST EFFICIENTLEAST EFFICIENT MOST EFFICIENTMOST EFFICIENT
Window Glazing Types
Multiple panesTwo panes of glass, with an air- or gas-�lled space in the middle, insulate much better than a single piece of glass. Some ENERGY STAR-quali�ed windows include three or more panes for even greater energy e�ency, increased impact resistance, and sound insulation.
Improved frame materialsWood composites, vinyl, and �berglass frames reduce heat transfer and help insulate better.
Gas �llsSome energy e�cient windows have argon, kyrpton, or other gases between their panes. These odorless, colorless, non-toxic gases insulate better than regular air.
Low-E glassSpecial coatings re�ect infrared light, keeping heat inside in winter and outside in summer. They also re�ect damaging ultraviolet light, which helps protect interior furnishings from fading.
Warm edge spacersA spacer keeps a window’s glass panes the correct distance apart. Today’s warm edge spacers—made from steel, foam, �berglass, or vinyl—reduce heat �ow and prevent condensation.Data: ENERGY STAR®
What Makes a Window Energy E�cient?

24 ©2019 The NEED Project www.NEED.org Ohio Energy Project www.ohioenergy.org
Relative Humidity
Cool air is like a small sponge—it holds a small amount of water. Warm air is like a larger sponge—it holds more. Warming the air increases the amount of water it can hold, but the relative humidity decreases because no additional moisture is added.
100% 50% 25%
Cool Air
Warm Air
Indoor Air QualityIn schools, what is mixed in the air is a major concern because schools tend to be closed up tight all day, everyday. Some classrooms may have an open window here and there, but for the most part, the doors and windows are kept closed. Commercial buildings, like schools, have HVAC systems – heating, ventilation, and air conditioning. Your home has a heating system and might have an air conditioner, but ventilation is usually accomplished by opening and closing doors and windows. Because you have relatively few people per square foot in your home, adding fresh air is unnecessary. In commercial buildings, it is not only desirable, it is vital to keep the occupants healthy.
Ventilation is measured by the number of air changes per hour. One air change in one hour means enough fresh air is brought into the room such that in one hour all of the air is exchanged. Fresh air exchange is important not only to remove the carbon dioxide produced by the people, but also to keep moisture at a healthy level to prevent mold growth and to remove chemicals from activities like cooking, cleaning, science lab experiments, and art projects.
AIR CONDITIONING SYSTEM
Different buildings with different uses are required to exchange the air at different rates. Local building codes and regulations also vary. Therefore, what may be sufficient in one school may not meet regulated ventilation requirements in another school. You can check with your school’s maintenance supervisor or your local building code enforcement office to find out how many air changes per hour are needed.

©2019 The NEED Project www.NEED.org Ohio Energy Project www.ohioenergy.org 2524 ©2019 The NEED Project www.NEED.org Ohio Energy Project www.ohioenergy.org
LandscapingAlthough you cannot control the weather, you can plant trees and bushes to block the wind and provide shade. Properly placed landscaping can reduce the energy needed to keep buildings comfortable. Deciduous trees, for example, are good to plant on the south side of a building in the Northern Hemisphere, since their leaves provide shade in summer and their bare branches allow sunlight through in the winter. Clusters of trees can be planted to reduce “heat islands” in areas like parking lots, and act as wind blocks during the winter. In tropical and warmer climates taller trees like palms and shades are used on a building’s exterior to block the sun while allowing a breeze to flow.
ThermometerA thermometer measures temperature. The temperature of a substance is a measure of the average amount of kinetic energy in the substance.
This thermometer is a long, glass tube filled with colored alcohol. Alcohol is used in many thermometers because it expands in direct proportion to the increase in kinetic energy or temperature.
Temperature can be measured using many different scales.
The scales we use most are:
� Celsius
The Celsius (C) scale uses the freezing point of water as 0ºC and the boiling point of water as 100ºC.
� Fahrenheit
The Fahrenheit (F) scale uses the freezing point of water as 32ºF and the boiling point of water as 212ºF.
In the United States, we usually use the Fahrenheit scale in our daily lives, and the Celsius scale for scientific work. People in most countries use the Celsius scale in their daily lives as well as for scientific work.
Notice the numerical difference between the freezing and boiling points of water are different on the two scales. The difference on the Celsius scale is 100, while the difference on the Fahrenheit scale is 180. There are more increments on the Fahrenheit scale because it shows less of an energy change with each degree.
-20-10
0102030
210
0
100
30
210
0
100
30405060708090
100110120130140150160170180190200210220
-30
-20
-10
0
10
20
30
40
50
60
70
80
90
°F °C100° C212° F
BOILING POINT OF WATER
0° C32° FFREEZING POINT OF WATER

26 ©2019 The NEED Project www.NEED.org Ohio Energy Project www.ohioenergy.org
On the Fahrenheit scale, the freezing point of water is 32° and the boiling point of water is 212°.
On the Celsius scale, the freezing point of water is 0° and the boiling point of water is 100°.
To convert from Celsius to Fahrenheit, multiply the C number by 180100 or 9
5 , then add 32, as shown in the
formula below.
To convert from Fahrenheit to Celsius, subtract 32 from the F number, then multiply by 100180
or 59
as shown in the formula below.
If C = 5
F = (5 x 95 ) + 32
F = 9 + 32
F = 41
If F = 50
C = (50 - 32) x 59
C = 18 x 59
C = 10
F = (C x 95
) + 32
C = (F - 32) x 59
Fahrenheit/Celsius Conversion
MASTER
LESSON 2

©2019 The NEED Project www.NEED.org Ohio Energy Project www.ohioenergy.org 2726 ©2019 The NEED Project www.NEED.org Ohio Energy Project www.ohioenergy.org
Digital ThermometerA digital thermometer measures the temperature of a substance and displays the temperature reading on its face. It has a battery for power. Sometimes they are waterproof for measuring the temperature of a liquid.
This digital thermometer can measure the temperature in Fahrenheit or Celsius. It shows the temperature range of the thermometer. It can read temperatures from -40° to 392°F and -40° to 200°C.
It has three buttons. The button on the bottom left is the ON/OFF switch. If the thermometer is not used for a few minutes, it turns itself off.
The C/F button on the bottom right switches from the Celsius scale to the Fahrenheit scale. The face of the thermometer will show a C or an F to indicate which scale is being used.
The mode button on the top holds the temperature reading when it is pushed. If you need the exact temperature of a liquid, you push the hold button while the thermometer is in the liquid, then remove the thermometer to read it. This button will also allow you to view the maximum and minimum temperatures measured when pushed two or three times.
The metal stem of the thermometer can measure the temperature of the air or the temperature of a liquid. The stem should be placed about halfway into a liquid to measure the temperature.
MASTER
LESSON 2

28 ©2019 The NEED Project www.NEED.org Ohio Energy Project www.ohioenergy.org
? Question �Which materials are the best thermal insulators?
Materials� 2 Insulation containers with lids � 2 Digital thermometers� 2 Testing containers� 1 Set of insulation materials� Hot water� Measuring cup
Hypothesis
_________________________________________________________________________________________________________________
_________________________________________________________________________________________________________________
_________________________________________________________________________________________________________________
Procedure1. Remove the lids from the insulation containers.
2. Place each insulation container in a testing container.
3. Loosely pack insulating material around one of the insulation containers. Leave no empty spaces around the container but do notsmash the insulating materials in the space.
4. The other insulating container will not have any insulating material and will serve as the control.
5. Pour 200 mL, or 6 ounces, of hot water into each of your insulation containers.
6. Replace the lids of the containers. Insert a thermometer into each container so that it is suspended in the water.
7. Wait for the temperature to stabilize, but do not wait longer than one minute. Once the temperature stabilizes read the thermometerand use this reading as your initial or “time zero” measurement.
8. Record the temperature of the water every two minutes. To ensure consistency, the same person should read the thermometer eachtime.
9. Calculate the overall change in temperature (∆T) for bother containers. Graph your results.
10. Share your data with the class. Compare the results for each type of insulation and determine the best thermal insulator.
Insulation Investigation
STUDENT WORKSHEET
LESSON 2A

©2019 The NEED Project www.NEED.org Ohio Energy Project www.ohioenergy.org 2928 ©2019 The NEED Project www.NEED.org Ohio Energy Project www.ohioenergy.org
DataType of Insulation:
ConclusionAnswer the following questions based on the data you and your classmates collected.
1. What was the difference in temperature change between the insulated and control container?
2. According to the class data, which material was the best insulator?
3. Using the same insulating material, explain how you can increase the R-value.
4. There are three ways that heat can transfer. Which way(s) were involved in this investigation?
5. In addition to the R-value of the insulation, what other properties should you consider when choosing a product?
6. Which insulating material or materials would you choose for your home? You may choose different materials for different areas of your home. Justify your answer.
Time (min) 0 2 4 6 8 10 12 14 16 18 20 ΔT
Insulated Container
Uninsulated Control
TIME (MINUTES)
TEM
PERA
TURE
(DEG
REES
CEL
SIUS
)
STUDENT WORKSHEET

30 ©2019 The NEED Project www.NEED.org Ohio Energy Project www.ohioenergy.org
LESSON 2A ANSWER KEY
The Value of an R-ValueFrom our reading, we know that an R-value represents insulation’s resistance to thermal energy transfer. Conduction occurs when thermal energy is transferred from one object in direct contact with another and insulation helps to deter that flow of energy. Insulation with a higher R-value resists or deters energy flow more so than insulation with a lower R-value.
The graphic below indicates which R-values are used in certain geographic zones of the U.S. Use the map and subsequent R- value information to answer the questions below.
? Questions1. What do the above zones represent?
Aside from R-values, the above zones represent climate.2. In what zone is your school located? Name two other states that are located within this same zone.
Answers will vary.3. According to the graphic, what is the R-value range used in constructing attic spaces in your zone? How about the R-value range used in constructing floors?
Attic - R38 to R60; Floor - R25 to R304. Compare the two ranges identified in Question 3 above. Why do you think these ranges differ?
Heat rises so more insulation is needed in the attic.5. How could you use these zones to discuss regional climate and/or weather patterns?
Answers will vary.
1
22
2 33
3
4 4
44
4
4
4
5
5
5
5
5
6
6 6
6
6
7
7
7
All of Alaska is in Zone 7 except for the following boroughs in Zone 8:Bethel Northwest Arctic, Dellingham Southeast Fairbanks, Fairbanks N. Star Wade Hampton, Nome Yukon-Koyukuk, North Slope
Zone 1 includes Hawaii, Guam, Puerto Rico, and the Virgin Islands.
ZONE
1
2
3
45
6
7
8
ATTIC
R30 to R49
R30 to R60
R30 to R60
R38 to R60
R38 to R60
R49 to R60
R49 to R60
R49 to R60
CATHEDRALCEILING
R22 to R38
R22 to R38
R22 to R38
R30 to R38
R30 to R60
R30 to R60
R30 to R60
R30 to R60
CAVITY
R13 to R15
R13 to R15
R13 to R15
R13 to R15
R13 to R21
R13 to R21
R13 to R21
R13 to R21
INSULATIONSHEATHING
None
None
R2.5 to R5
R2.5 to R6
R2.5 to R6
R5 to R6
R5 to R6
R5 to R6
FLOOR
R13
R13, R19 to R25
R25
R25 to R30
R25 to R30
R25 to R30
R25 to R30
R25 to R30
WALL INSULATION
Data: U.S. Department of Energy
Recommended R-Values for New Wood-framed Homes

©2019 The NEED Project www.NEED.org Ohio Energy Project www.ohioenergy.org 3130 ©2019 The NEED Project www.NEED.org Ohio Energy Project www.ohioenergy.org
LESSON 2B: WaterFreshwater and energy are inseparably linked to each other. We need energy to purify or treat our water for drinking and safe use. We also need water to generate electricity. For more information on water used for electricity generation, visit Lesson 3.
When water is extracted from the ground or a surface source such as a river or reservoir, it must be pumped from that site to the water treatment plant. Pumps are used to pull and convey the water to the treatment facility, and each pump uses energy to run.
At the treatment facility, pumps and other machinery are used to filter and clean the water so it is safe to drink. When water leaves the treatment facility, it is carried at a high pressure through pipes to your home or school. Pumps run to keep the water pressure elevated so you can always take a shower or wash your hands when you’d like.
As we use water, we have water softeners that further condition the water, filters that remove unpleasant tastes and odors from the water, heaters that heat the water, and pumps that move it in and out of the machines that use it. All of these devices use energy, too.
Finally, after you’ve finished a water-related task, it has to go somewhere. The drain in your school does not empty into a big hole in the ground. In most areas, water is sent through a series of sewer pipes to a wastewater treatment facility, where pumps and other machinery clean and filter it before releasing it back into the natural environment. Septic systems use gravity to pull water through a series of screens in a septic tank, where sediments are filtered out before the water is drained back into the ground water.
At each of the stages of our own water use listed above, significant amounts of energy are required to extract, clean, distribute, and treat the water we use every day. If you reduce the amount of water you use, you will also be reducing the amount of energy you use, saving your school money on the water bill and reducing the energy demand in your city or town.
Here are some great ways you can reduce the amount of water you
use:
1. Don’t let the water run needlessly in the restroom orclassroom.
2. Inform a teacher or other staff member if a faucet or drinkingfountain does not turn off properly.
3. In the locker room, turn off the shower when finished, don’tallow it to run for the next person.
4. Stomp or scrape your boots or shoes before entering theschool to avoid the need to extensively clean the floors everyevening.
Water HeatingYou don’t think too much about the hot water you need at school, but it is definitely needed. At home you probably have a hot water heater that holds 40 or 50 gallons of hot water and is fueled by natural gas or electricity. When you turn the hot water tap on in the kitchen or bathroom, you have to let the water run a bit before it’s warm. However, having one hot water heater in one central location in a school would mean letting the water run for a very long time before it ran warm in rooms far from the heater.
Most schools have one or more 100-gallon (or sometimes even bigger) hot water heaters, and the hot water supply is constantly circulating through the school with a pump. Thus, turning the hot water on in a distant classroom should provide hot water fairly quickly.
The temperature of the water at school is important. At home, you probably have your hot water heater set at 120 - 140 °F and rarely any higher because of the danger of serious injury by scalding. This is true for the hot water at school except in the kitchen. To comply with health department regulations, the cafeteria workers must wash all dishes and serving equipment in water that is at least 160 °F. But at this temperature, scalding injuries happen very quickly. Very young or distracted students would easily get their hands burned if water came out of the faucet at this temperature.
Most building designs handle this dilemma in one of two ways. One is to have two separate water heating systems, one for the cafeteria and the other for the rest of the school. The cafeteria water supply is kept very hot while the rest of the school is kept at a safer, lower temperature. The other way is to keep the entire school supply at a safe temperature but have a booster heating system in the cafeteria that heats the water to the necessary temperature for cleaning.
Water Use in Schools, 2016

32 ©2019 The NEED Project www.NEED.org Ohio Energy Project www.ohioenergy.org
STUDENT WORKSHEET
Water ConservationWater plays a vital role on Earth. Not only is it essential to the plants and animals on the surface, but it is also a key component in our climate, the shaping of Earth’s surface and ecosystems that support life. With that in mind, water conservation is an important part of our energy conservation measures.
Part 1: Down the DrainDripping faucets waste water and money. Such leaks may seem small, but the water loss can add up to be quite large.
? Question �How much water is wasted by a dripping faucet?
Materials� Empty two-quart, cardboard carton (milk, orange juice, etc.) � Water� Small sewing needle or pushpin� Graduated cylinder� Stopwatch
Procedure1. Use the needle to make a very small hole in the bottom of the empty carton. Make this hole as small as possible.
2. Support the carton on the rack approximately 15 centimeters (or 6 inches) above the tabletop. Fill the carton with water about half full.Place the beaker or cup under the pin hole opening to catch any drips.
3. Leave the beaker or cup under the carton for 10 minutes.
4. Using the graduated cylinder, measure the volume of water, to the nearest milliliter, that dripped.
5. Using the chart below, calculate and record the rate of water loss.
Water loss after 10 min. (mL)
Water loss per min. (mL/min)
Water loss per day (x 1,440 min.)
Liters of water lost per day (divide by 1,000)
Liters of water lost per year (daily loss x 365)
�Metal rack or objects to support carton �Beaker or cup to fit under rack (to catch dripping water)

©2019 The NEED Project www.NEED.org Ohio Energy Project www.ohioenergy.org 3332 ©2019 The NEED Project www.NEED.org Ohio Energy Project www.ohioenergy.org
Part 2: Personal Water Use Investigation
? Question �How much water do you use in a single day?
Materials� Personal Water Use Survey
ProcedureDay 1
1. Over the next 24 hours, complete the Personal Water Use Survey. Keep track of the amount of time you use water by noting it on the chart. Estimate minutes where appropriate.
Day 2
1. Brainstorm some simple, routine ways you could reduce the amount of water used in a day.
2. For the next 24 hours, repeat the Personal Water Use Survey. Put into practice some of the water conservation methods brainstormed in Question 1.
Conclusion
1. Where does your community get its drinking water?
2. How does saving water also save energy?
3. Aside from personal use, what are 5 additional areas of business or manufacturing that are large water consumers?
4. Suggest three ways your school could conserve water.
5. Could a water shortage or drought occur in your area? If so, list three ways your community could conserve water.

34 ©2019 The NEED Project www.NEED.org Ohio Energy Project www.ohioenergy.org
Personal Water Use SurveyWater Use Day 1: Time
Spent Using Water
Estimated Gallons
Actual Gallons Water Conserving
Method
Day 2: Time Spent Using
Water
Actual Gallons
Washing Hands/Face
Tap running 2.5 gallons per min.
Showering Water running 5 gallons per min.
Brushing Teeth Tap running 2.5 gallons per min.
Flushing the Toilet
7 gallons
Drinking Running water 1/4 gallon
Washing Dishes Running water 30 gallons
Washing Clothes 30 gallons
Cleaning the House
8 gallons
Watering Plants 5 - 10 gallons
Other Uses N/A
ANSWER KEY
LESSON 2B

©2019 The NEED Project www.NEED.org Ohio Energy Project www.ohioenergy.org 3534 ©2019 The NEED Project www.NEED.org Ohio Energy Project www.ohioenergy.org
STUDENT WORKSHEET
Energy in Action:1. Open your outside doors and check the condition of the weather stripping between the doors
and the door frames. Install weather stripping from your efficiency kit in areas where it ismissing or worn.
2. Check the thermostat settings in your home and record below. Then use the Thermostat Temperature Guide from your efficiency kit to calculate the percentage of energy you are saving or wasting.
Heating SeasonMy home temp: Ideal temp:
< 69 °F
% Saved or wasted:
Cooling SeasonMy home temp: Ideal temp:
> 74 °F
% Saved or wasted:
3. Check the efficiency of your bath and kitchen aerators using the Water Flow Bag in your efficiency kit. If aerators are missing orworn, install the aerators provided in your efficiency kit.
Web Quest:1. Visit your utility partner’s website (refer to Lesson One) and search for information regarding the following:
a. Smart Thermostats
i. Describe the features of Smart Thermostats and the benefits of having one in your home.
b. Weatherization
i. Describe a program(s) that your utility provides that you may share with your family or community membersduring extreme weather events.
Career Connections:
Hydrologist - Study how water interacts with the Earth’s crust.
Pump Technician – Install and repair pump systems that connect to water sources.
Wellsite Geologist – Supervise the drilling process for oil and natural gas. Analyze rocks from drilling sites to advise on drilling direction.
HVAC Technician – Install, inspect, and repair heating, cooling, and ventilation systems.
Civil Engineer – Oversee design, construction, and maintenance of built environments, such as roads, bridges, dams, pipelines, and more.
Home & CommunityEfficiency Kit Materials
�Weather Stripping
� Low Flow Showerhead
� Bath and Kitchen Aerators
�Water Flow Bag
� Thermostat Temperature Guide
�Draft stoppers (if included)
LESSON 2

36 ©2019 The NEED Project www.NEED.org Ohio Energy Project www.ohioenergy.org
Lesson 3: Electrical Energyt Overview This lesson provides an in-depth look at electrical energy and how it is used. The lesson begins with a discussion of how electricity is initially generated by power plants, transmitted, and then distributed to buildings.
Part A: After reviewing the basics of electrical energy, this lesson explores appliances and how they contribute to electrical usage.
Part B: Beyond appliances, this lesson explores lighting and how its use contributes to a building’s overall energy usage.
Objectives:Students will be able to:� discuss how electricity is generated and processed by power plants;� discuss how electricity is transmitted from a power plant and distributed to homes;� identify the impact of different types of appliances on a building’s energy usage;� identify different types of bulbs and discuss their contribution to energy usage;� identify and discuss energy efficient tools and conservation behaviors pertaining to electrical energy.
OEP Provided MaterialsLesson 3A� Kill A Watt® Meters
Teacher Provided Materials
Lesson 3A �Classroom Electrical Devices �Copy of School's Electric Bill �Spreadsheet Program (Microsoft Excel, Google Sheets, etc.)
Energy Efficiency Kit Materials
� LED Bulb(s)
�Nightlight (if applicable)
� Refrigerator/Freezer Thermometer (if applicable)
Procedure
Lesson 3A: Appliances1. Introduce the topic of electrical energy and explain what it is and how it is generated, transmitted, and distributed. Discuss how we
use electrical energy in our everyday lives.
2. Discuss with your students how your school is a treasure trove of electrical appliances that are needed to make the day easier.
3. Discuss with students how appliances are vetted through the Energy Star® program and how EnergyGuide labels help consumersmake the best purchases when comparing appliances.
4. Introduce Comparing EnergyGuide Labels and show students the Interpreting an EnergyGuide Label master. Discuss with the classhow to read an EnergyGuide label and instruct them to complete the worksheet.
5. Discuss with students how EnergyGuide labels can influence our purchasing decisions in the future.
6. Secure a copy of your school’s monthly electricity bill.
7. Introduce The Electrical Cost of a Classroom and have students split into small groups to complete the lab.
8. Direct student groups to survey the classroom for electrical devices and use a spreadsheet program to record the number of watts your classroom uses.
LESSON PLAN
Lesson 3B� Goose Neck Lamps � IL, CFL, LED Bulbs� Digital Thermometers � Light Meter� Kill A Watt® Meters

©2019 The NEED Project www.NEED.org Ohio Energy Project www.ohioenergy.org 3736 ©2019 The NEED Project www.NEED.org Ohio Energy Project www.ohioenergy.org
9. Direct students to use their survey to calculate the cost of the electricity your classroom uses.
10. Direct students to use their survey to calculate the environmental cost of using that electricity.
11. Discuss ways your classroom could save electricity.
Lesson 3B: Lighting1. Introduce the topic of lighting and how it is used in your school building. Discuss the different types of lighting and how lighting
could be used more efficiently.
2. Introduce Light Bulb Investigations and have students split into small groups to complete the lab.
3. Instruct students to follow the lab procedure and record the wattage, lighting level, and temperature of the various bulbs.
4. Discuss the results of the lab and what these results suggest about the efficiency of the different bulbs.
5. Introduce Comparing Light Bulbs.
6. Instruct the students to calculate the different costs of each bulb. Discuss what these different costs coupled with the lab findingssuggest about each type of bulb.
Home and Community Action1. Distribute any kit items associated with the lesson and have students install these measures at home or within their community.
2. Have students complete the questions regarding their kit items on the Home & Community worksheet in the Student and FamilyGuide.
3. Have students complete the Web Quest online by visiting various local government and utility websites.
4. Review the Related Careers with students and discuss what pathways students may pursue after graduation.

38 ©2019 The NEED Project www.NEED.org Ohio Energy Project www.ohioenergy.org
Magnets Can Produce ElectricityWe can use magnets to make electricity. A magnetic field can move electrons. Some metals, like copper, have electrons that are loosely held; they are easily pushed from their levels.
Magnetism and electricity are related. Magnets can create electricity and electricity can produce magnetic fields. Every time a magnetic field changes, an electric field is created. Every time an electric field changes, a magnetic field is created. Magnetism and electricity are always linked together; you can’t have one without the other. This phenomenon is called electromagnetism.
Power plants use huge turbine generators to make the electricity that we use in our homes and businesses. Power plants use many fuels to spin turbines. They can burn coal, oil, or natural gas to make steam to spin turbines. Or they can split uranium atoms to heat water into steam. They can also use the power of rushing water from a dam or the energy in the wind to spin the turbine.
The turbine is attached to a shaft in the generator. Inside the generator are magnets and coils of copper wire. The magnets and coils can be designed in two ways — the turbine can spin the magnets inside the coils or can spin coils inside the magnets. Either way, the electrons are pushed from one copper atom to another by the moving magnetic field.
Coils of copper wire are attached to the turbine shaft. The shaft spins the coils of wire inside two huge magnets. The magnet on one side has its north pole to the front. The magnet on the other side has its south pole to the front. The magnetic fields around these magnets push and pull the electrons in the copper wire as the wire spins. The electrons in the coil flow into transmission lines. These moving electrons are the electricity that flows to our houses. Electricity moves through the wire very quickly.
Another Word about WaterIn Lesson 2 we discussed how using water uses a significant amount of energy. But the relationship between water and energy does not stop there.
Thermoelectrical power plants use water in the form of steam to turn a turbine, which generates electricity. In fact, all thermal power plants are the same from the steam turbine through to the distribution lines; the only difference is the manner in which the water is heated to steam. Coal plants burn coal, natural gas plants burn natural gas, nuclear plants use the thermal energy from uranium atoms splitting, and concentrated solar power plants use the sun’s energy to heat water to steam. In each of these power plants, the goal is to boil water to high-pressure steam to turn a turbine. The water is cooled then condensed back to water, and the cycle repeats.
TO TRANSMISSION LINES
TURBINE
DIRECTION OF ELECTRIC CURRENT
Spinning Coil of Wire
TURBINE SPINS SHAFT
MAGNETM
AGNE
T
SouthPole
NorthPole
Turbine Generator
HYDROPOWER TURBINE GENERATORS
Photo of Safe Harbor Water Power Corporation on the Lower Susquehanna River in Pennsylvania.
U.S. Freshwater WithdrawalsIrrigation 32%
Mining 2%
Self-supplied Domestic Use 1%
Public Supply 12%
Self-supplied Industrial Use 5%
Aquaculture 3%
Thermoelectric Power 45%Data: EPA*Total does not equal 100% due to independent rounding.
Background Information: Electrical Energy
LESSON 3

©2019 The NEED Project www.NEED.org Ohio Energy Project www.ohioenergy.org 3938 ©2019 The NEED Project www.NEED.org Ohio Energy Project www.ohioenergy.org
ElectricityElectricity is a little different from the other sources of energy that we talk about. Unlike coal, petroleum, or solar energy, electricity is a secondary source of energy. That means we must use other primary sources of energy, such as coal or wind, to make electricity. It also means we can’t classify electricity as a renewable or nonrenewable form of energy. The energy source we use to make electricity may be renewable or nonrenewable, but the electricity is neither.
GenerationAlmost all electricity made in the United States is generated by large, central power plants. There are about 8,000 power plants in the U.S. Most power plants use coal, nuclear fission, natural gas, or other energy sources to superheat water into steam in a boiler. The very high pressure of the steam (it’s 75 to 100 times normal atmospheric pressure) turns the blades of a turbine. (A turbine turns the linear motion of the steam into circular motion.) As we have learned, the blades are connected to a generator, which houses a large magnet surrounded by coiled copper wire. The blades spin the magnet rapidly, rotating the magnet inside the coil producing an electric current.
The steam, which is still very hot but now at normal pressure, is piped to a condenser, where it is cooled into water by passing it through pipes circulating over a large body of water or cooling tower. The water then returns to the boiler to be used again. Power plants can capture some of the heat from the cooling steam. In old plants, the heat was simply wasted.
Not all power plants use thermal energy to generate electricity. Hydropower plants and wind farms use motion energy to turn turbines, turning a generator, which produces electricity. Photovoltaic plants use radiant energy to generate electricity directly.
Generating ElectricityThree basic types of power plants generate most of the electricity in the United States—fossil fuel, nuclear, and hydropower. There are also wind, geothermal, waste-to-energy, and solar power plants, but together they generate about 8.44 percent of the electricity produced in the United States.
FOSSIL FUEL POWER PLANTS Fossil fuel plants burn coal, natural gas, or petroleum. These plants use the chemical energy in fossil fuels to superheat water into steam, which drives a steam generator. Fossil fuel plants are sometimes called thermal power plants because they use heat to generate electricity. Coal and natural gas are the fossil fuels of choice for most electric companies, producing 30.59 and 34.03 percent of total U.S. electricity respectively. Petroleum produces 0.60 percent of the electricity in the U.S.
NUCLEAR POWER PLANTS Nuclear plants generate electricity much as fossil fuel plants do, except that the furnace is a reactor and the fuel is uranium. In a nuclear plant, a reactor splits uranium atoms into smaller elements, producing a great amount of heat in the process. The heat is used to superheat water into high-pressure steam, which drives a turbine generator. Like fossil fuel plants, nuclear power plants are thermal plants because they use heat to generate electricity. Nuclear energy produces 19.89 percent of the electricity in the U.S.
HYDROPOWER PLANTSHydropower plants use the gravitational force of falling water to generate electricity. Hydropower is the cheapest way to produce electricity in this country, but there are few places where new dams can be built economically. There are many existing dams that could be retrofitted with turbines and generators. Hydropower is called a renewable energy source because it is renewed continuously during the natural water cycle. Hydropower produces five to ten percent of the electricity in the U.S., depending upon the amount of precipitation. In 2016, hydropower generated 6.45 percent of U.S. electricity.
BOILER
STEAM LINE
TURBINE
CONDENSERFEED
WATER
GENERATORSWITCHYARD
ELECTRICITYTRANSMISSION
FUEL BURNING
ELECTRICITY GENERATION
1
2
3
45
FUEL SUPPLY
How a Thermal Power Plant Works
1. Fuel is fed into a boiler, where it is burned (except for uranium which is �ssioned, not burned) to release thermal energy.
2. Water is piped into the boiler and heated, turning it into steam.
3. The steam travels at high pressure through a steam line.
4. The high pressure steam turns a turbine, which spins a shaft.
5. Inside the generator, the shaft spins a ring of magnets inside coils of copper wire. This creates an electric �eld, producing electricity.
6. Electricity is sent to a switchyard, where a transformer increases the voltage, allowing it to travel through the electric grid.
Most thermal power plants are about 35 percent e�cient. Of the 100 units of energy that go into a plant, 65 units are lost as one form of energy is converted to other forms. The remaining 35 units of energy leave the plant to do usable work.
100 units of energy go in
THERMAL ENERGY
ELECTRICALENERGY
MOTION ENERGY
35 units of energy come out
6
Fuel Sources
Petroleum Coal Natural Gas Biomass Uranium
CHEMICALENERGY
E�ciency of a Thermal Power PlantEfficiency of a Thermal Power Plant

40 ©2019 The NEED Project www.NEED.org Ohio Energy Project www.ohioenergy.org
Transmission and DistributionWe are using more and more electricity every year. One reason that electricity is used by so many consumers is that it’s easy to move from one place to another. Electricity can be produced at a power plant and moved long distances before it is used. Let’s follow the path of electricity from a power plant to a light bulb in your home.
First, the electricity is generated at a power plant. It travels through a wire to a transformer that steps up, or increases, the voltage. Power plants step up the voltage because less electricity is lost along the power lines when it is at a higher voltage.
The electricity is then sent to a nationwide network of transmission lines. This is called the electric grid. Transmission lines are the huge tower lines you see along the highway. The transmission lines are interconnected, so if one line fails, another can take over the load.
Step-down transformers, located at substations along the lines, reduce the voltage from 350,000 volts to 12,000 volts. Substations are small fenced-in buildings that contain transformers, switches, and other electrical equipment.
The electricity is then carried over distribution lines that deliver electricity to your home. These distribution lines can be located overhead or underground. The overhead distribution lines are the power lines you see along streets.
Before the electricity enters your house, the voltage is reduced again at another transformer, usually a large gray metal box mounted on an electric pole. This transformer reduces the electricity to the 120 or 240 volts that are used to operate the appliances in your home. Electricity enters your home through a three-wire cable. Wires are run from the circuit breaker or fuse box to outlets and wall switches in your home. An electric meter measures how much electricity you use so that the utility company can bill you.
What’s a Watt?We use electricity to perform many tasks. We use units called watts, kilowatts, and kilowatt-hours to measure the electricity that we use.
A watt is a measure of the electric power an appliance uses. Every appliance requires a certain number of watts to work correctly.
Remember, we pay for the electricity we use in kilowatt-hours. Our power company sends us a bill for the number of kilowatt-hours we use every month.
Economics of ElectricityHow much does electricity cost? The answer depends on the cost to generate the power (57 percent), the cost of transmission (11 percent), and local distribution (32 percent). The average cost of electricity in Ohio is about 11 cents per kWh for residential customers. A major key to cost is the fuel used to generate the power. Electricity produced from natural gas, for example, costs more than electricity produced from uranium or hydropower. Location also plays a part in electricity costs.
Another consideration is how much it costs to build a power plant. A plant may be very expensive to construct, but the cost of the fuel can make it competitive to other plants, or vice versa. Nuclear power plants, for example, are very expensive to build, but their fuel — uranium — is very cheap. Coal-fired plants, on the other hand, are much less expensive to build than nuclear plants, but their fuel — coal — is more expensive.
When calculating costs, a plant’s efficiency must also be considered. In theory, a 100 percent energy efficient machine would change all the energy put into the machine into useful work, not wasting a single unit of energy. But converting a primary energy source into electricity involves a loss of usable energy, usually in the form of thermal energy. In general, it takes three units of fuel to produce one unit of electricity from a thermal power plant.
But that’s not all. Between three and eight percent of the electricity generated at a power plant must be used to run equipment. And then, even after the electricity is sent over electrical lines, another seven percent of the electrical energy is lost in transmission. Of course, consumers pay for all the electricity generated, lost or not.
The cost of electricity is affected by what time of day it is used. During a hot summer afternoon from noon to 6 p.m., there is a peak of usage when air-conditioners are working harder to keep buildings cool. Electric companies charge their industrial and commercial customers more for electricity during these peak load periods because they must turn to more expensive ways to generate power.
Power plant generates electricity
Transformersteps up voltagefor transmission
Step-down transformer
reduces voltage(substation)
Transmission linescarry electricitylong distances
Neighborhood transformer on pole
steps down voltagebefore entering house
Distribution linescarry electricity
to houses
Transporting Electricity
PowerTower
ElectricPoles
TRANSMISSION LINES

©2019 The NEED Project www.NEED.org Ohio Energy Project www.ohioenergy.org 4140 ©2019 The NEED Project www.NEED.org Ohio Energy Project www.ohioenergy.org
LESSON 3A: AppliancesAppliances, machines, and electronic devices use about 18 percent of a typical school’s energy. Any appliance that is designed to change temperature uses a lot of energy.
Look around any classroom and you will see many appliances. A quick survey of the typical classroom and school building reveals many kinds of electrical appliances, such as:
� coffee makers
� computers and monitors
� fans
� desk and table lamps
�microwaves
� refrigerators
� televisions
�DVD players/BluRay players
�window air conditioners
� vending machines
Many of these devices are important to the learning environment.
In addition, there are appliances that teachers and school staff bring from home that are not related to teaching, but are routine devices found in any office. Many electrical appliances, such as computers, printers, and copiers, waste energy when they are left on 24 hours a day. Often they are left on as a matter of convenience because they have a long warm–up time. Turning these machines off at the end of the day, and turning other machines off when they are not being used, can save a lot of energy.
Federal Government Guidelines for AppliancesWhen shopping for a new appliance or lighting, look for the ENERGY STAR® label — your assurance that the product saves energy. ENERGY STAR® appliances have been identified by the U.S. Environmental Protection Agency and Department of Energy as the most energy efficient products in their classes. A list of these appliances and devices can be found on the ENERGY STAR® website at www.energystar.gov.
Another way to determine the efficiency of appliances is to compare energy usage using EnergyGuide labels. The Federal Government requires most appliances to display bright yellow and black EnergyGuide labels. Although these labels do not say which appliance is the most efficient, they provide the annual energy consumption and average operating cost of each appliance so you can compare them.
� printers and scanners
� fax machines
� copiers
� fish tanks
� digital or over head projectors
� ranges and stoves
� vocational equipment
� clocks
� drinking fountains
� pencil sharpeners
Data: DOE, Buildings Data Book
How Much Electricity Do Appliances Use?
0 100 200 300 400 500 600 700 800
Dishwasher
Microwave
Refrigerator/Freezer
Hair Dryer
Desktop Computer
Laptop
Television
Video Game System
Vacuum
kW/Year

42 ©2019 The NEED Project www.NEED.org Ohio Energy Project www.ohioenergy.org
MASTER
Water Heater - Natural GasTank Size (Storage Capacity): 60 gallons
xx CorporationModel XXXXXXX
U.S. Government Federal law prohibits removal of this label before consumer purchase.
Your cost will depend on your utility rates and use.Cost range based only on models fueled by natural gas with a high �rst hour rating (over 75 gallons).Estimated energy cost based on a national average natural gas cost of $1.09 per therm.Estimated yearly energy use: 192 therms.
l
l
l
l
List of key features of the appliance and
similar models in the same cost
range.
What you might pay to run the appliance for a year, based on
its fuel or electricity
consumption and the national
average cost of the energy. Cost will appear for all
models and brands.
An estimate of water available
within first hour of use and its
comparison to other models.
The maker and model tell
exactly what product the label
is describing.
The cost range helps you compare the energy use of
different models by showing the range of operating costs for similar models
and features.
If you see the ENERGYSTAR
logo, it means the product is better for
the environment because it uses less
energy than standard models.
$213$225 $297
Estimated Yearly Energy Cost
Cost Range of Similar Models
First Hour Rating (How much hot water you get in the first hour of use)
very small low medium high157 Gallons
ftc.gov/energy
Interpreting an EnergyGuide LabelLESSON 3

©2019 The NEED Project www.NEED.org Ohio Energy Project www.ohioenergy.org 4342 ©2019 The NEED Project www.NEED.org Ohio Energy Project www.ohioenergy.org
ANSWER KEY
Comparing EnergyGuide LabelsAs we now know, EnergyGuide labels provide information on the annual energy consumption and average operating costs of an appliance so that you can compare them to similar models. Use the EnergyGuide labels below to fill in the charts.
How many years will it take before you begin to save money? Four years
How much money will you have saved after seven years? $110.00
Water Heater 1—Purchase Price: $750.00 Water Heater 2— Purchase Price: $650.00
WATER HEATER 1 EXPENSES COST TO DATE WATER HEATER 2 EXPENSES COST TO DATE
Purchase Price $750 $750 Purchase Price $650 $650
Year One $240 $990 Year One $270 $920
Year Two $240 $1,230 Year Two $270 $1,190
Year Three $240 $1,470 Year Three $270 $1,460
Year Four $240 $1,710 Year Four $270 $1,730
Year Five $240 $1,950 Year Five $270 $2,000
Year Six $240 $2,190 Year Six $270 $2,270
Year Seven $240 $2,430 Year Seven $270 $2,540
Water Heater - Natural GasTank Size (Storage Capacity): 50 gallons
xx CorporationModel XXXXXXX
U.S. Government Federal law prohibits removal of this label before consumer purchase.
Your cost will depend on your utility rates and use.Cost range based only on models fueled by natural gas with a high �rst hour rating (above 75 gallons).Estimated energy cost based on a national average natural gas cost of $1.09 per therm.Estimated yearly energy use: 224 therms.
l
l
l
l
$240$225 $275
Estimated Yearly Energy Cost
Cost Range of Similar Models
First Hour Rating (How much hot water you get in the first hour of use)
very small low medium high90 Gallons
ftc.gov/energy
Water Heater - Natural GasTank Size (Storage Capacity): 50 gallons
xx CorporationModel XXXXXXX
U.S. Government Federal law prohibits removal of this label before consumer purchase.
Your cost will depend on your utility rates and use.Cost range based only on models fueled by natural gas with a medium �rst hour rating (51-74 gallons).Estimated energy cost based on a national average natural gas cost of $1.09 per therm.Estimated yearly energy use: 248 therms.
l
l
l
l
$270$225 $275
Estimated Yearly Energy Cost
Cost Range of Similar Models
First Hour Rating (How much hot water you get in the first hour of use)
very small low medium high73 Gallons
ftc.gov/energy
LESSON 3A
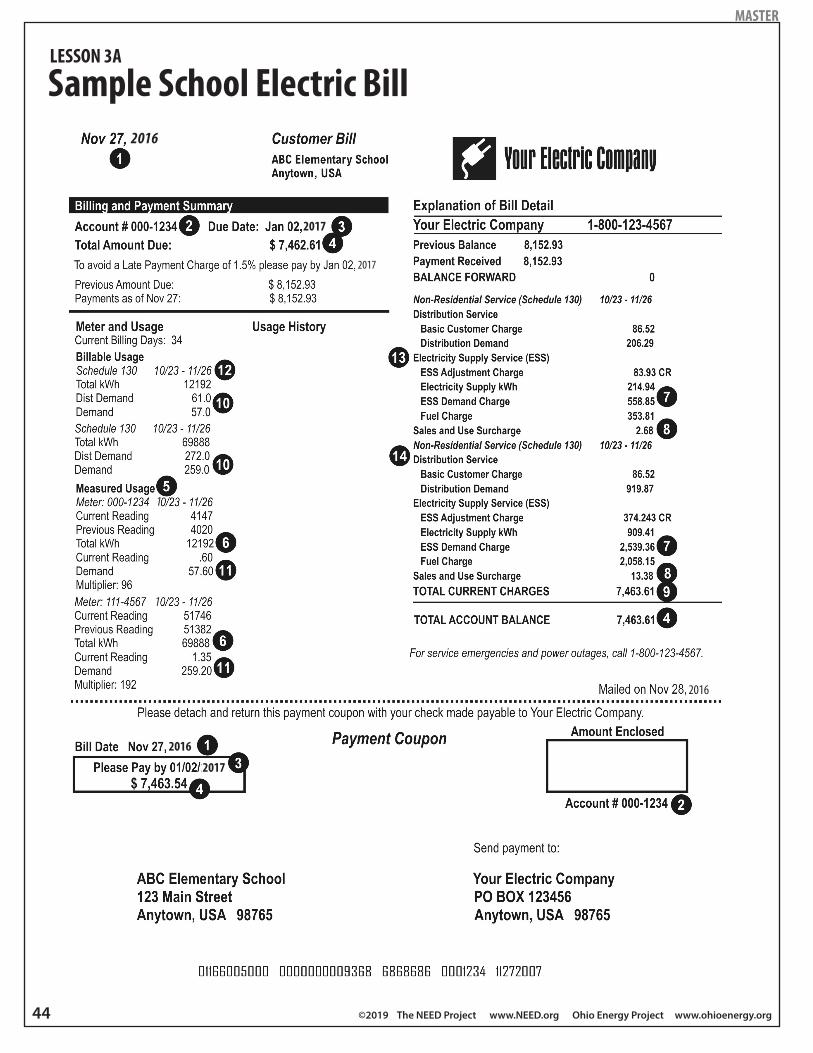
44 ©2019 The NEED Project www.NEED.org Ohio Energy Project www.ohioenergy.org
MASTER
Sample School Electric Bill2016
2017
2017
2016
2016
2017
1
1
LESSON 3A

©2019 The NEED Project www.NEED.org Ohio Energy Project www.ohioenergy.org 4544 ©2019 The NEED Project www.NEED.org Ohio Energy Project www.ohioenergy.org
MASTER
Sample School Electric Bill Explanation and DiscussionExplanation1. Bill mailing date
2. Customer account number
3. Payment due date
4. Total amount due
5. Meter readings by date in kilowatt-hours (note that there are two meters on this bill)
6. Actual kilowatt-hours consumed
7. Cost of the electricity consumed
8. Sales and use surcharge
9. Total current charges
10. Demand. This is a measurement of the rate at which electricity is used. The monthly demand is based on the 15 minutes during a billing period with the highest average kilowatt use. Demand charges are designed to collect some of the generation and transmission-related costs necessary to serve a particular group or class of customers.
11. Actual demand for the meter
12. Schedule 130. A rate class that determines how much is paid per kWh of usage and kW demand
13. Electricity supply service. Customers are billed for the electricity supply and the delivery of the electricity. The supply charge reflectsthe cost of generating the electricity at the power plant.
14. Distribution service. The delivery charge reflects the cost of delivering the electricity from the power plant to the customer.
DiscussionThe appearance of utility bills will be different from one utility to the next, but they typically contain the same information. The rate that a school or other commercial building pays for electricity is determined by measuring two items: the electrical energy usage, in kilowatt-hours, and the electrical energy demand, measured in kilowatts.
The demand is the maximum amount of power that the building needed within a time frame. The higher the total amount of kilowatts being used at any given time by a building, the higher this charge is. Demand can be reduced by rescheduling when high energy devices are running, or scheduling them such that their use is spread out evenly throughout the day. For example, vacuum cleaners or other appliances with high energy motors can be run after school is over, when other devices are turned off. Professional energy managers can make recommendations about this scheduling, or some other changes that can help a building’s occupants reduce the demand portion of their electric bill.
The energy use portion is how much electrical energy, in kilowatt-hours, is used in total during the billing period. The more devices turned on and running, the higher the energy use charge is. This portion of the utility bill can be reduced by turning off unnecessary items or installing more efficient equipment. For example, computer monitors in a school computer lab can be turned off at the end of the school day, or ENERGY STAR®appliances can be used in place of older, less efficient models.
Ask your teacher, principal, or building manager for a copy of the school’s electric bill, and identify as many of the above items on it as you can. If you have more than one building in your school district, see if you can get bills for other buildings to compare. Talk about ways you as students can help reduce both the demand as well as the energy use portions of your school’s utility costs.
LESSON 3A

46 ©2019 The NEED Project www.NEED.org Ohio Energy Project www.ohioenergy.org
MASTER
Kill A Watt® MeterThe Kill A Watt® meter allows users to measure and monitor the power consumption of any standard electrical device. You can obtain instantaneous readings of voltage (volts), current (amps), line frequency (Hz), and electric power being used (watts). You can also obtain the actual amount of power consumed in kilowatt-hours (kWh) by any electrical device over a period of time from one minute to 9,999 hours. A kilowatt is 1,000 watts.
Operating Instructions1. Plug the Kill A Watt® meter into any standard grounded outlet or extension
cord.
2. Plug the electrical device or appliance to be tested into the AC Power OutletReceptacle of the Kill A Watt® meter.
3. The LCD displays all meter readings. The unit will begin to accumulate dataand powered duration time as soon as the power is applied.
4. Press the Volt button to display the voltage (volts) reading.
5. Press the Amp button to display the current (amps) reading.
6. The Watt and VA button is a toggle function key. Press the button once todisplay the Watt reading; press the button again to display the VA (volts xamps) reading. The Watt reading, not the VA reading, is the value used tocalculate kWh consumption.
7. The Hz and PF button is a toggle function key. Press the button once todisplay the Frequency (Hz) reading; press the button again to display thePower Factor (PF) reading.
8. The KWH and Hour button is a toggle function key. Press the button onceto display the cumulative energy consumption. Press the button again todisplay the cumulative time elapsed since power was applied.
What is Power Factor?The formula Volts x Amps = Watts is used to find the energy consumption of an electrical device. Many AC devices, however, such as motors and magnetic ballasts, do not use all of the power provided to them. The Power Factor (PF) has a value equal to or less than one, and is used to account for this phenomenon. To determine the actual power consumed by an AC device, the following formula is used:
Volts x Amps x PF = Watts Consumed
LESSON 3A

©2019 The NEED Project www.NEED.org Ohio Energy Project www.ohioenergy.org 4746 ©2019 The NEED Project www.NEED.org Ohio Energy Project www.ohioenergy.org
STUDENT WORKSHEET
The Electrical Cost of a Classroom? Question
�How much does it cost to power your classroom?
Materials �Computer spreadsheet program, like Microsoft Excel �Classroom electrical devices �Kill A Watt® meter �Copy of your school’s electric bill
ProcedurePart 1: Classroom Electrical Audit
1. Create an individual or class spreadsheet to record data for the Classroom Electrical Audit.
2. Survey your classroom for electrical devices. Identify and record all surveyed devices on your spreadsheet. Be sure to include thename of the device as well as the number of those devices in your classroom.
3. Using the Kill A Watt® meter, measure the wattage of the surveyed devices and record it on your spreadsheet.
NOTE: Do not unplug a device at school without making sure it’s allowable to do so. Some devices, like copiers, require long start-up times. If you cannot use your Kill A Watt® meter to check a device, ask your school’s facilities team for the information.
4. Once the wattage of each device is recorded, calculate the total wattage of each device. Use the example provided below to guide you.
5. Add the total wattage of each device.
Sample Spreadsheet
? Question1. How many total watts does your classroom use?
ProcedurePart 2: Calculating Cost
1. Now that we know the total amount of watts your classroom uses, let’s calculate cost. To do this, we’ll need some more information.
Cost of Electricity: The average cost of electricity in Ohio is $0.11 per kilowatt-hour. We are billed for our electricity usage in kilowatt-hours, or how many kilowatts of energy we use each hour.
Operating Hours: Your classroom only operates during certain hours. To calculate the electricity usage of your classroom, we must account for only when your classroom is in use. Work with your teacher to estimate the number of hours your classroom is using electricity in a month.
2. Use a spreadsheet program to calculate the cost of the electricity in your classroom for a month. A sample has been provided on the next page.
3. With help from your teacher, use your school’s electricity bill to compare how much electricity your classroom uses with theelectricity consumption of the whole school.
LESSON 3A

48 ©2019 The NEED Project www.NEED.org Ohio Energy Project www.ohioenergy.org
? Questions
1. How much does the electricity in your classroom cost for one month?
2. List 3 reasons why the electricity consumption of your classroom might look different than the electricity consumption of yourwhole school.
Procedure
Part 3: Environmental Cost
Now that we understand how much money our school spends on electricity and how much electricity we use in the classroom, let’s talk about environmental costs.
1. Use a spreadsheet program to calculate the number of pounds of carbon dioxide your classroom’s energy usage creates in amonth.
NOTE: The average was 1.6 pounds of carbon dioxide per kilowatt-hour consumed in 2016.
2. With a knowledge of the environmental cost of the classroom, let’s take a look at some of the efficiency measures that could helpsave us electricity.
Occupancy Controls – These controls help to power a room when it is actually in use. These systems can be automatic, with special equipment that identifies whether or not anyone is in the room, or manual, with students and teachers taking action to turn off electrical devices when the room is not in use.Energy Efficient Devices – Devices that are energy efficient help us to use only the energy we need to be comfortable and accomplish necessary tasks. Talk with your teacher about what devices could be helpful for your classroom.
1. Brainstorm 3 ways your classroom could save electricity.
STUDENT WORKSHEET
Sample Spreadsheet
? Questions
Sample Spreadsheet

©2019 The NEED Project www.NEED.org Ohio Energy Project www.ohioenergy.org 4948 ©2019 The NEED Project www.NEED.org Ohio Energy Project www.ohioenergy.org
In �uorescent tubes, a very small amount of mercury mixes with inert gases to conduct the electric current. This allows the phosphor coating on the glass tube to emit light.
Fluorescent Tube Lamp
Mercury and inert gases
Phosphor coating
Base with bi-pin plug
In fluorescent tubes, a very small amount of mercury mixes with inert gases to conduct the electric current. This allows the phosphor coating on the glass tube to emit light.
Inside an LED
p-type layerp-n type junctionn-type layer
photons
anode lead
cathode lead
LED chip
re�ecting cup
epoxy case
emitted light
T121 ½”
40 watts
T81”
32 watts
T55⁄8”
24 watts
A T12 bulb consumes up to 40 watts of energy to produce a given amount of light. T8 and T5 bulbs use less energy to produce the same amount of light.
Fluorescent Lighting E�ciency
LESSON 3B: LightingLighting is a significant consumer of energy in a school system. An average school uses about 17 percent of the electricity (9% of the total energy) it consumes to light buildings and outside areas. Much of this can be the result of using inefficient lighting, while some can be attributed to wasteful lighting behaviors. Some schools may still use incandescent lighting in various lamps and fixtures in small spaces. Incandescent lighting is very inefficient, in that only 10 percent of the energy consumed actually produces light. The rest is given off as heat. There are other more efficient lighting choices on the market, including halogens, fluorescents, and LEDs. Halogens are sometimes called energy-saving incandescent bulbs because they last slightly longer, and use less energy than traditional incandescent bulbs, however they can burn hotter than incandescent lights do. Fluorescent lights produce very little heat and are even more efficient. Most schools use fluorescent tube lighting throughout the building, but may use incandescent bulbs in other spaces around the school.
A fluorescent lamp is a glass tube, whose inner surface has a powdered, phosphor coating. The tube is filled with argon gas and a small amount of mercury vapor. At the ends of the tubes are electrodes that emit electrons when heated by an electric current. When electrons strike the mercury vapor, the mercury atoms emit rays of ultraviolet (UV) light. When these invisible UV rays strike the phosphor coating, the phosphor atoms emit visible light. The conversion of one type of light into another is called fluorescence. Fluorescent lights have ballasts that regulate the electricity through the gas inside the bulb. Ballasts are electromagnets that produce a large voltage between the ends of the bulbs so the electricity will flow between them. There are two types of ballasts, magnetic and electronic. Magnetic ballasts produce a frequency of 60 Hertz (Hz), which means the light is flickering on and off 60 times a second. Electronic ballasts produce a frequency of at least 20,000 Hz. Fluorescent lights with electronic ballasts are more energy efficient than those with magnetic ballasts. Electronic ballasts use up to 30 percent less energy than magnetic ballasts. Electronic ballasts operate at a very high frequency that eliminates flickering and noise. Some electronic ballasts even allow you to operate the fluorescent lamp on a dimmer switch, which usually is not recommended with most fluorescents.
Fluorescent lights produce very little heat and are much more energy efficient than either type of incandescent bulb. CFLs use the same technology as overhead fluorescent lights, but they are designed to fit into lamps and other fixtures where incandescents are commonly used. All CFL bulbs have electronic ballasts.
Light emitting diode bulbs are even more efficient than CFL bulbs, last about 25 times longer than incandescent bulbs, and more than two and a half times longer than CFLs. One LED bulb has several tiny LEDs inside of it. LEDs contain semiconductors like solar panels and other diodes, however the difference is in the way the electrical energy is used by the LED. Three layers within the LED–p-type, n-type, and a depletion zone–combine to produce light. Basically, a minimum voltage is needed to energize electrons and they move from the n-layer to the p-layer. When the electrons move back to the n- layer again, they emit light that we see. Although CFLs and LEDs cost more to buy, they save money in the long run because they use 20-25 percent of the energy of incandescent bulbs and last several times longer. Each CFL or LED
installed to replace an incandescent can save about $30-80 over the life of each bulb. Replacing incandescent bulbs with LED or CFL bulbs can also reduce carbon dioxide emissions by hundreds of pounds over the life of the bulb.

50 ©2019 The NEED Project www.NEED.org Ohio Energy Project www.ohioenergy.org
Lighting ControlsLighting controls are devices that turn lights on and off or dim them.
The simplest type is a standard snap switch. Other controls include photocells, timers, occupancy sensors, and dimmers. Snap switches, located in many convenient areas, make it easier for people in large, shared spaces to turn off lights in unused areas. Photocells turn lights on and off in response to natural light levels. Photocells switch outdoor lights on at dusk and off at dawn, for example. Advanced designs gradually raise and lower fluorescent light levels with changing daylight levels.
Mechanical or electronic time clocks automatically turn indoor or outdoor lights on and off for security, safety, and tasks such as janitorial work. An occupancy sensor activates lights when a person is in the area and then turns off the lights after the person has left.
Dimmers reduce the wattage and output of incandescent and fluorescent lamps. Dimmers also significantly increase the service life of incandescent lamps; however, dimming incandescent lamps reduces their light output more than their wattage, making them less efficient as they are dimmed. Dimmers for fluorescents require special dimming ballasts, but do not reduce the efficiency of the lamps.
Even the best lighting system is not efficient if people do not use it wisely. In most schools, more light is used than needed and lights are often left on when no one is present. All lights that are not necessary for safety should be turned off when rooms are not in use. The same is true for outside lights. Using sunlight is a good idea whenever possible. Studies have shown that students learn better in natural light than in artificial light.
How Light Emitting Diodes Work1. Diodes are made of semiconductors and conducting materials
that need to be added to the semiconductor. In an LED themost common conductor added is aluminum-gallium-arsenide(AlGaAs). The AlGaAs is “doped” by adding small amounts ofanother material. One material will have more valence electronsthan AlGaAs, and another doping material will have fewerelectrons. The two doped materials are put together in a crystal.The material with more electrons is the “n-type” (n for negative)and the material with fewer electrons is the “p-type” (p for positive). When these materials are sandwiched together, the electronsmove to balance themselves out. The area between the materials, called the p-n junction, is also called the “depletion zone.”
2. Connecting a power source to the diode, such as a battery, provides electric current that carries electrical energy. The electrons in then-type are repelled by the electric current, and move through thedepletion zone to the p-type. They are energized, and will want to return to their original, unenergized state in the n-type.
3. When the electrons move back through the depletion zone to then-type, they release energy as light. This is the light that we seefrom the LED. This process continues over and over again–electrons absorbing energy, moving, then moving back and releasing theenergy, until the power supply is disconnected or depleted.
4. Connecting the power supply in the wrong orientation does notallow the LED to work. Instead, it merely increases the size of thedepletion zone. Therefore, it is important that LED’s be wired totheir power supply in the correct orientation.
n-type p-type
n-type p-type2Current Flow
Battery
n-type p-type
Battery
3Current Flow
n-type p-type
Battery
4No Current Flows
How Light Emitting Diodes Work
Increased Depletion
Zone
Indoor lighting sensor

©2019 The NEED Project www.NEED.org Ohio Energy Project www.ohioenergy.org 5150 ©2019 The NEED Project www.NEED.org Ohio Energy Project www.ohioenergy.org
MASTER
The Light Meter
Operating Instructions1. Insert the battery into the battery compartment in the back of
the meter.
2. Slide the ON/OFF Switch to the ON position.
3. Slide the Range Switch to the B Position.
4. On the back of the meter, pull out the meter’s tilt stand andplace the meter on a flat surface in the area you plan to measure.
5. Hold the Light Sensor so that the white lens faces the lightsource to be measured or place the Light Sensor on a flat surface facing the direction of the light source.
6. Read the measurement on the LCD Display.
7. If the reading is less than 200 fc, slide the Range Switch to the Aposition and measure again.
Light Output or Luminous FluxA lumen (lm) is a measure of the light output (or luminous flux) of a light source (bulb or tube). Light sources are labeled with output ratings in lumens. A T12 40-watt fluorescent tube light, for example, may have a rating of 3050 lumens.
Light Level or IlluminanceA foot-candle (fc) is a measure of the quantity of light (illuminance) that actually reaches the work plane on which the light meter is placed. Foot-candles are work plane lumens per square foot. The light meter can measure the quantity of light from 0 to 1000 fc.
Brightness or LuminanceAnother measure of light is its brightness or luminance. Brightness is a measure of the light that is reflected from a surface in a particular direction. Brightness is measured in footlamberts (fL).
LCD Display
ON/OFF Switch
Range Switch
Light Sensor
LESSON 3B

52 ©2019 The NEED Project www.NEED.org Ohio Energy Project www.ohioenergy.org
STUDENT WORKSHEET
Light Bulb Investigations? Questions
�What is the difference in thermal energy output of different light bulbs? �What is the difference in light output of different light bulbs? �How do light bulbs compare in the amount of energy used?
Materials �3 Lamps �1 Incandescent or halogen incandescent light bulb and its packaging �1 Compact fluorescent light bulb (CFL) and its packaging �1 Light emitting diode bulb (LED) and its packaging �3 Thermometers �Tape �Kill A Watt® meter �Light meter �Ruler or meter stick �Calculators
Hypothesis
______________________________________________________________________________________________________________
______________________________________________________________________________________________________________
_______________________________________________________________________________________________________________
Procedure1. Place the incandescent bulb in one lamp, the CFL in another lamp, and the LED bulb in the third lamp. If you do not have three
lamps, conduct three trials, one for each bulb.
2. Place the lamps on a table about 20 cm away from ablank wall. The light should face the wall.
3. Tape the thermometers to the wall so the lamps shinedirectly on them, as shown in the diagram.
4. Record the thermometer readings every two minutes.
5. Calculate and record the change in temperature (ΔT) foreach bulb.
6. Turn on the light meter and remove the cover fromthe sensor. Place the sensor on the wall in front of thethermometer and record the foot-candles for each bulb.
7. Turn off each lamp and unplug them. Plug one into theKill A Watt® meter and plug the meter into the wall. Push the Watts button and turn on the lamp. Record the power used by the lamp. Repeat for the other two lamps.
8. Answer the conclusion questions.PAGE 30 Learning & Conserving Student ©2009 THE NEED PROJECT • P.O. BOX 10101 • MANASSAS, VA 20108 • 1-800-875-5029
Lightbulb Investigation 1GOAL: To compare the heat output of an incandescent to a compact fluorescent lightbulb.
MATERIALS: 2 lamps, 1 incandescent lightbulb, 1 compact fluorescent bulb, 2 thermometers, tape
PREPARATION: Read all of the steps in the procedure.
Write your hypothesis below:
HYPOTHESIS:
PROCEDURE:
1. Place the incandescent bulb in one lamp and the compact fluorescent bulb in the other.
2. Place the lamps on a table about 40 cm apart facing a blank wall.
3. Tape the thermometers to the wall so that the lamps shine directly on them, as shown in thediagram below.
4. Record the thermometer readings in the chart below.
5. Turn on the lamps. Record the thermometer readings at 2-minute intervals for 10 minutes.
6. Calculate and record the change in temperature for each bulb. Compare. ΔΔΔΔΔ = change.
RESULTS:
CONCLUSION:
LESSON 3B

©2019 The NEED Project www.NEED.org Ohio Energy Project www.ohioenergy.org 5352 ©2019 The NEED Project www.NEED.org Ohio Energy Project www.ohioenergy.org
Conclusion1. Rank the bulbs in order of brightness, the first being the brightest. Does this ranking reflect the ranking of the bulbs according to the
lumens listed on the package? Explain why you think this is.
2. The three bulbs emit light using three different methods. Based on your observations of temperature change, which bulb do you think is most efficient at producing light? Does this agree with the watts recorded on the Kill A Watt® meter?
Data
Bulb typePackage
stated Wattage
Package stated
Lumens
Temperature (Celsius)Light meter
reading
Kill-a-Watt
meter reading
0 min 2 min 4 min 6 min 8 min 10 min ΔT
Incandescent
CFL
LED
STUDENT WORKSHEET

54 ©2019 The NEED Project www.NEED.org Ohio Energy Project www.ohioenergy.org
ANSWER KEY
Comparing Light BulbsThe graphic below shows four light bulbs that produce the same amount of light. You might use bulbs like these as a bright overhead light. One bulb is an incandescent light bulb (IL), one is a halogen, one is a compact fluorescent light (CFL), and another is a light emitting diode (LED). Which one is the better bargain? Let’s do the math and compare the four light bulbs using the residential cost of electricity at $0.11/kWh.
1. Determine how many bulbs you will need to produce 25,000 hours of light by dividing 25,000 by the number of hours each bulbproduces light.
2. Multiply the number of bulbs you will need to produce 25,000 hours of light by the price of each bulb. The cost of each bulb hasbeen given to you in the chart below.
3. Multiply the wattage of the bulbs (using the kW number given) by 25,000 hours to determine kilowatt-hours (kWh) consumed.
4. Multiply the number of kilowatt-hours by the cost per kilowatt-hour to determine the cost of electricity to produce 25,000 hours oflight.
5. Add the cost of the bulbs plus the cost of electricity to determine the life cycle cost for each bulb. Which one is the better bargain?
6. Compare the environmental impact of using each type of bulb. Multiply the total kWh consumption by the average amount ofcarbon dioxide produced by a power plant. This will give you the pounds of carbon dioxide produced over the life of each bulb.Which one has the least environmental impact?
COST OF BULB INCANDESCENT BULB HALOGEN COMPACT FLUORESCENT (CFL) LIGHT EMITTING DIODE (LED)
Life of bulb (how long it will light) 1,000 hours 3,000 hours 10,000 hours 25,000 hours
Number of bulbs to get 25,000 hours 25 9 3 1
x Price per bulb $0.50 $1.5 $1.5 $1.33
= Cost of bulbs for 25,000 hours of light $12.50 $13.50 $4.50 $1.33
COST OF ELECTRICITY INCANDESCENT BULB HALOGEN COMPACT FLUORESCENT (CFL) LIGHT EMITTING DIODE (LED)
Total Hours 25,000 hours 25,000 hours 25,000 hours 25,000 hours
x Wattage 60 watts = 0.060 kW 43 watts = 0.043 kW 13 watts = 0.013 kW 12 watts = 0.012 kW
= Total kWh consumption 1,500 1,075 325 300
x Price of electricity per kWh $0.11 $0.11 $0.11 $0.11
= Cost of Electricity $165.00 $118.25 $35.75 $33.00
LIFE CYCLE COST INCANDESCENT BULB HALOGEN COMPACT FLUORESCENT (CFL) LIGHT EMITTING DIODE (LED)
Cost of bulbs $12.50 $13.50 $4.50 $1.33
+ Cost of electricity $165.00 $118.25 $35.75 $33.00
= Life cycle cost $177.50 $131.75 $40.25 $34.33
ENVIRONMENTAL IMPACT INCANDESCENT BULB HALOGEN COMPACT FLUORESCENT (CFL) LIGHT EMITTING DIODE (LED)
Total kWh consumption 1,500 1,075 325 300
x Pounds (lbs) of carbon dioxide per kWh 1.6 lb/kWh 1.6 lb/kWh 1.6 lb/kWh 1.6 lb/kWh
= Pounds of carbon dioxide produced 2,400 lbs 1,720 lbs 520 lbs 480 lbs
All bulbs provide about 850 lumens of light.
LESSON 3B

©2019 The NEED Project www.NEED.org Ohio Energy Project www.ohioenergy.org 5554 ©2019 The NEED Project www.NEED.org Ohio Energy Project www.ohioenergy.org
STUDENT WORKSHEET
Energy in Action:1. Inspect your home for areas where an LED bulb could replace a less efficient lighting source. Use the LED bulb(s) provided in
your efficiency kit to replace the inefficient bulb. If your home is already all LED, brainstorm places where you could install the bulb(s), i.e. friend’s home, relative’s home, at a neighbor’s house, etc.
2. Inspect your home for a dimly lit area where a nightlight could come in handy and install the nightlight from the efficiency kit. The cost per year to power the nightlight is $0.02. If you use the nightlight for 80 years, how much would it cost?
3. Use the refrigerator/freezer thermometer from the efficiency kit to measure your current refrigerator/freezer settings and recordbelow. Keep the thermometer in place for 24 hours to get accurate results. Adjust the settings, if necessary.
a. Refrigerator temp: _______; Safe zone is 36 – 40 °F
b. Freezer temp: _______; Safe zone is 0 – 5 °F
4. Explain to a family member, friend, or relative what the EnergyStar logo on many common household appliances means. Survey the appliances in your home for the EnergyStar logo. What appliances did you find sporting the logo?
Web Quest:1. Visit your utility partner’s website (refer to Lesson One) and search for information regarding the following:
a. Appliances
i. What are some of the latest and greatest energy efficient appliances and what are their most efficient features? Besure to search for any rebates that may be helpful for your family now or in future purchases.
Career Connections:Electrical Engineer – Design, develop, and test electrical equipment, including power generators, navigation systems, and more.
Solar Photovoltaic Installer – Assemble, install, and maintain solar panel systems on rooftops and other structures.
Lineworker – Install, maintain, and repair power lines.
Mechanical Engineer – Design power-producing machines, such as electric generators, turbines, and more.
Electrician – Install, maintain, and repair wiring, control, and lighting systems.
Home & CommunityEfficiency Kit Materials� LED Bulbs
� LED Nightlight
� Refrigerator/Freezer Thermometer
LESSON 3

56 ©2019 The NEED Project www.NEED.org Ohio Energy Project www.ohioenergy.org
Lesson 4: Energy as a Systemt Overview This lesson discusses how energy usage works as part of a system. The lesson demonstrates how energy systems work together and what the environmental implications are. The lesson also discusses some career options for students interested in being part of the energy industry.
Part A: After reviewing energy usage as a system, this lesson explores how to conduct an energy audit of your school.
Part B: Beyond the energy audit, this lesson encourages students to design a project showcasing their understanding of energy efficiency.
Objectives:Students will be able to:
� discuss how energy works as a system;� discuss how energy usage impacts our environment;� audit their surroundings and discover ways to be more energy efficient;� demonstrate their knowledge of energy efficiency through a project of their own design.
OEP Provided MaterialsLesson 4A
�Digital Thermometers �Hygrometer �Light Meter �Kill A Watt® Meters
Procedure
Lesson 4A: Energy Audit1. Contact the facilities manager for your district and/or the school maintenance staff to begin the School Building Survey. They may
be able to answer many questions that will help with the audit.
2. Discuss how the different types of energy discussed so far are used in tandem as a system in your school. Discuss what theenvironmental implications of using this energy are and how we can use energy more efficiently.
3. Introduce the Energy Audit and review all the audit tools students will use. Assign students to working groups to complete the audit.
4. Assign each group an area or room of the school to audit. Remind students to be thorough yet respectful of whomever is occupying the spaces they are to investigate.
5. Instruct students to use the Student Audit Recording Form, Recommended Light Levels, and School Building Survey as their guide.
6. After the audit, instruct students to compile their results on the Findings and Recommendations worksheet.
7. Discuss what measures can be done at your school to save energy.
Lesson 4B: Culminating Project1. Introduce the Culminating Project and have students split into small groups.
2. Instruct students to design a project that will showcase their understanding of energy efficiency. Discuss the recommended projects in the curriculum and other potential projects that could highlight their understanding of energy.
3. Instruct students to submit a project plan to you for approval prior to completing their project. Once approved, allow students tocomplete their project and present it to their intended audience.
4. Discuss how this project showcases their efficiency knowledge.
5. Share student projects with OEP!
LESSON PLAN
� Infrared Thermometer� LCD Thermometer� Flow Meter Bags� Hot Water Temperature Gauges

©2019 The NEED Project www.NEED.org Ohio Energy Project www.ohioenergy.org 5756 ©2019 The NEED Project www.NEED.org Ohio Energy Project www.ohioenergy.org
Home and Community Action1. Distribute any kit items associated with the lesson and have students install these measures at home or within their community.
2. Have students complete the questions regarding their kit items on the Home & Community worksheet in the Student and FamilyGuide.
3. Have students complete the Web Quest online by visiting various local government and utility websites.
4. Review the Related Careers with students and discuss what pathways students may pursue after graduation.

58 ©2019 The NEED Project www.NEED.org Ohio Energy Project www.ohioenergy.org
Background Information: Energy as a SystemAt this point we have investigated energy use one form at a time. However, the overall energy consumption picture of a school is much more complicated than isolating one classroom or one facet of the building. The lights, heating, and electrical systems throughout the building work with the insulation and building envelope to keep us comfortable while we learn.
When managing the systems of a school to minimize energy consumption, it’s important to maintain the health and comfort of the occupants. After all, the reason energy is being used in the first place is to provide a good learning environment. Human beings have specific requirements for temperature, relative humidity, and general air quality. They also have requirements for the quality and quantity of lighting. If light levels are too low, or of poor quality, they can cause eyestrain, headaches, and safety issues. Energy can be saved by turning off lights and lowering the heat in winter, but doing so thoughtlessly can cause unsafe or unhealthy conditions in the building. When the building is treated as a system, energy is saved while maintaining or improving the indoor environment. The school is not only a system in itself, but also a part of a global energy system that has finite energy resources.
There are many other systems that work together in other ways in your school, but the most important part of those systems is the people who use them. People are the brains of energy use and they are the part of the system that will have the most impact on how much energy they use.
Environmental ImplicationsUsing all this energy to power our lives does not happen without impacting the environment.
Burning coal and natural gas carry with them environmental consequences beyond using the resources themselves. When coal and natural gas are burned, carbon dioxide is released into the atmosphere. You’ve heard of carbon dioxide before – it is a waste product from living cells when they use their own energy sources. Carbon dioxide alone isn’t a problem and is a necessary part of our natural cycles on Earth. However, when too much of it builds up in the atmosphere, it leads to climate change.
The atmosphere around the Earth works just like a blanket on your bed by trapping heat and holding it in. Water vapor, carbon dioxide, and other gases are called greenhouse gases because they absorb thermal energy and hold on to it. This is called the greenhouse effect, and it’s what keeps us from freezing to death every night when we are beyond the sun’s warming energy. But just like too much candy, too much of the greenhouse effect is not a good thing.
For thousands of years, carbon dioxide levels on Earth stayed fairly consistent. However, since the Industrial Revolution, when we as a society started using coal and petroleum for energy to run our
large machines, the amount of carbon dioxide in the atmosphere has been increasing. This has led to temperature increases world-wide, and is causing large amounts of ice to melt, raising sea levels. Too much carbon dioxide is causing the atmosphere, and also the oceans, to get warmer than they should be.
Careers in Energy ManagementManaging your home is done by one of your parents or another adult in your family. That person controls the thermostat setting and reminds people to turn things off when not in use. Managing the energy use of a home is important, but not overly complicated. However, managing the energy systems in a school is an entirely different situation. People who oversee the maintenance and operation of commercial buildings like schools often have some level of post-secondary training, and often have an associate’s degree in building management. These programs train people in the operation and maintenance of HVAC, water, electrical, and lighting systems. Many community and junior colleges offer programs in building operations and maintenance, and some companies hire and train their own employees to manage their commercial buildings.
Operations engineers are often mechanical or electrical engineers who have taken specialized courses in the operation and maintenance of commercial buildings. In addition to the skills that a building maintenance supervisor would have, operations engineers also know how to upgrade systems and choose the equipment for new construction. Mechanical and electrical engineers might also work in the energy management field by working with construction managers to design systems from one manufacturer to meet the specifications in a building design. They choose the equipment, oversee its installation, and set up the control systems, testing them to make sure they are operational.
Certified Energy Managers are a specific group of people who have gone through training and passed a test certifying that they are qualified to conduct energy audits and manage the energy use of a building. Their responsibilities include maintaining all the energy-using systems in commercial and industrial buildings but can also include conducting formal energy audits for companies who do not employ energy managers full-time.
There are other careers in energy management that are important. Technical writers, accountants, and marketing and advertising people can apply their skills in energy management by working for a company that manages properties or seek employment in a large corporation that has its own energy management staff.
LESSON 4

©2019 The NEED Project www.NEED.org Ohio Energy Project www.ohioenergy.org 5958 ©2019 The NEED Project www.NEED.org Ohio Energy Project www.ohioenergy.org
LESSON 4A: Energy Audit Everything you have learned has been leading up to Lesson 4 and describing energy audits. It’s time to put it all together, and audit the energy use in your building. An energy audit done by a professional energy manager is a formal, detailed walk-through of the entire building, room-by-room, measuring everything from temperature to relative humidity to airflow, and making detailed notes about what is running, plugged in, or drawing a phantom load, which is the electricity used by devices that are turned off but still plugged into an outlet. A professional energy audit also includes a review of the school’s utility bills and includes a list of recommendations to reduce energy consumption.
Auditing ToolsThe most important auditing tools are always with you – your ears and eyes. They will tell you more about how a building is using energy than any other tool. With them you can see and hear things that are running and can ask yourself why. You can see gaps around doors and windows, or hear the whistle of air being forced through a crack on a windy day. You can see lights left on in an empty room. You can see condensation building up, or in bad situations, mold or mildew that you can also smell. Do not discount the importance of good observation skills when you audit your work area.
The other tools you will use are a thermometer, hygrometer, light meter, and Kill A Watt® meter. These will give you objective measurements to use in evaluating the energy use in a room or building. You have already worked with the light meter, thermometer, and Kill A Watt® meter in previous lessons.
Work AreasYou will work in groups and evaluate a work area assigned to you. This may be a single room, or it may be several rooms or spaces such as hallways and stairways. When you enter a work area, first ask the teacher for permission to proceed. Remember to show courtesy and respect by working quickly and quietly and returning things where you found them.
Take Good NotesThe second part of the auditing form has an area for notes. This is where you will record unusual observations, such as a gap around a window, an unusually noisy HVAC unit, etc. If there are things plugged in and running, but you are unable to use the Kill A Watt® meter to measure them, make a note of it.
If you see something potentially dangerous, don’t wait to tell someone. Inform that teacher, your teacher, the principal, or a maintenance staff member about the problem right away.
Summarizing the Audit and Making RecommendationsIf you spend all this time collecting data but then do nothing with it, you have just wasted a lot of time. The point of collecting data on an audit is to evaluate it and look for ways your school as a community can improve. As a class, look over all the data collected for each room and see if some trends emerge. Are a cluster of classrooms too hot or too cold? Is an older section of a building more air-tight than a newer section? These are the kinds of things you are looking for. You may also see something that stands out in stark contrast to the rest of the building. If most rooms are a comfortable 72 degrees, but one room is a chilly 66 degrees, something is not right with the HVAC system in that one room.
After you have found trends across the entire building, or anomalies within your data, the next step is to write recommendations. These will probably start as bullet point-type statements, but they should be formulated into complete sentences or paragraphs. State what you found, what it should be, and make a recommendation to amend it. Professional energy audits include recommendations for upgrades and improvements, their cost, and the amount of money saved through reduced energy use. You will not go this far, but do not hesitate to suggest efficiency upgrades where they would obviously make a significant impact on the energy used in school. For example, replacing metal halide lights with LED in the gym has a moderate up-front cost that will yield significant energy savings right away. Whatever recommendations you make, do so with respect, citing the data you collected on your audit. Do not be upset if the authorities in your school district do not take all of your recommendations immediately. If you get them thinking about what they can do to improve, your audit has been successful.

60 ©2019 The NEED Project www.NEED.org Ohio Energy Project www.ohioenergy.org
MASTER
Scientists measure the amount of water vapor in the air in terms of relative humidity—the amount of water vapor in the air relative to (compared to) the maximum amount it can hold at that temperature. Relative humidity changes as air temperature changes. The warmer the air is, the more water vapor it can hold.Air acts like a sponge and absorbs water through the process of evaporation. Warm air is less dense and the molecules are further apart, allowing more moisture between them. Cooler air causes the air molecules to draw closer together, limiting the amount of water the air can hold. It is important to control humidity in occupied spaces. Humidity levels that are too high can contribute to the growth and spread of unhealthy biological pollutants. This can lead to a variety of health effects, from common allergic reactions to asthma attacks and other health problems. Humidity levels that are too low can contribute to irritated mucous membranes, dry eyes, and sinus discomfort. This digital humidity/temperature pen measures relative humidity and temperature and displays the readings on its face. It has a battery for power. It can display the temperature in Fahrenheit or Celsius. The reading shown on the right is 68.5°F. Devices that measure humidity are also called hygrometers.The hygrometer displays relative humidity in terms of percentage. The hygrometer shown reads 35%. This means that the air contains 35 percent of the water vapor it can hold at the given air temperature. When the air contains a lot of water vapor, the weather is described as humid. If the air cannot carry any more water vapor, the humidity is 100 percent. At this point, the water vapor condenses into liquid water.Maintaining relative humidity between 40 and 60 percent helps control mold. Maintaining relative humidity levels within recommended ranges is a way of ensuring that a building’s occupants are both comfortable and healthy. High humidity is uncomfortable for many people. It is difficult for the body to cool down in high humidity because sweat cannot evaporate into the air.
DirectionsON/OFF KEYPress the ON/OFF key to turn the power on or off.
°F/°CPress the °F/°C key to select the temperature unit you want to use, Fahrenheit or Celsius.
MAX/MINPress the MAX/MIN key once to display the stored maximum readings for temperature and humidity. An up arrow will appear on the left side of the display to indicate the unit is in the maximum recording mode.Press the MAX/MIN key a second time to display the stored minimum readings for temperature and humidity. A down arrow will appear on the left side of the display to indicate the unit is in the minimum recording mode.Press the MAX/MIN key a third time to return to normal operation.
CLEARIf an up or down arrow is displayed, press the CLEAR key until - - - appears on the display. The memory is cleared. New maximum or minimum values will be recorded within 3 seconds.
HygrometerHUMIDITY/TEMPERATURE PEN
LESSON 4A
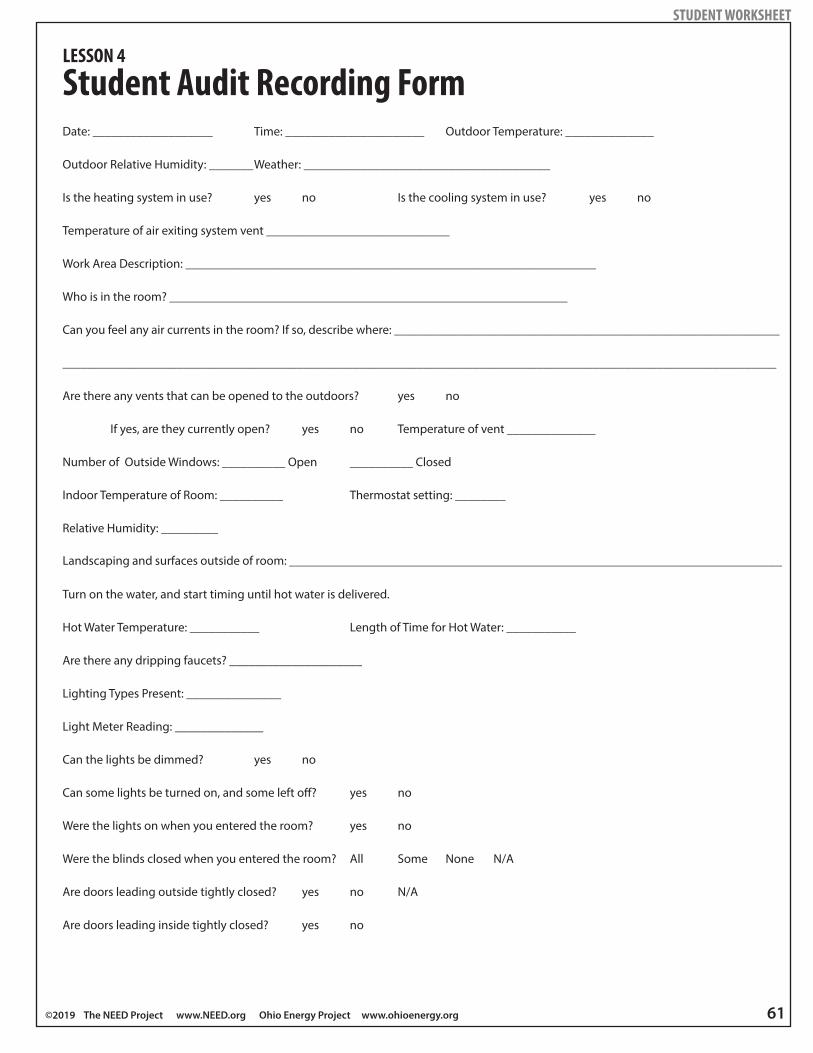
©2019 The NEED Project www.NEED.org Ohio Energy Project www.ohioenergy.org 6160 ©2019 The NEED Project www.NEED.org Ohio Energy Project www.ohioenergy.org
STUDENT WORKSHEET
Student Audit Recording FormDate: ___________________ Time: ______________________ Outdoor Temperature: ______________
Outdoor Relative Humidity: _______ Weather: _______________________________________
Is the heating system in use? yes no Is the cooling system in use? yes no
Temperature of air exiting system vent _____________________________
Work Area Description: _________________________________________________________________
Who is in the room? _______________________________________________________________
Can you feel any air currents in the room? If so, describe where: _____________________________________________________________
_________________________________________________________________________________________________________________
Are there any vents that can be opened to the outdoors? yes no
If yes, are they currently open? yes no Temperature of vent ______________
Number of Outside Windows: __________ Open __________ Closed
Indoor Temperature of Room: __________ Thermostat setting: ________
Relative Humidity: _________
Landscaping and surfaces outside of room: ______________________________________________________________________________
Turn on the water, and start timing until hot water is delivered.
Hot Water Temperature: ___________ Length of Time for Hot Water: ___________
Are there any dripping faucets? _____________________
Lighting Types Present: _______________
Light Meter Reading: ______________
Can the lights be dimmed? yes no
Can some lights be turned on, and some left off? yes no
Were the lights on when you entered the room? yes no
Were the blinds closed when you entered the room? All Some None N/A
Are doors leading outside tightly closed? yes no N/A
Are doors leading inside tightly closed? yes no
LESSON 4

62 ©2019 The NEED Project www.NEED.org Ohio Energy Project www.ohioenergy.org
STUDENT WORKSHEET
Fill in the table below for every electrical device (plug-in) in the room:
Device Plugged In Running Stand-by In Use Watts Used if Running
Watts of Phantom Load
Other notes and comments:

©2019 The NEED Project www.NEED.org Ohio Energy Project www.ohioenergy.org 6362 ©2019 The NEED Project www.NEED.org Ohio Energy Project www.ohioenergy.org
MASTER
Recommended Light LevelsBelow is a list of recommended illumination levels for school locations in foot-candles. These illumination levels align with the recommendations from the Illumination Engineering Society of North America.
AREA FOOT-CANDLES
Classrooms (Reading and Writing) 50
Classrooms (Drafting) 75
Computer Labs (Keyboarding) 30
Computer Labs (Reading Print Materials) 50
Computer Labs (Monitors) 3
Labs-General 50
Labs-Demonstrations 100
Auditorium (Seated Activities) 10
Auditorium (Reading Activities) 50
Kitchens 50
Dining Areas 30
Hallways 20-30
Stairwells 15
Gymnasiums (Exercising and Recreation) 30
Gymnasiums (Basketball Games) 75
Locker Rooms 10
Libraries and Media Centers (Study Areas) 50
Libraries and Media Centers (Other Areas) 30
Shops (Rough Work) 30
Shops (Medium Work) 50
Shops (Fine Work) 75
Offices (Reading Tasks) 50
Offices (Non-Reading Tasks) 30
Teacher Workrooms 30
Conference Rooms 30
Washrooms (Grooming Areas) 30
Washrooms (Lavatories) 15
Maintenance Rooms 30
Building Exteriors and Parking Lots 1-5
LESSON 4A

64 ©2019 The NEED Project www.NEED.org Ohio Energy Project www.ohioenergy.org
STUDENT WORKSHEET
School Building SurveyGeneral Information1. When was the school built?
2. What changes have been made since the school was built? When were they made?
3. What things use energy on the school grounds? Lighted fields? Outdoor lighting?
4. What fuels are used in the school? For heating, cooling, water heating, lighting, other?
5. How much does the school pay each year for energy (natural gas and electricity)?
6. Are there other energy costs that the school pays for, like buses?
7. Do other groups that use the school pay for the energy they use?
8. Who is in charge of controlling energy use in the school?
9. Who is in charge of maintaining energy-use equipment? Is there a maintenance schedule for all energy-using systems?
Building Envelope1. What is the building made of? Is it in good condition?
2. In which direction does the front door face?
3. How many windows are on each side of the building? Are any windows cracked or broken?
4. Are the windows single or double-paned? Can they be opened? Do the windows have adjustable blinds?
5. How many outside doors are there? Are they insulated? Are there windows in the doors? Are any cracked or broken?
6. Does the building have insulation in the walls and ceiling?
7. Are inside stairwells open or enclosed?
8. Do windows and doors seal tightly, or do they leak air?
9. Are trees placed around the building to provide shade in warm months?
10. Are there awnings or overhangs over the windows to shade windows from the overhead direct sun in warm weather, yet allow theslanted rays in winter to enter?
Recycling1. Is the paper recycled by your school?
2. Are cans and bottles recycled by your school?
3. Is food waste composted by your school?
LESSON 4A

©2019 The NEED Project www.NEED.org Ohio Energy Project www.ohioenergy.org 6564 ©2019 The NEED Project www.NEED.org Ohio Energy Project www.ohioenergy.org
STUDENT WORKSHEET
Heating/Cooling Systems1. What kind of heating system is used in the school? What fuel does it use?
2. How old is the heating system?
3. Does the heating system have a programmable thermostat to control temperature? What are the settings?
4. What kind of cooling system is used in the school? What fuel does it use?
5. How old is the cooling system?
6. Does the cooling system have a programmable thermostat to control temperature? What are the settings?
7. Is there an air exchange system to provide fresh air when the heating and cooling systems are not operating?
8. Are the boilers, pipes, and ducts sealed and insulated?
9. Are the heating and cooling systems maintained on a regular basis?
10. Does your school make use of passive solar heating?
Lighting1. What kind of lighting is used in the school? Outside the school? Exit lights?
2. Can the lights be controlled with dimmer switches? In which areas or rooms?
3. Does the school make use of skylights and natural lighting?
4. Are there timers for the outside lights so they go off automatically?
5. Are there automatic timers for any of the indoor lights?
Water Heating1. What fuel is used to heat water in the school?
2. Is there more than one water heater? How many?
3. How old are they?
4. Do the water heaters have timers?
5. At what temperatures are the water heaters set?
6. Are the water heaters and water pipes insulated?
7. Are there leaks in the hot water system?
8. Are flow restrictions used?

66 ©2019 The NEED Project www.NEED.org Ohio Energy Project www.ohioenergy.org
STUDENT WORKSHEET
Findings and RecommendationsEngineers study building systems, then report the results of their investigations and recommend ways to use less energy. Use this form to organize the data you gathered on the Student Audit Recording Form to prepare a presentation on your findings and recommendations. In your presentation, include an introduction and conclusion that explain your findings and recommendations.
Building EnvelopeWhat We Learned:
Our Recommendations To Save Energy:
Room Temperature and Thermostat SettingsWhat We Learned:
Our Recommendations To Save Energy:
Windows and DoorsWhat We Learned:
Our Recommendations To Save Energy:
LightingWhat We Learned:
Our Recommendations To Save Energy:
LESSON 4A

©2019 The NEED Project www.NEED.org Ohio Energy Project www.ohioenergy.org 6766 ©2019 The NEED Project www.NEED.org Ohio Energy Project www.ohioenergy.org
Electrical AppliancesWhat We Learned:
Our Recommendations To Save Energy:
Water HeatingWhat We Learned:
Our Recommendations To Save Energy:
Windows and DoorsWhat We Learned:
Our Recommendations To Save Energy:
RecyclingWhat We Learned:
Our Recommendations To Save Energy:
STUDENT WORKSHEET

68 ©2019 The NEED Project www.NEED.org Ohio Energy Project www.ohioenergy.org
STUDENT WORKSHEET
Culminating ProjectNow that we have audited our school using the efficiency information provided, let’s demonstrate our knowledge of efficiency outside of the school day. The Culminating Project is a hands-on way for you to get creative and put your knowledge of energy efficiency and conservation to the test in your community. You are welcome to design your own project to answer the question below or use a recommended project design.
? QuestionHow can my community become more energy efficient?
Recommended Projects � Energy Efficient Design
� Public Service Announcement
� Energy Campaign
PreparationWith your groupmates, brainstorm a few possible projects that will answer the question above. As a group, choose which project sounds the most interesting and exciting to pursue. Be sure to confirm your project with your teacher before you begin.
Procedure1. After deciding on your project type, work with your group to develop the message of your project. For instance, if pursuing an
energy campaign, decide on what you are campaigning for and how you will argue that this campaign will make the community more efficient. Having a goal in place at the beginning will help direct your project.
2. Work with your group to decide on your target audience, or who your project will be presented to. Examples include:
�Fellow students/peers
�School administration
�School Board
�Community members
�City Council
3. Work with your group to develop an action plan for your project and divide roles evenly amongst groupmates. Be sure that everyone in your group has a role.
4. Submit your action plan to your teacher for approval. No projects should be carried out without prior approval from your teacher.
5. Work with your group to carry out your project. Note: Be sure that any materials you need for your project are available to youbefore beginning. For instance, if you need video equipment, make sure you have access to video equipment before your projectbegins.
6. Check in with your teacher periodically to report your project’s progress. Ask for recommendations and feedback.
7. Present your project to your target audience.
LESSON 4B

©2019 The NEED Project www.NEED.org Ohio Energy Project www.ohioenergy.org 6968 ©2019 The NEED Project www.NEED.org Ohio Energy Project www.ohioenergy.org
Sample Project 1: Energy Efficient DesignOverview: Research, design, and build an energy efficient prototype, such as a room, vehicle, or other occupied space. You could also
design a landscape for your school’s exterior.
Goals:
� Increase awareness of energy use and efficiency in the spaces we occupy;
� Demonstrate how different materials and techniques can have efficient outcomes.
Sample Project 2: Public Service Announcement (PSA)Overview: Create a public service announcement (not to exceed 1 minute) communicating the importance of a specific topic pertaining to energy efficiency, i.e. water, lighting, weatherization, etc.
Goal:
� Raise awareness about the causes and consequences of energy waste and motivate others to take action in their communities.
Sample Project 3: Energy CampaignOverview: Enlist the help of other teachers and student groups to conduct an energy savings campaign in the school and/or community.
Students can make posters and flyers and record PSAs to encourage energy conservation and efficiency.
Goals:
� Educate the school community about energy saving practices and their importance;
� Persuade the school community to adopt energy saving behaviors to reduce energy consumption.
STUDENT WORKSHEET

70 ©2019 The NEED Project www.NEED.org Ohio Energy Project www.ohioenergy.org
Energy in Action:1. What top three changes would you make to keep your classroom comfortable yet efficient?
2. What would happen if your above changes were adopted by the whole student body?
Web Quest:1. Visit your utility partner’s website (refer to Lesson One) and search for information regarding the following:
a. Energy Audit
i. What are some of the auditing tools your utility provider offers? Why might these tools be useful?
Career Connections:Certified Energy Manager – Implement conservation measures, monitor energy consumption, and assess decisions on sustainability.
Seek out opportunities to increase energy efficiency.
Environmental Engineer - Develop solutions to environmental problems through engineering, environmental science, biology, and
chemistry.
Home & Community
STUDENT WORKSHEET
LESSON 4

©2019 The NEED Project www.NEED.org Ohio Energy Project www.ohioenergy.org 7170 ©2019 The NEED Project www.NEED.org Ohio Energy Project www.ohioenergy.org
Lesson 5: What We Have Learnedt Overview Students review what they have learned throughout the curriculum.
ObjectivesStudents will be able to:� understand the importance of energy efficiency and conservation and how it applies to their communities;� report the energy efficiency measures installed on the Family Installation Survey.
Procedure1. Discuss with students what they have learned from the energy unit and how it can be applied to the community in which they
live.
2. Discuss the installation of the provided energy efficiency measures. Have students complete the Family Installation Survey online at www.ohioenergy.org.
3. Have students complete the post-poll and record the average score on your teacher evaluation.
Procedure Post Energy Unit
1. Have students complete the Family Installation Survey online at www.ohioenergy.org or on paper and return to the following
address:
Ohio Energy Project
200 E. Wilson Bridge Rd.
Worthington, OH 43085
2. If possible, have students write thank you notes/letters to the sponsor(s) of the program. Their addresses are listed on the back of the Student and Family Guide. They appreciate hearing from students.
3. Complete the teacher evaluation at www.ohioenergy.org.
4. Register for next year’s program at www.ohioenergy.org.
Post-Poll Answer Key
1. a 2. c 3. c 4. a 5. b 6. a 7. d 8. a 9. c 10. d

72 ©2019 The NEED Project www.NEED.org Ohio Energy Project www.ohioenergy.org
Energy Efficiency Post-Poll1. ______________ is an example of a form of energy.
a. Thermal b. Biomass c. LED d. Lumens
2. What unit measures power?
a. Inch b. Foot-candle c. Watt d. Work
3. Which energy sector includes schools?
a. Transportation b. Industrial c. Commercial d. Residential
4. Energy ________ refers to a behavior that reduces energy usage.
a. Conservation b. Efficiency c. Transformation d. Awareness
5. ________ refers to the capacity of an insulating material to resist heat flow.
a. Building Envelope b. R-Value c. Weatherization d. System
6. Of the following, which is the largest consumer of water?
a. Thermoelectric Power Plant b. Residential Homes c. Restaurants d. Schools
7. The _________ is a nationwide network of transmission lines.
a. Transformer b. Substation c. Distribution Line d. Grid
8. What label ensures consumers that a product saves energy?
a. Energy Star b. EnergyGuide c. Energy Smart d. Energy Aware
9. On average, schools use 17% of their electricity consumption to do what?
a. Cook Food b. Operate Computers c. Light Buildings d. Heat Rooms
10. Which of the following is a career involved with the energy industry?
a. Recycling Coordinator b. LEED Construction c. Mechanical Engineer d. All

©2019 The NEED Project www.NEED.org Ohio Energy Project www.ohioenergy.org 7372 ©2019 The NEED Project www.NEED.org Ohio Energy Project www.ohioenergy.org
What We Have LearnedLESSON 5
Energy is foundational to the things we do every single day. From powering our schools to fueling our bodies, energy is a vital part of life. Knowing that energy is essential, it is important that we use energy in efficient ways. The efficient use of energy helps to eliminate waste, streamline activities, and, overall, reduce our environmental footprint.
Using this curriculum as your guide, we challenge you to stay energy aware in your everyday life. From installing efficiency measures to adopting conservation behaviors, you can take charge of your energy usage in ways big and small. No matter the effort, every little bit counts!
Installation Survery
This program is funded through your local electric and/or natural gas provider. We ask all families to complete this survey to measure the energy savings from the program. Thank you for making a difference and saving money with your energy efficiency actions.
Please visit www.ohioenergy.org to complete the survey.

74 ©2019 The NEED Project www.NEED.org Ohio Energy Project www.ohioenergy.org
Internet Resources
Energy Savings at HomeOhio Energy Project Programs and resources for teachers in grades 3-12. www.ohioenergy.org.
U.S. Energy Information AdministrationLearn about the various ways the U.S. uses energy every day.
https://www.eia.gov/
Energy Kid’s PageEnergy Ant hosts this site containing energy facts, fun and games, classroom activities, and more.
www.eia.gov/kids
Argonne National Library STEM resources for both student and teacher.
https://www.anl.gov/education/stem-outreach
Phet
Interactive simulations show how energy works.
http://phet.colorado.edu
Find Your Efficiency Zone Based on the zip code entered, it will provide a comparison of the energy costs of an average home and an energy-efficient home in your area.
http://homeenergysaver.lbl.gov/consumer
The National Energy Education Development Project Energy information and activities for students and teachers.
www.need.org
Ohio Consumers CouncilLearn ways to save 5-10% of your electric bill by turning off appliances instead of using standby mode.
http://www.occ.ohio.gov/publications/electric/Vampire_Power.pdf
National Geographic
The decision is yours! Choose the energy resources—and how much of each—you will use to provide electricity to your community.
http://media.education.nationalgeographic.com/assets/richmedia/0/213/project/index.html?page=intro

74 ©2019 The NEED Project www.NEED.org Ohio Energy Project www.ohioenergy.org
[BLANK PAGE]

The Ohio Energy Project thanks The NEED Project for permission to adapt NEED’s Saving Energy curriculum for use with OEP’s energy efficiency education programs.