energy efficiency policy case studies_dnvgl summary_schramek
TRANSCRIPT

Non-technical summary of the DNV-GL report “Energy Efficiency Policy Case Studies”
Page 1 of 59 Author: Camilla Schramek January 2015
This document is one of four non-technical summaries prepared in the context of an analysis of the multiples benefits of measures to improve energy efficiency. The document has been written by Camilla Schramek, on the basis of a technical report entitled “Energy Efficiency Policy Case Studies”, prepared by DNV-GL, a consulting company. All reports are available for download from http://www.unepdtu.org/

Non-technical summary of the DNV-GL report “Energy Efficiency Policy Case Studies”
Page 2 of 59 Author: Camilla Schramek January 2015
Energy Efficiency in Buildings

Non-technical summary of the DNV-GL report “Energy Efficiency Policy Case Studies”
Page 3 of 59 Author: Camilla Schramek January 2015
Description:
EECR is one of the 20 key elements of the “German integrated energy and climate programme.” The program aims to reduce CO2 emissions produced by the German residential sector by providing soft loans and investment grants to fund energy efficient construction and refurbishment activities in residential buildings. The maximum loan is €50,000 per residential unit. These loans finance renewable heating technology and thermal insulation for buildings and homes. Promotional loans are offered to applicants who do not want a deep retrofit of their home or building; promotional loans are for single measures such as windows, heating systems, or insulation. Applicants who do not want a loan can apply for a grant for investment between 10% and 25% of the maximum loan of €75,000. Both the grant for investment and promotional loan are based on the customer's target energy efficiency level. Germany's Energy Savings Ordinance (EnEv), which defines energy efficiency requirements for buildings, is used to help determine the programme's energy efficiency criteria; the energy consumption levels for the programme are set significantly lower than levels required by EnEv.
The Kreditanstalt für Wiederaufbau (KfW) bank funds and administers the program. The program is available to all private investors within the residential building sector in Germany and housing companies with equal financing conditions.
Customers apply for grants directly with KfW. An energy consultant is present when customers apply to ensure that the project is able to meet its target efficiency level. Once the promotional loan has been provided, the refurbishment project is performed with KfW consultants monitoring the project to ensure the efficiency level is reached and that the loan complies with promotional loan conditions. When the project is complete, partial debt relief is provided based on the energy efficiency level that is reached; the more efficient the household, the greater the potential debt relief. Actors: x Kreditanstalt für Wideraubau (KfW): Manages the program; ensures loan commitment and
disbursement. x Federal Ministry of Building, Transport, and Urban Development (BMVBS): Subsidizes the
interest rate of the promotional loan. x Energy consultant: Ensures that the construction or refurbishment project is designed to achieve its
expected efficiency level.
Barriers: x It is unclear whether the programme will be able to achieve Germany's goal of emission reductions of 80%-
95% by 2050. x Regional governments in Germany are not required to implement the federal EECR programme and the
regional governments set their own energy policies that vary based on the priority of energy efficiency in the specific region.
Enablers for Implementation: x Mandatory involvement of an energy expert throughout the project lifespan decreases financial risk and
ensures consistent performance levels. x Incentives for commercial banks, saving banks, and insurance companies include: reasonable margin of
risk-premium and administration fees; no refinancing cost; banks can offer their own financial options to pay for the portion of the project not covered by the maximum promotional loan; no up-front cost; free training for bank employees; offering the promotional loans gives banks a competitive advantage.
Funding: KfW refinances the promotional loans via the capital market. The Federal Ministry of Building, Transport, and Urban Development subsidises the interest rate of the promotional loan. Costs:
Germany's Energy Efficient Construction and Refurbishment (EECR) Country: Germany Sector: Household/Buildings
Stage: In progress/On going
Type of policy/ instrument: Grants/Subsidies
Period: 2009 to undetermined

Non-technical summary of the DNV-GL report “Energy Efficiency Policy Case Studies”
Page 4 of 59 Author: Camilla Schramek January 2015
The German government provides approximately 1.5 billion EURO per year to finance the partial debt relief and interest subsidies paid over a 10 year period. Energy savings and associated emission reductions: Total energy saving from 2008 to 2010 was 1.7 PJ and from 2008 to 2016 is projected to be 6.9 PJ. Benefits: 1. Reductions in energy demand: Energy savings of 2,200 gigawatts. 2. Mitigation of greenhouse gases: CO2 savings of 999,000 tonnes per year in 2010, 542,100 tonnes per
year in 2011, and 770,000 tonnes per year in 2012. 3. Improvement in air quality: N.A. 4. Macro-economic impacts: Information not available. 5. Impacts on public budgets: Tax income and social security contributions have increased the public
budget. 6. Creation of jobs: Jobs created or preserved in 2010 were 286,000, in 2011 were 251,200, and in 2012
were 370,000. 7. Improvements in human health and wellbeing: Information not available. 8. Increased access to energy and reduced fuel poverty: Programme decreases economic dependency
on fossil fuels and has lowered the energy bills of 1.8 million households. 9. Benefits to energy providers: Information not available. 10. Other: The programme pushes investors to go beyond legally defined energy efficiency standards. By
providing market incentives, the programme advances research and development of new energy efficient technologies.

Non-technical summary of the DNV-GL report “Energy Efficiency Policy Case Studies”
Page 5 of 59 Author: Camilla Schramek January 2015
Arizona Public Services Solutions for Business Program Country: USA, Arizona Sector: Commercial and Industrial Buildings (that is, non-residential buildings)
Stage: Ongoing
Type of policy/instrument: Cash incentives, training, and energy information services
Sub-sector: Large and small existing buildings, including schools (retrofit), and large new construction
Period: 2006 - present
Description: The Arizona Public Services (APS) Solutions for Business programme, which is the largest non-residential energy efficiency programme in Arizona, implemented a state mandate to reduce energy use in commercial and industrial buildings by 22%, by 2020. The programme offers cash incentives, technical trainings, and marketing services to help non-residential customers increase energy savings and reduce their demand for energy.
The Arizona Utility Regulatory Agency (Arizona Corporation Commission) oversees the program and reviews, approves, and amends the program annually. Cash incentives, trainings, and marketing services are offered to non-residential customers such as colleges, data centres, grocery stores, offices, and restaurants to increase energy savings and reduce demand. Additionally, Arizona Public Services and the National Bank of America have partnered to provide financing for energy efficiency projects.
Custom incentives are paid per kilowatt hour saved; there is an annual incentive cap and before each incentive is paid the customer must be evaluated to ensure social benefits exceed societal costs. The program also provides cash incentives for technical studies and design assistance, which pay incentives based on a percentage of the total energy efficiency investment up to a set amount approved by the regulatory agency. Actors: x State Authorities (Arizona Public Service): Sponsor and administrator of the programme. x DNV GL (formerly Kema Services): Implement the programme on behalf of APS; provide technical,
marketing, outreach, and application processing services. x National Bank of Arizona: Provide financing services to programme participants. x Trade Ally Contractors: Directly market the incentives to prospective programme beneficiaries. Barriers: x The programme does not cover all direct project costs, which has deterred potential beneficiaries that
would have required additional financial assistance.
x Lack of cross-institutional awareness and informational campaigning on energy efficiency measures, their incentives, and their long-term benefits, which could have incentivized more participants to join the programme.
Enablers for Implementation: x State law requires utilities to reduce their energy use, thus they are incentivized to come up with projects
to reach this objective. x Programme sponsored training and outreach campaigns helps to successfully disseminate and implement
the programme. x APS and the National Bank of Arizona partnered to overcome financial barriers by offering lower interest
rates to customers that qualify for incentives. x Adjusting incentive levels accordingly, promoting new technologies, and targeted outreach to reach
specific segments have increased participation in the programme. Funding: Programme beneficiaries pay Arizona Public Service for its services through monthly bills of 0.001845 USD/kWh. Costs: The total cost for implementing the program as of 2012 is $29.4 million. In 2012 the programme paid 50% of the incremental cost, up to $10,000, to customers. Energy savings and associated emission reductions:

Non-technical summary of the DNV-GL report “Energy Efficiency Policy Case Studies”
Page 6 of 59 Author: Camilla Schramek January 2015
In 2012, annual energy savings were approximately 274 GWh. Projects implemented in 2011 were among the most cost-effective: x Lifetime benefits of installed energy efficiency measures: $148 million x Estimated societal effectiveness (benefit to cost): 3.0 x Program cost per lifetime kWh saved: $.00228 per kWh Benefits: 1. Reductions in energy demand: Approximately 274 GWh of annual energy savings in 2012. 2. Mitigation of greenhouse gases: The programme eliminated 7.56 million tonnes of CO2 emissions
from 2006 to 2013. 3. Improvement in air quality: Information not available. 4. Macro-economic impacts: Approximately $73.5 million in incentives have been paid to over 4,000
customers for implementing energy efficiency projects that have lifetime savings of more than $926 million.
5. Impacts on public budgets: Information not available. 6. Creation of jobs: Hiring of local contractors for implementation; most contractors come from the Trade
Ally programme which consists of over 250 members. 7. Improvements in human health and wellbeing: Information not available. 8. Increased access to energy and reduced fuel poverty: N.A. 9. Benefits to energy providers: The programme aids APS in reaching the 22% energy reduction
mandate and decreases the demand for energy from energy providers.

Non-technical summary of the DNV-GL report “Energy Efficiency Policy Case Studies”
Page 7 of 59 Author: Camilla Schramek January 2015
LAGÅN Programme - for the construction and renovation of low-energy use buildings Country: Sweden Sector: Building Sector
Stage: Ongoing
Type of policy/instrument: Grants/Subsidies
Sub-sector: Manufacturing Industry
Period: 2010-2015
Description: The LAGÅAN programme (buildings with very low energy use, in Swedish) aims to increase energy efficiency in buildings and offers financial assistance in exchange for documentation and dissemination of energy-use data and best practices. The programme communicates its work to target groups such as potential clients and builders, subsidizes energy efficiency improvements, disseminates information about the improvements and the results of evaluations, and promotes regional collaboration on projects. Any building category can participate in the programme. A new building must have energy demand of 25% below current building regulation requirements to be considered 'low energy'. The Swedish Energy Agency partnered with the Swedish Construction Federation to create this programme. The Swedish Energy Agency establishes initiatives and funds over 25% of total project costs. For a building project to participate in the programme it is required to: include innovative elements, have a clear energy profile for energy use, make a significant contribution to information dissemination, provide scalable and replicable technical solutions, provide an evaluation of energy use, accept that results are made public online, and meet new construction and renovation standards. The program supports three different project categories: demonstration projects, collaborative projects, and implementation projects. Actors: x Swedish Construction Federation (BI): Leader of the board; administrative responsibilities and
program coordination; responsible for national oversight. x Swedish Energy Agency: Member of the Board; fund 40% of the project. x Region Västra Götaland: Member of the Board x Formas: Member of the Board x The National Board of Housing, Building, and Planning: Member of the Board x The Danish Building Research Institute: Member of the Board x Bostad AB Poseidon: Member of the Board
Barriers: x Have not completed an analysis of project results, which prevents knowledge sharing. x Programme has failed to reach all actors in the building sector, specifically contractors, property owners,
and actors outside of Sweden's west coast.
Enablers for Implementation: Still need to add enablers to the case file. I will include this when the information has been added. Funding: The programme has a budget of 60 million SEK; 22 million SEK from the Swedish Energy Agency, 1 million SEK from the Västra Götaland regional government, 2.9 million SEK from Formas, and additional funds provided by other industry actors. Costs: Still need this information. I will include this when the information is provided. Energy savings and associated emission reductions: In 2014, Sweden had over 10,000 low-energy apartments and 1 million square meters of low-energy buildings. Benefits: 1. Reductions in energy demand: No information provided. 2. Mitigation of greenhouse gases: No information provided. 3. Improvement in air quality: No information provided. 4. Macro-economic impacts: No direct information available for this category. 5. Impacts on public budget: No direct information available for this category.
Non-technical summary of the DNV-GL report “Energy Efficiency Policy Case Studies”
Page 8 of 59 Author: Camilla Schramek January 2015
6. Creation of jobs: No direct information available for this category. 7. Improvements in human health and wellbeing: No direct information available for this category. 8. Increased access to energy and reduced fuel poverty: No direct information available for this
category. 9. Benefits to energy providers: The programme secures energy demand and contributes to a broad
national supply of retailers of energy products and services. 10. Knowledge/Capacity Building: Spreads knowledge and raises awareness of energy and climate issues
by disseminating information from demonstration projects. 11. Infrastructure benefits: Programme is stimulating energy efficient construction and retrofitting. 12. Innovative value: Projects have value in a number of areas and create replicable technical solutions and
concepts.
Non-technical summary of the DNV-GL report “Energy Efficiency Policy Case Studies”
Page 9 of 59 Author: Camilla Schramek January 2015
Car Scrapping Schemes
Non-technical summary of the DNV-GL report “Energy Efficiency Policy Case Studies”
Page 10 of 59 Author: Camilla Schramek January 2015
China Car Scrapping Scheme Country: China Sector: Transport
Stage: Finalized
Type of policy/instrument: Financial incentives
Period: 2009-2010
Description:
To help remedy the financial crisis, China developed a car scrapping scheme that offered a rebate for scrapping vehicles six years or older or any car that did not meet emission standards and replacing it with a more efficient one. To further incentivize a transition to clean vehicles, the government offered a 5% sales tax reduction for cars with engines smaller than 1.6 litres. The government also provided direct subsidies for alternative energy cars to increase their mass production. The Chinese government funded and oversaw the implementation of this program. Initially, the rebate offered was between $450 and $900, in 2010 the rebate was increased to between $800 and $2900. There was a wide range of vehicles eligible for scrap such as old minivans and mid-sized passenger cars that did not meet government emission standards. The programme provided different amounts of subsidies based on the type of alternative energy car that was purchased. Actors: x Ministry of Commerce: Organized and guided the implementation of the programme. x Ministry of Public Security: Responsible for registration of automobiles. x Ministry of Finance: Responsible for funding the programme. x Ministry of Environmental Protection: Responsible for automobile identification and inspection. x Recycling Facilities: Bought and scrapped the old vehicles and gave customers a recycling certificate
that provided proof for imbursement of rebate.
Barriers: x Price stimuli: The initial incentive amount was too low to attract eligible beneficiaries. x Governance model: Lack of consistent emission standards and regulatory enforcement in the different
regions of China. Some cities had local scrapping programmes that differed from the national one, which created more confusion.
x Administration requirements: Long and complicated procedure to receive the incentive that required several steps and involved different organizations.
Enablers for Implementation: x Quick development and implementation of the programme. x Cooperation and successful coordination between different administrative agencies, national departments,
and central and local governments. x Consistency and transparency of enforcement procedures for vehicle emission standards were improved
over the course of the programme.
Funding: The Chinese government's national financial stimulus package funded the car scrapping scheme. Costs: The total cost for the scheme was $1.44 billion. Energy savings and associated emission reductions: The scheme decreased CO2 emissions by .16% in 2009 and .20% in 2010, but these reductions were short-term and offset by developments in China's power sector. Energy demand was reduced by .31% in 2009 and .54% in 2010, but was also short-term. Benefits: 1. Reductions in energy demand: Reduced energy consumption by .31% in 2009 and .54% in 2010, but
long-term impacts on energy demand were zero due to the rapid development of China's power sector. 2. Mitigation of greenhouse gases: CO2 decreased by .16% in 2009 and .20% in 2010. 3. Improvement in air quality: No information available. 4. Macro-economic impacts: The scheme increased GDP by .41% from 2009-2010.

Non-technical summary of the DNV-GL report “Energy Efficiency Policy Case Studies”
Page 11 of 59 Author: Camilla Schramek January 2015
5. Impacts on public budget: No information available. 6. Creation of jobs: The scheme increased job creation by .01% in 2009. 7. Improvements in human health and wellbeing: No information available. 8. Increased access to energy and reduced fuel poverty: N.A. 9. Benefits to energy providers: N.A.

Non-technical summary of the DNV-GL report “Energy Efficiency Policy Case Studies”
Page 12 of 59 Author: Camilla Schramek January 2015
Umweltprämie: German Car Scrapping Scheme Country: Germany Sector: Transport
Stage: Finalized
Type of policy/instrument: Grants/Subsidies
Period: 2009
Description: The goal of the programme was to achieve economic stability, decrease Germany's environmental impact, and improve driver safety. The scheme aimed to achieve this objective by providing incentives and tax rebates to private consumers. The German government implemented and oversaw this scheme.
The programme provided an incentive of €2,500 for scrapping a vehicle over 9 years old and purchasing a new or one-year old replacement. The programme also provided a tax rebate for vehicles that met a Euro 5 or Euro 6 standard Actors: x Federal Office of Economics and Export Control (BAFA): Responsible for the administration of
the programme. x Banking Sector: Financed to approximately 70% of the new car purchases.
Barriers: Time frames for the programme were too short. Impractical timing conditions required an extension of the programme when the original budget was depleted. Enablers for Implementation: x The amount of the incentive and the environmental component of the programme enticed eligible
participants. x Clear and simple structure of the programme eliminated confusion and encouraged participation.
Funding: Angela Merkel's €50 billion economic stimulus plan funded the programme. Costs: The original budget for the programme was €1.5 billion and was increased to €5 billion in March of 2009. Energy savings and associated emission reductions: The scheme led to a reduction of 540,819 tonnes of CO2. The scheme successfully pushed the market towards more efficient vehicles and removed lower standard vehicles from the roads. Benefits: 1. Reductions in energy demand: Improved average fuel economy by 0.6%. 2. Mitigation of greenhouse gases: Reduction of approximately 200 k tonnes of CO2 from 2010-2030
and approximately 32 k tonnes of NOx from 2010-2030. 3. Improvement in air quality: Accelerated the elimination of vehicles below the Euro 4 standard. 4. Macro-economic impacts: The scheme had a net impact of €3,530 million and increased GDP by .15%. 5. Impacts on public budget: Public finance costs of €1,070 million with net impact of €3,530 million. 6. Creation of jobs: The scheme helped preserve jobs in the automobile industry. 7. Improvements in human health and wellbeing: Injury reduction of 1.02% and approximately 20
avoided fatalities in 2010. 8. Increased access to energy and reduced fuel poverty: Not relevant. 9. Benefits to energy providers: Not relevant.

Non-technical summary of the DNV-GL report “Energy Efficiency Policy Case Studies”
Page 13 of 59 Author: Camilla Schramek January 2015
Egypt Vehicle Scrapping Incentive and Recycling Programme Country: Egypt Sector: Transport
Stage: In progress
Type of policy/instrument: Financial Incentive
Period: 2009
Description: The goal of the old vehicle scrapping and recycling programme (OVSRP) is to modernize the taxi fleet, microbuses, trailer trucks, and buses and to reduce greenhouse gas emissions through the scrapping and replacement of old vehicles. For each scrapped vehicle, a subsidy of up to $911 may be awarded to be used for the purchase of new vehicles from participating dealers. Vehicles more than 20 years old are replaced with one of 5 fuel-efficient models. The World Bank Carbon Fund financially supports the programme. The programme is a public private partnership (PPP), thus the following stakeholders share the costs, benefits, and risks: three commercial banks, five vehicle companies, an advertising firm, and an insurance agency. The Ministry of Finance and the respective vehicle dealer pre-approve all replacement vehicles. The steps to apply to the program are the following:
1. Application for bank loan 2. Designation of new vehicle 3. Old vehicle inspection and scrapping 4. Ministry of finance issuance of subsidy check 5. Participating advertising agency (optional) 6. Bank loan final approval 7. Receipt of new vehicle 8. Licensing of new vehicle and final document processing 9. Advertising application
Actors: x The Ministry of Finance (MoF): Coordinate and manage all activities; provide payments for
surrendered vehicles; ensure that vehicles are scrapped according to environmental regulations and standards; cover new vehicle sales tax for participants.
x The Ministry of Interior (MoI): Provide land and security and monitoring services for scrapping and recycling sites; manage vehicle inspection and licensing.
x The Ministry of Environmnet (MoE), EEAA and the Clean Development Mechanisms (CDM) Awareness and Promotion Unit: Develop and monitor the CDM project; supervise environmental aspect of the programme; approve environmental impact of private sector scrapping and recycling facilities.
x The World Bank Carbon Finance Fund: Financially support the subsidy; aid MoF in leveraging carbon finance to fund the recycling facilities; secure partners willing to buy carbon credits.
x Banks- National Bank of Egypt, Banque Misr, Bank of Alexandria: Provide low-interest loans to participants.
x Vehicle Manufacturing Companies and Auto Dealers [Daewoo Egypt Aboul Fotouh (Speranza), Ghabbour Auto (Hyundai), Al Mansour Auto (Chevrolet), Al Amal (Lada & BYD), Wagih Abaza (Peugeot)]: Prepare vehicles for mass transport; provide routine maintenance and up to 3 year warranty on vehicles; buy old taxi licenses; guarantee loans against default.
x Insurance Companies: Provide insurance for new vehicles at a discounted interest rate. x Advertising Firms: Advertise via taxis to decrease owners' payments.
Barriers: x Lack of clear, detailed information on the programme procedures. Target beneficiaries not familiar with
the media used to provide information. x Delay in delivering the new vehicles due to high demand. x Certified car agencies for mandatory vehicle maintenance were overbooked or expensive and maintenance
by a private mechanic is not allowed. Enablers for Implementation:
Non-technical summary of the DNV-GL report “Energy Efficiency Policy Case Studies”
Page 14 of 59 Author: Camilla Schramek January 2015
x Characteristics of Programme Design and Set up: Flexibility in the design of the programme allowed improvements to be made. The one-stop-shop application procedure was simple, effective, and transparent, which increased programme participation.
x Price Stimuli: The amount of the incentive was large enough to entice participants and the programme included additional financial benefits such as reduced cost of maintenance on new vehicles and guarantees for local bank loans.
Funding: The World Bank Carbon Finance Fund and the Ministry of Finance fund the programme. Costs: The total cost of the programme from 2010-2018 is approximately $620.24 million. Energy savings and associated emission reductions: Over the first 10 years of the programme, total fuel saving and GHG emission reductions are estimated at 0.6 million tonnes of oil equivalent and 1.7 million tonnes of CO2 equivalent. From 2010 to 2019 emission reductions from participating taxis in the Greater Cairo Region are estimated to be 1.3 to 2.3 million tonnes of CO2 equivalent. Benefits: 1. Reductions in energy demand: 29% as of 2009 (approximately 2,214 TJ). 2. Mitigation of greenhouse gases: Emission reductions from participating taxis of 1.3 to 2.3 million
tonnes CO2 equivalent from 2010-2019. 3. Improvement in air quality: Participating vehicles are expected to reduce air pollution by
approximately 1% per year. 4. Macro-economic impacts: Upgrading urban transport reduces commuting time, increases productivity
and income generated from tourism. Operation of new, efficient vehicles has led to annual fuel subsidy saving of approximately LE 399 million.
5. Impacts on public budget: Scrapping and replacement of old taxi vehicles will achieve an annual fuel subsidy saving of about LE 466 million.
6. Creation of jobs: The programme has created 10,500 direct jobs and 1,000 indirect jobs. Taxi owners' income has increased by 40% and taxi drivers' income has increased by 100%.
7. Improvements in human health and wellbeing: Programme reduces air pollution and GHG emissions, which is expected to reduce pollution-related diseases. The programme is estimated to reduce the poverty level from 21.6% in 2010 to 10% in 2020.
8. Increased access to energy and reduced fuel poverty: N.A. 9. Benefits to energy providers: N.A.

Non-technical summary of the DNV-GL report “Energy Efficiency Policy Case Studies”
Page 15 of 59 Author: Camilla Schramek January 2015
Voluntary Programs
Non-technical summary of the DNV-GL report “Energy Efficiency Policy Case Studies”
Page 16 of 59 Author: Camilla Schramek January 2015
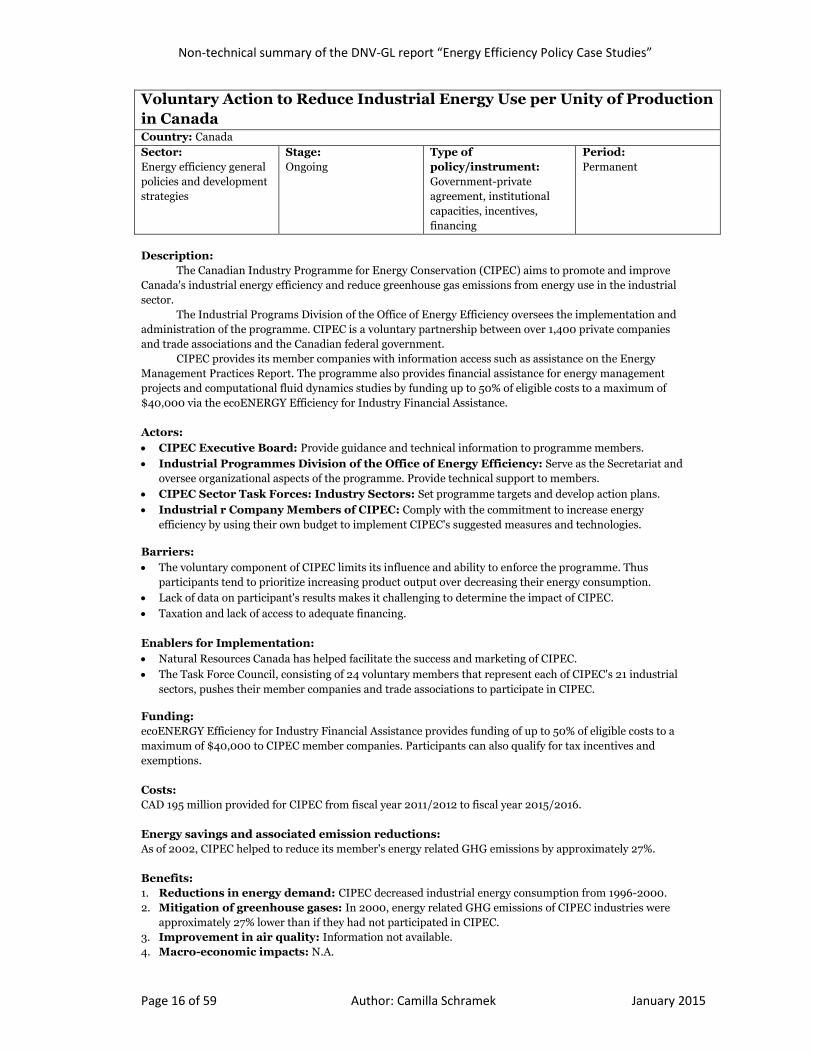
Voluntary Action to Reduce Industrial Energy Use per Unity of Production in Canada Country: Canada Sector: Energy efficiency general policies and development strategies
Stage: Ongoing
Type of policy/instrument: Government-private agreement, institutional capacities, incentives, financing
Period: Permanent
Description: The Canadian Industry Programme for Energy Conservation (CIPEC) aims to promote and improve Canada's industrial energy efficiency and reduce greenhouse gas emissions from energy use in the industrial sector. The Industrial Programs Division of the Office of Energy Efficiency oversees the implementation and administration of the programme. CIPEC is a voluntary partnership between over 1,400 private companies and trade associations and the Canadian federal government. CIPEC provides its member companies with information access such as assistance on the Energy Management Practices Report. The programme also provides financial assistance for energy management projects and computational fluid dynamics studies by funding up to 50% of eligible costs to a maximum of $40,000 via the ecoENERGY Efficiency for Industry Financial Assistance. Actors: x CIPEC Executive Board: Provide guidance and technical information to programme members. x Industrial Programmes Division of the Office of Energy Efficiency: Serve as the Secretariat and
oversee organizational aspects of the programme. Provide technical support to members. x CIPEC Sector Task Forces: Industry Sectors: Set programme targets and develop action plans. x Industrial r Company Members of CIPEC: Comply with the commitment to increase energy
efficiency by using their own budget to implement CIPEC's suggested measures and technologies.
Barriers: x The voluntary component of CIPEC limits its influence and ability to enforce the programme. Thus
participants tend to prioritize increasing product output over decreasing their energy consumption. x Lack of data on participant's results makes it challenging to determine the impact of CIPEC. x Taxation and lack of access to adequate financing. Enablers for Implementation: x Natural Resources Canada has helped facilitate the success and marketing of CIPEC. x The Task Force Council, consisting of 24 voluntary members that represent each of CIPEC's 21 industrial
sectors, pushes their member companies and trade associations to participate in CIPEC.
Funding: ecoENERGY Efficiency for Industry Financial Assistance provides funding of up to 50% of eligible costs to a maximum of $40,000 to CIPEC member companies. Participants can also qualify for tax incentives and exemptions. Costs: CAD 195 million provided for CIPEC from fiscal year 2011/2012 to fiscal year 2015/2016. Energy savings and associated emission reductions: As of 2002, CIPEC helped to reduce its member's energy related GHG emissions by approximately 27%. Benefits: 1. Reductions in energy demand: CIPEC decreased industrial energy consumption from 1996-2000. 2. Mitigation of greenhouse gases: In 2000, energy related GHG emissions of CIPEC industries were
approximately 27% lower than if they had not participated in CIPEC. 3. Improvement in air quality: Information not available. 4. Macro-economic impacts: N.A.

Non-technical summary of the DNV-GL report “Energy Efficiency Policy Case Studies”
Page 17 of 59 Author: Camilla Schramek January 2015
5. Impacts on public budget: Total budget for CIPEC is CAD 195 million over five years. 6. Creation of jobs: N.A. 7. Improvements in human health and wellbeing: N.A. 8. Increased access to energy and reduced fuel poverty: N.A. 9. Benefits to energy providers: N.A.
Non-technical summary of the DNV-GL report “Energy Efficiency Policy Case Studies”
Page 18 of 59 Author: Camilla Schramek January 2015
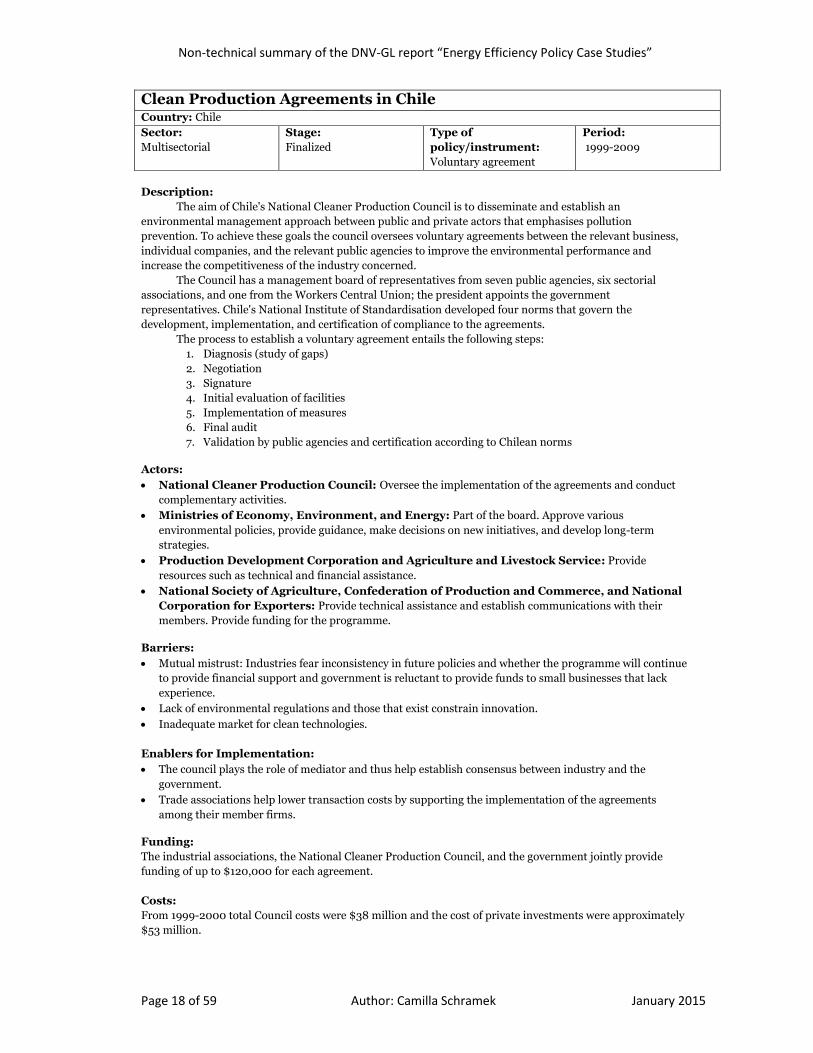
Clean Production Agreements in Chile Country: Chile Sector: Multisectorial
Stage: Finalized
Type of policy/instrument: Voluntary agreement
Period: 1999-2009
Description: The aim of Chile's National Cleaner Production Council is to disseminate and establish an environmental management approach between public and private actors that emphasises pollution prevention. To achieve these goals the council oversees voluntary agreements between the relevant business, individual companies, and the relevant public agencies to improve the environmental performance and increase the competitiveness of the industry concerned. The Council has a management board of representatives from seven public agencies, six sectorial associations, and one from the Workers Central Union; the president appoints the government representatives. Chile's National Institute of Standardisation developed four norms that govern the development, implementation, and certification of compliance to the agreements. The process to establish a voluntary agreement entails the following steps:
1. Diagnosis (study of gaps) 2. Negotiation 3. Signature 4. Initial evaluation of facilities 5. Implementation of measures 6. Final audit 7. Validation by public agencies and certification according to Chilean norms
Actors: x National Cleaner Production Council: Oversee the implementation of the agreements and conduct
complementary activities. x Ministries of Economy, Environment, and Energy: Part of the board. Approve various
environmental policies, provide guidance, make decisions on new initiatives, and develop long-term strategies.
x Production Development Corporation and Agriculture and Livestock Service: Provide resources such as technical and financial assistance.
x National Society of Agriculture, Confederation of Production and Commerce, and National Corporation for Exporters: Provide technical assistance and establish communications with their members. Provide funding for the programme.
Barriers: x Mutual mistrust: Industries fear inconsistency in future policies and whether the programme will continue
to provide financial support and government is reluctant to provide funds to small businesses that lack experience.
x Lack of environmental regulations and those that exist constrain innovation. x Inadequate market for clean technologies. Enablers for Implementation: x The council plays the role of mediator and thus help establish consensus between industry and the
government. x Trade associations help lower transaction costs by supporting the implementation of the agreements
among their member firms.
Funding: The industrial associations, the National Cleaner Production Council, and the government jointly provide funding of up to $120,000 for each agreement. Costs: From 1999-2000 total Council costs were $38 million and the cost of private investments were approximately $53 million.

Non-technical summary of the DNV-GL report “Energy Efficiency Policy Case Studies”
Page 19 of 59 Author: Camilla Schramek January 2015
Energy savings and associated emission reductions: 16 out of the 54 agreements between 2002 and 2010 reduced CO2e by over 4 million tonnes, thus there was an average annual reduction of 31.6 KtCO2e by each agreement. It is estimated that there will be emission reductions from 2012 to 2016 of approximately 7.0 Mt CO2e. Benefits: 1. Reductions in energy demand: Unknown. 2. Mitigation of greenhouse gases: Reduction of 18.3 million tonnes of CO2. 3. Improvement in air quality: Information not provided. 4. Macro-economic impacts: Unknown. 5. Impacts on public budget: Unknown. 6. Creation of jobs: Increase in jobs in the field of clean energy services. 7. Improvements in human health and wellbeing: N.A. 8. Increased access to energy and reduced fuel poverty: N.A. 9. Benefits to energy providers: N.A.

Non-technical summary of the DNV-GL report “Energy Efficiency Policy Case Studies”
Page 20 of 59 Author: Camilla Schramek January 2015
Keidanren Voluntary Action Plan on the Environment Country: Japan Sector: Industry
Stage: Finished
Type of policy/instrument: Voluntary Instrument
Sub-sector: Chemical
Period: 1997-2012
Description: The Keidanren Voluntary Action Plan was a voluntary environmental action plan that promoted efforts to achieve the objectives of the Kyoto Protocol, specifically to reduce industry CO2 emissions to the target level over the give year period from 2008-2012. Each industry that committed to the plan chose their own target for CO2 emissions, energy consumption, and energy efficiency. Nippon Keidanren, a Japanese Business Federation with 1,309 representatives, 112 industrial associations, and 47 economic organizations, ran this program. 114 industries, accountable for 50% of total emissions in Japan, committed to this plan. To ensure compliance and success of the programme, the Ministry of Economy Trade and Industry (METI) created advisory councils to periodically follow up on participating firms. Each firm that participated in this programme set their own targets to lower their CO2 emissions, CO2 intensity, energy consumption, or energy intensity. The programme required 4 major actions, called the PDCA cycle, for each industry sector:
1. Plan: Set targets, measures, mitigation actions, mitigation actions, energy efficiency activities and social commitment. Update the targets and measures based on the periodical review.
2. Do: Implementation of the planned objectives and participation in international cooperative schemes.
3. Action: Adopt additional measures to further reduce CO2. Disclose follow-up results on the internet or other public sources.
4. Check: Periodical review for each year of implementation by a third-party evaluation and the Government Councils (Ministry of Economy Trade and Industry).
Actors: x Nippon Keidanren: Invited industrial firms to participate in the programme; published the set targets
and level of compliance of the companies in an annual report. x Ministry of Economy Trade and Industry (METI): Established advisory councils to review the
targets and provide feedback to participating firms; used guidelines of Kyoto Protocol to review the annual reports and presented the information to the UNFCCC.
x Industrial Associations and Private Companies: Set own targets and implemented necessary actions to achieve their target; reported emission reductions.
Barriers: x Challenge of identifying new actions for energy efficiency due to the high efficiency levels already
implemented. x The impacts of the Great East Japan earthquake of 2011 created barriers to the implementation of the
voluntary plan.
Enablers for Implementation: x Regulation within the Energy Conservation Act of Japan that legally mandated annual improvements in
energy intensity and an energy manager to implement the energy efficiency measures. This regulation reduced barriers for the chemical sector to accomplish its targets.
x Government provided free permanent energy audits to the industry sector. x An annual review and the results of the review were published that peer pressured companies that did not
reach their target by putting them on a "shame list." Funding: Each individual company funded their implementation of the voluntary action plan. Costs: The costs of implementation have not been made public.

Non-technical summary of the DNV-GL report “Energy Efficiency Policy Case Studies”
Page 21 of 59 Author: Camilla Schramek January 2015
Energy savings and associated emission reductions: 84 out of the 114 participating industries achieved their targets. Compared to 1990 levels, in 2012 energy consumption decreased by 7.1%, energy intensity decreased by 16%, and CO2 emissions decreased by 5.634 MM tons. Benefits: 1. Reductions in energy demand: 7.1% decrease in 2012 compared to 1999. 2. Mitigation of greenhouse gases: 5.6% decrease in 2012 compared to 1999. 3. Improvement in air quality: In the chemical sector SOx, NOx, Dust, COD, Nitrogen, and Phosphorous
emissions decreased from 2004 to 2011. 4. Macro-economic impacts: No information available. 5. Impacts on public budgets: Avoid more costly future government regulation and energy management
planning. 6. Creation of jobs: No information available. 7. Improvements in human health and wellbeing: Have not yet analysed benefits to health. 8. Increased access to energy and reduced fuel poverty: N.A. 9. Benefits to energy providers: No information available.

Non-technical summary of the DNV-GL report “Energy Efficiency Policy Case Studies”
Page 22 of 59 Author: Camilla Schramek January 2015
Standards and Labels

Non-technical summary of the DNV-GL report “Energy Efficiency Policy Case Studies”
Page 23 of 59 Author: Camilla Schramek January 2015
Australia's Energy Rating Label Country: Australia and New Zealand Sector: Electrical Appliances
Stage: Ongoing
Type of policy/instrument: Standards and labels scheme
Period: 2000-2030
Description:
The scheme mandates that appliances such as refrigerators, freezers, and washing machines for sale in Australia and New Zealand display an energy rating label that shows the energy efficiency level of the device and the amount of energy it consumes. The goal of this scheme is to provide information to consumers and incentivize manufacturers to improve the energy efficiency of their appliances. Products included in the programme must have a benefit to the community that outweighs any cost associated with its regulation. The E3 committee, a board of state, territory, and federal government agencies from Australia and New Zealand oversee the implementation of this scheme. The label employed by the scheme has five key components:
1. A six-star rating: indicates the energy efficiency of the appliance - the more stars, the more efficient the appliance.
2. The make and model of the appliance. 3. Annual energy consumption 4. The standard against which the appliance is tested. 5. A link to the Energy Rating website: compares the energy consumption of different appliance
models.
Actors: x National Framework for Energy Efficiency and the Select Council on Climate Change:
Australian federal agencies and institutions that oversee the implementation of the programme. x Equipment Energy Efficiency (E3) Programme: Execute the labelling scheme. x Minimum Energy Performance Standards: Specify the minimum level of energy performance that
appliances must meet before they can be sold commercially.
Barriers: Inclusion of operating costs was confused with information on operating savings and purchase costs. Enablers for Implementation: x Label design presents information in a clear and concise format. x Minimum energy performance standards ensure that all appliances in the market meet a specified level of
energy efficiency.
Funding: No information available. Costs: The cost of the programme from 2010-2013 was approximately $3.9 billion. Energy savings and associated emission reductions: From 2000-2013 the programme saved over 314 PJ of energy; the scheme achieved emission reductions of 86.8 Mt CO2e, with an effective cost of $91 per tonne of CO2e avoided. From 2014-2030 the programme is projected to save 2,021 PJ of end-use energy and to achieve emission reductions of approximately 433 million tonnes of CO2e. Benefits: 1. Reductions in energy demand: 314 PJ from 2000-2013. 2. Mitigation of greenhouse gases: 86.8 Mt CO2e from 2000-2013. 3. Improvement in air quality: No available information. 4. Macro-economic impacts: The programme saved $11.8 billion in energy costs from 2000-2013. 5. Impacts on public budget: Net benefit of $7.9 billion. 6. Creation of jobs: No available information.

Non-technical summary of the DNV-GL report “Energy Efficiency Policy Case Studies”
Page 24 of 59 Author: Camilla Schramek January 2015
7. Improvements in human health and wellbeing: Informed consumers, which caused environmentally favourable behavioural changes in the population.
8. Increased access to energy and reduced fuel poverty: No available information. 9. Benefits to energy providers: No available information.
Non-technical summary of the DNV-GL report “Energy Efficiency Policy Case Studies”
Page 25 of 59 Author: Camilla Schramek January 2015
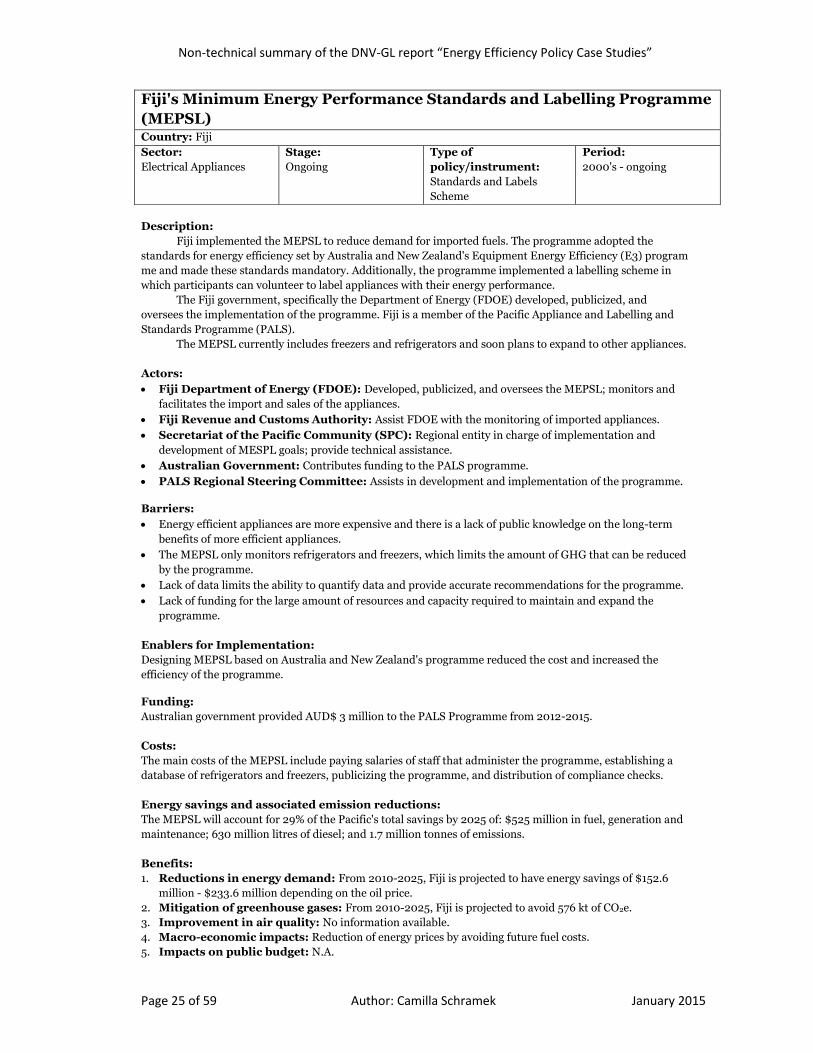
Fiji's Minimum Energy Performance Standards and Labelling Programme (MEPSL) Country: Fiji Sector: Electrical Appliances
Stage: Ongoing
Type of policy/instrument: Standards and Labels Scheme
Period: 2000's - ongoing
Description:
Fiji implemented the MEPSL to reduce demand for imported fuels. The programme adopted the standards for energy efficiency set by Australia and New Zealand's Equipment Energy Efficiency (E3) program me and made these standards mandatory. Additionally, the programme implemented a labelling scheme in which participants can volunteer to label appliances with their energy performance.
The Fiji government, specifically the Department of Energy (FDOE) developed, publicized, and oversees the implementation of the programme. Fiji is a member of the Pacific Appliance and Labelling and Standards Programme (PALS).
The MEPSL currently includes freezers and refrigerators and soon plans to expand to other appliances. Actors: x Fiji Department of Energy (FDOE): Developed, publicized, and oversees the MEPSL; monitors and
facilitates the import and sales of the appliances. x Fiji Revenue and Customs Authority: Assist FDOE with the monitoring of imported appliances. x Secretariat of the Pacific Community (SPC): Regional entity in charge of implementation and
development of MESPL goals; provide technical assistance. x Australian Government: Contributes funding to the PALS programme. x PALS Regional Steering Committee: Assists in development and implementation of the programme.
Barriers: x Energy efficient appliances are more expensive and there is a lack of public knowledge on the long-term
benefits of more efficient appliances. x The MEPSL only monitors refrigerators and freezers, which limits the amount of GHG that can be reduced
by the programme. x Lack of data limits the ability to quantify data and provide accurate recommendations for the programme. x Lack of funding for the large amount of resources and capacity required to maintain and expand the
programme. Enablers for Implementation: Designing MEPSL based on Australia and New Zealand's programme reduced the cost and increased the efficiency of the programme.
Funding: Australian government provided AUD$ 3 million to the PALS Programme from 2012-2015. Costs: The main costs of the MEPSL include paying salaries of staff that administer the programme, establishing a database of refrigerators and freezers, publicizing the programme, and distribution of compliance checks. Energy savings and associated emission reductions: The MEPSL will account for 29% of the Pacific's total savings by 2025 of: $525 million in fuel, generation and maintenance; 630 million litres of diesel; and 1.7 million tonnes of emissions. Benefits: 1. Reductions in energy demand: From 2010-2025, Fiji is projected to have energy savings of $152.6
million - $233.6 million depending on the oil price. 2. Mitigation of greenhouse gases: From 2010-2025, Fiji is projected to avoid 576 kt of CO2e. 3. Improvement in air quality: No information available. 4. Macro-economic impacts: Reduction of energy prices by avoiding future fuel costs. 5. Impacts on public budget: N.A.

Non-technical summary of the DNV-GL report “Energy Efficiency Policy Case Studies”
Page 26 of 59 Author: Camilla Schramek January 2015
6. Creation of jobs: No available information. 7. Improvements in human health and wellbeing: N.A. 8. Increased access to energy and reduced fuel poverty: N.A. 9. Benefits to energy providers: N.A.

Non-technical summary of the DNV-GL report “Energy Efficiency Policy Case Studies”
Page 27 of 59 Author: Camilla Schramek January 2015
Vietnam Energy Efficiency Standards and Labelling Programme Country: Vietnam Sector: Commercial, public, residential; industrial and transportation
Stage: Implemented
Type of policy/instrument: Voluntary labelling programme and minimum efficiency performance standards programme (MEPS)
Period: 9 years since start of labelling programme and 2 years since start of MEPS
Description:
In 2006, the Law on Energy Efficiency and Conservation established the voluntary Energy Efficiency Standard and Labelling Programme (EES&L). The voluntary labelling scheme was established as a precursor to the implementation of a mandatory labelling and MEPS in 2013. Today, the programme mandates that the claimed performance of all electrical equipment must be registered before it can be sold. The Energy Efficiency and Conservation (EE&C) Office, a part of the Department of Science and Technology/Energy Conservation Office within the Ministry of Industry and Trade (MoIT) both established and oversees the implementation of the programme. Today, mandatory labelling as well as mandatory MEPS are required for appliances such as lighting, air-conditioners, top loading washing machines, refrigerators, industrial equipment, and office and commercial equipment. To apply for MEPS, a third party must certify compliance with relevant performance criteria. The government verifies these claims by testing samples of products that are most likely to fail on the market and in retail outlets. Actors: x Department of Science and Technology/Energy Conservation Office of the Ministry of
Industry and Trade (MoIT): Monitors, verifies, and enforces the mandatory labels and the MEPS; educates industry on programme requirements; implements the programme.
x General Directorate of Energy: Overall responsibility for the EES&L programme. x Certification Agencies: Private firms that comply with MoIT's requirements can apply to become
certification agencies.
Barriers: x Regulatory framework: No experience with implementing mandatory regulations on energy efficiency; lack
of policy framework; difficulty in negotiations between manufacturers and stakeholders due to lack of experience with negotiation; lack of regular testing for equipment performance.
x Institutional barriers: lack of integrated institutional approach to programme implementation; lack of training programmes; lack of accredited labs that can test for energy efficiency.
x Market barriers: Limited funds and human capacity led to limited market monitoring and data collection. x Limited awareness: Households, sellers, and buyers lack information and knowledge on the benefits of
energy-saving appliances. Enablers for Implementation: x Technical assistance provided by the Australian government helped Vietnam to reduce costs by building
on the programme already in place in Australia and New Zealand.
x UNDP's barriers removal to the cost-effective development and implementation of energy efficiency standards and labelling (BRESL) project removed technical barriers and set energy benchmarks which helped Vietnam establish implementation guidelines for its programme.
Funding: UNDP's BRESL project was funded by the GEF for $650,000 and by the government for $3,085,000. The Australian technical assistance programme was funded by the Australian Agency for International Development (AusAID) for $1.4 million. Costs: No information available. Energy savings and associated emission reductions:

Non-technical summary of the DNV-GL report “Energy Efficiency Policy Case Studies”
Page 28 of 59 Author: Camilla Schramek January 2015
It is estimated that the MEPS and energy labels will have electricity savings of 6,000 GWh/year and will have cumulative energy savings over 70 TWh by 2030. Benefits: 1. Reductions in energy demand: No information available. 2. Mitigation of greenhouse gases: GHG reduction of 2.64 million tonnes of CO2 from selected
household appliances. 3. Improvement in air quality: N.A. 4. Macro-economic impacts: Estimated savings of $440 million for all households and $13 per household
by 2030. 5. Impacts on public budget: Electricity savings from more efficient public lighting systems. 6. Creation of jobs: N.A. 7. Improvements in human health and wellbeing: N.A. 8. Increased access to energy and reduced fuel poverty: N.A. 9. Benefits to energy providers: N.A.

Non-technical summary of the DNV-GL report “Energy Efficiency Policy Case Studies”
Page 29 of 59 Author: Camilla Schramek January 2015
Demand Side Management

Non-technical summary of the DNV-GL report “Energy Efficiency Policy Case Studies”
Page 30 of 59 Author: Camilla Schramek January 2015
Description: The program aims to establish a smart metering programme that will inform customers on their energy consumption patterns and increase efficiency of energy use and billing. The program plans to distribute the majority of smart meters in 2016 and 2017, with national electric network operators mandated to equip at least 95% of all metering points by the end of 2019. The Electricity Act (2010) gave the Minister of Economic Affairs the power to issue smart metering per decree, following a cost-benefit analysis. The Energy Regulatory Authority determines data requirements and logistical details of the smart metering systems. The implementation of the program includes the following aspects:
x Minister of Economic Affairs conducted a cost-benefit analysis on the smart metering system before the decree was issued. His office then consulted with the Energy Regulatory Authority, customer protection bodies, and the Austrian Data Protection Commission before finalizing the decree.
x Network operators must ensure smart metering systems comply with data and consumer protection laws. They meter customers' consumption and store this data. This data is provided daily to customers on an internet platform.
x Electricity distributors must send customers information on their consumption and related costs each month.
x The Energy Regulatory Authority re-evaluates the requirements for information given to customers and published to relevant databases.
Actors: x Ministry of Economy: Introduced smart metering legislation and conducted cost-benefit analysis;
oversee the implementation of the programme. x Energy Regulatory Authority: Published the decree; define responsibilities and requirements of the
smart metering system. x Networker Operators: Install smart meters for customers, bill network charges to the customers, and
forward necessary data to suppliers and market participants. x Electricity Distributors: Send energy consumption information and related costs to costumers on a
monthly basis. Barriers: x Operators: Network operators were concerned with the cost and feasibility of smart metering. Lack of
coordination and plans for implementation among the operators. x Benefits: Uncertainty about the quantification of benefits related to smart metering, specifically on energy
savings due to limited practical experience in the field and lack of historical data. x Costs of installation: High initial cost of smart meters. x Customers: Challenge of gaining trust and participation of customers due to lack of education and
awareness about smart meters. x Cost-benefit tool: The tool did not aid utilities; they felt they had to install smart meters regardless of the
outcome of the cost-benefit analysis. x Stakeholder buy-in: Stakeholders feel there is a lack of privacy and data protection for smart metering
data.
Enablers for Implementation: x The publication of the cost-benefit analysis, done by the Australian Regulatory Authority, helped to pass
the legislation by showing that the implementation of smart metering would bring significant economic benefits.
x Small scale projects were successfully used to gauge the acceptance and feasibility of a larger, nationwide smart metering programme.
Smart Metering and Informative Billing Country: Austria Sector: Smart Metering
Stage: On going
Type of policy/ instrument: Public Information/Education/DSM
Period: 2012-2019

Non-technical summary of the DNV-GL report “Energy Efficiency Policy Case Studies”
Page 31 of 59 Author: Camilla Schramek January 2015
x Regional experience sharing through various published reports and best practice determination have aided in the creation of appropriate regulatory frameworks for the programme.
x The cost-benefit sustainability tool helps stakeholders conduct their own in-depth analysis.
Funding: This program is domestically funded by network tariffs. Austria has provided for an explicit metering tariff or for a rental price for the smart meters. Costs: In the cost-benefit analysis for smart metering implementation performed in 2010 for the expected rollout period up until 2019, the estimated costs were between EUR 3.3 billion and EUR 4.4 billion. The major costs associated with smart metering are the purchasing, instalment, and operating costs of smart meters and the cost for data collection and data communication infrastructure. Energy Savings and Associated Emission Reductions: Based on the assumption that 570,000 smart meters would be distributed from 2012-2019, with a penetration rate of 95%, estimated energy savings from electricity smart metering is 3.5% of total consumption and from gas metering is 7% of total consumption. Benefits: 1. Reductions in energy demand: The smart metering programme resulted in energy savings of 3.5% for
electricity and 7% for gas. 2. Mitigation of greenhouse gases: N.A. 3. Improvement in air quality: N.A. 4. Macro-economic impacts: Estimated net present value between EUR 291 million and EUR 556 million
and estimated benefits between EUR 3.6 billion and EUR 4.9 million. 5. Impacts on public budgets: Information not available. 6. Creation of jobs: More than 21,000 jobs will be created from this program. 7. Improvements in human health and well-being: N.A. 8. Increased access to energy and reduced fuel poverty: N.A. 9. Benefits to energy providers: Improvement in security of supply due to faster fault location; easier
power restoration and improved monitoring of voltage quality; ability for quick remote disconnection or reconnection of customers or power; and potential for energy savings driven by changes in consumption behaviour.

Non-technical summary of the DNV-GL report “Energy Efficiency Policy Case Studies”
Page 32 of 59 Author: Camilla Schramek January 2015
Description: Eskom launched EEDSM, a financial incentives programme, to reduce energy demand and contribute towards the alleviation of short-term shortages of electricity supply in the country. The programme aims to improve electricity efficiency performance and decrease the amount of electricity consumed during peak hours. All electricity consumers of Eskom, including residential, commercial, and industrial sectors, can participate in this program which Eskom administers this programme. The programme was launched in response to the Government's National Energy Efficiency Strategy (NEES). The program includes the following incentives:
x Standard Product Programme: Eskom provides discounts on the cost of implementing small to medium projects that increase energy efficiency (<250 kW). When the project is commissioned the standard value per rebated item, capped at ZAR 750,000, and full payment are awarded.
x Standard Offer Programme: Eskom pays for the fixed cost per kWh of successful project proposals over three years. Eskom customers, project developers, or ESCO from the commercial, agriculture, and small industrial sectors can participate in this performance-based programme.
x Energy Service Company Programme: Energy service companies that submit a project proposal that includes significant energy demand reductions (over 1 MW) can participate in an incentive scheme. The incentive scheme consists of demand based payments between USD 0.04 and 0.06 cents per kWh for projects such as process optimisation and lighting.
x Aggregated Standard Product Programme: Allows project developers to aggregate all of their individual energy efficiency projects under the Standard Product Programme into a single contract. Funding is considered for projects with demand savings of less than 250 kW per project and with constant energy savings.
x Performance Contracting: Eskom contracts with a single project developer to purchase energy savings for multiple projects such as compressed air, ventilation, and lighting. The minimum project size must be more than 30 GWh over three years. Rates per kWh are fixed and based on the time of savings: USD 0.04 cents per kWh (peak) and USD 0.01 cents per kWh (other time).
All programmes except the Standard Product Programme require applicants to perform an energy audit, create a monitoring and verification plan, and submit a report on achieved savings that is verified by an independent verifier.
Actors: x Ministry of Energy: Set the EEDSM targets for the utility. x National Energy Regulator of South: Add, amend, and remove license conditions by law; approve
verification protocols; develop rules for the Standard Offer Programme; implement financial reconciliation of energy efficiency and demand-side management funds in relation to target savings.
x Eskom: Allocate the budget based on instructions from the National Energy Regulator; collect EEDSM funding through the use of a wholesale tariff.
x Department of Energy: Develop policy for the Standard Offer Programme; fund the Energy Efficiency Resource Standard (EERS) to cover the electricity savings purchased under the Standard Offer Programme; develops criteria for 'request for offers.'
x National Energy Efficiency Agency (NEEA): Receive verification reports for each EEDSM initiative under the Standard Offer Programme; advise Development Bank of South Africa and National Energy Regulator on savings per initiative; produce EEDSM performance reporting for the industry.
x Development Banks of South Africa: Provide concessionary funding to project developers wishing to benefit from the Standard Offer Programme and to individuals claiming electricity savings from a demand-side management funding mechanism; perform functions identified for NEEA in the Standard Offer
Eskom's Energy Efficiency and Demand-side Management (EEDSM) Incentive Programme Country: South Africa Sector: Industry/Buildings
Stage: Ongoing
Type of policy/instrument: Demand Side Management
Sub-sector: Manufacturing industry
Period: 2004-present

Non-technical summary of the DNV-GL report “Energy Efficiency Policy Case Studies”
Page 33 of 59 Author: Camilla Schramek January 2015
Programme until they are able to take over; advise the market on the criteria for the 'request for offers'; manage the EEDSM funds released by Eskom; pay verified claims.
Barriers: x Eskom was a barrier, rather than a facilitator to EEDSM implementation. The uncertainty and delays in
the Eskom evaluation process create risks and made the projects difficult to finance and implement. x The state owned utility has been forced to cut back on its energy efficiency incentives due to their current
energy crisis. There is a high degree of price sensitivity among industrial customers for participating in energy efficiency schemes.
x Eskom's demand-side management group was understaffed and overburdened. x Evaluation: process to evaluate and process EEDSM proposals was very cumbersome, slow, and non-
transparent; criterion for project approval was unclear and inconsistent; proposal evaluation provided insufficient feedback; evaluation teams spent too much time on the energy savings calculations and costs.
x Eskom's contract negotiation process was very complex, time-consuming, and adversarial. Enablers for implementation: x The government has aided in the implementation and the execution of the program. x The Electricity Regulation Act of 2006 requires every licensee to comply with energy efficiency standards
and demand side management. The act empowers the National Energy Regulator to amend, add or remove any licence condition and to implement the national government's electricity policy.
x Program implementers provide customers with a website platform that gives them access to necessary documents for the program.
x The programme's adaptive management approach has allowed it to quickly act in response to stakeholder feedback, which has resulted in greater transparency, shorter processing times, and reduced transaction risks.
Funding: Not publically available. Costs: As of April 2011, the estimated cost for government to implement the programme was USD 436,000, over 3 years. In 2011 Eskom total funding of DSM projects was USD 44 million. Total budget allocated for a 3 year period is USD 0.44 billion. Energy savings and associated emission reductions:
2011 Energy Savings percentage (%)
Residential 56 Industrial optimization 21
2012
Scheme ESCO Program
Standard Offer
Performance Contracting
Standard Product
Demand savings (MW) 793 31.4 19.7 Energy savings (GWh) 2347 148.1 2076 86.9
Benefits: 1. Reductions in energy demand: By 2012: the Energy Services Companies Programme had demand
savings of 793 MW and energy savings of 2347 GWh; the Standard Offer Programme had demand savings of 31.4 MW and energy savings of 148.1 GWh; the Performance Contracting Programme had demand savings of 131 MW and energy savings of 2076 GWh; and the Standard Product Programme had demand savings of 19.7 MW and energy savings of 86.9 GWh.
2. Mitigation of greenhouse gases: In 2012, the programme achieved a reduction of approximately 232 million tonnes of CO2.
3. Improvement in air quality: Information not available. 4. Macro-economic impacts: Lower economic costs; projects have had savings in demand and energy
consumption; the activities under the programme accelerate economic growth by increasing efficiencies and job creation.
5. Impacts on public budget: Information not available. 6. Creation of jobs: Information not available.

Non-technical summary of the DNV-GL report “Energy Efficiency Policy Case Studies”
Page 34 of 59 Author: Camilla Schramek January 2015
7. Improvements in human health and wellbeing: Information not available. 8. Increased access to energy and reduced fuel poverty: Information not available. 9. Benefits to energy providers: Information not available.
Non-technical summary of the DNV-GL report “Energy Efficiency Policy Case Studies”
Page 35 of 59 Author: Camilla Schramek January 2015
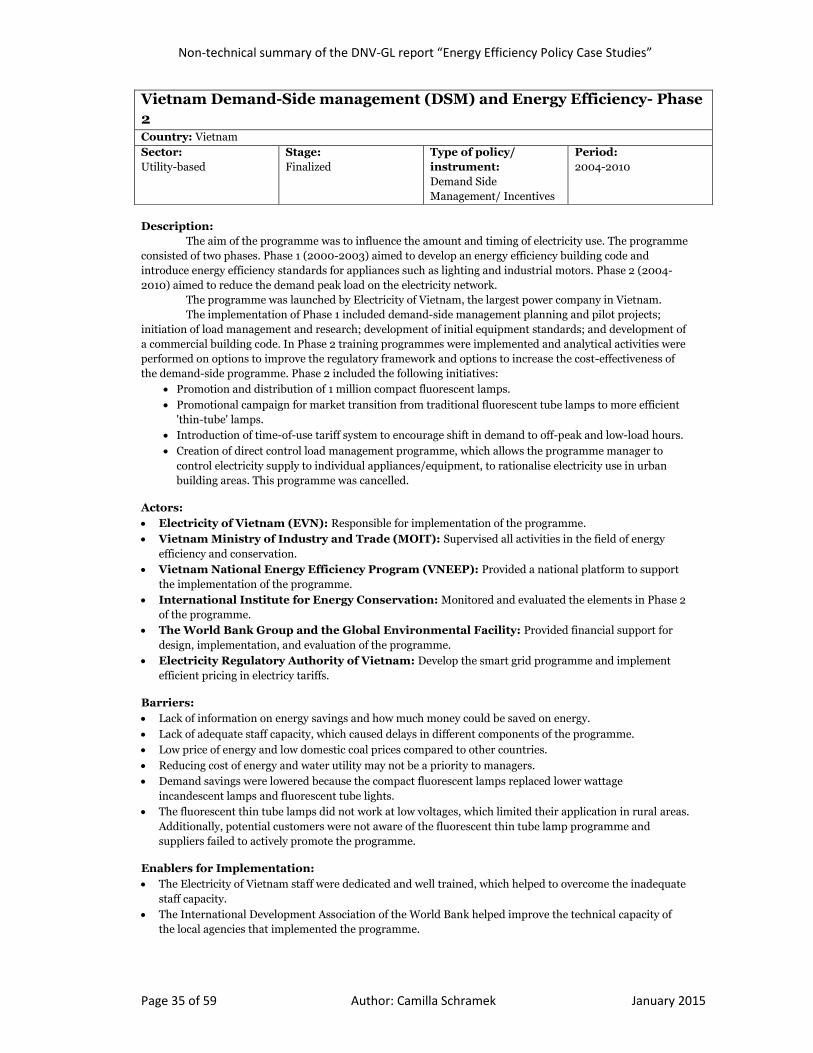
Vietnam Demand-Side management (DSM) and Energy Efficiency- Phase 2 Country: Vietnam Sector: Utility-based
Stage: Finalized
Type of policy/ instrument: Demand Side Management/ Incentives
Period: 2004-2010
Description: The aim of the programme was to influence the amount and timing of electricity use. The programme consisted of two phases. Phase 1 (2000-2003) aimed to develop an energy efficiency building code and introduce energy efficiency standards for appliances such as lighting and industrial motors. Phase 2 (2004-2010) aimed to reduce the demand peak load on the electricity network. The programme was launched by Electricity of Vietnam, the largest power company in Vietnam. The implementation of Phase 1 included demand-side management planning and pilot projects; initiation of load management and research; development of initial equipment standards; and development of a commercial building code. In Phase 2 training programmes were implemented and analytical activities were performed on options to improve the regulatory framework and options to increase the cost-effectiveness of the demand-side programme. Phase 2 included the following initiatives:
x Promotion and distribution of 1 million compact fluorescent lamps. x Promotional campaign for market transition from traditional fluorescent tube lamps to more efficient
'thin-tube' lamps. x Introduction of time-of-use tariff system to encourage shift in demand to off-peak and low-load hours. x Creation of direct control load management programme, which allows the programme manager to
control electricity supply to individual appliances/equipment, to rationalise electricity use in urban building areas. This programme was cancelled.
Actors: x Electricity of Vietnam (EVN): Responsible for implementation of the programme. x Vietnam Ministry of Industry and Trade (MOIT): Supervised all activities in the field of energy
efficiency and conservation. x Vietnam National Energy Efficiency Program (VNEEP): Provided a national platform to support
the implementation of the programme. x International Institute for Energy Conservation: Monitored and evaluated the elements in Phase 2
of the programme. x The World Bank Group and the Global Environmental Facility: Provided financial support for
design, implementation, and evaluation of the programme. x Electricity Regulatory Authority of Vietnam: Develop the smart grid programme and implement
efficient pricing in electricy tariffs.
Barriers: x Lack of information on energy savings and how much money could be saved on energy. x Lack of adequate staff capacity, which caused delays in different components of the programme. x Low price of energy and low domestic coal prices compared to other countries. x Reducing cost of energy and water utility may not be a priority to managers. x Demand savings were lowered because the compact fluorescent lamps replaced lower wattage
incandescent lamps and fluorescent tube lights. x The fluorescent thin tube lamps did not work at low voltages, which limited their application in rural areas.
Additionally, potential customers were not aware of the fluorescent thin tube lamp programme and suppliers failed to actively promote the programme.
Enablers for Implementation: x The Electricity of Vietnam staff were dedicated and well trained, which helped to overcome the inadequate
staff capacity. x The International Development Association of the World Bank helped improve the technical capacity of
the local agencies that implemented the programme.

Non-technical summary of the DNV-GL report “Energy Efficiency Policy Case Studies”
Page 36 of 59 Author: Camilla Schramek January 2015
x The Vietnam National Energy Efficiency Programme provided institutional framework for implementing the programme.
x The Vietnam Ministry of Industry and Trade provided guidance on energy-use and energy conservation planning requirements, constructed an effective data management system, provided energy audits, and provided training programmes.
Funding: To fund phase 1 of the programme, the Swedish International Development Agency (SIDA) provided and the International Development Agency (IDA) administered a multi-lateral technical assistance grant of $3.6 million. To fund phase 2 of the programme, the Global Environment Facility and the International Development Association of the World Bank provided and administered a multi-lateral technical assistance grant of $20 million.
Costs: Information not provided. Energy savings and associated emission reductions: In 2010, the programme had annual energy savings of 496 GWh and a reduction of 0.95 million tonnes of CO2 emissions. The compact fluorescent lamp programme had energy savings of 37,500 MWh per year and lifetime energy savings of 198,900 MWh. Benefits: 1. Reductions in energy demand: Total peak load reduction of 120MW; direct demand savings of 12.3
MVA from the compact fluorescent lamp programme; indirect demand reduction of 280 MW from the compact fluorescent lamp market transformation programme.
2. Mitigation of greenhouse gases: Total CO2 reductions of approximately 0.95 million tonnes. 3. Improvement in air quality: Information not available. 4. Macro-economic impacts: Implementation of 100 commercial energy-efficiency projects results in an
aggregate investment of $5.2 million and delivered training to over 100 services providers. 5. Impacts on public budget: Information not provided. 6. Creation of jobs: Information not available. 7. Improvements in human health and wellbeing: Information not provided. 8. Increased access to energy and reduced fuel poverty: Average energy bill savings of 15.2% for
consumers; consumer benefit/cost ratio of 6.34 from the compact fluorescent lamp programme. 9. Benefits to energy providers: Power company benefit/cost ratio of 19.5 from the compact fluorescent
lamp programme; estimated savings of 45 MW from the time-of-use metering project.

Non-technical summary of the DNV-GL report “Energy Efficiency Policy Case Studies”
Page 37 of 59 Author: Camilla Schramek January 2015
Financial Mechanisms

Non-technical summary of the DNV-GL report “Energy Efficiency Policy Case Studies”
Page 38 of 59 Author: Camilla Schramek January 2015
Turkey Private Sector Sustainable Energy Financing Facility (TurSEFF) Country: Turkey Sector: Energy production
Stage: Implementation
Type of policy/instrument: Incentive based Strategies
Sub-sector: SME sector
Period: Phase 1: June 2010-January 2013 Extension I launched in 2014
Description:
The TurSEFF aims to increase private sector participation in renewable energy and energy efficiency projects by helping Turkey establish a sustainable energy finance market. The key objectives of the facility are to improve energy efficiency in key sectors of the economy, strengthen energy security, improve environmental performance, reduce the impact of energy imports on Turkey's account deficit, and decrease reliance on fossil fuels while meeting energy needs.
The European Bank for Reconstruction and development launched and oversees the implementation of the programme.
The facility provides credit of up to $265 million to partner banks who then provide loans of up to $6.3 million to private sector borrowers for energy efficiency and renewable energy investments. The facility offers six types of loans for: large scale energy efficiency projects by industrial clients, energy efficiency projects for commercial buildings, stand-alone renewable energy projects, small scale energy efficiency and renewable energy projects, energy efficiency suppliers, and small and medium sized enterprises that adopt certain technologies. Additionally, the facility provides local training to loan officers and free technical assistance. Actors: x European Bank for Reconstruction and Development: Provide credit to support private sector
investment. x European Union and the Climate Investment Funds: Finance the technical assistance programme. x Project consultant (consortium made up of Montgomery Watson Harza, Muhendislik ve
Musavirlik, Sirketry, and Fichtner): Provide technical assistance to potential borrowers, energy management training through energy audits and workshops, project coordination, and capacity building and training to participating banks.
x Verification consultant ÅF Markets: Ensure facility objectives are met by confirming that sub-projects are completed in accordance with investment plans.
x Turkish participating banks: Danizbank, İş Bankası, Vakıfbank and Yapı Kredi: Borrow from the facility to lend to their customers.
Barriers: x Barriers to the private sector: private sector does not prioritize energy efficiency, limited experience in and
knowledge of energy efficiency projects, and private developers tend to be smaller and Turkish which limits their access to international markets and export credit agencies.
x Lack of capacity to evaluate and manage a regulatory framework for energy efficiency projects. x Lack of financial resources to fund the high transaction costs of the projects and lend to small-scale
projects. x Lack of technically reliable information on energy efficiency resources. Enablers for Implementation: x Targeted awareness-raising campaigns helped educate the private sector on energy efficiency projects. x Training: training on evaluating the projects and energy lending was provided to staff at participating
banks and on-the-job training for energy audits was provided to local businesses. x Independent experts monitored and reported the assessment and evaluation of the projects to prevent
conflict of interest.
Funding: x The European Bank for Reconstruction and Development provided multilateral funds of $285 million for
sustainable energy investment. x The Clean Technology Fund provided multilateral funds of $50 million for concessional co-financing and
$2 million for technical assistance for grant funding. x The European Union provided multilateral funds of $7.5 million for technical assistance.

Non-technical summary of the DNV-GL report “Energy Efficiency Policy Case Studies”
Page 39 of 59 Author: Camilla Schramek January 2015
x The Japan Bank for International Cooperation provided bilateral funds of $20 million for disbursement.
Costs: As of December 2012, the programme funded 370 clean energy projects, which had a total project value of $460 million. The average value of the loans was $700,000. Energy savings and associated emission reductions: From June 2010 to January 2013, the investments in sustainable energy projects through the facility avoided approximately 650,000 tonnes of CO2 per year. Investments in energy efficiency projects saved 1.5 TWh per year and investments in renewable energy projects saved 1.15 TWh per year. Benefits: 1. Reductions in energy demand: Decreased energy use of 2.65 TWh per year from energy efficiency and
renewable energy projects. 2. Mitigation of greenhouse gases: The facility avoided approximately 650,000 tonnes of CO2. 3. Improvement in air quality: Information not available. 4. Macro-economic impacts: Information not available. 5. Impacts on public budget: TurSEFF partner banks have disbursed $264 million, which has increased
the public funding available for energy efficiency initiatives. 6. Creation of jobs: Facility investments have led to employment creation, particularly in areas outside of
economic hubs. 7. Improvements in human health and wellbeing: Information not available. 8. Increased access to energy and reduced fuel poverty: Information not available. 9. Benefits to energy providers: Information not available.

Non-technical summary of the DNV-GL report “Energy Efficiency Policy Case Studies”
Page 40 of 59 Author: Camilla Schramek January 2015
Thailand's Energy Conservation (ENCON) Fund Country: Thailand Sector: Industrial
Stage: Implementation (ongoing through extension)
Type of policy/instrument: Directive and Incentive Based Strategies
Sub-sector: Industry, transportation, commercial, and residential
Period: 1992-2012
Description: The ENCON fund aims to increase energy efficiency and renewable energy projects by providing investments that mitigate perceived risks of such projects. The main objectives of the fund are to enable project developers to access capital, expand the energy-service market, stimulate sustainable investment from the private sector, and increase financial confidence in energy efficiency and renewable energy investments. The ENCON led to the creation of two sub-funds: the Energy Efficiency Revolving Fund, which aimed to increase investment in large-scale projects by providing debt financing and credit lines at low interest rates and the Energy Service Company fund, which aims to increase investment by small and medium sized enterprises and energy-service companies in energy efficiency projects by offering financial mechanisms such as equity investment and equipment leasing. The ENCON was established and implemented by the government of Thailand. The fund has been disbursed through various economic and financial mechanisms such as grants, subsidies, tax incentives, and a feed-in premium for renewable energy. The ENCON is funded by taxing all petroleum sold in Thailand. Loan eligibility for the Energy Efficiency Revolving Fund was determined by local banks who evaluated applications and the strength of the applicant's balance sheet and cash flow. Actors: x Ministry of Finance: Increases public awareness of the fund; responsible for the collection of tax
proceeds to maintain the fund. x Thailand's Department of Alternative Energy Development and Efficiency: Provides technical
assistance; responsible for implementation of projects under the fund. x Small Business Credit Guarantee Corporation: Provides partial credit guarantees to commercial
banks for loans to small enterprises eligible for debt financing. x Energy Conservation Foundation of Thailand: Manages the 'energy-service companies fund'. x Energy for Environmental Foundation: Manages the 'energy-service companies fund'. x Multilateral lending institutions (mainly the Global Environment Facility): Provides financing
and capacity building for government staff and banks.
Barriers: x Lack of financial liquidity due to uncertain investor confidence, limited banker experience, and weak
balance sheets. x High costs: requirement of high cost technology and high fixed investment, operation, and maintenance
costs. x Burdensome bureaucratic procedures and paperwork such as slow turnaround for project approval. x Slow disbursement of funds due to political and administrative issues such as poor quality of audits, lack of
penalty for non-compliance, lack of authority of energy managers, and delay in government approval for energy audits.
x Financing cap to invest in capital-intensive projects such as wind farms has deterred investment. Enablers for Implementation: x Establishment of complimentary programme that provided research and development promoted the use of
the fund. x Pilot programmes: resolved many of the political and administrative problems, helped stimulate
investment in large-scale industrial energy efficiency projects, determined economic feasibility, and assessed energy savings and greenhouse gas emission reductions.
x Fund quickly and successfully implemented reforms in response to stakeholder feedback. x The revolving fund increased the number of projects and helped increase confidence in clean energy
projects.

Non-technical summary of the DNV-GL report “Energy Efficiency Policy Case Studies”
Page 41 of 59 Author: Camilla Schramek January 2015
Funding: The ENCON is funded by a tax of USD .002 per litre of petroleum, which amounts to about USD 50 million annually. The Ministry of Energy administers these tax proceeds and provides financial subsidies to speed up energy efficiency improvement and support measures for energy conservation in small and medium sized enterprises. Additionally, a fund committee manages the fund. Costs: Until 2015, energy efficiency projects will receive funding of approximately USD 180.7 million per year. The Energy Efficiency Revolving programme resulted in total investment of USD 521.5 million and by 2010 the Energy-Service Companies Fund resulted in total investment of USD 109 million. Energy savings and associated emission reductions: By 2030, the fund will result in energy savings of 38,200 ktoe, CO2 emission reductions between 130 and 140 million tonnes per year, and a 25% reduction in energy intensity compared to 2010 levels. By the close of the revolving fund, there were approximately 98 million tonnes of CO2e in greenhouse gas emission reductions. By the end of the energy-service company fund's second phase in 2012, projects resulted in energy savings of 23.97 ktoe per year. Benefits: 1. Reductions in energy demand: Reduction of 38,200 ktoe in 2030 compared to 2010 levels. 2. Mitigation of greenhouse gases: Between 130 and 140 million tonnes of CO2 per year. 3. Improvement in air quality: Information not available. 4. Macro-economic impacts: Estimated expenditure savings of USD 33.7 billion in 2030. 5. Impacts on public budget: Information not available. 6. Creation of jobs: Information not available. 7. Improvements in human health and wellbeing: Information not available. 8. Increased access to energy and reduced fuel poverty: Information not available. 9. Benefits to energy providers: Information not available.
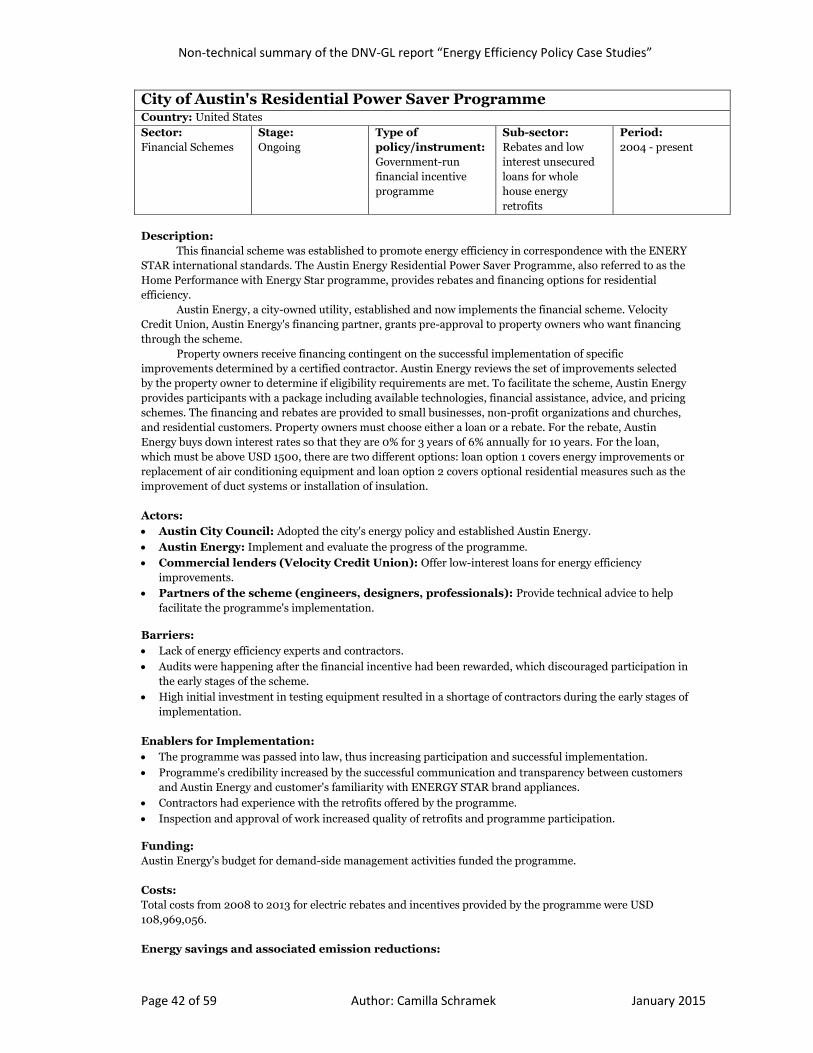
Non-technical summary of the DNV-GL report “Energy Efficiency Policy Case Studies”
Page 42 of 59 Author: Camilla Schramek January 2015
City of Austin's Residential Power Saver Programme Country: United States Sector: Financial Schemes
Stage: Ongoing
Type of policy/instrument: Government-run financial incentive programme
Sub-sector: Rebates and low interest unsecured loans for whole house energy retrofits
Period: 2004 - present
Description: This financial scheme was established to promote energy efficiency in correspondence with the ENERY STAR international standards. The Austin Energy Residential Power Saver Programme, also referred to as the Home Performance with Energy Star programme, provides rebates and financing options for residential efficiency. Austin Energy, a city-owned utility, established and now implements the financial scheme. Velocity Credit Union, Austin Energy's financing partner, grants pre-approval to property owners who want financing through the scheme. Property owners receive financing contingent on the successful implementation of specific improvements determined by a certified contractor. Austin Energy reviews the set of improvements selected by the property owner to determine if eligibility requirements are met. To facilitate the scheme, Austin Energy provides participants with a package including available technologies, financial assistance, advice, and pricing schemes. The financing and rebates are provided to small businesses, non-profit organizations and churches, and residential customers. Property owners must choose either a loan or a rebate. For the rebate, Austin Energy buys down interest rates so that they are 0% for 3 years of 6% annually for 10 years. For the loan, which must be above USD 1500, there are two different options: loan option 1 covers energy improvements or replacement of air conditioning equipment and loan option 2 covers optional residential measures such as the improvement of duct systems or installation of insulation. Actors: x Austin City Council: Adopted the city's energy policy and established Austin Energy. x Austin Energy: Implement and evaluate the progress of the programme. x Commercial lenders (Velocity Credit Union): Offer low-interest loans for energy efficiency
improvements. x Partners of the scheme (engineers, designers, professionals): Provide technical advice to help
facilitate the programme's implementation.
Barriers: x Lack of energy efficiency experts and contractors. x Audits were happening after the financial incentive had been rewarded, which discouraged participation in
the early stages of the scheme. x High initial investment in testing equipment resulted in a shortage of contractors during the early stages of
implementation. Enablers for Implementation: x The programme was passed into law, thus increasing participation and successful implementation. x Programme's credibility increased by the successful communication and transparency between customers
and Austin Energy and customer's familiarity with ENERGY STAR brand appliances. x Contractors had experience with the retrofits offered by the programme. x Inspection and approval of work increased quality of retrofits and programme participation.
Funding: Austin Energy's budget for demand-side management activities funded the programme. Costs: Total costs from 2008 to 2013 for electric rebates and incentives provided by the programme were USD 108,969,056. Energy savings and associated emission reductions:

Non-technical summary of the DNV-GL report “Energy Efficiency Policy Case Studies”
Page 43 of 59 Author: Camilla Schramek January 2015
From 1982 to 2008, the programme had energy savings of 116,991 MWh and an average savings rate of 1700 kWh per year. Additionally, during this period, 2824 tonnes of carbon dioxide were avoided. From 2009 to 2013, the programme resulted in energy savings of 124,658 MWh. Benefits: 1. Reductions in energy demand: Energy savings of just below 23,800 MWh in 2013, which decreased
from a peak of 32,800 in 2009. 2. Mitigation of greenhouse gases: In 2013, the programme resulted in savings of 14,317 tonnes of CO2. 3. Improvement in air quality: No information available. 4. Macro-economic impacts: As of 2007, the total economic impact of the programme was USD 108
million. 5. Impacts on public budget: Information not available. 6. Creation of jobs: The programme has increased the number of employed contractors from 4 to 90 as of
2008. 7. Improvements in human health and wellbeing: As of 2009, the programme assisted 90 families
with low incomes in purchasing energy efficient homes. 8. Increased access to energy and reduced fuel poverty: N.A. 9. Benefits to energy providers: Energy efficiency projects decrease the load on the grid, thus enhancing
its reliability. 10. Other: The programme has increased local democratic participation of local leaders and grassroots
groups aimed at increasing energy efficiency.

Non-technical summary of the DNV-GL report “Energy Efficiency Policy Case Studies”
Page 44 of 59 Author: Camilla Schramek January 2015
Broad Policy Frameworks

Non-technical summary of the DNV-GL report “Energy Efficiency Policy Case Studies”
Page 45 of 59 Author: Camilla Schramek January 2015
Institutional and Regulatory Framework Development in Mexico Country: Mexico Sector: Energy efficiency general policies and development strategies
Stage: Ongoing
Type of policy/instrument: Institutional capacities, incentives, monitoring, and programme implementation
Period: Permanent
Description: Mexico aims to establish an effective institutional governance structure for energy efficiency. The country has established development plans, funding schemes, and specific regulations on energy and has created programmes to implement such plans. SENER (Secretaria de Energia, Energy Secretariat) has been established to design and conduct the national energy policy to guarantee an economically feasible and sustainable energy supply. The National Commission for the Efficient Use of Energy (CONUEE) was established within the Secretariat of Energy to promote energy efficiency and serve as the technical body on sustainable energy use. Various funding schemes and programmes have been implemented through this new regulatory framework. The Fund for the Energy Transition and Sustainable Energy (FORTEASE) finances both public and private sector energy efficiency and renewable energy projects. The Energy Sustainability Fund (FSE) finances research, development, and innovation projects on energy at universities and research centres. CONUEE's Work Programme aims to mitigate climate change and increase economic competition in the energy efficiency market by sharing information, supporting local governments, and standardizing energy efficiency. Nafinsa, a development banking institution, finances sustainable development projects implemented by companies and international financial intermediaries. Actors: x Secretaria de Energia, Energy Secretariat (SENAR): Design and conduct the national energy
policy; provide funds for FORTEASE and FSE. x National Commission for the Efficient Use of Energy (CONUEE): Implement national registry of
certified energy responsible users; issue recommendations on best practices for sustainable energy; verify compliance with existing energy efficiency laws; establish methodologies to quantify greenhouse gas emissions and energy use; provide technical assistance on sustainable energy use.
x Financial Institutions (Nacional Financiera (SNC), BANOBRAS, private banks): Structure funded credit lines to promote energy efficiency; lend to private and public customers for energy efficiency and renewable energy projects.
Barriers: x Efforts to increase energy efficiency focused only on the supply side and ignored demand-side measures
which would further reduce environmental impacts and costs in the energy system. x Lack of knowledge on energy efficiency incentives and lack of measures to increase energy efficiency that
corresponded with the price structure. x Lack of appropriate regulatory and institutional framework in early stages. x Does not cater to varying situations and circumstances faced by different energy customers. Enablers for Implementation: x Established a new and effective regulatory and institutional framework. x Increasing customers' awareness and access to energy efficiency markets and financing incentives.
Funding and costs: This is not a specific project, but a general regulatory framework. Thus, there are no publically available costs and funding figures. Energy savings and associated emission reductions: The table below shows the mitigation potential of energy efficiency by sector, given a 90% penetration rate of energy efficiency in its operations: Sector Mitigation Potential (TCO2/yr) Percentage (%) Residential 5,752,827 31.99

Non-technical summary of the DNV-GL report “Energy Efficiency Policy Case Studies”
Page 46 of 59 Author: Camilla Schramek January 2015
Municipal 861,716 4.79 Agricultural 1,582,569 8.80 Commercial 3,533,225 19.65 Industrial 6,253,966 34.77 Total 17,984,303 100.00 Benefits: 1. Reductions in energy demand: Improvements in energy efficiency have decreased energy demand. 2. Mitigation of greenhouse gases: Please refer to table above. 3. Improvement in air quality: N.A. 4. Macro-economic impacts: N.A. 5. Impacts on public budget: Energy efficiency improvements have decreased company's costs. 6. Creation of jobs: Increase in jobs available in energy efficiency sector to provide energy services to
customers and develop renewable energy projects. 7. Improvements in human health and wellbeing: N.A. 8. Increased access to energy and reduced fuel poverty: N.A.

Non-technical summary of the DNV-GL report “Energy Efficiency Policy Case Studies”
Page 47 of 59 Author: Camilla Schramek January 2015
Institutional Energy Efficiency Development and Long Term Planning in Spain Country: Spain Sector: Energy efficiency general policies and development strategies
Stage: Ongoing
Type of policy/instrument: Institutional Framework Capacity for Energy Efficiency
Period: 2011-2020
Description: Spain has established an institutional framework for effective energy efficiency development and implementation. The goal of this plan is to successfully implement a national energy efficiency and renewable energy strategy. The Institute for Energy Diversification and Savings (IDEA) was established to act as an autonomous institutional body that provides technical and financial services to improve energy efficiency and establish renewable energy. The State Secretary of Energy (SE) within the Ministry of Industry, Energy, and Tourism (MIET) is in charge of all functions of the State's General Administration relating to the energy sector. Spain sets objectives and goals for energy efficiency that involve the country's production sectors and consumers. The country monitors progress towards energy efficiency goals and invests in energy efficiency objectives. The goal of the plan is to improve energy intensity by 1.5% a year from 2011 to 2020. Spain aims to improve energy efficiency in the industry sector, transportation sector, building, equipment, and services sector, and agriculture and fisheries sector. Actors: x Ministry of Industry, Energy, and Tourism (MIET): Create standards on legislation of the energy
and mining sectors; form proposals for energy savings; implement actions to secure energy supply; prepare proposals on energy prices.
x Institute for Energy Diversification and Savings (IDEA): Implement studies in industry sectors; define technical measures on energy conservation; perform energy audits; administer funds for incentivized actions; establish renewable energies; promote energy savings and diversification of energy.
x European Commission: Establish rules, regulations, and energy efficiency objectives and monitoring.
Barriers: x Looked at energy efficiency issues from the supply side and ignored demand-side management measures. x Inadequate pricing system and structure to promote energy efficiency which resulted in a lack of financing
and economic incentives. x Lack of knowledge of energy efficiency and clean energy economic incentives. x Lack of appropriate regulatory and institutional framework. Enablers for Implementation: x Strong commitment by government and private sector to energy efficiency. x Establishment of a strong institutional framework with legal support and stable energy efficiency planning
process. x Independent entity, IDEA, in charge of energy efficiency planning and implementation. x European Commission rules provide structure and consistency to the development of energy efficiency
measures.
Funding: Funding provided by investments and finance channels from private agents and the public sector. Costs: Total costs of the plan amount to approximately 46 billion euros, which represents an annual average volume of investment worth 4.6 billion euros, 500 million of which is provided by the public sector. Energy savings and associated emission reductions: In 2004, 76,656 tonnes of CO2 were avoided and in 2007 65,252 tonnes of CO2 were avoided. Benefits:
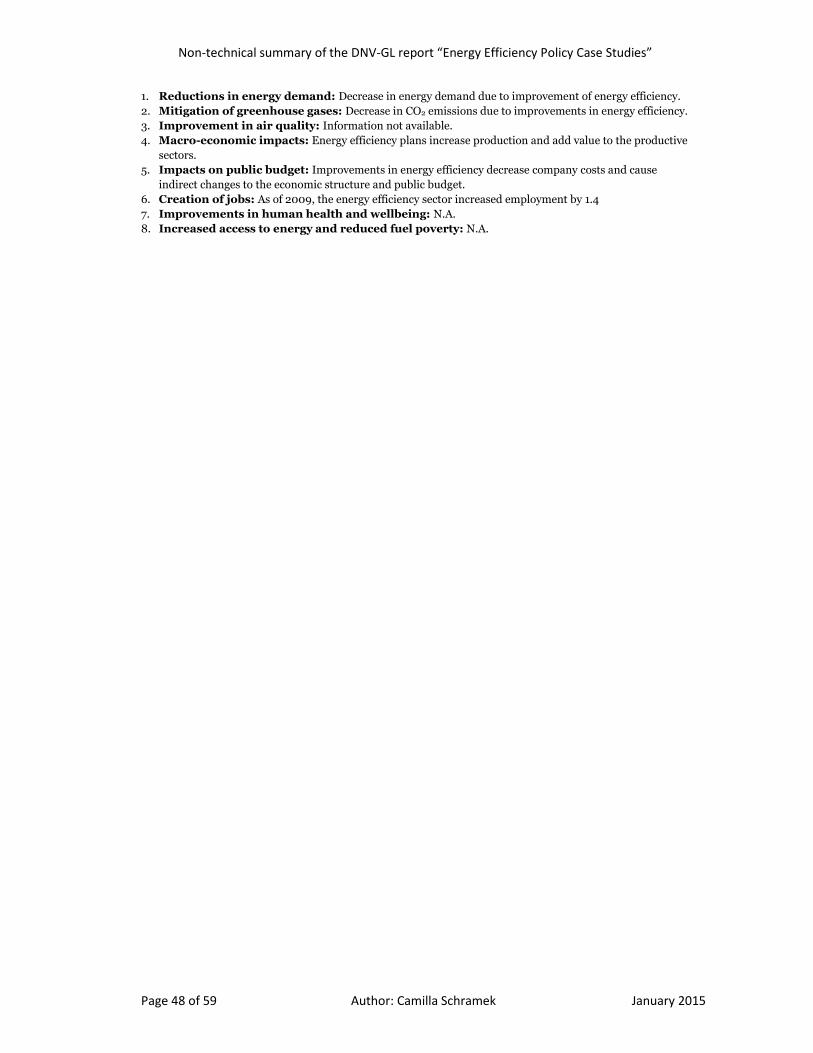
Non-technical summary of the DNV-GL report “Energy Efficiency Policy Case Studies”
Page 48 of 59 Author: Camilla Schramek January 2015
1. Reductions in energy demand: Decrease in energy demand due to improvement of energy efficiency. 2. Mitigation of greenhouse gases: Decrease in CO2 emissions due to improvements in energy efficiency. 3. Improvement in air quality: Information not available. 4. Macro-economic impacts: Energy efficiency plans increase production and add value to the productive
sectors. 5. Impacts on public budget: Improvements in energy efficiency decrease company costs and cause
indirect changes to the economic structure and public budget. 6. Creation of jobs: As of 2009, the energy efficiency sector increased employment by 1.4 7. Improvements in human health and wellbeing: N.A. 8. Increased access to energy and reduced fuel poverty: N.A.

Non-technical summary of the DNV-GL report “Energy Efficiency Policy Case Studies”
Page 49 of 59 Author: Camilla Schramek January 2015
Peru Reference Plan for the Efficient Use of Energy Country: Peru Sector: Commercial, Public, Residential, Industrial, and Services
Stage: Ongoing
Type of policy/instrument: Policy Framework
Period: 2009-2018
Description: Peru established an energy efficiency market to coordinate all of the energy efficiency policies and programmes in Peru to increase customer’s awareness of energy projects and strengthen their regulatory framework. The goal of the plan is to achieve annual energy savings of 15% by 2018 by implementing 125 energy efficiency projects in various sectors. The Ministry of Energy and Mining (MINEM) oversees and implements the programme. The programme has three components: energy efficiency services demand from customers, energy efficiency services supply from Energy Service Companies, and financial entities that finance energy efficiency projects. 106 of the projects aim to reduce energy consumption such as lighting markets transformation and energy efficiency standards and labelling programme and 19 are designed to measure the outcome. Actors: x Ministry of Mines and Energy, General Direction of Energy Efficiency (DGEE): Educate the
public, oversee energy efficiency programmes, plan energy efficiency projects, certify consultants and provide financial support.
x CENERGIA (Center for Conservation of Energy and the Environment): Promote the plan, provide technical assistance and training for research and development, organize forums and conferences on energy efficiency.
x Private and State-Owned Production Companies (Customers): Industrial, Commerce, and Services Companies; Energy Production and Transformation Companies: Develop energy audits and energy efficiency projects, implement the projects.
x Corporación Financiera de Desarrollo S.A. (COFIDE): Finances investments in energy efficiency projects.
Barriers: x Lack of political support at the time of implementation. x Lack of institutional coordination to optimize efforts to save energy. x Lack of knowledge on energy efficiency and working capacity to educate the public. Enablers for Implementation: Private banks and public institutions provide funding for energy efficiency projects.
Funding: DGEE had an annual budget of USD 0.5 million in 2010, USD 1.12 million in 2011, and USD 1.5 million in 2012. Costs: The implementation of the plan required an investment of USD 140 million and increases in annual investment each year to approximately USD 2.5 billion in 2034. Energy savings and associated emission reductions: The programmes established under the plan reduced CO2 emissions by 896 thousand tonnes in 2012. It is estimated that by 2040, the countries total GHG emissions will decrease by 6.8%. Benefits: 1. Reductions in energy demand: Energy demand is expected to decrease by 3401 petajoules. 2. Mitigation of greenhouse gases: From 2012 to 2040 GHG emissions are expected to decrease by 289
billion tonnes of CO2. 3. Improvement in air quality: N.A. 4. Macro-economic impacts: From 2012 to 2040, savings from the National Energy Efficiency Plan are
expected to be USD 94.8 billion and energy efficiency programmes are expected to add economic benefits of USD 1.95 billion.

Non-technical summary of the DNV-GL report “Energy Efficiency Policy Case Studies”
Page 50 of 59 Author: Camilla Schramek January 2015
5. Impacts on public budget: Reduction of electricity demand by approximately 31 MW in 2016. 6. Creation of jobs: May lead to increased jobs on energy efficiency projects. 7. Improvements in human health and wellbeing: Various energy efficiency programmes have been
implemented that reduce emissions that negatively impact human health. 8. Increased access to energy and reduced fuel poverty: Various projects such as “Light for All” and
“Benchmark Plan for Efficient Use of Energy” have increased access to renewable energy benefiting millions of people.

Non-technical summary of the DNV-GL report “Energy Efficiency Policy Case Studies”
Page 51 of 59 Author: Camilla Schramek January 2015
Benchmarking in Industry

Non-technical summary of the DNV-GL report “Energy Efficiency Policy Case Studies”
Page 52 of 59 Author: Camilla Schramek January 2015
India’s Perform Achieve and Trade (PAT) Scheme Country: India Sector: Industrial
Stage: In progress
Type of policy/instrument: Benchmarking industry performance with incentive strategies and marketable permits
Period: 2012-2015
Description: India implemented the PAT scheme to expand its energy efficiency programmes. PAT is a market-based scheme, which aims to facilitate industrial investment in energy efficiency through the trading of energy savings certificates. The scheme’s goal is for industrial sectors to achieve a reduction of 10 million tonnes of oil equivalent energy. Consumers that can show that they have achieved their target reductions in energy are eligible to receive energy savings certificates. The Bureau of Energy Efficiency in India designed the scheme and oversees its implementation. The PAT scheme mandates the participation of the power, cement, iron and steel, chlor-alkali, aluminium, textile, pulp and paper, and fertilizer industrial sectors. Each of these sectors is expected to reduce their energy use to an amount proportional to their consumption. The certificates issued represent one metric tonne of oil equivalent, these energy certificates can then be traded. Consumers that do not meet their target can purchase energy certificates or pay a penalty of USD 18,000. The PAT scheme consists of four phases:
1. Target Setting Phase: Each company is given a Specific Mandated Energy Consumption (SEC) based on their energy use.
2. Target Achieve Phase: The company has three years to reach their SEC target. 3. Measure and Verification (M&V) Phase: Energy audits from accredited agencies are conducted to
verify energy savings. 4. Trading Phase: Companies that exceed their targets are awarded a creditable trade permit that allows
them to sell the permits to industries that did not reach their target. Actors: x Bureau Energy Efficiency (BEE): Implement and designed the PAT scheme and regulate the energy
savings certificates. x Designated Energy Auditor (DENA): Certified 3rd party experts that perform PAT related activities
such as collecting baseline data and monitoring and verification. x Central Registry (CR): Maintain the electronic form of all transactions under the PAT scheme and
make this information public. x State Designated Agencies (SDA): Determine the penalties for designated consumers that do not
comply with the scheme. x Ministry of Power (MOP): Develop the implementation framework for the PAT scheme.
Barriers: x Lack of knowledge and experience with energy efficiency technologies and financing of such measures,
which slowed the progress of the scheme. x Large up-front costs associated with the implementation of the scheme and the purchase of energy
efficient products. x Lack of stakeholders that can develop the projects and managers that can consult on and oversee the
implementation of the projects. x Difficulty in setting appropriate energy reduction targets. Enablers for Implementation x Securing stakeholder participation and buy-in early on to sustain stakeholder engagement. x Collecting valid and credible data to monitor the programme, set goals, and establish accurate baselines. x Investing in strengthening institutional and human capacity.
Funding: Exact figures on funding are unknown. Total investment costs for industry from 2011-2014 were estimated to be USD 5.37 billion, most of which was spent across the eight sectors involved in the PAT scheme. Costs:

Non-technical summary of the DNV-GL report “Energy Efficiency Policy Case Studies”
Page 53 of 59 Author: Camilla Schramek January 2015
The Indian government allocated approximately USD 13 million for the PAT scheme from 2011-2014. Energy savings and associated emission reductions: The government estimates that, by the end of 2015, the PAT scheme will reduce carbon emissions by 100 million metric tonnes. Benefits: 1. Reductions in energy demand: The government estimates that, by the end of 2015, the energy savings
certificate market will be worth USD 16 billion. 2. Mitigation of greenhouse gases: By the end of 2015, the government estimates that carbon emissions
will be reduced by 100 million metric tonnes. 3. Improvement in air quality: Information not available. 4. Macro-economic impacts: The PAT scheme will lead to approximately USD 1 billion in savings by
fiscal year 2014-2015. 5. Impacts on public budget: Information not available. 6. Creation of jobs: Information not available. 7. Improvements in human health and wellbeing: N.A. 8. Increased access to energy and reduced fuel poverty: N.A. 9. Benefits to energy providers: Reduced energy demand from energy-intensive industry sectors.

Non-technical summary of the DNV-GL report “Energy Efficiency Policy Case Studies”
Page 54 of 59 Author: Camilla Schramek January 2015
The Malaysia Industrial Energy Efficiency Improvement Project (MIEEIP) Country: Malaysia Sector: Industry wide
Stage: Finished (2007)
Type of policy/instrument: Benchmarking in Industry
Period: 1999-2007
Description: The main objective of the project was to remove barriers to improve energy efficiency in the industrial sector. The project improved the technical and economic potential for energy efficiency initiatives in Malaysia. The MIEEIP achieved the establishment of sub-sectorial energy benchmarks, promotion of energy audits, successful implementation of energy rating programmes, documentation and disseminating of information on energy efficiency, training of local energy service companies (ESCOs), and implementation of energy efficient technology. Pusat Tenaga Malaysia (PTM) on behalf of the Ministry of Water, Energy, and Communications (MEWC) coordinated with private sector partners to implement the programme. A Project Implementation Unit (PIU) was established to ensure that projects were completed in a timely manner and complied with specific criteria. To ensure the successful implementation of the project, it was broken up into eight different components: Energy Use Benchmarking Programme, Energy Auditing Programme, Energy Rating Programme, Energy Efficiency Promotion Programme, ESCO Support Programme, Energy Technology Demonstration Programme, Local Energy Efficient Equipment Manufacturing Support Programme. A Component Project Manager and a Technical Advisor supervised each component. The MIEEIP programme focused on increasing the energy efficiency in the wood, rubber, food, ceramics, glass, pulp & paper, iron & steel, cement, plastics, textile, and oleo-chemical industries. Actors: x The Ministry of Energy, Water and Communications (MEWC): Facilitate and regulate the
Malaysian electricity sectors. Supervised and implemented the MIEEIP. x The Energy Commission (Suruhanjaya Tenaga, ST): Provided technical assistance and regulation
for the electricity industry. x The Malaysia Energy Centre (Pusat Tenaga Malaysia, PTM): Coordinated and managed energy
research and development and demonstration projects for the MIEEIP. x Multilateral Lending Institutions (UN Development Programme (UNDP) and the Global
Environment Facility (GEF): Provided funding for the implementation, monitoring, and evaluation of the MIEEIP.
Barriers: x Lack of political foundation and planning for the promotion and implementation of energy efficiency
projects. x The highly subsidized energy prices in Malaysia. x Lack of long-term government support after the projects completion to ensure long-term sustainability of
the projects. Enablers for Implementation:
x Capacity strengthening and increased awareness of energy efficiency. x The programme enabled institutional and organizational coordination. x Financing and demonstration projects that enticed industry to promote energy efficiency in their own
operations.
Funding: The government provided domestic funds of USD 7,929,600, the private sector contributed USD 5,260,000, and the UNDP/GEF provided USD 7,300,600 to fund the project. Costs: From 1999, total expenditures on the project were USD 13,282,795. Energy savings and associated emission reductions:

Non-technical summary of the DNV-GL report “Energy Efficiency Policy Case Studies”
Page 55 of 59 Author: Camilla Schramek January 2015
Over 250 companies implemented energy efficiency projects, which led to annual average energy savings of 3.2 million GJ. Energy savings led to an annual reduction in CO2 emissions of approximately 944.7 kilo tonnes. Benefits: 1. Reductions in energy demand: Energy savings of 3.2 million GJ per year. 2. Mitigation of greenhouse gases: Cumulative emission reduction of 1.81 million tCO2. Indirect
cumulative emission reduction of 9.45 million tCO2. 3. Improvement in air quality: No information available. 4. Macro-economic impacts: Expansion of energy efficiency businesses and services. 5. Impacts on public budget: Increase in volume of investments by USD 14.4 million; two banks
established of funds for sustainable energy; investment in energy efficiency of RM 40 million from 2006-2007.
6. Creation of jobs: No information available. 7. Improvements in human health and wellbeing: No information available. 8. Increased access to energy and reduced fuel poverty: No information available. 9. Benefits to energy providers: Provided industries with best practices in energy efficiency endeavours;
increased the number of trained energy experts and professionals; increased production of energy efficient equipment.

Non-technical summary of the DNV-GL report “Energy Efficiency Policy Case Studies”
Page 56 of 59 Author: Camilla Schramek January 2015
The Northwest Energy Efficiency Alliance (NEEA) Country: USA, North-Western states (Idaho, Montana, Oregon, and Washington) Sector: Industry- Food Processing
Stage: Ongoing yearly implementation since 2006
Type of policy/instrument: Management and finance consulting, training, goal and benchmark setting and energy information services
Period: 2006 - present
Description: The NEEA seeks to integrate sustainable energy into the food-processing sector by supporting company’s implementation of Continuous Energy Improvement (CEI) systems. Consultants and advisors aid participating companies in their implementation of sustainable energy initiatives. Member companies are enrolled in the Northwest Food Processors Association (NWFPA) and thus commit to energy reduction goals. The NEEA implements the program and oversees daily operations. The CEI system aids firms in permanently improving their energy performance by training the staff, tracking energy use, setting energy reduction goals, developing and updating an energy management plan, and quantifying energy savings from energy efficient upgrades and from O&M improvements. Actors: x Northwest Energy Efficiency Alliance (NEEA): Implement the programme and oversee daily
operations and services. x US Department of Energy (DOE): Finance the programme and provide training on energy
management for industrial systems. x US Environmental Protection Agency (EPA): Finance the programme and provide Energy Star
recognition. x Energy Trust of Oregon and the Bonneville Power Administration: Regional programmes that
provide funding and resources to programme participants in their territories. x Northwest Food Processors Association: Responsible for energy management systems and recruit
member companies. x Northwest Utilities: Provide technical and capacity building programme support.
Barriers: x Lack of coordination between key actors. x Lack of monitoring and evaluation capacity among contractors. x Contractors have limited supply channel to public utility. Enablers for Implementation x Member companies operate multiple facilities, which enables them to achieve economies of scale. x Capacity of contractors is adequate to met market demands.
Funding: The Department of Energy provides funding for training on energy management. The Energy Trust of Oregon and Bonneville Power Administration fund facilities in their territories. Costs: Exact costs of the programme have not been determined. Total expenses from Q2 in 2014 were USD 16,654,000. Energy savings and associated emission reductions: An assessment of 32 plants in 2014 found that 0.4 annual megawatts (aMW) and nearly 300,000 therms were saved annually. Total electric savings from CEI cohort participants were 0.64 aMW and net savings from CEI alone were 0.23 aMW. Benefits: 1. Reductions in energy demand: Total electric savings from CEI cohort participants were 0.63 aMW
and net savings from CEI were 0.23 aMW, 2. Mitigation of greenhouse gases: Information not available. 3. Improvement in air quality: Information not available.

Non-technical summary of the DNV-GL report “Energy Efficiency Policy Case Studies”
Page 57 of 59 Author: Camilla Schramek January 2015
4. Macro-economic impacts: Programme has paid approximately USD 73.5 million in incentives to over 4,000 customers for projects that represent over USD 926 million in lifetime savings.
5. Impacts on public budget: Information not available. 6. Creation of jobs: Increased jobs for local contractors and consultants. 7. Improvements in human health and wellbeing: Information not available. 8. Increased access to energy and reduced fuel poverty: N.A. 9. Benefits to energy providers: Facilities continued sustainable energy management after leaving the
programme. Increased awareness of sustainable energy. Other utilities have implemented this initiatives design outside of the Northwest.

Non-technical summary of the DNV-GL report “Energy Efficiency Policy Case Studies”
Page 58 of 59 Author: Camilla Schramek January 2015
Programme for Energy Efficiency in Energy Intensive Industry (PFE) Country: Sweden Sector: Industry
Stage: Ongoing
Type of policy/instrument: Incentives for Industry
Sub-Sector: Manufacturing Industry
Period: 2005 - present
Description: The PFE is a voluntary programme, which aims to make the energy manufacturing industry’s production process more efficient by decreasing their energy cost, educating employees on energy efficiency, and reducing the industry’s environmental impact. PFE’s main objective is to make industry the central actor in an economically and environmentally sustainable energy system. The programme introduced an energy tax on electricity, which raised the price of energy from 0 to 0.5 öre/kWh. However, Swedish companies that volunteer to participate in the programme are exempt from the energy tax. The Swedish Energy Agency holds decision-making power and approves programme participants. For companies to obtain acceptance into the programme they must meet one out of two criteria: (1) cost of bought and produced energy for the company must be at least 3% of its production value (2) the company’s taxes on energy. CO2, and sulphur must be at least 0.5% of the company’s added value. To receive exemption from the energy tax, companies commit to a five-year process. During the first two years of the programme companies are required to get certified to the Swedish standard for energy management, perform an inventory analysis, establish a routine for the purchase of power intensive equipment, and establish a routine for planning of development projects and restoration. During the last three years of a the programme companies are required to implement the actions they submitted to the Energy Agency, continue to apply their introduced energy management system, demonstrate the impacts of the purchasing routines, and assess the impacts of the routine for planning. Actors: x Swedish Energy Agency: Responsible for the implementation of the programme. x Swedish Standards Institute: Responsible for emitting standards and established the specifications of
the Energy Management Systems implemented by companies in the programme.
Barriers: x PFE poorly defined their goals and did not accurately account for energy savings. x Failure to establish clear targets has made it challenging to judge the success of the programme. x Double counting often occurs due to overlapping policy instruments. Enablers for Implementation: x Provide participants with resources such as manuals on energy audits and templates for life cycle costing. x Provide technical assistance and training. x Conduct workshops and seminars for programme participants and best practice dissemination. x Many firms educate their employees on energy issues due to the energy management system.
Funding: Government provides funding for administrative issues related to planning, implementation, and evaluation of the policy. Costs: Total government costs from 2004 to 2009 were approximately 792 MSEK; during that same period companies that participated in the programme invested almost 1,120 MSEK. Energy savings and associated emission reductions: During the first five-year phase, participating companies reported estimated savings from the investments in energy efficiency between 0.689 and 1.015 TWh. These companies made investments of USD 102 million in more than 1,200 electricity efficiency measures. The companies reported electricity savings of just under 1 TWh per year, which would result in reducing 0.5-1 million tonnes of CO2 emissions annually. Benefits: 1. Reductions in energy demand: During the first 5 years of the programme, electricity savings
surpassed expectations and were between 0.689 and 1.015 TWh.
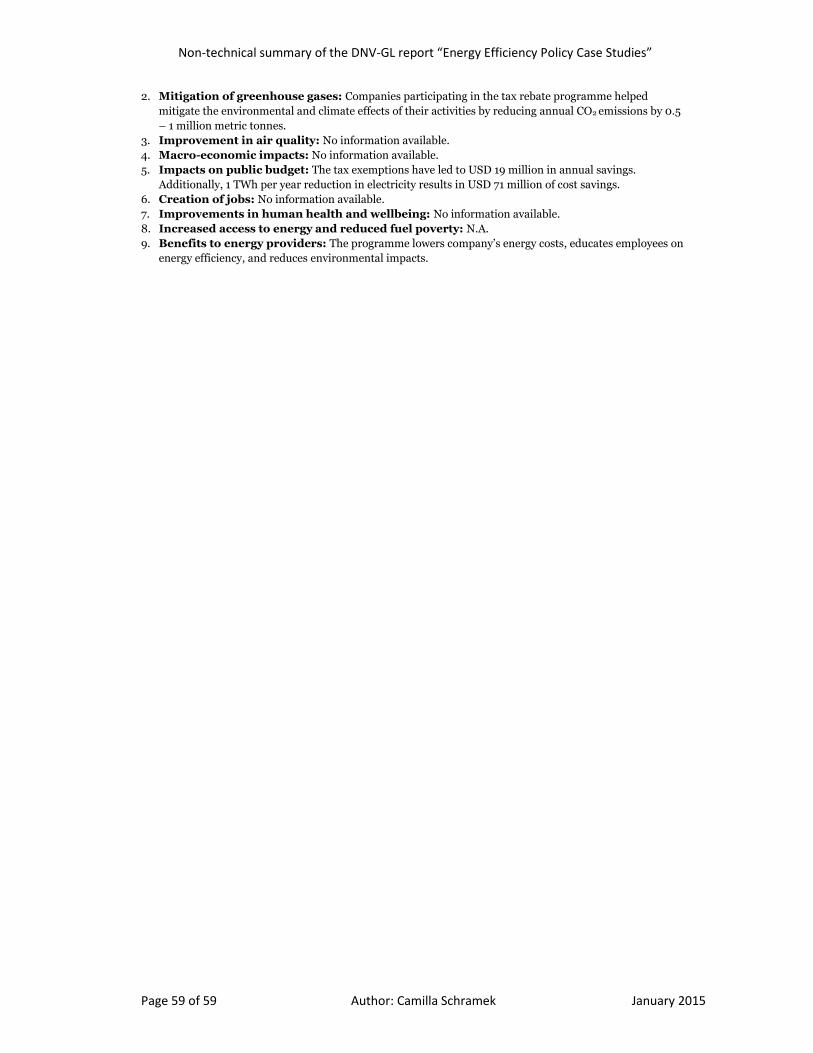
Non-technical summary of the DNV-GL report “Energy Efficiency Policy Case Studies”
Page 59 of 59 Author: Camilla Schramek January 2015
2. Mitigation of greenhouse gases: Companies participating in the tax rebate programme helped mitigate the environmental and climate effects of their activities by reducing annual CO2 emissions by 0.5 – 1 million metric tonnes.
3. Improvement in air quality: No information available. 4. Macro-economic impacts: No information available. 5. Impacts on public budget: The tax exemptions have led to USD 19 million in annual savings.
Additionally, 1 TWh per year reduction in electricity results in USD 71 million of cost savings. 6. Creation of jobs: No information available. 7. Improvements in human health and wellbeing: No information available. 8. Increased access to energy and reduced fuel poverty: N.A. 9. Benefits to energy providers: The programme lowers company’s energy costs, educates employees on
energy efficiency, and reduces environmental impacts.