energy efficiency technologies annex i - world energy … · 2017-04-25 · energy efficiency...
TRANSCRIPT
Energy Efficiency
Technologies
ANNEX I
Technical Report
Energy Efficiency Potentials and
Barriers for Realization
in the Industry Sector
WEC Knowledge Network
July 2013

This report has been prepared by Siemens
for the customer and for its own purposes
with due diligence and thoroughness in
accordance with its general terms and
conditions of business.
Siemens shall accept no liability for
applications that extend beyond the remit
described in the order. Furthermore Siemens
shall accept no liability toward third parties to
whom this report or parts thereof become
known. In particular no obligations can be
derived by third parties vis-à-vis Siemens.
Authors:
Katja Barzantny,
Jörg Meyer,
Edwin Koenig,
Maximilian Haverkamp, Andreas Trautmann,
Udo Niehage
Victoria Orioli
Aachen, June 20, 2013
Andreas Trautmann
Dr. Katja Barzantny
Project responsible Project leader
Siemens Industry, Customer Services

Content
1 SUMMARY ..................................................................................................... 4
2 BACKGROUND AND OBJECTIVES .............................................................. 4
3 METHODOLOGY ........................................................................................... 5
4 OVERVIEW KEY RESULTS........................................................................... 9
4.1 COUNTRY ANALYSIS ......................................................................................... 9
4.1.1 GERMANY ...................................................................................................... 9
4.1.2 FURTHER COUNTRIES ....................................................................................10
4.1.3 EU27 AND GLOBAL .....................................................................................18
4.2 ANALYSIS OF THE BRANCHES ...........................................................................20
4.2.1 FOOD AND BEVERAGES .................................................................................21
4.2.2 MINERALS .....................................................................................................21
4.2.3 PULP AND PAPER ...........................................................................................21
4.3 PRODUCT ANALYSIS ........................................................................................22
4.3.1 ENERGY EFFICIENT MOTORS (LOW VOLTAGE) ..................................................23
4.3.2 FREQUENCY CONVERTER FOR SPEED CONTROL ..............................................23
4.3.3 ENERGY DATA MANAGEMENT SYSTEMS (EDMS) .............................................23
4 CRITICAL APPRAISAL AND ANALYSIS OF THE BARRIERS ......................24
4.1 CRITICAL APPRAISAL ........................................................................................24
4.2 ANALYSIS OF BARRIERS ...................................................................................25
5 APPENDIX ....................................................................................................27
5.1 SOURCES .......................................................................................................27
5.2 ABBREVIATIONS ..............................................................................................27
5.3 GLOSSAR .......................................................................................................29
Page 4 of 30
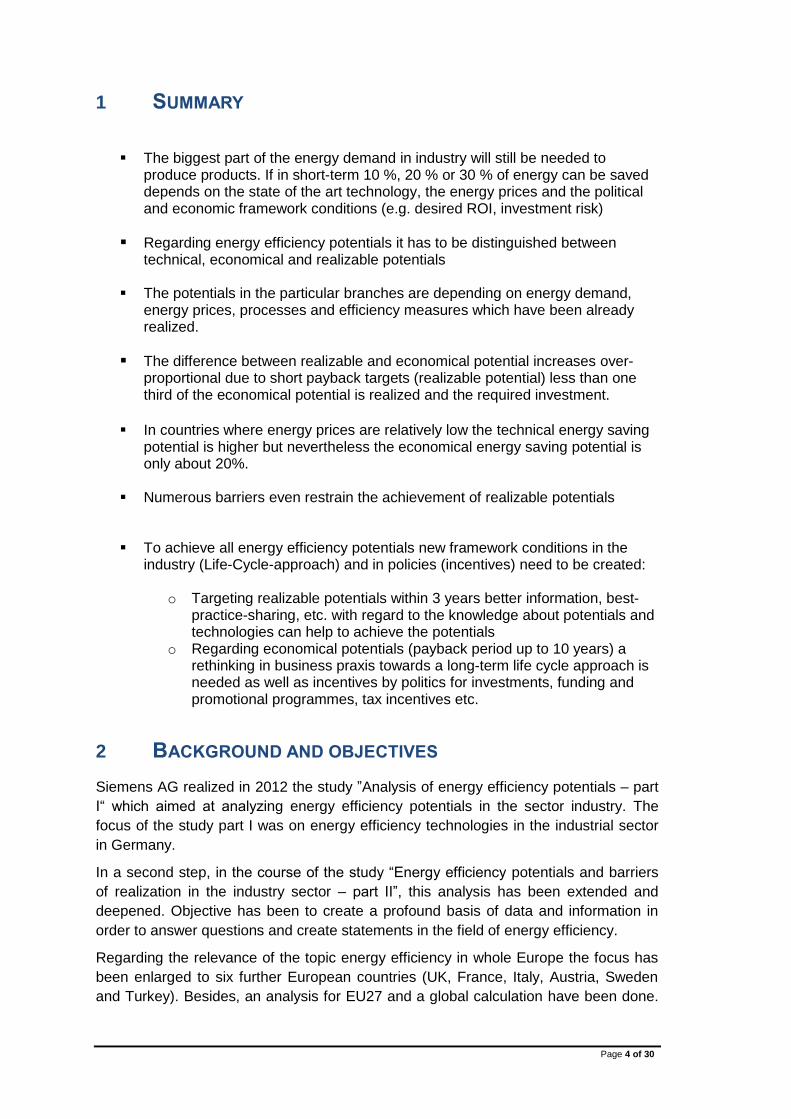
1 SUMMARY
The biggest part of the energy demand in industry will still be needed to produce products. If in short-term 10 %, 20 % or 30 % of energy can be saved depends on the state of the art technology, the energy prices and the political and economic framework conditions (e.g. desired ROI, investment risk)
Regarding energy efficiency potentials it has to be distinguished between technical, economical and realizable potentials
The potentials in the particular branches are depending on energy demand, energy prices, processes and efficiency measures which have been already realized.
The difference between realizable and economical potential increases over-proportional due to short payback targets (realizable potential) less than one third of the economical potential is realized and the required investment.
In countries where energy prices are relatively low the technical energy saving potential is higher but nevertheless the economical energy saving potential is only about 20%.
Numerous barriers even restrain the achievement of realizable potentials
To achieve all energy efficiency potentials new framework conditions in the industry (Life-Cycle-approach) and in policies (incentives) need to be created:
o Targeting realizable potentials within 3 years better information, best-practice-sharing, etc. with regard to the knowledge about potentials and technologies can help to achieve the potentials
o Regarding economical potentials (payback period up to 10 years) a rethinking in business praxis towards a long-term life cycle approach is needed as well as incentives by politics for investments, funding and promotional programmes, tax incentives etc.
2 BACKGROUND AND OBJECTIVES
Siemens AG realized in 2012 the study ”Analysis of energy efficiency potentials – part
I“ which aimed at analyzing energy efficiency potentials in the sector industry. The
focus of the study part I was on energy efficiency technologies in the industrial sector
in Germany.
In a second step, in the course of the study “Energy efficiency potentials and barriers
of realization in the industry sector – part II”, this analysis has been extended and
deepened. Objective has been to create a profound basis of data and information in
order to answer questions and create statements in the field of energy efficiency.
Regarding the relevance of the topic energy efficiency in whole Europe the focus has
been enlarged to six further European countries (UK, France, Italy, Austria, Sweden
and Turkey). Besides, an analysis for EU27 and a global calculation have been done.

Page 5 of 30
Furthermore an in-depth analysis for three particular technologies/products of the
sector industry (energy efficient motors, frequency converters for speed control and
energy data management systems) for the German market has been realized. Also an
analysis of energy efficiency potentials in three branches (food & beverage, minerals,
pulp & paper) has been done.
3 METHODOLOGY
Based on the results and the methodology of part I of the study first of all the energy
saving potentials for the chosen fields of analysis (countries, technologies/products
and branches) have been calculated. According to this the market potentials have
been estimated.
Three different types of potentials have been regarded:
The energy saving potential, in others words the potential regarding electricity, fuels and heat amounts
The energy cost saving potential, meaning costs for electricity, fuels and heat The market potential, meaning the needed investment sum to achieve a certain
energy efficiency potential.
Moreover potentials for diverse framework conditions have been calculated:
The “technical potential” comprises the use of the best available energy efficiency technologies in all applications without taking in consideration economical constraints.
The “economical potential” contains the use of energy efficiency technologies in applications when the use of the technology is economical taking into account the life cycle of the technology (meaning the internal rate of return (IRR) is bigger than 8 %)
the “realizable potential“ takes into consideration that energy efficiency technologies mostly are only used when a certain payback time is fulfilled (here: 3 years)
No estimations have been done within this study for the “realistic potential”, meaning
the potential taking also in consideration further barriers like political, financial, barriers
as to timing etc.

Page 6 of 30
Fig. 1: Definition – potential
For the country analysis, including EU27 and global, the methodology of part I of the
study for Germany has been used, meaning a top-down-approach. Therefore the
individual energy demand of the country for the industry sector as well as a specific
categorisation of technologies/applications is used.
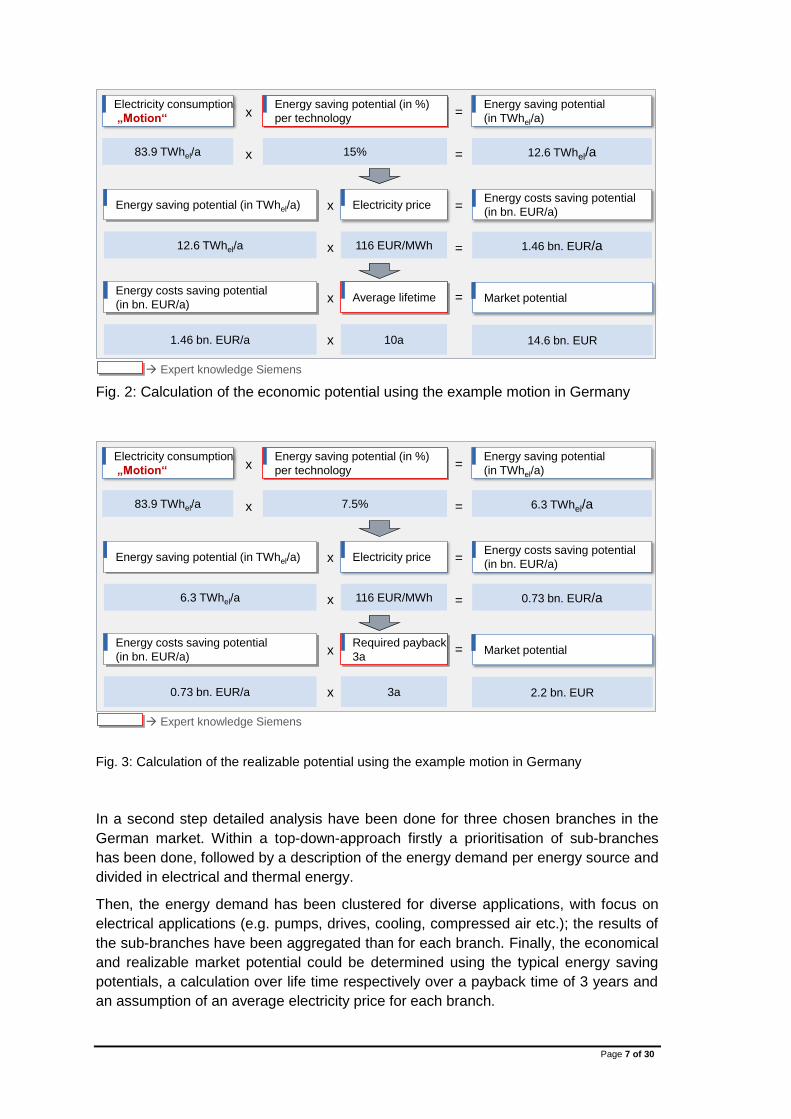
The example of the technology resp. application “motion” (electrical drives for transport
or conveyor systems etc.) for Germany according to the following two pictures shows
how the economical and realizable market potential is deduced for each technology.
The mentioned percentages for the energy saving potential differ a) by
technology/application and b) according to the considered time period (average life
cycle versus payback period of 3 years). These numbers are based on experiences of
Siemens and they are considered the same for all the chosen countries regarding the
particular technologies/applications. Calculating the sum over all relevant
technologies/applications (motion, EDMS, compressed air etc.) both the economical
and the realizable market potential can be deduced for a country.
Page 7 of 30
Fig. 2: Calculation of the economic potential using the example motion in Germany
Fig. 3: Calculation of the realizable potential using the example motion in Germany
In a second step detailed analysis have been done for three chosen branches in the
German market. Within a top-down-approach firstly a prioritisation of sub-branches
has been done, followed by a description of the energy demand per energy source and
divided in electrical and thermal energy.
Then, the energy demand has been clustered for diverse applications, with focus on
electrical applications (e.g. pumps, drives, cooling, compressed air etc.); the results of
the sub-branches have been aggregated than for each branch. Finally, the economical
and realizable market potential could be determined using the typical energy saving
potentials, a calculation over life time respectively over a payback time of 3 years and
an assumption of an average electricity price for each branch.
Electricity consumption
„Motion“
Energy saving potential (in %)
per technologyx =Energy saving potential
(in TWhel/a)
Market potential=Average lifetimeEnergy costs saving potential
(in bn. EUR/a)
Expert knowledge Siemens
12.6 TWhel/a83.9 TWhel/a 15% =x
10a1.46 bn. EUR/a 14.6 bn. EUR
x
x
=Energy costs saving potential
(in bn. EUR/a)
1.46 bn. EUR/a=
Electricity priceEnergy saving potential (in TWhel/a)
116 EUR/MWh12.6 TWhel/a
x
x
Electricity consumption
„Motion“
Energy saving potential (in %)
per technologyx =Energy saving potential
(in TWhel/a)
Market potential=Required payback
3a
Energy costs saving potential
(in bn. EUR/a)
Expert knowledge Siemens
6.3 TWhel/a83.9 TWhel/a 7.5% =x
3a0.73 bn. EUR/a 2.2 bn. EUR
x
x
=Energy costs saving potential
(in bn. EUR/a)
0.73 bn. EUR/a=
Electricity priceEnergy saving potential (in TWhel/a)
116 EUR/MWh6.3 TWhel/a
x
x

Page 8 of 30
The choice of the particular technologies has been done taking into account core
products of the industrial sector. To get best possible meaningful results the analysis
for energy efficient motors and frequency converters for speed control have been done
using a bottom-up approach. Based on the choice of relevant motors (low voltage)
respectively relevant applications for frequency converters a determination of the
number and distribution over the particular power classes and applications has been
done. Moreover, the share of already installed efficient motors resp. applications with
speed control has been taken into consideration. Finally, the economical (considering
life time) and the realizable (considering 3 years payback time) market potential has
been calculated taking into account the defined costs for motors respectively the
average price for frequency converters.
Contrary to this approach a top-down approach has been used for the analysis for
energy efficiency potentials of energy data management systems (EDMS). A bottom-
up approach was not possible to realize as no utile data for currently used EDMS in
Germany is available. Also an exact definition of the product is difficult.
First of all the yearly energy costs have been determined for the industry branches
based on the calculation of the electrical and thermal energy demand in the industry
divided in branches. The calculation of the economical energy saving potential of the
energy efficiency technologies until 2020 has been done using the study “Energy
efficiency – the intelligent energy source” by BMU (2009); so, finally the economical
(life time) and the realizable (payback time 3 years) market potential could also be
calculated.

Page 9 of 30
4 OVERVIEW KEY RESULTS
This analysis of energy efficiency potentials provides – taking into account the
mentioned assumptions – the following key results for the chosen countries, branches
and technologies.
4.1 COUNTRY ANALYSIS
4.1.1 GERMANY
The sector industry in Germany needed in 2010 222 TWh electricity and 498 TWh
thermal energy.
The economical energy saving potential amounts 42 TWhel/a (19 %) respectively
157 TWhth/a (31.5 %) and can be achieved with an investment of 44 bn Euro in the
field of electricity and 49 bn Euro in the field of thermal energy.
Considering a payback time of 3 years usually required by industrial companies the
energy saving potential is “only” 15 TWhel/a and 63 TWhth/a; requiring an investment
sum of 5 bn Euro in the field of electricity resp. 8 bn Euro in the field of thermal
energy.
It is remarkable that the economical energy saving potential in the German industry
amount to about 80 TWhth/a (16 % of 498 TWhth/a) thermal energy used for process
heat.
Large economical energy saving potential for electrical applications exist especially in
the field of motion with 12.6 TWhel/a out of 83.9 TWhel/a (15 %). The potential in the
field of energy are currently also in the focus of policies.

Page 10 of 30
Fig. 4: Economical potentials in Germany
Fig. 5: Realizable potentials in Germany
4.1.2 FURTHER EUROPEAN COUNTRIES
12,6 TWhel
4,4 TWhel
10,0 TWhth
79,7 TWhth
3,9 TWhel 0,4 TWhel
6,5 TWhel
2,2 TWhel
0,2 TWhel
0,8 TWhel
59,8 TWhth
3,3 TWhel
7,5 TWhth
8,0 TWhel
0
5
10
15
0 10,000 20,000 30,000
Payback in years
Market potential (Invest in Mio. €)
Motion Energy Data Management Heat generation & distribution
Process cooling Power quality Compressed air
Hydraulics Process water filtering Automation
HVAC Lighting
6,3 TWhel
2,2 TWhel
4,0 TWhth
27,9 TWhth
1,1 TWhel 0,2 TWhel
2,5 TWhel
1,0 TWhel
0,1 TWhel
0,4 TWhel
27,9 TWhth
1,1 TWhel
2,5 TWhth
0,8 TWhel
0
1
2
3
4
5
0 2,000 4,000
Payback in years
Market potential (Invest in Mio. €)
Motion Energy Data Management Heat generation & distribution
Process cooling Power quality Compressed air
Hydraulics Process water filtering Automation
HVAC Lighting
Page 11 of 30
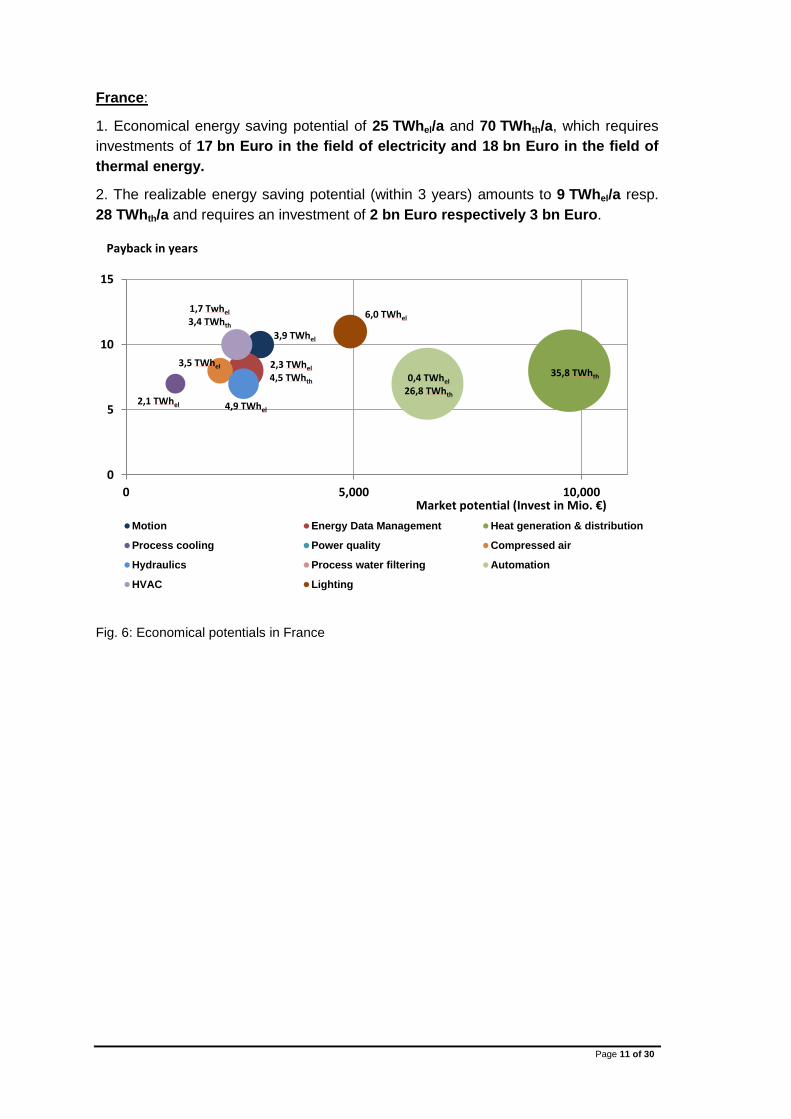
France:
1. Economical energy saving potential of 25 TWhel/a and 70 TWhth/a, which requires
investments of 17 bn Euro in the field of electricity and 18 bn Euro in the field of
thermal energy.
2. The realizable energy saving potential (within 3 years) amounts to 9 TWhel/a resp.
28 TWhth/a and requires an investment of 2 bn Euro respectively 3 bn Euro.
Fig. 6: Economical potentials in France
3,9 TWhel
2,3 TWhel
4,5 TWhth 35,8 TWhth
2,1 TWhel
3,5 TWhel
4,9 TWhel
0,4 TWhel
26,8 TWhth
1,7 Twhel
3,4 TWhth
6,0 TWhel
0
5
10
15
0 5,000 10,000
Payback in years
Market potential (Invest in Mio. €)
Motion Energy Data Management Heat generation & distribution
Process cooling Power quality Compressed air
Hydraulics Process water filtering Automation
HVAC Lighting
Page 12 of 30
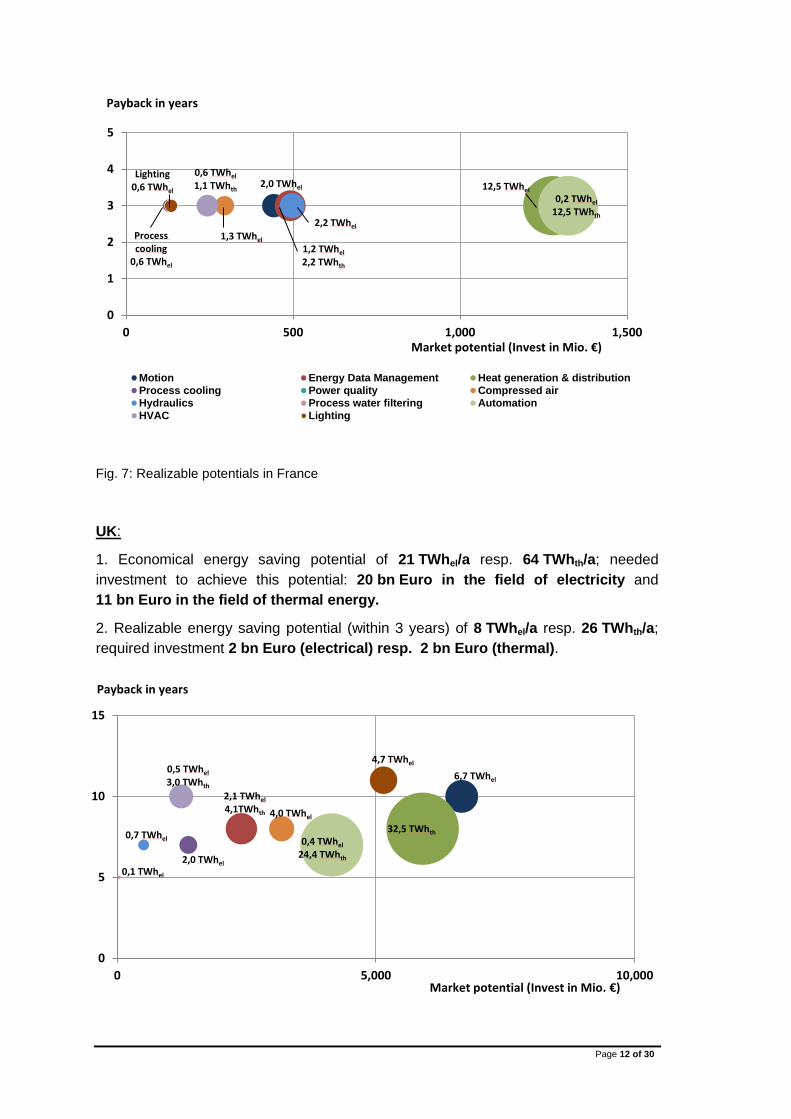
Fig. 7: Realizable potentials in France
UK:
1. Economical energy saving potential of 21 TWhel/a resp. 64 TWhth/a; needed
investment to achieve this potential: 20 bn Euro in the field of electricity and
11 bn Euro in the field of thermal energy.
2. Realizable energy saving potential (within 3 years) of 8 TWhel/a resp. 26 TWhth/a;
required investment 2 bn Euro (electrical) resp. 2 bn Euro (thermal).
2,0 TWhel
1,2 TWhel
2,2 TWhth
12,5 TWhel
Process cooling
0,6 TWhel
1,3 TWhel
2,2 TWhel
0,2 TWhel
12,5 TWhth
0,6 TWhel
1,1 TWhth Lighting
0,6 TWhel
0
1
2
3
4
5
0 500 1,000 1,500
Payback in years
Market potential (Invest in Mio. €)
Motion Energy Data Management Heat generation & distribution
Process cooling Power quality Compressed air
Hydraulics Process water filtering Automation
HVAC Lighting
6,7 TWhel
2,1 TWhel
4,1TWhth
32,5 TWhth
2,0 TWhel
4,0 TWhel
0,7 TWhel
0,1 TWhel
0,4 TWhel
24,4 TWhth
0,5 TWhel
3,0 TWhth
4,7 TWhel
0
5
10
15
0 5,000 10,000
Payback in years
Market potential (Invest in Mio. €)

Page 13 of 30
Fig. 8: Economical potentials in the UK
Fig. 9: Realizable potentials in the UK
Italy
1. Economical energy saving potential of 25 TWhel/a resp. 69 TWhth/a; required
investment 31 bn Euro in the field of electricity and 16 bn Euro in the field of
thermal energy.
2. Realizable energy saving potential of 9.4 TWhel/a and 28 TWhth/a; required
investment of 3 bn Euro (electrical) resp. 3 bn Euro (thermal).
6,7 TWh6,2 TWh32,5 TWh2,0 TWh4,0 TWh0,7 TWh0,1 TWh
24,8 TWh3,6 TWh4,7 TWh051015
0 5.00010.000 Investition in Mio. Euro
Motion Energy Data Management Heat generation & distribution
Process cooling Power quality Compressed air
Hydraulics Process water filtering Automation
HVAC Lighting
3,3 TWhel
1,0 TWhel
2,0 TWhth
11,4 TWhth
0,5 TWhel 1,5 TWhel 0,3 TWhel
0,04 TWhel
0,4 TWhth 11,2 TWhth
0,2 TWhel 1,0 TWhth
0,5 TWhel
0
1
2
3
4
5
0 500 1,000
Payback in years
Market potential (Invest in Mio. €) Motion Energy Data Management Heat generation & distribution
Process cooling Power quality Compressed air
Hydraulics Process water filtering Automation
HVAC Lighting
Page 14 of 30
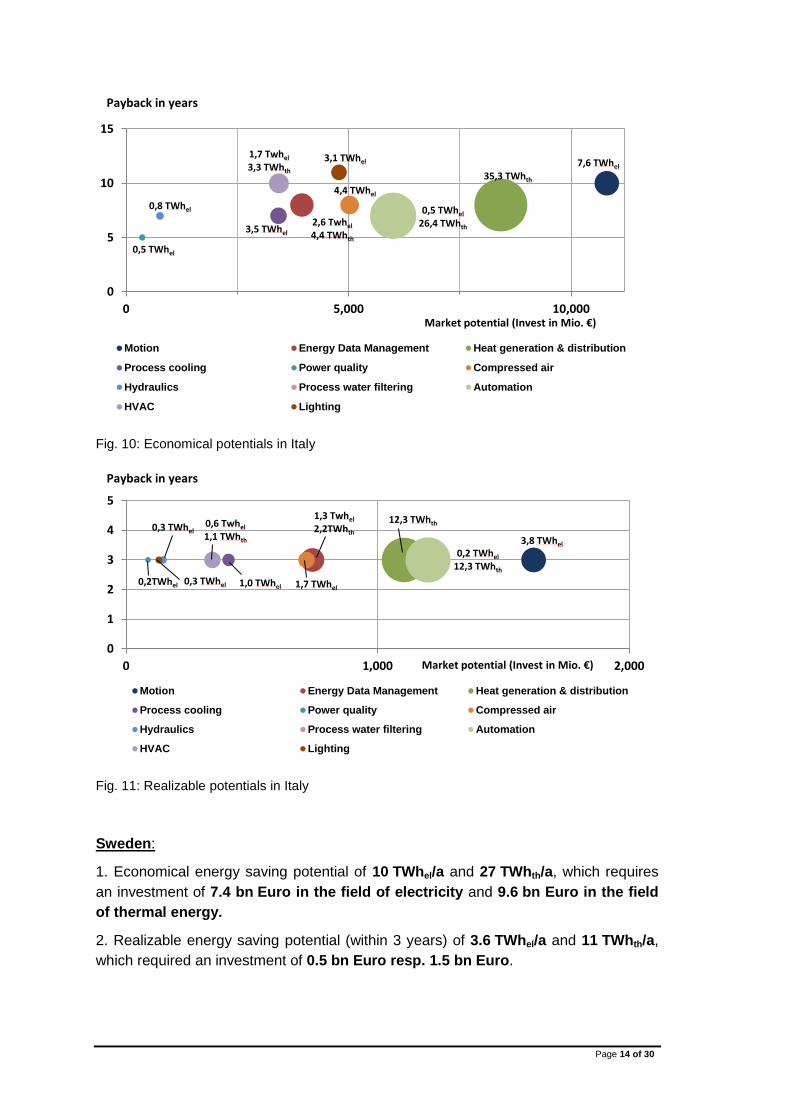
Fig. 10: Economical potentials in Italy
Fig. 11: Realizable potentials in Italy
Sweden:
1. Economical energy saving potential of 10 TWhel/a and 27 TWhth/a, which requires
an investment of 7.4 bn Euro in the field of electricity and 9.6 bn Euro in the field
of thermal energy.
2. Realizable energy saving potential (within 3 years) of 3.6 TWhel/a and 11 TWhth/a,
which required an investment of 0.5 bn Euro resp. 1.5 bn Euro.
7,6 TWhel
2,6 Twhel
4,4 TWhth
35,3 TWhth
3,5 TWhel
0,5 TWhel
4,4 TWhel
0,8 TWhel 0,5 TWhel
26,4 TWhth
1,7 Twhel
3,3 TWhth
3,1 TWhel
0
5
10
15
0 5,000 10,000
Payback in years
Market potential (Invest in Mio. €)
Motion Energy Data Management Heat generation & distribution
Process cooling Power quality Compressed air
Hydraulics Process water filtering Automation
HVAC Lighting
3,8 TWhel
1,3 Twhel
2,2TWhth
12,3 TWhth
1,0 TWhel 0,2TWhel 1,7 TWhel
0,3 TWhel
0,2 TWhel
12,3 TWhth
0,6 Twhel
1,1 TWhth 0,3 TWhel
0
1
2
3
4
5
0 1,000 2,000
Payback in years
Market potential (Invest in Mio. €)
Motion Energy Data Management Heat generation & distribution
Process cooling Power quality Compressed air
Hydraulics Process water filtering Automation
HVAC Lighting
Page 15 of 30
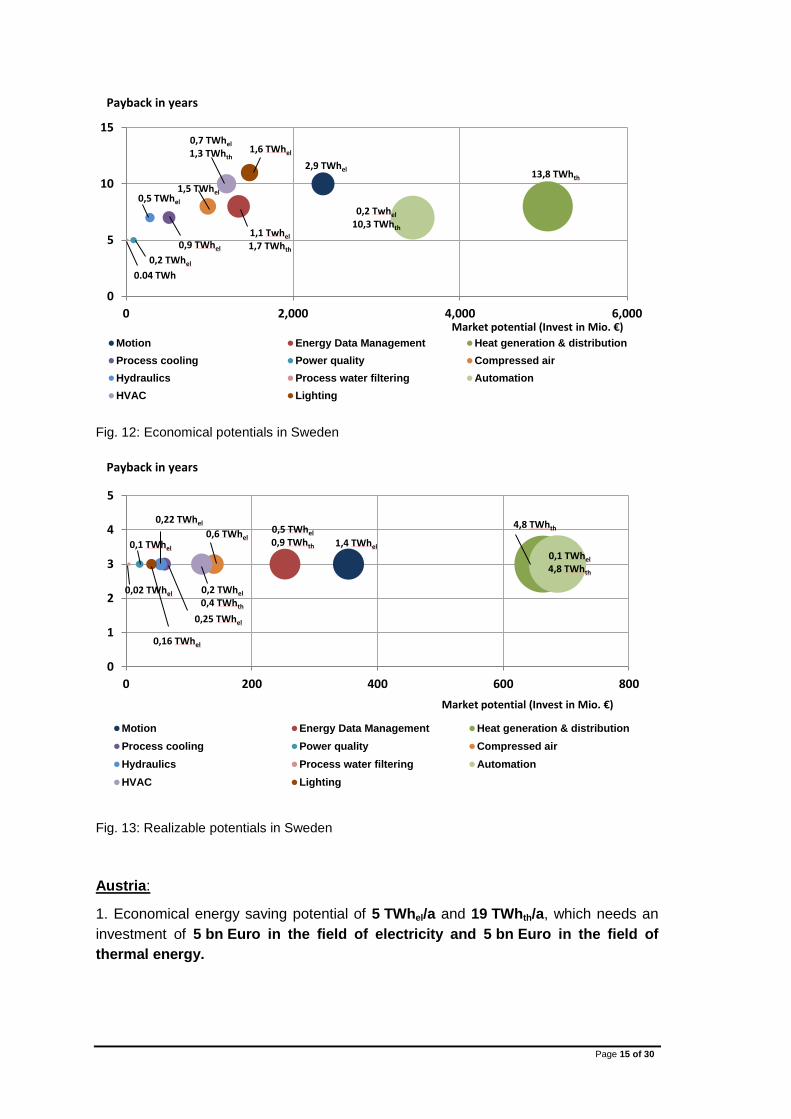
Fig. 12: Economical potentials in Sweden
Fig. 13: Realizable potentials in Sweden
Austria:
1. Economical energy saving potential of 5 TWhel/a and 19 TWhth/a, which needs an
investment of 5 bn Euro in the field of electricity and 5 bn Euro in the field of
thermal energy.
2,9 TWhel
1,1 Twhel
1,7 TWhth
13,8 TWhth
0,9 TWhel
0,2 TWhel
1,5 TWhel 0,5 TWhel
0.04 TWh
0,2 Twhel
10,3 TWhth
0,7 TWhel 1,3 TWhth 1,6 TWhel
0
5
10
15
0 2,000 4,000 6,000
Payback in years
Market potential (Invest in Mio. €)
Motion Energy Data Management Heat generation & distribution
Process cooling Power quality Compressed air
Hydraulics Process water filtering Automation
HVAC Lighting
1,4 TWhel
0,5 TWhel 0,9 TWhth
4,8 TWhth
0,25 TWhel
0,1 TWhel 0,6 TWhel
0,22 TWhel
0,02 TWhel
0,1 TWhel 4,8 TWhth
0,2 TWhel 0,4 TWhth
0,16 TWhel
0
1
2
3
4
5
0 200 400 600 800
Payback in years
Market potential (Invest in Mio. €)
Motion Energy Data Management Heat generation & distribution
Process cooling Power quality Compressed air
Hydraulics Process water filtering Automation
HVAC Lighting
Page 16 of 30
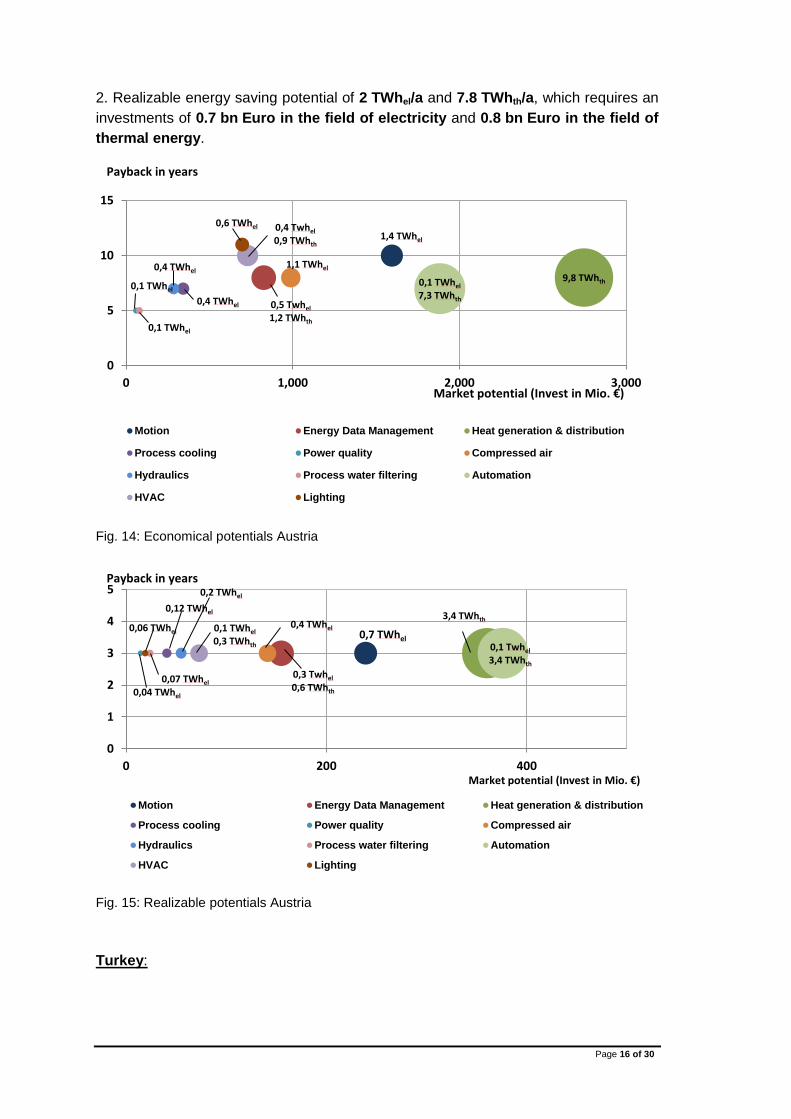
2. Realizable energy saving potential of 2 TWhel/a and 7.8 TWhth/a, which requires an
investments of 0.7 bn Euro in the field of electricity and 0.8 bn Euro in the field of
thermal energy.
Fig. 14: Economical potentials Austria
Fig. 15: Realizable potentials Austria
Turkey:
1,4 TWhel
0,5 Twhel
1,2 TWhth
9,8 TWhth
0,4 TWhel
0,1 TWhel
1,1 TWhel 0,4 TWhel
0,1 TWhel 0,1 TWhel
7,3 TWhth
0,4 Twhel
0,9 TWhth
0,6 TWhel
0
5
10
15
0 1,000 2,000 3,000
Payback in years
Market potential (Invest in Mio. €)
Motion Energy Data Management Heat generation & distribution
Process cooling Power quality Compressed air
Hydraulics Process water filtering Automation
HVAC Lighting
0,7 TWhel
0,3 Twhel
0,6 TWhth
3,4 TWhth
0,12 TWhel
0,04 TWhel
0,4 TWhel
0,2 TWhel
0,07 TWhel
0,1 Twhel
3,4 TWhth
0,1 TWhel
0,3 TWhth
0,06 TWhel
0
1
2
3
4
5
0 200 400
Payback in years
Market potential (Invest in Mio. €)
Motion Energy Data Management Heat generation & distribution
Process cooling Power quality Compressed air
Hydraulics Process water filtering Automation
HVAC Lighting
Page 17 of 30
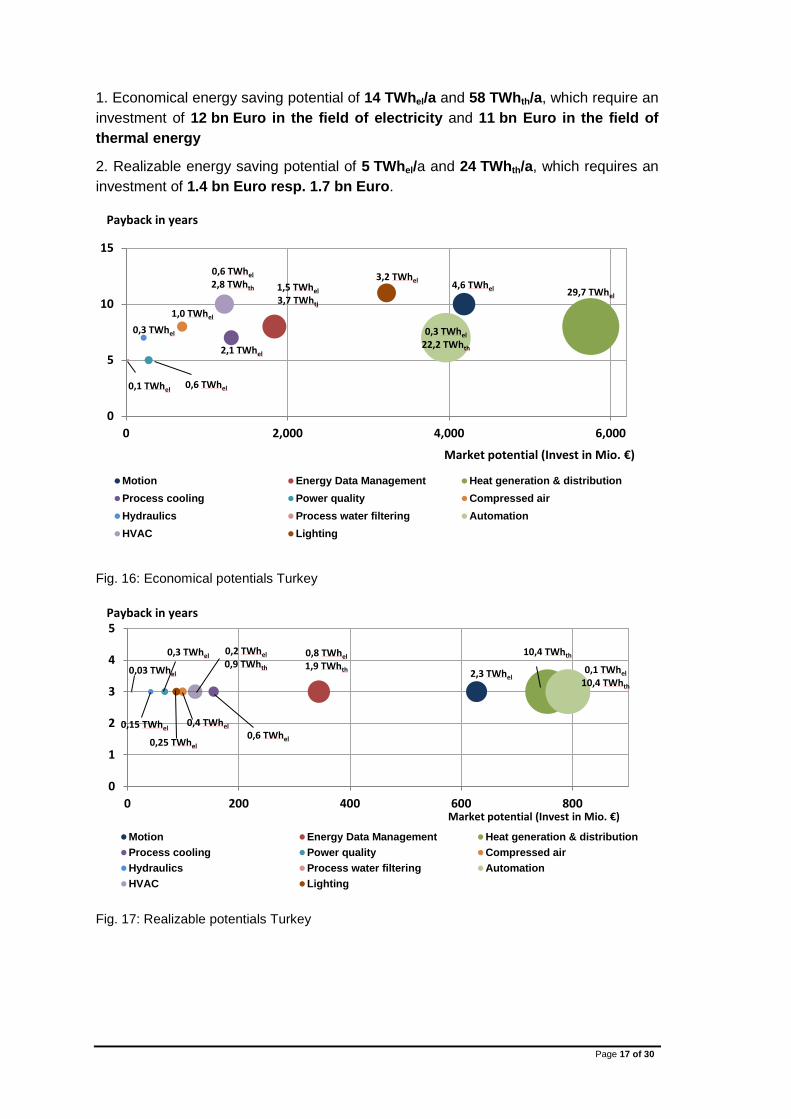
1. Economical energy saving potential of 14 TWhel/a and 58 TWhth/a, which require an
investment of 12 bn Euro in the field of electricity and 11 bn Euro in the field of
thermal energy
2. Realizable energy saving potential of 5 TWhel/a and 24 TWhth/a, which requires an
investment of 1.4 bn Euro resp. 1.7 bn Euro.
Fig. 16: Economical potentials Turkey
Fig. 17: Realizable potentials Turkey
4,6 TWhel 1,5 TWhel 3,7 TWhtj
29,7 TWhel
2,1 TWhel
0,6 TWhel
1,0 TWhel
0,3 TWhel
0,1 TWhel
0,3 TWhel 22,2 TWhth
0,6 TWhel 2,8 TWhth
3,2 TWhel
0
5
10
15
0 2,000 4,000 6,000
Payback in years
Market potential (Invest in Mio. €)
Motion Energy Data Management Heat generation & distribution
Process cooling Power quality Compressed air
Hydraulics Process water filtering Automation
HVAC Lighting
2,3 TWhel
0,8 TWhel 1,9 TWhth
10,4 TWhth
0,6 TWhel 0,25 TWhel
0,4 TWhel 0,15 TWhel
0,03 TWhel 0,1 TWhel 10,4 TWhth
0,2 TWhel 0,9 TWhth
0,3 TWhel
0
1
2
3
4
5
0 200 400 600 800
Payback in years
Market potential (Invest in Mio. €)
Motion Energy Data Management Heat generation & distribution
Process cooling Power quality Compressed air
Hydraulics Process water filtering Automation
HVAC Lighting
Page 18 of 30
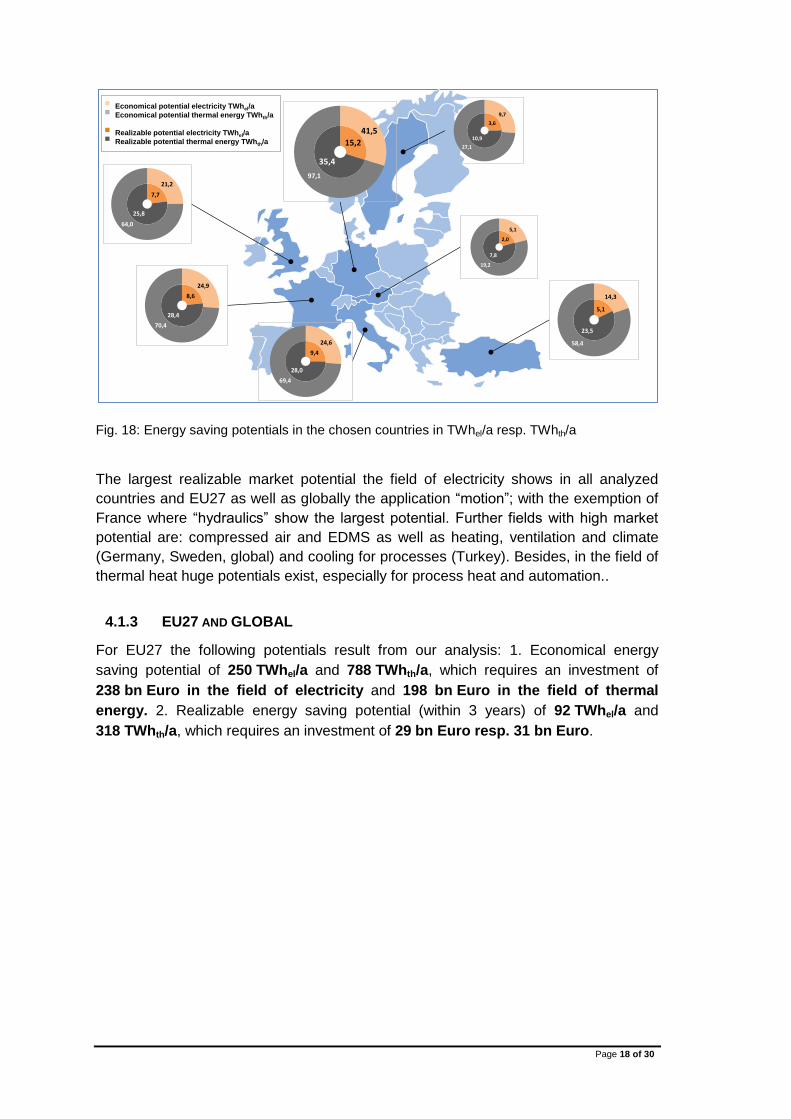
Fig. 18: Energy saving potentials in the chosen countries in TWhel/a resp. TWhth/a
The largest realizable market potential the field of electricity shows in all analyzed
countries and EU27 as well as globally the application “motion”; with the exemption of
France where “hydraulics” show the largest potential. Further fields with high market
potential are: compressed air and EDMS as well as heating, ventilation and climate
(Germany, Sweden, global) and cooling for processes (Turkey). Besides, in the field of
thermal heat huge potentials exist, especially for process heat and automation..
4.1.3 EU27 AND GLOBAL
For EU27 the following potentials result from our analysis: 1. Economical energy
saving potential of 250 TWhel/a and 788 TWhth/a, which requires an investment of
238 bn Euro in the field of electricity and 198 bn Euro in the field of thermal
energy. 2. Realizable energy saving potential (within 3 years) of 92 TWhel/a and
318 TWhth/a, which requires an investment of 29 bn Euro resp. 31 bn Euro.
Economical potential electricity TWhel/a
Economical potential thermal energy TWhth/a
Realizable potential electricity TWhel/a
Realizable potential thermal energy TWhth/a 15,2
35,4
41,5
97,1
7,7
25,8
21,2
64,0
3,6
10,9
9,7
27,1
8,6
28,4
24,9
70,4
9,4
28,0
24,6
69,4
2,0
7,8
5,1
19,2
5,1
23,5
14,3
58,4

Page 19 of 30
2,6 TWhel
140,0 TWhth 6,4 TWhel 5,8 TWhel 012345
0
Motion Energy Data Management Heat generation & distribution
Process cooling Power quality Compressed air
Hydraulics Process water filtering Automation
HVAC Lighting
Fig. 19: Economical potentials in the EU27
Fig. 20: Realizable potentials in the EU27
Globally the following potentials result: 1. Economical energy saving potential of
1,400 TWhel/a and 6,500 TWhth/a, which requires an investment of 900 bn Euro in
the field of electricity and 1.500 bn Euro in the field of thermal energy. 2.
Realizable energy saving potential of 520 TWhel/a and 2,600 TWhth/a, which requires
an investment of 109 bn Euro in the field of electricity and 236 bn Euro in the field
of thermal energy.
74,3 TWhel
26,2 TWhel 50 TWhth
400,1 TWhth
23,1 TWhel 2,6 TWhel
38,5 TWhel
12,8 TWhel
0,9 TWhel
5,7 TWhel
305,0 TWhth
13,3 TWhel 37,5 TWhth
47,2 TWhel
0
5
10
15
0 20,000 40,000 60,000 80,000 100,000 120,000
Payback in years
Market potential (Invest in Mio. €) Motion Energy Data Management Heat generation & distribution
Process cooling Power quality Compressed air
Hydraulics Process water filtering Automation
HVAC Lighting
37,2 TWhel 13,1 TWhel 25 TWhth
2,6 TWhel
140,0 TWhth 6,4 TWhel
14,7 TWhel
5,8 TWhel
142,3 TWhth 6,4 TWhel
12,5 TWhth 4,7 TWhel
0
1
2
3
4
5
0 2,000 4,000 6,000 8,000 10,000 12,000 14,000
Payback in years
Market potential (Invest in Mio. €)
1 TWhel
0,5 TWhel

Page 20 of 30
Fig. 21: Economical potentials globally
Fig. 22: Realizable potential globally
4.2 ANALYSIS OF THE BRANCHES
Energy saving potentials related to electricity in the particular branches are basically
depending on electricity demand, electricity prices, the particular processes and
measures which have been already implemented to save energy. According to our
420,0 TWhel
148,2 TWhel 412,5 TWhth
3300,1 TWhth
130,7 TWhel
14,8 TWhel
217,8 TWhel
72,6 TWhel
5,2 TWhel
27,8 TWhel
2475 TWhth
108,9 TWhel 309,4 TWhth 266,7 TWhel
0
5
10
15
0 300,000 600,000 900,000
Payback in years
Market potential (Invest in Mio. €)
Motion Energy Data Management Heat generation & distribution
Process cooling Power quality Compressed air
Hydraulics Process water filtering Automation
HVAC Lighting
210,0 TWhel
74,1 TWhel 206,3 TWhth
1155,0 TWhth
36,3 TWhel
5,9 TWhel
32,7 TWhel
2,6 TWhel
13 TWhel 1155 TWhth 36,3 TWhel
103,1 TWhth
26,7 TWhel
0
1
2
3
4
5
0 40,000 80,000 120,000
Payback in years
Market potential (Invest in Mio. €)
Motion Energy Data Management Heat generation & distribution
Process cooling Power quality Compressed air
Hydraulics Process water filtering Automation
HVAC Lighting

Page 21 of 30
analysis for the chosen branches in Germany the following efficiency potentials are as
follows:
4.2.1 FOOD AND BEVERAGES
In Food and Beverage sector partly significant differences exist in the sub-branches
with regard to energy demand and energy costs. Thus, principally differentiated
analyses as to energy efficiency potentials are recommended.
In all, the economical energy saving potential (taking into account life time measures, 9
years) for the branch is about 1.5 TWhel/a and requires an investment of 1.8 bn Euro
to achieve this potential. Considering the usually required payback period of 3 years
“only” a potential of 0.6 TWhel/a results, which requires an investment of 253 bn Euro.
4.2.2 MINERALS
The Minerals sector (cement, lime, gypsum, glass1, etc.) the economical energy
saving potential (average life time of 9.2 years) amounts to 1.4 TWhel/a and needs an
investment 1.2 bn Euro. Taking into account the usual required payback time of 3
years a potential of “only” 0.6 TWhel/a results which needs an investment of
181 bn Euro. Especially in the cement industry the electricity is used for only a few
very large drives or process components and energy efficiency is in a special focus,
also due to requirements in turn for special energy cost deductions.
4.2.3 PULP AND PAPER
In the sector pulp and paper the economical energy saving potential (meaning
considering an average life time of 9 years) amounts to 2.9 TWhel/a and can be
achieved with an investment of 2.4 bn Euro. Considering the usually used payback
time of 3 years an energy saving potential of “only” 1.4 TWhel/a results which needs an
investment of 387 m Euro to be achieved. The branch shows in both absolute and
relative numbers the largest energy saving potentials amongst the three analyzed
branches. Taking into account a broad heterogeneity amongst the paper plants a focus
of energy efficiency measure can be set generally on improvements of paper
machines and waste paper treatment.
1 According to the WZ categorization glass is not part of minerals; integrating glass here is
according to internal Siemens considerations

Page 22 of 30
Fig. 23: Potentials in the chosen branches
4.3 PRODUCT ANALYSIS
The following chart provides an overview of the chosen energy efficiency technologies.
Fig. 24: Energy-efficiency-technologies in the industry
Pulp & Paper
22 TWhel/a
2.9 TWhel/a
1.4 TWhel/a
0 TWh/a
5 TWh/a
10 TWh/a
15 TWh/a
20 TWh/a
25 TWh/a
15 TWhel/a
2 TWhel/a
1 TWhel/a
0 TWh/a
5 TWh/a
10 TWh/a
15 TWh/a
20 TWh/a
25 TWh/a
14 TWhel/a
1.4 TWhel/a
0.6 TWhel/a
0 TWh/a
5 TWh/a
10 TWh/a
15 TWh/a
20 TWh/a
25 TWh/aElectricity demand
Economical marketpotential
Realizable marketpotential
1.5 TWhel
0.6 TWhel
0
3
6
9
12
0 1.000 2.000 3.000
Payback in years
Market potential (investment in m. €)
1.4 TWhel
0.6 TWhel
0
3
6
9
12
0 1.000 2.000 3.000
Payback in years
Market potential (investment in m. €)
Economicmarketpotential
Viable marketpotential
2.9 TWhel
1.4 TWhel
0
3
6
9
12
0 1.000 2.000 3.000
Payback in years
Market potential (investment in m. €)
Food & Beverage Minerals
Economical
market
potential
Realizable
market
potential
“Motion”
Process cooling
Combined heat and power
“Smart Grid”
Compressed air
Hydraulics
Process water
Core production processes
EDMS
Waste
Power generation
Warehousing & logistics
Analysed products:
high efficient low voltage motors (red framed)
frequency converters for speed control (blue framed)
energy data management systems (green framed)
Buildings
incl. HVAC

Page 23 of 30
4.3.1 ENERGY EFFICIENT MOTORS (LOW VOLTAGE)2
With the use of energy efficient low voltage motors (0.75 – 375 kW, motor class IE3)
economically 2.4 TWhel/a electricity can be saved. This potential requires an
investment of 1.4 bn Euro. The realizable energy saving potential is assessed with
about 1.6 TWhel/a requiring an investment of 419 m Euro.
4.3.2 FREQUENCY CONVERTER FOR SPEED CONTROL3
By using energy efficient frequency converters for speed control (in field of pumps,
ventilation and compressors) economically 4.2 TWhel/a electricity can be saved with an
investment of 2.5 bn Euro. The realizable energy saving potential amounts to
2.8 TWhel/a and requires an investment 757 m Euro.
4.3.3 ENERGY DATA MANAGEMENT SYSTEMS (EDMS)
Although energy data management systems (EDMS) don’t save energy directly they
are an essential element to identify energy efficiency potentials and to conclude
efficiency measures. EDMS measure how much energy is used for which processes.
Comparing the data with target data energy efficiency potentials can be concluded.
Depending on the initial situation companies can save already 1-10% in the first year
by implementation of EDMS.
According to our moderate assessment the economical energy saving potential with
the support of EDMS in the German industry amounts to 2.4 TWhel/a and 5.4 TWhth/a
(slightly more than 1 %). This requires an investment of 1.5 bn Euro in the field of
electricity and 1.2 bn Euro in the field of thermal energy. The realizable energy
saving potential amounts to 1 TWhel/a and 2.2 TWhth/a associated with an investment
of 340 m Euro in the field of electricity and 260 m Euro in the field of thermal
energy.
2 Calculation the potentials only the costs of the motors of the particular power class has been used.
Costs for installation etc. of the motors vary largely depending on the project partner and thus haven’t been taken into consideration here.
3 Calculating the Potentials only the costs of the frequency converters in the particular power classes have
been considered. The costs for the installation etc. depend largely on the individual project partner and thus have not been taken into consideration here.

Page 24 of 30
Fig. 25: Product analysis
4 CRITICAL APPRAISAL AND ANALYSIS OF THE BARRIERS
4.1 CRITICAL APPRAISAL
A few points need to be mentioned which need to be regarded critically in regards to
their significance and validity despite the fact that the methodology has been chosen
conscientiously and the analyses have been realized carefully and thoroughly.
Consistence of data: Differences between national and international statistics,
based on diverse system boundaries or non-disclosure bring along difficulties
for data consistence.
Electricity prices and own electricity production: as electricity prices vary
largely by country, size of companies, energy demand etc. the analyses have
been done using average prices. These aspects have to be taken into
consideration while interpreting specific potentials for branches and
technologies. Electricity which is produced within plants is very difficult to
assess and thus has not been done within our analyses.
Internal rates of invest: Calculating the internal rate of invest makes only
sense in regards to the economical market potential (considering life time
usage); regarding a payback period of 3 years usually requirements as to the
internal rate of investment are fulfilled.
2.39 TWhel
1.59 TWhel
0
3
6
9
0 500 1.000 1.500
Market potential (investment in m. €)
Wirtschaft-lichesEinsparpotential (elektrisch)
Realisierbares Einsparpotential(elektrisch)
4.20 TWhel
2.80 TWhel
0
3
6
9
0 1.000 2.000 3.000
Market potential (investment in m. €)
Wirtschaft-lichesEinsparpotential (elektrisch)
Realisierbares Einsparpotential(elektrisch)
Payback in years
EDMS
Payback in years
Low voltage motors Frequency converters
103TWhel/a
5.2 TWhel/a 2.4
TWhel/a0 TWh/a
30 TWh/a
60 TWh/a
90 TWh/a
120 TWh/aElectricity demand
Economic energysaving potential
Viable energysaving potential
27 TWhel/a
4.2 TWhel/a 2.8
TWhel/a
0 TWh/a
5 TWh/a
10 TWh/a
15 TWh/a
20 TWh/a
25 TWh/a
30 TWh/a Electricity demand
Economic energysaving potential
Viable energysaving potential
720 TWh/a
7.8 TWh/a3.2 TWh/a
0 TWh/a
100 TWh/a
200 TWh/a
300 TWh/a
400 TWh/a
500 TWh/a
600 TWh/a
700 TWh/a
800 TWh/aElectricity demand
Economic energysaving potential
Viable energysaving potential
economical saving
potential (electricity)
realizable saving
potential (electricity)
economical saving
potential (electricity)
realizable saving
potential (electricity)
5.40 TWhth2 TWhel
1 TWhth
2 TWhel
0
3
6
9
0 500 1.000 1.500
Market potential (investment in m. €)
Wirtschaft-liches Einsparpotential(thermisch)
Wirtschaft-liches Einsparpotential(elektrisch)
Realisierbares Einsparpotential(thermisch)
Realisierbares Einsparpotential(elektrisch)
economical saving potential
(electricity)
realizable saving potential
(electricity)
economical saving potential
(thermal)
realizable saving potential
(thermal)
Payback in years
14 TWhel/a
1.4 TWhel/a
0.6 TWhel/a
0 TWh/a
5 TWh/a
10 TWh/a
15 TWh/a
20 TWh/a
25 TWh/aElectricity demand
Economical marketpotential
Realizable marketpotential
14 TWhel/a
1.4 TWhel/a
0.6 TWhel/a
0 TWh/a
5 TWh/a
10 TWh/a
15 TWh/a
20 TWh/a
25 TWh/aElectricity demand
Economical marketpotential
Realizable marketpotential
14 TWhel/a
1.4 TWhel/a
0.6 TWhel/a
0 TWh/a
5 TWh/a
10 TWh/a
15 TWh/a
20 TWh/a
25 TWh/aElectricity demand
Economical marketpotential
Realizable marketpotential

Page 25 of 30
Bottom-up-approach versus Top-down-approach: Depending on the data
base the appropriate approach for the analysis has been chosen. Due to data
availability it was not possible to use one approach for all assessments.
Realizable market potential: the realizable market potential usually is not the
same as the realistic market potential due to the following reasons:
Assumptions can vary from real conditions (prices, energy saving
potential in %, etc.)
Non-financial barriers e.g. culture-linked characteristics (acceptance of
solutions), business cultures in companies (no adequate staff, decision
processes etc.).
4.2 ANALYSIS OF BARRIERS
In the course of the project also barriers have been assessed which limit the
realization of energy efficiency potentials. Therefore Siemens experts in the chosen
countries and branches as well for analyzed products have been interviewed as to the
relevance of different predefined barriers (high, medium, low relevance). In the result
the following main barriers for investments in energy efficiency measures have been
mentioned – independent of the country and branch: uncertain economic market
situation of the companies, limited access to capital, too long payback times of the
energy efficiency measures and a lack of political incentives.
For the particular branches the following barriers have been pointed out especially:
pulp and paper industry: political incentive system, market situation of the companies
food and beverage: too long payback times, lack of resources (human, time)
minerals: limited capital, too long payback times and technologies/products which are not already mature

Page 26 of 30
Fig. 26: General barriers4
4 Results of questionnaire survey provided by country-, branch- and technology experts;
Sum of the number of interviewed persons (11) by weighting of answers on a scale of 0 (no relevance) to 2 (high relevance)
0
2
4
6
8
10
12
14
16
18
Missing politicalincentive scheme
Market situation of companies(uncertainties, for example respecting
product portfolio, economic future)
Lack of capital / limited access to loans(increase in prices)
Lack of product-specific and inovativefinancial instruments
High financial risks (especially if energyefficiency measures intervene with core
processes)
Too long payback periods
Immature technologies / measuresPrinzipal-Agent-Issues (investor is not the
beneficiary of savings)
Lack of awareness of the respectivepotentials
Lack of interest by the decision makers (nofinancial concerns)
Lack of acceptance by affected parties
Excessive transaction costs fordesign/implementation
Lack of resources (personnel,time)
Source: Siemens
0 = low relevance
18 = high relevance

Page 27 of 30
5 APPENDIX
5.1 SOURCES
AGEB. (2010). Energy balance Germany.
http://www.ag-energiebilanzen.de/viewpage.php?idpage=63
BMU. (2009). Energy Efficiency – the intelligent energy source.
Destatis. (2013). Data and facts economic sectors.
https://www.destatis.de/DE/ZahlenFakten/Wirtschaftsbereiche/Energie/Energie.
html
Eurostat. (2013). Energy statistics and prices: natural gas and electricity prices for
industrial consumers.
http://epp.eurostat.ec.europa.eu/portal/page/portal/statistics/search_database
Fraunhofer ISI. (2011). Energieeffizienz: Potenziale, volkswirtschaftliche Effekte und
innovative Handlungs- und Förderfelder für die Nationale Klimaschutzinitiative.
Fraunhofer ISI. (2012). Zukunftsmarkt Effiziente Elektromotoren.
IEA (C. Brunner, P. Waide). (2011). Energy-Efficiency Policy Opportunities for Electric
Motor-Driven Systems.
IEA. (2012). Energy Statistics of Non-OECD Countries.
IEA. (2012). Energy Statistics of OECD Countries.
Umweltbundesamt (R. Peglau). (2013). ISO 50001 certified sites worldwide.
ZVEI. (2012). Elektrische Antriebe – Energieeffizienz wird zunehmend reglementiert.
http://www.zvei.org/Verband/Fachverbaende/Automation/Seiten/Elektrische-
Antriebe-Energieeffizienz-wird-zunehmend-reglementiert.aspx
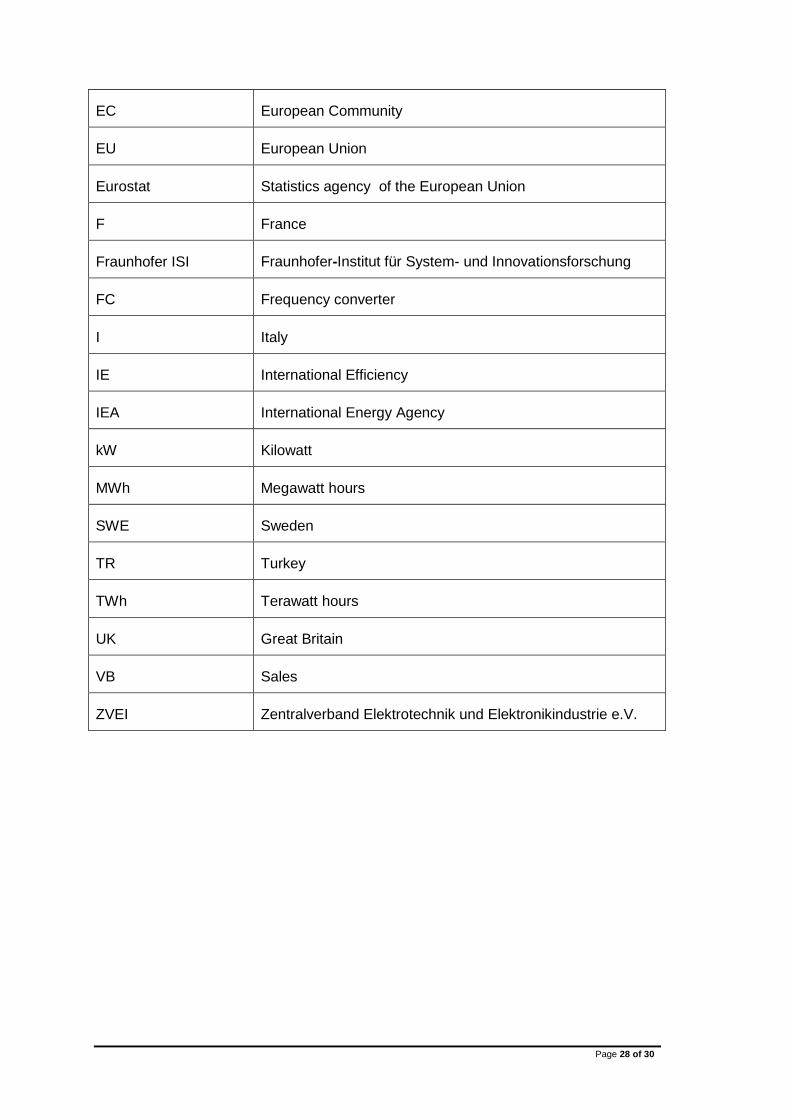
5.2 ABBREVIATIONS
Abbreviation Term
AGEB Arbeitsgemeinschaft Energiebilanzen e.V.
A Austria
BMU Bundesministerium für Umwelt, Naturschutz und Reaktorsicherheit
DESTATIS Statistisches Bundesamt
EDMS Energy data management system
Page 28 of 30
EC European Community
EU European Union
Eurostat Statistics agency of the European Union
F France
Fraunhofer ISI Fraunhofer-Institut für System- und Innovationsforschung
FC Frequency converter
I Italy
IE International Efficiency
IEA International Energy Agency
kW Kilowatt
MWh Megawatt hours
SWE Sweden
TR Turkey
TWh Terawatt hours
UK Great Britain
VB Sales
ZVEI Zentralverband Elektrotechnik und Elektronikindustrie e.V.
Page 29 of 30
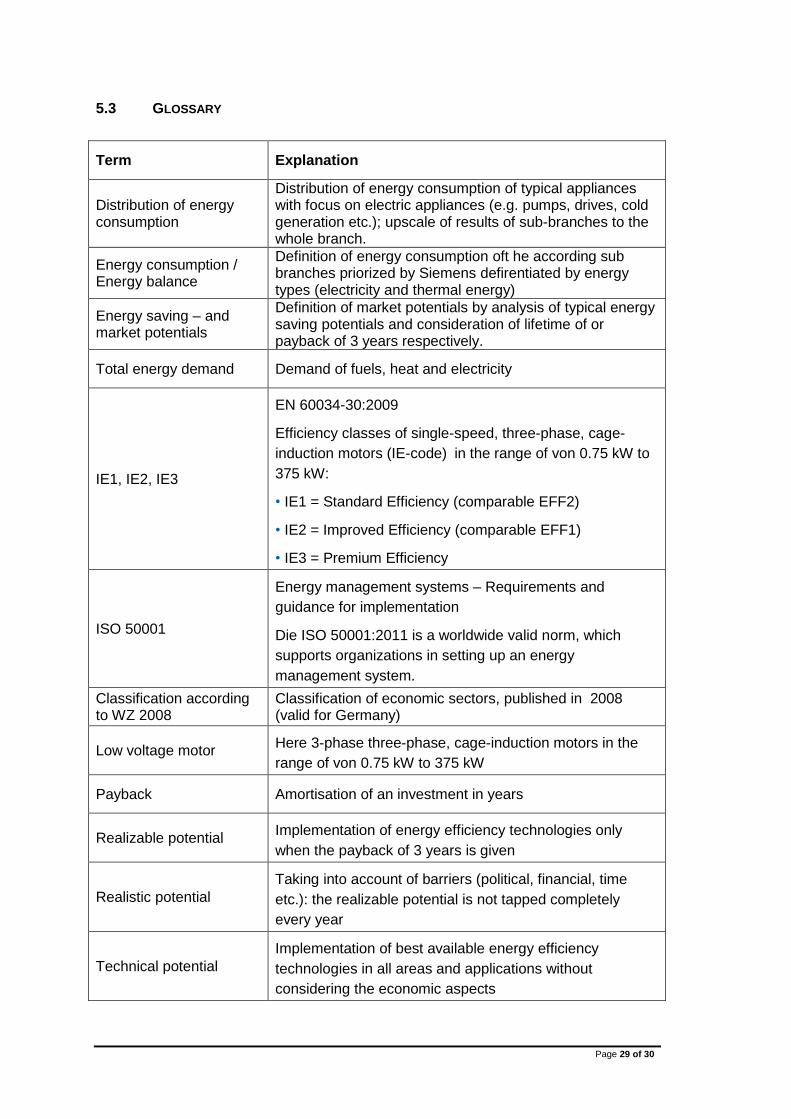
5.3 GLOSSARY
Term Explanation
Distribution of energy consumption
Distribution of energy consumption of typical appliances with focus on electric appliances (e.g. pumps, drives, cold generation etc.); upscale of results of sub-branches to the whole branch.
Energy consumption / Energy balance
Definition of energy consumption oft he according sub branches priorized by Siemens defirentiated by energy types (electricity and thermal energy)
Energy saving – and market potentials
Definition of market potentials by analysis of typical energy saving potentials and consideration of lifetime of or payback of 3 years respectively.
Total energy demand Demand of fuels, heat and electricity
IE1, IE2, IE3
EN 60034-30:2009
Efficiency classes of single-speed, three-phase, cage-
induction motors (IE-code) in the range of von 0.75 kW to
375 kW:
• IE1 = Standard Efficiency (comparable EFF2)
• IE2 = Improved Efficiency (comparable EFF1)
• IE3 = Premium Efficiency
ISO 50001
Energy management systems – Requirements and
guidance for implementation
Die ISO 50001:2011 is a worldwide valid norm, which
supports organizations in setting up an energy
management system.
Classification according to WZ 2008
Classification of economic sectors, published in 2008 (valid for Germany)
Low voltage motor Here 3-phase three-phase, cage-induction motors in the
range of von 0.75 kW to 375 kW
Payback Amortisation of an investment in years
Realizable potential Implementation of energy efficiency technologies only
when the payback of 3 years is given
Realistic potential
Taking into account of barriers (political, financial, time
etc.): the realizable potential is not tapped completely
every year
Technical potential
Implementation of best available energy efficiency
technologies in all areas and applications without
considering the economic aspects

Page 30 of 30
Economical potential
Implementation of energy efficiency technologies only in
applications, where the economic criteria are fulfilled over
the life time of the technology (the internal rate of return
(IRR) is higher than x%, here higher than 8%)