energy efficient iaq mini-bid preliminary report no. 2 - draft
TRANSCRIPT

WWW.JBB.COM
Energy Efficient IAQ Mini-Bid Preliminary Report No. 2
A U G U S T 2 7 , 2 0 2 0
Presented to:
NYSERDA

WWW.JBB.COM
▪ Housekeeping Items
▪ MoMA Main Update
▪ MoMA QNS Update
▪ 55 Water Street Update
AGENDA
4

HOUSEKEEPING ITEMS
5

WWW.JBB.COM
▪ Changes:
• 55 Water Street effort moved ahead of Rudin Properties.
• Horace Mann Buildings moved to end of schedule.
Progress to Date and Recommended Changes
SCHEDULE UPDATE

WWW.JBB.COM
Recommended Act ions Re la ted to HVAC Systems
APPROACHING IAQ (NEW)
Increase Outdoor Air
Ventilation
More Precise
Temperature and
Humidity Control
Upgrade Particulate
Filtration
Portable Room Air
Cleaners (HEPA)
Ultraviolet Germicidal
Irradiation (UVGI)
*
*ASHE requires specific temperature and humidity design parameters as part of their standard.
** Organizations such as the American Society for Microbiology (ASM) has reiterated the recommendations above.

WWW.JBB.COM
▪ Tier 1
• Enhanced Supply Air Filtration (Increased MERV level)
• Portable HEPA Filter Units
▪ Tier 2
• Increased Outside Air
• UV-C Emitters & Upper Room UVGI
• Increased Quantity of Air Changes
• Ventilation Effectiveness
• Real Time Air Monitoring
• Humidification Strategies
▪ Tier 3
• Active Agents Injected into Supply Air
• Bipolar Ionization
• Dry Hydrogen Peroxide
• Probiotic Air Purifier
• Disinfecting Filtration System
• Photocatalytic Oxidation
• Photohydroionization
• Far-UV
• Aerosol Disinfection System - Triethylene Glycol
Tiered Approach
APPROACHING IAQ (NEW)
• Tier 1: Strategies that are easy to implement with minimal
disruption.
• Tier 2: Strategies that are slightly more difficult to implement
but are well researched and have citable data about efficacy
of strategy.
• NYSERDA EE IAQ will focus on Tier 1 & Tier 2 strategies in
alignment with industry guidelines and publications.
• Tier 3: Emerging technologies.
• Tier 3 strategies and other emerging technologies are outside
the scope of EE IAQ.

WWW.JBB.COM
JB&B IAQ Process
APPROACHING IAQ (NEW)
▪ Measures are evaluated for feasibility based on IAQ survey effort.
▪ Final IAQ recommendations are based upon industry recommendations, feasibility outcomes, and Client feedback on preferred strategies.
Contractor

WWW.JBB.COM
Current Understanding
ENERGY MODELING PACKAGES
6

WWW.JBB.COM
▪ For buildings with an existing calibrated energy model:
• Energy model inputs adjusted to reflect ASHRAE recommendations
▪ For buildings without an existing calibrated energy model:
• Spreadsheet calculations for each individual IAQ strategy
• Resource: Airborne Infection Risk (AIRC) and Ventilation Increase Impact (VII) Calculator from NYC DCAS and Building performance Lab
Approaching the ASHRAE Recommendat ions Model
ENERGY MODELING (NEW)

MOMA MAIN
15

WWW.JBB.COM
▪ Building Name: The Museum of Modern Art (Main Campus)
▪ Building Location: 53 West 53rd Street, New York, NY
▪ Building Typology: Cultural Institution – Museum | Non-Profit | Owner-Occupied
▪ Occupancy Types: Art Gallery, Office, Retail
▪ Size: 557,000 sqft
▪ Operating Hours: 10:30 AM – 5:30 PM Monday through Sunday
▪ Systems Impacting IAQ:
• Pretreatment Units (PTU) to pre-condition ventilation air
• Variable Air Volume Central Air Handling Systems (various configurations & vintages)
• Air filtration strategy (galleries and art storage/preservation): MERV 8 pre-filter, MER 14 first stage particulate filter, MERV 15 dual pass gaseous phase filters, MERV 15 final filter
• Demand control ventilation
• No airside energy recovery
▪ Other Notes/Information:
• Gallery spaces have stringent temperature & humidity criteria for preservation of the art: 70°F ±2°F and 50% ±5% RH in accordance with an ASHRAE AA Preservation Category
Overview
MOMA MAIN (NEW)

MOMA MAIN TASK LIST STATUS
Data Collection & Review
□ Minimum 12-Months Pre-COVID Utility Data
□ Existing Building MEP Drawings
□ BMS Sequence of Ops
□ Conduct Preliminary Site Walkthrough
□ Conduct Operator Interviews
Develop Baseline Energy Model
□ Total Annual Energy Use Breakdown by End Use
□ Benchmark Building
□ Develop Preliminary ECMs
Site Survey & Energy Efficient IAQ Recommendations
□ Conduct Detailed Site Visits
□ Develop Filtration and Airside Equipment Operation Log
□ Develop IAQ Recommendations
□ Refine Preliminary ECMs
Energy Efficient IAQ Energy Analysis
□ ASHRAE Recommendations Energy Model (In Progress)
□ Energy Efficiency Model (In Progress)
Economic Analysis
□ Develop Design Document for Cost Estimator
□ Collect Cost Estimates
□ Conduct Economic Analysis
Final Reporting
□ Final Report
□ Case Study Documentation
7

WWW.JBB.COM
2019 Energy Consumpt ion by Ut i l i ty
BASELINE ENERGY MODEL
Energy Source
Energy
Consumption
[kBTUs]
% Energy
Consumption
Electricity 63,630,436 37.1%
ConEd Steam 105,128,235 61.4%
Natural Gas 2,601,160 1.5%
18
Steam, 61.3%
Electricity, 37.1%
Natural Gas, 1.5%

WWW.JBB.COM
Total 2019 Consumption: 171,397,290 kBtu
Tota l 2019 Month ly Consumpt ion by Ut i l i ty [ kBtu]
BASELINE ENERGY MODEL
19
0
5,000,000
10,000,000
15,000,000
20,000,000
25,000,000
January February March April May June July August September October November December
Steam Electric Natural Gas

WWW.JBB.COM
Year MonthEnergy
[ConEd Mlb]Days HDD
2018 January 9,113 28 777
2018 February 9,954 32 742
2018 March 7,939 27 526
2018 April 6,005 29 200
2018 May 5,694 31 33
2018 June 4,914 29 1
2018 July 4,651 28 0
2018 August 5,159 31 13
2018 September 4,708 28 49
2018 October 7,873 29 444
2018 November 10,878 32 825
2018 December 9,150 29 772
2019 January 10,635 28 892
2019 February 11,849 32 901
2019 March 8,335 27 381
2019 April 7,262 29 222
2019 May 6,534 31 19
2019 June 5,433 29 0
2019 July 4,710 28 0
2019 August 5,731 31 3
2019 September 6,171 29 79
2019 October 5,884 28 381
2019 November 7,793 32 781
2019 December 7,742 29 699
Steam
BASELINE ENERGY MODEL
Notes:
1. A regression analysis was utilized to develop a baseline energy model for heating end uses
in the building. This analysis often allows the energy auditing team to better understand the
facilities' heating energy profile and will form the analytical foundation for energy reduction
analysis associated with ECMs impacting building heating loads.
2. Insight: The regression analysis shows that MoMA Main’s steam profile follows an
expected trajectory, with steam usage driven by outside air temperature in the winter and
humidity control requirements year-round.
16
0
100
200
300
400
500
600
700
800
900
1,000
0
2,000
4,000
6,000
8,000
10,000
12,000
14,000
Ja
n-1
8
Feb
-18
Mar-
18
Apr-
18
May-1
8
Ju
n-1
8
Ju
l-18
Aug
-18
Sep
-18
Oct-
18
No
v-1
8
De
c-1
8
Ja
n-1
9
Feb
-19
Mar-
19
Apr-
19
May-1
9
Ju
n-1
9
Ju
l-19
Aug
-19
Sep
-19
Oct-
19
No
v-1
9
De
c-1
9
HDD
Monthly Steam Energy [Mlb/month]
Steam Energy vs. Heating Degree Days
Energy [Mlb] HDD

WWW.JBB.COM
Year MonthEnergy
[kWh]
Power
[kW]Days CDD
2018 January 1,086,787 2,536 22 0
2018 February 1,397,600 2,556 29 2
2018 March 1,372,000 2,340 28 0
2018 April 593,600 2,649 30 6
2018 May 2,284,800 2,866 28 64
2018 June 1,559,200 3,000 29 186
2018 July 1,831,200 3,185 30 356
2018 August 1,818,400 3,218 28 363
2018 September 1,812,800 3,244 29 302
2018 October 1,707,200 3,070 31 80
2018 November 1,389,600 2,621 28 3
2018 December 1,503,200 2,827 30 0
2019 January 1,623,414 2,532 33 0
2019 February 1,383,200 2,575 29 0
2019 March 1,486,400 2,701 30 0
2019 April 1,438,400 2,651 28 9
2019 May 1,460,800 2,845 28 17
2019 June 1,618,400 3,015 29 117
2019 July 1,916,800 3,138 31 443
2019 August 1,738,400 3,079 28 353
2019 September 1,544,000 2,951 29 171
2019 October 1,567,200 2,856 31 93
2019 November 1,358,400 2,865 28 1
2019 December 1,513,600 2,502 32 0
Notes:
1. A regression analysis was utilized to develop a baseline energy model for cooling end uses
in the building. This analysis often allows the energy auditing team to better understand the
facilities’ cooling energy profile and will form the analytical foundation for energy reduction
analysis associated with ECMs impacting building cooling loads.
2. Insight: The regression analysis shows that MoMA’s cooling energy profile is consistent
year-round due to the stringent temperature and humidity requirements for Museum gallery
spaces. Peaks in the summer months are due to additional cooling load as outside
temperatures rise.
Elect r ic i ty
BASELINE ENERGY MODEL
17
0
50
100
150
200
250
300
350
400
450
500
0
500,000
1,000,000
1,500,000
2,000,000
2,500,000
Ja
n-1
8
Feb
-18
Mar-
18
Apr-
18
May-1
8
Ju
n-1
8
Ju
l-18
Aug
-18
Sep
-18
Oct-
18
No
v-1
8
De
c-1
8
Ja
n-1
9
Feb
-19
Mar-
19
Apr-
19
May-1
9
Ju
n-1
9
Ju
l-19
Aug
-19
Sep
-19
Oct-
19
No
v-1
9
De
c-1
9
CDD
Monthly Electric Energy [kWh/month]
Electrical Energy vs. Cooling Degree Days
Energy [kWh] CDD

WWW.JBB.COM
Year MonthEnergy
[therm]Days
2018 January 2,054 22
2018 February 1,844 29
2018 March 2,094 28
2018 April 2,291 30
2018 May 2,315 28
2018 June 2,197 29
2018 July 2,211 31
2018 August 2,101 28
2018 September 2,003 29
2018 October 2,467 31
2018 November 2,215 28
2018 December 2,461 30
2019 January 2,118 32
2019 February 2,054 29
2019 March 2,177 30
2019 April 2,150 28
2019 May 2,169 30
2019 June 2,160 28
2019 July 1,994 31
2019 August 2,074 28
2019 September 1,815 29
2019 October 2,467 31
2019 November 2,215 28
2019 December 2,619 32
Natura l Gas
BASELINE ENERGY MODEL
Notes:
1. A regression analysis was utilized to develop a baseline energy model for natural gas uses
in the building. Natural gas is utilized for cooking in the museum’s café.
2. Insight: The analysis shows that MoMA Main’s cooking energy profile follows a typical
trajectory and is driven by the number of days that the building’s restaurant is open and
operational.
16
0
5
10
15
20
25
30
35
0
500
1,000
1,500
2,000
2,500
3,000
Ja
n-1
8
Feb
-18
Mar-
18
Apr-
18
May-1
8
Ju
n-1
8
Ju
l-18
Aug
-18
Sep
-18
Oct-
18
No
v-1
8
De
c-1
8
Ja
n-1
9
Feb
-19
Mar-
19
Apr-
19
May-1
9
Ju
n-1
9
Ju
l-19
Aug
-19
Sep
-19
Oct-
19
No
v-1
9
De
c-1
9
Days
Monthly Natural Gas Energy [therms/month]
Natural Gas Energy vs. Days
Energy [therms] Days

WWW.JBB.COM
Tota l 2019 Consumpt ion by End Use
UTILITY ANALYSIS
End UseEnergy Consumption
(kBtu)
% Energy
Consumption
Space Heating 28,373,022 16.6%
Water Heating 1,188,774 0.7%
Space Cooling 28,709,029 16.8%
Water Distribution 3,484,022 2.0%
Air Distribution 14,693,900 8.6%
Lighting 5,667,729 3.3%
Plug Loads 4,250,797 2.5%
Conveyance 8,942,825 5.2%
Humidification 75,566,439 44.1%
Notes:
1. The end use categories are based on ASHRAE Standard 211-2018 Guidelines.
2. Equipment runtimes are based on discussions with building staff and standard
assumptions, along with a 2020 LL87 report, where applicable.
3. Humidification and space heating end uses require further refinement.
10
Space Heating, 16.6%Water Heating, 0.7%
Space Cooling, 16.8%
Water Distribution 2.0%
Air Distribution, 8.6%
Lighting, 3.3%
Plugloads, 2.5%
Conveyance, 5.2%
Humidification, 44%

WWW.JBB.COM
▪ Inventory includes fan data, coil data, pre & final filtration strategies, make and model of each SF & RF, duct dimensions, etc.
▪ Information will be used to determine feasibility of IAQ recommendations and to evaluate energy impact of IAQ measures.
AHU and F i l t ra t ion Media Inventory
IAQ ONSITE SURVEY (NEW)
Unit Number
Fan Info
Service Floor Room VFD Fan Manufacturer Model Number Motor ID/Serial Number Motor Model Number Fan Serial Number Fan
ACW-23 Level 11 Offices 11 11th Floor Core 1 MER Yes Trane MOGB BX08 MCCB021UA0B0UA K02K59722A
ACW-24 Level 12 Offices 12 12th Floor Core 1 MER Yes Trane MOGB BX08 MCCB021UA0B0UB K02K59709A
ACW-25 Level 13 Offices 13 13th Floor Core 1 MER Yes trane N/A N/A MCCB021UA0B0UB K02K59729A
ACW-26 Level 14 Offices 14 14th Floor Core 1 MER Yes Trane M0GB BX08 MCCB021UA0B0UB K02K59750A
ACW-27 Level 15 Offices 15 15th Floor Core 1 MER Yes Trane MOGB BX07 MCCB021UA0B0UB K02K59742A
ACW-28Comm. & Elec. RM's,
Mez, 1st, 2nd Floors2
2nd Floor Core 1
Storage RoomYes Trane X70380211010 9QM56T17D5346B P BCVC054G1A0A1M03F T02K73396
ACW-29 Interstitial Glass Space Mezzanine Central Plant Yes Trane M0GB BX05 MCCB008UA0B0UA K02K56594A

WWW.JBB.COM
▪ Resource: ASHRAE Standard 211-2018
▪ Resource: ASHRAE Epidemic Task Force guidance
• Building Readiness (05/21/2020)
• Commercial (04/20/2020)
• Filtration & Disinfection (05/27/2020)
▪ Resource: Airborne Infection Risk (AIRC) and Ventilation Increase Impact (VII) Calculator v1.0 (07/2020)
▪ Existing LL87 Report (Kohler Ronan 2018-2019) utilized as a check on JB&B analysis.
▪ Existing documentation from MoMA Expansion project (JB&B design).
▪ Energy Star Portfolio for Utility Data (Con Ed benchmarking link enabled).
▪ Existing schedule sheets utilized for Energy Use Breakdown.
▪ Con Ed Facility Assessment Report (07/2020) reviewed for additional EEM opportunities.
NOTES, ASSUMPTIONS & RESOURCES

WWW.JBB.COM
▪ Evaluate feasibility of Tier 1 & Tier 2 IAQ strategies
▪ Complete ASHRAE Recommendations model
▪ Complete Energy Efficiency model
▪ Expected DRAFT for Final Report Delivery to MoMA Main and NYSERDA by 9/30.
NEXT STEPS

MOMA QNS
15

WWW.JBB.COM
▪ Building Name: The Museum of Modern Art Queens (MoMA QNS)
▪ Building Location: 45-20 33rd Street, Long Island City, QNS
▪ Building Typology: Art Storage/Industrial | Non-Profit | Owner-Occupied
▪ Occupancy Types: Storage, Office
▪ Size: 140,000 sqft
▪ Operating Hours: 10:00 AM – 5:00 PM Thursday through Monday & 10:00 AM – 7:45 PM Friday
▪ Systems Impacting IAQ:
• Dedicated outdoor air unit for ventilation air connected to indoor variable air volume air handling units | DX rooftop units
• Air filtration strategy (art storage/preservation): MERV 8 pre-filter, MER 14 first stage particulate filter, MERV 15 dual pass gaseous phase filters, MERV 15 final filter
• No demand control ventilation
• No airside energy recovery
▪ Other Notes/Information:
• Art storage spaces have stringent temperature & humidity criteria for preservation of the art: 70°F ±2°F and 50% ±5% RH in accordance with an ASHRAE AA Preservation Category. The Library Stacks is considered a specialty zone, which must maintain 65°F ±2°F and 35% ±5% RH
Overview
MOMA QNS (NEW)

MOMA QNS TASK LIST STATUS
Data Collection & Review
□ Minimum 12-Months Pre-COVID Utility Data
□ Existing Building MEP Drawings
□ BMS Sequence of Ops
□ Conduct Preliminary Site Walkthrough
□ Conduct Operator Interviews
Develop Baseline Energy Model
□ Total Annual Energy Use Breakdown by End Use
□ Benchmark Building
□ Develop Preliminary ECMs
Site Survey & Energy Efficient IAQ Recommendations
□ Conduct Detailed Site Visits
□ Develop Filtration and Airside Equipment Operation Log
□ Develop IAQ Recommendations
□ Refine Preliminary ECMs
Energy Efficient IAQ Energy Analysis
□ ASHRAE Recommendations Energy Model (In Progress)
□ Energy Efficiency Model (In Progress)
Economic Analysis
□ Develop Design Document for Cost Estimator
□ Collect Cost Estimates
□ Conduct Economic Analysis
Final Reporting
□ Final Report
□ Case Study Documentation
7

WWW.JBB.COM
Year MonthEnergy
[therms]Days HDD
2018 January 9,219 36 1,196
2018 February 8,862 29 617
2018 March 308 28 680
2018 April 5,711 30 355
2018 May 7,421 29 69
2018 June 5,708 30 2
2018 July 17,922 30 0
2018 August 5,814 29 0
2018 September 14,684 28 24
2018 October 8,398 28 284
2018 November 10,850 33 734
2018 December 4,655 24 605
2019 January 14,007 36 1,143
2019 February 6,870 29 891
2019 March 4,630 30 554
2019 April 11,515 28 226
2019 May 10,355 29 89
2019 June 12,956 31 5
2019 July 9,039 28 0
2019 August 4,486 29 0
2019 September 9,520 28 16
2019 October 8,973 30 212
2019 November 10,209 31 723
2019 December 7,474 24 631
Natura l Gas
BASELINE ENERGY MODEL
Notes:
1. A regression analysis was utilized to develop a simplified energy model for heating end
uses in the building.
2. Insight: The regression analysis shows that MoMA QNS’s heating energy profile follows a
typical trajectory and is driven by outside air temperature. Additional investigation into
peaks will be required. May need to run regression analysis based on OA RH instead of OA
temp since NG is used to generate steam for humidification and space heating.
16
0
200
400
600
800
1,000
1,200
1,400
0
2,000
4,000
6,000
8,000
10,000
12,000
14,000
16,000
18,000
20,000
Ja
n-1
8
Feb
-18
Mar-
18
Apr-
18
May-1
8
Ju
n-1
8
Ju
l-18
Aug
-18
Sep
-18
Oct-
18
No
v-1
8
De
c-1
8
Ja
n-1
9
Feb
-19
Mar-
19
Apr-
19
May-1
9
Ju
n-1
9
Ju
l-19
Aug
-19
Sep
-19
Oct-
19
No
v-1
9
De
c-1
9
HDD
Monthly Natural Gas Energy [therms/month]
Natural Gas Energy vs. Heating Degree Days
Energy [therms] HDD

WWW.JBB.COM
Year MonthEnergy
[kWh]Days CDD
2018 January 251,819 35 0
2018 February 228,000 29 2
2018 March 184,000 28 0
2018 April 247,200 30 51
2018 May 298,400 29 97
2018 June 316,000 29 271
2018 July 355,200 30 350
2018 August 342,400 29 369
2018 September 313,600 28 151
2018 October 256,800 28 42
2018 November 259,200 33 3
2018 December 190,968 25 0
2019 January 232,232 35 0
2019 February 192,000 29 0
2019 March 213,600 31 0
2019 April 241,600 28 10
2019 May 266,400 29 62
2019 June 346,400 31 280
2019 July 327,200 28 405
2019 August 320,800 29 287
2019 September 300,800 28 152
2019 October 279,200 30 5
2019 November 202,400 31 0
2019 December 165,368 24 0
Notes:
1. A regression analysis was utilized to develop a baseline energy model for cooling end uses
in the building.
2. Insight: The regression analysis shows that MoMA QNS cooling energy profile is
consistent year-round due to the stringent temperature and humidity requirements for
Museum gallery and art storage spaces.
Elect r ic i ty
BASELINE ENERGY MODEL
17
0
50
100
150
200
250
300
350
400
450
0
50,000
100,000
150,000
200,000
250,000
300,000
350,000
400,000
Ja
n-1
8
Feb
-18
Mar-
18
Apr-
18
May-1
8
Ju
n-1
8
Ju
l-18
Aug
-18
Sep
-18
Oct-
18
No
v-1
8
De
c-1
8
Ja
n-1
9
Feb
-19
Mar-
19
Apr-
19
May-1
9
Ju
n-1
9
Ju
l-19
Aug
-19
Sep
-19
Oct-
19
No
v-1
9
De
c-1
9
CDD
Monthly Electric Energy [kWh/month]
Electrical Energy vs. Cooling Degree Days
Energy [kWh] CDD

WWW.JBB.COM
Tota l Regress ion Based 2019 Consumpt ion by Ut i l i ty
BASELINE ENERGY MODEL
Energy Source
Energy
Consumption
[kBTUs]
% Energy
Consumption
Electricity 10,536,256 48.9%
Natural Gas 11,003,594 51.1%
18
Electricity, 48.9%Natural Gas, 51.1%
WWW.JBB.COM
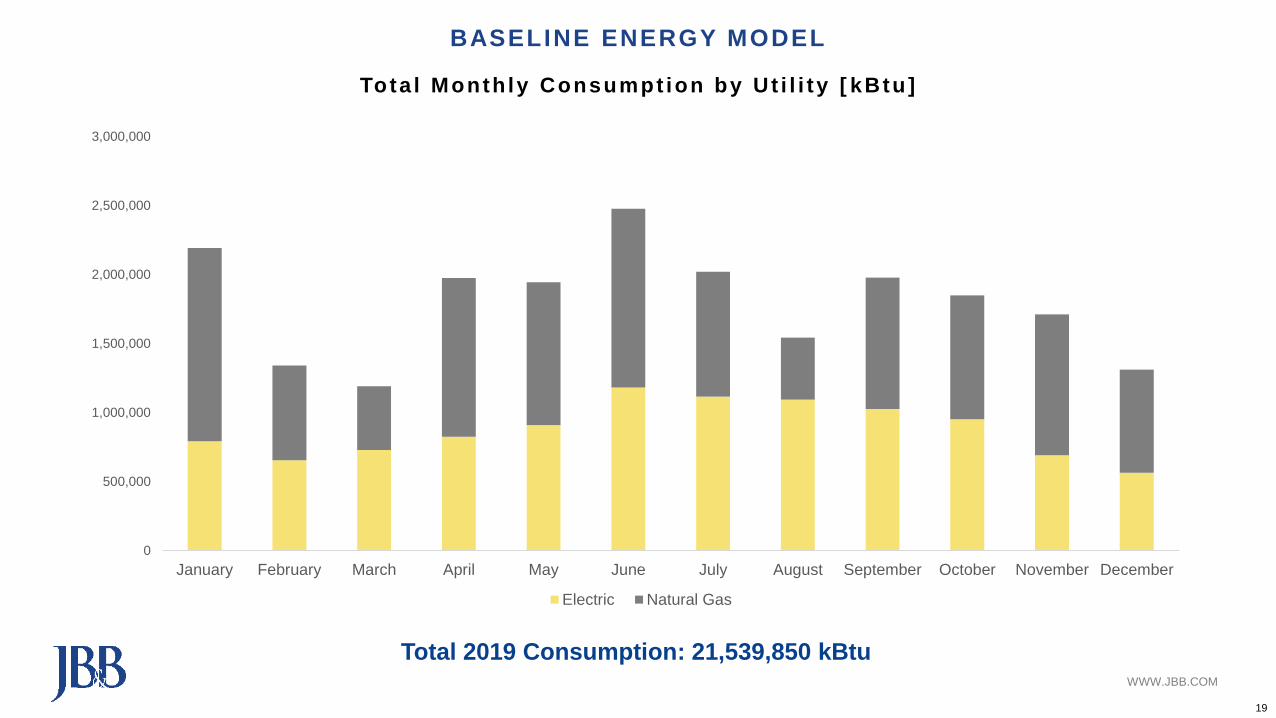
Total 2019 Consumption: 21,539,850 kBtu
Tota l Month ly Consumpt ion by Ut i l i ty [ kBtu]
BASELINE ENERGY MODEL
19
0
500,000
1,000,000
1,500,000
2,000,000
2,500,000
3,000,000
January February March April May June July August September October November December
Electric Natural Gas

WWW.JBB.COM
Tota l 2019 Consumpt ion by End Use
UTILITY ANALYSIS
Notes:
1. The end use categories are based on ASHRAE Standard 211-2018 Guidelines.
2. Equipment runtimes are based on discussions with building staff and standard
assumptions, along with a 2020 LL87 report, where applicable.
10
Space Heating, 33%
Space Cooling, 15%
Air Distribution, 19%
Water Distribution4%
DHW, 1%
Conveyance, 0%
Lighting, 4%
Plug Loads, 4%
Process Loads, 4%
Humidification, 16%
End UseEnergy Consumption
(kBtu)
% Energy
Consumption
Space Heating 7,376,459 33.2%
Space Cooling 3,246,275 14.6%
Air Distribution 4,134,779 8.6%
Water Distribution 800,678 3.6%
Water Heating 133,000 0.6%
Conveyance 45,000 0.2%
Lighting 971,000 4.4%
Plug Loads 952,000 4.3%
Process Loads 952,000 4.3%
Humidification 3,667,867 16.5%

WWW.JBB.COM
▪ Inventory includes fan data, coil data, pre & final filtration strategies, make and model of each SF & RF, duct dimensions, etc.
▪ Information will be used to determine feasibility of IAQ recommendations and to evaluate energy impact of IAQ measures.
AHU and F i l t ra t ion Media Inventory
IAQ ONSITE SURVEY (NEW)

WWW.JBB.COM
▪ Resource: ASHRAE Standard 211-2018
▪ Resource: ASHRAE Epidemic Task Force guidance
• Building Readiness (05/21/2020)
• Commercial (04/20/2020)
• Filtration & Disinfection (05/27/2020)
▪ Resource: Airborne Infection Risk (AIRC) and Ventilation Increase Impact (VII) Calculator v1.0 (07/2020)
▪ Existing LL87 Report (Kohler Ronan 2018-2019) utilized as a check on JB&B analysis.
▪ Existing documentation from MoMA Expansion project (JB&B design).
▪ Energy Star Portfolio for Utility Data (Con Ed benchmarking link enabled).
▪ Existing schedule sheets utilized for Energy Use Breakdown.
▪ Con Ed Facility Assessment Report (07/2020) reviewed for additional EEM opportunities.
NOTES, ASSUMPTIONS & RESOURCES

WWW.JBB.COM
▪ Evaluate feasibility of Tier 1 & Tier 2 IAQ strategies
▪ Complete ASHREA Recommendations model
▪ Complete Energy Efficiency model
▪ Expected DRAFT for Final Report Delivery to MoMA QNS and NYSERDA by 9/30
NEXT STEPS

55 WATER STREET
15

WWW.JBB.COM
▪ Building Name: 55 Water Street
▪ Building Location: 55 Water Street, New York, NY
▪ Building Typology: Commercial Office
▪ Occupancy Types: Office, Retail, Cafteria
▪ Size: 3.5 million sqft
▪ Operating Hours: 8:00 AM – 5:00 PM Monday through Friday | 8:00
AM – 12:00 PM Saturday
▪ Systems Impacting IAQ:
• Variable Air Volume Central Air Handling Systems (various
configurations & vintages)
• Perimeter Induction Units
• MERV 13/14 Filtration Strategy Upgraded to MERV 15/16
• No Demand Control Ventilation
• No Energy Recovery
Overview
55 WATER STREET (NEW)

55 WATER STREET TASK LIST STATUS (NEW)
Data Collection & Review
□ Minimum 12-Months Pre-COVID Utility Data
□ Existing Building MEP Drawings
□ BMS Sequence of Ops
□ Conduct Preliminary Site Walkthrough
□ Conduct Operator Interviews
Develop Baseline Energy Model
□ Total Annual Energy Use Breakdown by End Use
□ Benchmark Building
□ Develop Preliminary ECMs
Site Survey & Energy Efficient IAQ Recommendations
□ Conduct Detailed Site Visits
□ Develop Filtration and Airside Equipment Operation Log
□ Develop IAQ Recommendations (In Progress)
□ Refine Preliminary ECMs
Energy Efficient IAQ Energy Analysis
□ ASHRAE Recommendations Energy Model
□ Energy Efficiency Model
Economic Analysis
□ Develop Design Document for Cost Estimator
□ Collect Cost Estimates
□ Conduct Economic Analysis
Final Reporting
□ Final Report
□ Case Study Documentation
7

WWW.JBB.COM
DESIGNBUILDER® MODEL (NEW)
*Existing Calibrated Energy Model built in 2019 based on 2018
utility data. Weather file updated from 2018 to 2019.

WWW.JBB.COM
DESIGNBUILDER ® RENDERINGS (NEW)

WWW.JBB.COM
CALIBRATION OUTPUTS (NEW)
0 M
5 M
10 M
15 M
20 M
25 M
30 M
Jan Feb Mar April May June July Aug Sept Oct Nov Dec
Co
ns
um
pti
on
[k
BT
U]
Actual Meteorological Year
Energy Consumption
Electricity Actuals Simulation Output Steam Actuals Simulation Output
Total Actual 2019 Consumption: 343,841,233 kBtu
Total Calibrated 2019 Consumption: 346,710,322 kBtu
Margin of Error: +1%

WWW.JBB.COM
CALIBRATION OUTPUTS (NEW)
0.0 K
2.0 K
4.0 K
6.0 K
8.0 K
10.0 K
12.0 K
14.0 K
16.0 K
18.0 K
20.0 K
Jan Feb Mar April May June July Aug Sept Oct Nov Dec
Dem
an
d [
kW
]
Actual Meteorological Year
Electricity Demand
Demand Actuals
Simulation Output

WWW.JBB.COM
Tota l Annual Consumpt ion by Ut i l i ty
ENERGY BREAKDOWN (NEW)

WWW.JBB.COM
Tota l Month ly Consumpt ion
ENERGY BREAKDOWN (NEW)
0 M
5 M
10 M
15 M
20 M
25 M
30 M
35 M
40 M
45 M
January February March April May June July August September October November December
Co
ns
um
pti
on
[k
BT
U]
Actual Meteorological Year
Lights DHW Equipment Heat Rejection Pumps Fans Heating Cooling

WWW.JBB.COM
Monthly E lect r ica l Demand
ENERGY BREAKDOWN (NEW)
0
2,000
4,000
6,000
8,000
10,000
12,000
14,000
16,000
18,000
20,000
January February March April May June July August September October November December
Ele
ctr
icit
y D
em
an
d [
kW
]
Actual Meteorological Year
Cooling Heating Fans Pumps Heat Rejection Equipment Lights

WWW.JBB.COM
▪ Develop Filtration and Airside Equipment Operation Log
▪ Evaluate ASHRAE minimum recommendations in energy model
▪ Develop ECMs for IAQ systems
▪ Expected DRAFT for Final Report Delivery to MoMA QNS and NYSERDA by 10/15
NEXT STEPS (NEW)
WWW.JBB.COM
80 PINE STREET
NEW YORK, NY 10005
T 212.530.9300
F 212.269.5894
WWW.JBB.COM