energy fiji limited (efl)ceem.unsw.edu.au/.../karuneshrao-energyfijilimited.pdfvision energisingour...
TRANSCRIPT

Workshop on Sustainable Electricity Access in Pacific Island Countries:From Targets to Implementation
| Thursday 29th August, 2019 || Karunesh Rao | Corporate Affairs & Communications Manager | Energy Fiji Limited |
ENERGY FIJI LIMITED (EFL)

u FEA to EFL
u Vision, Mission & Values
u Strategic Objectives
u EFL Power Infrastructure Map
u Strategic Assets & Sales Statistics
u Demand Supply Statistics
u Total Asset Values
u Where are we now with our Generation Mix?
u Ageing Assets Replacement & Refurbishment
u Government Funded Rural ElectrificationProgram
u Non Commercial Obligation Cost
u Power Development Plan (PDP)
u Renewable Energy Development Projects up to
2026
u Funding the Power Development Plan
u Electricity Tariffs
u Workshop Objectives
u Video Presentation
u Discussions
Presentation Outline

3
u FEA was established in 1966 under the Electricity Act with the basic function to provide andmaintain a power supply that is financially viable, economically sound and consistent with therequired standards of safety, security and quality of power supply.
u FEA was Corporatized from a Commercial Statutory Authority to a Limited Liability Company on16th April, 2018 and now is known as Energy Fiji Limited (EFL).
u EFL is a limited liability company with 75% ownership by the Fijian Government. Out of the 100%,the Fijian Government has allocated 5% for domestic customers of EFL who are Fiji citizens andare resident in Fiji and 20% sold to FNPF. Some 35,759 Share Certificates have already been issuedas at 30th November, 2018 which amounts to 1.39% out of the 5%. Furthermore, the FijianGovernments partial divestment will see the sale of another 24% of EFL to a strategic investor(s).
u EFL is responsible for the generation, transmission and retail of electricity in the larger islands of –Viti Levu, Vanua Levu, Ovalau & Taveuni, which account for approximately 90% of the country’spopulation.
u Uniform tariff rates charged for electricity used by each consumer group, determined by the FijianCompetition & Consumer Commission (FCCC) in consultation with Government
u The EFL Board of Directors consists of 6 members (3 – private sector), Public sector representation– PS MITDMMS, Ministry of Economy Rep & CEO
Fiji Electricity Authority to Energy Fiji Limited

VISION
Energising our Nation
MISSION
“We aim to provide clean and affordable energy solutions to Fiji with at least 90% of the energy requirements through renewable sources by 2025”
VALUES
1. Customer Focus2. Honesty
3. Courage to do what’s right for EFL4. Team Work
5. Individual Accountability6. Transparency
7. Innovativeness

5
Strategic Assets & Locations

6
Strategic AssetsRenewable Power Stations } Monasavu Hydro Electric Scheme **} Wainikasou Hydro Power Station} Nadarivatu Hydro Electric Scheme **} Butoni Windfarm
} Nagado Hydro Electric Scheme} Wainiqeu Hydro Electric Scheme} Somosomo Hydro Scheme
Control Centre} Vuda National Control Centre
Zone Substations} Viti Levu – 37 } Vanua Levu – 4} Ovalau/Levuka – 1} Taveuni - 1
Thermal Power Stations} Kinoya Old**} Kinoya New **} Vuda **} Labasa
} Ovalau} Rakiraki} Nadi} Sigatoka} Savusavu
} Rokobili} Deuba} Korovou} Qeleloa} Taveuni
** High Asset Values
7
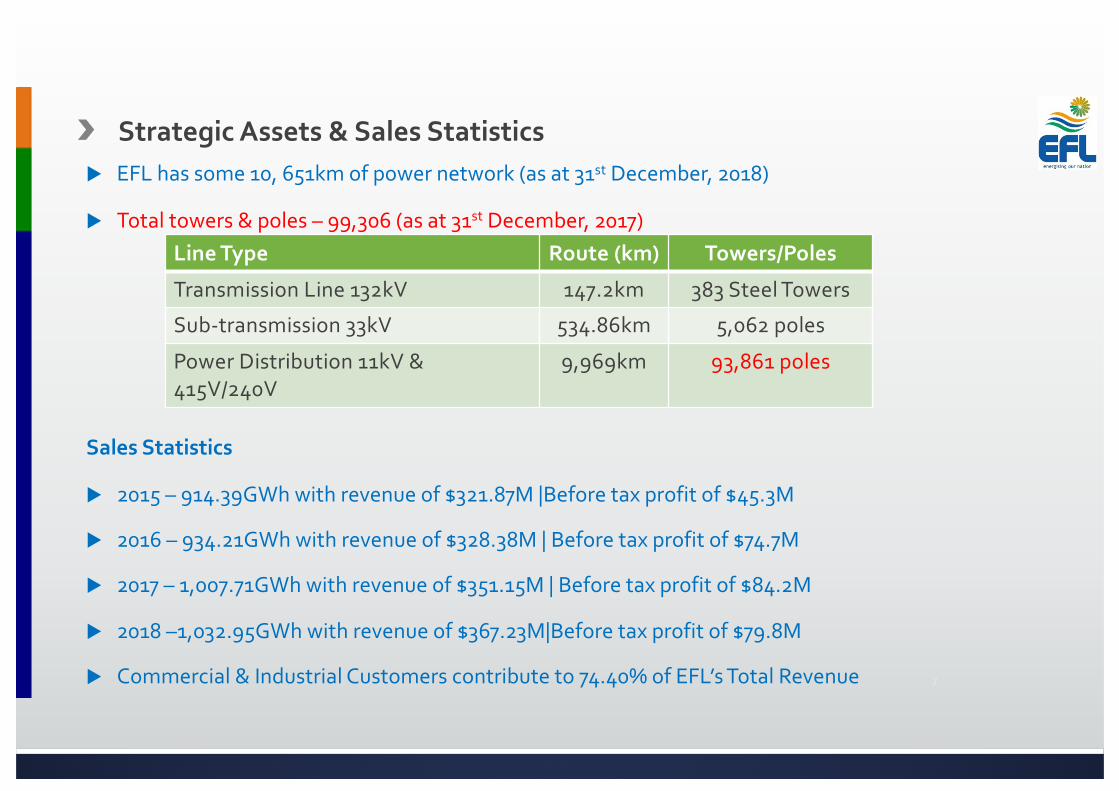
u EFL has some 10, 651km of power network (as at 31st December, 2018)
u Total towers & poles – 99,306 (as at 31st December, 2017)
Sales Statistics
u 2015 – 914.39GWh with revenue of $321.87M |Before tax profit of $45.3M
u 2016 – 934.21GWh with revenue of $328.38M | Before tax profit of $74.7M
u 2017 – 1,007.71GWh with revenue of $351.15M | Before tax profit of $84.2M
u 2018 –1,032.95GWh with revenue of $367.23M|Before tax profit of $79.8M
u Commercial & Industrial Customers contribute to 74.40% of EFL’s Total Revenue
Line Type Route (km) Towers/Poles
Transmission Line 132kV 147.2km 383 Steel Towers
Sub-transmission 33kV 534.86km 5,062 poles
Power Distribution 11kV & 415V/240V
9,969km 93,861 poles
Strategic Assets & Sales Statistics

8
Demand Supply Statisticsu Consumer Growth – Last 8 years average growth rate is around 2.97%
u Currently stands at 195,430 (31st July, 2019) – 32,729 or 17% Pre Paid
u 2018 Peak Demand, Installed & Available Capacity (Renewable & Thermal)
u Fiji Sugar Corporation supplies during the crushing season only in Labasa & Lautoka
u Tropik Wood supply has been erratic over the last few years due to operational issues
u Nabou Green Energy Limited started exporting to the grid from late July, 2017
Years 2010 2011 2012 2013 2014 2015 2016 2017 2018
Customer Numbers 150,724 155,912 159,017 162,656 167,017 171,939 174,530 182,439 194,404
Annual Growth 3.44% 1.99% 2.29% 2.68% 2.95% 1.51% 4.53% 4.37%
Individual Systems
Peak Demand (MW)
Installed Thermal (MW)
Available Thermal (MW)
Installed Renewable
(MW)
Available Renewable (MW)
Total Available Generation
Capacity (MW)
Viti Levu 171.57 140.90 126.91 146.5 125.18 252.085Labasa 7.6 15.50 11.10 - - 11.10Savusavu 2.3 4.50 3.70 0.80 0.80 4.50Ovalau 1.8 2.80 2.30 - - 2.30Taveuni 0.38 2.00 1.60 0.70 0.70 2.30Total 183.65 165.70 145.61 148.00 126.68 272.29

9
Where Are We Now with our Power Generation Mix?EFL Renewable Power Stations
u Monasavu Hydro Electric Scheme – 72MWwith anticipated generation of400GWh/annum
u Nadarivatu Hydro Electric Scheme – 44MWwith anticipated generation 101GWh/annum
u Butoni Wind Farm – 9.9MW with anticipatedgeneration of 5GWh/annum
u Wainikasou Hydro Electric Scheme – 6.6MWwith anticipated generation 26GWh/annum
u Nagado Hydro Electric Scheme – 2.8MWwith anticipated generation of12GWh/annum
u Wainiqeu Hydro Electric Scheme – 0.8MWwith anticipated generation of2GWh/annum
u Somosomo Hydro Electric Scheme – 0.7MWwith anticipated generation of2GWh/annum

10
u EFL has ageing assets that needs urgent replacement & refurbishment which would cost around
$150M and is expected to be completed by 2025. This exercise commenced in 2017.
u Monasavu Hydroelectric Scheme Half Life Refurbishment commenced in 2013 and to date some
$60M has been spent. This exercise will take another 5 years to complete and will cost another
$50M.
Ageing Assets Replacement & Refurbishment

11
Rural Electrification Program Funded by the Government
u The Fijian Government has an aim to ensure 100% access to basic electricity for all Fijians by 2021
u With the Government increasing its budget allocation towards Rural Electrification over the last
three (3) years, EFL has also increased its resources internally as well as increased the number of
external electrical contractors who can be deployed for the timely construction of these ruralelectrification schemes. A summary of the rural electrification schemes implemented by EFL from
2015 to 2018 is tabulated below:
u Schemes for 2018/19 – 170 schemes

Power Development Plan (PDP)u EFL reviews its 10 year Power Development Plan (PDP) every 2 years.
u The ten (10) year power development plan contains the load forecasting and power generationplanning scenarios up to 2026 for Viti Levu, Vanua Levu, Ovalau and Taveuni Power Systems with
associated network assets to be augmented/developed and the investment plan required to
implement this 10 year Power Development Plan.
u It is estimated that the total funding to execute the 10 year Power Development Plan will require
an investment of around FJ$2.4B.
u F$1.6B will be required for the development of power generation projects and around $0.8B
investment will be required in the transmission & distribution power network sector.
u EFL expects the private sector to invest in the Power Generation Sector as Independent Power
Producers (IPP).
u Discussions with prospective IPPs to develop various Renewable Energy technologies. i.e.
Biomass/Waste to Energy Projects, Solar Projects & Hydro Projects are ongoing.
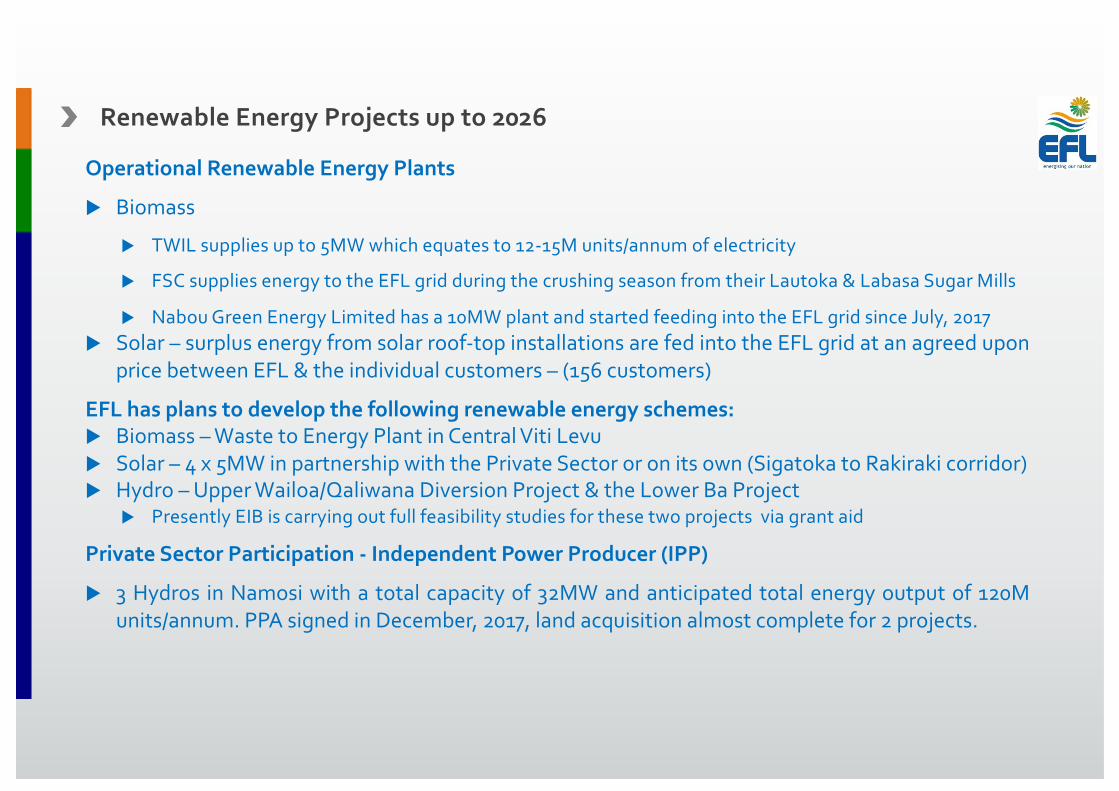
Renewable Energy Projects up to 2026
Operational Renewable Energy Plants
u Biomass
u TWIL supplies up to 5MW which equates to 12-15M units/annum of electricity
u FSC supplies energy to the EFL grid during the crushing season from their Lautoka & Labasa Sugar Mills
u Nabou Green Energy Limited has a 10MW plant and started feeding into the EFL grid since July, 2017u Solar – surplus energy from solar roof-top installations are fed into the EFL grid at an agreed upon
price between EFL & the individual customers – (156 customers)
EFL has plans to develop the following renewable energy schemes:u Biomass – Waste to Energy Plant in Central Viti Levuu Solar – 4 x 5MW in partnership with the Private Sector or on its own (Sigatoka to Rakiraki corridor)u Hydro – Upper Wailoa/Qaliwana Diversion Project & the Lower Ba Project
u Presently EIB is carrying out full feasibility studies for these two projects via grant aid
Private Sector Participation - Independent Power Producer (IPP)
u 3 Hydros in Namosi with a total capacity of 32MW and anticipated total energy output of 120Munits/annum. PPA signed in December, 2017, land acquisition almost complete for 2 projects.
14
u EFL needs to ensure economic viability to fund the implementation of the PDP
u Successful implementation of the PDP requires appropriate Electricity Tariff
Structure
u Private Sector Participation in the Power Generation Sector depends on the Feed-
in Tariff that EFL is prepared to pay them, in order to ensure a ‘win-win’ situation
for both parties
Funding the Power Development Plan (PDP)
15
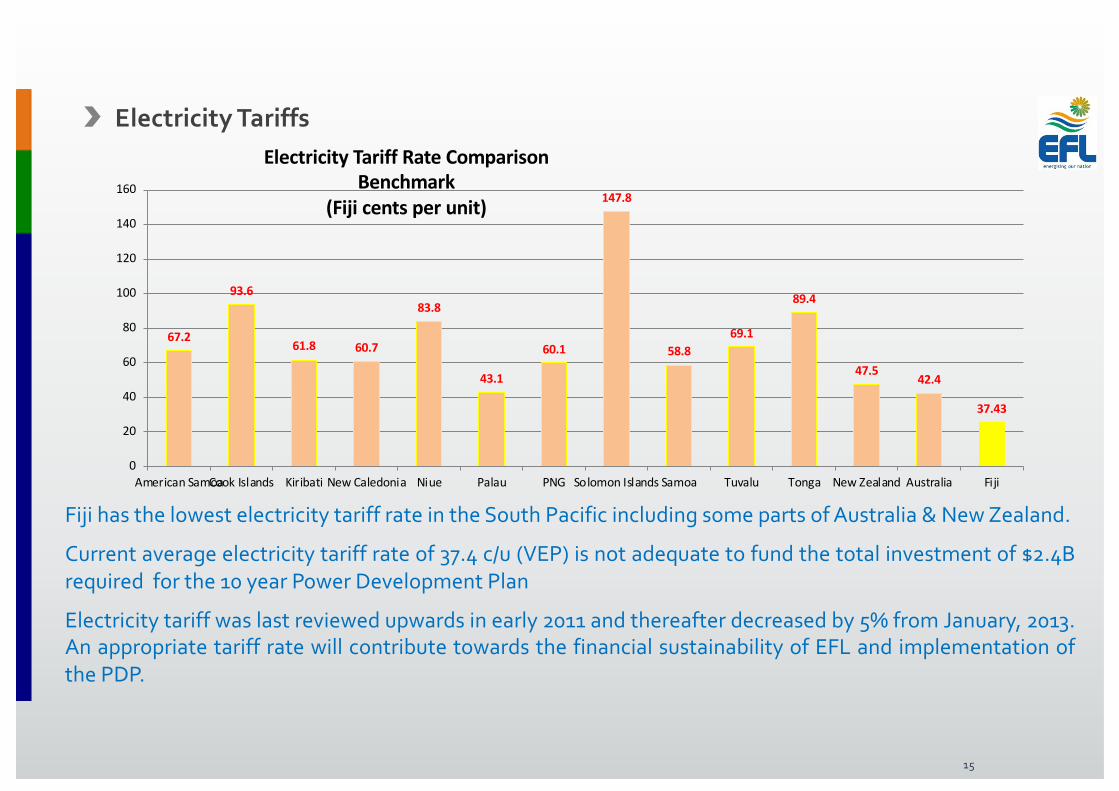
Electricity Tariffs
67.2
93.6
61.8 60.7
83.8
43.1
60.1
147.8
58.869.1
89.4
47.542.4
37.43
0
20
40
60
80
100
120
140
160
American SamoaCook Islands Kiribati New Caledonia Niue Palau PNG Solomon Islands Samoa Tuvalu Tonga New Zealand Australia Fiji
Electricity Tariff Rate Comparison Benchmark
(Fiji cents per unit)
Fiji has the lowest electricity tariff rate in the South Pacific including some parts of Australia & New Zealand.
Current average electricity tariff rate of 37.4 c/u (VEP) is not adequate to fund the total investment of $2.4Brequired for the 10 year Power Development Plan
Electricity tariff was last reviewed upwards in early 2011 and thereafter decreased by 5% from January, 2013.An appropriate tariff rate will contribute towards the financial sustainability of EFL and implementation ofthe PDP.

Workshop Objectives - Collaborative initiatives at Regional & National levels:u Training and Capacity Building
u Setup of a Regional Centre for Research, Development & Training
u Grid Integration of Renewable Energy (RE)
u Aim to attract IPP’s to provide cost effective, sustainable, uninterruptable, renewable energy solutions
u Utility Management with High Renewable Energy Penetration
u The challenges of grid stability & safety
u Role for the Private Sector
u Projects need to be financial viable
u Off-grid access
u Need to built capacity
u Energy Efficiency and other distributed Energy Resources
u PICs need guidance on standards and policing
u Electrifying Transportation
u Studies currently underway in Fiji
u Opportunities for collaboration and support for such initiatives
u None of the above can be achieved within collaboration and support

Questions & Discussions?
Karunesh Rao Corporate Affairs &
Communications Manager