energy flows in ecosystems
DESCRIPTION
Energy Flows in Ecosystems. Where does all the energy captured by plants go? SBI4U RHSA. About 1% of the sunlight that reaches Earth is captured by plants for photosynthesis. - PowerPoint PPT PresentationTRANSCRIPT
Energy Flows in Ecosystems
Where does all the energy captured by plants go?
SBI4U RHSA

About 1% of the sunlight that reaches Earth is captured by plants for photosynthesis.
By converting light energy to the chemical energy of glucose, plants are able to produce 150-200 billion tonnes of organic material a year.
This net primary productivity or biomass is measured in grams of vegetation per square metre per year (g/m2/a).

ridge.icu.ac.jp/gen-ed/ecosystem-jpgs/world-bioproduction.jpg

From the producer level up through the consumer levels the “Rule of 10” applies. This rule states that only about 10% of the energy consumed is used to build cells or new biomass in the consumer.
The other 90% of the energy consumed is “lost” to cellular respiration, heat, feces, urine or other cell functions. Thus less biomass is produced at every
higher consumer level. The Rule of 10 does not apply to the
biomass of decomposers in an ecosystem.
Rule of 10

http://www.rw.ttu.edu/2302_butler/chapter3.htm
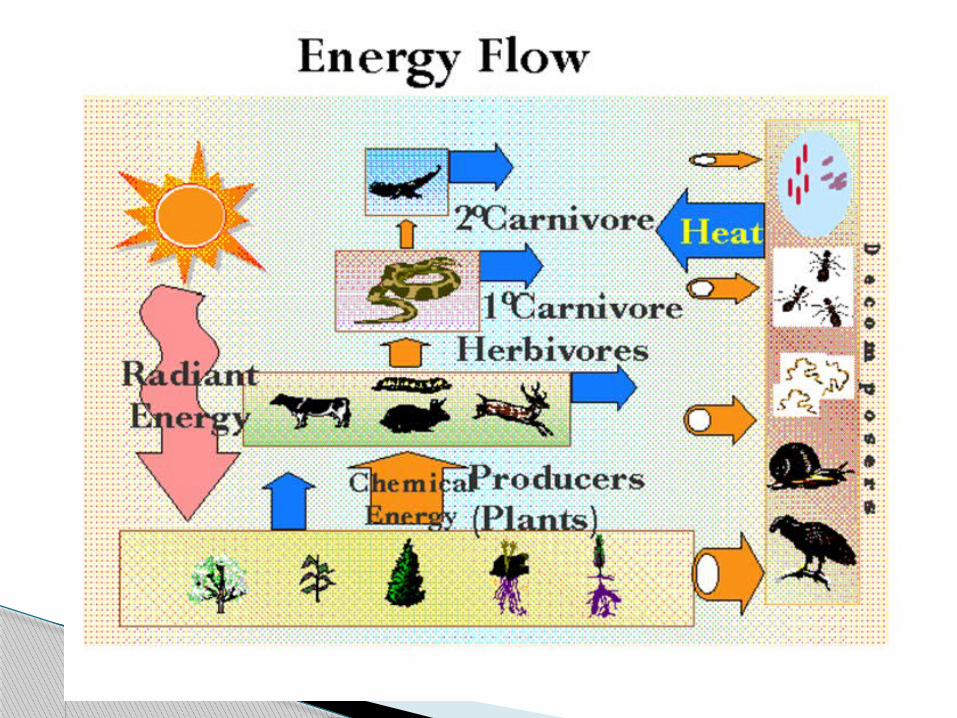
1. Why are the pyramid boxes different sizes?
2. What do the orange arrows represent?
3. Why are the orange arrows different sizes?
4. What are the units of measurement for energy? What is the metric unit?

In most aquatic and terrestial ecosystems pyramids representing: numbers of organisms, biomass amount and energy can be drawn.
How do you know this is a pyramid of numbers?
Pyramids
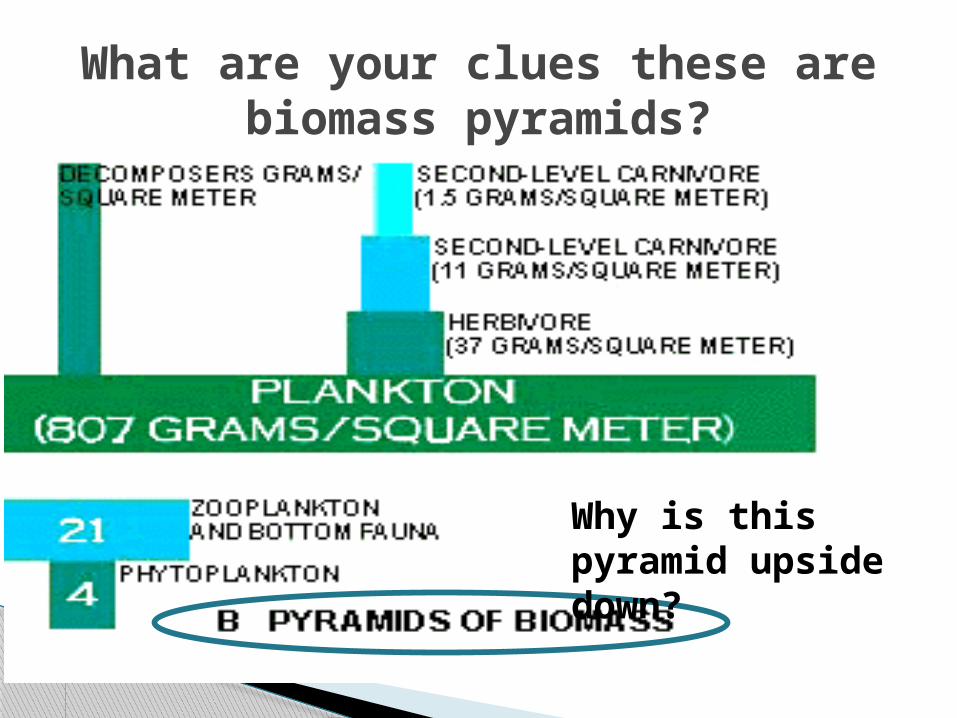
What are your clues these are biomass pyramids?
Why is this pyramid upside down?
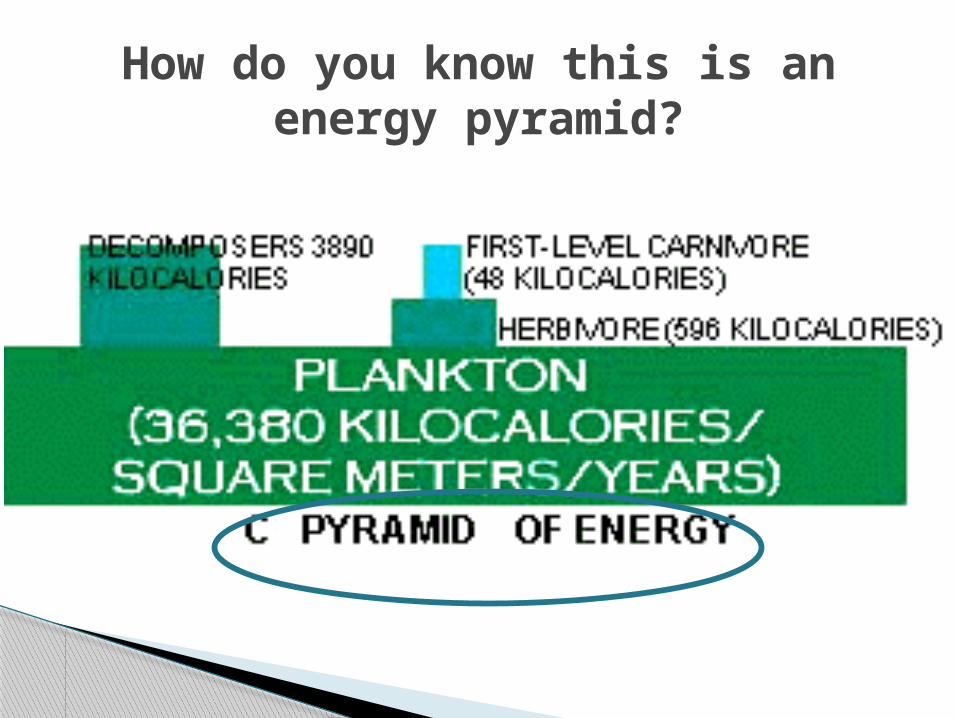
How do you know this is an energy pyramid?
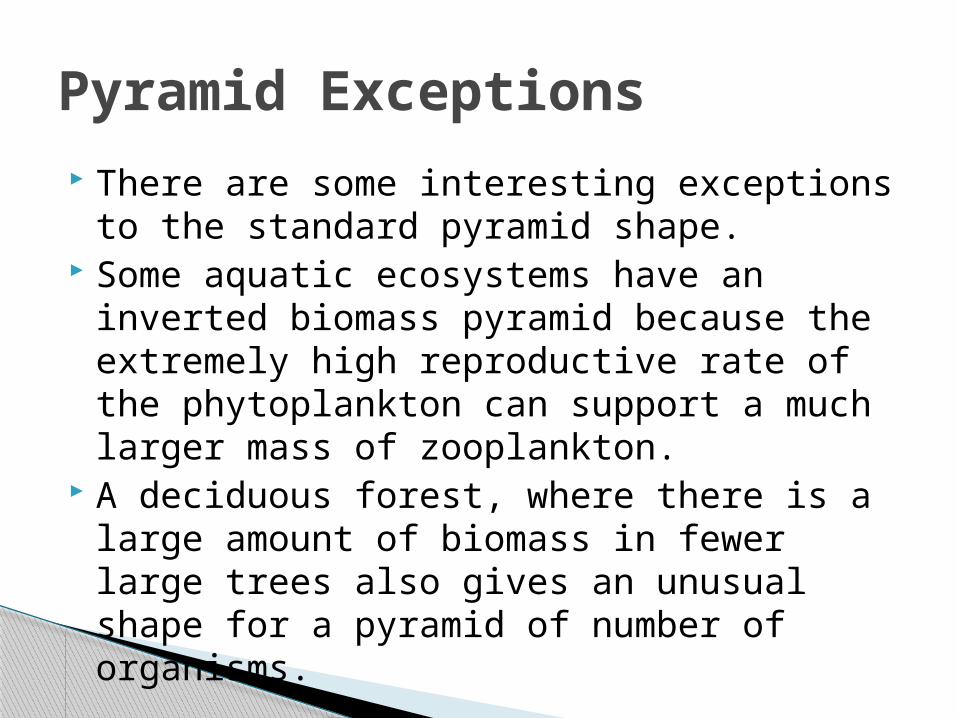
There are some interesting exceptions to the standard pyramid shape.
Some aquatic ecosystems have an inverted biomass pyramid because the extremely high reproductive rate of the phytoplankton can support a much larger mass of zooplankton.
A deciduous forest, where there is a large amount of biomass in fewer large trees also gives an unusual shape for a pyramid of number of organisms.
Pyramid Exceptions
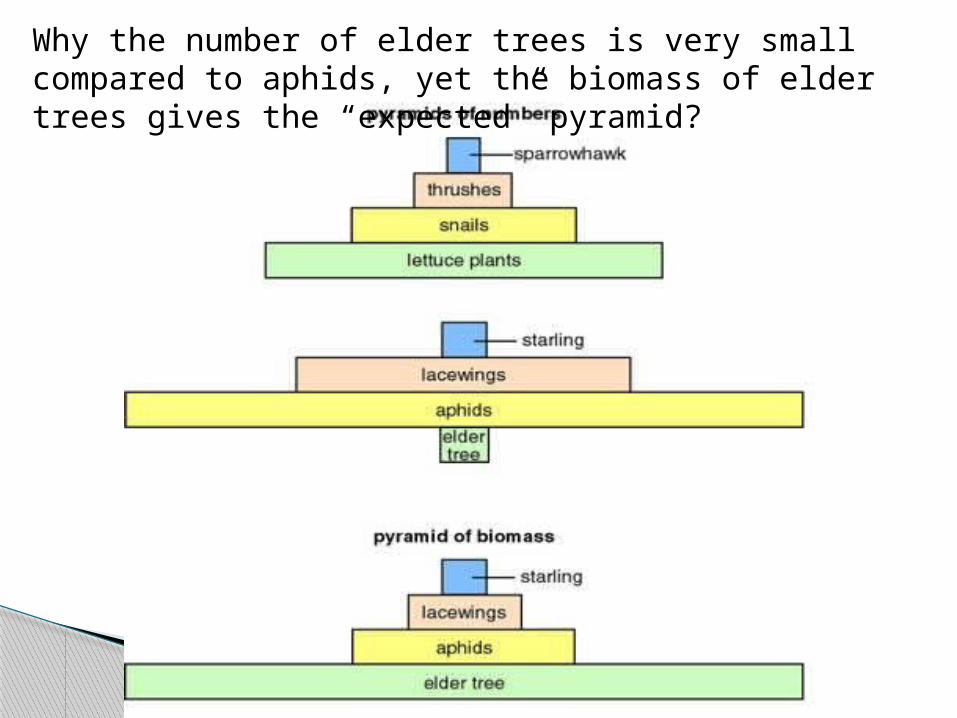
Why the number of elder trees is very small compared to aphids, yet the biomass of elder trees gives the “expected” pyramid?

Look at the next pyramid and analyse it closely.
What are the units of measurement? Why are some lines dashed and some
solid? How many trophic levels are shown? Does the Rule of 10 apply? Explain your answer.
Extracting Data from Graphics
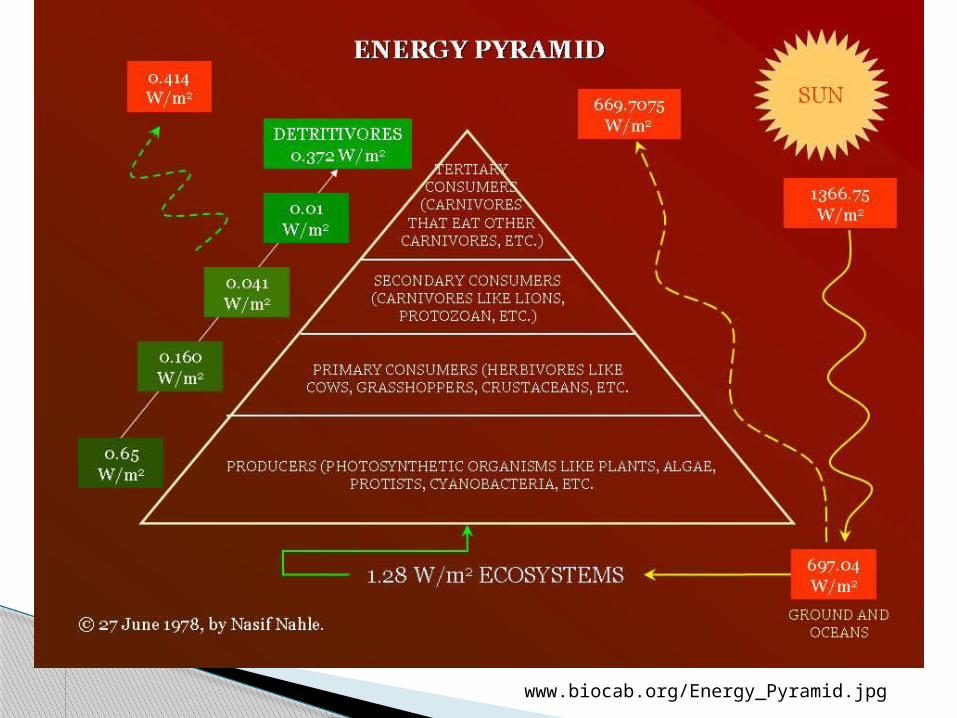
www.biocab.org/Energy_Pyramid.jpg
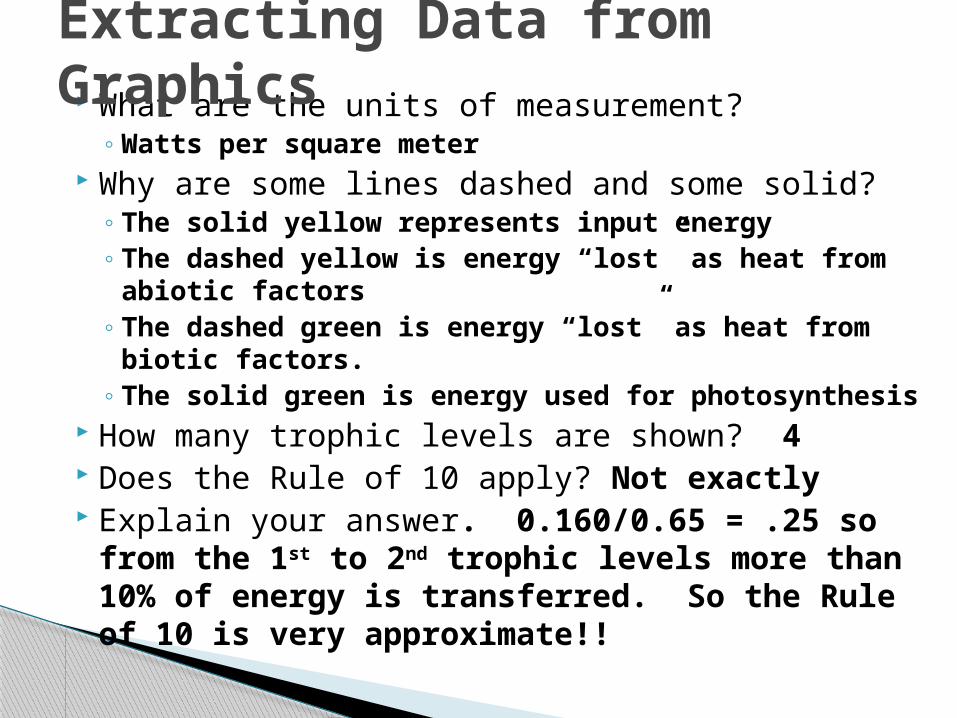
What are the units of measurement?◦ Watts per square meter
Why are some lines dashed and some solid?◦ The solid yellow represents input energy◦ The dashed yellow is energy “lost” as heat from
abiotic factors◦ The dashed green is energy “lost” as heat from
biotic factors.◦ The solid green is energy used for photosynthesis
How many trophic levels are shown? 4 Does the Rule of 10 apply? Not exactly Explain your answer. 0.160/0.65 = .25 so from
the 1st to 2nd trophic levels more than 10% of energy is transferred. So the Rule of 10 is very approximate!!
Extracting Data from Graphics

ridge.icu.ac.jp/gen-ed/ecosystem-jpgs/flow-of-energy.jpg
What can you learn from this diagram?