energy future - 20040116 energy future how do we move to a sustainable energy world? b. k. richard...
Post on 21-Dec-2015
215 views
TRANSCRIPT

Energy Future - 20040116
Energy FutureHow Do We Move To A Sustainable Energy World?
B. K. [email protected] for:EE 563, Winter Quarter 2004California Polytechnic State University
Energy Future - 20040116
Is there an energy issue? A crisis?
What are the dominant concerns?
What are the dominant solutions?
In the context of sustainability …
Energy Future - 20040116
Outline
What is the context for our energy future?
What are the issues?
What options are best?
What can an EE do about it?

Energy Future - 20040116
Disclaimer• The speaker has no formal training in energy policy or on
the specific technologies involved• At best, this is a simple, partial thread through a mass of
complex data, ideas, and opinions• The briefing is a “systems engineering view”:
– Try to understand the highest leverage items or trends– Attack the hard stuff and come up with a “good enough” answer
• 50-100 years into the future is a long time or … “It’s hard to make predictions, especially about the future” (Yogi Berra).

Energy Future - 20040116
Reminder
• It’s easy to see the downside, the looming problem• It’s harder to see the innovation and breakthrough
– When there is a need, we are incredibly resourceful in producing solutions
• “They will solve this problem”
They is … us!

Energy Future - 20040116
Measures
• This briefing will attempt to put energy units into Quads to match up with the approach in Energy Revolution, Geller.– A Quad is 1015 BTU– 1 Million Barrels/Day for a Year Of Oil Is 2.12 Quads– A barrel is 42 gallons– 1 TW.h = 3.6*1015 Joules
• See http://www.neb-one.gc.ca/stats/moreconversions_e.pdf for all kinds of conversions and energy contents.
• For two key points of reference:– The U.S. used 97.3 Quads of oil in 2001 (approximately 70
percent of it came from outside the U.S). (Approx. 3.3 TW)– It is anticipated that the U.S. will use approximately 139 Quads
in 2025 (this is the Energy Information Administration (DOE) “reference” estimate)
Key Numbers To Remember

Energy Future - 20040116
Major References
• Nathan Lewis, National Academy of Sciences papers.• Energy Information Administration, DoE. www.eia.doe.gov• IPCC* Synthesis Report, 2001, Morrocco.• Wim Turkenberg, Utrecht University, Netherlands. (Talk 2002).• UCEI (www.ucei.berkeley.edu)• Stanford Global Climate and Energy Project, http://
gcep.stanford.edu/• Rist, Curtis, “Why we’ll never run out of oil”, Discover, June 1999• Goodstein, David, Running Out Of Gas, 2004• Yergin, Daniel, “Imagining a $7-a-Gallon Future”, New York
Times, April 4, 2004• The Solar Fraud, Howard C, Hayden, 2001
*Intergovernmental Panel on Climate Change

Energy Future - 20040116
Context

Energy Future - 20040116
Energy Future: Context
• Fossil fuel is plentiful (and inexpensive)– Oil supply is in 10s of years (Lewis*: 40-80)– Gas supply is over 100 years (Lewis: 200-500)– Coal supply is several 100 years (Lewis: 200–2000)
• 85% of the world’s energy is supplied by fossil fuel• No new nuclear energy generation capacity has been
added in decades• Renewable energy sources contribute an extremely small
portion of the overall world requirement• Economic development has been and continues to be
dependent on “cheap energy”– Some correlate population with energy production
*Nathan Lewis reference is cited frequently.

Energy Future - 20040116
More Facts• 20% of U.S. Oil comes from the Persian Gulf
– 40% comes from OPEC nations; – 70% of U.S. oil from outside the U.S.– U.S. consumes 26% of the world’s total petroleum
• China is next with 10%• Russia uses 7%
• Oil prices:– Peak at $59.41 in 1980 (in 1996 dollars)– Retail energy price of gasoline in Japan ($3.40) and
Germany ($3.35).• Per capita consumption of energy:
– U. S. 342 BTU; Germany/Japan 170; China 30
Source: EIA
Energy Future - 20040116
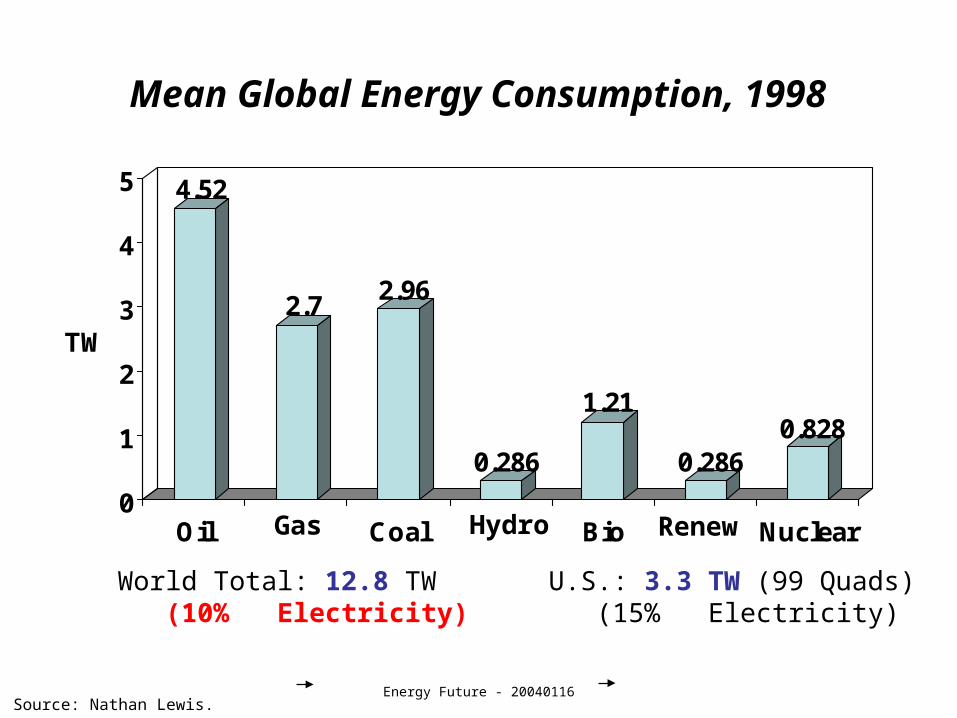
Mean Global Energy Consumption, 1998
4.52
2.72.96
0.286
1.21
0.2860.828
0
1
2
3
4
5
TW
Oil Coal Bio NuclearGas Hydro Renew
World Total: 12.8 TW U.S.: 3.3 TW (99 Quads) (10% Electricity) (15% Electricity)
Source: Nathan Lewis.

Energy Future - 20040116
Energy Reserves
0
50000
100000
150000
200000
(Exa)J
OilRsv
OilRes
GasRsv
GasRes
CoalRsv
CoalRes
Unconv
Conv
Reserves/(1998 Consumption/yr) Resource Base/(1998 Consumption/yr)Oil 40-78 51-151Gas 68-176 207-590Coal 224 2160
Rsv=ReservesRes=Resources
Source: Nathan Lewis.
Energy Future - 20040116
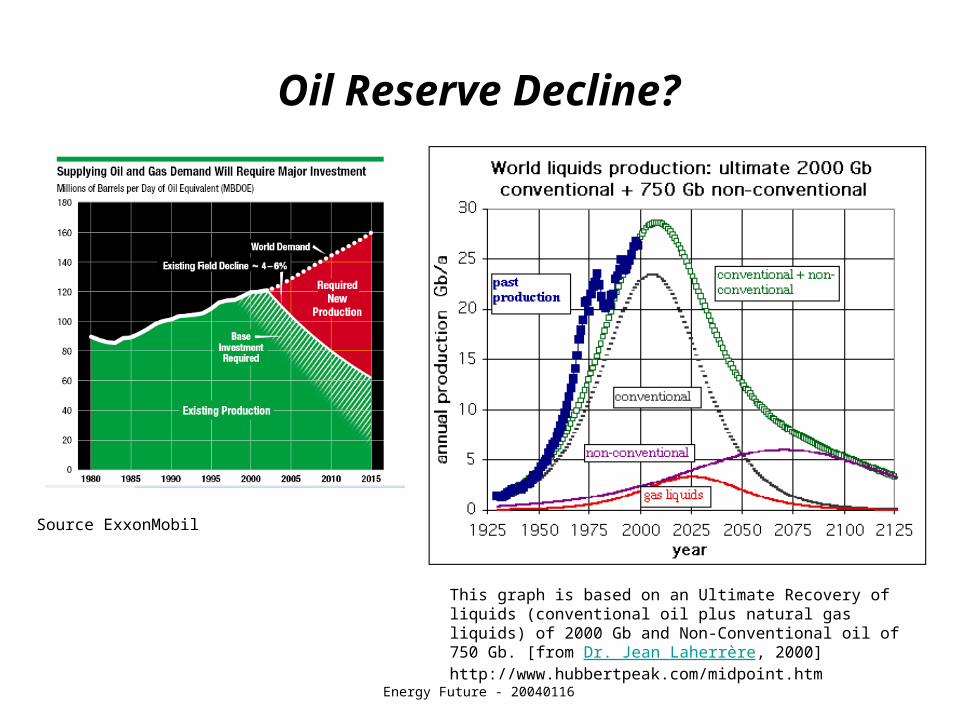
Oil Reserve Decline?
Source ExxonMobil
This graph is based on an Ultimate Recovery of liquids (conventional oil plus natural gas liquids) of 2000 Gb and Non-Conventional oil of 750 Gb. [from Dr. Jean Laherrère, 2000] http://www.hubbertpeak.com/midpoint.htm

Energy Future - 20040116
Oil Has No Dominant ProducerWorld Oil Production 2002
(Total Production = 76 M Barrels Per Day)
Mexico, 3,177Oman, 897
Russia, 7,408
Syria, 511
US, 5,746
Norw ay, 2,990
UK, 2,292
North Sea, 5,657 Iran, 3,444
Iraq, 2,023
Kuw ait1, 1,894
Libya, 1,319
Nigeria, 2,118
Qatar, 679
UAE, 2,082
Venezuela , 2,604
Saudi Arabia1, 7,634
Malaysia, 676
Brazil, 1,455
Angola, 896
Colombia, 577 China, 3,390
Ecuador, 390
Algeria, 1,306
Indonesia, 1,267
Other1, 4923.551
Canada, 2,171
Argentina, 757
Australia, 626
Gabon, 294 India, 665
Egypt, 631
Source: EIA
Energy Future - 20040116
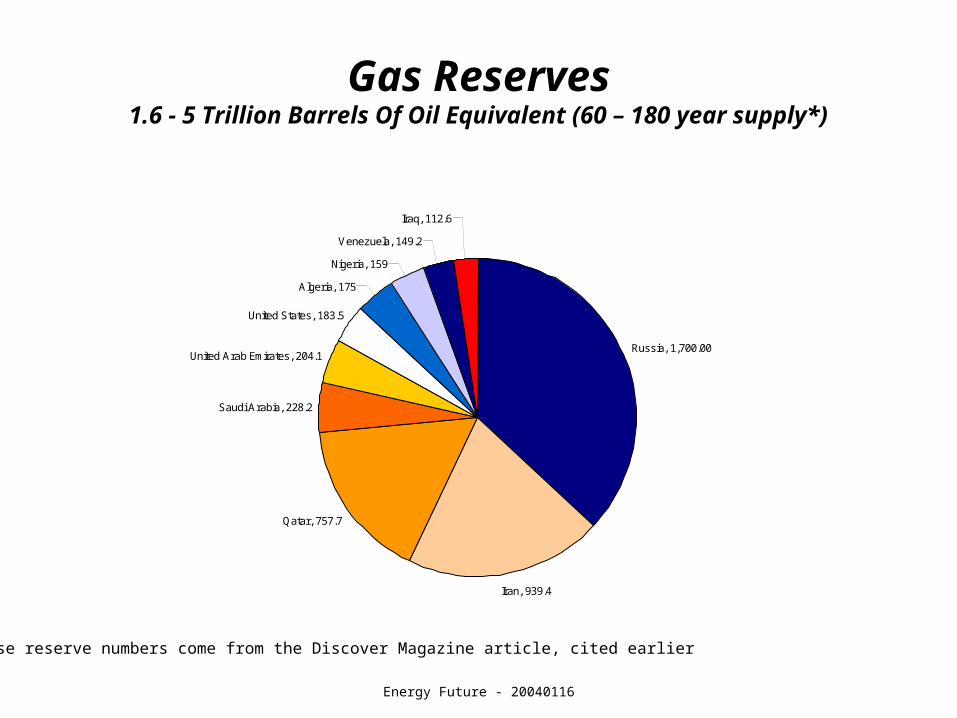
Gas Reserves1.6 - 5 Trillion Barrels Of Oil Equivalent (60 – 180 year supply*)
Russia, 1,700.00
Iran, 939.4
Qatar, 757.7
Saudi Arabia, 228.2
United Arab Emirates, 204.1
United States, 183.5
Algeria, 175
Nigeria, 159
Venezuela, 149.2
Iraq, 112.6
*These reserve numbers come from the Discover Magazine article, cited earlier

Energy Future - 20040116
Where Does Energy Go?
Use Amount (Quads) Waste (Heat)
Transport 22.2 9.8
Industry 19.4 19.4
Electricity (Generation)
29.2 3.0
Buildings (Heat)
10.6 3.0
Energy Future - 20040116
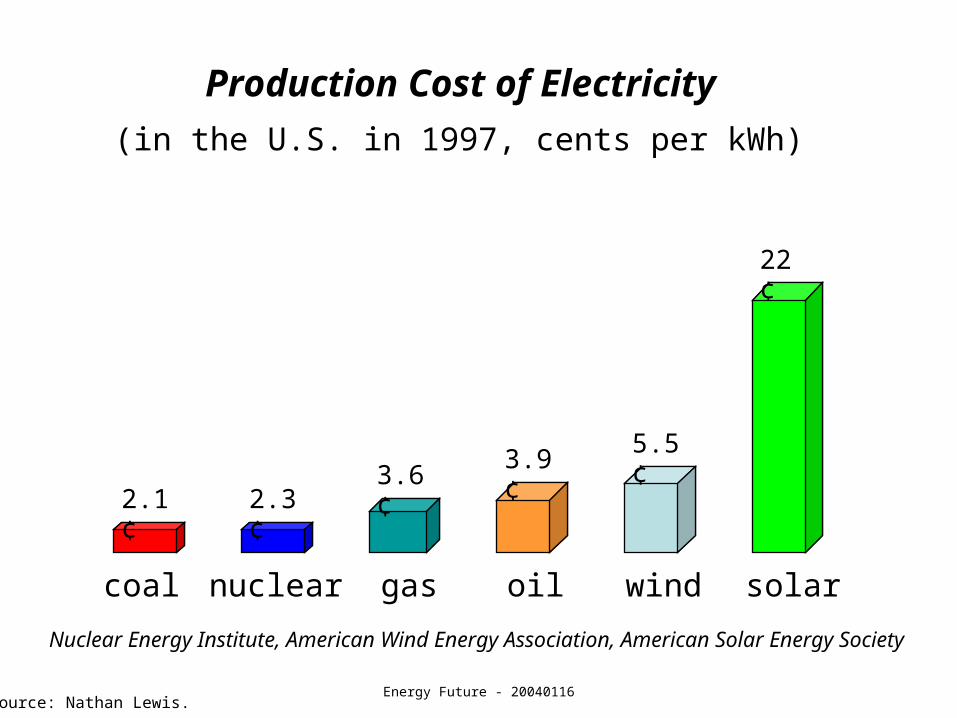
(in the U.S. in 1997, cents per kWh)
coal nuclear gas oil wind solar
2.1 ¢ 2.3 ¢3.6 ¢
3.9 ¢5.5 ¢
22 ¢
Nuclear Energy Institute, American Wind Energy Association, American Solar Energy Society
Production Cost of Electricity
Source: Nathan Lewis.
Energy Future - 20040116
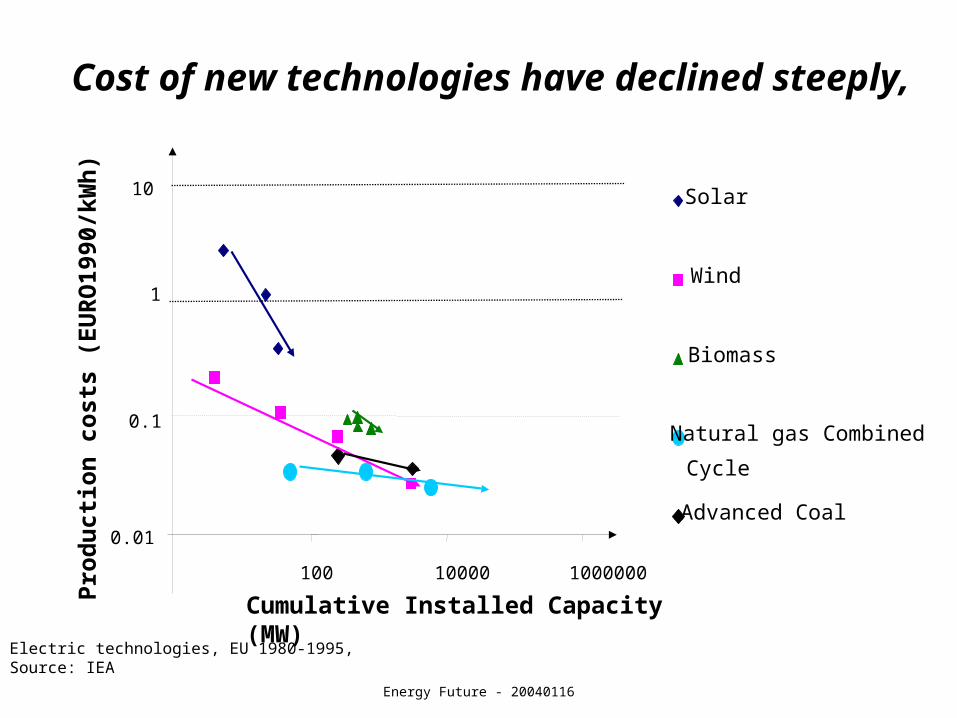
Cost of new technologies have declined steeply,
Solar
Wind
Biomass
Natural gas Combined
Cycle
Advanced Coal
Pro
du
ctio
n c
ost
s (E
UR
O19
90/k
Wh
)
0.01
0.1
1
10
Cumulative Installed Capacity (MW)
100 10000 1000000
Electric technologies, EU 1980-1995, Source: IEA

Energy Future - 20040116
Population Growth to 10 - 11 Billion People in 2050
Per Capita GDP Growthat 1.6% yr-1
Energy consumption perUnit of GDP declinesat 1.0% yr -1
Source: Nathan Lewis
Energy Future - 20040116
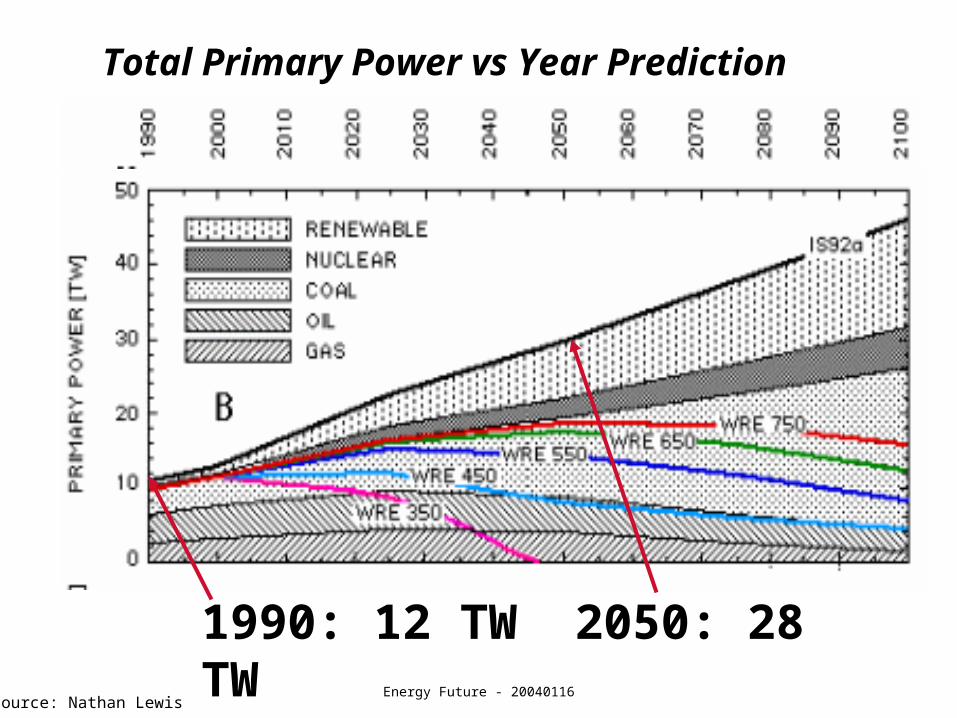
1990: 12 TW 2050: 28 TW
Total Primary Power vs Year Prediction
Source: Nathan Lewis

Energy Future - 20040116
Issues

Energy Future - 20040116
Energy Future: Issues
• A high rate of energy consumption has environmental impact– Global Warming is predicted, with a variety of side effects
• Human-induced linkage evidence is mounting– There may be increased potential for sudden, unpredictable
change• Fossil fuel consumption can produce serious direct health side
effects, predominantly respiratory illnesses, mercury poisoning, … .• Some respected forecasters predict a peak of production within 10-20
years (and related “new era economics” dealing with supply/demand)• Key energy producing countries have their own domestic agenda and
issues– May not be a collaborative or predictable supplier
• There is a “Catch-22” problem regarding new technology and infrastructure (i.e. getting investment before a crisis)

Energy Future - 20040116
A Piece Of The Data Continuum

Energy Future - 20040116
Mauna Loa "Keeting Graph"
280
290
300
310
320
330
340
350
360
370
380
1958
1960
1962
1964
1966
1968
1970
1972
1974
1976
1978
1980
1982
1984
1986
1988
1990
1992
1994
1996
1998
2000
2002
Year
Car
bo
n D
ioxi
de
(pp
mv)
At
July (ppmv)
http://cdiac.esd.ornl.gov/trends/co2/sio-mlo.htm
The “Keeting Curve”Mauna Loa, CO2 Concentrations
Recent concerns have surfaced about the rate accelerating
Energy Future - 20040116
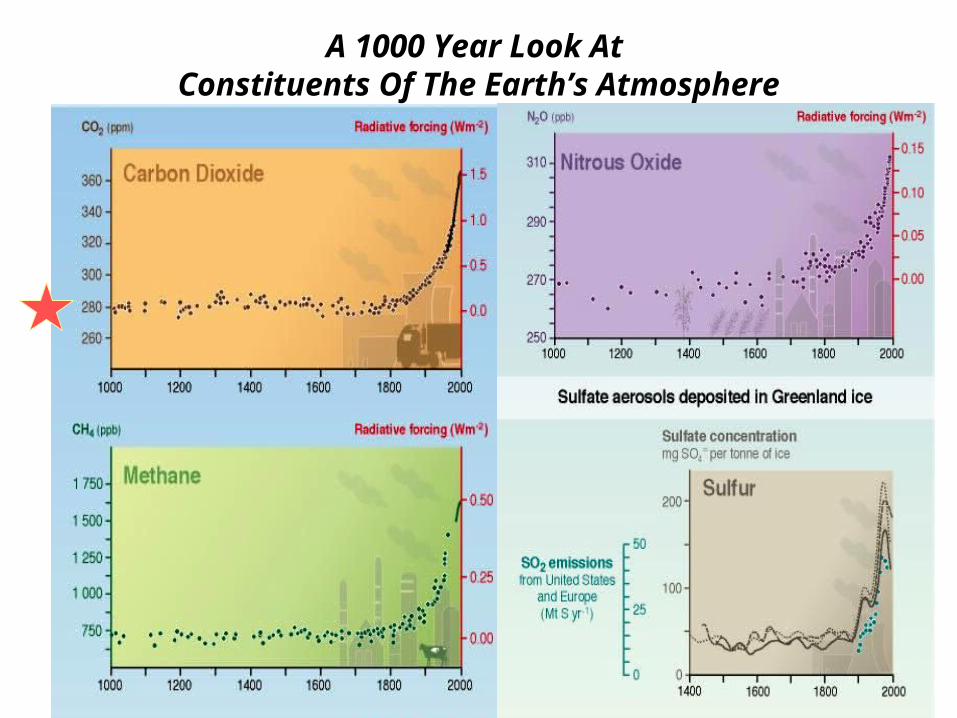
A 1000 Year Look At Constituents Of The Earth’s Atmosphere

Energy Future - 20040116
(BP 1950)
CO
2 C
on
ce
ntr
ati
on
(p
pm
v)
Projected levels of atmospheric CO2 during the next 100 years would be higher than at anytime in the last 440,000 yrs
Projected levels of atmospheric CO2 during the next 100 years would be higher than at anytime in the last 440,000 yrs

Energy Future - 20040116
The Land and Oceans have warmed
Source: IPCC

Energy Future - 20040116
Global mean surface temperatures have increased
Source: IPCC

Energy Future - 20040116
Sea Levels have risen
Source: IPCC

Energy Future - 20040116
Examples include:
• reduction in Arctic sea ice extent and thickness in summer
• non-polar glacier retreat
• earlier flowering and longer growing and breeding season for plants and animals in the Northern Hemisphere
• poleward and upward (altitudinal) migration of plants, birds, fish and insects; earlier spring migration and later departure of birds in the Northern Hemisphere
• increased incidence of coral bleaching
Changes in temperature have been associated with changes in physical and biological systems

Energy Future - 20040116
Shrinking Polar Cap: 2002
Satellite data show the area of the Arctic Ocean covered by sea ice in September 2002. This figure shows lower concentrations of ice floes than average for the period 1987-2001 in blue, and higher concentrations in yellow. The lavender line indicates a more typical ice extent (the median for 1987-2001). The white circle at the North Pole is the area not imaged by the satellite sensor.
Source: NSIDC News, http://nsidc.org/seaice/news.html

Energy Future - 20040116
Mount Kilimanjaro Ice Cap Shrinks: Soot?
• 80% of ice is gone (since 1900); formed 11000 years ago• Scientists (Hansen and Nazarenko) are finding warm winters rather
than warm summers to be the cause• Models tend to show that 25% of warming is caused by soot on
(sometimes very heavy) snow
February 17, 1993February 21, 2000

Energy Future - 20040116
The IPCC Makes The Case For Human Inducement Of Climate Change
Source: IPCC

Energy Future - 20040116
Projected concentrations of CO2 during the 21st century are two to four times the pre-industrial level
Source: IPCC
Scientists appear to be focusing on limiting the levels to 2X pre-industrial levels or 550 ppm

Energy Future - 20040116
Stabilization of the atmospheric concentration of carbon dioxide will require significant emissions reductions
(Target 550 PPM is a general “scientist goal”)

Energy Future - 20040116
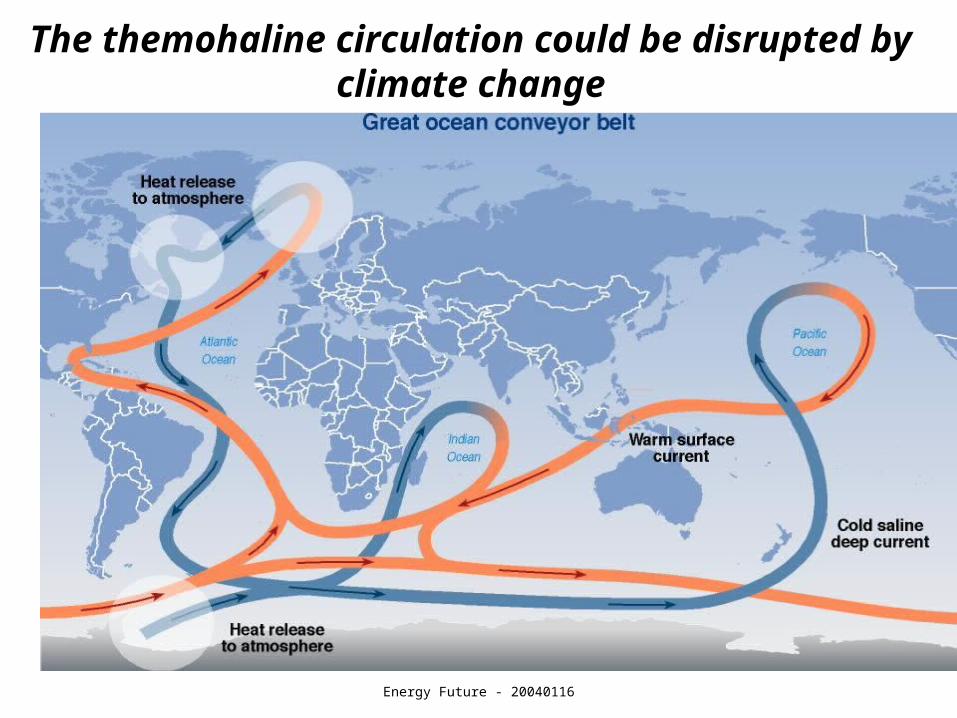
Is there potential for environmental catastrophe?
• Examples:– West Antarctica Ice Sheet Collapse– Rapid species isolation and extinction– Disruption of the themohaline circulation

Energy Future - 20040116
West Antarctica Ice Sheet Collapse?
• See: http://www.co2science.org/subject/w/summaries/wais.htm
• Most researchers believe this to be very unlikely, but– 5% chance of happening, per study led by British
Antarctic Survey– One meter ocean level rise within a century; 5 meters
over several hundred years.• Similar concerns apply to the ice sheet covering
Greenland.

Energy Future - 20040116
Will there be mass extinctions?
• From Nature, January 8, 2004: “Many plant and animal species are unlikely to survive climate change”
• 15–37% of a sample of 1,103 land plants and animals would eventually become extinct as a result of climate changes expected by 2050. – For some of these species there will no
longer be anywhere suitable to live.– Others will be unable to reach places where
the climate is suitable. • A rapid shift to technologies that do not produce
greenhouse gases, combined with carbon sequestration, could save 15–20% of species from extinction.
Energy Future - 20040116
The themohaline circulation could be disrupted by climate change
Energy Future - 20040116
The Big Picture
• To stabilize at 550 PPM of C02 (twice the pre-industrial level and one that produces roughly 2-4o C. of temperature rise) would require approx. 20 TW of carbon free power.
• In other words, the projection is that we will need as much as twice as much carbon-free power by 2050 than the total power produced, by all sources, globally, at present.
Source: Nathan Lewis

Energy Future - 20040116
Long Time Periods Are Required For CO2 Pulse To Be Absorbed
Source: IPCC

Energy Future - 20040116
Qualitative Impact of A “Carbon Pulse”
Source: IPCC

Energy Future - 20040116
The cost of compliance increases with lower stabilization levels
Tri
llio
n s o
f U
S$
Source: IPCC

Energy Future - 20040116
Projected mitigation costs are sensitive to the assumed emissions baseline
Source: IPCC
Energy Future - 20040116
Political Tipping Points Could Force Accelerated Change
• Examples:– Turbulence in Saudi Arabia or in other major oil
producers players– Terrorism fueled by hopelessness in energy “have
not” countries– China becoming the most powerful energy negotiator– Persistent disruption of key oil pipelines– Terrorist attack on LNG infrastructure– Unexpectedly high costs of recovery after production
peak

Energy Future - 20040116
Key Oil Produces Have Potentially Unstable Governments
World Oil Production 2002 (Colored By Political Stability (BKR))
Malaysia
Mexico
Oman
Russia
Syria
US
Norw ay
UK
North Sea
AngolaChina
Colombia
Ecuador
Algeria
Indonesia
Iran
Iraq
Kuw ait1
Libya
Nigeria
Qatar
Saudi Arabia1
UAE
Venezuela
Brazil
Egypt
IndiaGabon
AustraliaArgentina
Canada
Other1
Source: EIA (BKR opinion on stability)
Energy Future - 20040116
The Gap Between Rich And Poor Grows
• Energy is capital intensive– Poor countries do not have the resources– Impact: burn down the forests.– 2 B people rely on primary energy sources (e.g.
wood).– Energy costs in poorer countries range from 12-26
percent (vs a few percent in U.S.) of GDP.• Inequality between rural and urban.
– Good(?) news is that people are moving to urban areas.
Source: Geller

Energy Future - 20040116
Pollution Effects
• 500,000 deaths are attributed to air quality issues each year.– Earth Policy Institute claims 3M lives lost/yr. (vs 1M lost to traffic
fatalities)– EPI claims 70,000 deaths in U.S./yr. from pollution (vs. 40,000
traffic deaths)• 5% of deaths in urban areas are air quality related.• Almost 290,000 premature deaths each year in China, costing $50B
and 7% of GDP• Ontario estimates that pollution costs $1B in medical/hospital fees
and absenteeism for 11.9M people – Scaled to the U.S. this would be about $30B/yr.
• Mercury poisoning is now part of the public debate because of proposed EPA power plant licensing rule changes.
Source: EPI

Energy Future - 20040116
Barriers For New Technologies
• Lack of money or financing • Misplaced incentives• Pricing and tax barriers• Political obstacles• Regulatory and utility barriers• Limited supply infrastructure for energy efficient products• Quality problems (new technology doesn’t live up to
claims)• Insufficient information and training

Energy Future - 20040116
Options
Energy Future - 20040116
Energy Future: Options(An SE’s Sample Of Topics)
• Options for sources– “Reduced Carbon” fossil fuel– Renewables– Nuclear
• Options for energy transport systems– Hydrogen
• Options for efficiencies– Distributed generation– Spinning reserve
• Options for policies

Energy Future - 20040116
Energy Future: Options
Energy Future - 20040116
Energy Future: Options
• Options for sources
– “Reduced Carbon” fossil fuel
– Renewables
– Nuclear
• Options for energy transport systems
– Hydrogen
• Options for efficiencies
– Distributed generation
– Spinning reserve
• Options for policies
• Topics:– The importance of
Natural Gas– A solar future– Nuclear?– Tidal?

Energy Future - 20040116
M. I. Hoffert et. al., Nature, 1998, 395, 881
Carbon Intensity of Energy Mix
Source: Nathan Lewis

Energy Future - 20040116
LNG
• Worldwide proven reserves of Natural Gas: 5500 T ft3 – 1999 – 84 T ft3 total, worldwide production
• U.S. production of liquefied natural gas (LNG) has plateaued.
• New U.S. electric power plants are largely natural gas• Prediction: by 2020, 25% of the world’s energy will be
natural gas• Consumption:
– 1997 LNG – 4 T ft3
– 1999 LNG – 5.4 T ft3 shipped– 2010 LNG – U.S. will go from .5 T ft3 to 2.2 T ft3
Source: Arabicnews.com, 12/19/2003

Energy Future - 20040116http://www.energy.ca.gov/lng/
LNG
http://www.kryopak.com/LNGships.html
LNG requires a heavy infrastructure for cooling and transportation.
This is currently capacity limited.

Energy Future - 20040116
Coal Gasification And Sequestering
• Great Plains Coal Gasification Plant (North Dakota)• From coal to the equivalent of natural gas• Sequester carbon dioxide into oil fields to assist in
pumping– Oil field operator pays for Carbon Dioxide
http://www.dakotagas.com/
Energy Future - 20040116
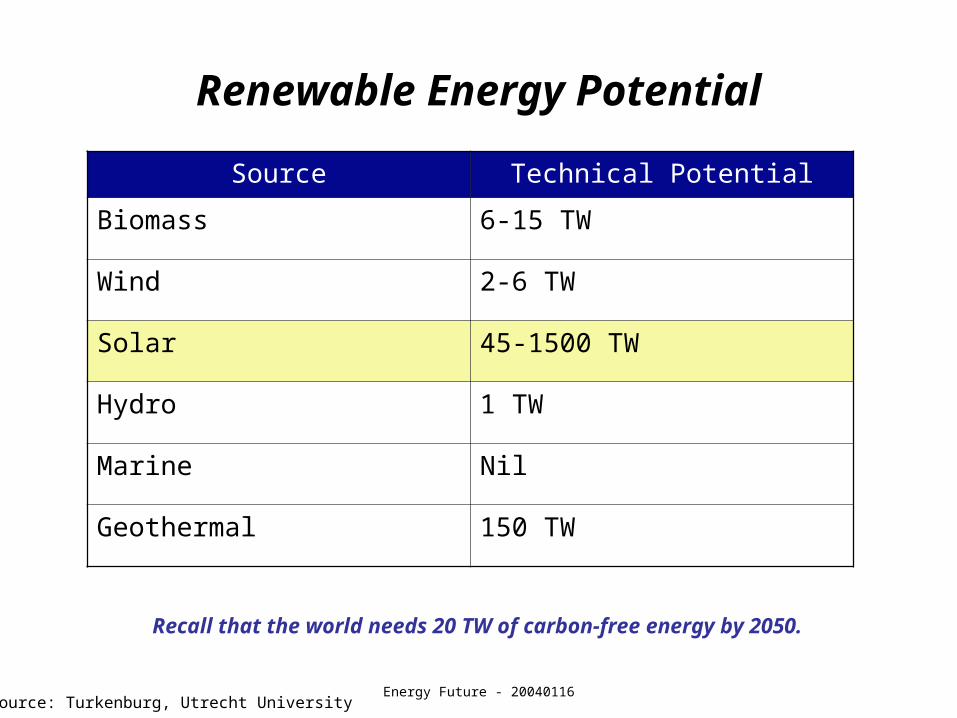
Renewable Energy Potential
Source Technical Potential
Biomass 6-15 TW
Wind 2-6 TW
Solar 45-1500 TW
Hydro 1 TW
Marine Nil
Geothermal 150 TW
Source: Turkenburg, Utrecht University
Recall that the world needs 20 TW of carbon-free energy by 2050.
Energy Future - 20040116
Source: Nathan Lewis
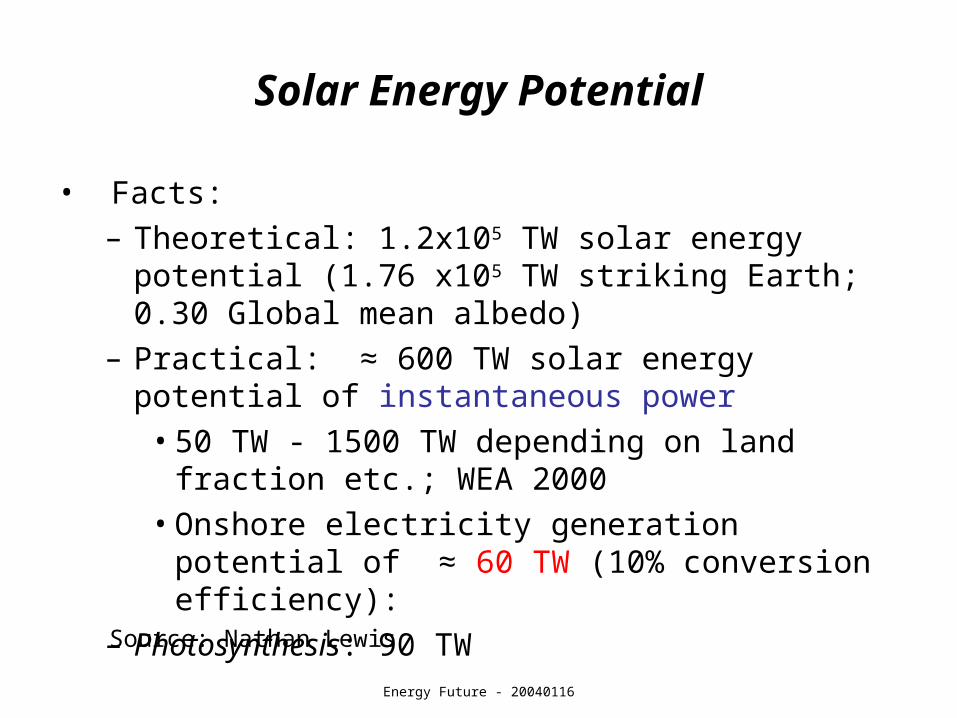
Solar Energy Potential
• Facts:– Theoretical: 1.2x10⁵ TW solar energy potential (1.76
x105 TW striking Earth; 0.30 Global mean albedo)– Practical: ≈ 600 TW solar energy potential of
instantaneous power• 50 TW - 1500 TW depending on land fraction etc.;
WEA 2000• Onshore electricity generation potential of ≈ 60
TW (10% conversion efficiency): – Photosynthesis: 90 TW

Energy Future - 20040116
Source: Nathan Lewis
Solar Thermal Energy Potential
• Roughly equal global energy use in each major sector:– transportation– residential– transformation – industrial
• World market: 1.6 TW space heating; 0.3 TW hot water; 1.3 TW process heat (solar crop drying: ≈ 0.05 TW)
• Temporal mismatch between source and demand requires storage– (DS) yields high heat production costs: ($0.03-$0.20)/kW-hr– High-T solar thermal: currently lowest cost solar electric source
($0.12-0.18/kW-hr); potential to be competitive with fossil energy in long term, but needs large areas in sunbelt
– Solar-to-electric efficiency 18-20% (research in thermochemical fuels: hydrogen, syn gas, metals)

Energy Future - 20040116
Source: Nathan Lewis
PV Land Area Requirements For U. S. Energy Independence
• Facts:– U.S. Land Area: 9.1x10¹² m2 (incl. Alaska)– Average Insolation: 200 W/m2– 2000 U.S. Primary Power Consumption: 99 Quads=
3.3 TW yr./yr.– 1999 U.S. Electricity Consumption = 0.4 TW
• Conclusions:– 3.3 TW /(2x102 W/m2 x 10% Efficiency) = 1.6x10¹¹ m2
– Requires 1.6x10¹¹ m2/ 9.1x10¹² m2 = 1.7% of Land

Energy Future - 20040116
20 TW
3 TW
Source: Nathan Lewis
PV Land Area Requirements
Energy Future - 20040116
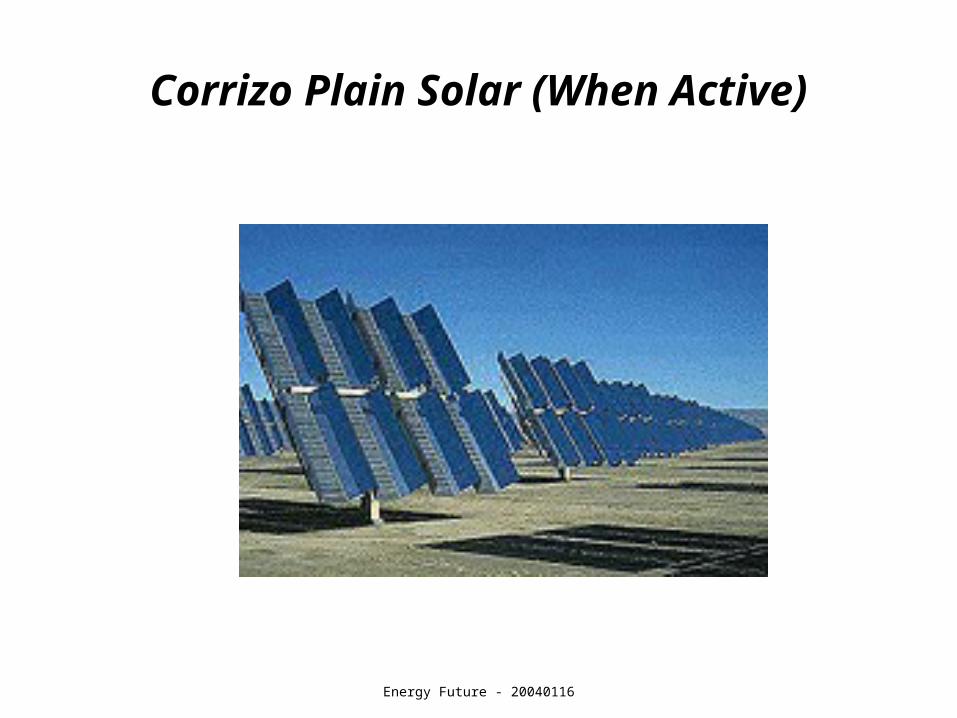
Corrizo Plain Solar (When Active)
Energy Future - 20040116
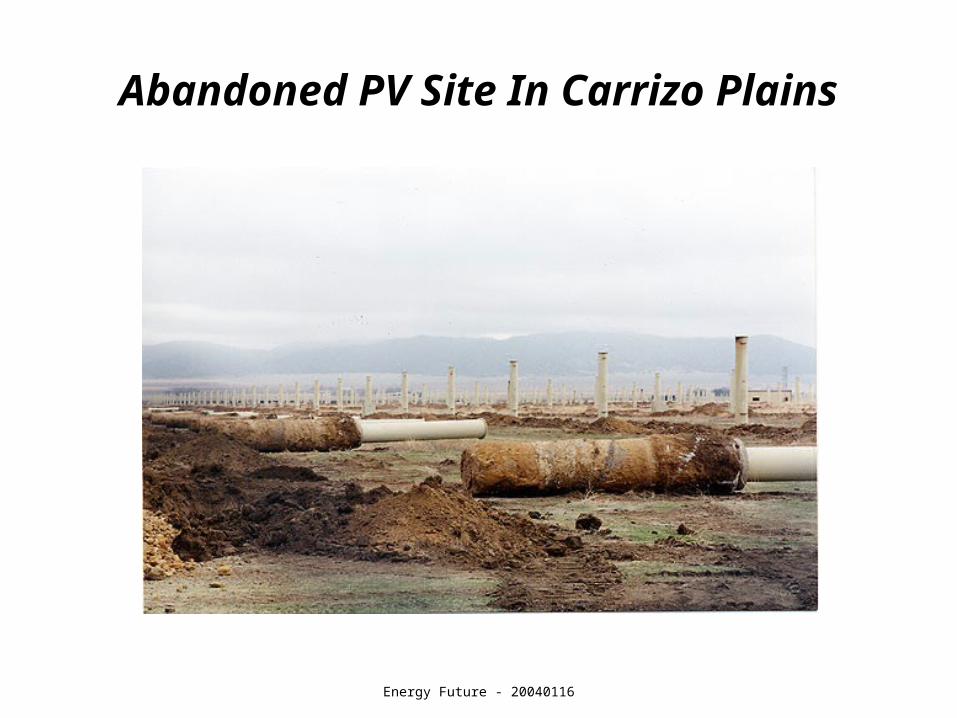
Abandoned PV Site In Carrizo Plains

Energy Future - 20040116
6 Boxes at 3.3 TW Each
Source: Nathan Lewis
A “Notional” Distribution Of PV “Farms” To Achieve 20 TW of Carbon Free Energy in 2050

Energy Future - 20040116
Source: Nathan Lewis
How Much Energy Can Be Produced On The Roofs of Houses?
• 7x10⁷ detached single family homes in U.S.– ≈2000 sq ft/roof = 44ft x 44 ft = 13 m x 13 m = 180
m2/home or … 1.2x10¹⁰ m2 total roof area• This can (only) supply 0.25 TW, or ≈1/10th of 2000 U.S.
Primary Energy Consumption
• … but this could provide local space heating, surge (daytime) capacity.

Energy Future - 20040116
SolarBuzz
http://www.solarbuzz.com/

Energy Future - 20040116
Margolis and Kammen, Science 285, 690 (1999)
1950 1960 1970 1980 1990 2000
5
10
15
20
25
Effi
cie
ncy
(%
)
Year
crystalline Si
amorphous Sinano TiO2
CIS/CIGSCdTe
Efficiency of Photovoltaic Devices
Source: Nathan Lewis
Sunpower20.4% in
2004

Energy Future - 20040116
Status Of Solar Photovoltaics
• Current efficiencies of PV modules:– 13-19% for crystaline Silicon– Performance efficiency improvement of 2X is anticipated
• Increase in PV shipments (50MW in 1991; 700 MW in 2003 (compounding at about 30%/yr.))
• Continuous reduction in investment costs up front– Rate of decline is 20%/year– Current cost is $5/Watt; target is $1/Watt (5X)
• Payback time will be reduced from 3-9 years to 1-2 years• Electricity production cost prediction:
– $.30 to $2.50/kWh would be reduced to $.05 - $.25/kWh• Over 500,000 Solar Home Systems have been installed in the last
10 years
Source: Turkenburg, Utrecht University

Energy Future - 20040116
Nuclear As An Option?
• Nuclear plants do not scale well. – Typically most effective at 1 GWatt
• To produce 10 TW of power …– 10000 new plants over the next 50 years– One every other day, somewhere in the world
• Nuclear remains an option and is re-emerging for consideration (Three Mile Island’s 25th anniversary)
• Fusion power remains as a “great hope”
Energy Future - 20040116
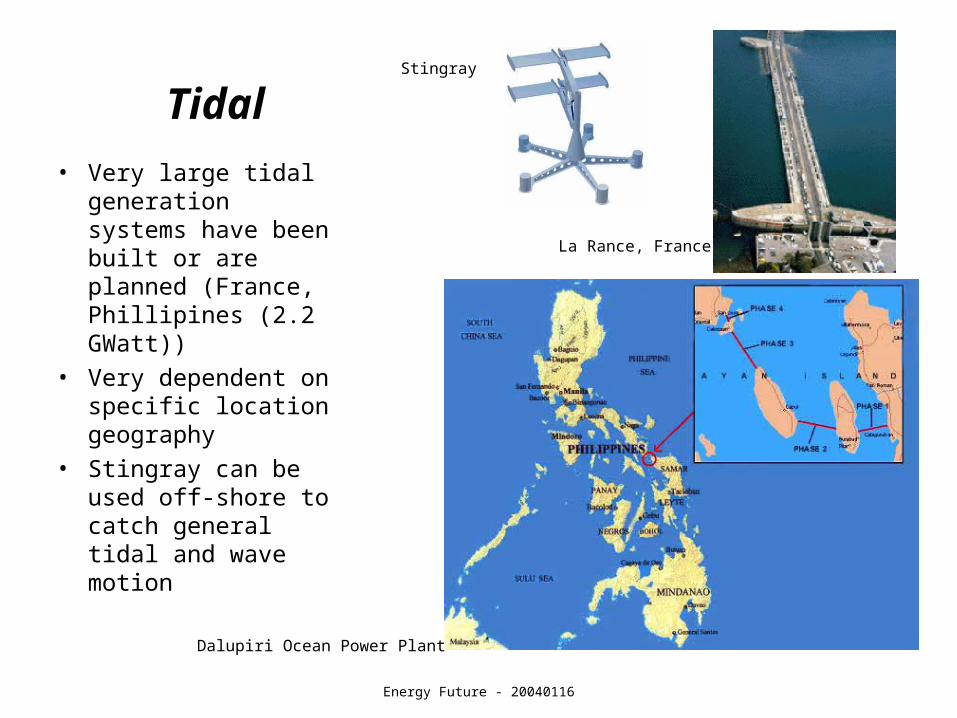
Tidal
• Very large tidal generation systems have been built or are planned (France, Phillipines (2.2 GWatt))
• Very dependent on specific location geography
• Stingray can be used off-shore to catch general tidal and wave motion
La Rance, France
Dalupiri Ocean Power Plant
Stingray

Energy Future - 20040116
Energy Future: Options
Energy Future - 20040116
Energy Future: Options
• Options for sources
– “Reduced Carbon” fossil fuel
– Renewables
– Nuclear
• Options for energy transport systems
– Hydrogen
• Options for efficiencies
– Distributed generation
– Spinning reserve
• Options for policies
• Topics:– Hydrogen– Fuel Cells

Energy Future - 20040116
Hydrogen
• Widely produced in today’s world economy– Steam-methane reformer (SMR) process– Just now, beginning to successfully scale down (e.g.
to be used at “gas stations” in future (100,000 places in U.S,).
Source: NAE Article, The Bridge, “Microgeneration Technology”, 2003
Energy Future - 20040116
Electrolysis
• Hydrogen can also be made from solar power on electrolysis of water– A liquid, transportable form can be produced
(methanol; (good catalysts exist to do this from CO2 )). This ends up as carbon neutral or CO.
• At bulk power costs of $.03/W electrolysis of water can compete with compressed or liquid H2 (transported)
– Could produce small quantities of H2 to fuel cars, even at the level of a residence

Energy Future - 20040116
Hydrogen, Again
• Fuel cells using Proton Exchange Membrane have made enormous progress, but are still expensive.
• Hydrogen storage in carbon fiber strengthened aluminum tanks.– Hydride systems and carbon from solar power on
electrolysis of water• A liquid, transportable form can be produced
(methanol; (good catalysts exist to do this from CO2). This ends up as carbon neutral.
• Hydrides appear to be promising as means of storing hydrogen gas

Energy Future - 20040116
Is there Carbon in Hydrogen?
• If used in a fuel cell, Hydrogen still produces Carbon (Dioxide) because of how it was manufactured:– 145 grams/mile if it comes from natural gas– 436 grams/mile if it comes from grid electricity
• But, for context:– 374 grams/mile if it came from gasoline (no fuel cell)– 370 grams/mile if natural gas had been used directly
(no fuel cell).– 177 grams/mile through hybrid vehicles (no fuel cell;
with natural gas)
Source: Wald, New York Times, 11/12/2003

Energy Future - 20040116
Fuel Cell TechnologyProton Exchange Membrane
Alkaline Solid Oxide Molten Carbonate
Phosphoric Acid
Operating temperature (oC)
80 80 1000 650 200
Power Density (watts/kg.)
340-1500 35-105 15-20 30-40 120-180
Efficiency (%) 40-60 40-60 45-50 50-57 40-47
Time to Operation
Seconds Minutes Hours (10) Hours (10) Hours (2)
Platinum Used
Yes No No No No
Issues Cost, stability, maturity
Time, density Time, temp, scale
Time, temp, scale
Time, temp, scale
Fuel Pure H2, Methane, Reformed Methanol
Pure H2 Natural Gas; Syn-Gas
Natural Gas; Syn-Gas
Reformed Natural Gas.
Source: CETC

Energy Future - 20040116
Fuel Cell Power Generation Is Emerging
Source: Ballard

Energy Future - 20040116
Energy Future: Options
Energy Future - 20040116
Energy Future: Options
• Options for sources
– “Reduced Carbon” fossil fuel
– Renewables
– Nuclear
• Options for energy transport systems
– Hydrogen
• Options for efficiencies
– Distributed generation
– Spinning reserve
• Options for policies
• Topics:– Distributed Power
Generation– Spinning capacity

Energy Future - 20040116
Microgeneration Technology(Distributed Generation)
• 7% of the world’s energy is generated on a distributed basis– In some countries this is up to 50%
• Generate power close to the load– 10 – 1000 kW (traditional power plants are 100 – 1000 MW)
• Internal Combustion, Turbine, Stirling Cycle (with efficiencies approaching 40%), Solid-oxide fuel cells (over 40% efficiency), Wind Turbines, PV
– Modular (support incremental additions of capacity)– Low(er) capital cost– Waste heat can be captured and used locally via Combined
Heat and Power (CHP) systems• Storage technology is also moving forward to deal with localized
capacity (e.g. zinc-air fuel cell).
Source: NAE Article, The Bridge, “Microgeneration Technology”, 2003
Energy Future - 20040116
Spinning Reserves From Responsive Loads
• How to avoid significant “reserves” in power generation?• Control both generation and load:
– Historically only generation was controlled– Network technology enables control of load (through
management of numerous small resources)
Source: Oak Ridge Research Report, March 2003.

Energy Future - 20040116
Spinning Reserve From Responsive Loads(Smart Energy)
Carrier ComfortChoice themostatsprovide significant monitoring capability
- Hourly data- No. of minutes of compressor/heater operation- No. of starts- Average temperature- Hour end temperature trend- Event data- Accurate signal receipt and control action time
stamp

Energy Future - 20040116
Conservation
• Hybrid Vehicles• Space heating• Water heating• Co-generation

Energy Future - 20040116
Energy Future: Options(Policies)
Energy Future - 20040116
Energy Future: Options
• Options for sources
– “Reduced Carbon” fossil fuel
– Renewables
– Nuclear
• Options for energy transport systems
– Hydrogen
• Options for efficiencies
– Distributed generation
– Spinning reserve
• Options for policies
• Topics:– Taxes– Forced Standards– Research and
Development

Energy Future - 20040116
Energy Future: The EE Role
• Electricity is the future– Most energy sources will come via electricity
• Systems will have to be significantly more efficient, smarter:– More distribution– More connectivity (communication)– More intelligence– More information– More integration– More transparency
• The entire energy infrastructure will have to be changed within 50-100 years
Electrical Engineers will play a critical role in making this transition effective

Energy Future - 20040116
Conclusions

Energy Future - 20040116
Conclusions (Mine)• There is an “energy problem” (and a “carbon problem”), an unsustainable
dependence on fossil fuel• Market forces and innovation will play a major role, but are not responsive
enough to deal with mass scale, current low costs of energy, and long time constants– The economic impact of a forced shift from fossil fuels is unacceptable– Policy shifts and long term investment are needed
• Natural Gas to Solar is the most visible path to sustainability, today– Major, near term investment in Natural Gas infrastructure is needed– Cost of a major solar power infrastructure is daunting, but we should
organize ourselves for this eventuality• Hydrogen can/will become an important transport system (start with methane
derived hydrogen and move toward renewable resource driven hydrogen)• Known efficiencies can produce near term gains. E.g., Distributed power (with
co-generation of heat), “smart power”, hybrids• Substantial investment in renewable energy research is justifiable
– Sufficient research is needed to achieve attractive economies of scale

Energy Future - 20040116
Questions and Comments