energy goals and integrated design
TRANSCRIPT

Energy Goals and Integrated Design
August 10, 2016USGBC Missouri Gateway Seminar
Terry E. Townsend, P.E., FASHRAE, LEED®APPresidential Member (2006-2007)
Produced By: Developed By: In partnership with:
Getting to Net-Zero Energy Buildings & Beyond!
A Sustainable Future is no longer just a topic for discussion but rather a serious global objective. I t is now
critical for definitive design guidance, innovative architectural and engineering applications and lead ing -edge research to be initiated as the principal focu s of
these global professional organizations…….
AIA, ASHRAE, IES & USGBC

The 2030 Challenge
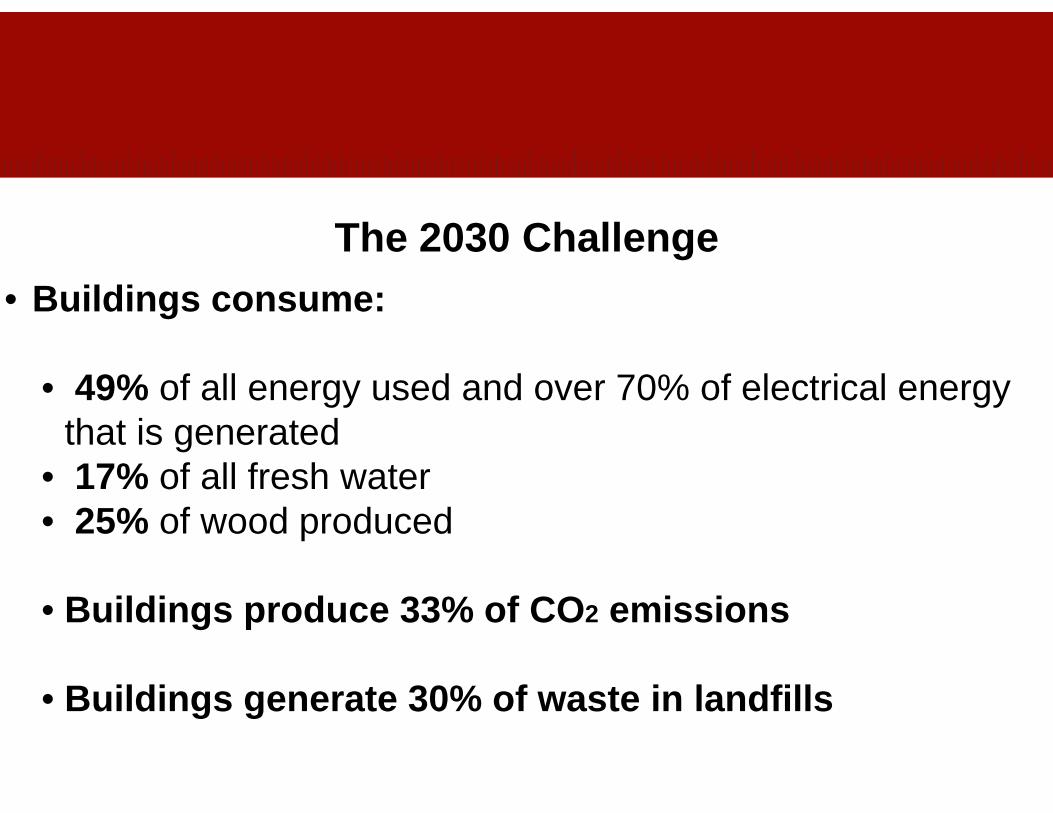
The 2030 Challenge• Buildings consume:
• 49% of all energy used and over 70% of electrical energy that is generated
• 17% of all fresh water• 25% of wood produced
• Buildings produce 33% of CO 2 emissions
• Buildings generate 30% of waste in landfills

The 2030 Challenge

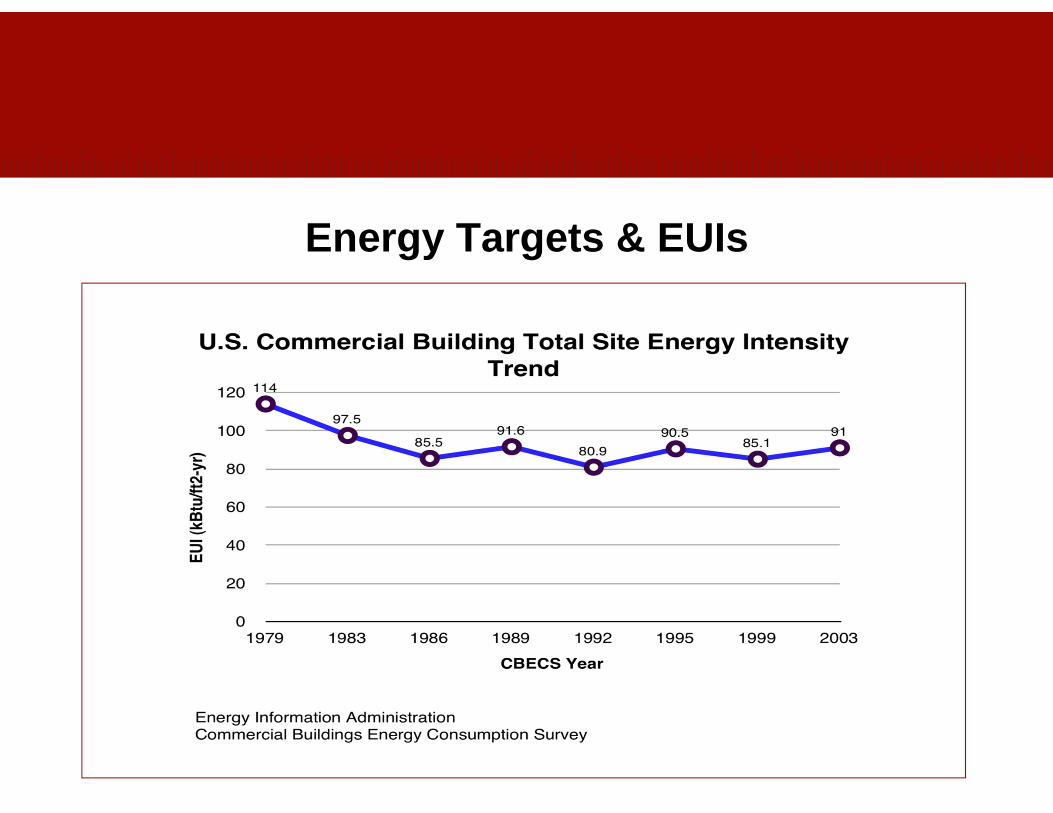
Energy Targets & EUIsTwo Types of Targets Should be Developed:
* Energy Use Index/Intensity (EUI) – includes no on-siterenewable energy generation
EUI = Total Annual Energy Use (kBtu/SF-yr)Gross Floor Area
* Net Energy Use Intensity (NEUI) – includes photovoltaicand other on-site renewable energy production
NEUI = Net Annual Energy Use (kBtu/SF-yr)Gross Floor Area

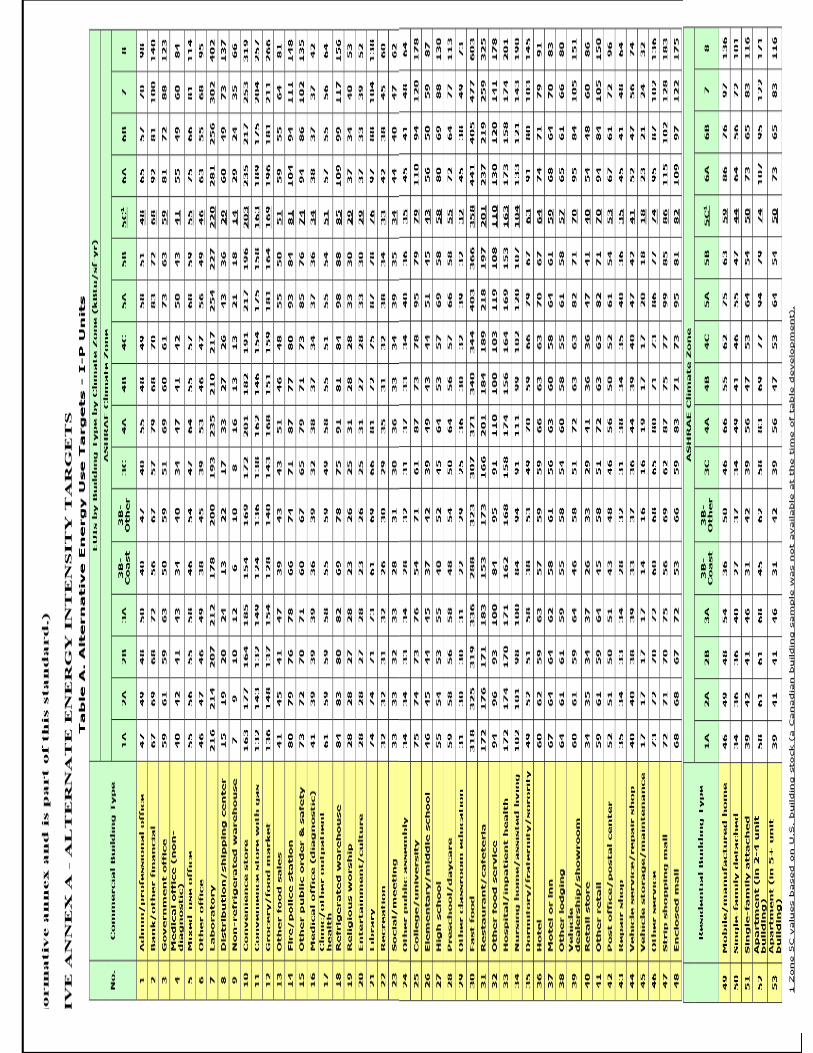
2030 Energy Targets & EUIs (kBTU/SF/Yr)
Building Type 50% 60% 70% 80% 90%
College/Univ. 60.0 48.0 36.0 24.0 12.0
Restaurant 151.0 120.8 90.6 60.4 30.2
Churches 23.0 18.4 12.8 9.2 4.6
Healthcare 62.0 49.6 37.2 24.8 12.4
Malls 53.5 42.8 32.1 21.4 10.7

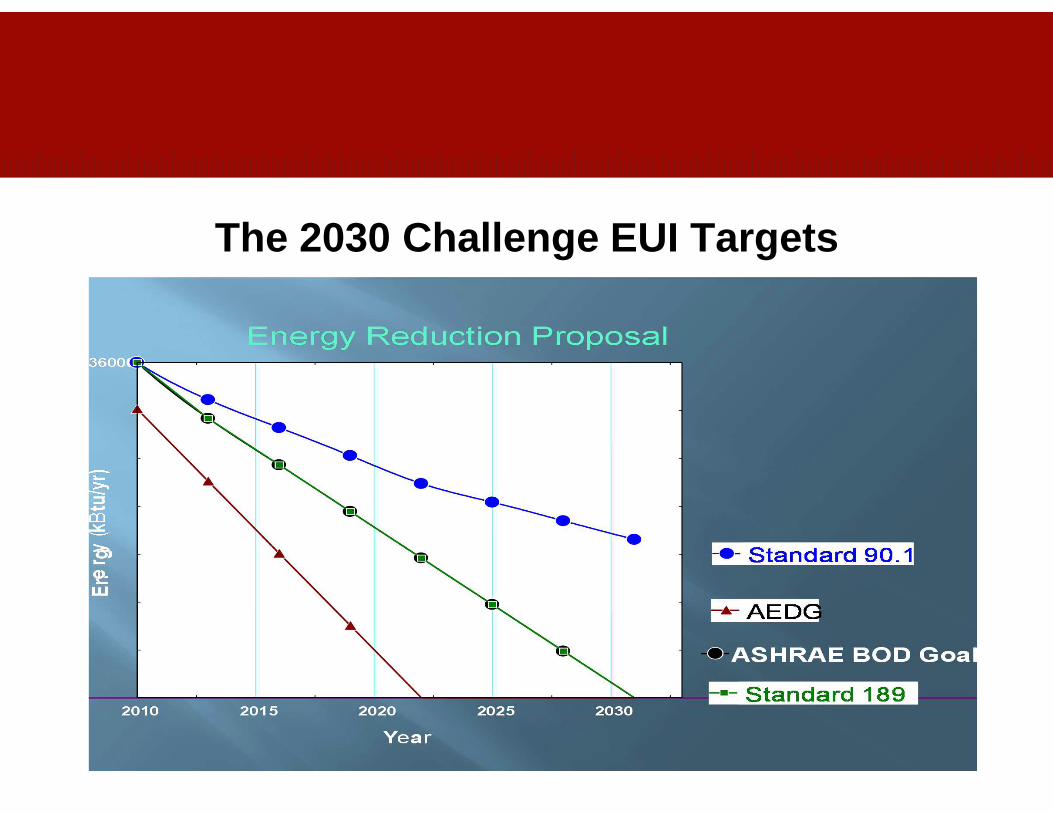
The 2030 Challenge EUI Targets
ASHRAE 90.1/189.12010 – 36 kBtu/ft2/yr
2013 – 302016 – 252019 – 202022 – 152025 – 102028 – 5
2030 – Net 0
Architecture 20302010 – 36 kBtu/ft2/yr
2015 – 272020 – 18 2025 – 9
2030 – Net 0
The 2030 Challenge EUI Targets

Traditional vs Integrated Design Teams
Traditional Project
Owner----->Architect
Consulting Engineers
Cost Consultants
Commissioning Authority
Contractors
Integrated Project
Design Team Leader(Arch/Eng/PM/CM)
+Commissioning Authority
Design Team MembersCost Consultants
Design Specialists-(Security, Communications, etc..)
Facility PersonnelOccupant’s Representatives
Contractors

Integrated Design Project’s Phases
Design Phase• Pre-Design (Project Kickoff, Programming & Concept
Design)• Initiation of Commissioning (Cx) Activities• Schematic Design & Design Development• Construction Documents & Bid Process
Construction Phase• Design Team & Cx Activities
Post Occupancy Phase• Design Team Close-out & Cx M&V Activities• Development of a Performance (Ongoing) Cx Program
High Performance Integrated Design
• A Successful Integrated Design Approach Provides th e Best Energy Performance at the Least Cost and is Characterized as Follows:
1. It is Resourceful – Proper Building Orientation, Form, and Layout Provide Substantial EnergySavings
2. It is Multi-disciplinary – Process Requires Cross-Disciplinary Design and Validation at ALL Phasesof the Process

High Performance Integrated Design
3. It is Goal Driven – Early in the Design ProcessGoal Setting can Identify Strategies to Meet Energy Efficiency and Other Building Goals inAccordance with the Owner’s Project Requirements/Mission
4. It is Iterative – Goal Setting is Just the Beginning ;The Design Concept Needs to be TestedThroughout the Design Process, Optimized forMaintenance Requirements and Adjusted toProvide Acceptable Life-Cycle Costs
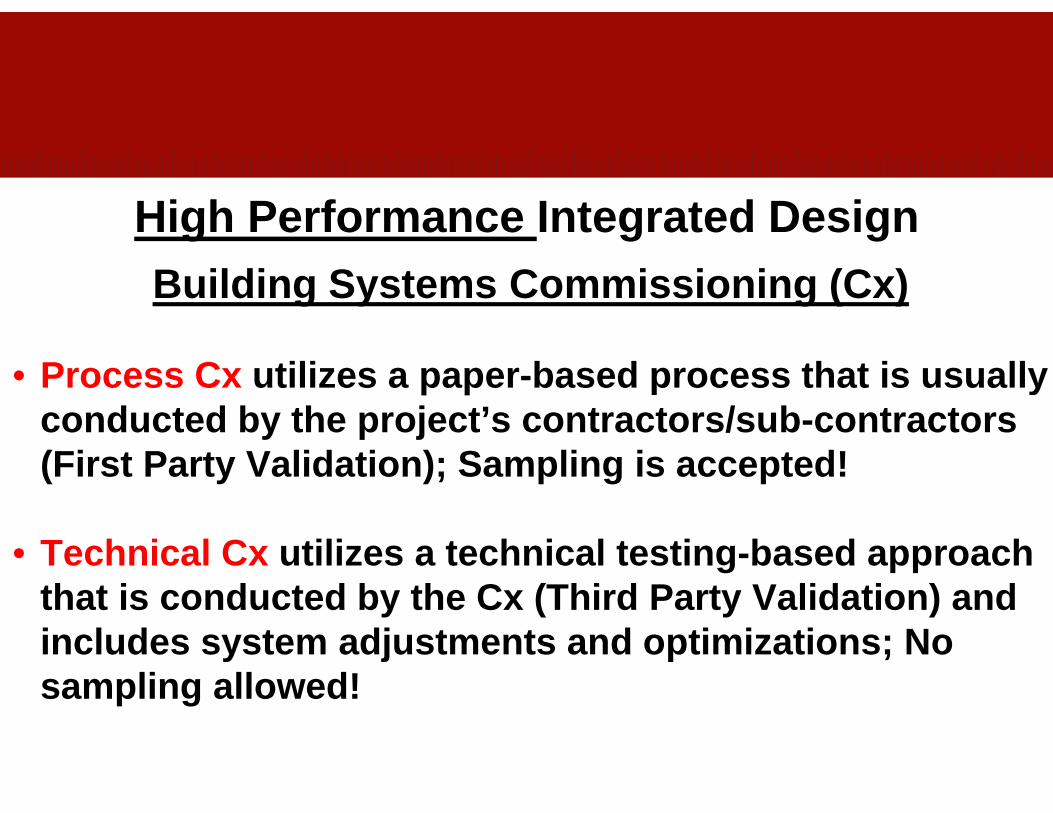
High Performance Integrated DesignBuilding Systems Commissioning (Cx)
• Process Cx utilizes a paper- based process that is usually conducted by the project’s contractors/sub -contractors (First Party Validation); Sampling is accepted!
• Technical Cx utilizes a technical testing -based approach that is conducted by the Cx (Third Party Validation ) and includes system adjustments and optimizations; No sampling allowed!

High Performance Integrated Design
Performance (On -going) Cx Deliverables
a. Deploy Performance Tools, Dashboards & Reportsb. Set Up Verification Data Protocolsc. Conduct Operator Training (as required)d. Validate Performance per Performance Cx Plane. Deliverables = Develop Improvement Opportunities;
Implement Corrections; Re-measure Performance; Record Results of Improvements; Update Performance Cx Plan; Update CFR

Indoor Air Quality GuideBest Practices for Design, Construction &
Commissioning

Advanced Energy Design Guidance

Advanced Energy Design Guidance


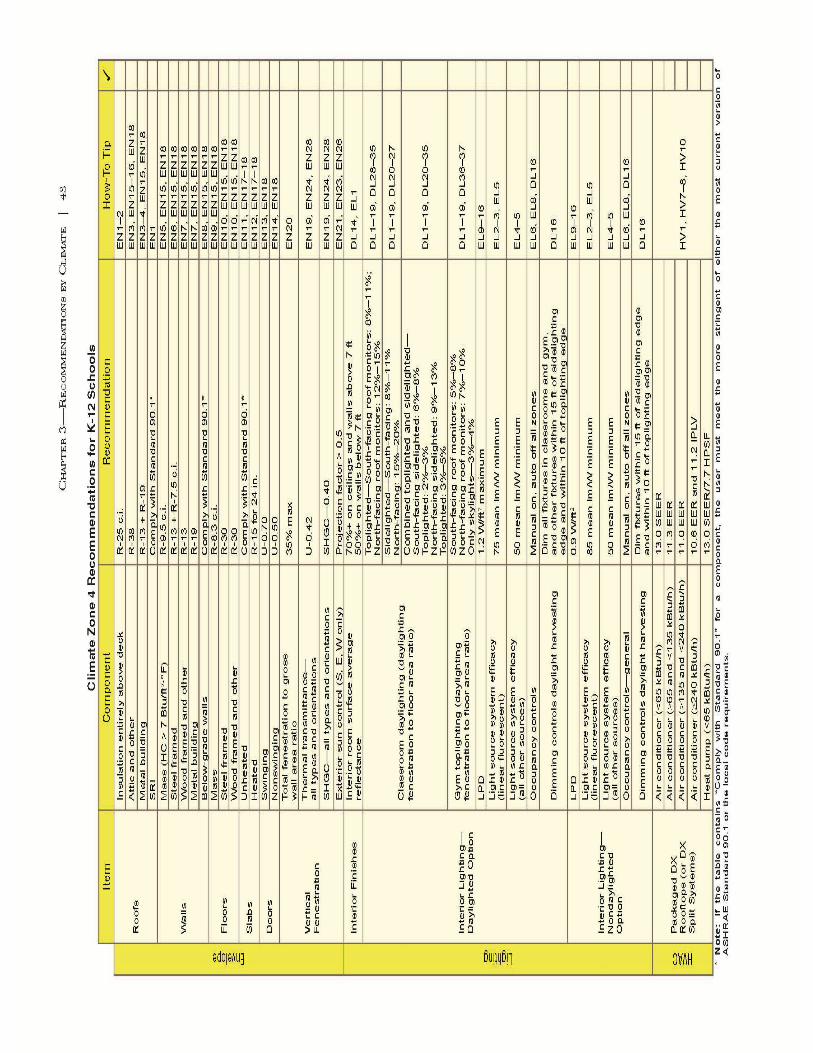

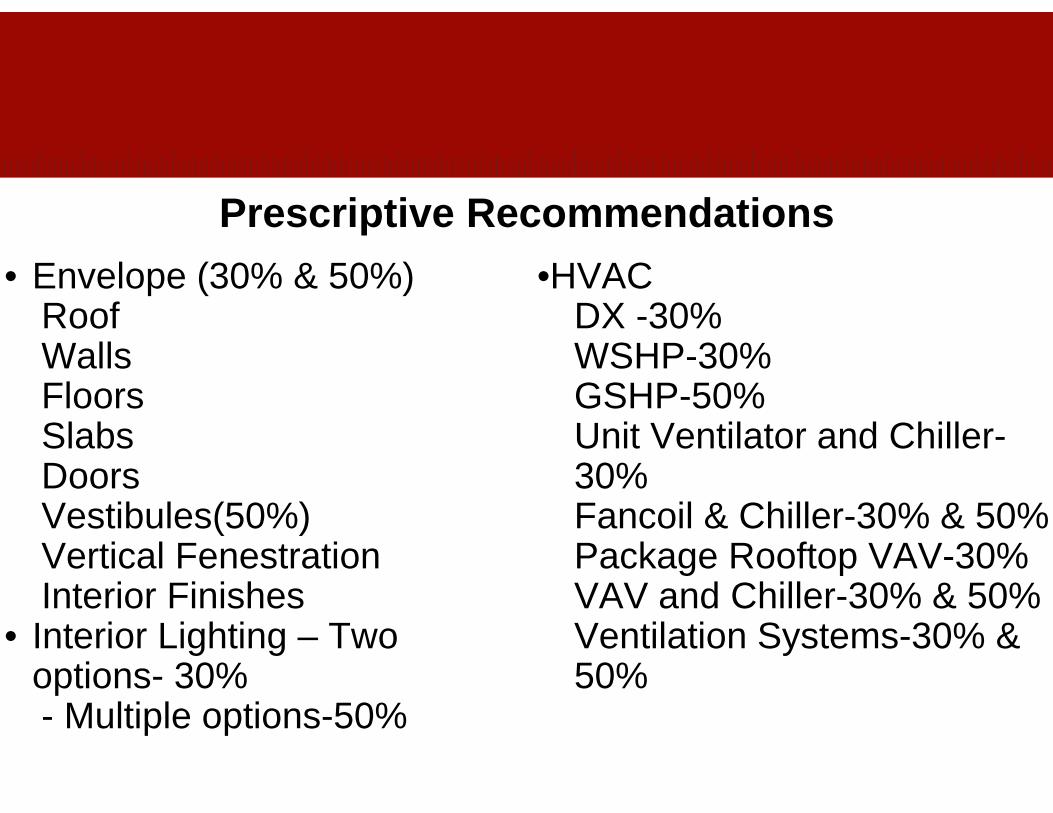
Prescriptive Recommendations
• Envelope (30% & 50%)RoofWallsFloorsSlabsDoorsVestibules(50%)Vertical FenestrationInterior Finishes
• Interior Lighting – Two options- 30%- Multiple options-50%
•HVACDX -30%WSHP-30%GSHP-50%Unit Ventilator and Chiller-30%Fancoil & Chiller-30% & 50%Package Rooftop VAV-30%VAV and Chiller-30% & 50%Ventilation Systems-30% & 50%
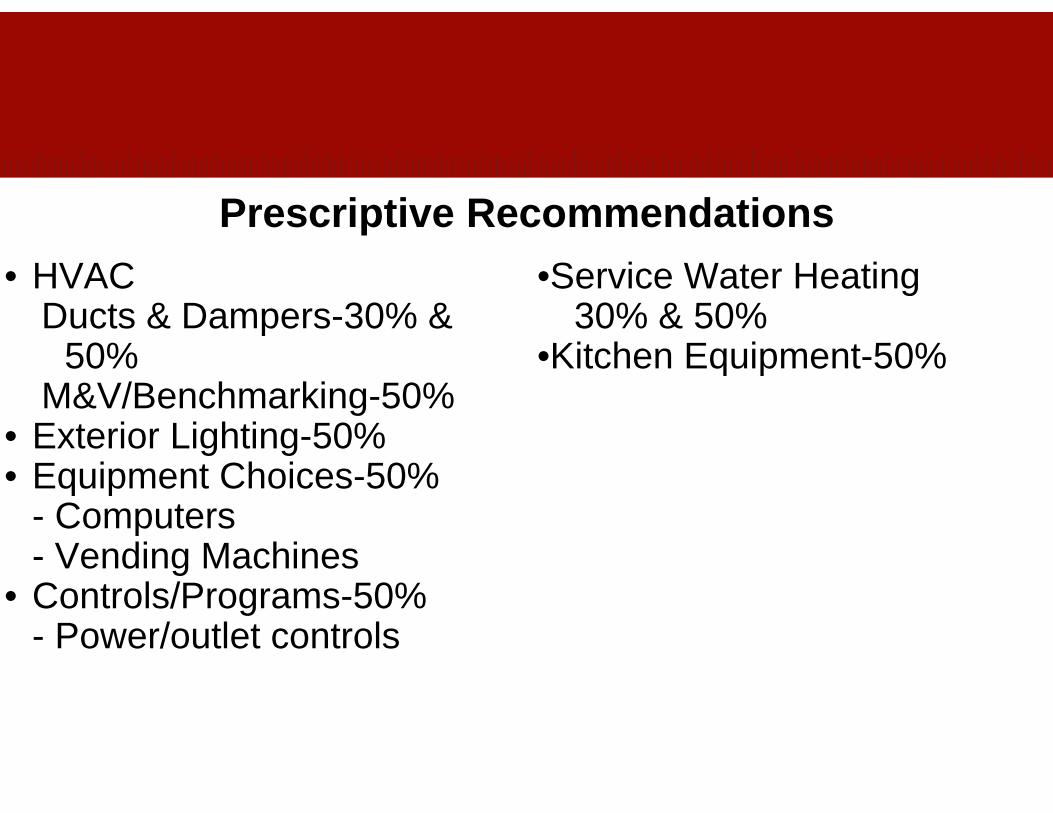
Prescriptive Recommendations
• HVACDucts & Dampers-30% &
50%M&V/Benchmarking-50%
• Exterior Lighting-50%• Equipment Choices-50%
- Computers- Vending Machines
• Controls/Programs-50%- Power/outlet controls
•Service Water Heating30% & 50%
•Kitchen Equipment-50%

• Enhanced insulation levels for many assemblies• Window-to-wall ratio (WWR) limited to 35% (30%)• Fenestration-Floor Area ration (FFR) E-W 5% (50%)
N-S 7% (50%)• Recommendations on window orientation
(An * SHGCn + As * SHGCs) > (Ae*SHGCe + Aw*SHGCw) • Exterior sun control recommendations (use of overhangs)
Envelope Recommendations
Interior Lighting
• Considerable attention given to daylighting
• Daylighting useful for increased performance of students and energy reduction
• Daylit and non-daylit options given for classrooms and gyms
• Glass divided into view glass (vertical fenestration) and daylighting glazing (sidelit, roof monitors and combined))

Interior Lighting 30% Guide
Lighting Power Density (LPD) (W/ft2 max)
Light Source System Efficacy (mean lumens/watt min)Linear Fluorescent All other sources
Lighting Controls – General
Dimming Controls – Daylight harvesting
“Efficacy” = Lumens/Watt
Daylit NonDaylit
1.2 0.9
75 8550 50
Manual On – Auto-off - all rooms
Dim fixtures within 15 ft of side-lighting and within 10 ft of top-lighting

Interior Lighting 50% Guide
Lighting Power Density (LPD) (W/ft2 max)
Light Source System Efficacy
(mean lumens/watt min)Linear Fluorescent All other sources
Lighting Controls – General
Dimming Controls –Daylight harvesting
“Efficacy” = Lumens/Watt
Whole Building
0.7
85 - 92>50
Manual On – Auto-off - all rooms
Dim all fixtures in daylightzones

HVAC Equipment and Systems• Recommendations for Multiple System Types
(30% Guide)
• Packaged DX Rooftops or Split DX• WSHP• Unit Ventilator and Chiller System• Fancoil and Chiller System• Packaged Rooftop VAV System• VAV and Chiller System
HVAC Equipment and Systems• Recommendations for Multiple System Types
(50% Guide)
• GSHP w/DOAS
• Fancoil System w/DOAS
• VAV AHU System w/DOAS

Service Water Heating – (30% Guide)
• Gas storage (>75 kBtu/h) – 90% Et
• Gas instantaneous – 0.81EF or 81% Et
• Electric storage –EF > 0.99 -0.0012* volume
• Pipe d < 1½” - 1” insulation
• Pipe d ≥ 1½” – 1½ ” insulation
• “EF” = Energy Factor

Service Water Heating – (50% Guide)• Point-of-Use - 0.82 EF or 81% Et
• Heat Pump WH – COP 3.0 (interior heat source)
• Solar Hot-water Heater – 30% solar HW fraction when LCC effective
• Gas WH (Condensing) – 95% Et
• Pipe d < 1½” ; d > 1 ½ ” - 1” insulation; 1 ½” insulation
EF” = Energy Factor

M&V/Benchmarking – (50% Guide)
• Electric Submeters – Disaggregate Submeters – Lighting,HVAC, General 120V, Renewables,& Whole Building
• Benchmarking – Begin early to address warrantyperiod issues
- Benchmark monthly energy use- Provide training on Benchmarking

“How -to” Guidance - Envelope

FREE ASHRAE PUBLICATIONS
AEDG; Advanced Energy Design
GuidesIAQG; Indoor Air
Quality Guide--
Building Systems Commissioning
• Process Cx utilizes First Party Validation = Paper-based procedures
• Technical Cx utilizes Third Party Validation = Testing-based procedures
• Phases of a Technical Cx Platform –1. Design Phase2. Construction Phase3. Post-Occupancy Phase4. “On-Going” Cx Activities

Building Systems Commissioning
• Technical Cx Design Phase Deliverables:
a. Owner’s Project Requirements (OPR)b. Issues Logc. Commissioning Pland. Updates to the Basis of Design (BOD) documentation
Building Systems Commissioning
• Technical Cx Construction Phase Deliverables:
a. Site Observation Inspections & reportsb. Pre-Functional Tests (PFTs)c. Functional Performance Tests (FPTs)d. Issues Log & Deficiency Resolutionse. Owner Training in O&M and functions of building’s systemsf. Systems’ Manualg. Final Technical Cx Report

Building Systems Commissioning
• Technical Cx Post-Occupancy Phase Deliverables:
a. Deferred Tests (PFTs and FPTs)b. Performance Verification Testing (PVT)c. Updated Final Technical Cx Report with Deferred Tests and PVTsd. Development of an On-going Technical Cx Plan and Program for Facility O&M Staff.
Building Systems Commissioning
• Technical On -Going Cx Phase Activities:
a. Deploy Performance Tools, Dashboards & Reportsb. Set Up Verification Data Protocolsc. Conduct Operator Training (as required)d. Validate Performance per O-Cx Plane. Deliverables = Develop Improvement Opportunities; Implement Corrections; Re-measure Performance; Record Results of Improvements; Update O-Cx Plan; Update CFR
New Whitmore Lake High School
• 150,000 sq.ft. in Whitmore Lake MI
• Classrooms, Natatorium, Admin. & General Offices,Cafeteria, Science Labs, Gym, Media Center, Auditorium and Large “Main Street” Common Spaces
• 1st High School in MI - LEED Silver Rating
New Whitmore Lake High School
Energy Efficiency
• Htg & Clg �Geothermal-based HVAC w/Var. Speed Pumps Circ. Glycol Solution & By-pass Valves (Reduce Total Pumping Energy)
• 46 Miles of HDPE in Horizontal & Pond (14 Ac) Loops; Pond Level Maintained (w/Well) for HVAC & Fire Protection Requirements
• All Kitchen Refrigeration Eqmt Connected to Loop Field• VAV ERVs – Pre-condition O/A w/WSHPs

New Whitmore Lake High School
Indoor Air Quality
• Air Velocities ≤ 150 FPM• Low Level R/A Inlets Increase Vent. Effectiveness• VAV Boxes Control O/A to each WSHP per BAS/CO2 Levels• Gym & Auditorium – Demand CO2 Vent Strategy (100%
Capability)• Absenteeism Decreased 12.5% � 5%; ACT Scores Now
Exceed MI State Averages (3 years in a row)
New Whitmore Lake High School
Maintenance & Operation
• Better Equipment Accessibility – Equipment Mezzanines• Repair/Remove/Replace Equipment w/o Disruptions• Reduced Filter Changeout Times• All Geo Loop Branches – Balancing Valves, Press.
Differential Readings & Thermometers (Monitor of Heat Exchange Effectiveness)
• Centralized Control of Entire Facility
.
Hybrid GeothermalSystemOptions
Reverse-Return Piping & Horizontal Loop –Single and Multiple Buildings on Loop
Reverse-Return Piping & Vertical Loop –Single and Multiple Buildings on Loop
Combination of Reverse-Return & Single Pipe Distribution Systems – Single and Multiple
Buildings

Hybrid Geothermal Systems

Hybrid Geothermal Systems

Hybrid Geothermal Systems
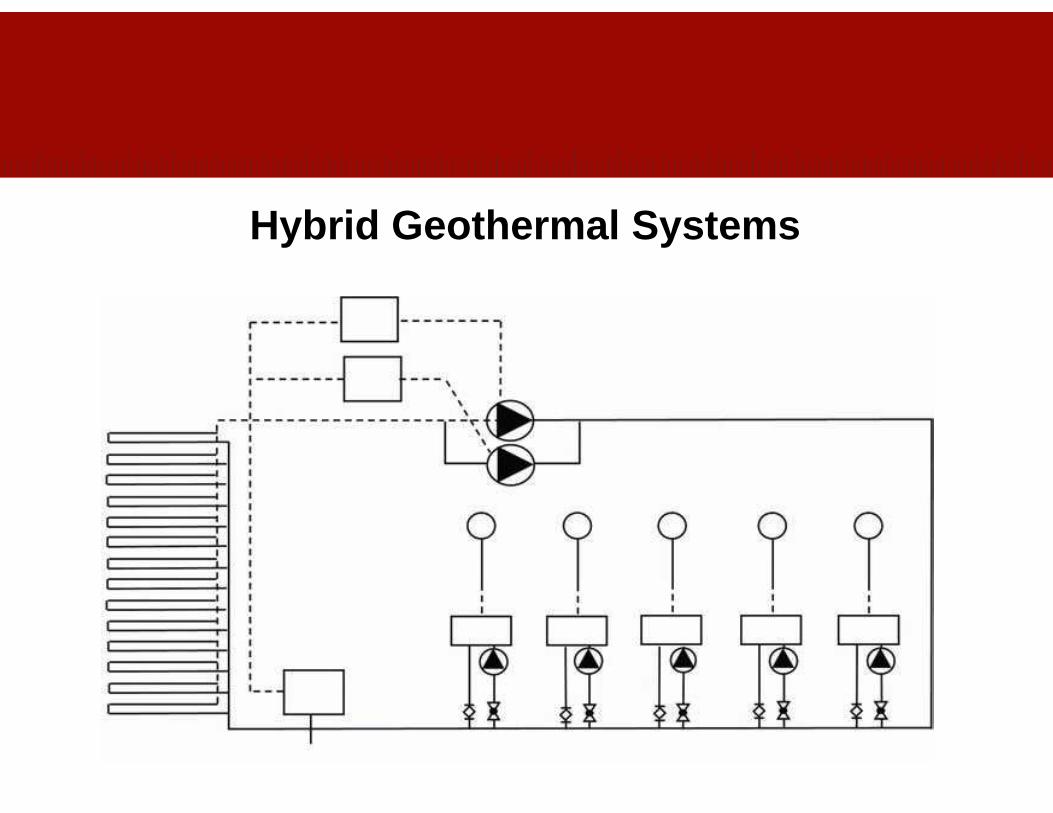
Hybrid Geothermal Systems

Hybrid Geothermal Systems

Hybrid Geothermal Systems
GSHP System (Cooling Dominant) with Cooling
Tower
GSHP System (Heating Dominant) with Boiler

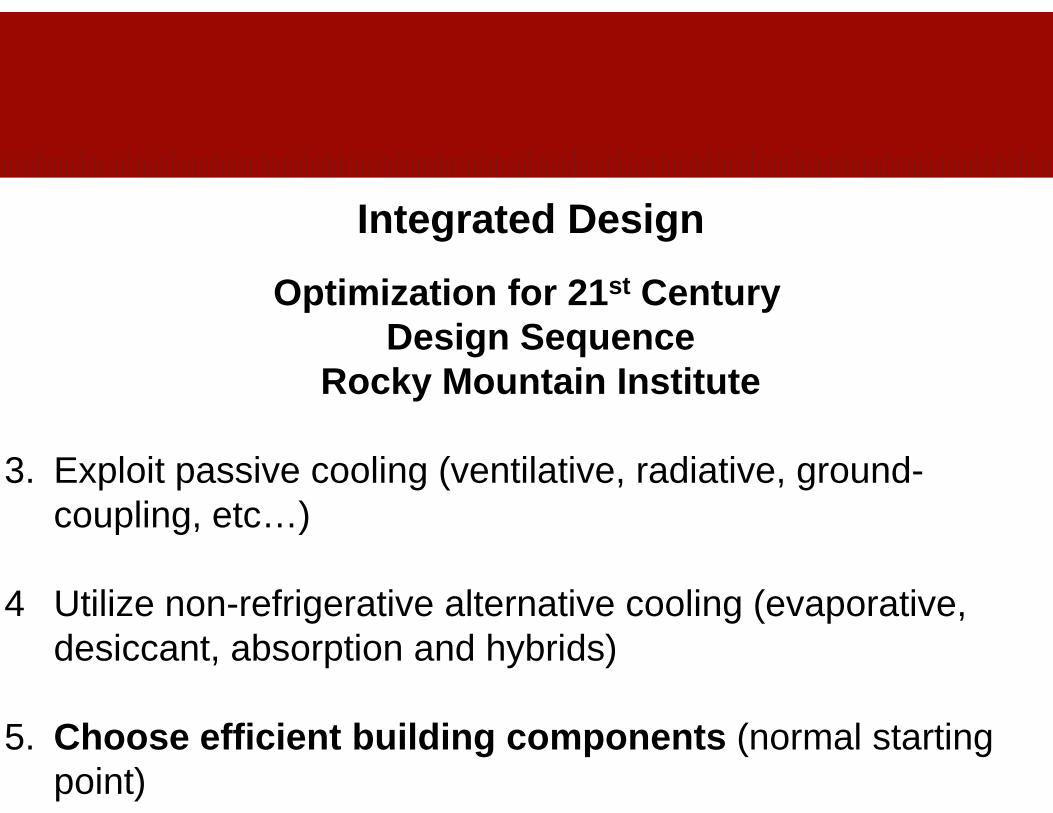
Integrated Design
Optimization for 21 st CenturyDesign Sequence
Rocky Mountain Institute
(Suggested Design Steps)1. Expand comfort considerations – radiant temperatures,
turbulent air movement, ventilative chairs, etc…
2. Reduce unwanted heat gains/losses of space
Integrated Design
Optimization for 21 st CenturyDesign Sequence
Rocky Mountain Institute
3. Exploit passive cooling (ventilative, radiative, ground-coupling, etc…)
4 Utilize non-refrigerative alternative cooling (evaporative, desiccant, absorption and hybrids)
5. Choose efficient building components (normal starting point)

Integrated Design
• A Successful Integrated Design Approach Provides the Best Energy Performance at the Least Cost and is Characterized as Follows:
1. It is Resourceful – Proper Building Orientation, Form, andLayout Provide Substantial Energy Savings
2. It is Multi-disciplinary – Process Requires Cross-Disciplinary Design and Validation at ALL Phases of theProcess
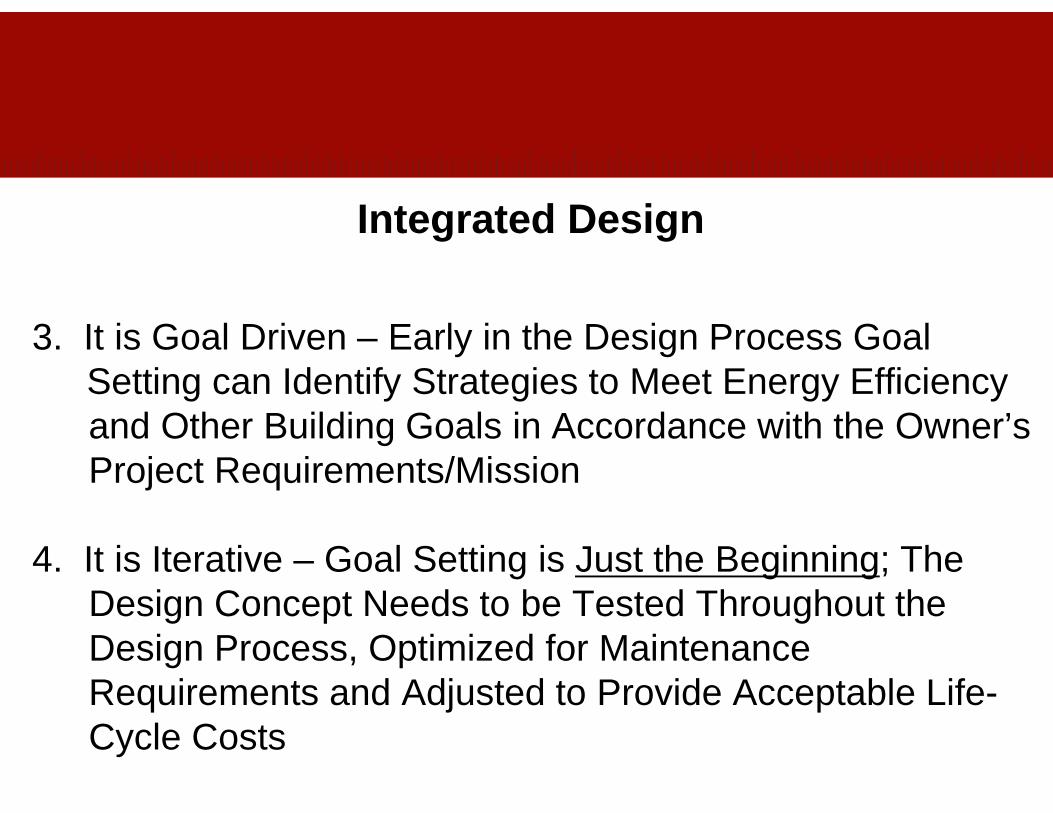
Integrated Design
3. It is Goal Driven – Early in the Design Process Goal Setting can Identify Strategies to Meet Energy Efficiencyand Other Building Goals in Accordance with the Owner’sProject Requirements/Mission
4. It is Iterative – Goal Setting is Just the Beginning; TheDesign Concept Needs to be Tested Throughout the Design Process, Optimized for Maintenance Requirements and Adjusted to Provide Acceptable Life-Cycle Costs
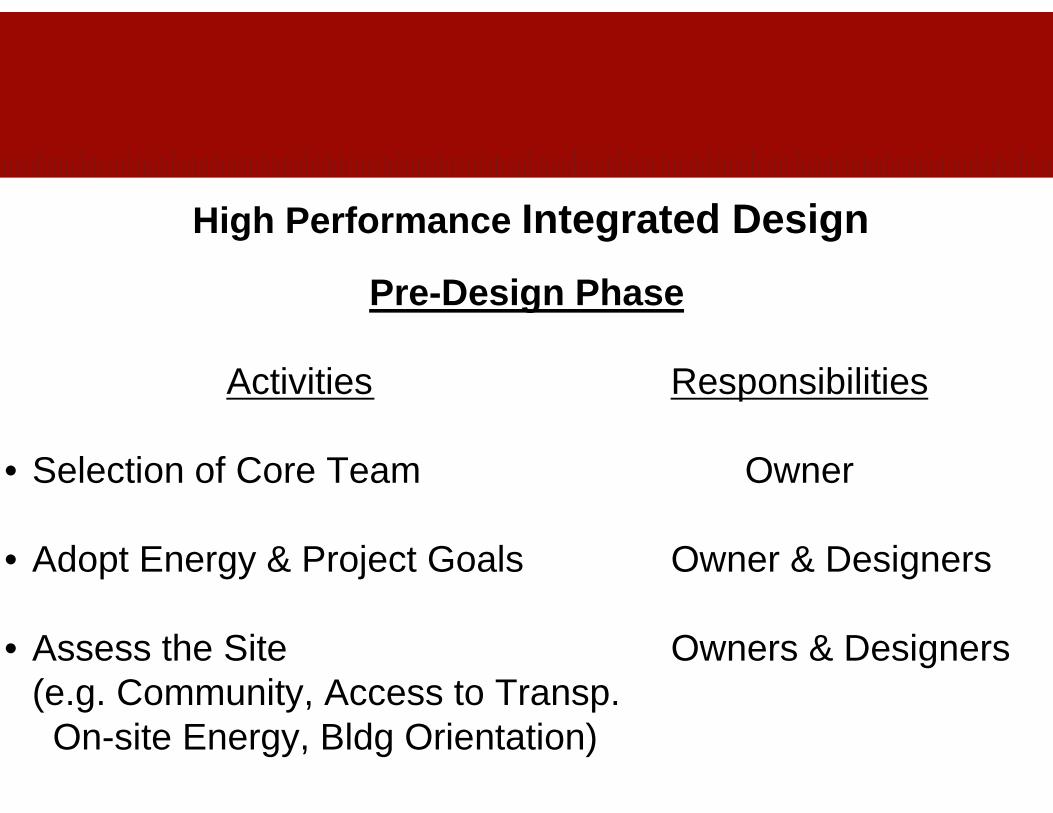
High Performance Integrated Design
Pre-Design Phase
Activities Responsibilities
• Selection of Core Team Owner
• Adopt Energy & Project Goals Owner & Designers
• Assess the Site Owners & Designers(e.g. Community, Access to Transp.
On-site Energy, Bldg Orientation)

High Performance Integrated Design
Pre-Design Phase
Activities Responsibilities
• Define Functional & Spatial Owner & DesignersRequirements
• Define Energy & Budget Bench- Owner & Designersmarks
• Prepare Design & Constr. Sch. Owner & Designers• Determine Preferences – Bldg Owner & Designers
Envelope & Systems
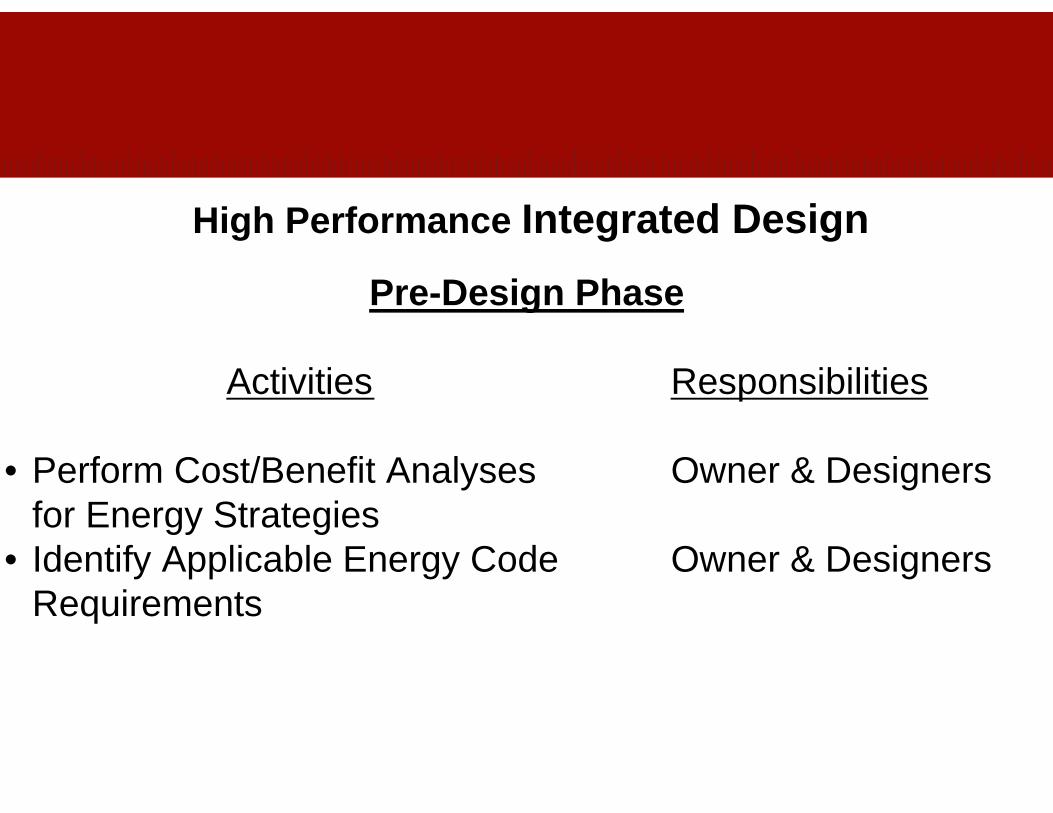
High Performance Integrated Design
Pre-Design Phase
Activities Responsibilities
• Perform Cost/Benefit Analyses Owner & Designersfor Energy Strategies
• Identify Applicable Energy Code Owner & DesignersRequirements

High Performance Integrated Design
Design Phase
Activities Responsibilities
• Prepare Bldg Plans per Functional DesignersProgram Requirements/OPR
• Develop Specific Energy Strategies Owner & Designers• Develop Site Plan – Best Use of Designers
Orientation & Daylighting• Select Bldg Systems per OPR Owner & Designers• Develop Bldg Plans, Sections & Designers
Details

High Performance Integrated Design
Design Phase
Activities Responsibilities
• Develop Arch. & Ltg. Details Designers• Perform Design Reviews at Each Owner & Designers
Phase for Conformance to OPR CxAEnergy Targets
• Calc Bldg Loads & Energy Models Designersto Optimize Designs
• Match Equip Capacities to Loads Designers

High Performance Integrated Design
Design Phase
Activities Responsibilities
• Perform Coordination and Integration Designersof Arch & MEP Systems
• Prepare Specifications Designers• Integrate Cx Into Specifications Designers & CxA• Prepare Cost Estimates at Each Estimators & CM
Design Phase• Review/Revise Final Design Owner, Designers, CxA
Documents

High Performance Integrated Design
Construction Phase
Activities Responsibilities
• At Pre-Bid – Emphasize EEMs Owner, Designers & CxA• At All Job Meetings – Review Owner, Designers, CxA
EEMS & Cx Procedures & CM• Verify Bldg Envelope Follows Designers & CxA
Drawings & Specs• Verify MEP Systems Meet Specs Designers &CxA• Conduct Pre-Functional Tests Owner, CxA, CM, GC &
Subcontractors
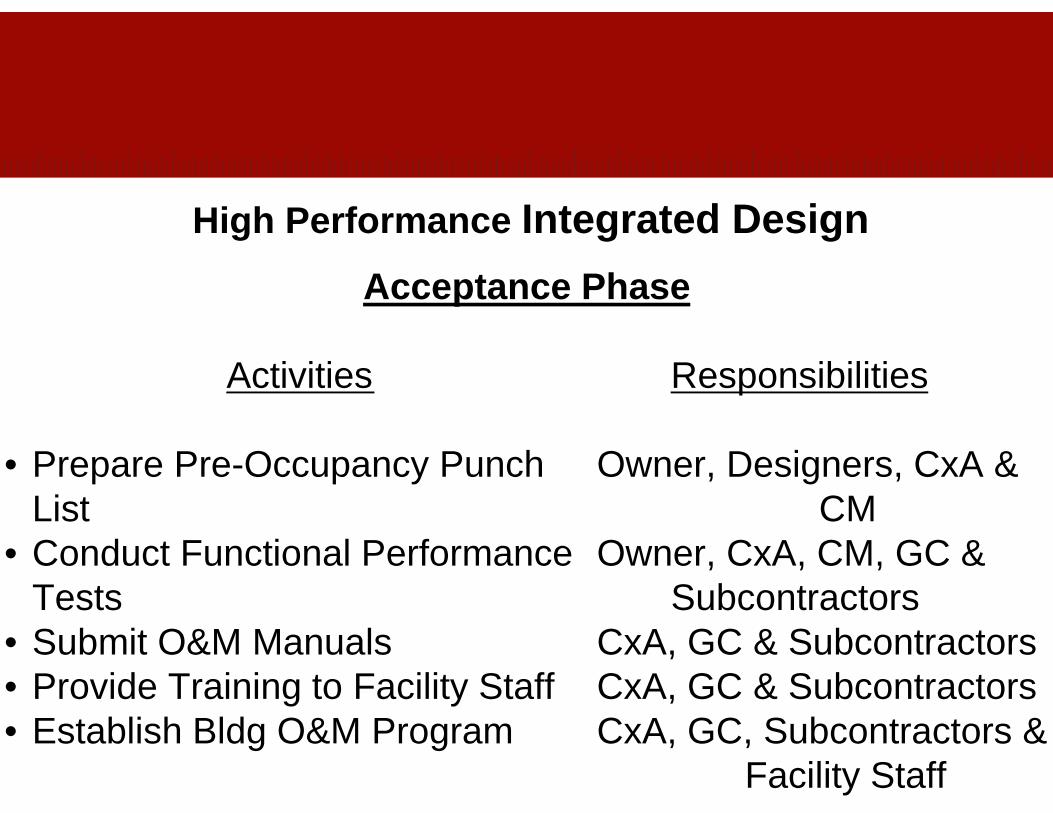
High Performance Integrated Design
Acceptance Phase
Activities Responsibilities
• Prepare Pre-Occupancy Punch Owner, Designers, CxA &List CM
• Conduct Functional Performance Owner, CxA, CM, GC &Tests Subcontractors
• Submit O&M Manuals CxA, GC & Subcontractors• Provide Training to Facility Staff CxA, GC & Subcontractors• Establish Bldg O&M Program CxA, GC, Subcontractors &
Facility Staff
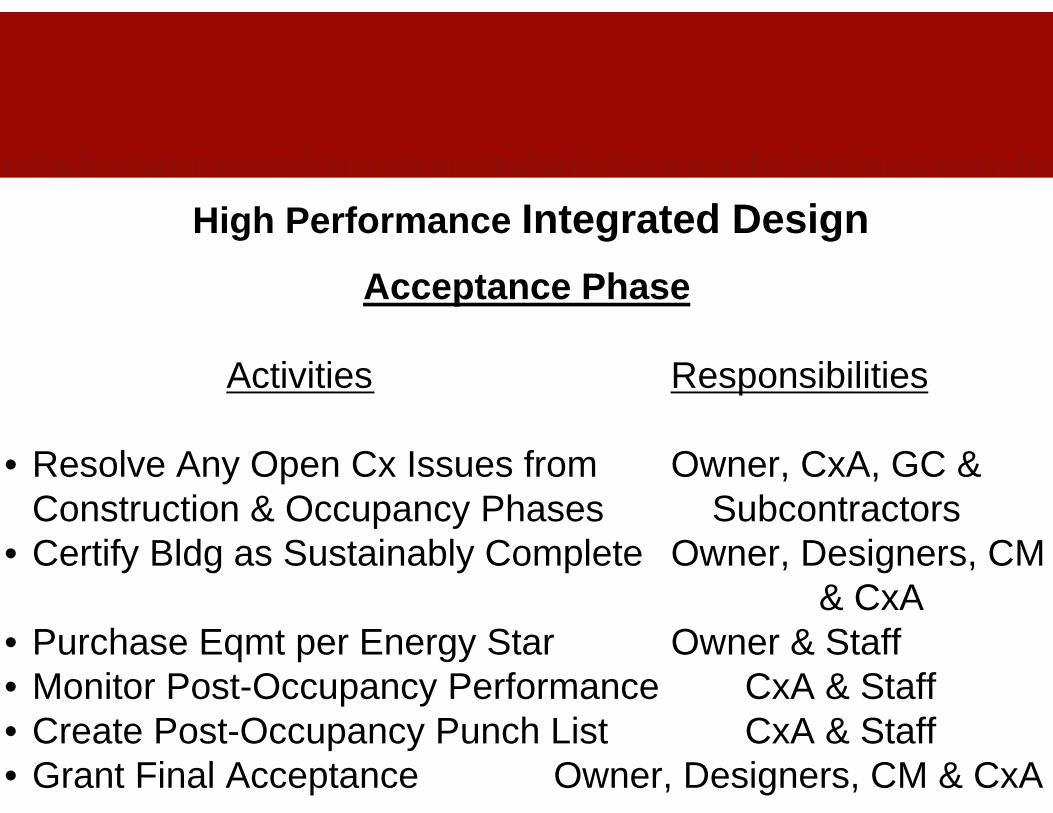
High Performance Integrated Design
Acceptance Phase
Activities Responsibilities
• Resolve Any Open Cx Issues from Owner, CxA, GC &Construction & Occupancy Phases Subcontractors
• Certify Bldg as Sustainably Complete Owner, Designers, CM& CxA
• Purchase Eqmt per Energy Star Owner & Staff• Monitor Post-Occupancy Performance CxA & Staff• Create Post-Occupancy Punch List CxA & Staff• Grant Final Acceptance Owner, Designers, CM & CxA

High Performance Integrated Design
Post-Occupancy Phase
Activities Responsibilities
• Set Up Performance Tools, Dashboards Owner, Staff && Verification Data Protocols CxA
• Validate Performance per O-Cx Plan Owner, Staff & CxA• Develop Improvement Opportunities Staff & CxA• Implement Corrections & Meas. Perform. Staff & CxA• Record Improvements Results Owner, Staff & CxA• Update O-Cx Plan Staff & CxA• Update CFR Owner, Designers & CxA

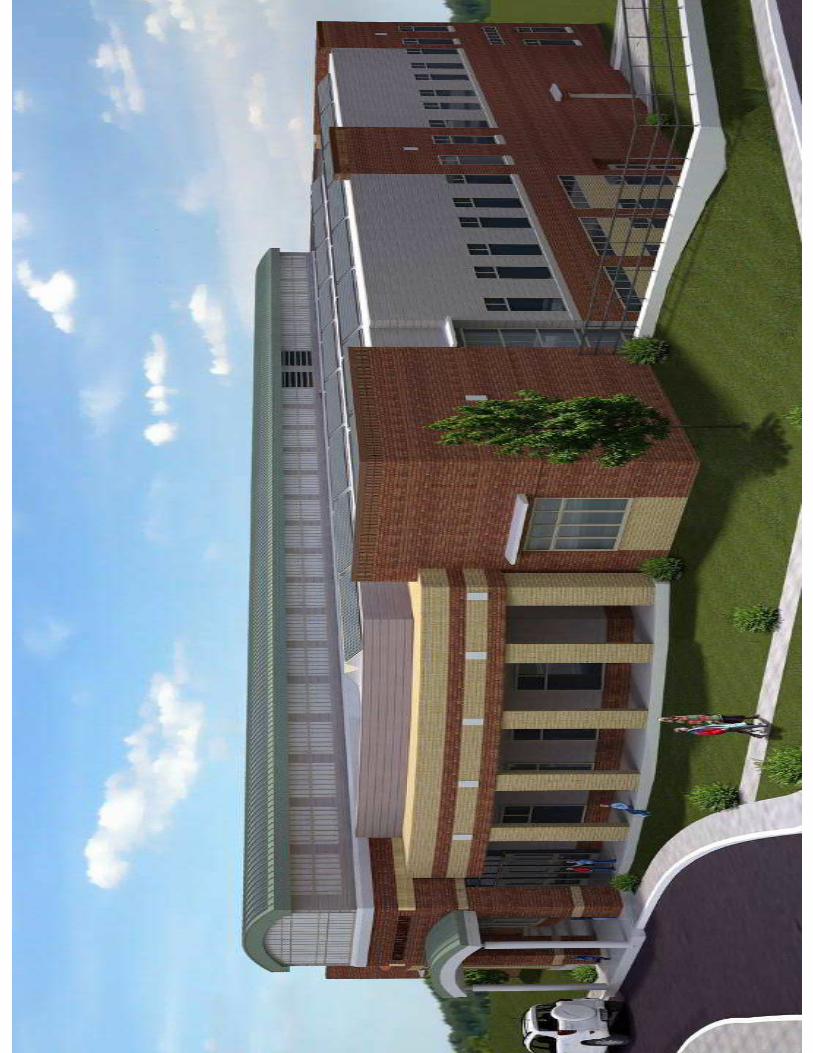
Net-Zero Richardsville Elementary SchoolBowling Green, Kentucky

Main Level Lower Level
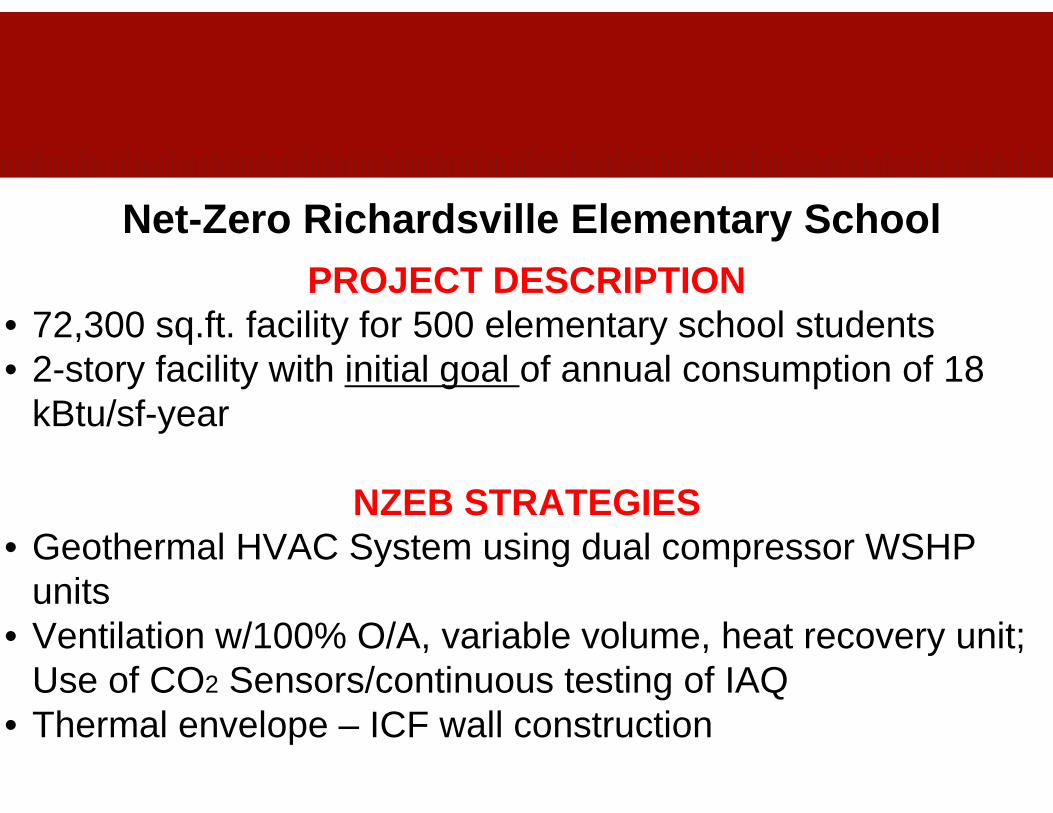
Net-Zero Richardsville Elementary SchoolPROJECT DESCRIPTION
• 72,300 sq.ft. facility for 500 elementary school students• 2-story facility with initial goal of annual consumption of 18
kBtu/sf-year
NZEB STRATEGIES• Geothermal HVAC System using dual compressor WSHP
units• Ventilation w/100% O/A, variable volume, heat recovery unit;
Use of CO2 Sensors/continuous testing of IAQ• Thermal envelope – ICF wall construction
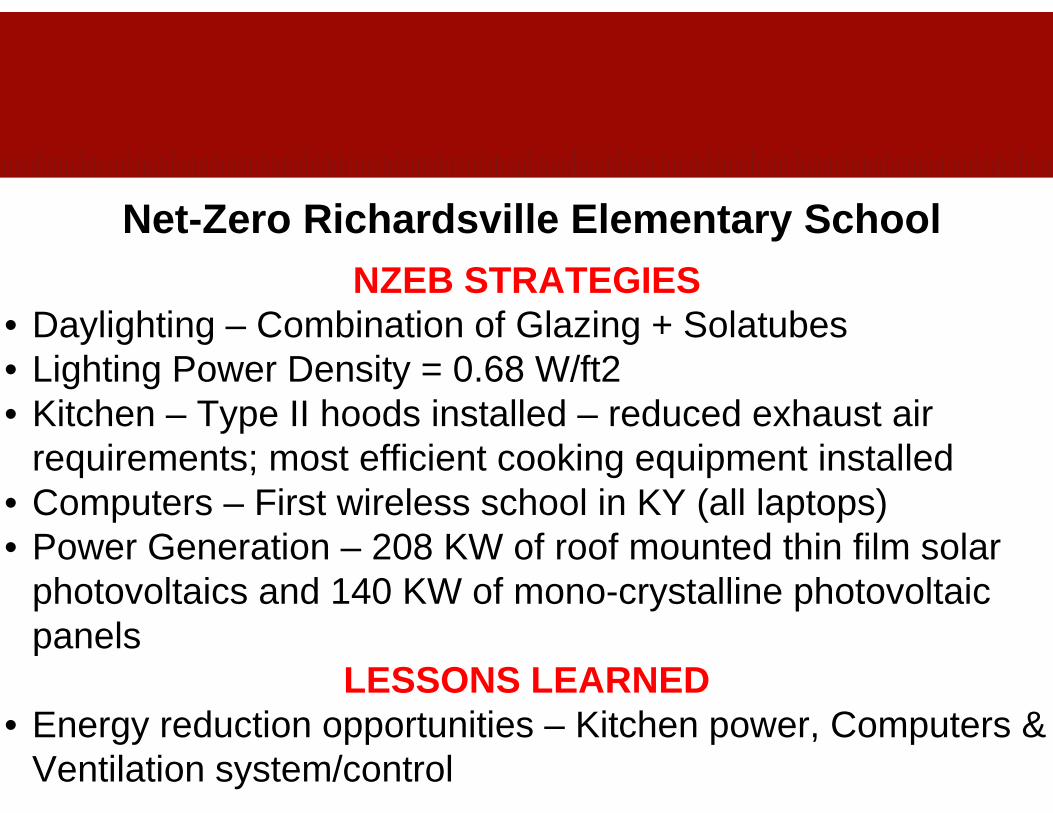
Net-Zero Richardsville Elementary SchoolNZEB STRATEGIES
• Daylighting – Combination of Glazing + Solatubes• Lighting Power Density = 0.68 W/ft2• Kitchen – Type II hoods installed – reduced exhaust air
requirements; most efficient cooking equipment installed• Computers – First wireless school in KY (all laptops)• Power Generation – 208 KW of roof mounted thin film solar
photovoltaics and 140 KW of mono-crystalline photovoltaic panels
LESSONS LEARNED• Energy reduction opportunities – Kitchen power, Computers &
Ventilation system/control

Net-Zero Richardsville Elementary School
Measured Energy UseAnnual Energy Consumption =
357,000 kWh/yr
Renewable Annual Energy Supply = 366,000 kWh/yr
Net Energy Use = (9,000 kWh/yr)

Gloria Marshall Elementary School

Marin County Day School

Advanced Energy Design & IAQ Guidance(Case Studies)
Gloria Marshall Elementary School (105,000 SF)Marin County Day School (K-8; 33,000 SF)
Manassas Park Elementary School + Pre-K (140,463 SF)Kinard Junior High School (113,000 SF)Two Harbors High School (190,000 SF)Des Moines Area Community College
R.J Klarek Information Commons, Loyola Univ.
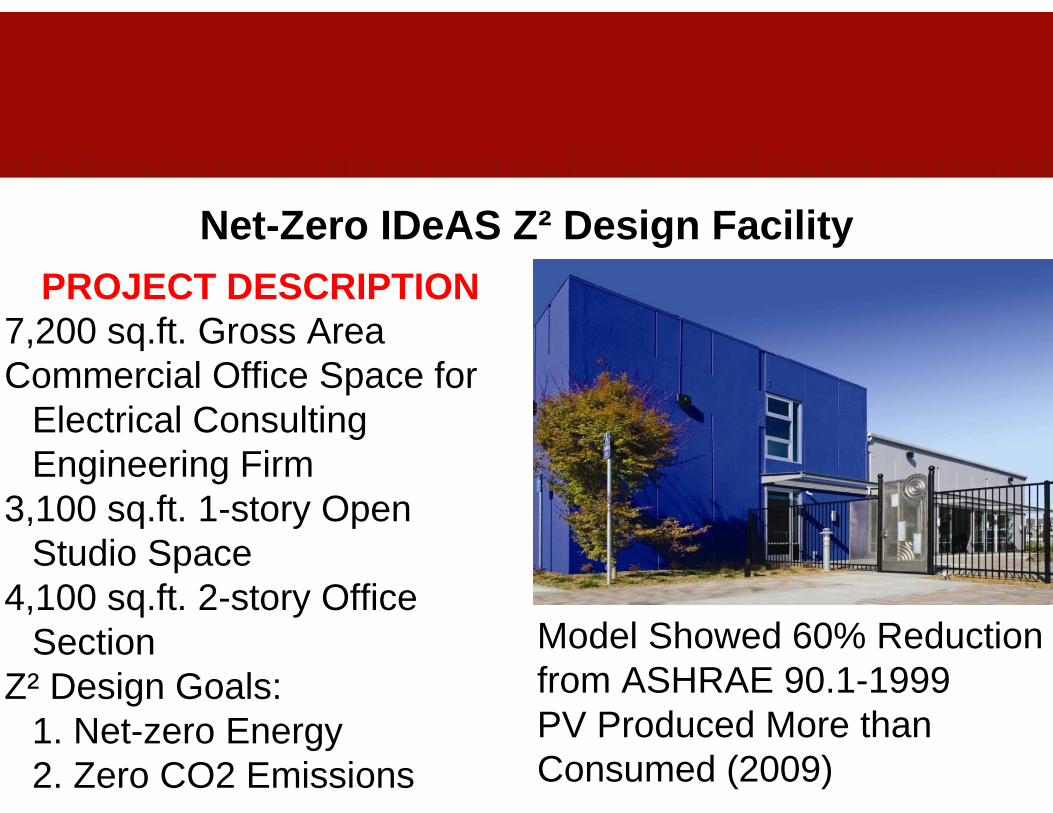
Net-Zero IDeAS Z² Design FacilityPROJECT DESCRIPTION
7,200 sq.ft. Gross AreaCommercial Office Space for
Electrical Consulting Engineering Firm
3,100 sq.ft. 1-story Open Studio Space
4,100 sq.ft. 2-story Office Section
Z² Design Goals:1. Net-zero Energy2. Zero CO2 Emissions
Model Showed 60% Reduction from ASHRAE 90.1-1999PV Produced More than Consumed (2009)

Net-Zero IDeAS Z² Design FacilityNZEB STRATEGIES
• Slab Radiant Tubing – Heating & Cooling• Ground-source Heat Pumps �Chilled Water & Space
Heating Water• Natural Ventilation – O/A Temps fall within Acceptable Range• Natural Daylighting• East Electrochromic Window Wall – No Moving Parts• R-19 (Walls); R-30 (Roof)

• 30 kW Building Integrated PV (BIPV) System �56 MWh/yr (100% of Bldg’s Energy Requirement)
• BIPV = White Roof Membrane Integrated PV MonocrystallineSolar Cells
• 2nd BIPV = Sunshade @ Main Entrance• High Efficiency Interior & Exterior Lighting • Occupancy Sensors – Lighting and Workspace Appliances &
Task Lights
Net-Zero IDeAS Z² Design FacilityNZEB STRATEGIES

Net-Zero IDeAS Z² Design Facility

IDeAS Design Facility
Measured Energy UseAnnual Energy
Consumption = 54,948 kWh/yr
= 8.38 kWh/SF-yr
Renewable Annual Energy Supply =
44,063 kWh/yr= 6.72 kWh/SF-yr
Net Energy Use = 10,885 kWh/yr
= 1.66 kWh/SF-yr= 5.7 kBTU/SF-yr
Net-Zero IDeAS Z² Design FacilityLESSONS LEARNED
• Reduce energy level before adding renewable energy sources
• New technologies can/will fail initially
• Radiant heating and cooling + natural ventilation provide low energy consumption & exceptional comfort levels
Net-Zero NREL Administration BuildingPROJECT DESCRIPTION
• 218,000 SF that includes one 3-story and one 4-story office wing
• Building Occupancy = 780
NZEB STRATEGIES
• Cross Ventilation Strategies• Hydronic radiant slab heating and cooling• DOAS in a displacement ventilation configuration


Net-Zero NREL Administration BuildingNZEB STRATEGIES
•Ventilation air preheat w/collectors on S-face of buildings
•Remote mass thermal storage (heat & coolth)
•Evaporative cooling for data center w/heat recovery
•Daylight harvesting + window shading
•Thermally massive exterior wall assemblies
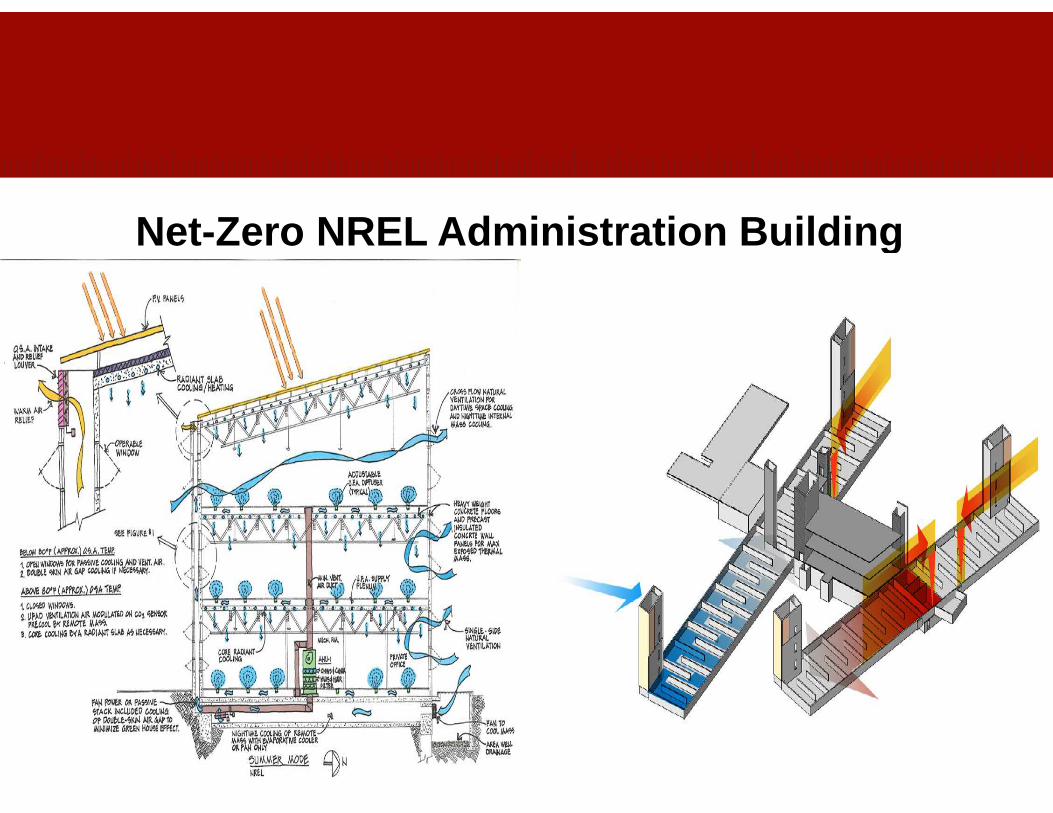
Net-Zero NREL Administration Building
Net-Zero NREL Administration BuildingNZEB STRATEGIES
• Portion of hot water heating by woodchip biomass boiler
• Photovoltaic arrays on building roofs and Visitor’s Parking Lot �NREL to have Power Purchase Agreement from a 3rd party vendor
• Use of ‘Light-louver’ – a light bouncing device to augment daylighting

Net-Zero NREL Administration BuildingMeasured Energy Use
Annual Energy Consumption = 2,001,240 kWh/yr= 9.18 kWh/SF-yr
Renewable Annual Energy Supply = 2,001,240 kWh/yr
= 9.18 kWh/SF-yr
Net Energy Use = 0 kWh/yr(Excess sold to 3rd party)
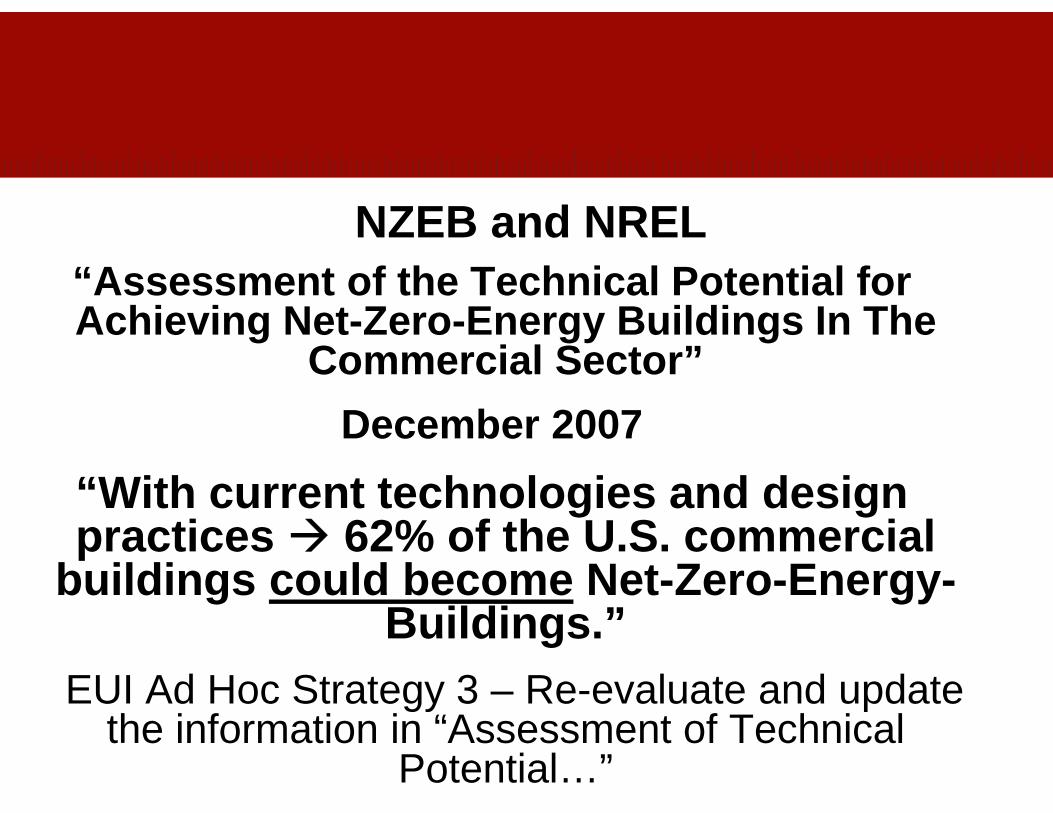
NZEB and NREL“Assessment of the Technical Potential for Achieving Net-Zero -Energy Buildings In The
Commercial Sector”
December 2007
“With current technologies and design practices � 62% of the U.S. commercial
buildings could become Net-Zero -Energy -Buildings.”
EUI Ad Hoc Strategy 3 – Re-evaluate and update the information in “Assessment of Technical
Potential…”

NZEB and NREL(Reference Points TODAY & TOMORROW -2025)
Energy Efficiency + IBD �EUI = 35 kBTU/SF/yr
PV Threshold to NZEB �EUI = 19 kBTU/SF/yr
Projected Max Tech + IBD �EUI = 12.2 kBTU/SF/yr
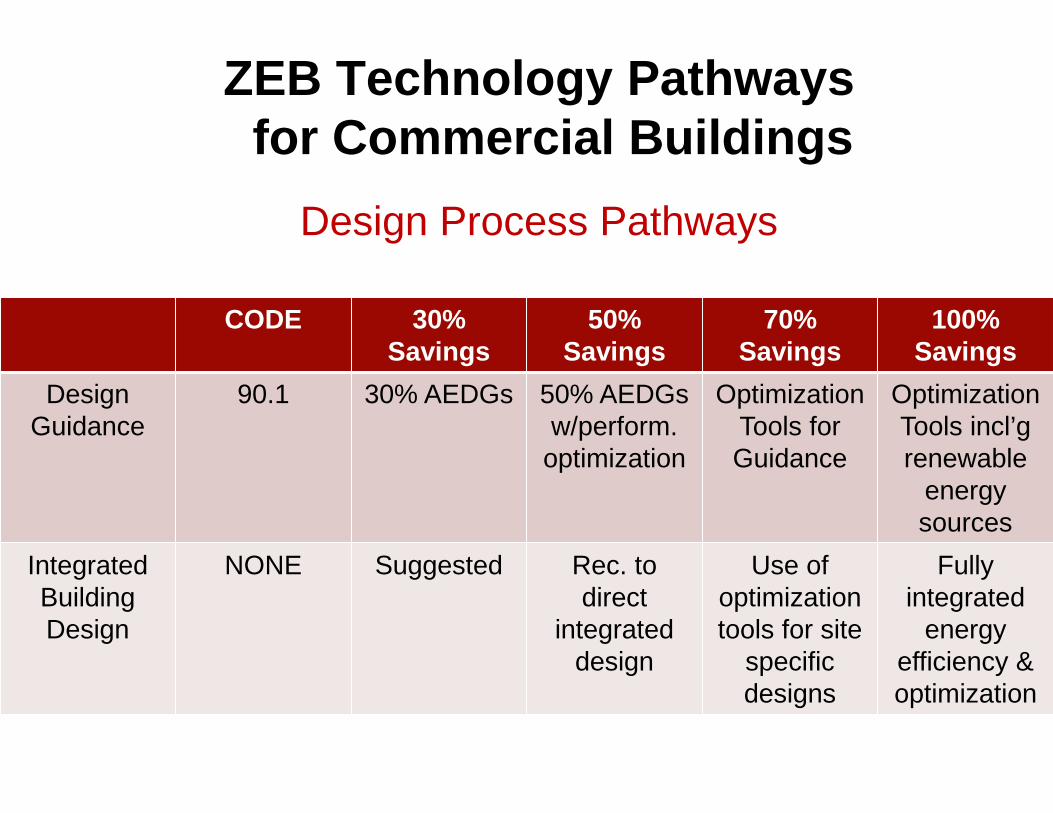
ZEB Technology Pathwaysfor Commercial Buildings
ZEB Technology Pathwaysfor Commercial Buildings
Design Process Pathways
CODE 30% Savings
50% Savings
70% Savings
100% Savings
Design Guidance
90.1 30% AEDGs 50% AEDGsw/perform.
optimization
OptimizationTools for Guidance
Optimization Tools incl’grenewable
energysources
Integrated BuildingDesign
NONE Suggested Rec. to direct
integrated design
Use of optimization tools for site
specific designs
Fullyintegrated
energy efficiency & optimization

ZEB Technology Pathwaysfor Commercial Buildings
Technology Pathways
CODE 30% Savings 50% Savings
70% Savings
100% Savings
Roofs R-15�R-25
R-15�R-30 R-20�R-35 R-25�R-45
R-25�R-45
Walls R-2�R-15 R-2�R-15 R-10�R-30 R-19�R-35
R-19�R-35
Windows 90.1 U-0.5�U-O.33SHGC:0.45�0.
25Vt/SHGC: 1
U-0.4�U-0.2SHGC:0.45
�0.25Vt/SHGC: 2
U-0.3�U-0.13
SHGC:0.5�0.25
Vt/SHGC: 2.5
U-O.3�U-0.13
SHGC:0.5�0.25
Vt/SCHGC: 2.5
Daylighting None Spec’d
None Spec’d 35% + daylight energy
60% + daylgt
energy red.
80% + daylgt
energy red.
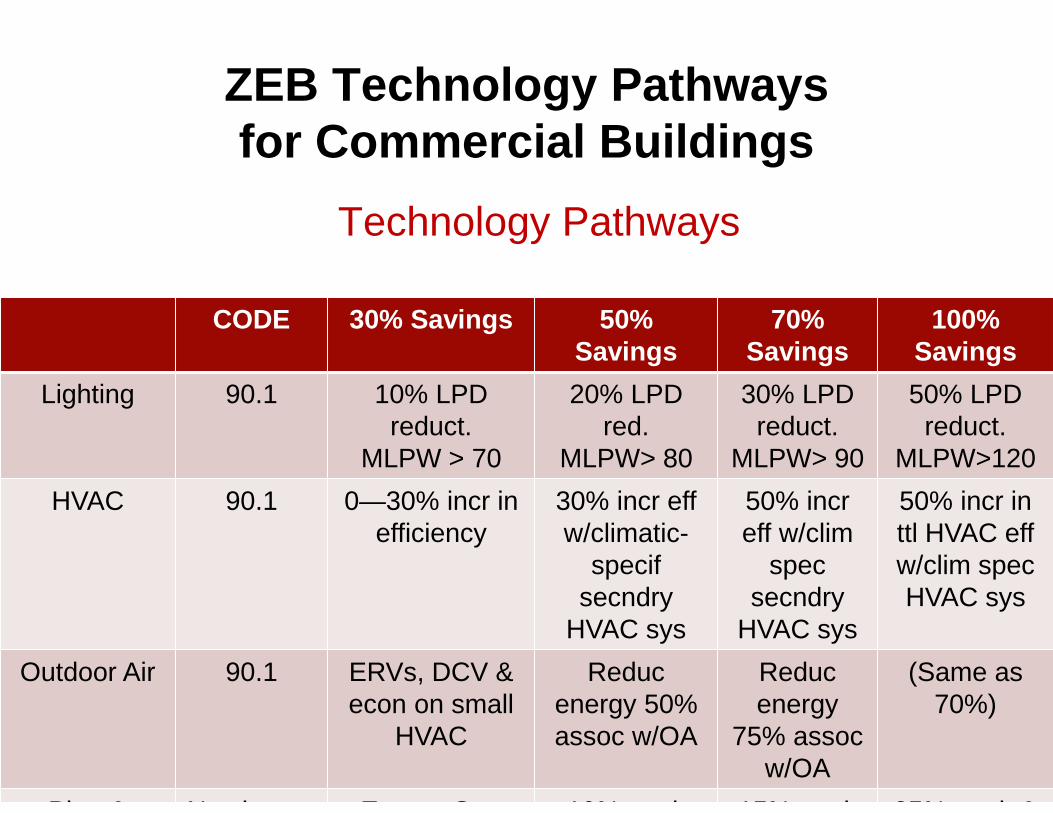
ZEB Technology Pathwaysfor Commercial Buildings
Technology Pathways
CODE 30% Savings 50% Savings
70% Savings
100% Savings
Lighting 90.1 10% LPD reduct.
MLPW > 70
20% LPD red.
MLPW> 80
30% LPD reduct.
MLPW> 90
50% LPD reduct.
MLPW>120
HVAC 90.1 0—30% incr in efficiency
30% incr effw/climatic-
specifsecndry
HVAC sys
50% increff w/clim
spec secndry
HVAC sys
50% incr in ttl HVAC effw/clim spec HVAC sys
Outdoor Air 90.1 ERVs, DCV & econ on small
HVAC
Reducenergy 50% assoc w/OA
Reducenergy
75% assoc w/OA
(Same as 70%)
Plug & No change Energy Star 10% peak 15% peak 25% peak &

ZEB Technology Pathwaysfor Commercial Buildings
Technology Pathways
Technology Pathways Table Notes:Vt/SHGC = Ratio of Visible Transmittance to Solar Heat Gain Coefficient
MLPW = Mean Lumens per Watt lighting system (bulb, ballast system efficacy)
Renewables Table Wind Speed Classifications for U.S.http://www.eere.energy.gov/windandhydro/windpoweringamerica/pdfs/wind_maps/
us_windmap.pdf
CODE 30% Savings 50% Savings
70% Savings
100% Savings
Service Water
Heating
80% Et 90% Et 90% Et 95% Et 95% Et
Energy Storage
None None None Create loadfactor of 50%+
Create loaf factor of 75%+

ZEB Technology Pathwaysfor Commercial Buildings
Renewables
CODE 30% Savings 50% Savings
70% Savings
100% Savings
PV None None 0%�20% Bldg load
20%�75% Bldg load
75%+ Bldg load
Solar Hot Water
None None Solar Fraction = 0.5 (year
around HW)
Solar Factor = 0.75 (yr around HW)
Solar Factor = 0.75 (HW) & 0.5 (rad.
htg)
Site Wind None None 0�10% Bldg load (wind class >4)
20%+ Bldg load (wind class>4)
30%+ Bldg load (wind class>3)
SiteBiomass
None None None 50%+ HW & space
80%+ HW & space htg

NZEB and NREL(Reference Points TODAY & TOMORROW -2025)
Energy Efficiency + IBD �EUI = 35 kBTU/SF/yr
PV Threshold to NZEB �EUI = 19 kBTU/SF/yr
Projected Max Tech + IBD �EUI = 12.2 kBTU/SF/yr
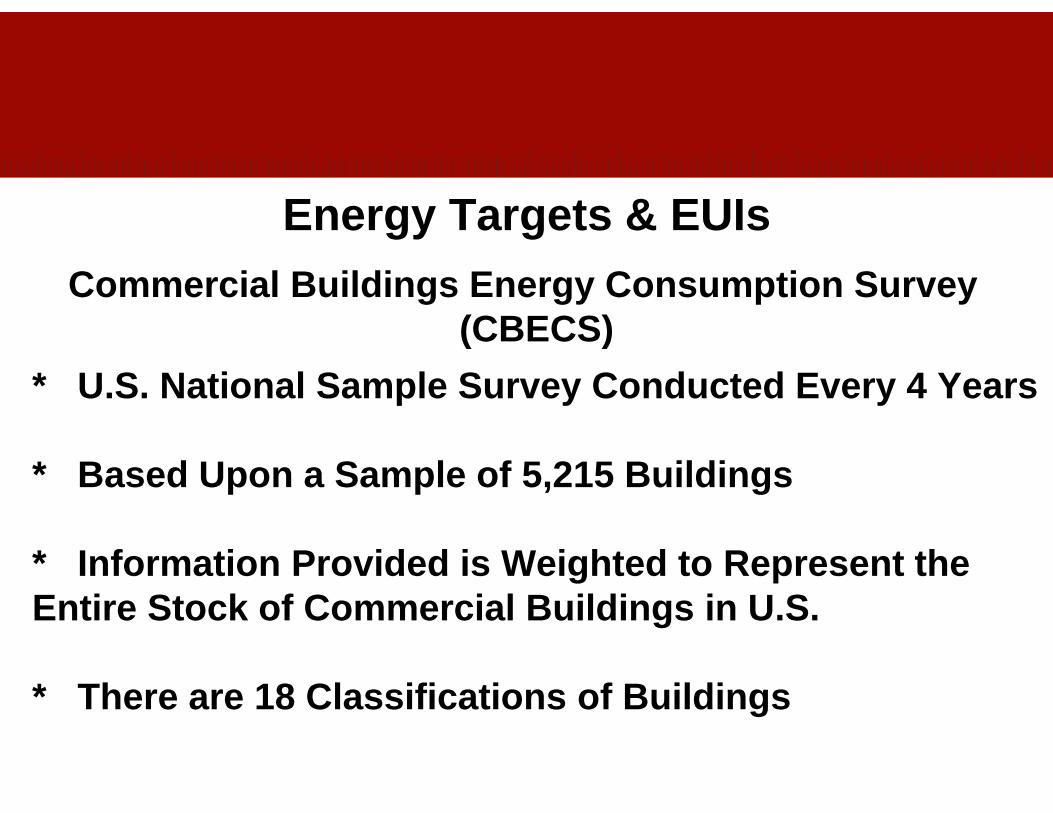
Energy Targets & EUIsCommercial Buildings Energy Consumption Survey
(CBECS)
* U.S. National Sample Survey Conducted Every 4 Y ears
* Based Upon a Sample of 5,215 Buildings
* Information Provided is Weighted to Represent t he Entire Stock of Commercial Buildings in U.S.
* There are 18 Classifications of Buildings
Energy Targets & EUIs

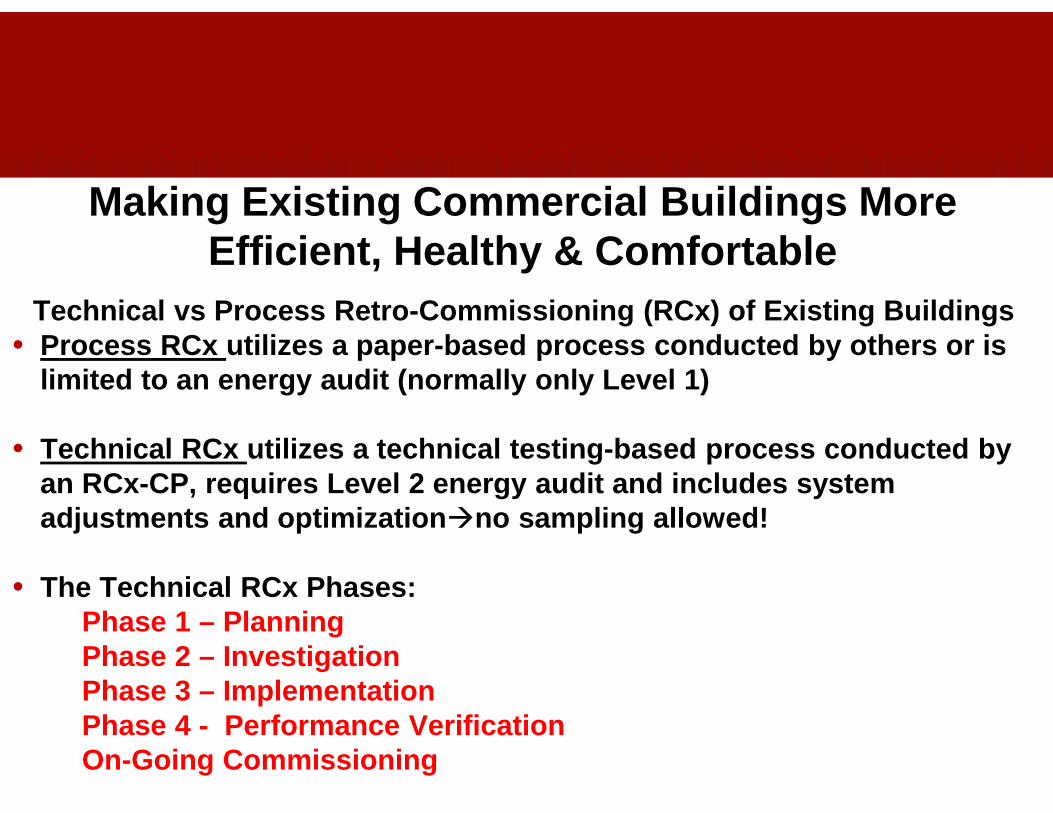
Making Existing Commercial Buildings More Efficient, Healthy & Comfortable
• New Buildings = 2% of Building Programs• 86% of U.S. Annual Building Construction Expenditur es Relate
to Building Renovations• Even with Commissioned Buildings in the U.S., their
Performance Deteriorates after 3 years by 30%• ASHRAE Research has shown that the “potential” for
reduction of a building’s energy use is between 10% and 40%simply by changing operational strategies
• 70% - 80% of Buildings in 2030 exist today• Over next 30 years, 150 billion SF of existing buil dings will be
renovated (1/2 U.S. bldg. stock)

Making Existing Commercial Buildings More Efficient, Healthy & Comfortable
“ We are confronted with insurmountable opportunities ”……Pogo

Making Existing Commercial Buildings More Efficient, Healthy & Comfortable
Terry E. Townsend, P.E., FASHRAE, LEED®AP
ASHRAE Presidential Member 2006-2007
NEBB BSC-CP; RCx-CP

Making Existing Commercial Buildings More Efficient, Healthy & Comfortable
Day 11. BEAP Certification Program Overview
2. Technical Retro-Commissioning of Existing Buildings (EBRCx) Program� Planning Phase� Discovery Phase
� Investigation Phase – PEA; Levels 1, 2, 3 & Targeted Audits� Analysis Phase
� Corrective Action Phase & Technical Commissioning of Construction Activities
� Performance Verification Phase & Ongoing Commissioning3. Preparation for Site Visit – __________

Making Existing Commercial Buildings More Efficient, Healthy & Comfortable
Day 21. Site Visit – 8:00 AM – 11:30 AM
2. Lunch3. Completion of bEQ “In Operation” Forms
4. Presentation of Results to Owner’s Representative…. “And the Winning Team is…..”
5. Seminar Survey & Recommendations6. Plan of Action for Submittal of bEQ Workbook to
ASHRAE and Preparation of Article for ASHRAE Journal
Making Existing Commercial Buildings More Efficient, Healthy & Comfortable
Technical vs Process Retro-Commissioning (RCx) of E xisting Buildings• Process RCx utilizes a paper-based process conducted by others o r is
limited to an energy audit (normally only Level 1)
• Technical RCx utilizes a technical testing-based process conducted by an RCx-CP, requires Level 2 energy audit and includ es system adjustments and optimization �no sampling allowed!
• The Technical RCx Phases:Phase 1 – PlanningPhase 2 – InvestigationPhase 3 – ImplementationPhase 4 - Performance VerificationOn-Going Commissioning

Making Existing Commercial Buildings More Efficient, Healthy & Comfortable
Setting a Building’s Energy Performance Goals
Establish “Benchmark” & ENERGY STAR Rating�If ENERGY STAR Rating is below 75%, 1 st Target should
be to achieve this level of operation�2nd Target �Increase performance 10% - 30% (15%)�3rd Target �Achieve performance of current version of
ASHRAE Standard 90.1 (2010)�4th Target �Go 30%, 50% or 70% beyond 90.1�5th Target �Go to Net-Zero Energy

Technical Commissioning of Existing Commercial Buildings (RCx)
Energy Audit Overview • Compile energy bills and meter readings 24-36 month s• Conduct Walk-Through Survey and Preliminary Energy- Use
Analyses (PEA) • Based Upon SOW Conduct Engineering Analyses (ASHRAE
Levels 1 &2 Activities & Analyses) or a Targeted Au dit for Specific Systems
• Determine Energy EUI & ECICalculate annual BTUs consumed for each fuel source & get
total annual BTUsCalculate total annual energy costs for each fuel s ource

Technical Commissioning of Existing Commercial Buildings (RCx)
Implementation Phase
ACTIVITIES:�Complete Repairs
Repair equipment or systemsReplace equipment
�Design & Construct Capital projectsNew equipment or systemsSystem upgrades
�Commissioning (Cx) of Capital Projects�Operator training

Technical Commissioning of Existing Commercial Buildings (RCx)
Performance Verification Phase
ACTIVITIES:
�Establish performance verification system�Measure / Make Adjustments / Repeat�Create Performance (Ongoing) OCx Plan� Deploy standard performance tools, dashboards and reports � Set up verification data accumulation � Develop improvement opportunities � Implement corrections� Re-measure performance

Technical Commissioning of Existing Commercial Buildings (RCx)
Performance Verification Phase

Your Role, Your Duty and Your Responsibility
“Don’t be put off by people who know what is not possible. Do what needs to be done , and then check to see if it was
impossible only after you are done.”
Paul HawkenUniversity of Portland Graduation Address
May 2009
“Remember Today….For It’s the Beginning of FOREVER”Dante Alighieri, Inferno

Your Role, Your Duty and Your Responsibility
The “Global Ponzi Scheme” – Lester Brown“We are stealing from the future, selling it in the present and
calling it Gross Domestic Product”
One Person Can Make A Difference!(Floyd Lee & Pegasus Chow Hall
Baghdad Airport)
HOW ABOUT YOU?