energy low emission development strategies: a regional overview of africa and experiences from cape...
TRANSCRIPT
Energy Low Emission Development
Strategies: A Regional
Overview of Africa and Experiences from
Cape Verde and Kenya
22 January 2015
Presenters:
Alexander Ochs - Worldwatch Institute, EWG Chair
John Yeboah– ECREEE, EWG Africa co-Chair
Anildo Costa - Consultant to the Government of Cape Verde
Esther Wang’ombe – Government of Kenya

Welcome & Introduction
Alexander Ochs
Worldwatch Institute
EWG Chair

Audio Options for Participants:
1. Listen through your computer. Please select the “mic and speakers” radio button on the right hand audio pane display
2. Listen by telephone. Please select the “telephone” option in the right-hand display, and a phone number and PIN will display
Panelists: Please mute your audio device when not presenting!
Technical Difficulties: Contact the GoToWebinars Help Desk: 888.259.3826
Logistics

To Ask a Question:
• Select the “questions” pane on your screen and type in your question
If you are having trouble with the webinar:
• PDFs of the presentation can be accessed at: http://ledsgp.org/sector/energy
• A video/audio recording of this webinar and slide decks will be available at: http://ledsgp.org/sector/energy
Logistics

1. Welcome & Introduction Alexander Ochs, Worldwatch Institute, EWG Chair
2. Introduction to the Africa LEDS Partnership and the Importance of Energy in Africa
John Yeboah, ECREEE, EWG Co-Chair for Africa
3. Learning from Cape Verde’s Renewable Energy Plan Anildo Costa, Consultant to the Government of Cape Verde
4. Learning from Kenya’s Clean Energy Plan Esther Wang’ombe, Government of Kenya
5. Q& A
6. Survey
Outline

LEDS Global Partnership
International initiative aiming to harness the collective knowledge and resources of governments, donors, international organizations, and practitioners in scaling up and strengthening implementation of climate-resilient low emission development around the world.
Launched in 2011, the LEDS GP now catalyzes action and collaboration across more than 120 countries and international organizations.
Energy Working Group (EWG)
The EWG promotes low-emission and climate-resilient development in the energy sector through a work program focused on learning and information exchange, sharing best practices, advisory services, and providing enhanced opportunities for coordination and collaboration.
Objectives Strengthen support for LEDS in energy sector Mobilize capacity and advance peer-to-peer learning and
collaboration on low emission energy development Improve coordination of energy-related LEDS at the country, regional,
and global levels

Energy Working Group Activities
Current work plan, highlights
Webinars:
Events:
• LEDS GP Annual Event, Addis Ababa, Ethiopia (August): - Energy Peer Learning Session For African Countries - Energy Sector Strategies and Policy Portfolios Session • LEDS LAC Regional Forum 2013
2015 work plan, highlights:
• Energy & Development World Atlas • Energy Toolkit • Energy Data Crowdsourcing Project • Energy LEDS Training Camp • Energy Policy Development Group
• Best Practices in Gathering and Using Energy Data for LEDS Development (April) • Energy LEDS in Asia (Oct.) • Energy LEDS in LAC (Nov.) • Energy LEDS in Africa (Jan.)

Introduction to AfLP & Overview of the Regional
Energy Developments
John Yeboah
ECREEE
EWG co-Chair
• While this module uses Africa-wide data, emphasis is placed on sub-Saharan Africa because of the low access levels of modern source of energy especially for the poor
• The module recognises that the availability of modern, reliable and efficient energy services is an important and indeed essential driver for economic development
• Most countries in Africa are faced with a major challenge in trying to achieve their development and social obligations because of inadequate access to modern energy services
• Majority of the population still depend on traditional biomass, which often has adverse environmental and health impacts
• Governments in the region also invest more in conventional energy sources rather than in renewable energy sources (RES)
Africa LEDS Partnership Introduction

Response to growing interest of the countries designing and implementing their own LEDS
First convening workshop held in Kinshasa, DRC on April 1, 2014
Built on the work of Africa Climate and Development Society (formed October 2012)
Brought together low emission development leaders from 20 African countries and
international participants
Africa LEDS Partnership Formation

1. Energy:
• Develop and share case examples of energy sector LEDS in the various
countries.
• Capacity building on developing LEDS and NAMAs for the energy sector
• Document and share good practices and toolkits on RE grid & mini-grid
integration
Africa LEDS Partnership Priority Working Areas

2. Communication: • Share communication materials on benefits of LEDS and enable
peer exchange and technical assistance through communication.
3. LEDS infrastructural financing: • Share leading examples of approaches across African countries for
financing LEDS related infrastructure (transport, electricity, waste, agriculture, etc.)
Africa LEDS Partnership Priority Working Areas
African Countries (specific Characteristics):
• Many Economies are classed as LDCs
• Economic growth and rural developments predominates national goals
• Affordable, reliable, clean energy is critical to maintain pace of inclusive
development
• Conventional energy sources are limited and require large investments
and natural resources
Overview of the Regional Energy Developments Energy in Africa

• Reduce poverty & create new economic opportunities
• Increase Energy security & economic development
• Enhance industrial/resource efficiency & productivity (productive use of
energy)
• Reduce GHG emissions & improve climate resilience
• Minimizes rural-urban migration
• Provides pathway for new employment facilities
Importance of Energy in Africa
Overview of the Regional Energy Developments

Electricity Access in Africa

Electricity Access in Africa
43
600
99
1 31.8
599
% of Population with Access No. of People Without Access (millions)
Electricity Access in 2014
Africa (Total)
North Africa
Sub-Saharan Africa

Electricity Generation by Source in Sub-Saharan Africa in 2012
Hydro 22%
Coal 56%
Nuclear 3%
Gas 9%
Oil 9%
Others 1%
Electricity Generation
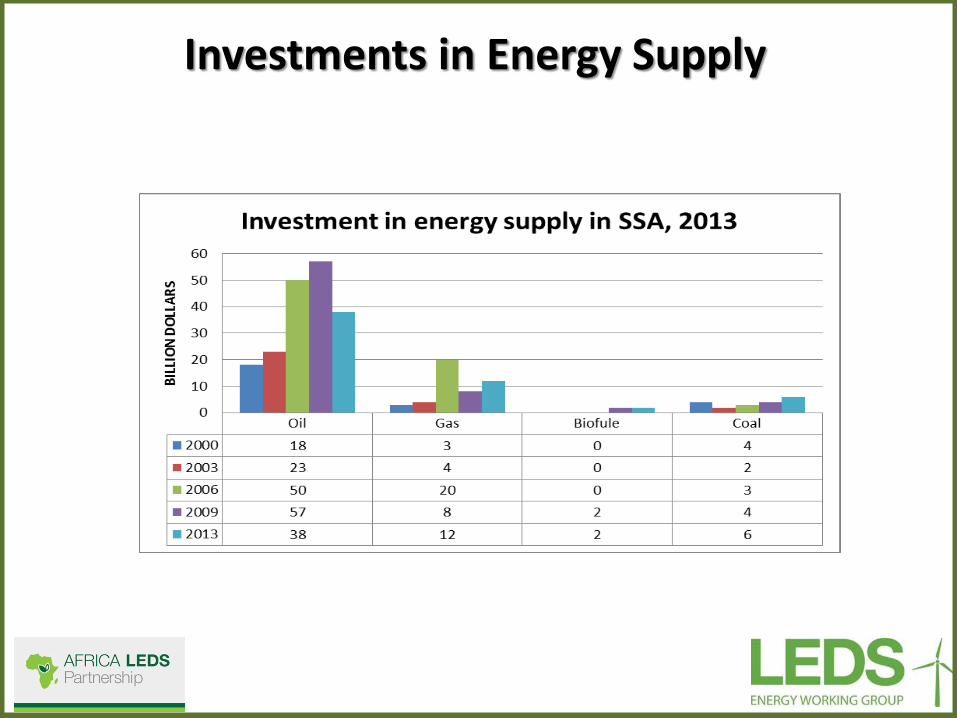
Investments in Energy Supply

Clean Energy (RE and EE) Programs: • Zambia - low emission development projects • Kenya - The National Energy Act 2006 • Cape Verde – vision 2020 • Cote D’Ivoire - climate resilient programs • Ethiopia - CRGE initiative • Botswana - village electrification project • Cameroon - off-grid dev’t projects • Malawi - local dev’t fund for SHS, micro hydro plant
Trends in Regional LEDS Energy Development

Regional & National LEDS Energy Policies and Legislative Frameworks:
• ECOWAS RE & EE Policy & NREAPs and NEEAPs
• Cameroon - Climate finance legislation
• Ethiopia - Climate Resilience and Green Economy initiative (CRGE)
• Gabon - National legislation on sustainable forest exploitation
• Zambia - National legislation on LEDS activities
• Kenya - National CC Action Plan
• South Africa - National CC response policy
Trends in Regional LEDS Energy Development

Learning from Cape Verde’s Renewable Energy Plan
Anildo Costa
Energy Consultant Cabo Verde Coordination Group on Renewable Energy and Energy Efficiency

CABO VERDE OVERVIEW
10 islands, 9 inhabited – 9 Energy Systems
Area: 4,033 km2
Population: ~ 500 000
GDP per capita: ~ 3,800 US$
Access to Electricity: ~95%
Access to modern energy for cooking: ~65%
Installed Capacity: ~150 kW of which 35 MW Renewables (~23%)
Production: ~400 GWh, 20% from Renewables
Life Expectancy: 76 years
Literacy Rate: 87% for adults, 99% for young
Active Population with Medium or Higher
Education: ~ 15% ( > 7 Medium or Higher
Education Institutions)

Installed
Capacity Population 2010 2013
(MW)
Santo Antão 43.915 6,0 6,0
São Vicente 76.107 19,4 19,4
São Nicolau 12.817 2,2 3,2
Sal 25.765 16,9 20,4
Boavista 9.162 4,5 17,0
Maio 6.952 1,4 1,0
Santiago 273.919 46,9 69,7
Fogo 37.051 3,8 3,2
Brava 5.995 1,1 0,9
5 MW
9,4 MW
2,55 MW
1 MW
5,95 MW
7,65 MW
2,5 MW
Brava Eólico 0,15 MW
Fogo
Santiago Eólico 9,4 MW
Solar 5 MW Maio
Boavista Eólico 2,55 MW
São Vicente Eólico 6,25 MW
São Nicolau
Santo Antão Eólico 1 MW
Sal Eólico 8,25 MW
Solar 2,5 MW
0 - 5
6 - 10
11 - 20
21 - 30
31 - 40
Potência MW
Tecnologia
Eólica
Solar
Rede
20 kV
0,15 MW
0,3 MW
0,6 MW
Outros projectos1
1 Microgeração, iluminação pública fotolvoltaica, sistemas isolados fotovoltaicos e micro-hídrica
Energy in Cape Verde: Past and Presence 9 SMALL AND DISPERSED ENERGY SYSTEMS
POWER PLANTS INSTALLED CAPACITY - MAINLY DIESEL (ALSO WIND AND SOME SOLAR PV)

GROSS ENERGY CONSUMPTION - EVOLUTION GWh
Year Butane Kerosene Gasoline Gasoil Fuel oil JET A1 Wind Solar Wood
fuel
Gross
Energy
2010 134,0 7,5 87,8 936,8 621,0 195,7 2,0 2,1 348,9 2.335,8
2011 136,0 7,5 87,7 990,2 640,3 228,4 15,6 9,0 357,0 2.471,6
2012 133,3 6,2 83,1 909,1 573,9 226,1 61,4 7,5 365,2 2365,7
2013 134,2 5,7 84,1 804,8 615,5 208,6 70,7 7,3 373,3 2.304,2
Energy in Cape Verde: Past and Presence
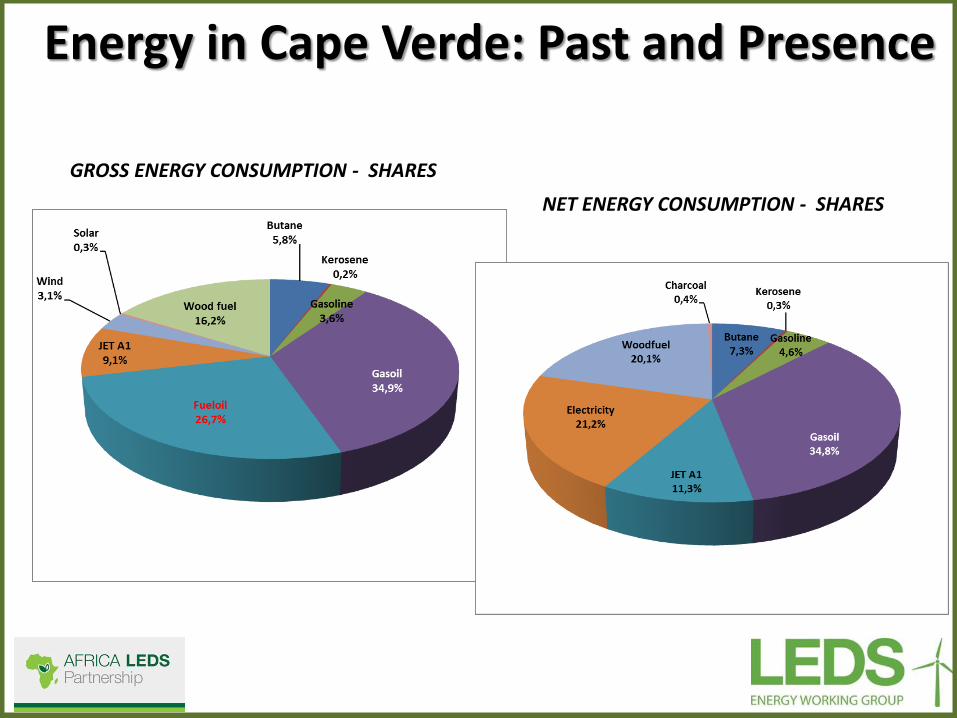
GROSS ENERGY CONSUMPTION - SHARES
Energy in Cape Verde: Past and Presence
NET ENERGY CONSUMPTION - SHARES

Clean Energy Programs and Policies: Present Program
2008: Cabo Verde Energy Policy
Energy Security and Energy Independence
Sustainability (Economic, Financial and Environmental)
Efficiency (Energy and Economic)
Promotion of Renewable Energy (50% of Electricity from Renewable in 2020)
Main Instruments
Decree Law 1/2011: Define General Condition and Incentives for Renewable Energy
(Taxes, Environmental and Customs benefits)
Introduce the Independent Power Producer (IPP)
Microgeneration

Energy in Cape Verde: Past and Presence
CABEÓLICA (PPP) – 4 Wind Park in 4 islands:
São Vicente: 5.9 MW
Sal: 7.6 MW
Boavista: 2.5 MW
Santiago: 9.3 MW
ELECTRA (Public)
Solar Park in Sal: 2.5 MW
Solar Park in Santiago: 5MW
ELECTRIC WIND (Private)
Wind Park in Santo Antão: 0.5 MW
RESULT:
Average more than 20% Renewable Energy Penetration on the Grid
More than 30% in São Vicente and Sal Islands
MAIN INVESTMENT IN RENEWABLE IN 2010/2011
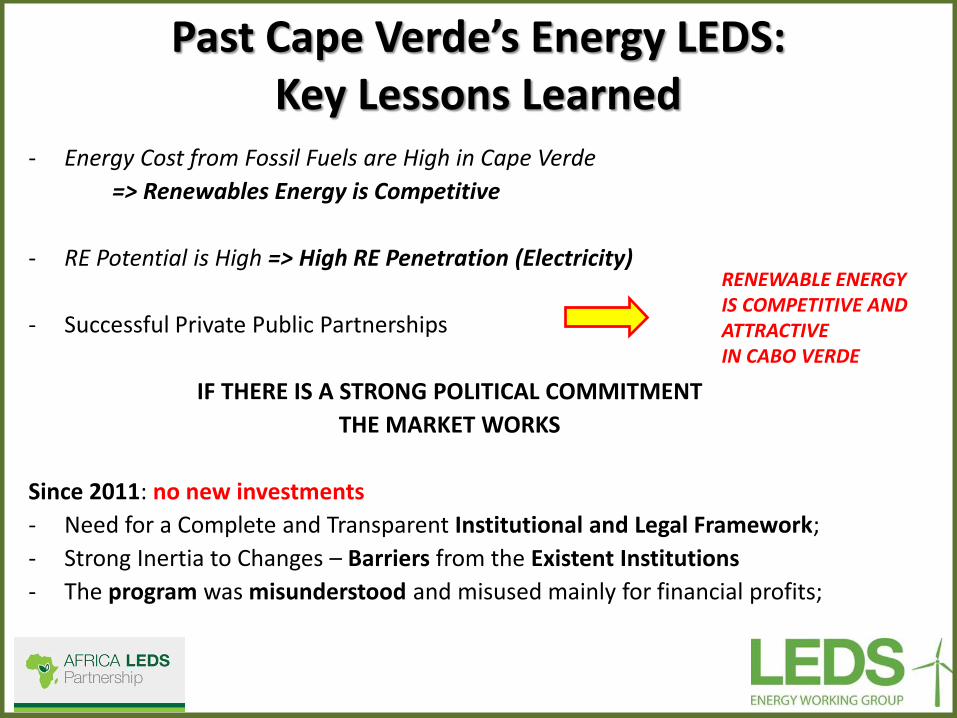
Past Cape Verde’s Energy LEDS: Key Lessons Learned
- Energy Cost from Fossil Fuels are High in Cape Verde
=> Renewables Energy is Competitive
- RE Potential is High => High RE Penetration (Electricity)
- Successful Private Public Partnerships
IF THERE IS A STRONG POLITICAL COMMITMENT
THE MARKET WORKS
Since 2011: no new investments
- Need for a Complete and Transparent Institutional and Legal Framework;
- Strong Inertia to Changes – Barriers from the Existent Institutions
- The program was misunderstood and misused mainly for financial profits;
RENEWABLE ENERGY IS COMPETITIVE AND ATTRACTIVE IN CABO VERDE

The Energy Future: Clean Energy Programs and Policies
ECOWAS countries have defined regional targets for RE, EE and Energy Access:
In preparation:
1. NATIONAL RENEWABLE ENERGY ACTION PLAN
2. ENERGY EFFICIENCY ACTION PLAN
3. AGENDA SUSTAINABLE ENERGY FOR ALL

The Energy Future: National Energy Goals
RENEWABLE FOR ELECTRICITY - Three Axes
1. Remote Grid: to achieve 100% Electricity Access in 2016!!
2. 100% Electricity from Renewables in 2020!
3. Microgeneration Grid connected System but mainly for Self-consumption
ENERGY EFFICIENCY - Four Axes:
1. Efficient Electricity Distribution Grid 2. Promoting Energy Efficient Building 3. Energy Standards and Labelling for Appliance and Equipment's 4. Promoting Energy Efficient Intensive Consumers
ENERGY ACCESS AND ENERGY EFFICIENCY FOR COOKING -
Eradicate three stones + universalization of improved stoves Promote Butane Gas

The Energy Future: Main Axes of Intervention
Legal and Institutional Framework: Complete and Transparent; Clear Responsibilities, Duties and Rights
Promoting Independent Power Producer and ESCO: private leadership
Competitive Market for Production
Competitive Market for Energy Efficiency
Create Storage Market
Create Confidence in the Energy Market
– Simplified Procedures for Licensing (one stop shop);
– Public and competitive Auction based on lest coast offer;
– Standard Power Purchase Agreement;
– Creation of a National Certification System for Buildings, Appliances and Equipment's;
– Certification of Technicians and Installers;
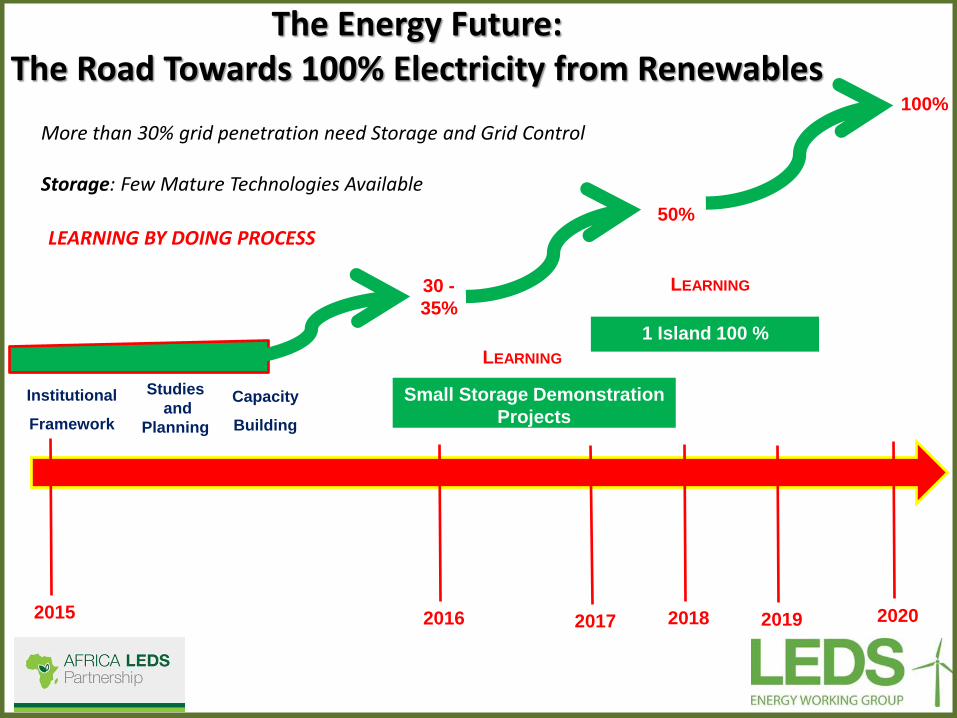
The Energy Future: The Road Towards 100% Electricity from Renewables
Institutional
Framework
2015 2018 2019
Studies
and
Planning
Small Storage Demonstration
Projects
LEARNING
2017 2020
30 -
35%
50%
100%
1 Island 100 %
2016
LEARNING
LEARNING BY DOING PROCESS
Capacity
Building
More than 30% grid penetration need Storage and Grid Control Storage: Few Mature Technologies Available
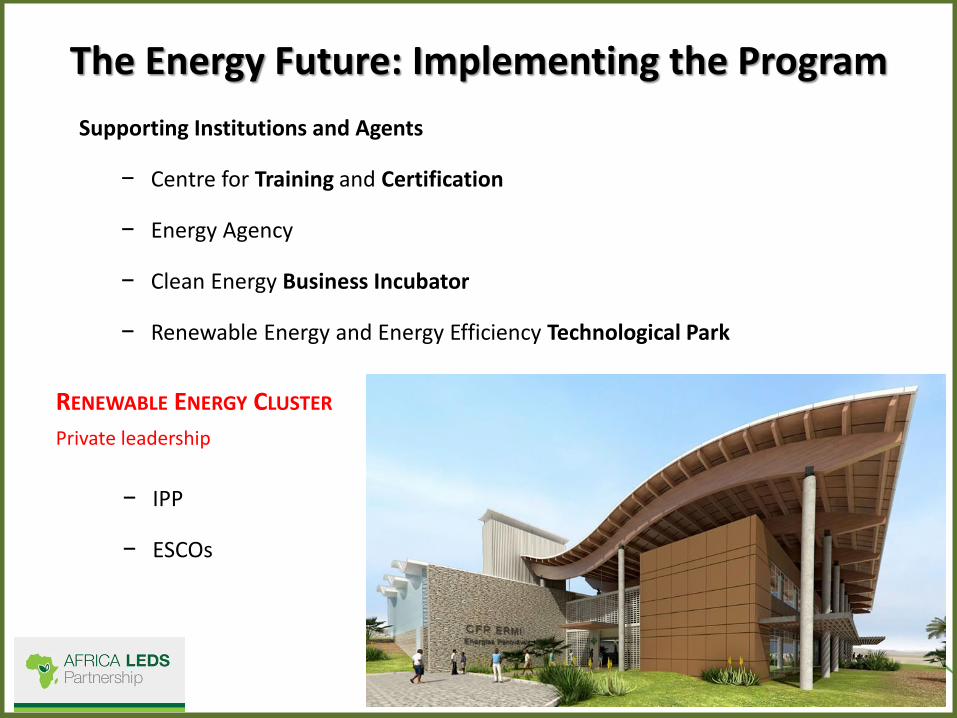
The Energy Future: Implementing the Program
Supporting Institutions and Agents
− Centre for Training and Certification
− Energy Agency
− Clean Energy Business Incubator
− Renewable Energy and Energy Efficiency Technological Park
RENEWABLE ENERGY CLUSTER
Private leadership
− IPP
− ESCOs

Monitoring, Verification, Reporting
All the energy strategy in Cape Verde shall, in its components of
Governance, Coordination, Implementation and Monitoring & Evaluation,
lead by the institution of a
Insular Energy Agency.
Regular Collection and Analysis of Data on Energy Consumption;
Monitoring the Effectiveness of Energy Efficiency Programs;
Development Sectorial Analysis;
Analysis and Monitoring of Sociocultural Factors related to Energy Efficiency;
Preparation and Dissemination of Specific Surveys;
Cape Verde’s Energy LEDS: Conclusions
What is Needed
→ Strong Political Commitment and Vision;
→ Clear Policy and Action Plans;
→ Clarify Rules, Duties and Responsibilities;
→ Promote and Strength the Necessary Institutions;
→ Build a Trustful and Transparent Market;
→ Inform and Educate;
→ Capacity Building.

Learning from Kenya’s Clean Energy Plan
Esther Wang’ombe
Government of Kenya Ministry of Energy and Petroleum

The Ministry of Energy is the key player in energy sector. Its mandate includes Policy Formulation and Planning, Monitoring & Evaluation for the following:
• Hydropower Development
• Geothermal Exploration & Development
• Thermal Power Development
• Renewable Energy Development
• Energy Regulation, Security & Conservation
• Fossil Fuels Exploration & Development
Energy in Kenya
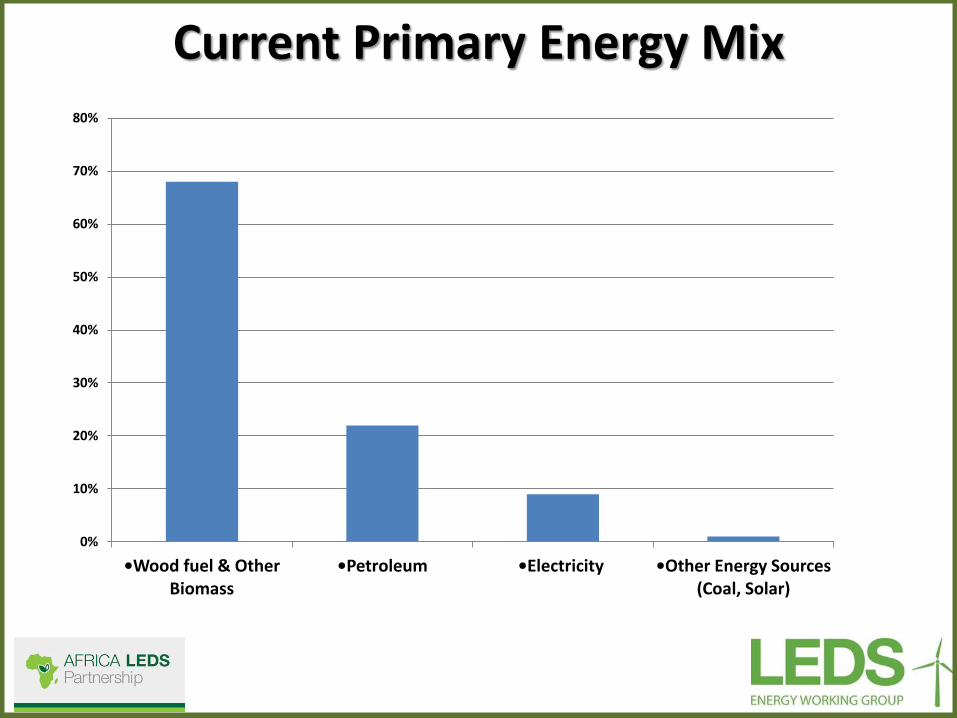
Current Primary Energy Mix
0%
10%
20%
30%
40%
50%
60%
70%
80%
•Wood fuel & Other Biomass
•Petroleum •Electricity •Other Energy Sources (Coal, Solar)

POWER SOURCE INSTALLED CAP. (MW)
PERCENT
HYDRO-ELECTRIC 817 46.6
THERMAL 542 30.9
GEOTHERMAL 363 20.7
WIND 5.9 0.3
Co- Generation 26 1.5
TOTAL 1,753.9 100
Current Electrical Power Generation Mix
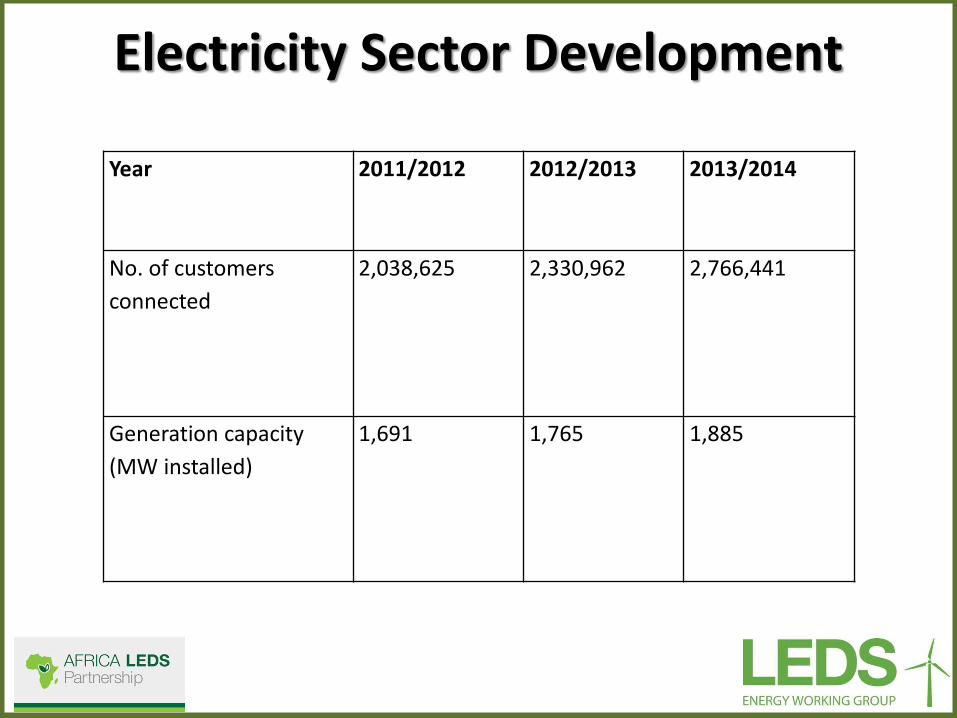
Year 2011/2012 2012/2013 2013/2014
No. of customers
connected
2,038,625 2,330,962 2,766,441
Generation capacity
(MW installed)
1,691 1,765 1,885
Electricity Sector Development

• Geothermal 5,110 MW
• Coal 2,420 MW
• Thermal (Diesel,& GTs) 3,615 MW
• Imports 2,000 MW
• Nuclear 3,000 MW
• Wind 2,036 MW
• Hydropower 1,039 MW
• Total 19,220 MW
Envisaged Electricity Generation Mix in 2030

Clean Energy Development
• Number of Primary schools connected during with electricity in year 2014 was 1706. About 401 solar PVs were also installed in primary schools that are far from the grid.
• Geothermal, wind, biogas
• Number of new customers connected with electricity was 214,377 (an increase of 18.7% from the previous year) giving a total of 2,980,818 as at 31st December 2014.

Policy guidance • National climate change action plan (Renewable energy key in
adaptation and mitigation, development of NAMA proposal)
• The Government is mandated to develop and implement energy policy, and ensure secure and efficient utilization and conservation of energy
• Energy Policy of 2004 and the Energy Act of 2006 provide policy direction and legal framework for energy efficiency and conservation; and promotion of new and renewable energy
• Feed-in Tariffs policy (biomass, wind, solar, biogas)
• Least cost power development plan
• Kenya’s Scaling Up Renewable Energy Program (SREP) Investment Plan
• Kenya’s Vision 2030 aims to make Kenya a middle income country with a clean and secure environment
• Energy identified as one of the key Enablers to the achievement of the vision goals.
• The country aims to increase the Electrical Power Generation from the current 1,533MW to at least 19,000MW by year 2030.
Kenya’s Vision 2030

Strategic Plan for Kenya 2013-2017 Objectives:
• To increase connectivity: The government’s strategy is to connect more
customers to enhance economic development. • To power energy intensive activities in the counties: include mining,
irrigation of large tracts of land for food security and agro-based industry • To power electrification of rail lines and new economic zones
• To enhance national electrification and distribution network: Progressive
expansion and up-grading of transmission and distribution network. • Planned development of 2,108.4 MW by 2016/2017 from renewable
energy resources; this is comprising of geothermal (1,460MW), wind (630.4MW), Co-generation (18MW).

Collaborative Initiatives with Stakeholders
The Government needs support from stakeholders towards achievements of the output targets in the Strategic Plan 2013-2017. These include:
• private sector
• development partners
• civil society
• the larger public

• Public- private sector
The private sector has an opportunity to invest in RE.
The Government has created the necessary environment for the private sector (e.g. policies, taxation, etc).
Scaling up research in RE technologies
• Energy and Environment Partnership Programme
• Bilateral Technical Cooperation with other countries
• Global initiative
Collaborative Initiatives with Stakeholders

GHG emissions
• Kenya’s National GHG inventory system is now institutionalised as informed by the National Climate Change Action Plan (NCCAP).
• Part of Kenya’s wider MRV framework.
• The Initial National Communication (INC) was submitted in June 2002.
• This was the first attempt Kenya made to prepare GHG inventory consistent with the IPCC Guidelines.
GHG emissions: Identified Gaps
• Current data collection systems not tailored for GHG inventory.
• Inadequate technical capacity to generate appropriate activity datasets
• Poor documentation of relevant information

Monitoring, Verification, Reporting
• Monitoring is done against performance contract reports, strategic plan goals reports and quarterly progress reports
• Review of policy is guided by:
– Kenya Vision 2030
– Kenya’s new constitution
– New government manifesto
• Transparency and reporting
– Customer feed back – stakeholder workshops
– Public forums – National Assembly and Senate

Kenya’s Energy LEDS: Conclusions
• Need to establish and implement a systematic, standardized process and format to collect, assess and share activity data and or maps and documentations.
• Need to build capacity for data collection and implementation and for archiving strategies to ensure effective national GHG inventory management systems
• Strengthen the ability of the national institutions to carry out GHG inventory development regularly

Key Lessons Learned from Kenya ENERGY DEVELOPMENT • Stakeholder consultation is an essential and critical component of the
process • High-level buy-in and involvement is crucial • Coordination between various tools and methods need to be encouraged • Work is needed to take prioritization to county governments – The recent
devolution process means that many low carbon development strategies require implementation at the county level
• Financial resources – The government has demonstrated commitment to many low carbon development strategies through budget allocations, but substantial international support will be required for the implementation of many actions/ activities
GHG • Current data collection systems are not tailored for GHG inventory. • Inadequate technical capacity to generate appropriate activity datasets • Poor documentation of relevant information

Questions
To ask a question, please select the “questions” pane on your screen and type your question into the textbox.

Survey
Please take a moment to take this short survey to let us know how we did and where we can improve.

Thank you
Alexander Ochs, [email protected]
John Yeboah, [email protected]
Anildo Costa, [email protected]
Esther Wang’ombe, [email protected]
Membership is open for the Energy Working Group. Please contact Max Lander at [email protected]
for more information or to join.