energy management system future group. how energy management system helps gives electrical...
TRANSCRIPT

Energy Management SystemFuture Group
SUN ELECTRIFICATION

How Energy Management System helps
Gives Electrical parameters and energy consumption Section or store wise for taking corrective actions
Gives a clear picture about energy costs involved per
store.
Helps to optimize and Monitor Electrical Parameters
to achieve Energy saving and Electrical Equipment Safety

Key Features - Analysis
Reports • Consumption reports• Specific parameter report.• Total consumption report.• Billing reports.• Sub Billing for tenants or different cost centers.

System Architecture
PHOENIX MALL
R MALL
GROWEL MALL
OBEROI MALL
R-CITY MALL
MEGA MALL
EVERSHINE MALL
INFINITY MALL
SOBO CENTER
HUB MALL
ORCHID MALL
K-STAR MALL
MILLAN MALL
All the sites are directly connected to the LAN network of the Future Group. We can see all the sites from any one of site by using desired Username and Password.

Accessing PowerMan from your PC
1. Go to Internet explorer & type http://10.0.119.11:8080/PowerMan
2. Login page of PowerMan will come
3. Use your User Name & Password to access the system

Login Page
1. PowerMan supports multiple user interface.
2. In order to access Power Man Application, it is necessary to pass through authentication.

How to Monitor Consumption
1. You can generate consumption graph for individual meter.
2. Select LOCATION from location list.
3. Select METER for which you want to generate graph.
4. Select date from calendar. To change month or year click on ‘<‘ ‘>’ Signs.
5. Apart from Horizontal bar graph you can select vertical bar, pie chart, Vertical 3D bar, Horizontal 3D bar, Pie 3D, stacked vertical bar, stacked vertical bar.

After above process you will get this type of screen which shows per day consumption of each meter.
You can view the consumption values even in tabular format by
selecting Textual overview option.

Graphical representation of Consumption
Comparison
The comparison
between planned and
actual consumption of
power or between two
modules or load
profiles of two or
more modules is
possible.

How to Monitor Current, VoltageSimilar to consumption
graphics you can generate load profile graph for Instantaneous
parameters like voltage, current, Frequency, Active Power, Average current and voltage, Phase angle etc.

How to monitor real time trend Real Time Trend
Real time trend charts of any of the parameters can be viewed separately or together on a single screen for a particular meter.
Parameters Monitored
All the various parameters like Voltage, Current, Active Power, Frequency, voltage, current, etc can be monitored and graphically represented.

How to download reports in Excel With screen you can generate Total Consumption
report. Properties of Total Consumption screen. Company: It is requires to select Company from
list. Location: It is requires to select Location from
list. Channel: It is requires to select Channel from
list. Relative Date: It is requires to select Relative
Date by selecting appropriate option. Start Date: It is requires to select Start Date from
which you want to generate report. End Date: It is requires to select End Date till
which you want to generate report. Report Name: This field is mandatory and
Report Name is required to define. Excel Code Generator: To download the report
into Excel click on Excel Code Generator

In case of missing readings:
To Check Energy Meter :1. Check whether all parameters are showing properly in
meter display like Current, Voltage, KW, etc.
3. If any Current or active power value gets improper value then have to check CT connections.
How to check hardware components :

check Com Controller :
1. Check auxiliary power supply of controller, whether RED LED glows, Green LED blinks.
2. Then check whether Network cable (controller to switch) is properly connected
3. If above all conditions are satisfied then check whether com-controller is in network

CONNECTION DETAIL
DATA CABLE CONNECTION
1.Server switch to com controller cat 5 straight cable
2.Controller to meter cat 5 as per connection detail
3. Meter to meter as per connection detail (CAT 5)
POWER CABLE CONNECTION
1.Com controller 230 v supply
2.Meter –3 phase ct connections
R Y B N supply connections
auxiliary supply connection
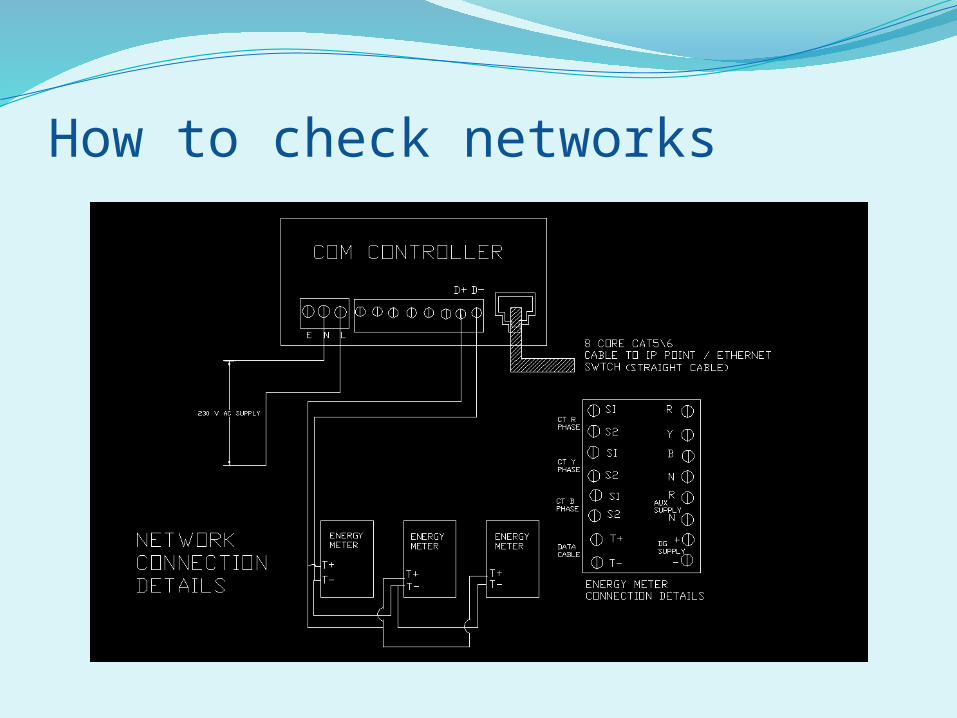
How to check networks

Contact Details
Pramod Sapkal9967530805
Anurag Giri09820689255
Sajiv K.V.09322259684
Dinesh Shingote09664351059
San Lazaro09324712300