energy optimisation of hybrid off-grid system for remote
TRANSCRIPT

Alsharif et al. EURASIP Journal on Wireless Communicationsand Networking (2015) 2015:64 DOI 10.1186/s13638-015-0284-7
RESEARCH Open Access
Energy optimisation of hybrid off-grid systemfor remote telecommunication base stationdeployment in MalaysiaMohammed H Alsharif*, Rosdiadee Nordin and Mahamod Ismail
Abstract
Cellular network operators are always seeking to increase the area of coverage of their networks, open up newmarkets and provide services to potential customers in remote rural areas. However, increased energy consumption,operator energy cost and the potential environmental impact of increased greenhouse gas emissions and theexhaustion of non-renewable energy resources (fossil fuel) pose major challenges to cellular network operators.The specific power supply needs for rural base stations (BSs) such as cost-effectiveness, efficiency, sustainabilityand reliability can be satisfied by taking advantage of the technological advances in renewable energy. This studyinvestigates the possibility of decreasing both operational expenditure (OPEX) and greenhouse gas emissionswith guaranteed sustainability and reliability for rural BSs using a solar photovoltaic/diesel generator hybrid powersystem. Three key aspects have been investigated: (i) energy yield, (ii) economic factors and (iii) greenhouse gasemissions. The results showed major benefits for mobile operators in terms of both environmental conservationand OPEX reduction, with an average annual OPEX savings of 43% to 47% based on the characteristics of solarradiation exposure in Malaysia. Finally, the paper compares the feasibility of using the proposed approach in afour-season country and compares the results against results obtained in Malaysia, which is a country with atropical climate.
Keywords: Mobile base station; Energy efficiency; Off-grid hybrid energy systems; Cost-effectiveness;Environmental impacts; HOMER
1 IntroductionThe unexpected increase in subscribers and demand forhigh-speed data has led to tremendous growth in cellularnetworks in the last several years. In 2013, the numberof mobile subscribers reached 6.8 billion [1], of whom 1billion were in rural areas (off-grid sites) [2]. To accessthese new markets and provide a service to potentialcustomers in remote rural areas, the number of BSs hasbeen increased to fulfil the needs of mobile subscribersand increase the coverage area. According to [3], BSs areconsidered the primary source of energy consumption incellular networks, accounting for 57% of the total energyused and putting the cellular operators under immensepressure to solve the problem of electricity supply in a
* Correspondence: [email protected] of Electrical Electronics and Systems Engineering, Faculty ofEngineering and Built Environment, Universiti Kebangsaan Malaysia, 43600Bangi, Selangor, Malaysia
© 2015 Alsharif et al.; licensee Springer. This isAttribution License (http://creativecommons.orin any medium, provided the original work is p
reliable and cost-effective way. However, electrical gridsare typically not available in these remote locations dueto the geographical limitations (challenging terrain) thatmake access to these sites difficult. Therefore, supplyingpower to an off-grid BS is a significant challenge. Trad-itionally, a diesel generator (DG) is used to supply elec-trical power to a base station at an off-grid site [4].Nevertheless, the concept of using DGs to power BSshas become much less viable for network companieslooking to expand and deliver their services to potentialnew customers for the following reasons:
1. Economic aspect: most of the costs go to the fuel,which is expensive, and the fuel price will continueto increase in the future. Additionally, the transfer offuel to these remote places characterised bychallenging terrain may require special means oftransport, such as helicopters, which increases the
an Open Access article distributed under the terms of the Creative Commonsg/licenses/by/4.0), which permits unrestricted use, distribution, and reproductionroperly credited.

Alsharif et al. EURASIP Journal on Wireless Communications and Networking (2015) 2015:64 Page 2 of 15
cost of the operation [5]. Figure 1 presents the costsof operating DGs, which include the initial capitalcost, installation cost, operating and maintenance(O&M) cost and fuel cost [6].
2. Environmental impact: air pollution by harmfulcomponents emitted from diesel fuels such ascarbon dioxide, sulphur dioxide and nitrogen oxidescauses global warming, the depletion of the ozonelayer, cancer, genetic mutations and acid rain.According to [7], the ICT sector’s CO2 emissionswill rise to 349 MtCO2 by 2020, with 51% (179MtCO2) of the emissions coming from the mobilesector. Accordingly, increasing awareness of theenvironmental impact of greenhouse gas emissionsand the exhaustion of non-renewable energyresources (fossil fuel) has highlighted the criticalneed to improve the energy efficiency of cellularnetworks.
3. Technical issues: the efficiency of the DG system islow, with only approximately 30% of the fuel energybeing converted to electrical energy and the restlost as heat [2]. In addition, BS sites supplied byDGs are not reliable; 65% of the telecom servicelosses are due to outages resulting from a variety ofthe failures from which these generators suffer [2].When a failure occurs, the input of substantialtime and money is generally required to bring atechnician on site to perform the necessary repairs.
These drawbacks have motivated cellular network op-erators to search for solutions to both promote environ-mental conservation and reduce capital and operationalcosts. The specific power supply requirements for ruralBSs, such as cost-effectiveness, efficiency, sustainabilityand reliability, can be met by utilising the technologicaladvances in renewable energy. The network equipmentdeployed in these remote locations must be optimised sothat they save energy while providing the best service
Figure 1 Net costs of operating a DG [6].
with the largest coverage feasible. If network companiescan install renewable energy supplies for their remote sites,they would gain access to hundreds of millions of potentialnew customers. Furthermore, by adopting renewable en-ergy sources, network operators can reduce their operatingexpenses and have a positive impact on the environmentvia the reduction of harmful gas emissions.The rest of this paper is organised as follows. Section
2 presents studies that have investigated the possibilityof reducing both the OPEX and greenhouse gas emis-sions through the use of renewable energy systems indifferent zones of the world. Section 3 discusses the po-tential for using renewable energy to supply the BSs inremote places in Malaysia, and Section 4 describes theuse of solar energy in Malaysia, including the character-istics of the solar radiation of Malaysia and the barriersto using solar photovoltaic (SPV) panels in Malaysia, aswell as some recommendations. In Section 5, the systemarchitecture for the hybrid power model to supply long-term evolution (LTE)-BS is described, and Section 6presents the mathematical model. Section 7 briefly intro-duces the hybrid optimisation model for electric renewables(HOMER) software, a hybrid power system modelling toolused in this study, and Section 8 includes the simulationconfiguration. Section 9 presents the results and discussion.Section 10 presents the comparison and estimation of thefeasibility of using the solar energy approach in Germanyby using Malaysia as the central point of reference, andSection 11 concludes this paper.
2 Related studiesOver the last 5 years, significant developments havebeen made in integrating electrical grids and renewableenergy into a smart grid to manage the power supply ofBS sites. In India, efforts have been made to optimisethe size of wind turbine generators (WTGs), SPV arraysand other components for a hybrid power system;generator-based power supplies for global system formobile communication (GSM, alternatively referred toas 2G) and code division multiple access (CDMA, 3G)standards have also been investigated [8,9]. Reference[10] studied the feasibility of implementing a SPV/dieselhybrid power generation system suitable for a GSM basestation site in Nigeria. Waqas et al. [11] presented thedesign idea for a solar system with a diesel generator asa backup source for a GSM cellular network standard inPakistan. Reference [12] studied the feasibility of imple-menting an SPV/diesel hybrid power generation systemsuitable for a GSM base station site in Bangladesh.Martinez-Diaz et al. [13] discussed a photovoltaic (PV)-wind-diesel-battery system for a station in Spain. InNepal, reference [6] studied the optimisation of a hybridPV-wind power system for a remote telecom station.Kanzumba et al. [2] investigated the possibility of using

Alsharif et al. EURASIP Journal on Wireless Communications and Networking (2015) 2015:64 Page 3 of 15
hybrid photovoltaic/wind renewable systems as primarysources of energy to supply mobile telephone base trans-ceiver stations in the rural regions of the Republic of theCongo. Reference [14] discussed three types of renew-able energy: (i) a SPV-battery system, (ii) an SPV-fuelcell (FC) system and (iii) an SPV-FC-battery system. Themodelling and size optimisation of such hybrid systemsfeeding a stand-alone direct current (DC) load at a tele-com base station have been carried out using theHOMER software. Vincent et al. [15] proposed a hybrid(solar and hydro) and DG system based on the powersystem models for powering stand-alone BS sites. Table 1provides a summary of related works that have been in-vestigated for green wireless network optimisation strat-egies within smart grid environments.
3 Potential for applying renewable energy as theenergy supply for BSs in remote sites in MalaysiaMalaysia lies entirely within the equatorial region, between1° and 7° N and 100° and 120° E, offering an abundant po-tential for the use of renewable energy resources, espe-cially solar and wind power [16].In the early 1980s, a study of Malaysia’s wind energy was
undertaken at University Kebangsaan Malaysia (UKM).The Solar Energy Research Group of UKM collected wind
Table 1 Summary of the approach that was discussed
Year of publication Hybrid resources Storage and
2009 [14] Photovoltaic Battery
Wind Fuel cell
Diesel genera
2010 [9] Photovoltaic Battery
Wind Diesel genera
2012 [8] Photovoltaic Battery
Wind Polar DC gene
2012 [2] Photovoltaic Battery
Wind Diesel genera
2012 [12] Photovoltaic Battery
Diesel genera
2013 [10] Photovoltaic Battery
Diesel genera
2013 [13] Photovoltaic Battery
Wind Diesel genera
2013 [6] Photovoltaic Battery
Wind Fuel cell
Diesel genera
2013 [15] Photovoltaic Battery
Hydro turbine Diesel genera
2013 [11] Photovoltaic Battery
Diesel genera
data from ten stations throughout the country over aperiod of 10 years from 1982 to 1991. The data studied in-clude the hourly wind speed at the stations, which are lo-cated mostly at airports and near coasts, where the landand sea breezes may influence the wind regime [17]. Thestudy showed that the mean wind speed is low, not exceed-ing 2 m/s. However, the wind does not blow uniformly,varying by month and region. The greatest wind power po-tential is that of Mersing and Kuala Terengganu, which arelocated on the East Coast of Peninsular Malaysia [18]. In2014, reference [19] presented a study on predicting thewind speed in these states over the long-term using neuralnetworks and a set of recent wind speed measurementsamples from the two meteorological stations in thesestates. The results showed that the future mean wind speedwill remain low, not exceeding 3 m/s. Therefore, wind tur-bines are rarely used in Malaysia and were excluded fromthis study.Regarding solar energy, Malaysia has a stable climate
throughout the year. Hence, the solar radiation in Malaysiais highly relative to global standards. Malaysia’s solar poweris estimated to be four times the power of the world’s fossilfuel resources [20]. The global irradiation fluctuated in therange of 2 to 6 kWh/m2/day. The second part of the year(October to February) is characterised by more cloud cover
support system Cellular generation Case study
GSM India
tor
GSM India
tor UMTS
GSM India
rator CDMA
GSM Congo
tor
GSM Bangladesh
tor
GSM Nigeria
tor
GSM Spain
tor
GSM Nepal
CDMA
tor
GSM Nigeria
tor
GSM Pakistan
tor

Alsharif et al. EURASIP Journal on Wireless Communications and Networking (2015) 2015:64 Page 4 of 15
and thus poorer solar potential than the first part of theyear (March to October), and the average temperatureranges from 33°C during the day to 23°C at night [21].Moreover, solar cells have low-maintenance needs andhigh reliability, with an expected lifespan of 20 to 30 years.One square metre of solar panelling in Malaysia is esti-mated to result in an annual reduction of 40 kg of CO2
[18], making solar power a promising future energy sourcefor telecommunication applications.
4 Solar energy in MalaysiaSolar radiation data in Malaysia have been the subject ofearlier studies. Malaysia’s climatic conditions are desirablefor extending the utilisation of SPV systems due to thehigh amount of solar radiation received throughout theyear. The northern region and a few places in easternMalaysia receive the highest amount of solar radiationthroughout the year. The lowest irradiance value is ob-tained for Kuching, whereas Kota Kinabalu has the highestmeasured solar radiation [16]. Figure 2 provides informa-tion on solar radiation in different states of Malaysia.Figure 2 reveals that Sabah, Perlis and Kedah have suffi-
cient solar resources to support solar energy applications.Figure 3 presents the daily solar radiation in these threestates.The average daily solar radiation in Kedah, Sabah and
Perlis is equal to 5.48, 5.31 and 5.24 kWh/m2, respect-ively. According to reference [22], the average solar radi-ation in these states indicates the high potential of SPVwhere the solar radiation is higher than 5 kWh/m2/day.Moreover, Figure 4 shows Malaysia’s average daily solarradiation, which is estimated to be 5.15 kWh/m2 [18].Accordingly, this study will investigate five average
daily solar radiation values to cover all the states ofMalaysia: 5.1, 5.2, 5.3, 5.4 and 5.5 kWh/m2.
Figure 2 Annual average solar radiation (MJ/m2/day) [16].
4.1 Barriers to using SPV panels for remote areas inMalaysiaThe aforementioned discussion reveals that Malaysia hasexcellent solar energy potential. However, some barriersthat affect the performance of SPV panels should be con-sidered, as power shortages are not admissible in the cel-lular network sector.One of the major drawbacks of using solar cells is shade,
which may dramatically reduce the power produced bythe solar cell. In some seasons, tropical countries experi-ence heavy rain and cloudiness that may continue for sev-eral days, causing battery banks to run out of charge morequickly. To solve this problem, the present study suggeststhe hybridisation of the solar power system with existingbackup DG in rural areas, which will provide BSs with asustainable and reliable power supply, especially if the bat-tery lifespan is short.Dirt, dust, tree debris, moss, sap, water spots, mould,
etc. on solar panels have a significant impact on the per-formance of solar power systems. Cleaning the panels isalso a problem. The SPV panels are installed at relativelyhigh sites to maximise their access to the sunlight, andmoss and grass grow quickly on the panels, increasingthe cost of cleaning the panels. Therefore, we recom-mend installing solar panels on tilted roofs (with tilts ofas little as 5° to 10°) to allow wind, rain and gravity toremove most debris and dust naturally.In addition, the rapid growth of the surrounding trees
will shade the panels, decreasing the performance of PVpanels. Solar PV panels mounted on high poles also at-tract lightning strikes, the destructive voltage of whichdestroys the electronic components. Furthermore, thebypass diodes, which are mounted in the terminationbox under each panel, may crack under high humidity,heat and short circuits. One of the solutions is to engage

Figure 3 Average daily radiation (kWh/m2) [18].
Alsharif et al. EURASIP Journal on Wireless Communications and Networking (2015) 2015:64 Page 5 of 15
trained educated villagers to operate, maintain and man-age the solar panels.
5 System architectureFigure 5 is a schematic showing two subsystems: the BSand the hybrid energy source.
5.1 Base station subsystemThe BS, a centrally located set of equipment used tocommunicate with mobile units and the backhaul net-work, consists of multiple transceivers (TRXs), which inturn consist of a power amplifier (PA) that amplifies theinput power, a radio-frequency (RF) small-signal trans-ceiver section, a baseband (BB) for system processingand coding, a DC-DC power supply, a cooling systemand an alternating current (AC)-DC unit for connectionto the electrical power grid. Table 2 summarises thepower consumption of the different pieces of LTE-macro BS equipment for a 2 × 2 MIMO configuration,and three sectors where the total input power (Pin)
Figure 4 Average daily solar energy received in Malaysia [18].
needed by the LTE-macro BS is 964.9 W. More detailson the BS internal components can be found in [23].
5.2 Hybrid energy source subsystemThe main components of a hybrid energy source subsys-tem are listed below:
1. Solar panels: responsible for collecting sunlight andconverting the sunlight into DC electricity.
2. Diesel generator: used as a secondary energy sourceduring the peak demand or in the case of batterydepletion. The optimum operation range for adiesel generator is between 70% and 89% of itsrated power [24].
3. Battery bank: stores excess electricity for futureconsumption by the BS at night, during load-shedding hours, or if the available solar energy isnot sufficient to feed the BS load completely. Toprotect the battery, inclusion of a charge controlleris recommended. A charge controller or battery

Figure 5 System model of an adaptive power management scheme for remote LTE-BS.
Alsharif et al. EURASIP Journal on Wireless Communications and Networking (2015) 2015:64 Page 6 of 15
regulator limits the rate at which the electric currentis added to or drawn from electric batteries, preventsovercharging and may protect against overvoltage,which can reduce battery performance or lifespan andmay pose a safety risk. A charge controller may alsoprevent the complete draining (‘deep discharging’) ofa battery or perform controlled discharges, dependingon the battery technology, to protect battery life [24].
4. Inverter: converts the DC voltage from the loadbus-bar and battery to AC voltage at a high efficiencyto satisfy the (BS) requirement of the main load foruninterruptible AC power. The inverter is also ableto log information such as system performance (e.g.electricity produced by the system on a daily, monthlyor yearly basis) and safety measures to avoid electricalmishaps [24].
5. Control system: serves as the brain of a complexcontrol, regulation and communication system. Themost common communication units in the remoteinterface are wireless modems or network solutions.In addition to the control functions, data logger andalarm memory capabilities are of high importance.All power sources working in parallel are managed
by a sophisticated control system and share the loadwith their capabilities to accommodate the fact thatpower shortages are not admissible in the cellulartelephony sector.
6 Mathematical model6.1 Photovoltaic systemThe SPV generator contains modules that are composed ofmany solar cells interconnected in series/parallel to form asolar array. HOMER calculates the energy output of theSPV array (ESPV) by using the following equation [25]:
ESPV ¼ Y SPV � PSH� f SPV ð1Þ
where YSPV is the rated capacity of the SPV array (kW)and PSH is a peak solar hour which is used to expresssolar irradiation in a particular location when the sun isshining at its maximum value for a certain number ofhours. Because the peak solar radiation is 1 kW/m2, thenumber of peak sun hours is numerically equal to thedaily solar radiation in kWh/m2 [18] and fSPV is the SPVderating factor (sometimes called the performance ratio),a scaling factor meant to account for effects of dust on

Table 2 Power consumption of the LTE-BS hardwareelements [23]
Item Notation Unit Macro
PA Max transmit (rms)power, Pmax
W 39.8
Max transmit (rms)power
dBm 46.0
PAPR dB 8.0
Peak output power dBm 54.0
PA efficiency, μ % 38.8
Total PA (PPA) =Pmaxμ W 102.6
TRX PTX W 5.7
PRX W 5.2
Total RF (PRF) W 10.9
BB Radio (inner Rx/Tx) W 5.4
Turbo code(outer Rx/Tx)
W 4.4
Processor W 5.0
Total BB (PBB) W 14.8
DC-DC loss, σDC % 6.0
Cooling loss, σcool % 9.0
AC-DC (main supply) loss, σMS % 7.0
Total per TRX = PPAþPRFþPBB1−σDCð Þ 1−σcoolð Þ 1−σMSð Þ W 160.8
Number of sectors # 3
Number of antennas # 2
Number of carriers # 1
Total number of transceivers (NTRX) # 6
Total number of NTRX chains,Pin = NTRX × Total per TRX
W 964.9 s
Alsharif et al. EURASIP Journal on Wireless Communications and Networking (2015) 2015:64 Page 7 of 15
the panel, wire losses, elevated temperature or anythingelse that would cause the output of the SPV array to de-viate from the expected output under ideal conditions.In other words, the derating factor refers to the relation-ship between actual yield and target yield, which is calledthe efficiency of the SPV. Today, due to improvedmanufacturing techniques, the performance ratio ofsolar cells increased to 85% to 95%.
6.2 Diesel generatorThe energy generated (EDG) by a DG with a given ratedpower output (PDG) is expressed in Equation 2 [25]:
EDG ¼ PDG � μ� t ð2Þwhere μ is the efficiency of the DG. Moreover, the fuelconsumption (FC) is calculated as follows [25]:
FC ¼ EDG � F spe ð3Þ
where EDG is the energy production (kWh) and Fspe isthe specific fuel consumption (L/kWh).
6.3 Battery modelThe battery characteristics that play a significant role indesigning a hybrid renewable energy system are batterycapacity (Ah), battery voltage (V), battery state of charge(%), depth of discharge (%), days of autonomy (h), effi-ciency (%) and lifetime of battery (year). The ‘TrojanL16P’ battery model, which provides good characteristicsas shown in Figure 6 combined with low cost, is used inthis paper. More details can be found in [26].The nominal capacity of the battery bank is the max-
imum state of charge SOCmax of the battery. The mini-mum state of charge of the battery, SOCmin, is thelower limit that does not discharge below the minimumstate of charge, which is 30% in the ‘Trojan L16P’battery model, as shown in Figure 6. The depth ofdischarge (DOD) is used to describe how deeplythe battery is discharged and is expressed in Equation 4[6]:
DOD ¼ 1−SOCmin ð4Þ
Based on Equation 4, the DOD for the ‘Trojan L16P’battery is 70%, which means that the battery has deliv-ered 70% of its energy and has 30% of its energy re-served. DOD can always be treated as how much energythe battery delivered.A battery bank is used as a backup system and is sized
to meet the load demand when the renewable energy re-sources failed to satisfy the load. The number of days afully charged battery can feed the load without any con-tribution of auxiliary power sources is represented bydays of autonomy. The battery bank autonomy is the ra-tio of the battery bank size to the electric load (LTE-BS).HOMER calculates the battery bank autonomy (Abatt) byusing the following equation [25]:
Abatt ¼Nbatt � V nom � Qnom 1− SOCmin
100
� �24 h=dayð Þ
Lprim−avg 1; 000Wh=kWhð Þð5Þ
where Nbatt is the number of batteries in the batterybank, Vnom is the nominal voltage of a single battery(V), Qnom is the nominal capacity of a single battery(Ah) and Lprim,ave is the average daily LTE-BS load(kWh).
Battery life is an important factor that has a directimpact on replacement costs. Two independent factorsmay limit the lifetime of the battery bank: the lifetimethroughput and the battery float life. HOMER calcu-lates the battery bank life (Rbatt) based on these twofactors as given in the following equation [25]:

Figure 6 ‘Trojan L16P’ battery model characteristics.
Alsharif et al. EURASIP Journal on Wireless Communications and Networking (2015) 2015:64 Page 8 of 15
Rbatt ¼ minNbatt � Qlifetime
Qthrpt;Rbatt;f
!ð6Þ
where Qlifetime is the lifetime throughput of a single bat-tery (kWh), Qthrpt is the annual battery throughput(kWh/year) and Rbatt,f is the battery float life (year).
6.4 DC/AC inverterInverters convert electrical energy from the DC forminto the AC form with the desired frequency of the load.The efficiency of the inverter is assumed to be roughlyconstant over the entire working range (e.g. 90%) [27].The optimum criteria, including economic, technical
and environmental feasibility parameters, were analysedusing the HOMER software package developed by theNational Renewable Energy Laboratory (NREL).
7 HOMER hybrid power system modellingsoftwareHOMER [25] is an optimisation software package usedto simulate various renewable energy source (RES) sys-tem configurations and scale them based on the netpresent cost (NPC). The NPC represents the life cyclecost of the system. The calculation assesses all costs thatoccur within the project lifetime, including initial setupcosts (IC), component replacements within the project
lifetime and maintenance. Figure 7 presents the architec-ture of the HOMER software.HOMER calculates the NPC according to the follow-
ing equation [25]:
NPC ¼ TACCRF
ð7Þ
where TAC is the total annualised cost ($). The capitalrecovery factor (CRF) is given by:
CRF ¼ i 1þ ið Þn1þ ið Þn−1 ð8Þ
where n is the project lifetime and i is the annual realinterest rate. HOMER assumes that all prices escalate atthe same rate and applies an annual real interest rate ra-ther than a nominal interest rate.The discount factor (fd) is a ratio used to calculate the
present value of a cash flow that occurs in any year ofthe project lifetime. HOMER calculates the discount fac-tor by using the following equation [25]:
f d ¼1
1þ ið Þn ð9Þ
NPC estimation in HOMER also considers the salvagecost, which is the residual value of the power system

Figure 7 Architecture of HOMER software.
Alsharif et al. EURASIP Journal on Wireless Communications and Networking (2015) 2015:64 Page 9 of 15
components at the end of the project lifetime. The equa-tion used to calculate the salvage value (S) is as follows:
s ¼ repremcomp
� �ð10Þ
where rep is the replacement cost of the component,rem is the remaining lifetime of the component andcomp is the lifetime of the component.
8 Simulation configurationThe lifetime of the project is 20 years, which representsthe lifetime of the BS equipment and the solar cells. Be-tween all the components in a base station, solar cellshave been found to be the most expensive in terms ofcapital cost. Hence, solar cells have a lifetime of 20 years,which is the same as the project lifetime, so neither BSnor the solar cells require replacement during the20-year period. In addition, the next-generation network,i.e. fifth generation (5G), is predicted to be implementedin the next 20 years, based on historical evolution fromthe previous legacy network cycle, e.g. 3G and 2G. TheMalaysian annual real interest rate was 3.25% in 2014[28]. HOMER makes a decision in each time step tomeet the power needs at the lowest cost, subject to theconstraints of the dispatch strategy chosen in the simu-lation and a set point of 80%. The system must supplyelectricity to both the load (base station system) and thebackup power system each hour. In the present study,the backup power needs 10% of the hourly load require-ment to retain enough spare capacity to serve the loadeven under a sudden 10% decrease in the renewable en-ergy output within an hour. Moreover, several sets ofsizes will be considered in the simulation, taking into ac-count the SPV, inverter and number of batteries neededto achieve cost-effective, reliable and efficient perform-ance in the optimisation process. The efficiency of theinverter is assumed to be roughly constant over theworking range (e.g. 90%, based on [27]), and the battery
efficiency is taken to be 85%. The DG configurations arebased on [2], where the DG cost is $660/kW. The re-placement cost is assumed to be $660/kW, and the oper-ating and maintenance costs are $0.05/h. The dieselprice is $0.7/L, and the carbon emission penalty is inter-nationally set to $2.25/t. The technical specifications,costs, economic parameters and system constraints thatare used in the present study are given in more detail inTable 3 below.
9 Results and discussionDifferent average daily solar radiation values of 5.1, 5.2,5.3, 5.4 and 5.5 kWh/m2 are used to simulate the appli-cation of solar energy across a wide range of Malaysianstates (for a detailed discussion, see the first paragraphof Section 4). The total power consumption by the LTE-BS is 965 W (details given in Table 2). Additional config-uration details are given in Table 3. The energy output,the economic analysis of the proposed hybrid systemsand the related sensitivity analysis are provided in thefollowing paragraphs.
9.1 Optimisation criteriaTable 4 includes a summary of the technical and eco-nomic criteria for the optimal design of the hybrid SPV/DG system at different daily radiation values.The optimal size of the solar energy system is obvi-
ously the same for all solar radiation rates proposed (5.1to 5.5 kWh/m2/day) for the same capacity of the DG(1 kW). However, the energy contribution differs, withthe contribution of energy from the solar power systemincreasing with increasing radiation rate. This increasewill decrease the energy contribution of the DG, lower-ing its operating period and providing the benefits of re-ducing both the operating costs and pollution rate.The system costs consist of the following: (i) the initial
capital cost is paid at the beginning of the project anddecreases with decreasing size of the elements of theproject, with the largest proportion of these costs going

Table 3 Simulation setup of the SPV/DG hybrid system
Systemcomponents
Parameters Value
Controlparameters
Annual real interest rate 3.25%
Project lifetime 20 years
Dispatch strategy Cyclic charging
Apply set point state of charge 80%
Operating reserve: as percent ofload, hourly load
10%
Carbon emission penalty $2.25/t
Diesel price $0.7/L
SPV Sizes considered 1, 1.5, 2, 2.5 kW
Operational lifetime 20 years
Efficiency 90%
System tracking Two axis
Capital cost $4/W
Replacement cost $4/W
O&M cost per year $0.01/W
DG Sizes considered 1, 2, 3, 4 kW
Operational lifetime 25,000 h
Intercept coeff. 0.08 L/h/kW
Capital cost $0.66/W
Replacement cost $0.66/W
O&M cost $0.05/h
Inverter Sizes considered 0.5, 1, 1.5, 2 kW
Efficiency 90%
Operational lifetime 15 years
Capital cost $0.9/W
Replacement cost $0.9/W
O&M cost per year $0.01/W
Trojan L16Pbattery
Number of batteries 2, 4, 5, 6, 7, 8
Round trip efficiency 85%
Minimum state of charge 30%
Nominal voltage 6 V
Nominal current 360 Ah at 20 h
Nominal capacity 6 V × 360 Ah =2.16 kWh
Lifetime throughput 1,075 kWh
Max. charge rate 1 A/Ah
Max. charge current 18 A
Self-discharge rate 0.1% per hour
Min. operational lifetime 5 years
Capital cost $300
Replacement cost $300
O&M cost per year $10
Alsharif et al. EURASIP Journal on Wireless Communications and Networking (2015) 2015:64 Page 10 of 15
towards solar cells because of their high cost (approxi-mately $4/W). Table 4 shows that the initial capital costis fixed because the optimal system size is the same forall average daily solar radiation values studied. (ii) Theoperating cost is paid annually, and most of this costgoes towards operating and maintaining the DG. Table 4indicates that the operating cost decreases with increas-ing solar radiation at the same optimal size of the systemdue to the increase in the energy contribution from thesolar power system and the decrease in the energy con-tribution of the DG, which reduces the operating periodof the DG. The NPC represents all costs that occurwithin the project lifetime, including initial setup costs,component replacements within the project lifetime andmaintenance. More details will be provided in the nextsubsections.
9.2 Energy yield analysisFigure 8 summarises the annual energy contribution ofthe solar electric system and the DG at different averagedaily solar radiation values. Higher solar radiation ratesclearly correspond to higher annual energy contributionsof the solar power system for the same SPV size stemseries and less energy consumed by the generator. Thus,a higher solar radiation rate is desirable, as it decreasesthe maintenance and operational costs for the DG and theemission of polluting gases into the environment. Theannual energy contribution of the solar electric systemranged from 43% to 47% for an average daily solar radi-ation value ranging from 5.1 to 5.5 kWh\m2, respectively.The following statistical analysis discusses the energy
production based on an average daily solar radiation forMalaysia of 5.1 kWh/m2 as a case study based on theequations that are given in Section 6. However, this ana-lysis can be extended to other cases, yielding a slight dif-ference in daily peak solar hours per case depending onthe average daily solar radiation.The average annual energy consumption by LTE-
macro BS is 8,453 kWh, which is computed as an LTE-macro BS load of 965 W, as given in Table 2 × 24 h ×365 days/year. The annual energy contribution of thesolar system to the total energy production is 4,290kWh, which is computed based on Equation 1. SPVrated capacity is 2 kW × peak solar hours 5.1 h × SPVderating factor 0.9 × 365 days/year, which equals 3,351kWh. However, the tracking system plays a role in in-creasing the total amount of energy produced by a solarsystem by approximately 20% to 25%. The present simu-lation adopted a dual axis tracker which increased thetotal amount of energy by approximately 21.90% to be-come the annual energy contribution of the solar systemat 4,290 kWh. The DG covered the remaining portion ofthe energy by 5,573 kWh, which represents 57% of thetotal energy production.

Table 4 Summary of the technical and economic criteria for the optimal design of the hybrid SPV/DG system
Energy model Economic factors DG factors
Daily solar SPV DG Battery Inverter Initial Operating NPC Diesel DG
(kWh/m2) (kW) (kW) (unit) (kW) Capital ($/year) ($) (L) (h)
5.1 2 1 4 1.5 $11,210 1,993 40,188 1,880 6,091
5.2 2 1 4 1.5 $11,210 1,980 40,000 1,866 6,039
5.3 2 1 4 1.5 $11,210 1,968 39,820 1,854 5,999
5.4 2 1 4 1.5 $11,210 1,956 39,653 1,840 5,954
5.5 2 1 4 1.5 $11,210 1,946 39,497 1,830 5,923
Alsharif et al. EURASIP Journal on Wireless Communications and Networking (2015) 2015:64 Page 11 of 15
The total annual energy production of the hybrid sys-tem is 9,863 kWh (4,290 kWh of solar system + 5,573kWh of DG), while the total annual energy needed byLTE-macro BS is 8,453 kWh. The difference betweenelectrical production and consumption is equal to theexcess electricity of 888 kWh/year, plus the batterylosses of 112 kWh/year, plus inverter losses of 410 kWh/year.The maximum energy contribution of the solar power
system occurred in March and August. The averagemonthly energy contribution ranged from 510 to 564kWh, and the average monthly energy contribution ofthe DG ranged from 675 to 636 kWh at 5.1 and 5.5kWh/m2/day, respectively. Meanwhile, the minimum en-ergy contribution of the solar power system occurred inOctober and February. The average monthly energy con-tribution was 467 kWh at 5.1 kWh/m2/day and 564kWh at 5.5 kWh/m2/day. These results are attributed tothe differences in the average solar radiation rate, as thesecond part of the year (October to February) includesmore cloud cover and thus lower solar potential thanthe first part of the year (March to October).The number of batteries in a string size is four batter-
ies in parallel arrangement where the battery annualenergy-in is 770 kWh, while the annual energy-out is
Figure 8 Annual energy contribution of various sources for different
655 kWh, where the round-trip efficiency was 85%. Bat-teries can supply LTE-BS load autonomy for 6.27 h,which is computed based on Equation 5, (number of thebatteries is 4 × nominal voltage of a single battery 6 V ×nominal capacity of a single battery 360 Ah × 0.7 × 24)divided by (daily average LTE-BS load 23.2 kWh). How-ever, one battery can supply LTE-BS load autonomy1.57 h. The battery expected life is 6 years, based onEquation 6, number of the batteries 4 × battery lifetimethroughput 1,075 kWh divided by battery annual through-put (713 kWh). Moreover, the inverter annual energy-in is3,545 kWh, while the annual energy-out is 3,191 kWh,with 90% efficiency and 6,047 h/year operation.
9.3 Economic analysisThe following analysis discusses the cash flow based onan average daily solar radiation for Malaysia of 5.1 kWh/m2 as a case study, as shown in Figure 9. However, thisanalysis can be extended to other cases, yielding a slightdifference in operating cost per case depending on theenergy contribution of the solar power system, as ex-plained in the above subsections.The initial capital cost, paid once at the beginning of
the project, is directly proportional to the size of the sys-tem. From Table 4, the initial capital cost is fixed at
average solar radiation values.

Figure 9 Cash flow summary of the SPV/DG hybrid power system within the project lifetime for a solar radiation value of 5.1 kWh/m2/day.
Figure 10 Fuel cost vs. global solar radiation rate.
Alsharif et al. EURASIP Journal on Wireless Communications and Networking (2015) 2015:64 Page 12 of 15
$11,210 because the optimal design found by the HOMERsoftware for the hybrid power system is the same for alldaily solar radiation values studied. The breakdown of thiscost is as follows: (i) 71.4% for the SPV (size 2 kW× cost$4,000/1 kW= $8,000), (ii) 5.9% for the DG (size 1 kW×cost $660/1 kW= $660), (iii) 10.7% for the battery units(4 units × cost $300/unit = $1,200) and (iv) 12% forthe inverter (size 1.5 kW× cost $900/1 kW= $1,350). Inaddition, the charger controller costs $2,000, and the con-trol system cost depends on the system chosen. The SPVclearly represents the bulk of this cost.The annual cost for the maintenance and operation of
the system amounted to $1,707, as shown in Figure 9.Here, the DG represents the bulk of this cost ($1,621/year, including the fuel cost). A breakdown of this cost is$305 for DG maintenance per year based on a DG main-tenance cost of $0.05/h (as given in Table 3) × annualDG operating hours 6,091 h (as given in Table 4) and afuel cost of $1,316, equal to a total diesel consumptionof 1,880 L per year, as shown in Table 4 (computedbased on a specific fuel consumption of 0.388 L/kWh ×annual electrical production of the DG of 5,573 kWh/year at 5.1 kWh/m2/day, as given in Figure 8) multipliedby the diesel price of $0.7/L. Thus, lower DG energy con-sumption and increased reliance on the solar power sys-tem create more operational expenses and are achievedunder a higher solar radiation rate. Figure 10 highlights onthe annual diesel cost for each solar radiation rate.Regarding the other components, the batteries, SPV and
inverter cost $40/year, $20/year and $15/year, respectively.Generally, the bulk of the replacement cost goes to the
components with short operational lifetimes, which arethe DG (4 years) and batteries (expected 6 years). TheDG will be changed in years 5, 9, 13 and 17 at a cost of$660, while the batteries will be changed at a cost of$1,200 (4 units × $300/unit) in years 7 and 13. Moreover,the cost of replacing the inverter in year 15 is $1,350
(1.5 kW × $900/1 kW). The SPV array has a lifetime of20 years, which is the same as the project lifetime, soneither requires replacement. Thus, the total replace-ment cost during the project lifetime is $7,590.The economic analysis described above has been con-
ducted on the basis of the nominal system. However,Figure 11, below, shows the discount factor for each yearof the project lifetime based on Equation 9.The NPC of a system is the present value of all the
costs that it incurs over its lifetime, minus the presentvalue of all the revenue that it earns over its lifetime.Costs include capital costs, replacement costs, O&Mcosts and fuel costs. Revenues include salvage value. Thetotal NPC calculates by summing up the total discountedcash flows in each year of the project lifetime as follows: in-clude capital costs $11,210 + replacement costs $5,198 +O&M costs $5,680 + fuel costs $19,138 − salvage $1,038,equal $40,188 for solar radiation rate 5.1 kWh/m2.Figure 12 describes a comparison of the solar radiation rateand total NPC.The NPC clearly decreases with increasing solar radi-
ation at the same optimal size of the system due to theincrease in the energy contribution from the solar power
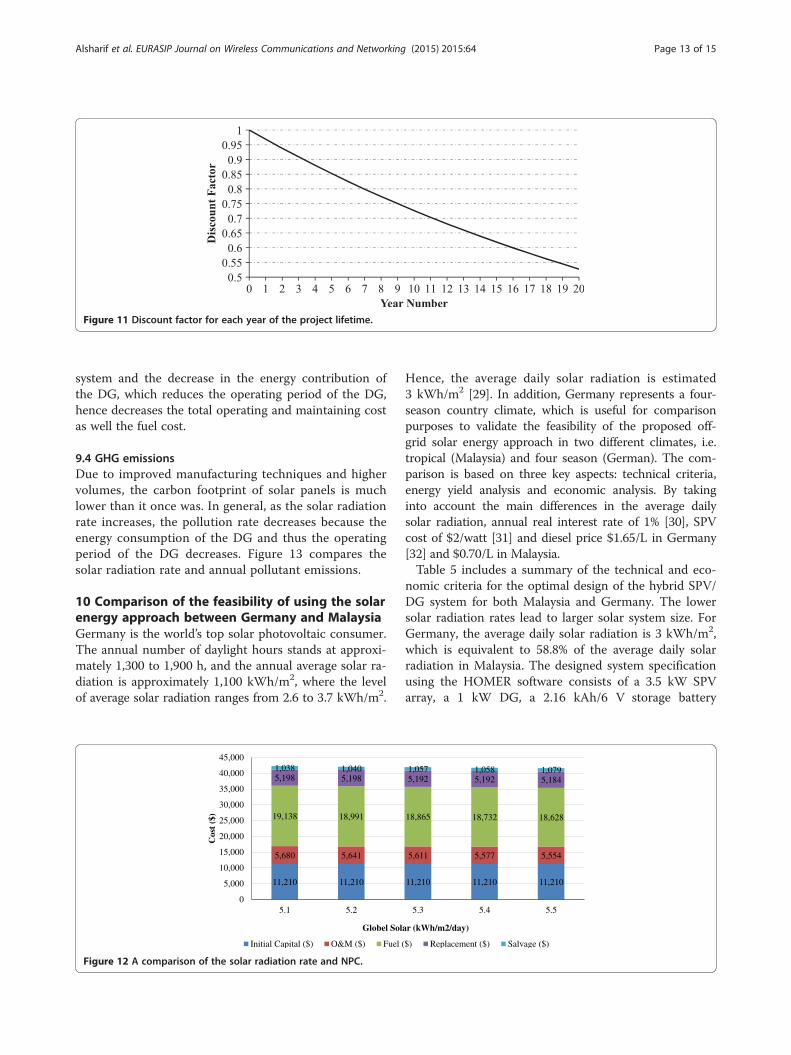
Figure 11 Discount factor for each year of the project lifetime.
Alsharif et al. EURASIP Journal on Wireless Communications and Networking (2015) 2015:64 Page 13 of 15
system and the decrease in the energy contribution ofthe DG, which reduces the operating period of the DG,hence decreases the total operating and maintaining costas well the fuel cost.
9.4 GHG emissionsDue to improved manufacturing techniques and highervolumes, the carbon footprint of solar panels is muchlower than it once was. In general, as the solar radiationrate increases, the pollution rate decreases because theenergy consumption of the DG and thus the operatingperiod of the DG decreases. Figure 13 compares thesolar radiation rate and annual pollutant emissions.
10 Comparison of the feasibility of using the solarenergy approach between Germany and MalaysiaGermany is the world’s top solar photovoltaic consumer.The annual number of daylight hours stands at approxi-mately 1,300 to 1,900 h, and the annual average solar ra-diation is approximately 1,100 kWh/m2, where the levelof average solar radiation ranges from 2.6 to 3.7 kWh/m2.
11,210 11,210
5,680 5,641
19,138 18,991
5,198 5,1981,038 1,040
0
5,000
10,000
15,000
20,000
25,000
30,000
35,000
40,000
45,000
5.1 5.2
Cos
t ($
)
Globel Sol
Initial Capital ($) O&M ($) Fuel (
Figure 12 A comparison of the solar radiation rate and NPC.
Hence, the average daily solar radiation is estimated3 kWh/m2 [29]. In addition, Germany represents a four-season country climate, which is useful for comparisonpurposes to validate the feasibility of the proposed off-grid solar energy approach in two different climates, i.e.tropical (Malaysia) and four season (German). The com-parison is based on three key aspects: technical criteria,energy yield analysis and economic analysis. By takinginto account the main differences in the average dailysolar radiation, annual real interest rate of 1% [30], SPVcost of $2/watt [31] and diesel price $1.65/L in Germany[32] and $0.70/L in Malaysia.Table 5 includes a summary of the technical and eco-
nomic criteria for the optimal design of the hybrid SPV/DG system for both Malaysia and Germany. The lowersolar radiation rates lead to larger solar system size. ForGermany, the average daily solar radiation is 3 kWh/m2,which is equivalent to 58.8% of the average daily solarradiation in Malaysia. The designed system specificationusing the HOMER software consists of a 3.5 kW SPVarray, a 1 kW DG, a 2.16 kAh/6 V storage battery
11,210 11,210 11,210
5,611 5,577 5,554
18,865 18,732 18,628
5,192 5,192 5,1841,057 1,058 1,079
5.3 5.4 5.5
ar (kWh/m2/day)
$) Replacement ($) Salvage ($)

Figure 13 Pollutant emissions vs. global solar radiation rate.Figure 14 The annual energy contribution of different energysources for Malaysia and Germany.
Alsharif et al. EURASIP Journal on Wireless Communications and Networking (2015) 2015:64 Page 14 of 15
(360 Ah × 6 units) and a 1.5 kW inverter for the sameLTE-BS load. Although the solar system size forGermany is larger than the solar system size for Malaysia(as shown in Table 5), the initial capital cost in Germanyis less than the initial capital cost in Malaysia becausethe price of solar system components is cheaper inGermany. However, the NPCGermany is higher thanNPCMalaysia, which is approximately doubled. Themain reason behind the doubling is the price of fuel, aswill be explained in the following paragraphs.Figure 14 summarises the annual energy contribution
of the solar electric system and the DG. The annual en-ergy contribution reached 43% (4,290 kWh) of the solarsystem based on the characteristics of Malaysia’s solarradiation exposure, and 57% (5,573) of the DG wherethe total annual energy production was 9,863 kWh.While, the annual energy contribution amounted to 42%(4,094 kWh) of the solar system based on the character-istics of Germany’s solar radiation exposure, and 58%(5,667 kWh) of the DG where the total annual energyproduction was 9,761 kWh.Figure 15 describes the comparison of all of the costs
that occur within the project lifetime for both Malaysiaand Germany. The initial capital cost is directly propor-tional to the size of the system. However, the initialcapital cost of the project in Germany is lower than inMalaysia because the price of the solar system com-ponents in Germany is lower than in Malaysia. The totalmaintenance and operation costs for Germany are higherthan for Malaysia because the size of the solar systemlarger than the Malaysian solar system leads to high oper-ating and maintenance costs. Replacement costs dependsignificantly on the discount factor which is given in
Table 5 Summary of the technical and economic criteria for t
Energy model
Daily solar SPV DG Battery Inverter
(kWh/m2) (kW) (kW) (unit) (kW)
5.1 (Malaysia) 2 1 4 1.5
3 (Germany) 3.5 1 6 1.5
Equation 9. If the real interest rate increases, the discountfactor will decrease, and the replacement cost will also de-crease. The real interest rate for Malaysia is 3.25% and forGermany is 1% for quarter 3 of 2014, so the discount ratefor Malaysia is higher than for Germany which is reflectedin the total replacement costs. The fuel cost representsthe bulk of the NPC, which amounted to 48% of the totalproject cost for Malaysia and 70% for Germany. Hence,NPCGermany is double the value of NPCMalaysia. NPCestimation in HOMER also considers the salvage cost(based on Equation 10), which is the residual value of thepower system components at the end of the projectlifetime.
11 ConclusionsThis study examined the feasibility of the integration ofa solar power system with a DG to supply power to re-mote BSs in off-grid sites of Malaysia to minimise boththe OPEX and carbon emissions. Three key aspects havebeen investigated: (i) energy yield analysis, (ii) economicanalysis and (iii) greenhouse gas emissions. When thesolar radiation rates increase, the energy produced fromthe solar power system will increase, which has the posi-tive effect of reducing the emission of polluting gasesand the operating cost of the system. In summary, thebulk of the initial cost of the system is the cost of theSPV due to its inherent high cost. Meanwhile, the bulkof the annual operating and maintenance costs go to theDG, and the bulk of the replacement cost goes to the DGand batteries. However, the average annual OPEX savingsof the hybrid system was 43% to 47% depending on thesolar radiation rate. Comparison between Malaysia and
he optimal design of the hybrid SPV/DG system
Economic factors DG factors
Initial Operating($/year)
NPC($)
Diesel DG
Capital (L) (h)
$11,210 1,993 40,188 1,880 6,091
$10,750 4,436 80,044 1,886 5,862

Figure 15 NPC comparison between Malaysia and Germany.
Alsharif et al. EURASIP Journal on Wireless Communications and Networking (2015) 2015:64 Page 15 of 15
Germany shows that Malaysia’s climatic conditions aredesirable for wide utilisation of the proposed off-gridhybrid system due to the high amount of solar radiationreceived throughout the year, in addition to lower projectcost in the long run.
Competing interestsThe authors declare that they have no competing interests.
AcknowledgementsThe authors would like to thank the Universiti Kebangsaan Malaysia for thefinancial support of this work, under the Grant Ref: ETP-2013-072.
Received: 9 September 2014 Accepted: 9 February 2015
References1. International Telecommunication Union (ITU) statistics database; available:
http://www.itu.int/en/ITU-D/Statistics/Pages/stat/default.aspx, accessed 26.Aug.2014.
2. K Kanzumba, JV Herman, Hybrid renewable power systems for mobiletelephony base stations in developing countries. Renew Energ. 51(2013),419–425 (2013)
3. C Tao, Y Yang, H Zhang, H Kim, K Horneman, Network energy savingtechnologies for green wireless access networks. IEEE Commun. Mag.18(5), 30–38 (2011)
4. MH Alsharif, R Nordin, M Ismail, Classification, recent advances and researchchallenges in energy efficient cellular networks. Wireless Pers. Commun.77(2), 1249–1269 (2014)
5. H Ziaul, H Boostanimehr, VK Bhargava, Green cellular networks: a survey,some research issues and challenges. IEEE Commun. Surv. Tut.13(4), 524–540 (2011)
6. P Subodh, DS Madhu, A Muna, SN Jagan, Technical and economicassessment of renewable energy sources for telecom application: a case studyof Nepal Telecom, in Proc of 5th International Conference on Power and EnergySystems (Nepal, Kathmandu, 2013). pp. 28–30
7. GeSI, Global e-sustainability initiative: SMART 2020: Enabling the low carboneconomy in the information age. (2008); available: http://www.smart2020.org/_assets/files/02_smart2020Report.pdf, accessed 12. Nov. 2014
8. S Rath, SM Ali, MN Iqbal, Strategic approach of hybrid solar-wind power forremote telecommunication sites in India. Int. J. Sci. Eng. Res. 3(6), 1–6 (2012)
9. P Nema, R Nema, S Rangnekar, Minimization of green house gases emissionby using hybrid energy system for telephony base station site application.Renew Sustain Energ. Rev. 14(6), 1635–1639 (2010)
10. AV Anayochukwu, EA Nnene, Simulation and optimization of hybrid dieselpower generation system for GSM base station site in Nigeria. Elec. J. Energ.Environ. 1(1), 37–56 (2013)
11. WA Imtiaz, K Hafeez, Stand alone PV system for remote cell site in SwatValley, in Proc of 1st Abasyn International Conference on Technology andBusiness Management, Pakistan, 2013
12. S Moury, MN Khandoker, SM Haider, Feasibility study of solar PV arrays ingrid connected cellular BTS sites, in Proc of 2012 International Conference on
Advances in Power Conversion and Energy Technologies (APCET), Mylavaram,Andhra Pradesh, 2012, pp. 1–5
13. M Martínez-Díaz, R Villafáfila-Robles, D Montesinos-Miracle, A Sudrià-Andreu,Study of optimization design criteria for stand-alone hybrid renewable powersystems, in Proc of International Conference on Renewable Energies and PowerQuality (ICREPQ’13), 2013
14. P Bajpai, N Prakshan, N Kishore, Renewable hybrid stand-alone telecom powersystem modeling and analysis, in Proc of IEEE TENCON Conference, 2009
15. VA Ani, AN Nzeako, Potentials of optimized hybrid system in poweringoff-grid macro base transmitter station site. Int. J. Renew Energ. Res.3(4), 861–871 (2013)
16. S Mekhilefa, A Safaria, WES Mustaffaa, R Saidurb, R Omara, MAA Younisc,Solar energy in Malaysia: current state and prospects. Renew Sustain Energ.Rev. 16(1), 386–396 (2012)
17. K Sopian, MY Othman, A Wirsat, The wind energy potential of Malaysia.Renew Energ. 6(8), 1005–1016 (1995)
18. H Borhanazada, S Mekhilefa, R Saidurb, G Boroumandjazib, Potentialapplication of renewable energy for rural electrification in Malaysia. RenewEnerg. 59(2013), 210–219 (2013)
19. H Borhanazada, S Mekhilefa, R Saidurb, VG Ganapathy, Long-term windspeed forecasting and general pattern recognition using neural networks.IEEE T. Sustain. Energ. 5(2), 546–553 (2014)
20. WA Azhari, K Sopian, A Zaharim, M Al Ghoul, A new approach for predictingsolar radiation in tropical environment using satellite images e case study ofMalaysia. WSEAS Trans. Environ. Dev. 4, 4 (2008)
21. T Khatib, A Mohamed, K Sopian, M Mahmoud, Solar energy prediction forMalaysia using artificial neural networks. Int. J. Photoenergy, vol. 2012,Article ID 419504, doi:10.1155/2012/419504, 1-16 (2012)
22. Green Power for Mobile, GSMA, Community Power Using Mobile to Extendthe Grid; Available: http://www.gsma.com/mobilefordevelopment/wp-content/uploads/2012/05/Community-Power-Using-Mobile-to-Extend-the-Grid-January-2010.pdf, accessed 18. Nov. 2014.
23. G Auer, O Blume, V Giannini, I Godor, MA Imran, Y Jading, E Katranaras, MOlsson, D Sabella, P Skillermark, W Wajda, Energy efficiency analysis of thereference systems, areas of improvements and target breakdown. EARTHproject report, Deliverable D2.3, 2010
24. G Schmitt, The green base station, in Proc. of 4th International Conference onTelecommunication - Energy Special Conference (TELESCON), 1–6, 2009
25. T Lambert, P Gilman, P Lilienthal, Micropower system modeling withHOMER (2006); available: http://homerenergy.com/documents/MicropowerSystemModelingWithHOMER.pdf, accessed 18. Nov. 2014.
26. Trojan Battery Company; available: http://www.trojanbattery.com/, accessed18. Nov. 2014.
27. S Rehman, LM Al-Hadhrami, Study of a solar PVedieselebattery hybrid powersystem for a remotely located population near Rafha, Saudi Arabia. Energ.35(12), 4986–4995 (2010)
28. Central Bank of Malaysia; available: http://www.bnm.gov.my/index.php?ch=statistic&pg=stats_convinterbkrates, accessed 28.Aug.2014.
29. International Energy Agency (IEA), Solar Energy Perspectives; availablehttp://www.iea.org/publications/freepublications/publication/solar_energy_perspectives2011.pdf, accessed 18. Nov. 2014.
30. Organization for Economic Co-operation and Development (OECD);available: http://stats.oecd.org/index.aspx?queryid=86, accessed 18.Nov. 2014.
31. International Renewable Energy Agency (IRENA), Renewable EnergyTechnologies: Cost Analysis Series; available: http://www.irena.org/DocumentDownloads/Publications/RE_Technologies_Cost_Analysis-SOLAR_PV.pdf, accessed 18. Nov. 2014.
32. Fuel prices europe information; available: http://www.fuel-prices-europe.info/, accessed 17. Nov. 2014.