energy policies of iea countries: slovak republic …...7.1 share of nuclear in electricity...
TRANSCRIPT
ENERGYPOLICIES OF IEACOUNTRIES
Slovak Republic2018 Review
Together
SecureSustainable

ENERGYPOLICIES OF IEACOUNTRIES
Slovak Republic2018 Review

INTERNATIONAL ENERGY AGENCY
The IEA examines the full spectrum of energy issues including oil, gas and coal supply and demand, renewable energy technologies, electricity markets, energy efficiency, access
to energy, demand side management and much more. Through its work, the IEA advocates policies that will enhance the reliability, affordability and sustainability of energy in its 30 member countries, 8 association countries and beyond.
The four main areas of IEA focus are:
n Energy Security: Promoting diversity, efficiency, flexibility and reliability for all fuelsand energy sources;
n Economic Development: Supporting free markets to foster economic growth andeliminate energy poverty;
n Environmental Awareness: Analysing policy options to offset the impactof energy production and use on the environment, especially for
tackling climate change and air pollution; and
n Engagement Worldwide: Working closely with associationand partner countries, especially major emerging
economies, to find solutions to shared energy and environmental
concerns.
IEA member countries:
Australia Austria
Belgium Canada
Czech RepublicDenmark
EstoniaFinland
FranceGermany
GreeceHungary
Ireland Italy
JapanKoreaLuxembourgMexicoNetherlandsNew Zealand NorwayPolandPortugalSlovak RepublicSpainSwedenSwitzerland
TurkeyUnited Kingdom
United States
The European Commission also participates in
the work of the IEA.
Please note that this publication is subject to specific restrictions that limit its use and distribution.
The terms and conditions are available online at www.iea.org/t&c/
© OECD/IEA, 2018
International Energy Agency Website: www.iea.org
Together
SecureSustainable

3
FOR
EW
OR
D
Foreword The International Energy Agency (IEA) has been conducting in-depth peer reviews of its member countries’ energy policies since 1976. This process not only supports energy policy development but also encourages exchange of and learning from international best practice and experiences. In short, by looking at what has worked – or not – in the “real world”, these reviews help to identify policies that achieve objectives and bring concrete results. Recently, the IEA has moved to modernise these reviews by focusing on some of the key energy challenges in today’s rapidly changing energy markets.
Since the 2012 in-depth review, the Slovak Republic has made significant progress on several fronts of energy policy. Energy security is a policy priority, and, together with its neighbours and with support from the European Union, this country has strengthened cross-border connections for electricity, natural gas and oil. This has served both to improve energy security and to increase competition on these markets. In addition, the energy intensity of the Slovak economy has declined, and the share of renewable energy in energy supply has increased. Energy-related carbon dioxide emissions have been reduced as well and can be decreased further, thanks to investments in nuclear energy.
This report also offers insights into the heating sector, which is the special focus area chosen by the Slovak government. This sector is critical to advance decarbonisation since fossil fuels currently dominate the energy sector. Investments are needed to modernise the heat networks and decarbonise heat generation, and the government is encouraged to design a new regulatory framework for the sector to advance its competitiveness.
It is my hope that this report will guide the Slovak Republic in its energy transition and support its contribution to a cleaner, more sustainable and secure global energy system.
Dr Fatih Birol
Executive Director
International Energy Agency
© O
EC
D/IE
A, 2
018

© O
EC
D/IE
A, 2
018

5
TAB
LE O
F C
ON
TEN
TS
ENERGY INSIGHTS
1. Executive summary and key recommendations .................................................... 11
Low-carbon electricity system is expanding .................................................................... 11
Oil and gas security has improved .................................................................................. 12
Energy efficiency offers further multiple benefits ............................................................ 13
Focus area: The heat sector ........................................................................................... 14
CO2 emissions from energy use need to be further limited ............................................. 15
Key recommendations .................................................................................................... 16
2. General energy policy .............................................................................................. 17
Country overview ............................................................................................................ 17
Supply and demand ........................................................................................................ 19
Institutions ....................................................................................................................... 23
Key strategies and policies ............................................................................................. 23
Energy taxes and subsidies ............................................................................................ 25
Assessment .................................................................................................................... 26
Recommendations .......................................................................................................... 28
ENERGY SECURITY
3. Oil ............................................................................................................................... 29
Overview ......................................................................................................................... 29
Supply and demand ........................................................................................................ 30
Infrastructure ................................................................................................................... 32
Industry and market structure ......................................................................................... 35
Prices and taxes ............................................................................................................. 36
Emergency response policy ............................................................................................ 37
Emergency stocks .......................................................................................................... 37
Assessment .................................................................................................................... 39
Recommendations .......................................................................................................... 41
© O
EC
D/IE
A, 2
018

TABLE OF CONTENTS
6
4. Natural gas ................................................................................................................ 43
Overview ......................................................................................................................... 43
Supply and demand ........................................................................................................ 44
Legal and regulatory framework ..................................................................................... 46
Infrastructure ................................................................................................................... 46
Market structure .............................................................................................................. 49
Prices and taxes ............................................................................................................. 51
Security of supply ........................................................................................................... 52
Assessment .................................................................................................................... 53
Recommendations .......................................................................................................... 54
5. Coal ............................................................................................................................ 57
Overview ......................................................................................................................... 57
Supply and demand ........................................................................................................ 58
Domestic coal mining policy ............................................................................................ 60
Assessment .................................................................................................................... 61
Recommendations .......................................................................................................... 61
6. Electricity ................................................................................................................... 63
Overview ......................................................................................................................... 63
Supply and demand ........................................................................................................ 64
Legal and regulatory framework ..................................................................................... 67
Electricity system – participants, infrastructure and operations ...................................... 68
Prices and taxes ............................................................................................................. 73
Security of supply ........................................................................................................... 75
Assessment .................................................................................................................... 76
Recommendations .......................................................................................................... 78
7. Nuclear energy .......................................................................................................... 81
Overview ......................................................................................................................... 81
Policy developments ....................................................................................................... 83
Institutional and organisational structure......................................................................... 83
© O
EC
D/IE
A, 2
018

TABLE OF CONTENTS
7
TAB
LE O
F C
ON
TEN
TS Nuclear energy fuel cycle and RAW management ......................................................... 84
Safety .............................................................................................................................. 85
Assessment .................................................................................................................... 85
Recommendations .......................................................................................................... 87
ENERGY SYSTEM TRANSFORMATION
8. Energy and climate change ..................................................................................... 89
Overview ......................................................................................................................... 89
Energy-related CO2 emissions ........................................................................................ 90
Institutions ....................................................................................................................... 94
Climate change policies and measures .......................................................................... 94
Climate change adaptation ............................................................................................. 99
Air quality ........................................................................................................................ 99
Assessment .................................................................................................................. 100
Recommendations ........................................................................................................ 101
9. Energy efficiency .................................................................................................... 103
Overview ....................................................................................................................... 103
Energy consumption by sector ...................................................................................... 104
Regulation and institutions ............................................................................................ 109
Energy efficiency targets ............................................................................................... 110
Energy efficiency policies .............................................................................................. 112
Assessment .................................................................................................................. 116
Recommendations ........................................................................................................ 118
10. Renewable energy ................................................................................................ 119
Overview ....................................................................................................................... 119
Supply and demand ...................................................................................................... 120
Institutions ..................................................................................................................... 124
Policies and measures .................................................................................................. 124
Assessment .................................................................................................................. 130
© O
EC
D/IE
A, 2
018

TABLE OF CONTENTS
8
Recommendations ........................................................................................................ 132
11. Focus area: Heat and district heating ................................................................. 133
Overview of the heating sector ..................................................................................... 133
DH supply and demand ................................................................................................ 135
DH markets and infrastructure ...................................................................................... 137
DH regulation ................................................................................................................ 139
Assessment .................................................................................................................. 144
Recommendations ........................................................................................................ 146
12. Energy technology research, development and demonstration....................... 149
Overview ....................................................................................................................... 149
Institutions ..................................................................................................................... 150
Funding ......................................................................................................................... 151
Monitoring and evaluation ............................................................................................. 153
International collaboration ............................................................................................. 153
Assessment .................................................................................................................. 154
Recommendations ........................................................................................................ 155
ANNEXES
ANNEX A: Organisations visited ................................................................................... 157
ANNEX B: Energy balances and key statistical data .................................................... 159
Footnotes to energy balances and key statistical data ................................................. 162
ANNEX C: International Energy Agency “Shared Goals” .............................................. 163
ANNEX D: Glossary and list of abbreviations ............................................................... 165
LIST OF FIGURES, TABLES AND BOXES
Figures
2.1 Map of the Slovak Republic ...................................................................................... 18 2.2 Overview of energy production, TPES and TFC by fuel and sector, 2017 ................ 19 2.3 TPES by source, 1973-2017 ..................................................................................... 20 2.4 Breakdown of TPES in IEA member countries, 2016................................................ 20 2.5 Energy production by source, 1973-2017 ................................................................. 21
© O
EC
D/IE
A, 2
018
TABLE OF CONTENTS
9
TAB
LE O
F C
ON
TEN
TS 2.6 Energy self-sufficiency, 1973-2017 ........................................................................... 21
2.7 TFC by sector, 1973-2016 ........................................................................................ 22 2.8 TFC by source and sector, 2016 ............................................................................... 22 2.9 Revenues from energy product taxation, 2000-16 (EUR 1 000) ............................... 25 2.10 Development of implicit tax on energy products, 2000-15 ...................................... 25 3.1 Share of oil in different energy supplies, 1977-2017 ................................................. 29 3.2 Crude oil supply by source, 1973-2017 ..................................................................... 30 3.3 Oil products supply by source, 1973-2017 ................................................................ 30 3.4 Oil products net exports, 2007-17 ............................................................................. 31 3.5 Oil supply (TPES) by consuming sector, 1973-2016................................................. 31 3.6 Oil supply (TPES) by product, 2017 .......................................................................... 32 3.7 Map of oil infrastructure, 2017 .................................................................................. 34 3.8 Fuel prices in IEA member countries, fourth quarter 2017 ........................................ 36 4.1 Share of natural gas in different energy supplies, 1977-2017 ................................... 43 4.2 Natural gas supply by source, 1973-2017 ................................................................. 44 4.3 Natural gas supply (TPES) by consuming sector, 1974-2016 ................................... 45 4.4 Map of natural gas infrastructure, 2017 .................................................................... 48 4.5 Natural gas prices in IEA member countries, 2017 ................................................... 51 4.6 Natural gas price trends in selected IEA member countries, 1990-2017 .................. 52 5.1 Share of coal in different energy supplies, 1976-2016 .............................................. 57 5.2 Coal supply by source, 1973-2017 ........................................................................... 58 5.3 Hard coal imports by country, 1995-2017 ................................................................. 58 5.4 Coal supply (TPES) by consuming sector, 1973-2016.............................................. 59 6.1 Electricity generation by source and consumption by sector in 2017 ........................ 63 6.2 Electricity generation by source, 1973-2017 ............................................................. 64 6.3 Electricity generation by source in IEA member countries, 2017 .............................. 65 6.4 The Slovak Republic’s electricity trade by country, 1990-2017 ................................. 66 6.5 Electricity consumption by sector, 1974-2016 ........................................................... 67 6.6 Map of electricity infrastructure, 2017 ....................................................................... 71 6.7 Industry electricity prices in IEA member countries, 2017 ......................................... 74 6.8 Household electricity prices in IEA member countries, 2017 .................................... 74 6.9 Electricity price trends in selected IEA member countries, 1985-2017 ..................... 74 7.1 Share of nuclear in electricity generation in IEA member countries, 2016 ................ 81 7.2 Nuclear power generation and share in electricity generation, 1973-2017 ............... 83 8.1 GHG emissions by sector, 1990 and 2016 ............................................................... 90 8.2 GHG emissions by gas, 1990 and 2016 ................................................................... 90 8.3 Energy-related CO₂ emissions by sector, 1973-2016 ............................................... 91 8.4 Energy-related CO₂ emissions by fuel type, 1973-2016 ........................................... 91 8.5 Energy-related CO2 emissions and main drivers, 1990-2016 ................................... 92 8.6 Energy-related CO2 emissions per unit of GDP in IEA member countries, 2016 ...... 93 8.7 Energy-related CO₂ emissions per unit of GDP in the Slovak Republic and in
other selected IEA member countries, 1973-2016 ................................................... 93 8.8 Carbon intensity of power and heat generation in the Slovak Republic and in
other selected IEA member countries, 1973-2016 ................................................... 93 9.1 Energy demand and drivers, 1990-2016 ................................................................. 103 9.2 Energy intensity in IEA member countries, 2015 .................................................... 104 9.3 Energy intensity in selected IEA member countries, 1974-2016 ............................. 105 9.4 TFC in industry by source, 1973-2016 .................................................................... 105 9.5 Energy consumption in manufacturing industry sectors, 2016 ................................ 106 9.6 TFC in residential and commercial sectors by source, 1973-2016 ......................... 106
© O
EC
D/IE
A, 2
018

TABLE OF CONTENTS
10
9.7 Residential energy intensity, 2000 and 2016 .......................................................... 107 9.8 Share of residential buildings and U-value of the buildings by age, 2014 ............... 107 9.9 TFC in transport by source, 1973-2016 .................................................................. 108 9.10 Cars per capita in selected IEA member countries, 1990-2015 ............................ 109 9.11 Final energy savings by sector and targets 2014-20............................................. 112 10.1 Share of renewable energy in TPES, electricity and TFC, 1976-2016 .................. 120 10.2 Renewable energy and waste in TPES, 1973-2017 ............................................. 120 10.3 Renewable energy and waste in TPES in IEA member countries, 2017 ............... 121 10.4 Biofuels and waste supply and consumption by source, 2016 .............................. 121 10.5 Renewable energy and waste in electricity generation, 1973-2017 ...................... 122 10.6 Renewable energy in power generation in IEA member countries, 2017 .............. 122 11.1 Heat consumption and projection for buildings by heat source, 2010-25 .............. 134 11.2 DH generation by fuel, 2010-14 ............................................................................ 135 11.3 Regulation models for DH networks ...................................................................... 140 12.1 Government energy RD&D spending by category, 2009-16 ................................. 152 12.2 Government energy RD&D spending as a ratio of GDP in IEA member
countries, 2016 ...................................................................................................... 153 Tables
4.1 Projected Slovak Republic natural gas production, 2017-24 ..................................... 44 4.2 Cross-border gas connections, 2017 ........................................................................ 47 4.3 Gas storage facilities, 2017 ....................................................................................... 47 4.4 Switching rates for natural gas customers, 2013-16 ................................................. 50 6.1 Installed electricity-generating capacity, 1995-2016 (MW) ........................................ 66 6.2 Forecast maximum cross-border capacity for 2018 (MW) ........................................ 70 6.3 The largest electricity suppliers by consumer category and market share, 2016 ...... 72 6.4 Electricity supplier switching rate, 2012-16 ............................................................... 75 7.1 NPPs in the Slovak Republic .................................................................................... 82 8.1 The Slovak Republic revenue from auctions, 2012-16 (EUR) ................................... 96 8.2 Slovak Republic annual emissions allocation for 2013-20 (MtCO2-eq) ..................... 97 8.3 Progress towards ESD emissions based on projections ........................................... 97 9.1 National energy consumption targets for 2020 and 2014-16 performance ............. 111 9.2 Energy savings in public buildings .......................................................................... 112 9.3 Energy savings from energy services (TJ) .............................................................. 115 10.1 National targets for renewable energy by sector, 2005 to 2020 ............................ 125 10.2 Progress with meeting the national targets for RES, 2004-15 .............................. 125 10.3 Overview of financial support schemes to promote renewable energy by
sector, 2017 ........................................................................................................... 126 10.4. FiT rates for new installations, 2017 .................................................................... 127 10.5 National targets for biofuels in transport and progress towards them ................... 130 11.1 DH distribution network parameters ...................................................................... 138 11.2 Investment programmes in the heating sector (euro million) ................................ 139 11.3 Investments in the heating sector, 2014-16 .......................................................... 139 11.4 Summary assessment of DH price regulation models .......................................... 143 Boxes
8.1 The EU Emissions Trading System .......................................................................... 96 11.1 4GDH and integrating heat and electricity systems .............................................. 140 11.2 Price cap models for DH ....................................................................................... 143
© O
EC
D/IE
A, 2
018
11
EN
ER
GY
INS
IGH
TS
1. Executive summary and key recommendations Since the 2012 in-depth review, the Slovak Republic has made significant progress on several fronts of energy policy. Together with its neighbours, the Slovak Republic has strengthened cross-border connections for electricity, natural gas and oil. This has served both to improve energy security and increase market competition.
The government has also set targets for energy efficiency and renewable energy, and the latter go beyond the country’s European Union (EU) targets. The International Energy Agency (IEA) congratulates the government for making clear progress to meet these targets. Energy efficiency is improving, the share of renewable energy is increasing, and energy-related carbon dioxide (CO2) emissions are declining. At the same time, the IEA encourages the government to continue in this direction and to do more to ensure the security of supply, economic efficiency and environmental sustainability in its energy policy. Targets and objectives to this end could be in included in a revision of the country’s 2014 Energy Policy.
Low-carbon electricity system is expanding The Slovak electricity system is being enhanced and modernised through investments and upgrades at generation and transmission levels. The country’s electricity generation is dominated by low-carbon sources and baseload is largely met by nuclear power and hydropower. The share of renewable energy has increased and, after the commissioning of two 470-megawatt (MW) nuclear units at the Mochovce plant in 2018-19, more than 80% of the Slovak Republic’s electricity generation will be low carbon.
At the transmission level, the Slovak electricity transmission system operator SEPS (Slovenska Elektrizacna Prenosova Sustava) has been upgrading the system to the 400-kilovolt (kV) level and improving the operation of the networks through investments in technology to meet the requirements of generation and consumption capacities. The Slovak Republic has ample cross-border capacity, which amounts to more than 40% of the country’s generating capacity. The completion of the three planned interconnections with Hungary will further strengthen cross-border trading and alleviate congestion.
In another positive development, market coupling in the central Eastern European region has continued to advance and, since late 2014, the joint wholesale market area of the Slovak Republic, the Czech Republic and Hungary now includes Romania.
At the distribution level, in 2013 the system operators stopped accepting requests for distribution grid connection of any kind of generating capacity of more than 10 kilowatts because of concerns over grid stability and security of supply. This regulatory measure
© O
EC
D/IE
A, 2
018

1. EXECUTIVE SUMMARY AND KEY RECOMMENDATIONS
12
still applies. The distribution system operators (DSOs) and other stakeholders need to solve these issues given that variable renewable technologies are becoming more cost-competitive without subsidies and in the future could offer the Slovak Republic a low-carbon way to diversify its electricity supply further.
Following a cost-benefit analysis, the three main DSOs have embarked on a programme to deploy more than 400 000 smart meters to at least 80% of those consumers with an annual consumption in excess of 4 megawatt-hours. This is a welcome initiative, and eventually the use of smart meters and related technology should be expanded to bring benefits to all electricity suppliers and end users.
A challenge in this respect is that electricity prices for all households and many small and medium-sized companies are capped under price regulation. This also limits retail market competition and discourages energy-efficient behaviour and investment in the electricity sector at large. A similar price regulation also applies to natural gas. The regulator should develop a clear and transparent price-setting programme to eliminate this system of determined end-user prices. Vulnerable customers and less well-off households should be protected through social policy rather than energy policy, in accordance with the new Directive of the European Parliament and of the Council on common rules for the internal market in electricity.
The proposal to construct a new nuclear power plant (NPP) at Jaslovské Bohunice (1 200 MW) would, if proceeded with, further increase the security of supply and the share of low-carbon power supply after 2025. The possible new NPP would be of a new design, and so the nuclear safety regulator would need to equip itself to evaluate and license it. These regulatory activities are likely to occur simultaneously with life-extension activities at the Bohunice units. The regulator should ensure that it has sufficient staff as well as in-house expertise to regulate and license both the new reactor design and the life-extension activities.
Regarding nuclear waste, the Slovak Republic should identify a final spent fuel disposal solution and determine whether the current and projected payments into the nuclear waste fund (the National Nuclear Fund) will be sufficient for the chosen solution.
Oil and gas security has improved The Slovak Republic depends on imports for practically all of its crude oil and natural gas supply. Traditionally, these imports have come from a single supplier, the Russian Federation (hereafter, “Russia”). Energy security has thus been an overarching concern and a priority for the Slovak Republic’s energy policy. The results have been positive, and, in recent years, the country has succeeded in diversifying sources and routes for these imports.
As to gas, the Slovak Republic has made large investments in the cross-border infrastructure, which includes the reverse flow from the Czech Republic and Austria, the bidirectional reverse flow to Ukraine and an interconnection between the Slovak Republic and Hungary. An interconnection with Poland is under construction, and the feasibility of the Eastring project is being studied. Once constructed, the Eastring project and the Slovak Republic–Poland interconnector would give the
© O
EC
D/IE
A, 2
018

1. EXECUTIVE SUMMARY AND KEY RECOMMENDATIONS
13
EN
ER
GY
INS
IGH
TS Slovak Republic access to liquefied natural gas imports from Poland and Croatia and
connect the North-South corridor with south-eastern Europe.
The security of gas supply is also addressed through a stockholding policy based on the experience of the 2009 gas crisis. Natural gas suppliers must hold gas stocks in underground storages for emergencies or for contractually secure supplies. At most, 50% of the volume may be secured by using cross-border storage capacity.
The Slovak Republic remains a large and reliable transit country for Russian gas to other EU countries. However, the annual gas transit has fallen from 80 billion cubic metres (bcm) to around 60 bcm as a result of the commissioning of the Nord Stream 1 pipeline.
As to oil, the Slovak Republic’s high dependency on Russian crude oil imports is well understood, and the government has been proactive in addressing the issue. The country has a well-developed oil security policy and government-controlled emergency stocks are typically well above the levels required under IEA membership. However, the government has not had to use these stocks and the release mechanism has not been tested. It may be prudent to test the release process at some point to ensure the administration is properly prepared in case of an oil supply disruption.
The Slovak Republic has also been active and successful in finding alternative routes to supply its crude oil needs. In particular, the Adria oil pipeline, which originates in Croatia, was upgraded in 2015 and can now carry 6 million tonnes per year, enough to cover the entire needs of the country’s sole refinery.
Energy efficiency offers further multiple benefits The Slovak Republic’s energy intensity has continued to decline quickly. From a high level, it is one of the leading nations in energy intensity reduction over the past 20 years. This is because of the significant improvements in energy efficiency in industry and buildings, as well as economic restructuring. Although many of the easy efficiency measures have been implemented, plenty of potential remains, and the country needs not be limited by its EU targets when setting future targets and policies.
In recent years, home renovation has seen the most notable progress in energy efficiency. Around 60% of flats have been insulated and their energy efficiency and appearance improved. At the current levels of renovation, all blocks of flats in the country will be insulated by 2030. Making such a positive intervention in people’s lives can also shape public opinion on energy transformation and climate change. As the efficiency improvements also reduce the energy bill, they could act as a trigger to deregulate end-user prices.
The government has strongly improved data gathering through the Energy Efficiency Monitoring System. This is very positive, and the government should continue its efforts to collect and analyse data, and use the data as a basis for policy design.
Lack of funding has often challenged the implementation of energy efficiency projects. Positively, the 2014 Energy Efficiency Act strengthened the regulatory framework for and increases the credibility of the energy service sector, which holds a great potential to attract private capital.
© O
EC
D/IE
A, 2
018

1. EXECUTIVE SUMMARY AND KEY RECOMMENDATIONS
14
The government should continue to support a growing energy service market and further remove investment barriers. High investment costs that discourage energy efficiency measures can be addressed by continued support via grants and loans, funded through the state budget or the EU structural and investment funds. However, the issue of competition between public funding and private energy service providers should also be addressed. To avoid conflicts and unfair competition that discourage market development, further co-ordination between the support policy and market forces is required.
Focus area: The heat sector The Slovak Republic has significantly increased the share of renewable energy in heat supply, and the sector has further potential for decarbonisation. The heating sector in general and district heating (DH), in particular, are essential for the energy transformation in the country. Natural gas is the dominant fuel in both individual heating and in DH, and together with coal it accounts for 60% of the total DH production. However, biomass has more than doubled in DH over the past four years and replaced fossil fuels, which has improved both sustainability and security of the heat supply.
Biomass use for heat has been the focus of the government’s renewable energy policy. The country has extensive forests, and biomass is thus a significant domestic low-carbon energy resource. In contrast, the cost-effective potential for renewable electricity seems more limited at the moment and the country’s power mix is already 80% low carbon, high by international comparison. The focus on heat in renewable energy policy is also driven by the sensible desire to minimise costs while applying an integrated approach to utilise renewable energy sources and decrease greenhouse gas (GHG) emissions. Also, biomass use is not subsidised. A point of critical importance, the government should ensure that biomass is grown and sourced in an environmentally sustainable manner.
The country has an extensive DH infrastructure, but investments are needed to modernise it. Investment, however, is challenged by the decline in demand for heat, paradoxically thanks to the successful building renovations, and by an uneven competition with natural gas, the price of which is capped for households and small businesses.
The current cost-based price regulatory model offers DH suppliers only weak incentives to improve the cost-effectiveness in the systems. Based on international best practice, the Slovak Republic should create a new regulatory model that incentivises efficiency improvements and allows more market flexibility to encourage long-term investments. The government can start by investigating the design of a possible benchmarking system and adopting efficiency requirements within the current regulatory framework.
For DH to remain relevant, DH market development must go hand-in-hand with further improvements to energy efficiency and increased utilisation of sustainable energy sources. In some places, DH might be replaced by heat pumps, whereas in other areas DH networks can continue to grow and be modernised, supplied by a range of low-carbon heat sources. This development should follow from market-based business decisions under a more flexible regulatory framework. Finally, energy policy and regulation must be aligned across energy sectors for DH to compete with other heating alternatives on fair market terms. Unlike gas and electricity consumption, DH prices can
© O
EC
D/IE
A, 2
018

1. EXECUTIVE SUMMARY AND KEY RECOMMENDATIONS
15
EN
ER
GY
INS
IGH
TS vary significantly across systems. With the regulated fixed tariff for natural gas, more
customers will probably want to switch from DH to individual gas heating. The government needs to take a broad perspective on energy market regulation and co-ordinate between the sectors.
CO2 emissions from energy use need to be further limited Since the early 1990s, GHG emissions in the Slovak Republic have declined sharply. The country’s economy remains relatively carbon-intensive, partly because of the large heavy industry. As large industrial emitters and power and heat plants fall under the EU Emissions Trading System (ETS), the government focuses its efforts to reduce emissions in the sectors outside the EU ETS.
In the non-ETS sectors, GHG emissions decreased by 23% from 2005 to 2015 and, with the existing measures, are expected to remain at that level to 2020. For 2030, the country’s non-ETS target under the European Union is 12% below the 2005 level, that is, non-ETS emissions would be allowed to increase by 14% from the anticipated 2020 levels. These EU-level targets appear to lack ambition and may not serve the country to trigger progress towards the 2050 long-term decarbonisation goals. The IEA encourages the Slovak Republic to set more ambitious national targets and continue to reap multiple benefits from reducing energy-related CO2 emissions. Energy research, development and innovation should be encouraged as a long-term tool to this end.
In recent years, the government has worked hard to support renewable energy, mostly for heat, and energy efficiency. All this has helped to limit energy-related CO2 emissions. As the government will start to design policies and measures to increase the share of renewables in gross final consumption of energy to 2030, it should assess the comparative cost-effectiveness of renewable and efficiency policies to meet the targets (2030 and beyond) in an optimal way.
Energy taxes can and should help implement policy. The current tax system in the Slovak Republic is characterised by a high number of exemptions. Although there is precedent for the use of energy policy for social ends, the current tax and subsidy system does not provide the right incentives and deterrents to progress energy and climate change policies. The government is re-evaluating the system of exemptions and is communicating about this with the European Commission.
The transport sector is of particular importance because its emissions are projected to increase as the country grows richer and private car ownership becomes more common. Encouragingly, a strategy of transport development was approved in 2017, which targeted fleet renewal, alternative fuels, multimodal transport, air quality and modernisation of the tram and railway tracks.
More ambitious policies and measures should be introduced to limit emissions. For example, a bonus-malus system could be adopted to favour purchases of low-emission vehicles through fees on high-emission cars. Private car traffic in urban areas could also be limited through congestion charges, car sharing and prioritising public transport, cycling and walking. Measures for environmentally sustainable freight transport should be considered as well. The measures could provide multiple benefits, such as better air
© O
EC
D/IE
A, 2
018

1. EXECUTIVE SUMMARY AND KEY RECOMMENDATIONS
16
quality (air pollution is a major concern in the country), lower noise and increased road safety, in addition to the reduced climate impact. The country’s significant car manufacturing industry should see this as a business opportunity.
The government should also reconsider the policy to support domestic coal production financially. The subsidy costs electricity users around EUR 100 million a year, or around EUR 14 000 per employee in coal mining and related services. As practically all domestic coal is used for power generation, it is therefore part of the electricity security equation and its future should be considered in this context. The coal subsidy adds an unjustifiable and discriminatory component to electricity bills, and does not align with national decarbonisation goals. To the extent that domestic coal is needed for the security of supply, this concern will be alleviated as soon as the first 470 MW nuclear unit, planned for completion in 2018-19, comes on line.
Key recommendations The government of the Slovak Republic should:
Update the 2014 Energy Policy and incorporate ambitious targets and objectives for 2030 and beyond on energy security, energy-related CO2 emissions and energy market functioning.
Continue the progress in decarbonising the heating sector by introducing a new regulatory framework to enhance flexibility in DH systems and create a long-term stable environment for investments.
Develop a clear and transparent programme to eliminate the administratively determined end-user prices of electricity and natural gas for the new regulatory period that begins in 2022.
Take further measures to limit energy-related CO2 emissions, in particular in the transport sector.
© O
EC
D/IE
A, 2
018

17
EN
ER
GY
INS
IGH
TS
2. General energy policy
Key data (2017 provisional)
TPES: 17.0 Mtoe (nuclear 23.6%, natural gas 22.9%, oil 21.8%, coal 19.6%, biofuels and waste 8.0%, hydro 2.3%, electricity imports 1.5%, solar energy 0.3%), -4.8% since 2007
TPES per capita: 3.0 toe (IEA average: 4.1 toe)
TPES per unit of GDP: 104 toe/USD million PPP (IEA average: 106 toe)
Energy production: 6.7 Mtoe (nuclear 60.1%, biofuels and waste 20.4%, coal 6.7%, hydropower 5.8%, oil 4.6%, natural gas 1.3%, solar energy 0.8%), +11.7% since 2007
Exchange rate: euro: EUR 1 = USD 1.12 (2017)
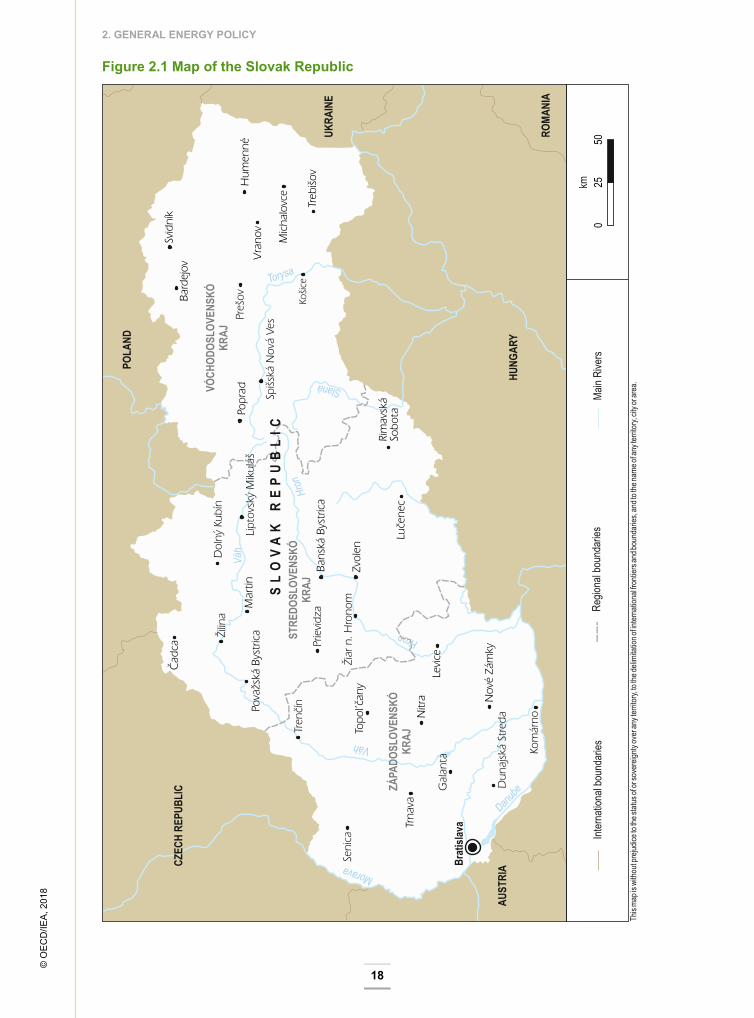
Country overview The Slovak Republic was formed on 1 January 1993 after the break-up of the former Czechoslovakia.1 It is a landlocked country in central Eastern Europe, and its territory of around 49 000 square kilometres is largely rugged and mountainous. Agricultural land and forests both cover two-fifths of the area. The population of 5.4 million is relatively evenly distributed across the country and around 45% of the people live in rural areas. Slovaks account for around 80% of the population. The two main minority groups are Hungarians and Roma.
The Slovak economy’s output has more than doubled since 1993 in purchasing power parity terms and is expected to continue to grow fast, at more than 4% per year in 2018 and 2019. In 2017, the per capita gross domestic product (GDP) at market prices was USD 32 100. The Organisation for Economic Co‐operation and Development (OECD) also expects unemployment to fall below 7% in 2019. The Slovak Republic has an open economy; imports and exports equal 180% of GDP (OECD, 2018). The main export articles include cars, car parts, machinery, consumer electronics, metals and metal products.
The Slovak Republic is a parliamentary democracy. The unicameral National Council has 150 seats and, since the last elections in March 2016, includes representatives from eight parties. The coalition government is headed by Prime Minister Peter Pellegrini from the Smer-SD party. The next elections are scheduled for March 2020. The country’s president is Andrej Kiska, and the next presidential elections are scheduled for 2019. 1 In this report, country energy data prior to 1993 correspond to energy supply and demand in those regions of Czechoslovakia that form today’s Slovak Republic.
© O
EC
D/IE
A, 2
018
2. GENERAL ENERGY POLICY
18
Figure 2.1 Map of the Slovak Republic
© O
EC
D/IE
A, 2
018

2. GENERAL ENERGY POLICY
19
EN
ER
GY
INS
IGH
TS The Slovak Republic joined the OECD in 2000 and the International Energy Agency
(IEA) in 2007. It is a member of the European Union (since May 2004) and it adopted the euro (EUR) as its currency in January 2009.
Supply and demand The Slovak Republic’s energy system is characterised by a high share of nuclear power, which accounts for 60% of domestic energy production and the largest part of the total primary energy supply (TPES)2 (Figure 2.2). Domestic nuclear energy production helps improve energy security in the Slovak Republic, which otherwise is dependent on large fossil fuel imports, mainly from the Russian Federation (hereafter “Russia”).
The country has a large industrial sector, which accounts for over 40% of the total final consumption (TFC).3 Natural gas, oil and electricity are the main energy sources, which account for three-quarters of TFC. Natural gas and electricity are consumed across most sectors, with the largest demand in industry, whereas oil dominates in the transport sector. The Slovak Republic also has an extensive district heating (DH) system, fuelled mainly with natural gas and, increasingly, biofuels.
Figure 2.2 Overview of energy production, TPES and TFC by fuel and sector, 2017
*Consumption data by fuel and sector are for 2016. **Other renewables includes hydro, solar, wind and geothermal. Note: 2017 data are provisional. Source: IEA (2018), World Energy Balances 2018, www.iea.org/statistics/.
Primary energy supply TPES has varied around 15-20 million tonnes of oil equivalent (Mtoe) over nearly half a century. In the past decade, TPES has trended slowly lower, from 18.6 Mtoe in 2006 to 16.5 Mtoe in 2016 (Figure 2.3). Nuclear power production began in the late 1970s and grew rapidly in the mid-1980s and early 2000s as new power plants were introduced. Over the past decade, nuclear energy has decreased slightly as a result of the 2 TPES is made up of production + imports - exports - international marine and aviation bunkers ± stock changes. This equals the total supply of energy that is consumed domestically, either in transformation (e.g. power generation and refining) or in final use. 3 TFC is the final consumption of energy (electricity, heat and fuels, such as natural gas and oil products) by end users, but does not include the transformation sector (e.g. power generation and refining).
0
4
8
12
16
20
Production TPES TFC (by fuel)* TFC (by sector)*
MtoeHeatElectricityOther renewables**Biofuels and wasteNuclearNatural gasOilCoal
ImportsTransformation and losses
Residential
Transport
Industry
Commercial
© O
EC
D/IE
A, 2
018
2. GENERAL ENERGY POLICY
20
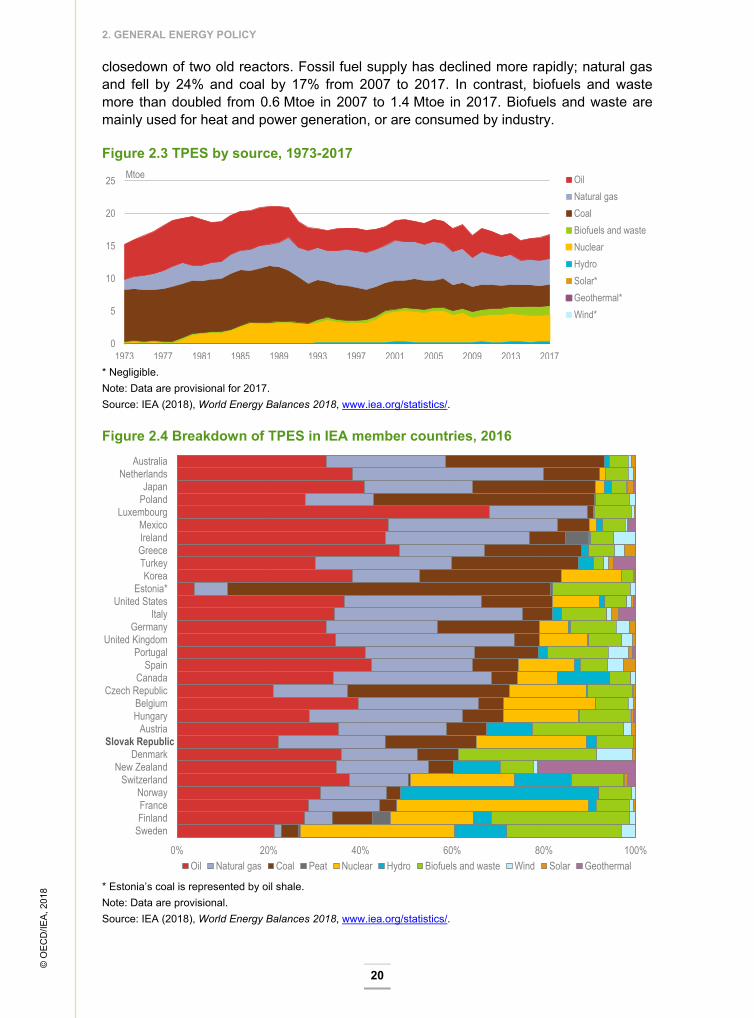
closedown of two old reactors. Fossil fuel supply has declined more rapidly; natural gas and fell by 24% and coal by 17% from 2007 to 2017. In contrast, biofuels and waste more than doubled from 0.6 Mtoe in 2007 to 1.4 Mtoe in 2017. Biofuels and waste are mainly used for heat and power generation, or are consumed by industry.
Figure 2.3 TPES by source, 1973-2017
* Negligible. Note: Data are provisional for 2017. Source: IEA (2018), World Energy Balances 2018, www.iea.org/statistics/.
Figure 2.4 Breakdown of TPES in IEA member countries, 2016
* Estonia’s coal is represented by oil shale. Note: Data are provisional. Source: IEA (2018), World Energy Balances 2018, www.iea.org/statistics/.
0
5
10
15
20
25
1973 1977 1981 1985 1989 1993 1997 2001 2005 2009 2013 2017
Mtoe OilNatural gasCoalBiofuels and wasteNuclearHydroSolar*Geothermal*Wind*
0% 20% 40% 60% 80% 100%
SwedenFinlandFranceNorway
SwitzerlandNew Zealand
DenmarkSlovak Republic
AustriaHungaryBelgium
Czech RepublicCanada
SpainPortugal
United KingdomGermany
ItalyUnited States
Estonia*Korea
TurkeyGreeceIrelandMexico
LuxembourgPolandJapan
NetherlandsAustralia
Oil Natural gas Coal Peat Nuclear Hydro Biofuels and waste Wind Solar Geothermal
Slovak Republic
© O
EC
D/IE
A, 2
018

2. GENERAL ENERGY POLICY
21
EN
ER
GY
INS
IGH
TS The Slovak Republic has the eight-lowest share of fossil fuels in TPES among the IEA
member countries (Figure 2.4). The share of nuclear power is the third-highest.
Energy production and self-sufficiency Nuclear power dominates domestic energy production in the Slovak Republic. In 2017, it accounted for over 60% of the total energy production, down from 68% in 2007, mainly as a result of increased domestic production of biofuels and waste (Figure 2.5).
Before nuclear power was introduced, coal accounted for most domestic energy production. Coal production has been declining for several decades, and the share in total energy production has fallen to 7% in 2017. Biofuels and waste largely replaced coal in heat and power generation. In the past decade, biofuels and waste production more than doubled and accounted for 20% of the total energy production in 2017. The rest of energy production is mainly from hydropower, oil and natural gas.
The large nuclear and biomass production helps to raise energy self-sufficiency (domestic production as a share of TPES) to around 40%, despite high import dependence for fossil fuels (Figure 2.6).
Figure 2.5 Energy production by source, 1973-2017
* Negligible. Source: IEA (2018), World Energy Balances 2018, www.iea.org/statistics/.
Figure 2.6 Energy self-sufficiency, 1973-2017
Source: IEA (2018), World Energy Balances 2018, www.iea.org/statistics/.
0
1
2
3
4
5
6
7
8
1973 1977 1981 1985 1989 1993 1997 2001 2005 2009 2013 2017
MtoeOilNatural gasCoalBiofuels and wasteNuclearHydroSolar*Geothermal*Wind*
0%
10%
20%
30%
40%
50%
1973 1977 1981 1985 1989 1993 1997 2001 2005 2009 2013 2017
Total energy
Coal
Oil
Natural gas
© O
EC
D/IE
A, 2
018

2. GENERAL ENERGY POLICY
22
Energy demand Energy demand dropped sharply after the collapse of the Soviet Union in the early 1990s. From the mid-1990s, energy consumption remained rather stable, at around 11-12 Mtoe per year, until 2011. Since then, it has declined gradually to 10.3 Mtoe in 2016 (Figure 2.7).
The Slovak Republic has a large industrial sector, notably a fast-growing automotive manufacturing industry, which has replaced some heavy industries from the Soviet era. Industry accounts for over 40% of TFC in the country, of which 21% is natural gas and oil products used for non-energy purposes in industrial processes. The remaining energy consumption is in the transport sector (24% of TFC), residential sector (20%) and commercial sector (14%). Although transport energy consumption increased by 11% in the past decade, consumption decreased by 12% in the residential sector and 28% in the commercial sector.
Oil is the dominating fuel in transport, whereas natural gas and electricity account for the largest share of TFC in other sectors (Figure 2.8). DH is the second-largest energy source in the residential sector after natural gas.
Figure 2.7 TFC by sector, 1973-2016
* Industry includes non-energy consumption. ** Commercial includes commercial and public services, agriculture and forestry. Source: IEA (2018), World Energy Balances 2018, www.iea.org/statistics/.
Figure 2.8 TFC by source and sector, 2016
* Industry includes non-energy consumption. ** Commercial includes commercial and public services, agriculture and forestry. *** Other renewables includes negligible shares of solar and geothermal heat. Source: IEA (2018), World Energy Balances 2018, www.iea.org/statistics/.
0
5
10
15
20
1973 1976 1979 1982 1985 1988 1991 1994 1997 2000 2003 2006 2009 2012 2015
MtoeIndustry*
Transport
Residential
Commercial**
29%
5%
86%
17%
28%
38%
53%
6%
26%
8%
4%
1%
18%
7%
4%
2%6%
12%
21%
42%
22%
2%
24%
7%
6%
22%
3%
0% 20% 40% 60% 80% 100%
Total
Commercial**
Residential
Transport
Industry* Oil
Natural gas
Coal
Biofuels and waste
Other renewables***
Electricity
Heat
© O
EC
D/IE
A, 2
018

2. GENERAL ENERGY POLICY
23
EN
ER
GY
INS
IGH
TS Institutions
The Ministry of Economy (MoE) (www.economy.gov.sk) holds the main responsibility for energy policy, its development and the implementation of a policy framework. The Ministry of Environment (ME) (www.minzp.sk) is responsible for the development and implementation of environmental, climate change and adaptation policy.
The Ministry of Transport and Construction (www.telecom.gov.sk) is responsible for policies and measures in the transport and buildings sectors. The implementation of European Union (EU) directives related to buildings is a shared responsibility, with the Ministry of Transport and Construction responsible for buildings‐related legislation and the MoE responsible for boilers, air conditioning and other heating and cooling equipment.
The Ministry of Agriculture and Rural Development (www.mpsr.sk) co-operates with the MoE in the development and implementation of renewable energy policy and biomass use.
The Ministry of Foreign Affairs is responsible for diplomatic affairs, which include ad hoc energy issues. It deals with international aspects of energy security. The Ministry of Education, Science, Research and Sport (www.minedu.sk) is responsible for science and research policy, also related to energy.
The Regulatory Office for Network Industries (RONI) (www.urso.gov.sk) is the national regulatory authority for network industries (electricity, natural gas, DH and water management). Its task is to ensure a balance between the interests of investors and consumers as well as monitor the performance of regulated activities in the electricity, natural gas and DH sectors. RONI is an independent state body, but the government has an exclusive right to name RONI’s chairperson. RONI also implements the government policy on regulating (capping) end-user prices of electricity and natural gas for the so-called vulnerable customers (all households and many small businesses).
Energy statistics are the responsibility of three government entities: the Statistical Office of the Slovak Republic, the State Material Reserves Administration and the MoE.
Key strategies and policies The 2014 Energy Policy In November 2014, the government approved a new Energy Policy (MoE, 2014) of the Slovak Republic (hereafter, “Energy Policy”). It is the strategic document that defines the energy sector’s primary objectives and priorities to 2035 with an outlook to 2050. The Energy Policy is part of the Slovak Republic’s national economic strategy, given that to ensure a sustainable economic growth is conditioned by the reliable supply of affordable energy.
The MoE is responsible for implementing the Energy Policy up to 2035 and updating it at least every five years. The 2014 Energy Policy (MoE, 2014) replaced the 2006 Energy Policy. A revision was needed, because of economic developments and new EU laws and policies, which include further liberalisation of the EU energy markets.
© O
EC
D/IE
A, 2
018

2. GENERAL ENERGY POLICY
24
The Energy Policy aims to ensure the sustainability of the Slovak energy sector and to contribute to the sustainable growth of the economy and its competitiveness. The priority from this perspective is to ensure a reliable and stable energy supply, environmental protection and efficient energy use at optimal costs.
The 2016 government programme In its programme on energy policy from 2016, the current government builds on the 2014 Energy Policy. The government sees as the main energy policy objective the balanced approach between its three pillars of security, competitiveness and sustainability to ensure a safe, sustainable and affordable supply of all kinds of energy.
In energy security solutions, it emphasises maintaining a balanced energy mix and increasing security of energy supply. The basis of the Slovak energy policy is the optimal use of indigenous energy sources and low-carbon technologies, such as renewable energy and nuclear energy. As part of this policy the government is creating conditions for the completion of units 3 and 4 of the Mochovce nuclear power plant (NPP). It also analyses possibilities for further preparation of a new NPP in Jaslovské Bohunice (Chapter 7).
The Slovak Republic is highly dependent on energy imports. Therefore, conditions are being created to increase the security of gas and oil supplies and to support infrastructure projects that will enable the diversification of energy sources and routes. The Slovak Republic strengthens regional co-operation by promoting cross-border connections for the transport of energy. The priority is to support the concept of the North-South gas interconnection. At the same time, transmission systems and transport networks that pass through the territory of the Slovak Republic will be utilised as much as possible.
Much has been done to improve cross-border connections. In the gas sector, the Slovak Republic is connected with the Czech Republic, Austria, Hungary and Ukraine. It is also continuing to develop a Slovak–Polish interconnector that will join up liquefied natural gas (LNG) terminals in Poland and Croatia as well as the Eastring project, which will diversify supplies across the region. These are all significant steps to alleviate the Slovak Republic’s reliance on Russian gas. For crude oil, the upgrade of the Adria pipeline between the Slovak Republic and Hungary means that its crude oil supplies can be met via this route. For electricity, the country is increasing its transmission capacity with Hungary with two projects due to be completed in 2021.
Strategies under preparation The government is preparing several strategies related to energy and the environment. The 2030 Environmental Strategy is expected to be adopted later in 2018. A low-carbon strategy with development paths up to 2050 is being prepared by the ME in co-operation with other ministries, which include the MoE, and aided by the World Bank. The strategy is expected to be adopted in 2019.
An update of the 2014 Energy Policy (MoE, 2014) will be required also because the European Union has adopted energy and climate targets to 2030 and the member states are expected to take additional measures on carbon dioxide emissions, namely energy efficiency and renewable energy (Chapters 9 and 10, respectively). This will also imply a need to update the 2017 National Energy Efficiency Action Plan (which
© O
EC
D/IE
A, 2
018
2. GENERAL ENERGY POLICY
25
EN
ER
GY
INS
IGH
TS applies for the period three-year period 2017-19) and the 2010 National Renewable
Energy Action Plan, which set targets to 2020.
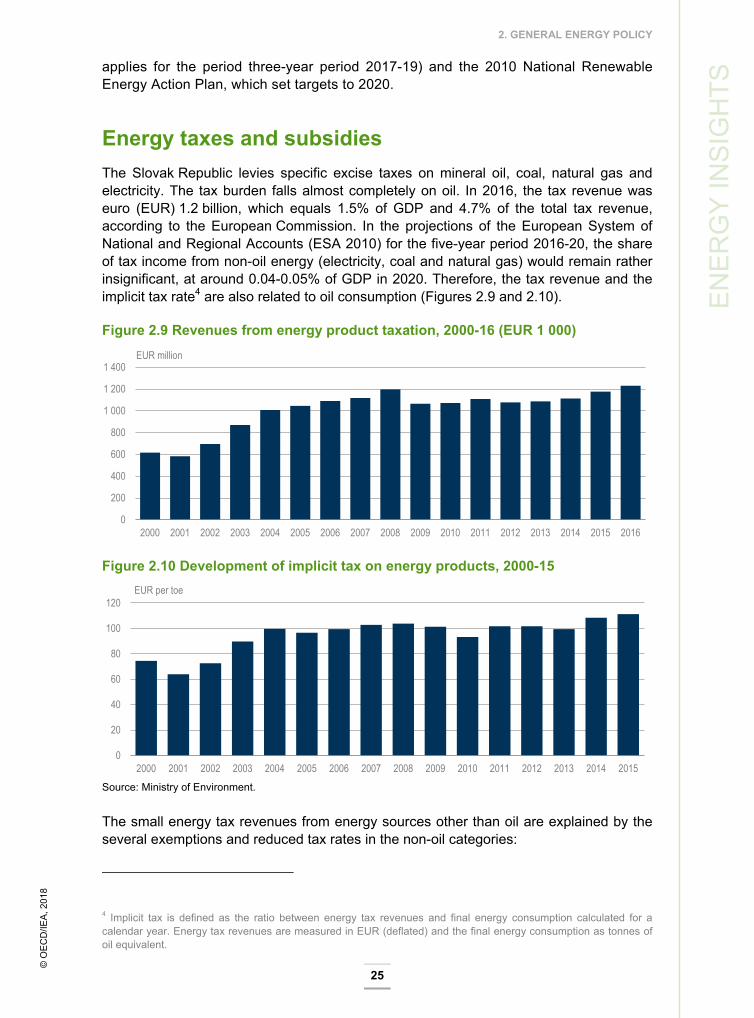
Energy taxes and subsidies The Slovak Republic levies specific excise taxes on mineral oil, coal, natural gas and electricity. The tax burden falls almost completely on oil. In 2016, the tax revenue was euro (EUR) 1.2 billion, which equals 1.5% of GDP and 4.7% of the total tax revenue, according to the European Commission. In the projections of the European System of National and Regional Accounts (ESA 2010) for the five-year period 2016-20, the share of tax income from non-oil energy (electricity, coal and natural gas) would remain rather insignificant, at around 0.04-0.05% of GDP in 2020. Therefore, the tax revenue and the implicit tax rate4 are also related to oil consumption (Figures 2.9 and 2.10).
Figure 2.9 Revenues from energy product taxation, 2000-16 (EUR 1 000)
Figure 2.10 Development of implicit tax on energy products, 2000-15
Source: Ministry of Environment.
The small energy tax revenues from energy sources other than oil are explained by the several exemptions and reduced tax rates in the non-oil categories:
4 Implicit tax is defined as the ratio between energy tax revenues and final energy consumption calculated for a calendar year. Energy tax revenues are measured in EUR (deflated) and the final energy consumption as tonnes of oil equivalent.
0
200
400
600
800
1 000
1 200
1 400
2000 2001 2002 2003 2004 2005 2006 2007 2008 2009 2010 2011 2012 2013 2014 2015 2016
EUR million
0
20
40
60
80
100
120
2000 2001 2002 2003 2004 2005 2006 2007 2008 2009 2010 2011 2012 2013 2014 2015
EUR per toe
© O
EC
D/IE
A, 2
018

2. GENERAL ENERGY POLICY
26
electricity, gas and coal used by final household customers
electricity used for some specified purposes (i.e. for industrial production if the electricity costs represent more than 50% of the average own costs of the product manufactured)
electricity, coal and gas used for the transportation of persons and cargo by public transport (e.g. trains, underground and tramways)
electricity produced from renewable energy sources and co-generation5
pure biofuels
natural gas and coal used (i) to produce electricity and co-generation as well as heat for domestic use, (ii) for operational and technological purposes and (iii) for any purpose other than motor fuel or as heating fuel.
Reduced tax rates apply for petrol and diesel blended with biofuels (Chapter 10).
Production subsidies are granted for the generation of renewable energy and high-efficiency co-generation under feed-in tariffs. Also, electricity generation from domestically produced lignite is subsidised (Chapters 5 and 10).
Investments in several types of energy efficiency measures are subsidised, partially from the EU budget. In recent years, the focus has been on the thermal insulation of buildings and around 60% of flats have been insulated. At the current pace, all blocks of flats in the country will be insulated by 2030.
Assessment Since the 2012 IEA in-depth review (IDR) (IEA, 2012) the Slovak Republic has made good progress in setting new and implementing existing policies. On new policies, the MoE issued in 2014 a new Energy Policy of the Slovak Republic (MoE, 2014), which sets energy policy for the next 20 years, and it also launched an “Energy Efficiency Action Plan” for the three-year period 2017-19. The government is due to publish several more key strategy documents, which afford the opportunity to enhance policy clarity and co-ordination further. A key overall success in energy policy implementation is the large improvement in energy security, which results from the diversification of fuel supplies, a key goal for the country given its high dependence on imports.
Specifically in the gas sector, the Slovak Republic has improved interconnectivity with the Czech Republic, Austria, Hungary and Ukraine. It is also continuing to develop a Slovak–Polish interconnector that will link LNG terminals in Poland and Croatia as well as the Eastring project, which will diversify supplies across the region. These are all significant steps to alleviate the Slovak Republic’s reliance on Russian gas. The upgrade of the Adria oil pipeline between the Slovak Republic and Hungary means that its crude oil supplies can be met via this route. And, finally, the country is increasing its electricity transmission capacity with Hungary through two projects due to be completed in 2021. The above projects will all bring pan-regional benefits and EU funding has been decisive in their development. The Slovak government should be
5 Co-generation refers to the combined production of heat and power.
© O
EC
D/IE
A, 2
018

2. GENERAL ENERGY POLICY
27
EN
ER
GY
INS
IGH
TS commended for the improvement in the diversity of its supply sources and the current
situation is such that it can now focus more on other objectives.
The supplies of electricity, heating and gas continue to consist of nationally dominant firms and regional monopolies. Since the electricity and gas market liberalisation in 2005, the number of retail companies has increased, although the rate of switching has declined in recent years. Alongside this market structure, the government is committed to protecting the final consumers of energy with regulated prices. As a result, RONI, although legally independent, sets its policies in a political context, which gives it little flexibility, particularly in the regulation of energy supplies to households and small businesses.
In addition, the government has a stake in many of the dominant companies involved in the production, transmission, distribution and retailing of oil, gas and electricity. Alongside the extensive price controls present in electricity and gas (as well as heating), this could act as a deterrent to further private investment and the development of competition (Chapters 4 and 6).
The Slovak Republic’s energy intensity has continued to decline quickly. From a high level 20 years ago, it is now one of the leading nations in energy intensity reduction. This is because of significant improvements in energy efficiency in industry and buildings, as well as economic restructuring. Although many of the easy efficiency measures have been implemented, given that the Slovak Republic remains the seventh-highest among EU member states for energy intensity, plenty of potential remains, and the country should not be limited by its EU targets when setting future targets and policies.
In energy efficiency, the most notable progress has been made in the renovation of homes, with around 60% of flats now insulated with an improved energy efficiency and appearance. At current levels of renovation, all blocks of flats will be insulated by 2030 – a notable achievement. To make such a positive intervention in people’s lives can be used as an opportunity to shape public opinion on energy transformation and climate change. As the efficiency improvements also reduce the energy bill, they could also act as a trigger to deregulating end-user prices.
The Slovak Republic continues to have an electricity mix dominated by low-carbon sources with its baseload largely met by nuclear power and hydropower. The share of renewable energy has increased, although the government’s vision for the future role of specific renewable technologies is not clear.
Energy taxes can and should contribute to achieving policy goals. The current energy tax system in the Slovak Republic is characterised by many exemptions, including for coal wbich also receives direct and indirect subsidies. Although there is precedent for the use of energy policy for social ends, the current tax and subsidy system does not provide the right incentives and deterrents to progress energy and climate change policies. The government is planning to update the system of exemptions on energy products and has officially started communication with the European Commission (Directorate-General for Competition) about a possible and acceptable solution.
The government has made good progress since the previous IDR in making key evidence publicly available and having a robust process of public consultation and communication on energy and climate policy. However, there remain further
© O
EC
D/IE
A, 2
018

2. GENERAL ENERGY POLICY
28
opportunities to ensure that government institutions have clear roles in setting and implementing policy and to increase the transparency of decision-making.
The IEA also underlines the need to ensure sufficient resources are devoted to energy statistics. Given that the responsibility for compiling energy statistics is divided between three organisations (the Statistical Office of the Slovak Republic, the State Material Reserves Administration and the MoE), sufficient communication between these organisations also needs to be ensured.
Recommendations The government of the Slovak Republic should:
Align the upcoming Energy Policy, Environmental Strategy and the Low-Carbon Strategy to avoid conflicts and create synergies.
Build on the positive impacts of the domestic buildings retrofit programme to promote the impact of climate change policies on people’s lives and the affordability of energy.
Clarify the roles of government institutions in the implementation of government energy and climate policy.
Further enhance the regulator’s independence and ensure it has adequate powers and resources for its decision-making to be reasoned, justified and transparent.
Ensure sufficient resources are devoted to compile energy statistics in a timely manner.
References
IEA (International Energy Agency) (2018), World Energy Balances 2018 [database], www.iea.org/statistics/.
IEA (2012) Energy Policies of IEA Countries: The Slovak Republic 2012 Review, OECD/IEA, Paris.
MoE (Ministry of Energy) (2014), Energy Policy of the Slovak Republic, MoE, Bratislava, www.economy.gov.sk/uploads/files/47NgRIPQ.pdf.
OECD (Organisation for Economic Co‐operation and Development) (2018), “Developments in individual OECD and selected non-member economies”, in OECD Economic Outlook, Volume 2018 Issue 1: Preliminary version, OECD, Paris, pp. 212-4, http://dx.doi.org/10.1787/eco_outlook-v2018-1-en.
Further reading
IEA (2018), CO2 Emissions from Fuel Combustion, OECD/IEA, Paris, www.iea.org/statistics/.
© O
EC
D/IE
A, 2
018

29
EN
ER
GY
SE
CU
RIT
Y
3. Oil
Key data (2017 provisional)
Crude oil production: 0.01 Mt
Imports of crude oil: 5.6 Mt
Oil products production: 6.1 Mt
Net exports of oil products: 2.1 Mt (1.9 Mt imported, 4.0 Mt exported)
Share of oil: 21.8% of TPES and 28.5% of TFC (2016)
Consumption by sector (2016): 3.5 Mtoe (transport 60.9%, industry 21.0%, other energy 9.0%, power and heat generation 6.7%, commercial 2.1%, residential 0.3%)
Exchange rate: euro: EUR 1 = USD 1.12 (2017)
Overview Oil is the third-largest energy source in the total primary energy supply (TPES), and the second-largest in the total final consumption (TFC) (Figure 3.1). Domestic crude oil production is negligible and the country depends on imports from the Russian Federation (hereafter, “Russia”). Alternative import routes have been developed as a response to the dependency on one single supplier, and the security of supply can be further improved through increased regional collaboration.
Figure 3.1 Share of oil in different energy supplies, 1977-2017
*Latest data for final consumption are for 2016. Source: IEA (2018a), World Energy Balances 2018, www.iea.org/statistics/.
0%
10%
20%
30%
40%
Domestic energyproduction
Total primaryenergy supply
Electricitygeneration
Total final energyconsumption*
Share of oil
19771987199720072017
© O
EC
D/IE
A, 2
018

3. OIL
30
The Slovak Republic has a refinery capacity to cover more than the domestic demand for oil products, and the country is a net exporter to its neighbouring countries. Transport and industry are the largest domestic oil consumers.
Supply and demand Production, imports and exports In 2017, total crude oil supply in the Slovak Republic was 6.2 million tonnes (Mt) (Figure 3.2). Domestic production was 0.01 Mt, with some additional input from natural gas liquids and feedstocks, which supplied 0.53 Mt. The country imports roughly 6 Mt of crude oil per year. In 2016, crude oil imports supplied 92% of the domestic demand. The main source of the oil imports is Russia (via the Druzhba pipeline), which accounted for 99.9% of the total crude oil imports in 2016.
The Slovak Republic has a large refinery capacity at the Slovnaft refinery in Bratislava, which produces around 6 Mt of oil products annually (Figure 3.3). In 2017, the domestic supply of oil products was 3.5 Mt and net exports were 2.1 Mt, mainly to the neighbouring countries (Figure 3.4). The Czech Republic accounted for 48% of the Slovak Republic’s oil product net exports, followed by Hungary at 17%, Poland at 14% and Austria at 13%.
Figure 3.2 Crude oil supply by source, 1973-2017
* Refers to supplies of additives and other hydrocarbons derived from coal, natural gas or renewables. Source: IEA (2018b), Oil Information 2018, www.iea.org/statistics/.
Figure 3.3 Oil products supply by source, 1973-2017
Source: IEA (2018b), Oil Information 2018, www.iea.org/statistics/.
-2
0
2
4
6
8
10
12
1973 1977 1981 1985 1989 1993 1997 2001 2005 2009 2013 2017
MtImportIndigenous productionStock changesFrom other sources*Exports
-6
-4
-2
0
2
4
6
8
10
1973 1977 1981 1985 1989 1993 1997 2001 2005 2009 2013 2017
MtImportIndigenous productionStock changesExportsDomestic supply
© O
EC
D/IE
A, 2
018

3. OIL
31
EN
ER
GY
SE
CU
RIT
Y Figure 3.4 Oil products net exports, 2007-17
Source: IEA (2018b), Oil Information 2018, www.iea.org/statistics/.
Consumption Oil supply (in terms of TPES) has been relatively stable at around 3-3.5 million tonnes of oil equivalent (Mtoe) since the early 1990s, after a large decline following the collapse of the communist system (Figure 3.5). The TFC of oil has been in the range 2.7-3.3 Mtoe. The transport and industry sectors consume the largest share of oil in the TFC, but with different trends.
Figure 3.5 Oil supply (TPES) by consuming sector, 1973-2016
* Other energy includes the energy sector’s own consumption and losses in oil and gas production and refineries. ** Industry includes non-energy consumption. *** Commercial includes commercial and public services, agriculture and forestry. Note: Owing to transfers between different oil products, the other energy category can have negative numbers in the TPES but are shown as zero in the chart. Source: IEA (2018a), World Energy Balances 2018, www.iea.org/statistics/.
Transport accounts for most of the oil consumed in the country, and the demand is growing. In 2016, it consumed 2.1 Mtoe, an increase of 27% since 2006. Road transport accounted for 98% of the total transport oil demand. Diesel is the most-used fuel, and accounts for nearly half of the total oil consumption in the country (Figure 3.6).
Industry is the second-largest oil consumer, but demand has been declining for decades. In 2016, it consumed 0.7 Mtoe, a decrease of 37% since 2006. Over three-quarters of industrial oil demand is for non-energy purposes, such as feedstock used mainly in the chemical industry, typically in the form of naphtha and liquefied petroleum gases.
0
1
2
3
2007 2008 2009 2010 2011 2012 2013 2014 2015 2016 2017
MtOther
Poland
Austria
Hungary
Czech Republic
0
1
2
3
4
5
6
7
8
1973 1976 1979 1982 1985 1988 1991 1994 1997 2000 2003 2006 2009 2012 2015
MtoeHeat and power generationOther energy*Industry**TransportResidentialCommercial***
© O
EC
D/IE
A, 2
018

3. OIL
32
The rest is mainly fuel oil that is used in heat and power generation. Oil consumption in the residential and commercial sectors is very minor.
Figure 3.6 Oil supply (TPES) by product, 2017
* Other oil products includes petroleum coke, refinery gas, kerosene and other products. Source: IEA (2018b), Oil Information 2018, www.iea.org/statistics/.
Infrastructure Refineries The Slovak Republic has one refinery, the Slovnaft refinery in Bratislava. It is a complex refinery with a crude oil distillation capacity of 124 thousand barrels per day (kb/d), or roughly 6 million tonnes per year (Mt/yr). The refinery produces a range of products, with a focus on motor fuels, for domestic consumption and for export to neighbouring countries (primarily the Czech Republic). The total refinery output averaged 137 kb/d in 2016, with the domestic output sufficient to meet domestic demand for all major outputs. However, despite domestic production overcapacity, around 48% of domestic demand of key products (e.g. motor fuels) is met by imports, primarily from the Czech Republic, Austria and Hungary.
Pipelines The crude oil pipeline system consists of around 510 kilometres (km) of pipelines, which is almost entirely accounted for by the Druzhba pipeline; this originates in Russia and transits Belarus and Ukraine before it continues on to the Czech Republic (Figure 3.7). The section within the Slovak Republic, part of the Druzhba’s southern branch, has five pump stations and consists of two parallel pipelines for most of its length.
Transpetrol is the sole operator of the crude oil pipeline system, and it is 100% state-owned by the Ministry of Economy. In 2016, it delivered around 9.2 Mt of crude oil, primarily to Slovak and Czech refiners. Notably, however, Druzhba’s cross-border interconnector with the Czech Republic does not have a reverse flow capacity, and therefore the Druzhba cannot be easily used to facilitate alternative sources of supply in the event of an interruption to eastern supplies.
In recent years, the Slovak Republic has worked to expand its pipeline system in an effort to diversify import sources. The Adria pipeline, which connects the Croatian port of Omišalj with the Hungarian refinery at Duna, provides a potential alternative source of supply for the Slovak Republic. The Slovak section of the Druzhba pipeline is connected with the Adria by a 130 km pipeline from Százhalombatta, Hungary, to Šahy in the Slovak Republic.
46%
17%
12%
7%
5%
13% Total gas/diesel oil
Total motor gasoline
Naphtha
Total fuel oil
Liquefied petroleum gases
Other oil products*
© O
EC
D/IE
A, 2
018

3. OIL
33
EN
ER
GY
SE
CU
RIT
Y Although not used for normal operations as yet (crude oil is only occasionally transferred
between the Slovak and Hungarian refineries), the section has a 6 Mt/yr capacity.
The government also continues to prioritise the Bratislava-Schwechat Pipeline (BSP) project to connect the Bratislava refinery with the Schwechat refinery in Austria. The BSP is considered to be of strategic importance for both the Slovak Republic and Austria, as well as for the rest of the region. Once completed, the proposed 80 km bidirectional crude oil pipeline will close a gap in the trans-European pipeline network between the western oil pipeline network and the southern Druzhba. The BSP could have a capacity of around 2.5-5 Mt/yr.
The BSP would enhance the Slovak Republic’s role as an oil transit hub. It would also enable the supply of oil to the country from the west via the Transalpine (TAL) and the Adria-Wien pipelines, in the event of a supply disruption on the Druzhba.
The BSP is on the European Union list of projects of common interest. However, it remains in the development stage and has been subject to ongoing delays. Owing ostensibly to environmental protection issues, the decision as to the route the pipeline should take through the Bratislava region has not been made and, as of October 2017, the project had not been agreed. However, the Slovak government has repeatedly stated the importance of the project, so it is expected that the commissioning problems will be resolved at some point. The BSP is part of the 2014 Energy Policy of the Slovak Republic up to 2025 (MoE, 2014).
Slovnaft also operates an oil products pipeline that connects its Bratislava refinery to three key product terminals that hold Emergency Oil Stocks Agency (EOSA) public stocks. The pipeline system is used by Slovnaft for commercial purposes and also connects to the Czech Republic’s product pipeline network. The network has a maximum capacity of 36 kb/d.
Storage The total oil storage capacity in the Slovak Republic amounts to some 1.4 million cubic metres (Mm3) (around 9.0 million barrels [mb]), of which around 1 Mm3 is crude oil and the remaining 0.4 Mm3 are refined products. Oil storage facilities in the Slovak Republic are operated primarily by the two major oil companies – Transpetrol and Slovnaft.
Transpetrol operates three crude oil storage facilities, all located along the Druzhba pipeline, with a total combined capacity of around 860 000 cubic metres (m3). The location and capacities of these facilities are:
Budkovce: 380 000 m3
Šahy: 330 000 m3
Bučany: 150 000 m3
Additionally, the Slovnaft refinery in Bratislava hosts some 180 000 m3 of crude oil storage capacity. The maximum drawdown rate of crude oil stocks in the Slovak Republic is around 25 000 tonnes per day, well above the daily capacity of the Slovnaft refinery.
© O
EC
D/IE
A, 2
018

3. OIL
34
Figure 3.7 Map of oil infrastructure, 2017
© O
EC
D/IE
A, 2
018

3. OIL
35
EN
ER
GY
SE
CU
RIT
Y Product stocks are primarily held by Slovnaft at several large storage facilities across the
country. The total storage capacities of these facilities are:
Horný Hričov 108 789 m3
Hronský Beňadik 84 177 m3
Kľačany 115 482 m3
Stožok 76 122 m3
Kapušany 19 166 m3
Other smaller companies operate an additional estimated 30 000 m3 of storage capacity for petroleum products.
These facilities serve to support not only Transpetrol and Slovnaft’s normal business operations, but also to address the Slovak Republic’s emergency stockholding obligations. The Slovak stockholding agency, the EOSA, has a stockholding contract with Spoločnosť pre skladovanie a.s. (SPS), a subsidiary of Transpetrol, to hold emergency stocks of crude oil in both Transpetrol and Slovnaft facilities. The EOSA also has a stockholding contract with the company Zväz pre skladovanie zásob a.s. to hold emergency stocks of petroleum products.
Industry and market structure Two companies, Transpetrol and Slovnaft, operate the bulk of the country’s oil market infrastructure.
Transpetrol is the sole operator of the crude oil pipeline network in the Slovak Republic, and it also operates several crude oil storage facilities, in support of both its normal operations and EOSA’s emergency stockholding operations. The company is fully state-owned.
Slovnaft operates the Slovak Republic’s refinery and product pipeline network. It is owned by the Hungarian energy company, MOL. Its operations also include petrochemical processing and product storage as well as wholesale and retail distribution and product exports. Slovnaft holds a dominant position on the domestic market, supplying 70% of the retail fuel market – one-third of this amount via its own domestic network of petrol stations. The other main oil companies on the Slovak wholesale and retail markets include Shell Slovakia, Unipetrol Slovensko, Jurki Hayton, Benzinol Slovakia, Normbenz Slovakia and Tesco stores.
There is a total of 897 petrol stations in the Slovak Republic. The Slovak Association of Petroleum Industry and Trade represents all of the main companies that operate on the Slovak wholesale and retail oil markets. Its members operate roughly 500 of the country’s petrol stations and sell over 80% of all oil products on the Slovak market.
© O
EC
D/IE
A, 2
018

3. OIL
36
Prices and taxes The Slovak oil market is not subject to any form of price regulation. Fuels sold for use in motor vehicles are subject to an excise tax – with automotive diesel subject to a lower tax rate compared with gasoline. The excise tax on gasoline is euro (EUR) 0.551 per litre (EUR/L), and the excise tax on diesel fuel is EUR 0.386/L.
Consumer fuel prices in the Slovak Republic are close to median levels among International Energy Agency (IEA) member countries (Figure 3.8). In the second quarter of 2018, the automotive diesel price was US dollars (USD) 1.51 per litre, of which 46% taxes. The gasoline price was slightly higher at USD 1.67 per litre, of which 53% taxes.
Figure 3.8 Fuel prices in IEA member countries, fourth quarter 2017
Automotive diesel
Premium unleaded gasoline (95 RON)
Note: Gasoline data are not available for Japan. Source: IEA (2018c), Energy Prices and Taxes, Second Quarter 2018, www.iea.org/statistics/.
Compared with the neighbouring countries, diesel and gasoline prices are slightly higher in the Slovak Republic, despite generally being taxed at lower levels. The tax component for automotive diesel is lower in the Slovak Republic (46%) relative to the Czech Republic (53%), Hungary (50%) and Poland (49%). For gasoline, only Poland has a lower tax component (52% compared with 53% in the Slovak Republic). The price of gasoline, in particular, stands out as consumers in the Slovak Republic pay USD 1.67/L compared with consumers in Poland (USD 1.39/L), Hungary (USD 1.44/L) and the Czech Republic (USD 1.48/L).
0.0
0.5
1.0
1.5
2.0
2.5 USD/L Tax component
0.0
0.5
1.0
1.5
2.0
2.5USD/L Tax component
© O
EC
D/IE
A, 2
018

3. OIL
37
EN
ER
GY
SE
CU
RIT
Y Emergency response policy
Security of supply As a net exporter of refined products, issues related to security of supply in the Slovak Republic primarily involve crude oil supply. The main risk related to oil security in the Slovak Republic is the lack of diversified crude oil sources. Virtually all imports of crude oil (around 99%) come from Russia via the Druzhba pipeline.
Two oil infrastructure projects have been developed to address the issues of the security of crude oil supply in the Slovak Republic (see “Pipelines” section above). First, the newly reconstructed Adria pipeline, which connects the Croatian port of Omišalj to the Bratislava refinery, offers increased flexibility with respect to the sourcing of crude oil supplies in case of a Druzhba disruption. Second, the BSP project between the Bratislava refinery with the Schwechat refinery in Austria would connect the Druzhba pipeline with the Western European pipeline network.
Decision-making structure The Administration of State Material Reserves (ASMR) is responsible for the preparedness to respond to an oil emergency in the Slovak Republic. The ASMR functions as an independent body and reports directly to the Council of Ministers. It is responsible for stockpiling and ensuring the secure supply of all the resources considered essential for the protection of the public interest during a crisis, with the exception of emergency oil stocks. In 2013, the EOSA purchased all the emergency oil stocks from ASMR and the responsibility to maintain emergency oil stocks was transferred from the ASMR to the EOSA. The EOSA replaced the previous system whereby emergency oil stocks were owned directly by the state and managed by the ASMR. The ASMR continues to supervise the EOSA.
The government maintains a 70% share of decision rights in the EOSA through the state-controlled company, SPS. The remaining 30% is distributed among the companies that have a stockholding obligation, the so-called selected entrepreneurs (see “Stockholding Policy” below). Currently, the EOSA has four industry members, and their decision rights are divided based on their market shares of selected oil product sales.
Emergency stocks Stockholding policy By law, the EOSA is required to keep emergency stocks at the level of at least 90 days of daily net imports of crude oil and oil products (or at least 61 days of consumption, whichever is greater; however, in practice, the 90-day requirement is always higher). By law, at least one-third of the emergency stocks must be kept in the form of oil products and at least one-half must be in the form of crude oil. About 65% of the emergency stocks are kept in the form of crude oil and 35% in the form of oil products (motor gasoline, diesel and kerosene jet fuel).
The EOSA maintains emergency stocks on behalf of industry participants. The oil industry is not obliged physically to keep emergency stocks and the stocks owned by
© O
EC
D/IE
A, 2
018

3. OIL
38
the industry are generally considered commercial stocks (with the exception of tickets kept for foreign subjects). Industry participants, so-called “selected entrepreneurs” or “market participants”, are companies that supply “selected oil products” into the domestic market in amounts greater than 20 m3 per year. The term “selected oil product” refers to the main product categories (e.g. gasoline-type fuels, kerosene fuels, gas/diesel oil and fuel oils). Selected entrepreneurs pay fees to the EOSA and correspond to the real costs of holding their stocks. The current fee is EUR 29.65 per m3 of selected oil product.
The Slovak Republic has a strong record of compliance with the IEA’s 90-day stockholding obligation. Using the IEA methodology to calculate emergency reserves, the Slovak Republic’s daily net imports in 2016 were 8.7 thousand tonnes of oil equivalent (ktoe). To meet the 90-day obligation, this equates to around 779 ktoe (or 6.6 mb). As of end-December 2017, the country held a total volume of around 1.1 Mtoe (or 9.0 mb) of stocks, equivalent to 123 days of net imports, and around 287 ktoe (2.4 mb) in excess of the required minimum.
Monitoring and compliance The EOSA stocks are held on its behalf by two stockholding companies (i.e. SPS and Zväz pre skladovanie zásob a.s.) on the basis of storage contracts concluded between the stockholding companies and the EOSA. The EOSA controls the volume and quality of the emergency stocks stored under contract on its behalf. The stockholding companies are also required to send samples from all the storage tanks to an accredited laboratory for analysis at least twice a year, and to provide the results to the EOSA. The volume of the stocks is controlled by the EOSA through required monthly data submissions and monthly physical on-site checks, and the EOSA also annually takes a physical inventory of all the contracted emergency stocks.
Drawdown procedures According to Act No. 218/2013, emergency stocks may be released in response to an oil supply disruption. By law, stocks may only be released in the form of a sale and may not be sold for less than the original purchasing price, currently at USD 110 per barrel on average. The exact nature of the sale would depend on circumstances related to the supply disruption, which could include: whether the disruption was domestic or international; whether or not an IEA collective action was initiated; etc. The type of emergency stocks released (e.g. crude oil or refined products) would also depend on the nature of the disruption.
During a domestic supply disruption, the main goal would be to supply emergency stocks to the domestic market. As such, the sale would be aimed primarily at companies operating within the Slovak oil market. Emergency crude oil stocks would be offered directly to the Bratislava refinery under the condition that the resulting products be subsequently distributed within the Slovak territory.
In the event of a release of petroleum products, the range of possible buyers would be broader. The EOSA would issue a public tender to sell emergency stocks along with basic conditions of the sale. These conditions would specifically include provisions as to the availability of distribution infrastructure (e.g. a network of filling stations), restrictions as to the resale of stocks to ensure they are distributed within the territory of the Slovak Republic, a mechanism to determine the resale (i.e. retail) price, etc.
© O
EC
D/IE
A, 2
018

3. OIL
39
EN
ER
GY
SE
CU
RIT
Y Should the government decide to sell stocks directly to specific priority customers (e.g.
police forces, firefighting and rescue units, etc.), the EOSA will manage the sale via the Ministry of Interior.
In the event that emergency stocks are released to fulfil an international obligation (e.g. an IEA collective action), the primary aim would be to deliver stocks to the markets (domestic or international). As such, the sale would be more open and potential buyers would be subject to fewer conditions.
Demand restraint Demand restraint measures are an important component of the Slovak oil emergency management system. The government is required by law to develop and maintain a contingency plan to implement oil demand restraint measures in the event of a crisis. Demand restraint measures in the Slovak Republic may be implemented in the event of an oil supply disruption upon the recommendation of the ASMR chair. The level of such measures would depend on the severity of the crisis. In the initial stages, even before the official declaration of a state of emergency, measures would consist primarily of a mass media campaign that calls for voluntary reductions in oil consumption. Stronger measures available to the government once a state of emergency has been declared include:
reduction of the speed limit
restriction or ban on the use of certain groups of motor vehicles or motor vehicles with certain licence plates (e.g. odd/even licence plates)
limitation on the opening hours of petrol stations
restriction or ban on the sale of crude oil and oil products
specification of regulatory measures for importers of crude oil and oil products that determine the quantity, place, time, timetable and other terms of the release of crude oil or product stocks
temporary restriction or ban on the export of crude oil or oil products.
The restriction or ban on the exports may only be implemented during a domestic oil emergency if the EOSA stocks need to be released to the domestic market. Such measures cannot be implemented if the action conflicts with international obligations (i.e. obligations as a member of the IEA or European Union with respect to participation in a collective action).
Assessment Oil accounts for the third-largest share of the TPES (22% in 2017, behind nuclear and natural gas). Domestic crude oil production is minimal and the Slovak Republic is heavily dependent on imports of Russian crude oil through the Druzhba pipeline. Russian imports amount to some 6 Mt/yr (5.6 Mt in 2017), and only a small amount of additional supplies arrives via the Adria pipeline (around 0.25 Mt in 2017).
The Slovak Republic’s high dependency on Russian imports is well understood, and the government has been proactive in addressing the issue. The country has a
© O
EC
D/IE
A, 2
018

3. OIL
40
well-developed oil security policy and government-controlled emergency stocks are typically well above the levels required under IEA membership. However, the government has not had to use these stocks1, the release mechanism has not been tested and the IEA notes certain issues that could complicate the release process. Notably, the requirement that these stocks cannot be released at a price below their original purchasing price could prove problematic with regard to the volatility of oil prices and probable urgency of the emergency stocks release, as the stocks were transferred to the EOSA in 2013 when oil prices stood at USD 110 per barrel. As such, it may be prudent to test the release process at some point to ensure that the administration is properly prepared in case of an oil supply disruption.
The Slovak Republic has also been active in finding alternative routes to supply its crude oil needs. In particular, two pipeline projects are intended to improve flexibility with respect to import sources. First, since the previous IDR, the Adria pipeline was upgraded in 2015 and can now carry 6 Mt/yr, enough to cover the needs of the Slovnaft refinery running at full capacity, if necessary.
Second, the proposed 80 km BSP would connect the Bratislava refinery with the Schwechat refinery in Vienna, and so allow the Bratislava refinery to source crude oil via the TAL pipeline. In normal times, this pipeline could provide the Schwechat refinery with the option to source Russian crude oil and/or the Bratislava refinery could source crude oi from the west, albeit in limited quantities given its capacity. Despite more than a decade of planning efforts, the suggested routes in the Bratislava region are still being contested on environmental and security grounds.
A third possible option that has been discussed would be to create a reverse flow capacity on the Druzhba pipeline interconnector with the Czech Republic. This project is still in the initial discussion phase.
The IEA commends the government and Slovnaft for being proactive in finding alternative routes for oil supplies. That Slovnaft has already imported several test cargos of non-Russian crude oil via the Adria pipeline demonstrates an increased flexibility with respect to import sources.
Diesel is by far the most-consumed oil product in the Slovak Republic (almost 1.9 Mt), around three times larger than gasoline (nearly 0.6 Mt). The high share of diesel cars in the Slovak Republic’s car fleet has raised some environmental concerns in metropolitan areas and could, in turn, create some issues for the domestic automotive industry. The Slovak Republic’s automotive industry is one of the pillars of its economy and the recent problems with reported emissions from diesel cars have led many car manufacturers to intensify their efforts to develop cars that run on alternative fuels. The government should consider this as an opportunity to support the development of an alternative fuels market in the transport sector and the development of the relevant infrastructure.
1 The Slovak Republic became a member of the IEA in 2007 and did not participate in the 2011 Libya Collective Action, which was confined to a limited number of IEA countries.
© O
EC
D/IE
A, 2
018

3. OIL
41
EN
ER
GY
SE
CU
RIT
Y Recommendations
The government of the Slovak Republic should:
Review its emergency oil stock release procedures to ensure that stocks can be released quickly and effectively, and reconsider the prohibition on selling EOSA stocks for less than the original purchase price.
Continue to strengthen regional co-operation, integrate regional oil markets and support increased interconnections with its neighbours. Notably, continue its efforts on the BSP project to connect the Bratislava refinery with the Schwechat refinery in Austria.
Further decarbonise and clean the transport sector, especially by reducing diesel consumption, which should include public transport.
References
IEA (International Energy Agency) (2018a), World Energy Balances 2018 [database], OECD/IEA, Paris, www.iea.org/statistics/.
IEA (2018b), Oil Information 2018 [database], OECD/IEA, Paris, www.iea.org/statistics/.
IEA (2018c), Energy Prices and Taxes, Second Quarter 2018 [database], www.iea.org/statistics/.
MoE (Ministry of Energy) (2014), Energy Policy of the Slovak Republic, MoE, Bratislava, www.economy.gov.sk/uploads/files/47NgRIPQ.pdf.
© O
EC
D/IE
A, 2
018

© O
EC
D/IE
A, 2
018

43
EN
ER
GY
SE
CU
RIT
Y
4. Natural gas
Key data (2017 provisional)
Natural gas production: 0.1 bcm, -20% since 2006
Imports: 5.0 bcm, -20% since 2006
Share of natural gas: 22.9% of TPES and 4.3% of electricity generation
Consumption by sector (2016): 3.9 Mtoe (industry 30.3%, residential 27.1%, heat and power generation 17.4%, commercial 14.2%, other energy 8.7%, transport 2.4%)
Exchange rate: euro: EUR 1 = USD 1.12 (2017)
Overview Natural gas is a major energy source in the Slovak Republic. It is the second-largest source of total primary energy supply (TPES), just below nuclear energy, and the largest in total final consumption (TFC). Natural gas is the primary energy source in the heating sector, but provides only a small share of electricity generation (Figure 4.1).
Figure 4.1 Share of natural gas in different energy supplies, 1977-2017
*Latest data for final consumption are for 2016. Source: IEA (2018a), World Energy Balances 2018, www.iea.org/statistics/.
The Slovak Republic is heavily dependent on natural gas imports to meet domestic demand, the vast majority of which comes from the Russian Federation (hereafter, “Russia”). As such, security of supply is a major concern. Improvements have been made and further interconnections are planned to increase flexibility with respect to import sources. However, this remains an issue.
0%
10%
20%
30%
40%
Domestic energyproduction
Total primaryenergy supply
Electricitygeneration
Total final energyconsumption*
Share of natural gas19771987199720072017
© O
EC
D/IE
A, 2
018

4. NATURAL GAS
44
The Slovak natural gas market is open for competition, but remains dominated by large suppliers. Gas prices are regulated for vulnerable customers, a category that includes all households and small businesses. Market liberalisation and transparency could, therefore, also be improved.
Supply and demand Production and imports Domestic natural gas production is negligible, with almost no prospect for unconventional gas. In 2017, total production amounted to 103 million cubic metres (Mm3), or around 2% of domestic gas demand for that year. As a result, most domestic demand is met through imports, primarily from Russia (Figure 4.2). Despite ongoing efforts to diversify supply sources, imports of Russian gas accounted for 87% of total domestic production and imports in 2017.
Figure 4.2 Natural gas supply by source, 1973-2017
Note: Data are provisional for 2017. Source: IEA (2018b), Natural Gas Information 2018, www.iea.org/statistics/.
NAFTA a.s. is the sole domestic producer. Through the implementation of modern exploration and enhanced recovery techniques, it has been able to maintain production at around 80-90 Mm3 per year despite a pessimistic outlook. In 2015, NAFTA began production at a new facility in Záhorská Ves. The facility has a 15-year life cycle, with a projected capacity of 85 000 cubic metres per day (m3/d) in the summer and 98 000 m3/d in the winter. Nevertheless, the Slovak natural gas production is projected to continue to decline in the short term (Table 4.1).
Table 4.1 Projected Slovak Republic natural gas production, 2017-24
Year 2017 2018 2019 2020 2021 2022 2023 2024
Production (Mm3) 84 76 63 51 32 15 10 10
Source: MoE.
Demand Natural gas is central to the Slovak Republic’s energy systems and is consumed in most sectors. However, domestic consumption is declining. Total natural gas
-2.0
0.0
2.0
4.0
6.0
8.0
10.0
1973 1977 1981 1985 1989 1993 1997 2001 2005 2009 2013 2017
bcmOther imports
Imports from Russia
Stock changes
Indigenous production
Exports
Inland consumption
© O
EC
D/IE
A, 2
018
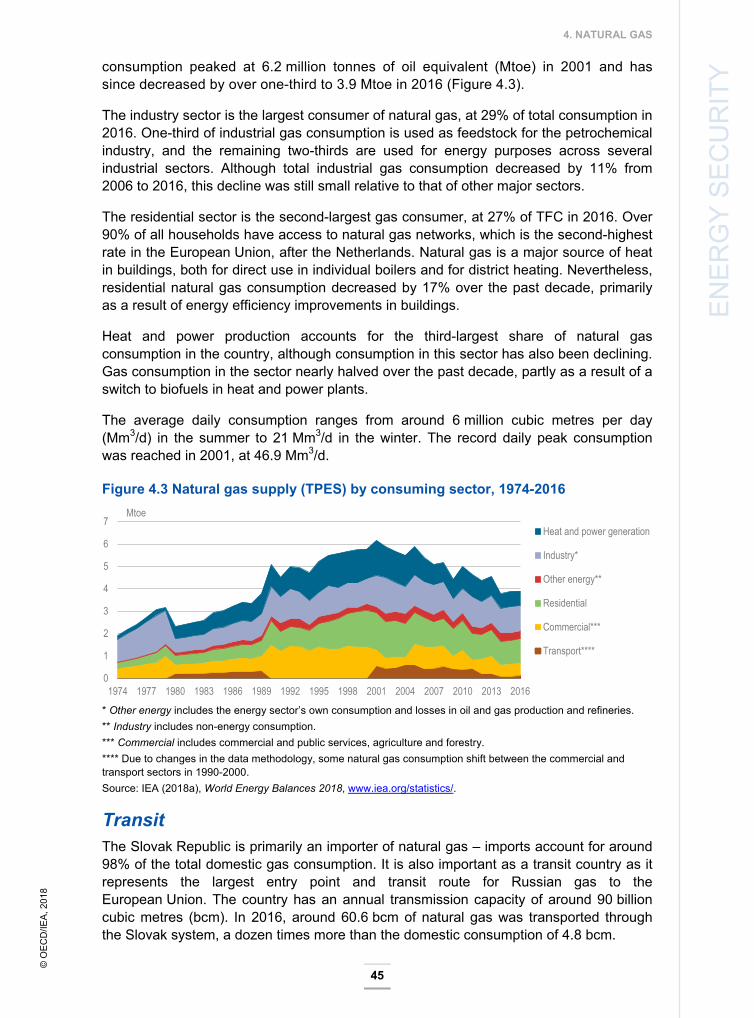
4. NATURAL GAS
45
EN
ER
GY
SE
CU
RIT
Y consumption peaked at 6.2 million tonnes of oil equivalent (Mtoe) in 2001 and has
since decreased by over one-third to 3.9 Mtoe in 2016 (Figure 4.3).
The industry sector is the largest consumer of natural gas, at 29% of total consumption in 2016. One-third of industrial gas consumption is used as feedstock for the petrochemical industry, and the remaining two-thirds are used for energy purposes across several industrial sectors. Although total industrial gas consumption decreased by 11% from 2006 to 2016, this decline was still small relative to that of other major sectors.
The residential sector is the second-largest gas consumer, at 27% of TFC in 2016. Over 90% of all households have access to natural gas networks, which is the second-highest rate in the European Union, after the Netherlands. Natural gas is a major source of heat in buildings, both for direct use in individual boilers and for district heating. Nevertheless, residential natural gas consumption decreased by 17% over the past decade, primarily as a result of energy efficiency improvements in buildings.
Heat and power production accounts for the third-largest share of natural gas consumption in the country, although consumption in this sector has also been declining. Gas consumption in the sector nearly halved over the past decade, partly as a result of a switch to biofuels in heat and power plants.
The average daily consumption ranges from around 6 million cubic metres per day (Mm3/d) in the summer to 21 Mm3/d in the winter. The record daily peak consumption was reached in 2001, at 46.9 Mm3/d.
Figure 4.3 Natural gas supply (TPES) by consuming sector, 1974-2016
* Other energy includes the energy sector’s own consumption and losses in oil and gas production and refineries. ** Industry includes non-energy consumption. *** Commercial includes commercial and public services, agriculture and forestry. **** Due to changes in the data methodology, some natural gas consumption shift between the commercial and transport sectors in 1990-2000. Source: IEA (2018a), World Energy Balances 2018, www.iea.org/statistics/.
Transit The Slovak Republic is primarily an importer of natural gas – imports account for around 98% of the total domestic gas consumption. It is also important as a transit country as it represents the largest entry point and transit route for Russian gas to the European Union. The country has an annual transmission capacity of around 90 billion cubic metres (bcm). In 2016, around 60.6 bcm of natural gas was transported through the Slovak system, a dozen times more than the domestic consumption of 4.8 bcm.
0
1
2
3
4
5
6
7
1974 1977 1980 1983 1986 1989 1992 1995 1998 2001 2004 2007 2010 2013 2016
MtoeHeat and power generation
Industry*
Other energy**
Residential
Commercial***
Transport****
© O
EC
D/IE
A, 2
018

4. NATURAL GAS
46
Legal and regulatory framework As a member of the European Union, the Slovak Republic is committed to implementing European Union (EU) legislation. As such, the Third Energy Package has been successfully transposed into the national legislative framework.
The Regulatory Office for Network Industries (RONI) is the sole state (public) authority responsible for the regulation of network industries. It has national authority, as established by the Network Industries Act. It is an independent body and acts in a transparent and non-discriminatory manner in carrying out its activities.
Prices for vulnerable customers (households and businesses that consume less than 100 megawatt-hours per year [MWh/yr]) are regulated, as is the case with electricity. RONI sets the maximum prices, although suppliers are free to offer lower prices to customers. The regulated entity may also ask RONI to change the price, if the economic parameters for determining the price have changed significantly.
In the current five-year regulatory period (2017-21), RONI’s policy is to ensure transparent, non-discriminatory and effective competition in the network industries, with the to protect consumers and improve the business sector’s competitiveness. A significant place in the new regulatory policy is devoted to the protection of vulnerable energy consumers.
The Act on Energy (Act No. 251/2012 Coll.) and Network Industries Act (No. 250/2012 Coll.) were approved by the National Council on 31 July 2012. The Act on Energy sets out the obligations with respect to the security of supply for participants in the natural gas market. Of note, this includes a definition of protected customers. Additionally, the Act outlines the procedure by which companies obtain permission to build new infrastructure projects. It is ultimately the responsibility of the Ministry of Economy (MoE) to grant this permission.
The procedures for building new infrastructure are governed by the Building Act. Special attention is dedicated to projects designated to be of common interest (i.e. projects of common interest [PCI] status). Based on Article 9(1) of Regulation No. 347/2016 on guidelines for trans-European energy infrastructure, the MoE, as the relevant state authority, has developed a manual of procedures to permit PCIs in a timely manner.
The Slovak Republic is involved in regional co-operation in the Visegrád 4 Group. This involves the co-operation on gas market integration and supply security issues with the other members, namely the Czech Republic, Hungary and Poland. The group has established a road map towards developing a regional gas market and conducted a joint risk assessment in 2015.
Infrastructure Transmission system Eustream is the sole natural gas transmission system operator (TSO) in the Slovak Republic. Since 2013, it has been certified as an independent TSO. Eustream is one of the largest TSOs in Europe and focuses primarily on the transit of Russian gas to Western and Southern Europe. Since 2015, Eustream has also been involved in the
© O
EC
D/IE
A, 2
018

4. NATURAL GAS
47
EN
ER
GY
SE
CU
RIT
Y transit of gas to Ukraine. The Slovak Republic’s cross-border gas connections and
capacity are listed in Figure 4.4 and Table 4.2, respectively, and discussed in the “Security of Supply” section below.
Table 4.2 Cross-border gas connections, 2017
Cross-border point From SR (bcm/yr*) To SR (bcm/yr*) Budince (SR/Ukraine) 10.2 6.4 Veľké Kapušany (SR/Ukraine) 0 82.1 Lanžhot (Czech Republic/SR) 14.6 25.4 Veľké Zlievce (SR/Hungary) 4.6 0 Baumgarten (Austria/SR) 58.8 9.0 Note: SR = Slovak Republic. * Firm technical capacity only, i.e. does not include interruptible capacity. Source: MoE.
Distribution system SPP-Distribúcia (SPP-D) is the largest distribution network operator in the Slovak Republic. In addition to SPP-D, around 40 other small independent local distribution companies are active in gas distribution. SPP-D distributes around 98% of the Slovak Republic’s gas to 1.5 million end users, or 94% of the population. It controls all entries into the distribution system and all offtakes in the Slovak Republic, and thereby guarantees synergies between balancing and security of supply management. SPP-D is part of the SPP capital group.
Storage The Slovak Republic has a total natural gas storage capacity of around 3.5 bcm. All the operators comply with the requirements as to third-party access. The access regime for storage is based on negotiations.
There are two storage system operators: NAFTA and POZAGAS. NAFTA, also the largest natural gas producer in the country, is primarily owned by two companies – SPP Infrastructure a.s., which controls 56.15%, and Czech Gas Holding Investment B.V., which controls 40.45%. POZAGAS owns and operates the Láb 4 Underground Natural Gas Storage Facility.
Table 4.3 Gas storage facilities, 2017
Operator Working gas volume (Mm3)
Injection rate (Mm3/day)
Withdrawal rate (Mm3/day)
NAFTA 2 869 33.8 39.2 POZAGAS 695 7.3 7.3 Total 3 564 41.1 46.5 Source: MoE.
© O
EC
D/IE
A, 2
018

4. NATURAL GAS
48
Figure 4.4 Map of natural gas infrastructure, 2017
Note: MPa = megapascal; PN = pressure normal.
© O
EC
D/IE
A, 2
018

4. NATURAL GAS
49
EN
ER
GY
SE
CU
RIT
Y Increased interconnections with neighbouring countries and the proximity to Austria’s
Central European Gas Hub (CEGH) has had the most significant effect on both the number and diversity of storage users. Gas suppliers and traders benefit from the access of Slovak storages to the transmission network, distribution network and to the Austrian Virtual Trading Point (VTP). The availability of a reverse flow connection with Ukraine since 2016 has also benefited storage customers with its increase in the number of storage contracts. The Slovak Republic-Hungary interconnection has had only a marginal effect on the Slovak storages, and the Slovak Republic–Poland interconnector remains in the development phase.
Eastring pipeline project Eastring is a bidirectional pipeline project between Romania, Bulgaria, Hungary and the Slovak Republic. It will transport natural gas from various sources: from the Turkish border to Europe (prospective Caspian, Middle East, Russian and Romanian Black Sea natural gas) and also from European gas hubs to Turkey. At the same time, it will provide Southeast Europe (SEE) with gas from European gas hubs.
It has a projected capacity of 20-40 billion cubic metres per year (bcm/yr) and a commissioning timeline of over three years. The project is on the second PCI list, with the intention for it to be part of the third as well. It received a Connecting Europe Facility grant for a feasibility study in 2017. This study is now underway with five possible routes being considered.
Market structure Wholesale market The Slovak Republic’s wholesale market is characterised by purchases on long-term contracts, commodity exchanges, bilateral over-the-counter (OTC) (7.5 terawatt hours [TWh] in 2016), the virtual trading point (168 TWh) and swaps in underground gas storage (16 TWh). The CEGH, the Prague Power Exchange, Net Connect Germany and bilateral contracts are sufficient to cover the Slovak Republic’s gas demand in full. Proximity to the CEGH has also helped to spur trading in the region.
The creation of a virtual trading hub in Austria (the VTP) has spurred gas trading in the region, but the hub remains still less liquid than other major European gas hubs. Although the traded volumes on both the OTC market and the exchange are rising, the CEGH’s low liquidity has thus far prevented the summer-winter spread, the key driver of storage product pricing, from rising above historically low levels.
As to the Slovak VTP, some brokers provide liquidity to the market. Liquidity is generally good for day-ahead products, whereas for month-ahead and longer products, the bilateral OTC market is more developed. Prices are partially linked to the Austrian VTP market, with additional margins that are generally stable throughout the whole year.
© O
EC
D/IE
A, 2
018
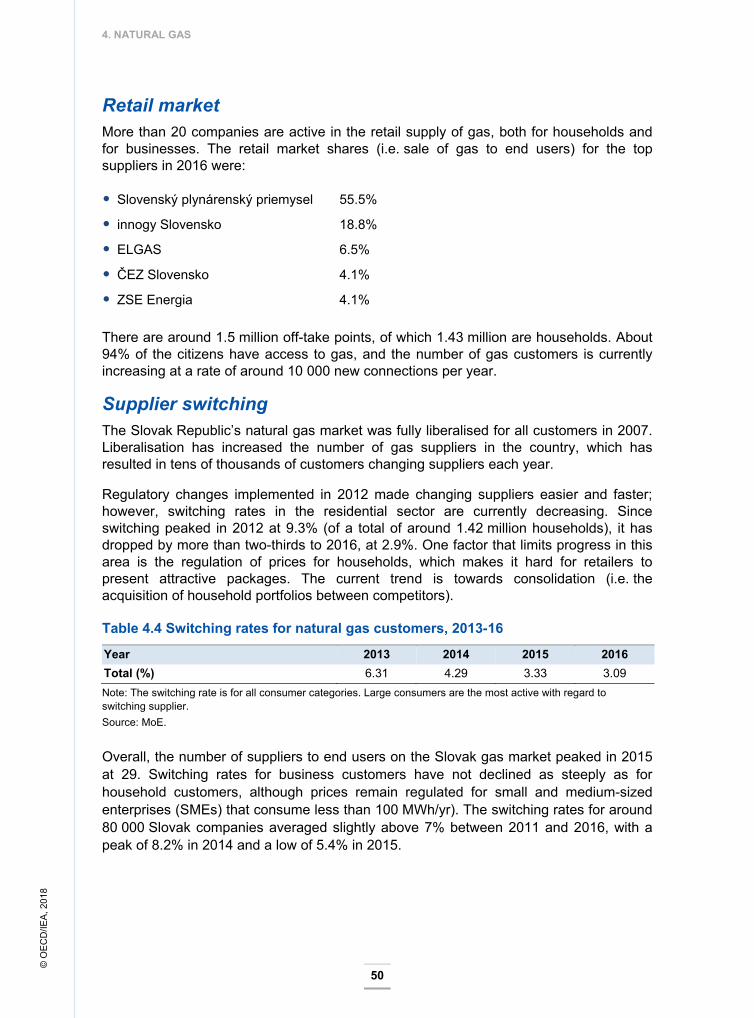
4. NATURAL GAS
50
Retail market More than 20 companies are active in the retail supply of gas, both for households and for businesses. The retail market shares (i.e. sale of gas to end users) for the top suppliers in 2016 were:
Slovenský plynárenský priemysel 55.5%
innogy Slovensko 18.8%
ELGAS 6.5%
ČEZ Slovensko 4.1%
ZSE Energia 4.1%
There are around 1.5 million off-take points, of which 1.43 million are households. About 94% of the citizens have access to gas, and the number of gas customers is currently increasing at a rate of around 10 000 new connections per year.
Supplier switching The Slovak Republic’s natural gas market was fully liberalised for all customers in 2007. Liberalisation has increased the number of gas suppliers in the country, which has resulted in tens of thousands of customers changing suppliers each year.
Regulatory changes implemented in 2012 made changing suppliers easier and faster; however, switching rates in the residential sector are currently decreasing. Since switching peaked in 2012 at 9.3% (of a total of around 1.42 million households), it has dropped by more than two-thirds to 2016, at 2.9%. One factor that limits progress in this area is the regulation of prices for households, which makes it hard for retailers to present attractive packages. The current trend is towards consolidation (i.e. the acquisition of household portfolios between competitors).
Table 4.4 Switching rates for natural gas customers, 2013-16
Year 2013 2014 2015 2016 Total (%) 6.31 4.29 3.33 3.09 Note: The switching rate is for all consumer categories. Large consumers are the most active with regard to switching supplier. Source: MoE.
Overall, the number of suppliers to end users on the Slovak gas market peaked in 2015 at 29. Switching rates for business customers have not declined as steeply as for household customers, although prices remain regulated for small and medium-sized enterprises (SMEs) that consume less than 100 MWh/yr). The switching rates for around 80 000 Slovak companies averaged slightly above 7% between 2011 and 2016, with a peak of 8.2% in 2014 and a low of 5.4% in 2015.
© O
EC
D/IE
A, 2
018

4. NATURAL GAS
51
EN
ER
GY
SE
CU
RIT
Y Prices and taxes
Natural gas prices for households are regulated in the Slovak Republic, as households and small businesses are considered to be vulnerable customers. This means that Slovak households pay a relatively low price for natural gas compared with other International Energy Agency (IEA) member countries (Figure 4.5). In 2017, the household price was US dollars (USD) 50.8 per megawatt-hour (USD/MWh), of which 17% was taxes. Prices for these customers are set by RONI.
Figure 4.5 Natural gas prices in IEA member countries, 2017
Households
Industry
Note: Data are not available for industry in Australia, Mexico and Norway, and for households in Australia, Finland and Norway. * Tax data are not available for the United States. Source: IEA (2018c), Energy Prices and Taxes, Second Quarter 2018, www.iea.org/statistics/.
Industries outside of price regulation paid on average USD 32.5/MWh for natural gas in 2017. In comparison with other IEA member countries, this was the tenth-highest price. The tax share of the price was 5%.
Slovak natural gas prices have followed the same overall trends as those of the neighbouring countries (Figure 4.6). Prices initially increased rapidly over the past decade, but have declined in recent years. Industry gas prices fell by over a third from 2012 to 2017, but prices dropped even more rapidly in the neighbouring countries. Polish and Hungarian industries paid prices that were around 20% lower than those in
0
30
60
90
120
150USD/MWh Tax component
0
20
40
60
80USD/MWh Tax component
© O
EC
D/IE
A, 2
018

4. NATURAL GAS
52
in the Slovak Republic in 2017. Household prices decreased by 28% in the Slovak Republic in the past three years, and were 22% below prices in the Czech Republic, but 24% above prices in Hungary, where prices are heavily regulated by the government.
Figure 4.6 Natural gas price trends in selected IEA member countries, 1990-2017
Industry Households
Source: IEA (2018c), Energy Prices and Taxes, Second Quarter 2018, www.iea.org/statistics/.
Security of supply The MoE is the competent authority with respect to the security of natural gas supply in the Slovak Republic. According to EU Regulation 994/2010, it is thus responsible for maintaining a preventive action plan and an emergency plan, and for updating them every two years. The latest plans were provided to the European Commission in April 2017 and are published on the ministry website. Within the administration, the Crisis Committee is tasked with National Emergency Strategy Organisation (NESO) obligations.
The government sees enhanced regional market integration as a way to foster competition and improve the security of gas supply. On 1 July 2015, the Slovak Republic-Hungarian gas interconnection was commissioned into commercial operation. It provides a firm transmission capacity of 4.6 bcm annually from the Slovak Republic to Hungary and an interruptible transmission capacity of 1.8 bcm annually in the opposite direction. Also, in 2015, a pipeline interconnection and gas measurement station were constructed at the compressor station in Veľké Kapušany to enable the reverse flow of natural gas to Ukraine via the exit point in Budince, at an amount of 14.6 bcm/yr.
As part of the North-South gas corridor (with a total length of around 106 kilometres (km) in Slovak territory), the Polish-Slovak gas interconnection is an integral component of a transmission gas pipeline system that will eventually connect Eastern Europe from the Polish liquefied natural gas (LNG) terminal in Świnoujście to the planned Croatian LNG terminal on the island of Krk. An environmental impact assessment was carried out throughout 2015 and the gas pipeline is expected to be operational in 2021.
0
20
40
60
80
100USD/MWh
Slovak Republic Czech Republic Hungary Poland
0
20
40
60
80
100USD/MWh
© O
EC
D/IE
A, 2
018

4. NATURAL GAS
53
EN
ER
GY
SE
CU
RIT
Y The security of supply has also been enhanced by fulfilling the standard of
EU Regulation 994/2010, which concerns measures to safeguard the security of gas supply. According to the Act on Energy, each gas supplier has to fulfil the standard. They can either hold gas stocks in gas storage facilities such that those stocks could be made available to the Slovak network in a state of emergency. Or, they can hold contractually secured supplies of gas such that no more than 50% of the gas volume necessary to ensure the standard security of supply may be met by the use of cross-border capacity.
According to EU Regulation 2017/1938, gas supply has to be guaranteed for protected customers for 30 days at the average consumption level in November–March. As the distribution system operator (DSO), SPP-Distribúcia fulfils the security of supply standard for all household customers (irrespective of their supplier) by holding sufficient gas volumes in the underground storage facility in Dolní Bojanovice located in the Czech Republic.
Regulation (EU) 2017/1938 also requires that, if the single largest gas infrastructure fails in one member state, the capacity of the remaining infrastructure is able to satisfy the total gas demand during a day of exceptionally high gas demand. The Slovak Republic complies with this rule. In October 2017, a new security of supply regulation was approved at EU level that will impose new obligations on member states, which includes the Slovak Republic.
Assessment Natural gas is consumed in all sectors of the Slovak economy, led by industry and the residential sector, each of which accounts for around 30% of the total consumption. In the power sector, natural gas consumption has fallen by almost one-third in the past decade, and accounts for only 4% of the total electricity generation as of 2017. Gas supplies nearly 44% of the total heat generation.
There are around 1.5 million off-take points, of which 1.43 million are households. About 94% of citizens have access to gas, and the number of gas customers is currently increasing at a rate of around 10 000 new connections per year.
With only a small amount of indigenous production (around 90 Mm3, or 2% of the total consumption), nearly all the natural gas consumed in the Slovak Republic is imported, primarily from Russia. In addition to importing gas for domestic consumption, the Slovak Republic also acts as a key transit country for Russian gas to other EU countries (i.e. the Czech Republic, Austria and Hungary), with a total transit capacity of around 90 bcm/yr. In 2016, a total of 60.6 bcm transited through the Slovak Republic.
The establishment of a reverse flow mechanism with Ukraine was a milestone for gas security in the region. It is worth noting, however, that gas transit fell from 80 bcm to around 60 bcm as a result of the commissioning of Nord Stream 1. According to the government, plans for Nord Stream 2 may further affect the Slovak Republic’s status as a main transit route for Russian gas.
The policy of the government is to maximise the use of transport routes for gas through the country to increase the resiliency of the domestic gas market, which ideally leads to lower prices. To this end, the Slovak Republic has made large investments in the reverse flow from the Czech Republic and Austria, bidirectional reverse flow to Ukraine and an
© O
EC
D/IE
A, 2
018

4. NATURAL GAS
54
interconnection between the Slovak Republic and Hungary. The construction of the interconnection with Poland is ongoing, and the feasibility of the Eastring project and the Slovak Republic–Poland interconnector is being studied. Once constructed, the Eastring project would give the Slovak Republic access to LNG imports from Poland and Croatia and connect the North-South corridor with SEE.
There are two underground storage operators – NAFTA, operating 2.8 bcm, and POZAGAS, operating 0.65 bcm – both of which are also connected to the Czech and Austrian markets and distribution systems. Storage is mainly used for security of supply reasons, as an instrument of elasticity and as arbitrage. There is potential for further increases in capacity, but the current economic conditions do not encourage investments.
Market liberalisation has increased competition. A high number of wholesale traders (27) and the number of switching customers demonstrate that there are no formal barriers to entering the Slovak gas market. In 2016, four gas suppliers had to leave the market, as they lacked profitability. The VTP wholesale market for day-ahead products is liquid, and the bilateral OTC market is more developed for month-ahead or longer products.
The switching rate, which peaked at 120 000 in 2012, fell to around 40 000 in 2016. SPP, the state-owned incumbent supplier, retains a market share of 55% (the second highest being innogy with 19%). However, for small business and household users, SPP holds more than 70% of the market.
Prices for SMEs (with an annual consumption of less than 100 MWh) and for all households remain regulated. The regulated prices do not change rapidly – the price that was decided for 2014 remained in force for 2015 and 2016. This can lead to prices that do not reflect actual costs, which discourages saving when supply is constrained. It also gives gas a competitive advantage and creates cross-subsidisation between groups of customers.
The Slovak Republic has a comprehensive policy to address security of supply, based on the experience during the gas crisis of 2009. Each supplier of natural gas is required to hold gas stocks in underground storages for emergencies or to secure supplies contractually. However, at most 50% of the volume may be secured by using cross-border capacity. The DSO fulfils the security of supply standard for all household customers by holding sufficient gas volumes in storage. Within the administration, the Crisis Committee is tasked with NESO obligations. In October 2017, a new security of supply regulation was approved at EU level that will impose new obligations on member states, which include the Slovak Republic.
Recommendations The government of the Slovak Republic should:
Proceed with the ongoing work of the interconnection point with Poland and the Eastring project to explore the full potential of regional market integration and diversification of sources, and also consider LNG in this process.
© O
EC
D/IE
A, 2
018

4. NATURAL GAS
55
EN
ER
GY
SE
CU
RIT
Y Develop a clear and transparent programme to eliminate administratively determined
end-user prices for the new regulatory period. Protect vulnerable customers and less well-off households through social policy rather than energy policy.
Enable the regulator to advance effective competition and consumer protection in the deregulated retail gas market, for example by:
> increasing market transparency for consumers;
> assessing best practices of other IEA member countries to prevent malpractices at an early stage of market liberalisation;
Given the new EU regulation on security of gas supply:
> review and ensure that the measures required and the roles and responsibilities of the relevant entities in the Slovak gas sector are fit for purpose.
> explore the potential for enhanced regional co-operation on gas emergency policy by taking an active role in the preparedness of regional risk assessments, and in preventive and emergency plans.
References
IEA (International Energy Agency) (2018a), World Energy Balances 2018 [database], OECD/IEA, Paris, www.iea.org/statistics/.
IEA (2018b), Natural Gas Information 2018 [database], OECD/IEA, Paris, www.iea.org/statistics/.
IEA (2018c), Energy Prices and Taxes, Second Quarter 2018 [database], OECD/IEA, Paris, www.iea.org/statistics/.
© O
EC
D/IE
A, 2
018

© O
EC
D/IE
A, 2
018

57
EN
ER
GY
SE
CU
RIT
Y
5. Coal
Key data (2017 provisional)
Coal production: 1.8 Mt, -13% since 2007
Coal imports: 4.3 Mt imported (3.8 Mt hard coal, 0.5 Mt brown coal), -31% since 2007
Share of coal: 19.6% of TPES and 11.4% of electricity generation
Consumption by sector (2016): 3.2 Mtoe / 6.1 Mt (other energy industry* 43.3%, power and heat generation 30.3%, industry 23.7%, commercial 1.8%, residential 0.9%)
Exchange rate: euro: EUR 1 = USD 1.12 (2017) * Coke ovens and blast furnaces.
Overview Coal mining has traditionally been an important industry in the Slovak Republic. In recent decades, however, coal has moved from the largest energy source in the country’s energy production, total primary energy supply (TPES) and electricity generation to account for only around 10-20% of the energy mixes (Figure 5.1). The introduction of nuclear power and the growth in bioenergy use has reduced the relevance of coal for the Slovak Republic’s energy security, and some uneconomical coal mines are now closed down. However, the remaining coal mines depend on subsidies for domestic coal use in power generation.
Figure 5.1 Share of coal in different energy supplies, 1976-2016
*Latest data for final consumption are for 2016. Note: Includes hard coal (anthracite and other bituminous coal) and lignite. Source: IEA (2018a), World Energy Balances 2018, www.iea.org/statistics/.
0%
20%
40%
60%
80%
100%
Domestic energyproduction
Total primaryenergy supply
Electricitygeneration
Total final energyconsumption*
Share of coal
19771987199720072017
© O
EC
D/IE
A, 2
018

5. COAL
58
Supply and demand In 2017, the total domestic supply of coal was 6.1 Mt, of which domestic lignite production accounted for 37% (in terms of weight). Coal is used mainly for steel production and heat and power generation. The economic transition led to a dramatic drop in the early 1990s after which the coal supply declined steadily, but at a slower pace (Figure 5.2).
Production and imports Two-thirds of coal supply is imported, mainly from the neighbouring countries and the Russian Federation (hereafter, “Russia”) (Figure 5.3). Russia accounted for 29% of total imports followed by the Czech Republic (25%) and Poland (20%). Most of the imported coal is hard coal, but also lignite accounted for 11% of the total coal imports in 2017. Coal imports declined by 31% from 2007 to 2017, in line with the decline in coal demand.
Domestic lignite production accounts for 30% of the total coal supply when measured in weight, and 14% when measured in energy content. Lignite production decreased by 13% in the past decade, and several coal mines are now closed down.
Figure 5.2 Coal supply by source, 1973-2017
Note: Includes hard coal (anthracite and other bituminous coal) and brown coal (mainly lignite). Source: IEA (2018b), Coal Information 2018, www.iea.org/statistics/.
Figure 5.3 Hard coal imports by country, 1995-2017
Note: Data not available by country prior to 1994. Source: IEA (2018b), Coal Information 2018, www.iea.org/statistics/.
-5
0
5
10
15
20
25
1973 1977 1981 1985 1989 1993 1997 2001 2005 2009 2013 2017
MtImports hard coal
Imports brown coal
Indigenous production(lignite)Stock changes
0
1
2
3
4
5
6
1995 1997 1999 2001 2003 2005 2007 2009 2011 2013 2015 2017
MtOtherUnited StatesUkrainePolandRussiaCzech Republic
© O
EC
D/IE
A, 2
018

5. COAL
59
EN
ER
GY
SE
CU
RIT
Y According to the State Geological Institute of Dionýz Štúr, the Slovak Republic’s coal reserves total around one billion tonnes.1 Of this, 100–130 million tonnes (Mt) are extractable (MoE, 2014). Hornonitrianske bane Prievidza a.s. (HBP), the sole coal mining company in the country, estimates 40 Mt are extractable.
After the mine closures and mergers, in 2016 HPB became the sole producer of coal. HBP has around 4 000 direct employees. The contractors linked to the coal mining sector have around 3 000 employees.
In 2016, HBP produced 1 957 kilotonnes of coal in the four mining sites of Nováky, Handlová, Cigeľ and Čary. HBP intends to close the Cigeľ mine before 2020, as reserves are becoming depleted. The company sells coal mostly to the Nováky power plant, which is compensated for using it (see “Domestic coal mining policy” below). HBP is planning to open a new mine in the Nováky area and, in September 2017, it submitted a plan for the 1 Mt per year mine for an environmental impact assessment.
Coal consumption In 2016, total coal consumption was 3.2 million tonnes of oil equivalent (Mtoe), of which 80% was hard coal and 20% lignite (in energy terms). Roughly two-thirds is consumed in the production of coke, iron and steel, and around 30% is used at co-generation2 plants to generate power and heat. A small share is consumed in the commercial sector and other industry (Figure 5.4).
Figure 5.4 Coal supply (TPES) by consuming sector, 1973-2016
* Other energy includes consumption in coke ovens, blast furnaces and energy industry losses. ** Industry includes non-energy consumption. *** Commercial includes commercial and public services, agriculture and forestry. Source: IEA (2018a), World Energy Balances 2018, www.iea.org/statistics/.
The Slovak Republic has two coal-fired power plants (Nováky at 266 megawatts [MW] and Vojany at 220 MW). Lignite accounts for roughly two-thirds of coal in heat and power generation, and the remaining share is imported hard coal.
Over 90% of domestic coal is used at the Nováky power plant in the Upper Nitra coal mining area. The plant generates around 1.6 terawatt hours of electricity per year (plus 1 Of this, around 450 Mt are reserves of brown coal and 600 Mt of lignite, according to the Slovak classification. In the IEA classification, brown coal includes lignite. 2 Co-generation refers to the combined production of heat and power.
0
2
4
6
8
10
1973 1976 1979 1982 1985 1988 1991 1994 1997 2000 2003 2006 2009 2012 2015
Mtoe
Heat and power generation
Other energy*
Industry**
Residential
Commercial***
© O
EC
D/IE
A, 2
018

5. COAL
60
heat to local communities and industrial facilities) and requires around 1.8 Mt of coal per year. The rest is used for industrial and public heating.
Domestic coal mining policy The government policy is to ensure sufficient domestic coal supply to generate electricity for residential and industrial use to 2035, as laid out in the 2014 Energy Policy (MoE, 2014). On the other hand, the Environment Minister announced at the “One Planet Summit” in Paris in December 2017 that both coal mining and the use of local coal at the Nováky plant will be phased out by 2023.
Domestic coal is uncompetitive against imported coal and, although coal mining is not subsidised, electricity generation from domestic coal is. Such subsidies are allowed under European Union (EU) law (Electricity Directive 2009/72/EC) for reasons of security of supply. EU member states may give preference (i.e. subsidies) to power plants that use domestic primary energy sources, but only up to 15% of the total primary energy use in electricity generation per year.
In practice, the Nováky power plant has preferential dispatch and a guaranteed price for electricity generated from domestic lignite. The difference between the electricity wholesale price and the price the Nováky power plant receives is paid by the Regulatory Office for Network Industries. This subsidy is financed through a surcharge of about EUR 4.5 per MWh of electricity sold on the domestic market. The same kind of surcharge system is also used to finance subsidies for renewable energy. The method used to calculate the surcharge is laid down in Article 11 of the “Decree on Electricity Produced from Domestic Coal Sources”. The Decree specifies that the electricity producer is entitled to set a fixed price for each MWh of electricity made from lignite.
In July 2017, the Ministry of Environment calculated that to close down the Nováky power plant would save the Slovak Republic euros (EUR) 100 million in subsidies annually and EUR 500 million in “health benefits” (ME, 2017). As HBP has around 4 000 direct employees and the related contractors another 3 000 employees, the annual subsidy per direct and indirect employee is around EUR 14 000.
The government considers that an abrupt termination of coal mining in the Upper Nitra would radically increase unemployment in the area. To minimise the impact on employment, it prefers to find solutions that gradually phase out coal mining and the subsidy. An example is an EU-funded study on prospects for geothermal energy in the region, launched under the EU Platform for Coal Regions in Transition.
Subsidies are also granted to mine closures. From 2002 to 2015, a total subsidy of EUR 6.7 million was given to the mining company Baňa Dolina a.s., to cover the exceptional costs to end the mining activities and to cover the severance payments to workers. The closure of the Cigeľ mine is expected to cost around EUR 6 million in state aid.
© O
EC
D/IE
A, 2
018

5. COAL
61
EN
ER
GY
SE
CU
RIT
Y Assessment The role of coal in the Slovak Republic’s energy system is in decline, both in absolute and relative terms. In 2017, coal supply was 3.7 Mtoe, or 19.6% of the TPES, down from 4.0 Mtoe and 22.4% of the TPES in 2007. Total coal supply consisted of 80% hard coal and 20% of lignite.
All hard coal, some 3.8 Mt, is imported (mostly from the Czech Republic, Russia and Poland). Hard coal is mostly used in the steel industry. Most of the lignite comes from domestic mines, some 1.8 Mt in 2017, and some 0.5 Mt is imported, mostly from the Czech Republic. The domestic production of lignite has fallen from the close to 6 Mt per year in the 1970-80s. The government considers the current annual production level of 1.8 Mt desirable, as it contributes to the security of electricity supply, reduces dependence on energy imports and provides employment. At the same time, a phase-out of domestic coal mining by 2023 was announced by the Environment Minister in December 2017.
Lignite is mostly used in power and heat generation at the Nováky plant. In 2016, the plant accounted for 6.4% of the total power generation in the country. The remaining extractable lignite reserves in the Slovak Republic would be sufficient to supply the Nováky power plant for at least for another 20 years.
The challenge is that domestic lignite is uncompetitive in power generation. Its perceived security of supply benefits, however, means the government has adopted a compensation system for its use in electricity generation. Electricity from domestic lignite also benefits from a priority dispatch to the network, just as renewable energy. The subsidy costs electricity users around EUR 100 million a year, or around EUR 14 000 per employee in coal mining and related services.
Practically all domestic coal is used for power generation and therefore it is part of the electricity security equation and its future should be considered in this context. The International Energy Agency notes that to the extent that domestic lignite is currently needed for the security of supply, this concern will be alleviated as soon as the first 470 MW nuclear unit comes on line, planned for completion in 2018.
Recommendations The government of the Slovak Republic should:
Continue to close uneconomic mines.
Eliminate the subsidies for domestic lignite production and the cost recovery of these subsidies via the electricity price.
© O
EC
D/IE
A, 2
018

5. COAL
62
References
IEA (International Energy Agency) (2018a), World Energy Balances 2018 [database], OECD/IEA, Paris, www.iea.org/statistics/.
IEA (2018b), Coal Information 2018 [database], OECD/IEA, Paris, www.iea.org/statistics/.
ME (Ministry of Environment) (2017), Revízia výdavkov na životné prostredie (Review of environmental expenditure), ME, Bratislava, www.minzp.sk/files/iep/zaverecna_sprava_zivotne_prostredie.pdf.
MoE (Ministry of Economy) (2014), Energy Policy of the Slovak Republic, Bratislava, http://www.economy.gov.sk/uploads/files/47NgRIPQ.pdf..
© O
EC
D/IE
A, 2
018
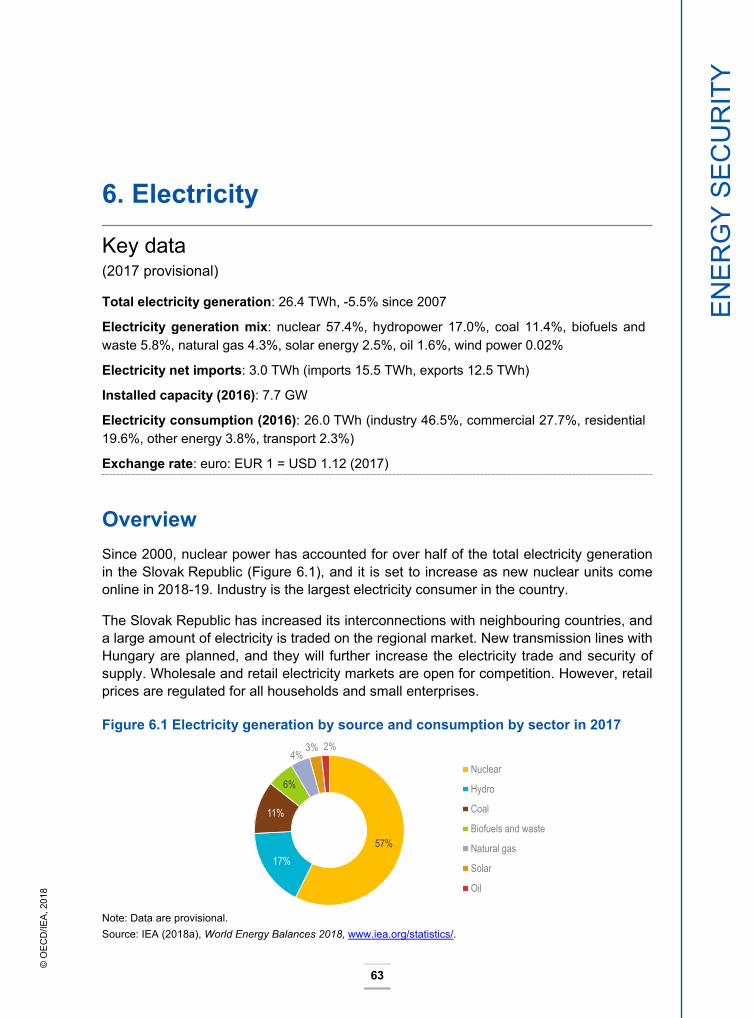
63
EN
ER
GY
SE
CU
RIT
Y
6. Electricity
Key data (2017 provisional)
Total electricity generation: 26.4 TWh, -5.5% since 2007
Electricity generation mix: nuclear 57.4%, hydropower 17.0%, coal 11.4%, biofuels and waste 5.8%, natural gas 4.3%, solar energy 2.5%, oil 1.6%, wind power 0.02%
Electricity net imports: 3.0 TWh (imports 15.5 TWh, exports 12.5 TWh)
Installed capacity (2016): 7.7 GW
Electricity consumption (2016): 26.0 TWh (industry 46.5%, commercial 27.7%, residential 19.6%, other energy 3.8%, transport 2.3%)
Exchange rate: euro: EUR 1 = USD 1.12 (2017)
Overview Since 2000, nuclear power has accounted for over half of the total electricity generation in the Slovak Republic (Figure 6.1), and it is set to increase as new nuclear units come online in 2018-19. Industry is the largest electricity consumer in the country.
The Slovak Republic has increased its interconnections with neighbouring countries, and a large amount of electricity is traded on the regional market. New transmission lines with Hungary are planned, and they will further increase the electricity trade and security of supply. Wholesale and retail electricity markets are open for competition. However, retail prices are regulated for all households and small enterprises.
Figure 6.1 Electricity generation by source and consumption by sector in 2017
Note: Data are provisional. Source: IEA (2018a), World Energy Balances 2018, www.iea.org/statistics/.
57%17%
11%
6%
4%3% 2%
Nuclear
Hydro
Coal
Biofuels and waste
Natural gas
Solar
Oil
© O
EC
D/IE
A, 2
018

6. ELECTRICITY
64
Supply and demand Electricity generation From the late 1970s on, electricity generation increased gradually with the introduction of new nuclear power plants (NPPs) (Figure 6.2). Since the peak at 32.2 terawatt hours (TWh) in 2002, generation has declined. In 2017, total electricity generation amounted to 26.4 TWh, one of the lowest levels in the past two decades.
Nuclear power overtook coal as the largest source of electricity in 1985 and has remained the dominant source of electricity ever since. In 2017, nuclear generation was 15.1 TWh. This was 16% less than the peak of 18.0 TWh in 2006, after which two reactors were shut down as a condition for the country to enter the European Union (discussed further in Chapter 7).
Hydropower is the second-largest source of electricity. Annual output varies around 4-5 TWh, depending on hydrological conditions. Coal is the third-largest source with its peak in the 1980s, but it is now in decline. The largest increase in power generation in the past decade comes from biofuels and waste, which tripled, and solar power, which grew tenfold, although from a very low level. From 2013, out of grid stability concerns, the distribution system operators (DSOs) have not accepted new requests for a grid connection to generate a capacity of more than 10 kilowatts (kW). This has stalled new installations of small-scale power generation.
Figure 6.2 Electricity generation by source, 1973-2017
*Negligible. Note: Data for 2017 are provisional. Source: IEA (2018a), World Energy Balances 2018, www.iea.org/statistics/.
The share of fossil fuels in electricity generation is the fifth lowest among International Energy Agency (IEA) member countries (Figure 6.3). This is mainly a result of the large share of nuclear power, which is the second highest after France. The share of wind power, however, is the lowest among the IEA member countries.
-10
0
10
20
30
40
1973 1977 1981 1985 1989 1993 1997 2001 2005 2009 2013 2017
TWhOilNatural gasCoalBiofuels and wasteNuclearHydroSolarWind*Net import/export
© O
EC
D/IE
A, 2
018

6. ELECTRICITY
65
EN
ER
GY
SE
CU
RIT
Y Figure 6.3 Electricity generation by source in IEA member countries, 2017
* Estonia’s coal represents oil shale. Note: Data are provisional. Source: IEA (2018a), World Energy Balances 2018, www.iea.org/statistics/.
In terms of installed capacity, hydropower accounts for the largest share, before nuclear power, natural gas and coal (Table 6.1). In 2016, nuclear had a capacity factor1 of 87%, whereas hydropower had a capacity factor of only 17%.2 Also, gas-fired power plants were used less than 20% of the time.
Although the Slovak electricity system has recently become reliant on power trade to meet the total demand, its domestic supply capability of 7.7 gigawatt (GW) is relatively high in relation to its peak demand of around 4.5 GW. In 2016, the peak load reached 4.382 GW (on 7 December at 17:00). The government projects peak demand to increase gradually to 4.7 GW in 2020 and 5.1 GW in 2030. Reliance on imports is likely to end when two new nuclear units (0.94 GW in total) enter into service in 2018-19 (Chapter 7).
Future electricity generation was estimated in 2016 in a consultancy study “Updating of the electricity consumption forecast in the Slovak Republic until 2035” for the needs of SEPS (Slovenska Elektrizacna Prenosova Sustava), the transmission system operator (TSO). The study took into consideration macroeconomic and demographic developments, energy performance developments, energy savings and the deployment
1 Actual production divided by the maximal theoretical production from the installed capacity. 2 Part of the hydropower capacity is pumped storage, which actually reduces the net generation.
0% 20% 40% 60% 80% 100%
SwitzerlandSwedenNorwayFrance
Slovak RepublicNew Zealand
FinlandCanadaAustria
LuxembourgDenmarkBelgiumHungary
SpainUnited Kingdom
GermanyCzech Republic
PortugalUnited States
ItalyKorea
TurkeyIrelandGreeceJapan
NetherlandsMexico
AustraliaPoland
Estonia*
Oil Natural gas Coal Peat Nuclear Biofuels and waste Hydro Wind Solar Geothermal
Slovak Republic
© O
EC
D/IE
A, 2
018

6. ELECTRICITY
66
of new technologies for electricity generation and consumption. Under the central scenario of the study, gross electricity generation reaches 32 TWh in 2020 and 35 TWh in 2030.
Table 6.1 Installed electricity-generating capacity, 1995-2016 (MW)
Energy source 1995 2000 2005 2010 2014 2015 2016 Nuclear 1 760 2 640 2 640 1 820 1 940 1 940 1 940 Hydropower 2 260 2 420 2 512 2 516 2 523 2 522 2 524 Of which pumped 735 735 916 916 916 916 916 Solar photovoltaics 0 0 0 19 533 533 533 Wind 0 0 5 3 3 3 3 Combustible fuels 3 218 2 394 3 090 3 496 3 068 2 754 2 710 Coal - - 1 240 964 927 714 591 Liquid fuels - - 12 112 138 138 139 Natural gas - - 405 1 083 1 022 959 1 027 Mixed fuel plants* - - 1 378 1 144 820 779 807 Other combustible fuels - - 55 193 161 164 146 Other sources 0 0 10 19 25 30 32 Total capacity 7 238 7 454 8 257 7 873 8 092 7 783 7 742 Note: Detailed data on combustible fuels are not available for 1995 and 2000. * Power plants that use solid/gas, liquid/gas and solid/liquid/gas fuels. Source: IEA (2018b), Electricity Information 2018, www.iea.org/statistics/.
Imports and exports The Slovak Republic is well interconnected and trades electricity with several countries in the region. In many respects, it serves as a transit country for power that flows south from the Czech Republic and Poland to Hungary and Ukraine (Figure 6.4). In 2017, the Slovak Republic imported 15.5 TWh and exported 12.5 TWh, which resulted in net imports of 3.0 TWh. The net imports of power generally reflected regional market opportunities rather than supply limitations.
Figure 6.4 The Slovak Republic’s electricity trade by country, 1990-2017
Note: Data on electricuty trade by country are not available for 2017. Source: IEA (2018b), Electricity Information 2018, www.iea.org/statistics/.
-15
-10
-5
0
5
10
15
20
1990 1993 1996 1999 2002 2005 2008 2011 2014 2017
TWh
Czech Republic
Hungary
Poland
Ukraine
Other/not-specified
Net trade
Imports
Exports
© O
EC
D/IE
A, 2
018
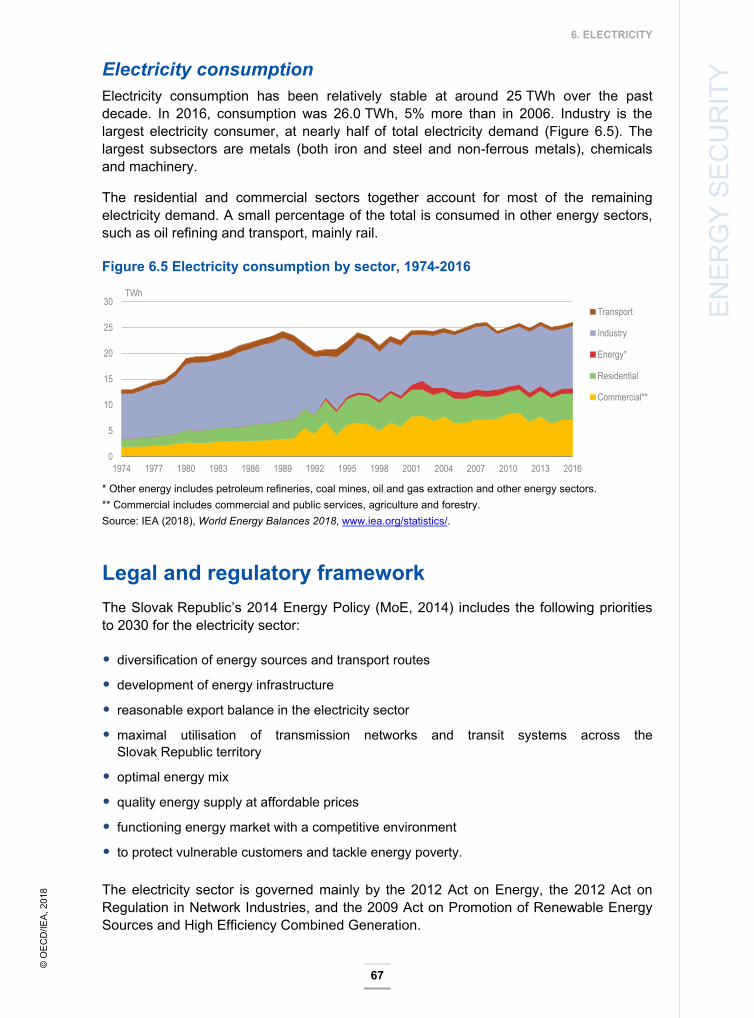
6. ELECTRICITY
67
EN
ER
GY
SE
CU
RIT
Y Electricity consumption
Electricity consumption has been relatively stable at around 25 TWh over the past decade. In 2016, consumption was 26.0 TWh, 5% more than in 2006. Industry is the largest electricity consumer, at nearly half of total electricity demand (Figure 6.5). The largest subsectors are metals (both iron and steel and non-ferrous metals), chemicals and machinery.
The residential and commercial sectors together account for most of the remaining electricity demand. A small percentage of the total is consumed in other energy sectors, such as oil refining and transport, mainly rail.
Figure 6.5 Electricity consumption by sector, 1974-2016
* Other energy includes petroleum refineries, coal mines, oil and gas extraction and other energy sectors. ** Commercial includes commercial and public services, agriculture and forestry. Source: IEA (2018), World Energy Balances 2018, www.iea.org/statistics/.
Legal and regulatory framework The Slovak Republic’s 2014 Energy Policy (MoE, 2014) includes the following priorities to 2030 for the electricity sector:
diversification of energy sources and transport routes
development of energy infrastructure
reasonable export balance in the electricity sector
maximal utilisation of transmission networks and transit systems across the Slovak Republic territory
optimal energy mix
quality energy supply at affordable prices
functioning energy market with a competitive environment
to protect vulnerable customers and tackle energy poverty.
The electricity sector is governed mainly by the 2012 Act on Energy, the 2012 Act on Regulation in Network Industries, and the 2009 Act on Promotion of Renewable Energy Sources and High Efficiency Combined Generation.
0
5
10
15
20
25
30
1974 1977 1980 1983 1986 1989 1992 1995 1998 2001 2004 2007 2010 2013 2016
TWh
Transport
Industry
Energy*
Residential
Commercial**
© O
EC
D/IE
A, 2
018
6. ELECTRICITY
68
The 2012 Energy Act transposes the third European Union (EU) electricity market directive (2009/72/EU) into national law. At the EU level, the political priority is to progress towards an integrated internal electricity market. This market integration has focused on two areas: first, to integrate national and regional electricity markets and co-ordinate system operations via commonly agreed mechanisms based on the EU regulations and guidelines and, second, to construct cross-border interconnections and a co-ordinating network infrastructure planning via the European Network of Transmission System Operators for Electricity’s ten-year network development plans and regional plans.
Price regulation in the electricity sector in the Slovak Republic covers network operations, as in all EU countries. As is the case in the gas sector, the regulation also covers the end-user prices for the so-called vulnerable consumers, i.e. households and small enterprises with an annual consumption of at most 30 megawatt hours (MWh). The Ministries of Economy and the Environment have the right to step into price-setting proceedings. Price regulation is set for a period of five years, currently from 2017 to 2021.
Distribution network tariffs for power generators, which are used to recover the costs of operating and investing in electricity distribution networks, are based on generating capacity.
The regulated network tariffs that are included in the electricity bill also include the costs of support for electricity generation from renewable sources (around 2.8 TWh in 2016, according to the Regulatory Office for Network Industries [RONI], the regulator) and high-efficiency co-generation3 plants (around 2.2 TWh in 2016), as well as electricity generation from domestic coal (around 1.6 TWh in 2016). These costs totalled around euros (EUR) 560 million in 2016.
Electricity-generating facilities above 10 kW are not allowed (since 2013) to connect to the distribution network (the “stop status”), partly to solve issues of system balancing at the transmission and distribution levels.
Electricity system – participants, infrastructure and operations Key participants in the electricity market in the Slovak Republic are:
TSO (SEPS a.s.)
DSOs (Západoslovenská distribučná a.s. [ZSD], Stredoslovenská distribučná a.s. [SSD] and Východoslovenská distribučná a.s. [VSD])
157 local DSOs
the short-term electricity market operator (OKTE a.s.)
the most significant electricity producer (SE a.s.)
3 Co-generation refers to the combined production of heat and power.
© O
EC
D/IE
A, 2
018

6. ELECTRICITY
69
EN
ER
GY
SE
CU
RIT
Y
193 electricity suppliers
electricity consumers
electricity producers.
Generation and wholesale trade The generating segment includes a major utility, Slovenské Elektrárne a.s. (SE), more than 260 independent district heating and power plants and several industrial co-generation facilities. The total system capacity was 7.7 GW at the end of 2016.
SE owns and operates some 4.2 GW of generating capacity, which includes nuclear, fossil fuel and hydropower plants, and accounted for more than 69% of generation in the country in 2016. This is down from the 90% to 95% share it held early in the previous decade. SE is 34% owned by the Slovak Republic state, and a 66% stake is owned by Slovak Power Holding (SPH), which in turn is 50/50 owned by Enel and Energeticky a Prumyslovy Holding (EPH), both large multinational utilities. Enel owned the entire 66% stake from 2006 to 2016, and has agreed to sell its remaining 50% share in SPH to EPH in the near future. According to the agreement between the two companies, this transaction may take place once the Mochovce NPP units 3 and 4 have been granted operating permits. Enel had agreed to complete the construction of the two units when it acquired its stake in SE in 2006. The units are expected to come online in 2018-19 (Chapter 7).
Within the co-generation segment of the industry, some 260 installations represent 2 460 megawatts (MW) of thermal capacity and provide the vast majority of generating capacity outside of SE. The market concentration in electricity generation remains high because of SE’s strong position.
Electricity is mostly traded under bilateral contracts linked to the Prague Power Exchange and the European Energy Exchange, which are regarded as the sources for the most transparent price signals in the region. Around 8% of the total annual generation is traded on the Slovak day-ahead market or the neighbouring markets on a bilateral basis (RONI, 2017), rather low by international standards.
OKTE a.s. operates the day-ahead wholesale electricity market. It is a subsidiary of the transmission operator SEPS a.s. (see “Transmission” below). The state owns 100% of OKTE via the Ministry of Finance.
Transmission In 2016, the transmission network consisted of 2 138 kilometres (km) of 400 kilovolt (kV) lines, 826 km of 220 kV lines and 80 km of 110 kV lines, according to the SEPS. In total, 29.3 TWh was transmitted, of which 0.98% was lost.
The transmission system is owned and operated by SEPS a.s. (Slovak Power Grid). SEPS is 100% state-owned. Shareholder rights are exercised by the Ministry of Economy (MoE). In recent years, SEPS has invested heavily to upgrade and expand the transmission capacity.
The TSO is obliged to draw up each year a transmission system development plan for the following ten years (the Ten-Year Network Development Plan [TYNDP]) and submit it to the MoE and RONI. It also has to report on the implementation of the TYNDP. The
© O
EC
D/IE
A, 2
018

6. ELECTRICITY
70
ministry and the TSO draw up each year the “Report of results of monitoring security of electricity supplies”, which contains information on and proposals for balancing the electricity supply and demand, availability of reserve capacity for the following five years and the security of electricity supply for the following 5-15 years.
Cross-border connections The Slovak Republic has significant cross-border capacity compared with its generating capacity (Table 6.2). According to the European Commission, the ratio was 43% in 2017, which is well above the 2020 and 2030 EU objectives (respectively, 10% and 15%). However, the country is impacted by electricity loop flows from Germany, via Poland and the Czech Republic. Germany has a single market on its territory, and the TSOs of Poland, Czech Republic, the Slovak Republic and Austria have submitted a request to the European Commission to review whether Germany should have bidding zones, as these TSOs are burdened with higher costs due to re-dispatching and potential requirements of upgrading their grids.
Also, the Slovak Republic’s connections with Hungary are congested, and three new connections are planned to improve the situation. They are listed as the projects of common interest and will receive funding from the European Union’s Connecting Europe Facility (EC, 2017).
Table 6.2 Forecast maximum cross-border capacity for 2018 (MW)
Czech Republic Hungary Poland Ukraine
From SR to 1 200 350 400 400
To SR from 2 000 500 500 n/a
Note: SR = Slovak Republic. Source: ENTSO-E (2018), Forecasted Transfer Capacities – Year Ahead, https://transparency.entsoe.eu/transmission-domain/ntcYear/show.
Market coupling An essential part of developing a single EU electricity market is to connect the different, typically national, market areas both physically through cross-border interconnections and through market-coupling arrangements to ensure the efficient use of cross-border capacity one day ahead of physical delivery. This market integration is also expected to increase wholesale price convergence over time.
In November 2014, the market-coupling project (the so-called 4MMC) that integrated the markets of the Slovak Republic (OKTE), the Czech Republic (OTE), Hungary (HUPX) and Romania (OPCOM) was successfully launched. This project is a continuation of the trilateral market coupling of the electricity markets of the Slovak Republic, the Czech Republic and Hungary, that has operated since 2012. The Czech and Slovak markets were coupled before that in 2009. The total volume of electricity traded in the Slovak spot market in 2016 amounted to 9.1 TWh, 1.1 TWh less than in 2015 (RONI, 2017).
© O
EC
D/IE
A, 2
018

6. ELECTRICITY
71
EN
ER
GY
SE
CU
RIT
Y Figure 6.6 Map of electricity infrastructure, 2017
© O
EC
D/IE
A, 2
018

6. ELECTRICITY
72
Distribution and retail The Slovak Republic has three regional DSOs: ZSD, SSD and VSD. They carry out their activities independently in a transparent and non-discriminatory manner, in accordance with Act No. 250/2012 on regulation in network industries as amended.
The three DSOs are owned 51% by the state and 49% by large European utilities. This public-private ownership structure reflects the government’s decision in 2002 to develop strategic partnerships to modernise and strengthen the management of the power sector. Through this initiative, Enel purchased the majority ownership of SE, while E.ON, Rheinisch-Westfälisches Elektrizitätswerk (RWE) and Électricité de France acquired minority interests in the three DSOs.
ZSD operates in the west of the country, in the regions of Bratislava, Trnava, Nitra and Trencin. In 2016, it served 1 119 000 connected consumers and distributed 9 347 gigawatts (GW) of electricity. E.ON owns 49% of the shares.
SSD operates in the central part of the country, in the regions of Žilina, Trencin and a part of Banska Bystrica. In 2016, it had around 740 000 customers and distributed 5 944 GWh of electricity. SSD is owned by Stredoslovenská energetika a.s. (SSE), which in turn is owned 51% by the state and 49% by EPH.
VSD operates distribution networks in the east of the country, in the regions of Košice, Presov and a part of Banska Bystrica. It distributes electricity for more than 630 000 customers. The total volume of electricity distribution for end customers in 2016 was 3 750 GWh. VSD is 49% owned by innogy International Participations N.V. (formerly RWE). Distribution network losses in 2016 were 5.94% for ZSD, 6.06% for SSE-D and 6.59% for VSD.
In addition to the three regional DSOs, 157 holders of electricity distribution licences were also active on the electricity market. These are operators of small local distribution systems.
The country has 193 electricity suppliers. By market share, ZSE Energia, SSE and VSE are the largest suppliers in all consumer categories (Table 6.3) (households, small enterprises and other consumers). They are mainly supplied by SE. Four large industrial customers are directly connected to the transmission grid.
Table 6.3 The largest electricity suppliers by consumer category and market share, 2016
Electricity supplier Households (%) Small companies (%) Other (%)
ZSE Energia 36.9 33.6 26.4
SSE 27.3 26.1 17.2
VSE 20.9 22.0 12.6
SPP 5.9
Slovakia Energy 4.8 14.7
ČEZ Slovensko (2.7) 1.7 11.7
SE Predaj 15.3
Source: MoE.
© O
EC
D/IE
A, 2
018

6. ELECTRICITY
73
EN
ER
GY
SE
CU
RIT
Y Smart grids
In accordance with EU Directives 2009/72/EC and 2009/73/EC, the EU member states are encouraged to modernise distribution networks, for example by introducing smart grids that should be built in a way that encourages decentralised generation and energy efficiency. The Slovak government sees that the introduction of such systems depends on an economic assessment of all the costs incurred and benefits obtained by market participants and on the cost efficiency of each smart metering model as well as the potential schedule for their installation.
The work on smart grids is led by the Managing Committee for Introducing Intelligent Measuring Systems (MC IMS). It has as members the TSO, the three regional DSOs and other important electricity market participants. The MC IMS was founded in 2012 as an advisory body to the Minister of Economy.
The MC IMS is in charge of developing the concept and the legislative framework for intelligent measuring systems and implementing them. Its future work is planned to cover a broader concept of intelligent networks. The MC IMS agenda also includes regular monitoring of the development of employment of the IMS and following the current trends in the area of intelligent measuring technologies.
The IMS deployment project is only at the beginning of its implementation. The programme is focused on the deployment of smart meters to at least 80% of consumers with an annual consumption in excess of 4 MW. By 1 June 2017, about 82 000 IMS (VSD, 26 500; SSD, 33 000; ZSD, 22 500) were installed, which represents around 21% of the target of around 400 000 IMS in 2020.
IMS are expected to benefit consumers, suppliers and DSOs alike. It will enable end consumers to gain access to objective information on their consumption and thus help them optimise their energy costs. For suppliers, the government sees the acquisition of data as the main benefit. For DSOs, the expected benefits include to improve grid conditions and to reduce technical and commercial losses.
Prices and taxes Electricity prices are regulated for vulnerable customers, which include all households and small enterprises. This affects the price comparison with other IEA member countries. Electricity prices in the Slovak Republic are relatively high for industries and relatively low for households (Figures 6.7 and 6.8). In 2017, industry prices were the fourth highest in the comparison, at 129 USD/MWh, whereas household prices were in the lower half at 166 USD/MWh. The ratio between household and industry prices in the Slovak Republic was the fourth lowest after Mexico, Korea and Turkey.
© O
EC
D/IE
A, 2
018

6. ELECTRICITY
74
Figure 6.7 Industry electricity prices in IEA member countries, 2017
Source: IEA (2018c), Energy Prices and Taxes, Second Quarter 2018, www.iea.org/statistics/.
Figure 6.8 Household electricity prices in IEA member countries, 2017
Source: IEA (2018c), Energy Prices and Taxes, Second Quarter 2018, www.iea.org/statistics/.
Price development Electricity price trends are similar in the central European region, but prices in the Slovak Republic are higher than in the neighbouring countries, especially for industry (Figure 6.9). Prices increased rapidly during the decade 2000-10, but in recent years they have declined.
Figure 6.9 Electricity price trends in selected IEA member countries, 1985-2017
Industry Households
Source: IEA (2018c), Energy Prices and Taxes, Second Quarter 2018, www.iea.org/statistics/.
0
40
80
120
160
200USD/MWh Tax component
0
100
200
300
400USD/MWh Tax component
0
50
100
150
200
250
1985 1989 1993 1997 2001 2005 2009 2013 2017
USD/MWh
Slovak Republic Hungary Czech Republic Poland
0
50
100
150
200
250
1985 1989 1993 1997 2001 2005 2009 2013 2017
USD/MWh
© O
EC
D/IE
A, 2
018

6. ELECTRICITY
75
EN
ER
GY
SE
CU
RIT
Y Supplier switching
The process of switching suppliers is usually carried out by a new supplier on the basis of the customer’s authorisation. The process takes 21 days and is possible as of the first day of each month. Mostly because of price regulation, the level of supplier switching has been rather low (Table 6.4).
Table 6.4 Electricity supplier switching rate, 2012-16
Consumer category 2012 2013 2014 2015 2016 Households 3.53% 3.59% 2.58% 2.75% 2.74% Other than households 3.73% 6.93% 4.17% 3.56% 4.24% Total 3.55% 3.99% 2.77% 2.84% 2.92%
Security of supply In accordance with Article 88 of the 2012 Energy Act, the MoE monitors compliance with the security of electricity supply. It assesses the projected balance of supply and demand for the following five-year period. It also assesses the prospects for the security of electricity supply for the five to 15-year period (based on analysis of the TSO SEPS) and annually updates and publishes the Electricity Supply Security Monitoring Report. SEPS is tasked to guarantee a secure, reliable, high-quality and cost-effective operation of the transmission system (Article 28 of the Energy Act).
To ensure the safe and reliable operation of the power system, the TSO follows the principles laid out in the so-called Defence Plan of the electricity system. The Defence Plan is updated every three years and it includes steady-state calculations and dynamic analysis to define the conditions of the power system operation. Further, the Defence Plan includes short-circuit calculations, system protection setting calculations, technical equipment settings, calculations related to voltage regulation and defining a sufficient amount of ancillary services. To ensure that the transmission system operations are safe and reliable and that the amount of ancillary services is sufficient, the TSO analyses and monitors the annual, monthly, weekly and daily preparations in compliance with security criteria (N-1).
In the case of blackouts, the TSO follows a restoration plan that it is also responsible for preparing. SEPS also co-ordinates tests of the national emergency procedures, such as power units’ black-start and islanding operations.
To remove the criterion (N-1) failure, planned actions may be cancelled. If this is not sufficient, then capacity may be curtailed under the Auction Rules.
In the case of frequency deviation from the normal range (49.8 to 50.2 hertz), the TSO will follow its operational instructions. Under this Frequency Plan, measures to be carried out have been negotiated with electricity generators and DSOs.
When determining the individual amount of ancillary services, the following documents are applied:
© O
EC
D/IE
A, 2
018

6. ELECTRICITY
76
obligatory norms of the ENTSO-E Regional Group Continental Europe (RG-CE) Operation Handbook4
expected maximum load for a relevant time period
dynamic load changes in the control area (of the Slovak Republic power system)
dynamic changes of renewable energy sources production in the control area (of the Slovak Republic power system).
Relevant ancillary services are provided under the terms of annual, monthly and daily competitive tendering or under direct long-term contracts. For each trading hour, the required amount of ancillary services is calculated. The amount is sufficiently high to ensure the safe operation of the power system.
In total, 11 failure switches off were recorded in facilities of the TSO in 2016, of which nine were of the E1 type – without damage to the facilities – and two were failures of the E2 type – with damage to the facilities. Combined, these failures led to 616 MWh of electricity not being delivered.
Assessment Nuclear power dominates the electricity generation in the Slovak Republic at 57% of the generation in 2017, followed by renewable energy and waste (25%) and fossil fuels (17%). Coal (11% of the total) continues to decline, despite the provision of a subsidy.
Building on the experience of its electricity market-coupling project with the Czech Republic and Hungary, which has operated since 2012, in November 2014 the Slovak Republic moved forward to market couple with Romania. Since that date, there has been an enhanced regional electricity market with the Slovak Republic’s transmission system connected to all its neighbouring countries except Austria. The development of this regional market has many benefits, which include an improved security of supply for the Slovak Republic.
Assessing generation capacity The Slovak power system is being enhanced and modernised through investments and upgrades at transmission and generation levels. The commissioning of two nuclear units of 470 MW each at the Mochovce nuclear facility – planned for completion in 2018 and 2019 – will increase the share of low-carbon sources in the Slovak electricity generation to beyond 80%. The proposal to construct a new NPP at Jaslovské Bohunice (1 200 MW) would, if proceeded with, further increase the security of supply and the share of low-carbon sources in power generation. However, an investment decision has not yet been made for this project and the expected commissioning date is after 2030.
At the transmission level, the completion of the three planned interconnections between the Slovak Republic and Hungary will strengthen cross-border trading and alleviate congestion. The TSO SEPS has also been upgrading the system at the 400 kV level and improving operation of the networks, through investments in technology to meet the requirements of generation and consumption capacities. 4 https://www.entsoe.eu/publications/system-operations-reports/#continental-europe-operation-handbook.
© O
EC
D/IE
A, 2
018
6. ELECTRICITY
77
EN
ER
GY
SE
CU
RIT
Y Smart grids
The broad deployment of advanced metering infrastructure in the commercial and residential sectors is recognised as one of the ways to improve energy efficiency. Following a cost-benefit analysis, the three main DSOs have embarked on a programme to deploy smart meters. By 1 June 2017 a total of 82 000 metres had been installed and around five times that are planned to be installed by 2020.
Although the smart meter programme is a commendable initiative and will provide consumers with information on usage, on cost-effectiveness grounds the deployment threshold was set above the average household consumption level. Also, the current policy of the regulation of retail electricity prices for households and small and medium-sized enterprises (SMEs) limits the consumer benefits of deployment. It is recommended that on completion of the current phase, the government moves to the wide-scale deployment of smart meters.
The path towards deregulation of retail electricity prices The government has laid the foundations for a competitive environment with the completion of unbundling of the transmission and distribution businesses from generation and retail. The large industry segment of the electricity market has not been regulated and remains the only element of the retail market that is unregulated. All household customers and enterprises with an annual consumption up to 30 MWh are categorised as “vulnerable customers”. The banding of all these customers and SMEs into this crude classification is not based on their economic circumstances.
The price cap method applied to regulating electricity prices sets a price limit that must be applied by all suppliers over the regulatory period. It is, in practice, unclear whether suppliers ever offer prices below the cap. The current regime is a clear disincentive to the development of competition in the retail electricity markets, to energy-efficient behaviour and to investments in the electricity sector at large.
The cost of supports paid to renewable generators is reflected in consumer bills, as is the payment of a subsidy to support coal production and coal-fired power generation. The coal subsidy adds an unjustifiable and discriminatory component to electricity bills, and does not align with national decarbonisation goals. The regulator should develop a clear and transparent price-setting programme for the elimination of administratively determined end-user prices. Protection measures targeted at vulnerable customers and less well-off households should form part of social policy rather than energy policy.
Better aligning distribution network regulation and decarbonisation objectives In 2013, the DSOs ceased to accept requests for distribution grid connections for any kind of generating capacity (renewable or not) of more than 10 kW because of concerns over grid stability and the security of supply. After more than four years, this regulatory measure still applies. The DSOs and other stakeholders need to solve the issues related to the grid integration of variable renewable sources, as the technologies are becoming cost competitive even without subsidies and could then offer the Slovak Republic a low-carbon way to diversify its electricity supply. The Slovak Republic could be inspired by Denmark or Ireland, which accommodate much higher shares of variable renewable sources into their grids without compromising
© O
EC
D/IE
A, 2
018

6. ELECTRICITY
78
electricity security. For the same reason, the government should make resource atlases available for potential investors in solar energy and wind power.
In a positive development in 2013 and 2014, the administrative procedures for installations with up to 10 kW were reduced. Since 2014, legislation has been amended significantly to simplify the process to connect a small power source up to 10 kW for households that cover a large part of their electricity energy consumption by their self-produced electricity energy.
The DSOs are key to enabling a successful energy transition. Network tariffs are used to recover the costs of operating and investing in electricity distribution networks. The recovery of these costs should be fair and designed to incentivise efficiencies in both network use and investment. The composition and methodology used by RONI to set distribution network tariffs is an issue of concern for certain power generators. Specifically, the current capacity-based network tariff is biased against non-baseload generation (e.g. solar energy, hydropower and self-generation). The tariff should be non-distortionary, avoid cross-subsidisation between customer classes, and be transparent and predictable with the network costs recovered efficiently and fairly. RONI should review the current tariff structure to ensure an efficient and fair allocation of costs among all categories of generation, and thereby avoid punitive tariffs for low-carbon non-baseload generators.
Recommendations The government of the Slovak Republic should:
Continue to support the development of the regional electricity market to strengthen the security of supply and competition in the wholesale market.
Give priority to the infrastructure developments that implement interconnection projects and modernise and enhance the transmission system, with particular regard to the alleviation of congestion on the Hungarian border.
Develop a clear and transparent programme to eliminate the administratively determined end-user prices for a new regulatory period. Protect vulnerable customers and less well-off households through social policy rather than energy policy.
Encourage the regulator to monitor actively the consumer benefits of deploying smart meters, with a view to introducing a time-bound programme to define further options to deploy them.
Review the capacity-based tariff structure for power generators to avoid punitive tariffs for low-carbon non-baseload generation, while taking account of the Council of European Energy Regulators Guidelines of Good Practice on Electricity Distribution Network Tariffs5.
5 https://www.ceer.eu/documents/104400/-/-/1bdc6307-7f9a-c6de-6950-f19873959413.
© O
EC
D/IE
A, 2
018

6. ELECTRICITY
79
EN
ER
GY
SE
CU
RIT
Y
References
EC (European Commission) (2017), Energy Union Factsheet Slovak Republic, EC, Brussels.
ENTSO-E (2018), Forecasted Transfer Capacities – Year Ahead, ENTSO-E, Brussels, https://transparency.entsoe.eu/transmission-domain/ntcYear/show
IEA (International Energy Agency) (2018a), World Energy Balances 2018 [database], OECD/IEA, Paris, www.iea.org/statistics/.
IEA (2018b), Electricity Information 2018 [database], OECD/IEA, Paris, www.iea.org/statistics/.
IEA (2018c), Energy Prices and Taxes, Second Quarter 2018 [database], OECD/IEA, Paris, www.iea.org/statistics/.
MoE (Ministry of Energy) (2014), Energy Policy of the Slovak Republic, MoE, Bratislava, http://www.economy.gov.sk/uploads/files/47NgRIPQ.pdf.
RONI (Regulatory Office for Network Industries) (2017), National Report 2016, RONI, Bratislava.
© O
EC
D/IE
A, 2
018

© O
EC
D/IE
A, 2
018

81
EN
ER
GY
SE
CU
RIT
Y
7. Nuclear
Key data (2017 provisional)
Number of reactors: Four pressurised water reactors, operated by Slovenské Elektrárne a.s.
Installed capacity: 1.94 GW (two reactors of 500 MW and two reactors of 470 MW)
Electricity generation: 15.1 TWh, -1% since 2007
Share of nuclear: 23.6% of TPES, 60.1% of domestic energy production, 57.4% of electricity generation
Overview Nuclear power accounted for 57% of the total electricity generation in the Slovak Republic in 2016, the second-highest share among the International Energy Agency (IEA) member countries (and in the world) after France (Figure 7.1). In addition to the four operating reactors, two new ones are being built and expected to be commissioned in 2018 and 2019. The four nuclear units in operation and the two under construction are owned by Slovenské Elektrárne (SE).
Figure 7.1 Share of nuclear in electricity generation in IEA member countries, 2016
Source: IEA (2018), World Energy Balances 2018, www.iea.org/statistics/.
Nuclear energy power plants The first nuclear power plant (NPP) in the Slovak Republic (then part of Czechoslovakia) was built at the Bohunice site (about 55 kilometres [km] northeast of Bratislava)
0%
20%
40%
60%
80%
© O
EC
D/IE
A, 2
018

7. NUCLEAR
82
(Table 7.1). Known as Bohunice A1, this 110-megawatt electrical (MWe) heavy water moderated, gas cooled reactor (HWGCR) was built by Škoda Works (then a state‐owned heavy engineering enterprise). The reactor operated only from 1972 to 1977.
Construction of two Water-Water Energetic Reactor (VVER)‐440 reactors, Bohunice V1 units 1 and 2, began at the same site in 1972. Supplied by Atomenergoexport of the Soviet Union in co-operation with Škoda, these used the first-generation V‐230 version of the VVER‐440. They began operation in 1978 and 1980. They continued to operate until 2006 and 2008, respectively, when they were shut down as a condition of the Slovak Republic’s accession to the European Union. After the shutdown of the Bohunice VI units 1 and 2, the Slovak Republic became a net importer of electricity.
A further two VVER‐440s, Bohunice V2 units 1 and 2, were built from 1976. Škoda was the main contractor for these units, which used the later V‐213 design of VVER‐440. They entered operation in 1984 and 1985, and are still in service. Their capacity was increased from the original 440 MWe (gross) to 505 MWe in 2010. The Bohunice units will reach 40 years of operation in 2025. SE plans to apply to extend their lifetime to 2045, but these plans have not yet been finalised.
Work started in 1983 on a further two V‐213 reactors at the Mochovce site (some 100 km east of Bratislava). In 1986, the construction of two more units, Mochovce 3 and 4, began at the same site. Construction was delayed by the major political and economic changes that occurred after 1989 and was halted completely in 1992. Work on units 1 and 2, which include safety upgrades from the original design, restarted in 1996 with the involvement of French and German companies. These two units eventually started up in 1998 and 1999. Their capacity was uprated from the original 440 MWe (gross) to 470 MWe (gross) in 2008.
Table 7.1 NPPs in the Slovak Republic
Plant Technology type
Power original (MWe)
Power uprated (MWe)
Present status Owner/licensee Start-up year
Bohunice A1 HWGCR 110 - Decommissioning JAVYS 1972
Bohunice V1 VVER 213 2 × 440 - Decommissioning JAVYS 1978-80
Bohunice V2 VVER 213 2 × 440 2 × 505 Operation SE 1984-85
Mochovce 1&2 VVER 230 2 × 440 2 × 470 Operation SE 1998-99
Mochovce 3&4 VVER 230 2 × 440 2 × 470 Under construction
SE
Construction of the Mochovce 3 and 4 units resumed in 2009. After the separation of Czechoslovakia in 1993, all the Slovak NPPs belonged to the state‐owned SE. In 2006, the Slovak government sold a 66% stake in SE to Enel, a major Italian utility under the condition that Enel would have to complete the construction of units 3 and 4. The units are expected to start operating in 2018 and 2019. A roughly five-year delay over previous forecasts was due to financing difficulties. These units are also expected to be uprated from 440 MWe to 470 MWe once they commence operation.
A new 1 200 MWe reactor unit has been proposed for the Bohunice site. Jadrová energetická spoločnosť Slovenska (JESS), which was created in 2006, leads this project. An environmental impact assessment was completed in 2016. A financing
© O
EC
D/IE
A, 2
018

7. NUCLEAR
83
EN
ER
GY
SE
CU
RIT
Y arrangement for the new reactor project has not yet been worked out. If built, this plant
is expected to be commissioned after 2030.
Power generation Nuclear power generation has increased and decreased in steps, as new reactors have been commissioned and old ones decommissioned (Figure 7.2). In 2017, nuclear power generation was 15.1 terawatt hours (TWh). This was 16% lower than in the peak year of 2006, before the Bohunice V1 units were shut down.
Figure 7.2 Nuclear power generation and share in electricity generation, 1973-2017
Source: IEA (2018), World Energy Balances 2018, www.iea.org/statistics/.
Policy developments The 2014 Energy Policy of the Slovak Republic (MoE, 2014) specifies the goals for installed capacity as well as priorities in the energy sector to 2035. It calls for the Slovak Republic to become a net exporter of electricity and, to this end, for the safe and reliable use of nuclear energy as a zero-carbon source of energy. The construction of a new 1 200 MWe reactor at Bohunice is specified as one of the measures to increase energy security (see above). The National Policy and Programme on Handling of Spent Nuclear Fuel and Radioactive Waste in the Slovak Republic was approved in July 2015. A new model for contributions to the National Nuclear Fund (Národný jadrový fond [NJF]) was created to ensure the contributions will cover the total decommissioning and waste management costs. The related law was expected to come into force in January 2019.
Institutional and organisational structure The reactors in operation and under construction are owned by SE. SE, created at the time of the split of Czechoslovakia, was initially a state-owned company, but in 2006, the government sold 66% of SE to the Italian utility Enel. In 2016, a Czech energy company, Energeticky a Prumyslovy Holding (EPH), acquired 50% of Enel’s shares in SE, which created a three-way ownership structure. Under the current structure, the shares initially wholly owned by Enel are now held by Slovak Power Holding (SPH) – with Enel and EPH each holding 50% of these shares. EPH has the option to buy Enel’s remaining shares after Mochovce units 3 and 4 complete one year of operation.
0%
20%
40%
60%
80%
0
5
10
15
20
25
1973 1977 1981 1985 1989 1993 1997 2001 2005 2009 2013 2017
TWh Nuclearpowergeneration
Share intotal powergeneration
Commissioning Bohunice V2 (two reactors)
Upgrading Mochovce and Bohunice V2
Commissioning Bohunice V1(two reactors)
Commissioning Mochovce(two reactors)
Decommissioning Bohunice V1
© O
EC
D/IE
A, 2
018

7. NUCLEAR
84
Under the new arrangement, Enel is responsible for the completion of Mochovce units 3 and 4 and EPH will be responsible for operating the units.
The waste management and decommissioning activities, previously under the purview of SE, were separated at the time of the sale to Enel. They are now attributed to a state-owned nuclear decommissioning company, Jadrová a vyraďovacia spoločnosť (JAVYS). JAVYS owns all three reactors that have been shut down (Bohunice A1 and Bohunice V1 and V2). JAVYS also owns and operates a facility for the treatment of low and intermediate waste at Bohunice, a liquid radioactive waste (RAW) final treatment facility at Mochovce, a near-surface repository for the final disposal of low and very low-level RAW at Mochovce and an interim spent fuel storage (ISFS) facility at Bohunice. A second ISFS at Mochovce is expected to begin operations in 2018.
JAVYS’s decommissioning and spent fuel (SF) management activities are funded by the NJF. The fund was created in 2006 to replace an earlier fund created in 1995. It is an independent legal entity under the Ministry of Economy. It is governed by a board of trustees, a supervisory board, director and auditors. Government Regulation 312/2007 Coll. contains the method of collection and payment of compulsory contributions to the NJF. Payments into the NJF are made by SE. JAVYS receives payments for its activities from the NJF.
In 2006, JESS was created to build a 1 200 MWe unit at the Bohunice site. The state-owned company JAVYS owns 51% of JESS, and the remaining 49% is held by the Czech energy company ČEZ.
Safety and security of the operating reactors as well as SF management is regulated by Úrad jadrového dozoru (ÚJD), the independent regulatory body that reports directly to the prime minister. ÚJD grants operating licences for the NPPs. Operating licences are renewed after carrying out periodic safety reviews (PSRs). PSRs were carried out in Bohunice in 2008 and in Mochovce in 2011 and again at the Bohunice reactor units in 2016.
The Ministry of Health is responsible for the occupational and health safety of workers at nuclear installations.
Other institutions (RELKO, DECOM Slovakia, VUEZ, Slovak Technical University and the Slovak Academy of Sciences etc.) also support the nuclear programme.
Nuclear energy fuel cycle and RAW management All nuclear fuel in the Slovak Republic is supplied by the Russian Federation (hereafter Russia) company TVEL. Long-term contracts with TVEL cover the supply of uranium, enrichment and fabrication of fuel elements. Although efforts have been made to diversify the fuel supply – for example from France – TVEL continues to be the sole global supplier of fuel for VVER-440 type reactors. One possibility to diversify the fuel supply is to make use of the uranium deposits in the eastern part of the country. These are currently not exploited.
Spent fuel is initially stored for three to seven years in the SF pools at each reactor. Before 1987, it was returned to the Soviet Union, but subsequently it was transferred to an ISFS facility near Bohunice, now operated by JAVYS. The ISFS, which became
© O
EC
D/IE
A, 2
018

7. NUCLEAR
85
EN
ER
GY
SE
CU
RIT
Y operational in 1986, is a wet storage facility. It was initially designed to store cooled SF
for a ten-year period, but in 2000 the storage period was extended to 50 years. Together, these two facilities are expected to have sufficient capacity for the interim storage of fuel from the operating reactors, as well as from those under construction, until a final disposal option is determined.
The long-term goal for SF management is to build a deep geological repository for SF storage. JAVYS has been developing plans to create such a repository since 1996. Five candidate sites were identified and the initial site work was carried out, but this process was halted in 2001. A more recent policy created in 2008 calls for the exploration of shared regional as well as international disposal options alongside the national repository plan. A final decision on the final disposal of spent nuclear fuel is not expected until 2020.
Costs for SF storage, disposal and decommissioning are all borne by SE, the producer, through payments made to the NJF. Payments made to the NJF are from the income of the licensee, charges to transmission and distribution system operators (DSOs) and charges on the total nuclear capacity.
Safety After the Fukushima Daiichi nuclear accident in March 2011, the Slovak NPPs underwent a comprehensive assessment of safety as part of the “Stress Tests”, whose methodology and scope were jointly determined by the European Commission and the European Nuclear Safety Regulators Group. In April 2012, the European Commission issued a summary report on the stress tests and also approved country-specific reports that contained recommendations for each country. Based on this report, the national nuclear safety regulator ÚJD and SE developed a joint action plan to implement the recommendations. The action plan contains short- and medium-term recommendations and additional measures to be implemented by 2013, 2015 and beyond 2015. The recommendations were further divided into three categories: natural hazards, loss of safety systems and severe accident management. The nuclear safety regulator ÚJD inspected the plant in 2013 and 2014 and verified the implementation of the recommendations.
Assessment Fuel diversification All European Union member states that use nuclear energy are required to ensure a diversified portfolio of fuel supply to increase the security of supply and to avoid unilateral dependency on a single supplier. Given the ageing and thus fading presence of VVER-440 type reactors globally, the Slovak Republic has taken steps to diversify its fuel supply. Uranium supplied from a different (not Russian) source can fulfil the requirements of the European Commission on the diversification of fuel sources.
Based on the 2015 National Policy and Programme on Handling of Spent Nuclear Fuel and Radioactive Waste in the Slovak Republic, the government has opted for an open cycle with the direct domestic disposal of SF and high-level RAW. Therefore, there is no
© O
EC
D/IE
A, 2
018

7. NUCLEAR
86
need to improve and/or create transportation solutions for SFs. Currently, non-irradiated fuel elements can be transported to the Slovak Republic by railway and air transfer, so the transportation method is already diversified. Given the ongoing conflict between Russia and Ukraine, it is essential for all member states that use Russian-type reactor technology coupled with a long-term fuel supply contract from Russia to create an alternative railway transportation route.
Ownership structure of the JESS project company The high share of nuclear power in domestic electricity supply means it is essential to have a clear and direct policy on the financial and ownership structure of the possible additional unit at the Bohunice site.
The NPP project, for which the environmental impact assessment was issued in April 2016, is owned by JESS. The controlling 51% share of JESS is held by the state-owned JAVYS, which is responsible for and entrusted with decommissioning, radioactive waste and SF management. JAVYS receives financial resources from the NJF’s yearly budget for carrying out its core activities.
National Nuclear Energy Fund The current contribution system to the NJF is linked to built-in capacity, income of the licensee and transmission system operator and distribution system operator charges. It would be beneficial to take into account the estimated and technology-specific decommissioning cost, and the specificities and quantity of RAW and SF as well. For example, the licensee of the NPP must contribute to the fund 5.95% of the electricity sales price over the previous year, but as the price is exposed to market volatility, the actual contribution may vary strongly. Thus, it does not constitute a firm basis for the finances of the decommissioning, RAW and SF management.
The government has realised that the current calculation methodology does not ensure the proper structure and eligibility of funding to perform these activities. Therefore, it is preparing legislation that uses a different approach to accumulate sufficient funds over the years of operation and to customise the amount of contribution to the characteristics of the NPPs.
Preparing the regulatory system to construct a new unit A possible scenario for the Slovak nuclear programme is that both Bohunice units are granted life extensions along with the construction of a new 1 200 MWe at the same site. If the new 1 200 MWe reactor comes on line in or after 2025 and the Bohunice units are granted a 20-year life extension from 2025 to 2045, there will be up to a 20-year period in which all three reactors are operational. Under this scenario, significant upgrades to the transmission network will be needed.
The envisaged additional capacity at the Bohunice site requires the nuclear regulator, ÚJD, to have further regulatory power, expertise and human resources to perform its tasks (such as to license civil construction, verify supplier eligibility and control the content of the detailed technical plan). Such projects need strong centralised co-ordination of the regulatory work, a well-defined split of responsibility and a smooth co-operation between the different regulatory bodies and authorities.
© O
EC
D/IE
A, 2
018

7. NUCLEAR
87
EN
ER
GY
SE
CU
RIT
Y The addition of a NPP with a new design will necessitate that the nuclear safety regulator
equip itself to evaluate and license a new design. These regulatory activities are likely to occur simultaneously with life-extension activities at the Bohunice units. The regulator should ensure that it has sufficient staff as well as in-house expertise to regulate and license both the new reactor design and the life-extension activities.
Financing structure of the new unit In the current market conditions, very few NPP projects are based on private investment. Furthermore, the investment is capital intensive, with a linear return over the lifetime. The 60-year commitment requires very careful planning by the investor, with the aim to ensure the long-term security of supply.
For the planned new unit at the Bohunice site, it is essential to have a clear strategy on the ownership structure and financing. The Slovak Republic is considering further steps to develop this project. To launch a tendering process for the construction of the NPP, there is a strong need to create a firm financing structure, backed by feasibility studies and calculations on the project’s financial viability. Also, governance and regulatory structures need to be created to manage the project.
Nuclear energy waste management A plan for the final disposal for nuclear waste has not yet been established. There continues to be an interest in identifying a regional or international solution for the final disposal of SF and a decision has been deferred until 2020. Several European countries, however, have prioritised the final disposal of nuclear waste and identified a site for or started construction of a geological repository. A greater emphasis is needed to identify a final SF disposal solution and a technical assessment of the alternatives to determine whether the current NJF and projected payments into it will be sufficient for the chosen solution.
Recommendations The government of the Slovak Republic should:
Ensure that the new legislation on the NJF management duly applies the polluter-pays principle and covers the estimated total cost of decommissioning, radioactive waste and SF management over the lifetime of each unit, as proposed in the draft law on the NJF.
Assess the needs of the regulatory system to provide for a possible licensing process of a completely new unit at the Bohunice site, and update the capabilities of the regulator where needed.
Clarify the ownership and financing structure of the new Bohunice NPP project, which includes the role of the state, before a tendering process for the NPP construction is launched.
© O
EC
D/IE
A, 2
018

7. NUCLEAR
88
References
IEA (International Energy Agency) (2018), World Energy Balances 2018 [database], OECD/IEA, Paris, www.iea.org/statistics/.
MoE (Ministry of Energy) (2014), Energy Policy of the Slovak Republic, MoE, Bratislava, http://www.economy.gov.sk/uploads/files/47NgRIPQ.pdf.
© O
EC
D/IE
A, 2
018
89
EN
ER
GY
SY
STE
M T
RA
NS
FOR
MA
TIO
N
8. Energy and climate change
Key data (2016)
GHG emissions without LULUCF*: 41.1 MtCO2-eq, -45% since 1990
GHG emissions with LULUCF*: 34.2 MtCO2-eq, -46% since 1990
CO₂ emissions from fuel combustion: 30.2 MtCO₂, -45% since 1990
CO₂ emissions by fuel: coal 39.5%, oil 31.0%, natural gas 25.7%, other 3.9%
CO₂ emissions by sector: industry 24.2%, transport 22.4%, power and heat generation 21.8%, other energy industries 17.1%, residential 8.8%, commercial 5.9%
CO₂ (energy-related) intensity per GDP: 0.19 kgCO₂/USD GDP PPP (IEA average 0.24)
Exchange rate: euro: EUR 1 = USD 1.12 (2017) * UNFCCC data (SHMU, 2018). LULUCF = Land use, land-use change and forestry.
Overview Since 1990, the Slovak Republic’s energy-related greenhouse gas (GHG) emissions have fallen by over half as a result of the overall decrease in energy consumption driven by economic restructuring and a transition towards low-carbon energy technologies, such as hydropower, bioenergy and nuclear power. In 2016, the Slovak Republic’s GHG emissions totalled 41.1 million tonnes of carbon dioxide equivalent (MtCO2-eq). Energy-related emissions, including the transport sector, accounted for 67% of total GHG emissions, followed by industrial processes (23%), agriculture (6%) and the waste sector (4%) (Figure 8.1).
As for emissions by gas, carbon dioxide (CO₂) dominates GHG emissions at 83% of the total, followed by methane (CH4) at 11%, nitrous oxide (N2O) at 5% and the so-called F-gases (mainly hydrofluorocarbons [HFCs] and sulphur hexafluoride [SF6] produced exclusively for industrial processes) at 2%. F-gases were the only sources that increased from 1990 to 2015 (Figure 8.2).
The Slovak Republic is already below its 2020 GHG target for the sectors outside the European Union (EU) Emissions Trading Scheme (ETS) and these emissions are projected to decline by 23% from 2005 to 2020 with existing measures. The government has proposed more ambitious long-term measures to put the country well on track to meet the post-2020 target in line with the Paris Agreement.
© O
EC
D/IE
A, 2
018

8. ENERGY AND CLIMATE CHANGE
90
Figure 8.1 GHG emissions by sector, 1990 and 2016
Note: Only CO2, CH4 and N2O are included in the calculations. * Energy includes emissions from transport, manufacturing and construction. Source: SHMI (2018), National Inventory Report 2018, https://unfccc.int/documents/65459.
Figure 8.2 GHG emissions by gas, 1990 and 2016
* Others include the F-gases – HFCs, perfluorocarbons (PFCs) and SF6. Source: SHMI (2017), National Inventory Report 2017, http://unfccc.int/national_reports/annex_i_ghg_inventories/national_inventories_submissions/items/10116.php.
Energy-related CO2 emissions CO2 accounts for 92% of the energy-related emissions.The following sections look specifically at energy-related CO2 emissions.
Emissions by sector and fuel In 2016, fuel combustion in different sectors resulted in 30.2 million tonnes carbon dioxide (MtCO2) from energy-related emissions, down by 17% from 2006 and by 45% from 1990. Over the past decade, carbon emissions have decreased in all sectors, except for transport.
By sector, the largest emitters are industry (24.2%), transport (22.4%) and power and heat generation (17.4%) (Figure 8.3). Iron and steel production accounts for over half of industrial emissions, and this mostly comes from the U. S. Steel Košice plant, the single largest emitter in the country. From 2006 to 2016, emissions declined by 35% in power and heat generation and by 13% in industry, mainly as a result of fuel switching to biofuels. Transport emissions, however, increased by 11%, which corresponds to the
0
10
20
30
40
50
60
Energy* Industrial processes Agriculture Waste
MtCO2-eq.
1990
2016
-5%
-51%
-60%11%
0
20
40
60
80
CO2 CH4 N2O Others*
MtCO2-eq.
1990
2016-45%
-38%-61%
121%
CO2 CH4 N2O
© O
EC
D/IE
A, 2
018

8. ENERGY AND CLIMATE CHANGE
91
EN
ER
GY
SY
STE
M T
RA
NS
FOR
MA
TIO
N increased energy demand. Road transport accounts for 94% of the total transport
emissions, mainly from the combustion of diesel and gasoline. Rail transport is largely electrified, and there is little domestic aviation or navigation in the country.
Figure 8.3 Energy-related CO2 emissions by sector, 1973-2016
* Other energy industries includes emissions from blast furnaces, oil refineries, coke ovens, oil and gas extraction and coal mines. ** Industry includes CO2 emissions from combustion at construction and the manufacturing industries. *** Commercial includes commercial and public services, agriculture/forestry and fishing. Source: IEA (2018), CO2 Emissions from Fuel Combustion 2018, www.iea.org/statistics/.
The remaining energy-related CO2 emissions are from other energy industries, such as blast furnaces, oil refineries and coke ovens, plus small shares from the commercial and residential sectors. In the past decade, the residential sector’s emissions were reduced by 19%, mainly thanks to strong governmental support for energy savings in buildings, particularly on their thermal performance through improved insulation and renovation.
By fuel, coal accounted for 39.5% of the total energy-related CO2 emissions in 2016, followed by oil (31.0%) and natural gas (25.7%) (Figure 8.4). Coal combustion emits the most CO2 in both industry and power and heat generation, whereas oil-related emissions are largely from the transport sector. From 2006 to 2016, only the emissions from oil increased, and its share of the total rose from 22.0% to 31.0% as the consumption in transport grew. Natural gas is used in many parts of the energy system, but its use and the related emissions are particularly dominant in the residential and commercial sectors.
Figure 8.4 Energy-related CO₂ emissions by fuel type, 1973-2016
* Other includes emissions from non-renewable waste combustion. Source: IEA (2018), CO₂ Emissions from Fuel Combustion 2018, www.iea.org/statistics/.
0
10
20
30
40
50
60
1973 1976 1979 1982 1985 1988 1991 1994 1997 2000 2003 2006 2009 2012 2015
MtCO₂Power and heat generation
Other energy industries*
Industry**
Transport
Residential
Commercial***
0
10
20
30
40
50
60
1973 1976 1979 1982 1985 1988 1991 1994 1997 2000 2003 2006 2009 2012 2015
MtCO₂
Oil
Natural gas
Coal
Other*
© O
EC
D/IE
A, 2
018
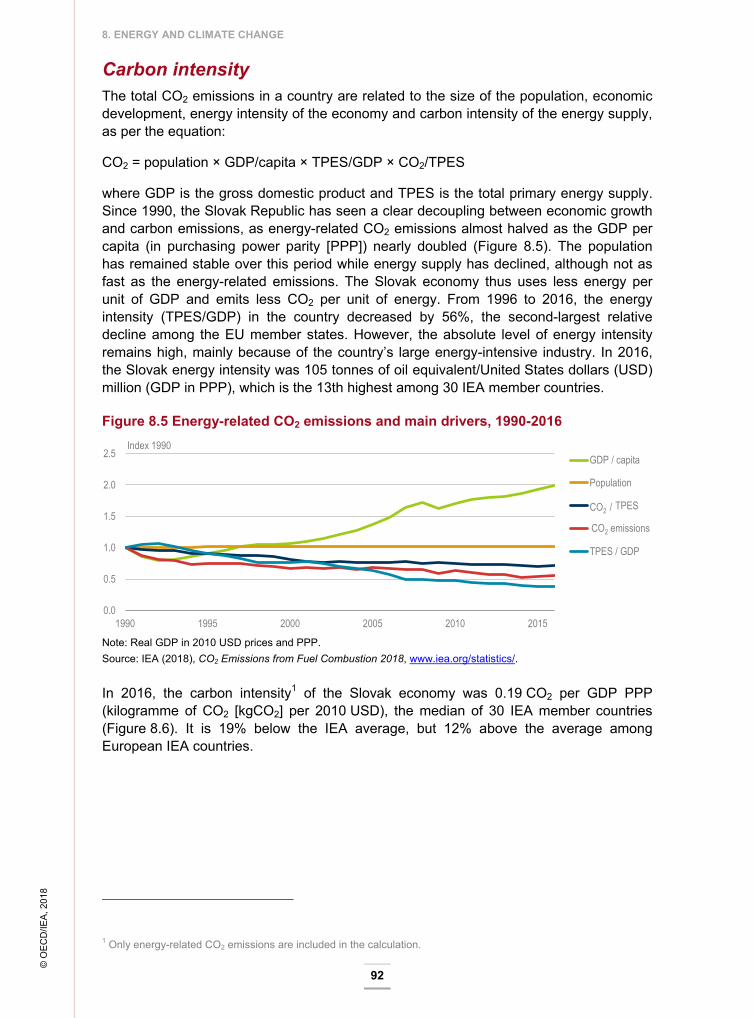
8. ENERGY AND CLIMATE CHANGE
92
Carbon intensity The total CO2 emissions in a country are related to the size of the population, economic development, energy intensity of the economy and carbon intensity of the energy supply, as per the equation:
CO2 = population × GDP/capita × TPES/GDP × CO2/TPES
where GDP is the gross domestic product and TPES is the total primary energy supply. Since 1990, the Slovak Republic has seen a clear decoupling between economic growth and carbon emissions, as energy-related CO2 emissions almost halved as the GDP per capita (in purchasing power parity [PPP]) nearly doubled (Figure 8.5). The population has remained stable over this period while energy supply has declined, although not as fast as the energy-related emissions. The Slovak economy thus uses less energy per unit of GDP and emits less CO2 per unit of energy. From 1996 to 2016, the energy intensity (TPES/GDP) in the country decreased by 56%, the second-largest relative decline among the EU member states. However, the absolute level of energy intensity remains high, mainly because of the country’s large energy-intensive industry. In 2016, the Slovak energy intensity was 105 tonnes of oil equivalent/United States dollars (USD) million (GDP in PPP), which is the 13th highest among 30 IEA member countries.
Figure 8.5 Energy-related CO2 emissions and main drivers, 1990-2016
Note: Real GDP in 2010 USD prices and PPP. Source: IEA (2018), CO2 Emissions from Fuel Combustion 2018, www.iea.org/statistics/.
In 2016, the carbon intensity1 of the Slovak economy was 0.19 CO2 per GDP PPP (kilogramme of CO2 [kgCO2] per 2010 USD), the median of 30 IEA member countries (Figure 8.6). It is 19% below the IEA average, but 12% above the average among European IEA countries.
1 Only energy-related CO2 emissions are included in the calculation.
0.0
0.5
1.0
1.5
2.0
2.5
1990 1995 2000 2005 2010 2015
Index 1990GDP / capita
Population
CO2/ TPES
CO2 emissions
TPES / GDP
CO2 emissions
CO2 /
© O
EC
D/IE
A, 2
018

8. ENERGY AND CLIMATE CHANGE
93
EN
ER
GY
SY
STE
M T
RA
NS
FOR
MA
TIO
N Figure 8.6 Energy-related CO2 emissions per unit of GDP in IEA member countries,
2016
Source: IEA (2018), CO2 Emissions from Fuel Combustion 2018, www.iea.org/statistics/.
Compared with the neighbouring Visegrád countries, the Hungarian economy is slightly less carbon-intensive than the Slovak Republic’s, whereas both the Czech Republic and Poland have much more carbon-intensive economies (Figure 8.7). This is mostly explained by different dominant sources for electricity generation; nuclear for Hungary and the Slovak Republic, but coal for the Czech Republic and Poland (Figure 8.8).
Figure 8.7 Energy-related CO2 emissions per unit of GDP in the Slovak Republic and in other selected IEA member countries, 1973-2016
Source: IEA (2018), CO2 Emissions from Fuel Combustion 2018, www.iea.org/statistics/.
Figure 8.8 Carbon intensity of power and heat generation in the Slovak Republic and in other selected IEA member countries, 1973-2016
Source: IEA (2018), CO2 Emissions from Fuel Combustion 2018, www.iea.org/statistics/.
0
0.1
0.2
0.3
0.4
0.5kgCO₂/USD GDP PPP
0.0
0.2
0.4
0.6
0.8
1.0
1.2
1.4
1973 1976 1979 1982 1985 1988 1991 1994 1997 2000 2003 2006 2009 2012 2015
kgCO₂/USD GDP PPP
Czech Republic
Poland
Slovak Republic
Hungary
IEA Europe
0
0
200
400
600
800
1000
1973 1976 1979 1982 1985 1988 1991 1994 1997 2000 2003 2006 2009 2012 2015
gCO2/kWh
Poland
Czech Republic
IEA Europe
Hungary
Slovak Republic
0
© O
EC
D/IE
A, 2
018
8. ENERGY AND CLIMATE CHANGE
94
In 2016, the Slovak Republic’s CO2 intensity in power and heat generation was 169.6 grammes of CO2 per kilowatt-hour (gCO2/kWh), 25% less than in 2006. The Slovak carbon intensity of power and heat generation has remained substantially lower than in its neighbouring countries since 1990.
Institutions The Ministry of Environment (ME) is the main body responsible for developing and implementing the national environmental policy, which includes on climate change and air protection. The ME adopted the National Sustainable Development Strategy of the Slovak Republic in 2001, which articulated the key domestic climate change targets. In 2014, the ministry also approved the preparation of the Low-Carbon Development Strategy of the Slovak Republic until 2030. The Climate Change Policy Department of the ME is the national focal point for the United Nations Framework Convention on Climate Change (UNFCCC).
The High Level Committee for Co-ordination of Climate Change Policy (2011) is responsible for developing, implementing and evaluating the climate mitigation and adaptation policies. It also submits an annual report to update the country’s status on climate change policy, commitments and their progress.
The Slovak Hydrometeorological Institute (SHMI), Department of Emissions and Biofuels, is the agency authorised by the ME as the main co-ordinator of monitoring and reporting the annual inventory of GHG emissions and sinks.
The Ministry of Economy mainly deals with the national energy policy, which includes energy efficiency and the development of renewable energy. The 2014 Energy Policy aims to ensure the sustainability and reliability of energy supply, efficient energy utilisation at optimum costs and environmental protection.
Climate change policies and measures GHG targets The Slovak Republic is a Party to the UNFCCC. The government ratified the Kyoto Protocol in 2002 and the Paris Agreement in 2016. For the first five-year commitment period of the Kyoto Protocol (2008-12), the Slovak Republic was not a part of the EU-15 Burden‐Sharing Agreement, but committed itself to reducing its emissions by 8% from the base year level (1990). The Slovak Republic has overachieved this target and received considerable benefits from the tradable emissions allowances.
For the second Kyoto commitment period (2013-20), as part of the EU goal to reduce GHG emissions by at least 20% from 1990 to 2020, the Slovak Republic must limit the increase in GHG emissions from sectors outside the EU ETS to 13% from 2005 to 2020. To comply with this commitment, the Slovak Republic must meet the binding annual GHG limits, known as Annual Emissions Allocations (AEAs) (Table 8.2). The EU ETS sector has a European Union-wide emissions reduction target of -21% from 2005 to 2020 (see below).
© O
EC
D/IE
A, 2
018

8. ENERGY AND CLIMATE CHANGE
95
EN
ER
GY
SY
STE
M T
RA
NS
FOR
MA
TIO
N Beyond 2020, the European Union has agreed to decrease total GHG emissions by at
least 40% from 1990 to 2030. This joint commitment is stipulated in the Nationally Determined Contribution of the European Union and its member states under the Paris Agreement. The sectors under the EU ETS shall reduce emissions by 43% in 2030 compared to 2005, and non-ETS sectors by 30%. For the Slovak Republic, the non-ETS obligation is -12% from 2005 to 2030.
The country is on track to meet its 2020 and 2030 international commitments for GHG mitigation (SHMI, 2017). The positive outlook is partly thanks to the Slovak government’s proactive policy support, but also to emission targets that were set rather low initially.
Policy overview The Slovak Republic’s climate change policy and measures are guided by EU regulations and directives. Following the EU 2020 Climate and Energy Package, the new goals set under the 2030 Climate and Energy Framework will apply to the Slovak Republic, along with a new set of long-term policies and measures, such as the Energy Roadmap 2050.
Indirectly, policies that aim to improve energy efficiency (Chapter 9) and increase the share of renewable energy also help limit GHG emissions (Chapter 10). Standards on air quality and fuel quality also help mitigate climate change.
At a national level, the Seventh National Communication of the Slovak Republic on Climate Change under the UNFCCC provides the most updated overview of the country’s climate change policies. Also, a national strategy for environmental policy until 2030 – Envirostrategy 2030 – is being drafted by the ME. In addition, the government is collaborating with the World Bank to formulate its long-term low-carbon development paths to 2050. The government is also considering whether to introduce a carbon tax and to revise energy tax exemptions that hinder effective carbon pricing.
Emissions Trading Scheme The EU ETS (Box 8.1) is both the Slovak Republic’s primary tool for carbon pricing and a central policy tool to mitigate GHG emissions. Act No. 414/2012 Coll. on Emission Trading sets an overarching framework for the country’s ETS sector throughout 2013-20. The Act, composed of 40 articles, includes the following key provisions:
allowances are distributed for free for industrial facilities at risk of carbon leakage
free allowance for district heat facilities will decrease from 80% in 2013 to 30% in 2020
electricity generators no longer receive free allowances.
The new allocation rules have helped to save energy, switch fuels and decrease air pollution. Since 2015, under EU State Aid rules, the Slovak Republic may grant state aid to domestic electricity-intensive industries to compensate for the electricity costs that have increased because of costs related to CO2 emissions. The aid is financed from revenue from the allowance auctions.
Phase III of the National Allocation Plan (2013-20) introduced several changes to the EU ETS, which included auctioning as a new instrument to distributing allowances. Preliminary auctioning commenced in 2012 with 120 million EU Allowances (EUAs), among which the Slovak Republic accounted for 1.8 million (Table 8.1). Since 2015, the
© O
EC
D/IE
A, 2
018

8. ENERGY AND CLIMATE CHANGE
96
generated revenues have been used as the main income for the Environmental Fund of the Slovak Republic.
Table 8.1 The Slovak Republic revenue from auctions, 2012-16 (EUR)
Period 2012 2013 2014 2015 2016
Revenue (EUAs) 12 193.3 61 702.6 57 590.6 84 312.1 64 991.4
Revenue (EUAAs) - - 44.6 197.3 55.8
Total revenue 12 193.3 61 702.6 57 635.2 84 509.4 65 047.2
Note: EUAAs = EU Aviation Allowances. Source: ME (2017), 3rd Biennial Report of the Slovak Republic, 2017.
Box 8.1 The EU Emissions Trading System
The EU Emissions Trading System (ETS) is one of the key tools for limiting greenhouse gas emissions in the European Union. It operates in 31 countries and applies to more than 11 000 power plants and industrial facilities as well as airlines operating between these countries, covering around 45% of the European Union's GHG emissions.
The EU ETS works as a “cap and trade” system. A cap is set on the total amount of certain GHGs that can be emitted by installations covered by the system. The cap is reduced over time, ensuring that total emissions fall. Within the cap, companies obtain emission allowances, which they can trade with one another. Trading brings flexibility that stimulates emissions reductions at least cost.
Every year, a company must submit enough allowances to cover all its emissions, otherwise it is fined. If a company reduces its emissions more than it has allowances for, it can keep the spare allowances to cover its future needs or sell them to another company.
In 2013-20 the EU ETS operates in its third phase, which has the following key characteristics compared to the first two phases:
• A single, EU-wide cap on emissions instead of the previous system of national caps. • Auctioning as the default method for allocating allowances (instead of free
allocation), and harmonised allocation rules for the allowances still given away for free.
• More sectors and gases included. • 300 million allowances set aside in the New Entrants Reserve to fund the
deployment of innovative renewable energy technologies and carbon capture and storage.
Beyond 2020, the EU target for ETS is a 43% reduction in GHG emissions by 2030 relative to the 2005 level. This means that in the years 2021-30, the volume of emission allowances will decline by 2.2% per year, compared to the 1.74% per year in 2013-20.
Oversupply in the EU ETS has led allowance prices to be low, giving little incentive for structural change towards clean energy systems. The recently agreed “Market Stability Reserve” seeks to address this oversupply.
Source: European Commission (2018), EU Emissions Trading System, https://ec.europa.eu/clima/policies/ets_en.
© O
EC
D/IE
A, 2
018
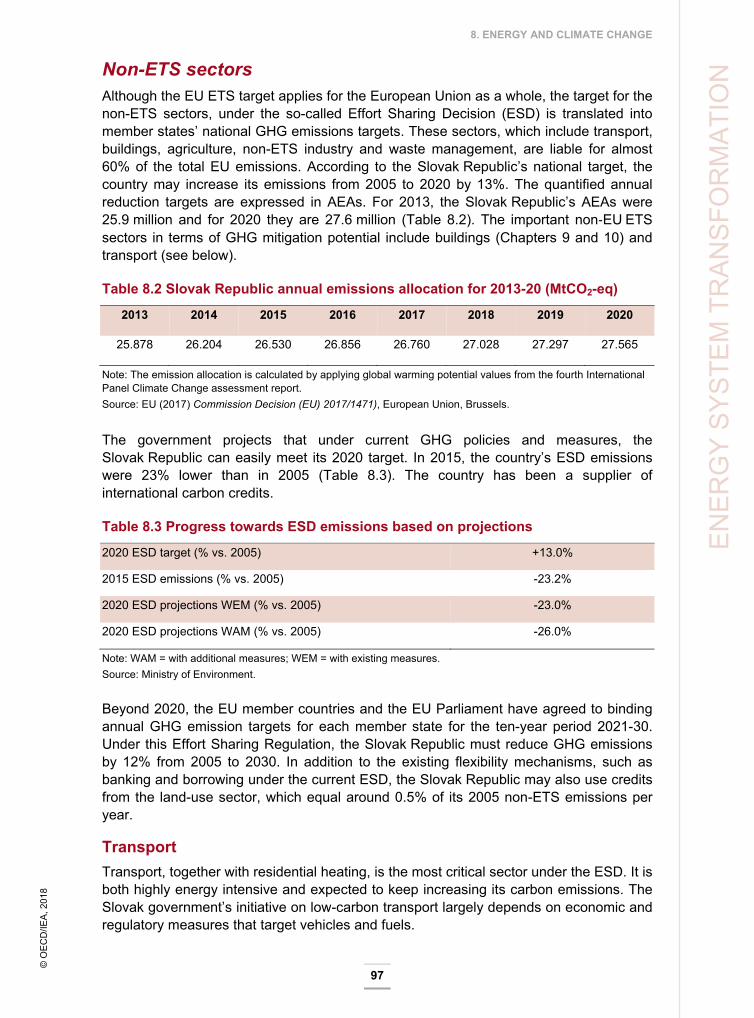
8. ENERGY AND CLIMATE CHANGE
97
EN
ER
GY
SY
STE
M T
RA
NS
FOR
MA
TIO
N Non-ETS sectors
Although the EU ETS target applies for the European Union as a whole, the target for the non-ETS sectors, under the so-called Effort Sharing Decision (ESD) is translated into member states’ national GHG emissions targets. These sectors, which include transport, buildings, agriculture, non-ETS industry and waste management, are liable for almost 60% of the total EU emissions. According to the Slovak Republic’s national target, the country may increase its emissions from 2005 to 2020 by 13%. The quantified annual reduction targets are expressed in AEAs. For 2013, the Slovak Republic’s AEAs were 25.9 million and for 2020 they are 27.6 million (Table 8.2). The important non‐EU ETS sectors in terms of GHG mitigation potential include buildings (Chapters 9 and 10) and transport (see below).
Table 8.2 Slovak Republic annual emissions allocation for 2013-20 (MtCO2-eq)
2013 2014 2015 2016 2017 2018 2019 2020
25.878 26.204 26.530 26.856 26.760 27.028 27.297 27.565
Note: The emission allocation is calculated by applying global warming potential values from the fourth International Panel Climate Change assessment report. Source: EU (2017) Commission Decision (EU) 2017/1471), European Union, Brussels.
The government projects that under current GHG policies and measures, the Slovak Republic can easily meet its 2020 target. In 2015, the country’s ESD emissions were 23% lower than in 2005 (Table 8.3). The country has been a supplier of international carbon credits.
Table 8.3 Progress towards ESD emissions based on projections
2020 ESD target (% vs. 2005) +13.0%
2015 ESD emissions (% vs. 2005) -23.2%
2020 ESD projections WEM (% vs. 2005) -23.0%
2020 ESD projections WAM (% vs. 2005) -26.0%
Note: WAM = with additional measures; WEM = with existing measures. Source: Ministry of Environment.
Beyond 2020, the EU member countries and the EU Parliament have agreed to binding annual GHG emission targets for each member state for the ten-year period 2021-30. Under this Effort Sharing Regulation, the Slovak Republic must reduce GHG emissions by 12% from 2005 to 2030. In addition to the existing flexibility mechanisms, such as banking and borrowing under the current ESD, the Slovak Republic may also use credits from the land-use sector, which equal around 0.5% of its 2005 non-ETS emissions per year.
Transport Transport, together with residential heating, is the most critical sector under the ESD. It is both highly energy intensive and expected to keep increasing its carbon emissions. The Slovak government’s initiative on low-carbon transport largely depends on economic and regulatory measures that target vehicles and fuels.
© O
EC
D/IE
A, 2
018

8. ENERGY AND CLIMATE CHANGE
98
To reduce the GHG emissions in the transport sector, the Slovak Republic implements several measures adopted at EU level, which include:
CO2 emission standards for new cars and vans
CO2 labelling of cars
fuel quality requirements: the GHG intensity of vehicle fuels must be cut by 6% by 2020. CO2 emission standards set at the EU level help gradually reduce the fleet-wide average emissions from new cars and vans. The maximum value for 2015 was 130 grammes of CO2 per kilometre (gCO2/km) and the target for 2021 is 95 gCO2/km.
The increasing pressure to cut GHG emissions in the transport sector has motivated the government to take more ambitious and effective strategies, such as the toll paid by freight vehicles based on their environmental performance, and stricter fuel and emission standards for new cars. In 2017, the government approved the new national strategy for transport development, which highlights fleet renewal, alternative fuels, multimodal transport, air quality and the modernisation of transport routes.
For transport fuels, the main support scheme to reduce the GHG emissions is a quota system, which obliges companies that import or produce petrol or diesel to include a defined percentage of biofuels in their annual fuel sales. Biofuels are also supported through taxation (Chapter 10).
The government has supported the deployment of advanced vehicle technologies, such as hybrid buses in selected cities in 2011. It also adopted the electromobility development strategy in 2015. From late 2016 to late 2017, the government provided subsidies to promote the use of low-carbon transportation – EUR 5 000 for the purchase of a new battery-electric vehicle and EUR 3 000 for plug-in hybrids. At the end of 2017, 639 electric vehicles (EVs) were registered in the country. Other than direct subsidies, there are tax reductions for vehicles that run on cleaner fuels, such as compressed natural gas (CNG) as well as support for alternative fuel infrastructures. The number of EV charging points in the Slovak Republic has increased from 50 in 2014 to 335 in 2016.
Kyoto flexible mechanisms In 2013, the Slovak Republic became the first Annex 1 party to have concluded a freestanding assigned amount unit (AAU) deal. Seven million AAUs were sold to Spain and the revenues were used to finance various GHG emission reduction projects under the SlovSEFF Greening Programme, such as energy efficiency in industry and renewable energy. The AAUs have been sold under a so-called Green Investment Scheme, which is a framework to invest the revenue from AAU sales in climate change mitigation.
In practice, all the revenue from the AAU sales was channelled to the country’s Environmental Fund. Through loans and grants, the Fund is a main source for funding climate action in the country. The Fund also receives the charges paid for environmental pollution.
© O
EC
D/IE
A, 2
018

8. ENERGY AND CLIMATE CHANGE
99
EN
ER
GY
SY
STE
M T
RA
NS
FOR
MA
TIO
N Climate change adaptation
The Slovak Republic is vulnerable to extreme fluctuations in precipitation and the water cycle. A noticeable increase in daily precipitation in the past decade has caused severe floods in the central area of the country, whereas the southern part of the country has suffered from droughts. The government adopted a National Adaptation Strategy in 2014, and its key elements are incorporated into sector-specific policies, which include water, agriculture, transport and energy. By the time of writing, in March 2018, the ME was updating the 2014 National Adaptation Strategy.
For the energy sector, the government has three main concerns:
The impacts of climate change on the supply and demand of electricity and heat. The country anticipates an increased energy demand for air conditioning in the summer (but also a decreased power consumption in the winter) because of milder weather.
Increased frequency and intensity of technical disruptions to power plants and transmission and distribution grids caused by extreme weather events. The government estimates that extreme weather could increase the occurrence of blackouts by 10% to 20% in 2050 compared to the 11-year reference period 2000-10 (SHMI, 2017).
Electricity generation in thermal and nuclear power plants requires access to cooling water. Extended dry periods because of climate change can intensify the competition between water for agricultural irrigation and that for power plants.
The government’s central adaptation strategies for the energy sector include to:
Improve overall energy efficiency, for example through energy labelling for appliances, and promote smart energy consumption that takes into account seasonal changes.
Reinforce the safety measures of power facilities and prepare precautionary arrangements against potential disruptions to ensure a reliable system operation during extreme weather events.
Air quality The 1991 air pollution legislation has one of the strongest drivers for the switch from oil and coal to natural gas and nuclear in power generation. The air quality legislation, Act No. 137/2010 Coll. on air protection, combined with financial penalties on the medium- and large-scale air-polluting facilities have reduced emissions in recent years. The national framework for alternative fuels includes establishing low-emission zones, which combines climate and air quality benefits. To fill in the existing loopholes and legislative ambiguity around biogas production, some new standards,2 particularly on the fermenting process and treatment of odorous substances, were set in 2016.
Nevertheless, air pollution, particularly emissions of particulate matter less than 10 micrometres (μm) in diameter (PM10) and particulate matter less than 2.5 μm in diameter (PM2.5), remains a serious challenge. This is mainly because of the inefficient 2 Decree of the Ministry of Environment of the Slovak Republic No. 252/2016 Coll., which amended and supplemented the Decree of the Ministry of Environment of the Slovak Republic No. 410/2012 Coll. about requirements for the air protection act and on amendments to Decree No. 270/2014 Coll.
© O
EC
D/IE
A, 2
018

8. ENERGY AND CLIMATE CHANGE
100
combustion techniques for domestic heating and transport, as well as ineffective policy designs. For instance, the air pollution charges introduced in 1988 were proved too low to encourage cleaner production technologies. Moreover, the EU ETS, pollution payments and the recent application of new emission restrictions under the Industrial Emissions Directive are generally limited to large and medium combustion facilities.
Assessment The Slovak Republic’s target under the EU ESD allows for a 13% increase in GHG emissions from the non-ETS sectors from 2005 to 2020. In contrast, emissions decreased by 23.2% from 2005 to 2015. By 2020, the decrease is projected to remain at 23% with the existing measures. For 2030, the country’s target is -12% from 2005, which is thus clearly higher (by 14%) compared with the anticipated 2020 levels. According to the European Commission Reference Scenario3, the country will reach this target already with existing measures.
The ME is preparing a strategy for environmental policy until 2030 (Envirostrategy 2030). The Slovak Republic is also developing a low-carbon strategy with development paths up to 2050, aided by the World Bank, to be presented in 2019. In this strategic work, the possibility of setting stricter national targets than those decided at the EU level is under consideration. Some of the policies under consideration include the introduction of a carbon tax and reduction of some of the energy tax exemptions that now hinder the effective pricing of carbon emissions. The government could also consider targeting tax exemptions more specifically and using direct social policy measures for low-income households, for example.
In general, the IEA encourages the Slovak Republic to set such stricter targets, as the relatively easy EU-level medium-term targets might not represent the national long-term best path that gives the most cost-effective transition in the 2050 timeframe.
The transport sector is of particular interest, because it is not covered by the ETS and its emissions are projected to increase. Encouragingly, a strategy for transport development was approved in 2017, which targets fleet renewal, alternative fuels, multimodal transport, air quality and modernisation of the tram and railway tracks.
In terms of transport policies, the focus is on fuel and vehicles. For fuel, there is a biofuels blending mandate, and for vehicles, the policies include direct subsidies for the purchases of EVs, tax/fee reductions for vehicles that run on CNG and alternative fuels, and support for the alternative fuel infrastructure for road transport as well as for waterways. For those who cannot afford the subsidised cars, there is no incentive to choose a less-polluting car apart from the general fuel tax. This can be compared to, for example, the French bonus-malus system, in which a fee on the purchase of high-emission cars finances a subsidy for low-emission cars and the size of the fee/subsidy depends on the level of emissions.
To reduce oil consumption in the transport sector is not a government objective and, although there are some initiatives, there are no comprehensive policies for a modal shift 3 EU Reference Scenario 2016, Energy, Transport and GHG emissions Trends to 2050.
© O
EC
D/IE
A, 2
018

8. ENERGY AND CLIMATE CHANGE
101
EN
ER
GY
SY
STE
M T
RA
NS
FOR
MA
TIO
N and demand moderation. Private car ownership has increased significantly since the
early 1990s and congestion has become a problem in major cities. Efforts to limit private car traffic in urban areas through, for example congestion charges, car sharing, prioritising public transport, cycling and walking, should be considered in infrastructure investments and spatial planning. They could provide multiple benefits in the form of better air quality, lower noise and increased road safety, in addition to the reduced climate impact.
Air pollution is a major concern in the Slovak Republic, especially PM10 and PM2.5. The main sources are transport and ineffective combustion in domestic heating. Air pollution charges were introduced in 1998, but the levels have not been raised since then and appear to be too low to encourage the use of cleaner production technologies. The national political framework for alternative fuels includes the establishment of low-emission zones, which is a measure that combines climate and air quality benefits.
Recommendations The government of the Slovak Republic should:
Adopt national emission targets for the non-ETS sector that are more ambitious than those decided at the EU level and that go beyond business as usual to enable a more cost-effective long-term energy transition.
Reform energy taxation to better reflect the carbon and particulate emissions of fossil fuels.
Phase out tax exemptions that cannot be motivated by a legitimate risk of carbon leakage.
In the transport sector, prioritise limiting individual motorised transport, especially in urban areas, and create effective tools for the higher use of low-carbon public transport.
Reform the current support for alternative vehicles to a more general system to incentivise choosing vehicles with lower emissions when a new one is purchased, for example by letting a fee on high-emission cars finance a subsidy for low-emission cars (the bonus-malus system).
References
European Commission (2018), EU Emissions Trading System, EC, Brussels, https://ec.europa.eu/clima/policies/ets_en, accessed on 6 March 2018.
EU (European Union) (2017) Commission Decision (EU) 2017/1471 of 10 August 2017 amending Decision 2013/162/EU to revise member states’ annual emission allocations for the period from 2017 to 2020 (notified under document C(2017) 5556), EC, Brussels, https://eur-lex.europa.eu/legal-content/EN/TXT/?uri=CELEX:32017D1471.
IEA (International Energy Agency) (2018), CO2 Emissions from Fuel Combustion 2018 [database], OECD/IEA, Paris, www.iea.org/statistics/.
© O
EC
D/IE
A, 2
018

8. ENERGY AND CLIMATE CHANGE
102
ME (Ministry of Environment) (2017), 3rd Biennial Report of the Slovak Republic, 2017, ME, Bratislava, http://unfccc.int/files/national_reports/biennial_reports_and_iar/submitted_biennial_reports/application/pdf/72450391_slovakia-br3-1-3br_svk.pdf.
MoE (Ministry of Energy) (2014), Energy Policy of the Slovak Republic, MoE, Bratislava, www.economy.gov.sk/uploads/files/47NgRIPQ.pdf.
SHMU (Slovak Hydrometeorological Institute) (2018), National Inventory Report 2018, Submission under the UNFCCC and under the Kyoto Protocol, Slovak Hydrometeorological Institute and Ministry of Environment of the Slovak Republic, Bratislava, Reported to the UNFCCC: https://unfccc.int/documents/65459.
SHMI (2017), National Inventory Report 2017, http://unfccc.int/national_reports/annex_i_ghg_inventories/national_inventories_submissions/items/10116.php.
© O
EC
D/IE
A, 2
018

103
EN
ER
GY
SY
STE
M T
RA
NS
FOR
MA
TIO
N
9. Energy efficiency
Key data (2016)
TFC: 10.3 Mtoe (natural gas 28.3%, oil 28.6%, electricity 21.0%, coal 8.3%, biofuels and waste 7.3%, heat 6.5%), -10% since 2006
Consumption by sector: industry 42.1%, transport 23.9%, residential 19.8%, commercial and public services including agriculture, forestry and fishing 14.2%
Energy consumption (TFC) per capita: 1.9 toe (IEA average 2.9 toe (2015)), -11% since 2006
Energy intensity (TFC per GDP): 65.2 toe/USD million PPP (IEA average: 76.3), -34% since 2006
Exchange rate: euro: EUR 1 = USD 1.12 (2017)
Overview The Slovak Republic has achieved a clear decoupling of energy consumption and economic growth in recent decades (Figure 9.1). Gross domestic product (GDP) more than doubled over the two decades 1996-2016, whereas the total final consumption (TFC) of energy remained stable at around 10-12 million tonnes of oil equivalent (Mtoe).
Figure 9.1 Energy demand and drivers, 1990-2016
Source: IEA (2018a), World Energy Balances 2018, www.iea.org/statistics/.
Successful energy efficiency improvements, especially increased thermal insulation in buildings, have resulted in a decline in energy demand in the residential and commercial sectors. The potential for further improvements exists, but more investments are required
0.0
0.5
1.0
1.5
2.0
2.5
1990 1992 1994 1996 1998 2000 2002 2004 2006 2008 2010 2012 2014 2016
Index 1990
GDP
Electricity output
Population
TFC
TFC/GDP
© O
EC
D/IE
A, 2
018

9. ENERGY EFFICIENCY
104
to continue the positive trend and reach the energy efficiency targets set by the country. Many easy measures have already been implemented and the challenge will be to find more cost-effective ways to improve energy efficiency further.
Energy consumption by sector Energy consumption in the Slovak Republic is characterised by a large industry sector that accounts for nearly half of TFC, followed by the residential and commercial sectors and transport. Energy intensity has fallen but is still above the European average.
Energy intensity Energy intensity can be measured as energy consumption per capita and per GDP. In 2016, TFC per capita was the seventh lowest among International Energy Agency (IEA) member countries at 1.9 Mtoe. Energy intensity per GDP was 65 tonnes of oil equivalent per US dollars (toe/USD) million (in purchasing power parity [PPP]), which was below the IEA median but above the IEA Europe average (Figure 9.2).
Figure 9.2 Energy intensity in IEA member countries, 2015
Energy consumption per capita (TFC/capita)
Energy consumption per GDP (TFC/GDP)
Notes: Energy intensity in the final energy consumption does not include the energy transformation sector. toe = tonnes of oil equivalent. Source: IEA (2018a), World Energy Balances 2018, www.iea.org/statistics/.
6.15.3
4.7 4.73.9 3.7 3.5 3.4 3.4 3.3 3.2 3.1 2.9 2.7 2.4 2.4 2.3 2.3 2.3 2.3 2.2 2.2 2.0 2.0 1.9 1.9 1.8 1.8 1.6 1.5 1.3 1.0
01234567
toe/capita
124 12399 91 90 89 82 80 78 75 74 74 74 74 73 69 66 65 64 63 62 61 61 59 58 57 54 53 53 50 42 37
0
30
60
90
120
150toe/USD million PPP
© O
EC
D/IE
A, 2
018

9. ENERGY EFFICIENCY
105
EN
ER
GY
SY
STE
M T
RA
NS
FOR
MA
TIO
N Since the early 1990s, the energy intensity in the Slovak Republic has declined, with few
exceptions, continuously and faster than in the neighbouring countries (Figure 9.3). From 2006 to 2016, it fell by a third in the Slovak Republic, compared with 16% on average for European IEA member countries. The decline can be explained by a combination of energy efficiency improvements and structural changes, such as shifts in industrial production. The government wants to reduce the energy intensity further to reach the European average (MoE, 2017).
Figure 9.3 Energy intensity in selected IEA member countries, 1974-2016
Note: Energy intensity as TFC/GDP PPP. Source: IEA (2018a), World Energy Balances 2018, www.iea.org/statistics/.
Industry The industry sector is the largest energy consumer in the Slovak Republic. In 2016, industry accounted for 42.1% of the TFC. However, industry’s energy consumption has decreased by 11% since 2006, with the most recent significant drop in 2009 during the global financial crisis (Figure 9.4).
Natural gas is the largest energy source with 26% of total industrial consumption, followed by electricity (24%), coal (18%), oil (17%), biofuels and waste (12%), and heat (3%). Fossil fuels thus dominate the energy consumption in industry, but in recent years have partly been replaced by an increasing share of biofuels. From 2006 to 2016, oil consumption fell by over one-third. Natural gas and coal consumption also declined, but less than oil, whereas biofuels and waste consumption more than doubled.
Figure 9.4 TFC in industry by source, 1973-2016
Note: Includes non-energy consumption. Source: IEA (2018a), World Energy Balances 2018, www.iea.org/statistics/.
0.00
0.05
0.10
0.15
0.20
0.25
1974 1977 1980 1983 1986 1989 1992 1995 1998 2001 2004 2007 2010 2013 2016
toe/USD 1 000 GDP PPPHungary
Czech Republic
Poland
Slovak Republic
IEA Europe
0
0 1 2 3 4 5 6 7 8
1973 1976 1979 1982 1985 1988 1991 1994 1997 2000 2003 2006 2009 2012 2015
MtoeOil
Natural gas
Coal
Biofuels and waste
Electricity
Heat
© O
EC
D/IE
A, 2
018

9. ENERGY EFFICIENCY
106
The metal industry, mainly iron and steel, is the largest energy-consuming industry, followed by non-metallic minerals and pulp and paper (Figure 9.5). If fuels used for non-energy purposes are included, however, the consumption in the chemical and petrochemical industry is almost as large as the metal industry consumption.
Figure 9.5 Energy consumption in manufacturing industry sectors, 2016
* Other industries include wood and wood products, construction, textile and leather, mining and quarrying and other non-specified. Note: Energy consumption does not include fuels for non-energy use. Source: IEA (2018a), World Energy Balances 2018, www.iea.org/statistics/.
Further energy efficiency improvements in industry can bring multiple benefits, such as increased energy security, lower costs and increased productivity for companies, as well as lower greenhouse gas (GHG) emissions and cleaner air.
Residential and commercial In 2016, the residential and commercial sectors together consumed just over one-third of the TFC. Energy consumption has declined in the sectors since the late 1990s, except in years with cold winters (Figure 9.6). Over the past decade, consumption fell by 19%, mainly as a result of energy efficiency improvements in buildings, with nearly equal decreases in both the residential and commercial sectors.
Figure 9.6 TFC in residential and commercial sectors by source, 1973-2016
* Negligible. Notes: The commercial sector includes commercial and public services, agriculture, forestry and fishing. For the years 1980-89, a different methodology was used to produce the data, which led to breaks between the natural gas consumption in the commercial and transport sectors. Source: IEA (2018a), World Energy Balances 2018, www.iea.org/statistics/.
30%
14%
14%12%
8%
6%5%
4%7%
Iron and steelNon-metallic mineralsPaperChemical and petrochemicalNon-ferrous metalsMachineryTransport equipmentFood and tobaccoOther industries*
0
1
2
3
4
5
6
7
1973 1976 1979 1982 1985 1988 1991 1994 1997 2000 2003 2006 2009 2012 2015
Mtoe
Oil
Natural gas
Coal
Biofuels and waste
Electricity
Heat
Solar*
Geothermal*
© O
EC
D/IE
A, 2
018

9. ENERGY EFFICIENCY
107
EN
ER
GY
SY
STE
M T
RA
NS
FOR
MA
TIO
N Natural gas is the dominant fuel in residential and commercial sectors at 47% of the final
consumption in 2016, followed by electricity (30%) and district heating (DH) (16%). Natural gas and DH are used for space and water heating, whereas electricity is used mainly in household appliances and commercial applications.
Space heating accounts for nearly two-thirds of total energy consumption in the residential sector. As a result of energy efficiency improvements in buildings, the energy intensity of space heating per floor area has fallen by 43% between 2000 and 2014 (Figure 9.7). Water heating accounts for another fifth of residential energy consumption, and its energy intensity has declined by 37%. Consequentially, the consumption of natural gas and DH has declined over the past decade. Electricity consumption, however, has increased slightly in the residential and commercial sectors.
Figure 9.7 Residential energy intensity, 2000 and 2016
*TC = temperature corrected. Note: GJ/m2 = gigajoule per square metre; GJ/dW = gigajoules per deciwatt. Source: IEA (2018b forthcoming), Energy Efficiency Indicators Highlights 2018 (preliminary), www.iea.org/statistics/.
The building stock of the Slovak Republic is older than the European Union (EU) average (Figure 9.8). In 2014, 12% of the residential building stock in the Slovak Republic was constructed after 1990 compared with the EU average of 23%.
Figure 9.8 Share of residential buildings and U-value of the buildings by age, 2014
* No data available for buildings after 2010. Source: EC (2018a), EU Buildings Database, https://ec.europa.eu/energy/en/eu-buildings-database.
0
0.2
0.4
0.6
0.8
Space heating (TC*)
GJ/m2
0
5
10
15
20
Water heating Residential appliances
GJ/dwelling
2000
2016
0
0.5
1
1.5
2
2.5
3
3.5
0
5
10
15
20
25
30
35
Before 1945 1945-1969 1970-1979 1980-1989 1990-1999 2000-2010 After 2010
W/m2K% of total building stock Slovakia
EU-28
U-value of buildingenvelope* SlovakiaU-value of buildingenvelope* EU-28
© O
EC
D/IE
A, 2
018

9. ENERGY EFFICIENCY
108
The thermal transmittance1 of buildings was reduced by more than half, from an average of 2.3 watts per square metre Kelvin (W/m2K) (the U-value) in buildings constructed before 1945 to 1.1 W/m2K in buildings constructed after 2010.
A higher share of newer more energy-efficient buildings leads to reduced energy consumption, but energy savings can also be achieved through refurbishing older buildings. From 2008 to 2014, energy efficiency improvements resulted in around a 10% reduction of the U-value of buildings from the 1970s and 1980s (EC, 2018a).
Energy efficiency improvements in the residential and commercial sectors bring multiple benefits to building users and owners, in terms of lower energy costs and more comfortable indoor climate. However, energy savings in buildings create problems for DH suppliers, whose infrastructure (boilers and pipelines) is based on the previously larger energy demands.
Transport Energy consumption in transport increased significantly in the early 2000s, plateaued for some years and then it increased again (Figure 9.9). In 2016, the demand peaked at 2.3 Mtoe, 29% higher than in 2006.
Figure 9.9 TFC in transport by source, 1973-2016
Notes: Pipeline transport consumption of natural gas is not included (0.1 Mtoe in 2015). For the years 1980-89, a different methodology was used to produce the data, which led to breaks between natural gas consumption in the commercial and transport sectors. Source: IEA (2018a), World Energy Balances 2018, www.iea.org/statistics/.
The sector depends largely on oil, which accounts for 91% of the TFC in 2016. Diesel is the most-used fuel and represents 60% of the TFC in transport, followed by gasoline at 25%. Biofuels, especially biodiesel, have increased significantly, by 41% from 2013 to 2016, and account for 6% of the transport energy consumption. Electricity has increased slightly in recent years, but accounts for just over 2% of the TFC in transport, mainly rail transport. Natural gas accounts for less than 1% of the transport energy demand, which does not include gas consumed in the pipeline transport.
1 The thermal transmittance, or U-value, is a measure of the energy leakage through a material. The better insulated a building is, the lower the U-value will be.
0.0
0.5
1.0
1.5
2.0
2.5
1973 1976 1979 1982 1985 1988 1991 1994 1997 2000 2003 2006 2009 2012 2015
Mtoe
Oil
Natural gas
Coal
Biofuels and waste
Electricity
© O
EC
D/IE
A, 2
018

9. ENERGY EFFICIENCY
109
EN
ER
GY
SY
STE
M T
RA
NS
FOR
MA
TIO
N Road transport accounts for over 91% of the total transport energy demand. The
Slovak Republic has a relatively small and old car fleet. In 2015, the country had 375 passenger cars per 1 000 inhabitants, the fifth lowest in the European Union and 25% lower than the EU average of 498 cars (Figure 9.10). However, in the 11-year period 2005-15, the number of passenger cars in the Slovak Republic increased by 55%, compared with the EU average growth of 12%.
Energy efficiency improvements in transport can bring multiple benefits in terms of a reduction in GHG emissions and improved air quality on a local level, as well as cost savings for consumers.
Figure 9.10 Cars per capita in selected IEA member countries, 1990-2015
Note: Passenger cars per 1000 inhabitants. Source: EC (2018b), Statistical Pocketbook 2017, https://ec.europa.eu/transport/facts-fundings/statistics/pocketbook-2017_en.
Regulation and institutions The national energy efficiency policy is built largely on directives from the European Union, of which the Energy Efficiency Directive (EED) is the most important one.
Energy Efficiency Directive The 2012 EED (2012/27/EU) establishes a set of binding measures to help the European Union reach its 20% energy efficiency target by 2020. Among other things, the EED requires EU countries to:
Set up an energy efficiency obligation scheme. Under the scheme, energy companies must save at least 1.5% of their annual energy sales to final consumers. Countries may choose other means for these savings, such as to improve the efficiency of heating systems and thermal performance of buildings.
Present national building renovation strategies and measures to improve the energy efficiency in public buildings. Every year, governments must carry out energy-efficient renovations on at least 3% (by floor area) of the buildings they own and occupy.
Require large companies to audit their energy consumption to help them identify ways to reduce it. National incentives should support energy audits for small and medium-sized enterprises (SMEs) also.
Provide energy consumers with easy and free access to data on consumption through individual metering to better manage their consumption.
0
100
200
300
400
500
600
1990 1995 2000 2005 2010 2015
Vehicles per 1 000 inhabitantsAustria
Poland
EU-28
Czech Republic
Slovak Republic
Hungary
© O
EC
D/IE
A, 2
018
9. ENERGY EFFICIENCY
110
In November 2016, the European Commission proposed an update to the EED, which included a new 30% energy efficiency target for 2030 and a package of measures to reach this target, which is currently under review (EC, 2018c).
Other EU directives The Energy Performance of Buildings Directive (EPBD, 2010/31/EU) requires all new buildings to be nearly zero energy from the end of 2020. New public buildings must be nearly zero energy from the end of 2018. In accordance with the directive, EU countries have to draw up national plans to increase the number of nearly zero-energy buildings. In 2018, the European Commission, European Parliament and European Council agreed on updates to the EPBD that aim to accelerate the cost-effective renovation of existing buildings.
Other important EU directives are the Ecodesign Directive (2009/125/EC)2 and the Energy Labelling Directive (2010/30/EU), which is being gradually replaced by a new EU regulation from 2017 (2017/1369). The Ecodesign Directive aims to improve energy efficiency throughout a product’s life cycle. It applies to products that use energy, such as household appliances, and to products that have an impact on energy use, such as building components. Product-specific standards are set by EU regulations based on the directive. The Energy Labelling Directive expands the mandatory labelling requirement from household appliances to cover commercial and industrial appliances and also energy-related appliances.
National regulation and institutions In December 2014, the Slovak Republic adopted the Energy Efficiency Act, which sets up a legal framework for energy efficiency in the country. Energy efficiency is also one of the four pillars of the 2014 Slovak Energy Policy, together with energy security, competitiveness and sustainable energy (MoE, 2014).
The main ministry responsible for energy efficiency is the Ministry of Economy (MoE). Part of its work is delegated via law and ministerial decision to the Slovak Innovation and Energy Agency (SIEA). SIEA provides, among other things, advice on energy efficiency measures and energy services. The Ministry of Transport and Construction deals with energy efficiency in the transport and buildings sectors.
SIEA operates (since 2014) an Energy Efficiency Monitoring System. The system monitors primary and final energy consumption in different sectors and evaluates energy efficiency improvements to reach the 2020 targets. SIEA and the MoE plan to expand the monitoring system.
Energy efficiency targets Since 2006, European policies have been designed to help reach non-binding EU targets for energy efficiency, first for 2016 and now for 2020. The 2020 target, agreed upon in 2007, is to reduce primary energy use in the European Union by 20% from baseline projections. 2 A directive to establish a framework for setting ecodesign requirements for energy-related products.
© O
EC
D/IE
A, 2
018
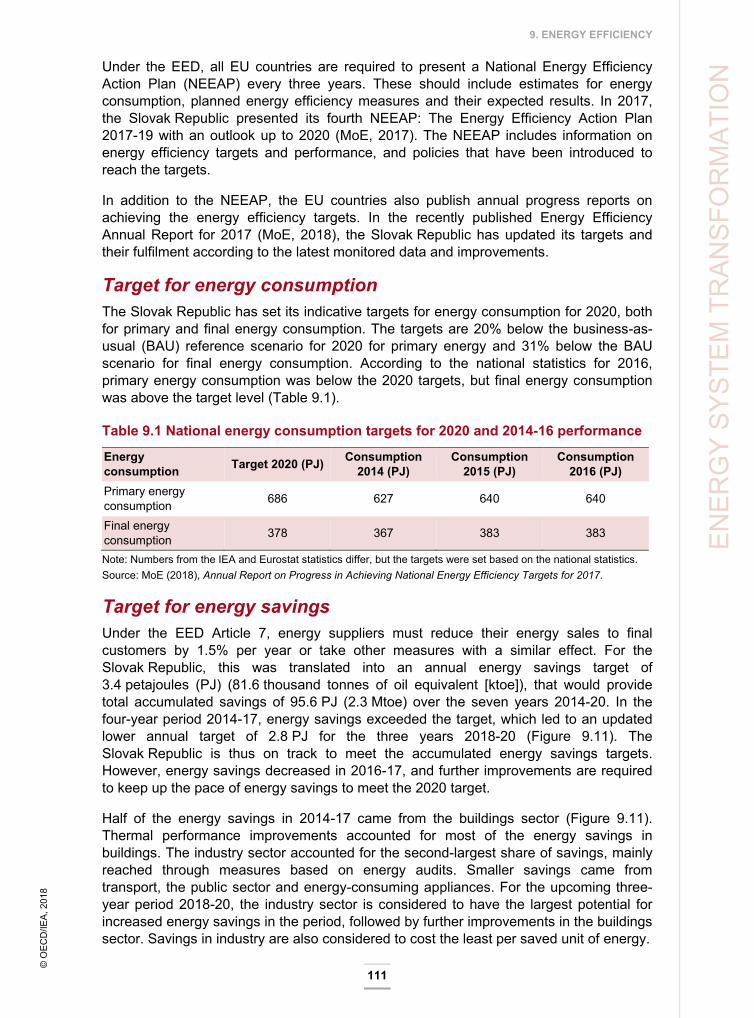
9. ENERGY EFFICIENCY
111
EN
ER
GY
SY
STE
M T
RA
NS
FOR
MA
TIO
N Under the EED, all EU countries are required to present a National Energy Efficiency
Action Plan (NEEAP) every three years. These should include estimates for energy consumption, planned energy efficiency measures and their expected results. In 2017, the Slovak Republic presented its fourth NEEAP: The Energy Efficiency Action Plan 2017-19 with an outlook up to 2020 (MoE, 2017). The NEEAP includes information on energy efficiency targets and performance, and policies that have been introduced to reach the targets.
In addition to the NEEAP, the EU countries also publish annual progress reports on achieving the energy efficiency targets. In the recently published Energy Efficiency Annual Report for 2017 (MoE, 2018), the Slovak Republic has updated its targets and their fulfilment according to the latest monitored data and improvements.
Target for energy consumption The Slovak Republic has set its indicative targets for energy consumption for 2020, both for primary and final energy consumption. The targets are 20% below the business-as-usual (BAU) reference scenario for 2020 for primary energy and 31% below the BAU scenario for final energy consumption. According to the national statistics for 2016, primary energy consumption was below the 2020 targets, but final energy consumption was above the target level (Table 9.1).
Table 9.1 National energy consumption targets for 2020 and 2014-16 performance
Energy consumption Target 2020 (PJ) Consumption
2014 (PJ) Consumption
2015 (PJ) Consumption
2016 (PJ) Primary energy consumption 686 627 640 640
Final energy consumption 378 367 383 383
Note: Numbers from the IEA and Eurostat statistics differ, but the targets were set based on the national statistics. Source: MoE (2018), Annual Report on Progress in Achieving National Energy Efficiency Targets for 2017.
Target for energy savings Under the EED Article 7, energy suppliers must reduce their energy sales to final customers by 1.5% per year or take other measures with a similar effect. For the Slovak Republic, this was translated into an annual energy savings target of 3.4 petajoules (PJ) (81.6 thousand tonnes of oil equivalent [ktoe]), that would provide total accumulated savings of 95.6 PJ (2.3 Mtoe) over the seven years 2014-20. In the four-year period 2014-17, energy savings exceeded the target, which led to an updated lower annual target of 2.8 PJ for the three years 2018-20 (Figure 9.11). The Slovak Republic is thus on track to meet the accumulated energy savings targets. However, energy savings decreased in 2016-17, and further improvements are required to keep up the pace of energy savings to meet the 2020 target.
Half of the energy savings in 2014-17 came from the buildings sector (Figure 9.11). Thermal performance improvements accounted for most of the energy savings in buildings. The industry sector accounted for the second-largest share of savings, mainly reached through measures based on energy audits. Smaller savings came from transport, the public sector and energy-consuming appliances. For the upcoming three-year period 2018-20, the industry sector is considered to have the largest potential for increased energy savings in the period, followed by further improvements in the buildings sector. Savings in industry are also considered to cost the least per saved unit of energy.
© O
EC
D/IE
A, 2
018

9. ENERGY EFFICIENCY
112
Figure 9.11 Final energy savings by sector and targets 2014-20
Note: Efficiency improvements in publicly owned buildings are included in the public sector savings. Source: MoE (2018), Annual Report on Progress in Achieving National Energy Efficiency Targets for 2017.
Target for energy efficiency in public buildings Under the EED Article 5, 3% of the floor area of government-owned buildings must be renovated every year. The Slovak Republic opted for a fixed target, set as annual energy savings of 52.17 gigawatt-hour (GWh) (188 terajoules (TJ), or 4.5 ktoe).
In the recent four years, 2014-17, the target was reached only in 2015, when several public building refurbishment projects financed by EU structural funds were completed. In the other three years, the target was not met (Table 9.2). Thanks to the large margin in 2015, the total savings over the four-year period exceeds the target by 6%. However, the pace of energy savings must increase again to stay above the target level in the coming period up to 2020.
Table 9.2 Energy savings in public buildings
Year Annual target (GWh) Savings per year (GWh) Target fulfilment (%)
2014 52.17 43.79 83.9%
2015 52.17 91.06 174.5%
2016 52.17 38.89 74.5% 2017 52.17 48.21 92.4% 2014-17 208.68 221.95 106.4% Source: MoE (2018), Annual Report on Progress in Achieving National Energy Efficiency Targets for 2017.
Energy efficiency policies To fulfil the national energy savings target, in accordance with Article 7 in the EED, the government introduced several programmes to improve energy efficiency across the sectors. These include to improve the thermal performance in buildings, compulsory energy audits in industry and support for energy-efficient transportation systems. The programmes are funded mainly from the state budget and the European Structural Investment Funds (ESIF). The energy service sector is also supported with policies to remove barriers to further development.
0
1
2
3
4
5
2014 2015 2016 2017 2018 2019 2020
PJAppliances
Transport
Industry
Public sector
Buildings
Original target
Updated target
© O
EC
D/IE
A, 2
018

9. ENERGY EFFICIENCY
113
EN
ER
GY
SY
STE
M T
RA
NS
FOR
MA
TIO
N One important programme is SlovSEFF III – a sustainable energy financing facility
developed by the European Bank for Reconstruction and Development (EBRD) in collaboration with the Ministry of Environment. Credit lines of up to euro (EUR) 100 million are provided to local commercial banks for on-lending to renewable energy and energy efficiency projects. The programme’s incentive payments are funded through a carbon credit transaction between the Slovak Republic and Spain (SlovSEFF, 2018).
Industry Energy efficiency improvements in industry are driven by energy audits in large companies as well as in SMEs, and by voluntary agreements in different industry sectors.
Energy audits in large companies Under the EED, large enterprises in all EU member countries must conduct energy audits every four years, with the first one competed on 5 December 2015 at the latest. Large enterprises are defined as companies of at least 250 employees and an annual turnover of more than EUR 50 million. Within 30 days of an energy audit, the company must send the basic energy audit data to the operator of the Energy Efficiency Monitoring System. The data are used to monitor the potential for energy savings at enterprises.
During the four-year period 2014-17, 766 large enterprises in the Slovak Republic performed energy audits in accordance with the EED.
Energy audits in SMEs The Slovak Republic introduced compulsory energy audits for enterprises and in the agricultural sector in 2011, as an alternative policy measure to meet energy savings targets. During the three-year period from 2011 to the end of 2014, 225 energy audits were carried out in the country.
The MoE subsidises SMEs (since 2016) in the Bratislava region to promote energy audits. In total, the scheme will provide EUR 300 000 of funding. The scheme is currently being upgraded to provide support to implement the measures in the Bratislava region. A similar mechanism is being implemented for other regions, funded by EUR 12 million from the Operational Programme Environmental Quality of the ESIF. It will support energy auditing as well as implementing measures derived from the audits.
Voluntary agreements Voluntary agreements exist between the MoE and different sectors, primarily within energy companies, large industries or associations. The agreements are either focused directly on energy savings or on providing energy efficiency data. The government has concluded 21 voluntary agreements to provide information on energy efficiency measures. A planned expansion of the voluntary agreements to large industries is expected to help save a lot more energy in the coming years.
Buildings The buildings sector has seen the largest energy savings in recent years, and it has a high potential for further efficiency improvements (Figure 9.8 and Table 9.2). The most important measure is renovations to improve the thermal performance of buildings.
© O
EC
D/IE
A, 2
018

9. ENERGY EFFICIENCY
114
Energy efficiency measures in the buildings sector are supported through legislative measures and funding from support programmes.
Financial support programmes Support for building renovation comes from national resources, such as the State Housing Development Fund, and from ESIF resources from several programmes. Another source is the Bohunice International Decommissioning Support Fund, administered by the EBRD.
An important financial mechanism to improve the thermal performance of multifamily buildings is the Joint European Support for Sustainable Investment in City Areas (JESSICA) programme. Since 2013, the mechanism has financed the State Housing Development Fund from the European operational programmes. Currently, JESSICA IV is under preparation and will be financed from the ESIF Integrated Regional Operational Programme (IROP).
Until 2020, the State Housing Development Fund and the SlovSEFF III facility will continue to subsidise improving the thermal performance of multifamily buildings, and the Ministry of Transport and Construction will subsidise single-family buildings.
Legislation and other measures Important legislative measures to improve energy efficiency in buildings include an obligation to ensure the hydronic balancing of a building’s heating system. Owners of larger buildings (over 1 000 square metres) are obliged to ensure the regulation of heat supply in a building, to ensure and maintain the hydronic balance of hot water distribution systems and to install suitable thermal insulation for heating and hot water distribution systems. Hydronic balancing and other improvements to the technical systems of buildings have provided around 10% of the total energy savings in the sector (MoE, 2017). The buildings sector is also supported by information campaigns of the Ministry of Transport and Construction and of the SIEA.
Transport The Slovak Republic has made improvements to energy efficiency in different transport areas. In the period 2014-15, the fleet of public transport vehicles was comprehensively renewed in Bratislava and partially also in Košice. Another significant measure was the replacement of the passenger rail transport fleet, which added new trains and wagons to the regional lines. Public transport improvements in the rail and bus sectors provided over half of total energy savings in the transport sector in the three years 2014-16 (MoE, 2017).
ESIF funding for energy efficiency in the transport sector comes through two programmes: the Operational Programme Integrated Infrastructure (OPII) and the IROP.
The OPII programme, managed by the Ministry of Transport and Construction, supports:
renewable fuels and modernising the vehicle fleet
building and upgrading the transport infrastructure
developing and using public passenger transport, which includes supporting the creation of integrated transport systems.
© O
EC
D/IE
A, 2
018
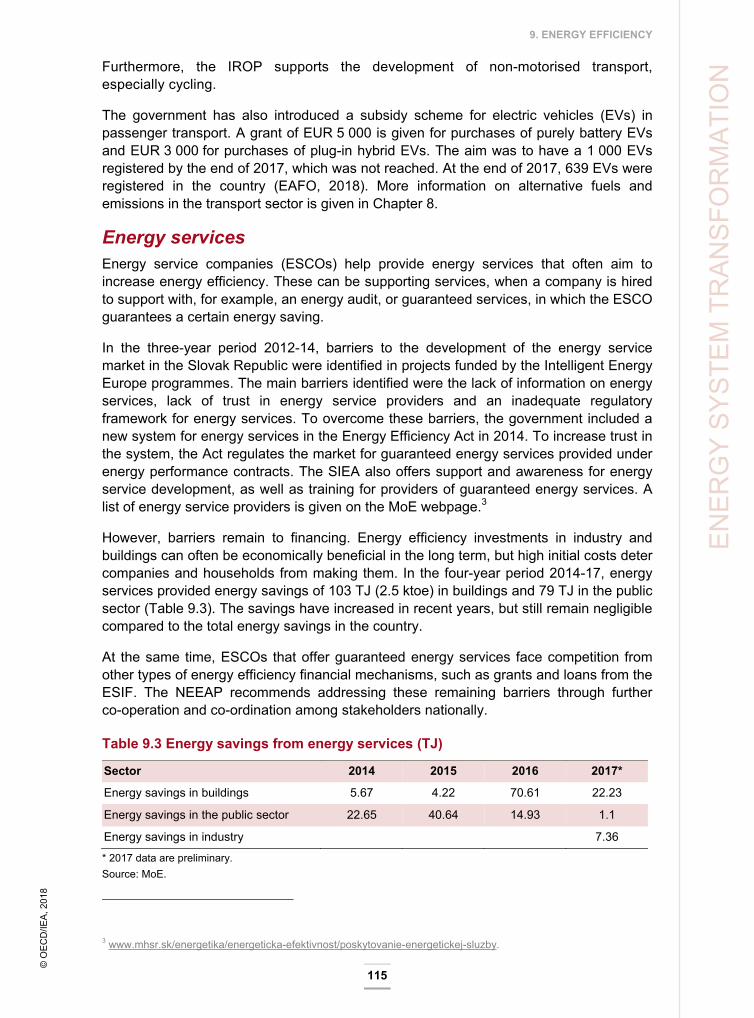
9. ENERGY EFFICIENCY
115
EN
ER
GY
SY
STE
M T
RA
NS
FOR
MA
TIO
N Furthermore, the IROP supports the development of non-motorised transport,
especially cycling.
The government has also introduced a subsidy scheme for electric vehicles (EVs) in passenger transport. A grant of EUR 5 000 is given for purchases of purely battery EVs and EUR 3 000 for purchases of plug-in hybrid EVs. The aim was to have a 1 000 EVs registered by the end of 2017, which was not reached. At the end of 2017, 639 EVs were registered in the country (EAFO, 2018). More information on alternative fuels and emissions in the transport sector is given in Chapter 8.
Energy services Energy service companies (ESCOs) help provide energy services that often aim to increase energy efficiency. These can be supporting services, when a company is hired to support with, for example, an energy audit, or guaranteed services, in which the ESCO guarantees a certain energy saving.
In the three-year period 2012-14, barriers to the development of the energy service market in the Slovak Republic were identified in projects funded by the Intelligent Energy Europe programmes. The main barriers identified were the lack of information on energy services, lack of trust in energy service providers and an inadequate regulatory framework for energy services. To overcome these barriers, the government included a new system for energy services in the Energy Efficiency Act in 2014. To increase trust in the system, the Act regulates the market for guaranteed energy services provided under energy performance contracts. The SIEA also offers support and awareness for energy service development, as well as training for providers of guaranteed energy services. A list of energy service providers is given on the MoE webpage.3
However, barriers remain to financing. Energy efficiency investments in industry and buildings can often be economically beneficial in the long term, but high initial costs deter companies and households from making them. In the four-year period 2014-17, energy services provided energy savings of 103 TJ (2.5 ktoe) in buildings and 79 TJ in the public sector (Table 9.3). The savings have increased in recent years, but still remain negligible compared to the total energy savings in the country.
At the same time, ESCOs that offer guaranteed energy services face competition from other types of energy efficiency financial mechanisms, such as grants and loans from the ESIF. The NEEAP recommends addressing these remaining barriers through further co-operation and co-ordination among stakeholders nationally.
Table 9.3 Energy savings from energy services (TJ)
Sector 2014 2015 2016 2017*
Energy savings in buildings 5.67 4.22 70.61 22.23
Energy savings in the public sector 22.65 40.64 14.93 1.1
Energy savings in industry 7.36
* 2017 data are preliminary. Source: MoE.
3 www.mhsr.sk/energetika/energeticka-efektivnost/poskytovanie-energetickej-sluzby.
© O
EC
D/IE
A, 2
018

9. ENERGY EFFICIENCY
116
Assessment Improvements The Slovak Republic has significantly improved its energy efficiency, but there is room for more ambitious measures that can also bring multiple benefits for the country.
Energy efficiency has been a focus area for Slovak energy policy in recent years, and the government has introduced new policies and regulation to progress energy savings across different sectors. As a result, the energy intensity has decreased significantly, with notable improvements in the buildings sector. However, work remains to meet the 2014 Energy Policy (MoE, 2014) target to decrease energy intensity further to the EU average level. The IEA welcomes the political will to reduce further the energy intensity of the economy and the continued focus on energy efficiency improvements.
The Slovak Republic has strengthened its domestic policies for energy efficiency by implementing EU directives on energy efficiency into national regulation. Articles in the EED have been adopted into 2020 targets on total energy consumption, total energy savings and savings in public buildings. Although large improvements have been made in several areas since 2014, the rate of improvement declined in recent years because many low-cost improvements have already been made. Increased efforts are required to reach all the set targets for 2020. These efforts should then be continued and intensified towards 2030, in line with the requirements of the future EU directive.
Energy efficiency improvements bring multiple benefits, beyond the obvious energy demand reduction and lower GHG emissions. Benefits include increased energy security, lower energy costs for consumers, increased industrial productivity, cleaner air, a more comfortable indoor climate in buildings and savings to the public budget and disposable income of the population. With this in mind, the government can focus its attention to the areas in which energy savings are the most useful to the country and the population, and gain stronger public support for increased efforts.
Energy consumption data Further energy efficiency improvements can be achieved across different sectors, and the available energy consumption data should be used in policy design.
Data on energy consumption is crucial to make informed decisions, and the government has strongly improved data gathering, through the Energy Efficiency Monitoring System. This is very positive, and the government should continue its efforts to collect and analyse data, and use the data as a basis for policy design to steer the financial support to sectors and projects that are most cost-effective.
Industry is the largest energy consumer in the country and the second-largest contributor to energy savings in recent years. Also, it has a large potential for increased energy efficiency improvements, and it is the sector where further energy savings are deemed the most cost-effective. Activities have focused on technology transfer and to realise the measures identified in the energy audits. This should continue, as well as the work to gather and process more data from the energy audits. The government should also seek to enter into more voluntary agreements with industry sectors as a method to increase energy savings as well as to collect more accurate energy consumption data.
© O
EC
D/IE
A, 2
018

9. ENERGY EFFICIENCY
117
EN
ER
GY
SY
STE
M T
RA
NS
FOR
MA
TIO
N Buildings have seen a significant reduction in energy intensity thanks to strong policy
support in recent years. In the four-year period 2014-17, buildings contributed with monitored final energy savings of 7.2 PJ (0.17 Mtoe), half of the total energy savings in the country. This is mainly thanks to the thermal insulation of residential buildings, supported by several EU- and state-funded programmes. However, further improvements are needed in the buildings sector, including public buildings. Data on energy consumption patterns can help identify the areas in most need of renovation, and also the use of data should be improved for energy consumption in appliances. Energy companies, and specifically DH suppliers, should also be involved in the planning process for energy efficiency improvements in residential areas.
Transport consumes less energy than industry or buildings, but it is the only sector that has increased its consumption in the past decade. The Slovak Republic has fewer cars per capita than the EU average, but also a relatively old and energy-consuming car fleet. Measures towards improved efficiency of the vehicle fleet should be designed to avoid incentives for increased vehicle ownership that would result in a higher energy demand. Furthermore, the Slovak Republic should keep a broad perspective on the sector and continue to promote public transportation and other modes of transport, rather than to focus on personal vehicle technologies.
Investment The energy service sector holds great potential to attract private capital and utilise market forces to direct investments towards cost-effective measures.
The 2014 Energy Efficiency Act improved clarity for the energy service sector. It strengthened the regulatory framework and increased the credibility of energy service providers. SIEA’s training and certification of energy service providers removed barriers that stem from a lack of information and trust in the system. However, other barriers to growth of the energy service sector remain, mainly on the financial side. To find new ways to allocate more capital should be a priority.
High investment costs that discourage energy efficiency measures can be addressed by continued support via grants and loans, funded through the state budget or the EU structural funds (ESIF). The government should continue to support a growing energy service market and further remove investment barriers. However, the issue of competition between public funding and private energy service providers should also be addressed. To avoid conflicts and unfair competition that discourage market development, further co-ordination between support policy and market forces is required.
Multiple-sourced financing can bring much-needed capital into energy efficiency projects. Specifically, the government and other public institutions should facilitate financing from multiple sources for energy efficiency projects in the public sector. By combining support funding from the EU structural funds, for example, with private financing on the guaranteed energy service contracts market, the government can increase the total capital available for energy efficiency investments. Energy efficiency is an area that benefits from close collaboration between different stakeholders, and the government should seek to involve energy companies, housing and consumer associations, industries, energy service providers and private and public financiers into the process.
© O
EC
D/IE
A, 2
018

9. ENERGY EFFICIENCY
118
Recommendations The government of the Slovak Republic should:
Carefully monitor progress on energy efficiency in different sectors and ensure that all energy efficiency targets are met on time. As a next step, set more ambitious targets than the minimum required by the European Union, and increase the efforts to reach them, given the multiple benefits of energy efficiency.
Build on the successful collection and analysis of data on energy consumption to identify the most cost-effective energy efficiency measures and to allocate public resources towards those.
Continue to stimulate the market for energy services and explore ways to allocate more private capital to energy efficiency, together with energy service providers, financial actors and other relevant stakeholders.
References
EAFO (European Alternative Fuels Observatory) (2018), Slovakia, EAFO, Brussels, www.eafo.eu/content/slovakia.
EC (European Commission) (2018a), EU Buildings Database, EC, Brussels, https://ec.europa.eu/energy/en/eu-buildings-database.
EC (2018b), “Means of transport” in Statistical Pocketbook 2017, EC, Brussels, https://ec.europa.eu/transport/facts-fundings/statistics/pocketbook-2017_en.
EC (2018c) Energy Efficiency Directive, EC, Brussels, https://ec.europa.eu/energy/en/topics/energy-efficiency/energy-efficiency-directive.
IEA (International Energy Agency) (2018), World Energy Balances 2018 [database], OECD/IEA, Paris, www.iea.org/statistics/.
IEA (2018b forthcoming), Energy Efficiency Indicators Highlights 2018 (preliminary), OECD/IEA, Paris, www.iea.org/statistics/.
MoE (Ministry of Economy) (2018), Annual Report on Progress in Achieving National Energy Efficiency Targets for 2017, MoE, Bratislava.
MoE (2017), Energy Efficiency Action Plan 2017-19 with an Outlook up to 2020, MoE, Bratislava, https://ec.europa.eu/energy/en/topics/energy-efficiency/energy-efficiency-directive/national-energy-efficiency-action-plans.
MoE (2014), Energy Policy of the Slovak Republic, MoE, Bratislava, www.economy.gov.sk/uploads/files/47NgRIPQ.pdf.
SlovSEFF (2018), SlovSEFF III, SlovSEFF, Bratislava, www.slovseff.eu/index.php/en/#.
© O
EC
D/IE
A, 2
018
119
EN
ER
GY
SY
STE
M T
RA
NS
FOR
MA
TIO
N
10. Renewable energy
Key data (2017 provisional)
Total supply*: 1.6 Mtoe (9.5% of TPES) and 6.6 TWh (25.0% of electricity generation).
IEA average*: 10.0% of TPES and 24.7% of electricity generation.
Biofuels and waste**: 1.4 Mtoe (8.0% of TPES) and 1.5 TWh (5.8% of electricity generation)
Hydropower: 0.4 Mtoe (2.3% of TPES) and 4.5 TWh (17.0% of electricity generation)
Solar energy: 0.06 Mtoe (0.3% of TPES) and 0.7 TWh (2.5% of electricity generation)
Exchange rate: euro: EUR 1 = USD 1.12 (2017) * Excluding non-renewable waste. ** Includes 0.2 Mtoe non-renewable municipal and industrial waste, which accounts for 14% of total biofuel supply. Note: Shares of wind and geothermal power are negligible.
Overview Renewable energy supply has increased significantly in the Slovak Republic (Figure 10.1). From 2007 to 2017, the share of renewable energy in total primary energy supply (TPES) nearly doubled from 5.3% to 9.5% (10.6% with non-renewable waste included) and its share in electricity generation increased from 17.7% to 25.0%. The growth was mainly in biofuels and waste, which accounted for around three-quarters of the total renewables in TPES, but also solar energy increased. A generous financial support triggered a very rapid growth in solar power in 2010-11, but the growth has since stalled, as the government cut back the subsidies out of concern for grid instability and the financial burden on final consumers.
In line with the European Union (EU) targets for 2020, the government set national targets to increase the share of renewables in electricity, heating and transport. It considers biomass and waste the most cost-effective domestic renewable energy sources (RES) and strongly supports its use in heating, in particular (Chapter 11).
© O
EC
D/IE
A, 2
018

10. RENEWABLE ENERGY
120
Figure 10.1 Share of renewable energy in TPES, electricity and TFC, 1976-2016
*Latest data for final consumption are for 2016. Note: Includes non-renewable waste. Source: IEA (2018), World Energy Balances 2018, www.iea.org/statistics/.
Supply and demand Renewable energy in TPES In 2017, the Slovak Republic’s total supply of renewable energy (including waste) was 1.8 million tonnes of oil equivalent (Mtoe), nearly twice the 2007 level (Figure 10.2). The growth was driven mostly by biofuels and waste. The share of renewable energy in TPES also rose because overall TPES declined, while RES supply increased. In comparison with other International Energy Agency (IEA) countries, the Slovak Republic has close to the median share of renewables in TPES, just less than its neighbouring countries, the Czech Republic and Hungary (Figure 10.3).
In 2017, biofuels and waste accounted for 75% of the total renewables in TPES, followed by hydropower (21%) and solar energy (3%). Biofuels and waste more than doubled in ten years from 0.6 Mtoe in 2007 to 1.4 Mtoe in 2017. As the second-largest RES, hydropower is important for the country. However, as the biofuels and waste supply has increased significantly, hydropower’s share of total renewable energy in TPES has fallen from 38% in 2007.
Figure 10.2 Renewable energy and waste in TPES, 1973-2017
* Negligible. Note: Includes non-renewable waste. Source: IEA (2018), World Energy Balances 2018, www.iea.org/statistics/.
0%
5%
10%
15%
20%
25%
30%
Total primaryenergy supply
Electricitygeneration
Final energyconsumption*
19771987199720072017
0%
3%
6%
9%
12%
0
0.5
1
1.5
2
1973 1977 1981 1985 1989 1993 1997 2001 2005 2009 2013 2017
MtoeBiofuels and waste
Hydro
Solar
Geothermal*
Wind*
Renewables share(right axis)
© O
EC
D/IE
A, 2
018
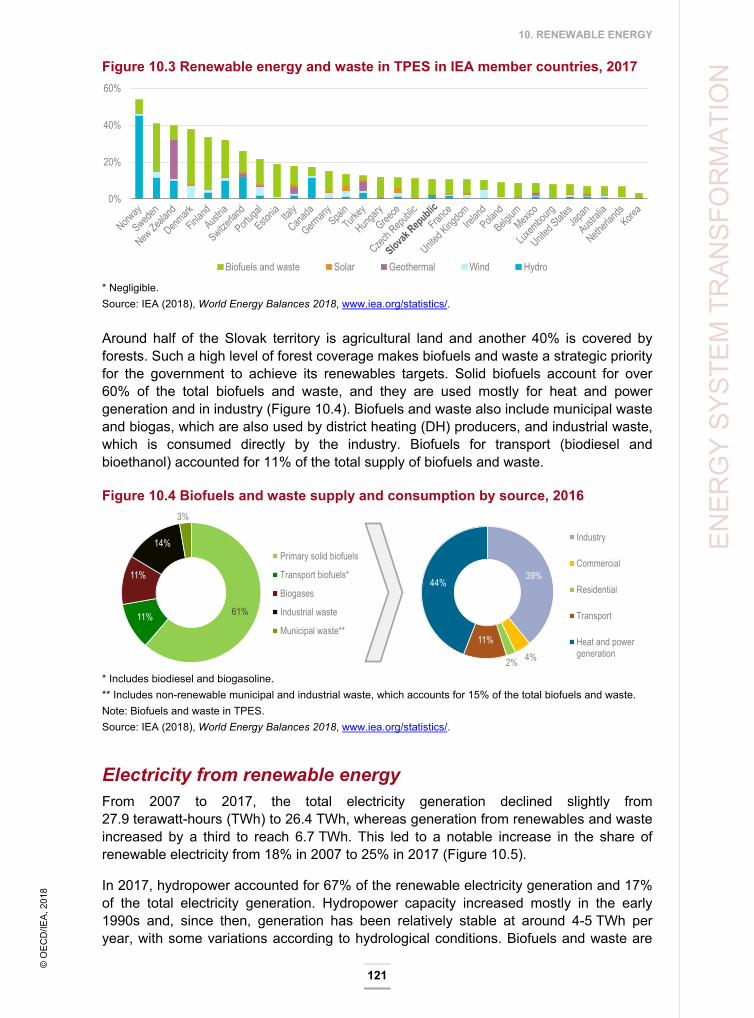
10. RENEWABLE ENERGY
121
EN
ER
GY
SY
STE
M T
RA
NS
FOR
MA
TIO
N Figure 10.3 Renewable energy and waste in TPES in IEA member countries, 2017
* Negligible. Source: IEA (2018), World Energy Balances 2018, www.iea.org/statistics/.
Around half of the Slovak territory is agricultural land and another 40% is covered by forests. Such a high level of forest coverage makes biofuels and waste a strategic priority for the government to achieve its renewables targets. Solid biofuels account for over 60% of the total biofuels and waste, and they are used mostly for heat and power generation and in industry (Figure 10.4). Biofuels and waste also include municipal waste and biogas, which are also used by district heating (DH) producers, and industrial waste, which is consumed directly by the industry. Biofuels for transport (biodiesel and bioethanol) accounted for 11% of the total supply of biofuels and waste.
Figure 10.4 Biofuels and waste supply and consumption by source, 2016
* Includes biodiesel and biogasoline. ** Includes non-renewable municipal and industrial waste, which accounts for 15% of the total biofuels and waste. Note: Biofuels and waste in TPES. Source: IEA (2018), World Energy Balances 2018, www.iea.org/statistics/.
Electricity from renewable energy From 2007 to 2017, the total electricity generation declined slightly from 27.9 terawatt-hours (TWh) to 26.4 TWh, whereas generation from renewables and waste increased by a third to reach 6.7 TWh. This led to a notable increase in the share of renewable electricity from 18% in 2007 to 25% in 2017 (Figure 10.5).
In 2017, hydropower accounted for 67% of the renewable electricity generation and 17% of the total electricity generation. Hydropower capacity increased mostly in the early 1990s and, since then, generation has been relatively stable at around 4-5 TWh per year, with some variations according to hydrological conditions. Biofuels and waste are
0%
20%
40%
60%
Biofuels and waste Solar Geothermal Wind Hydro
61%11%
11%
14%
3%
Primary solid biofuels
Transport biofuels*
Biogases
Industrial waste
Municipal waste**
39%
4%2%
11%
44%
Industry
Commercial
Residential
Transport
Heat and powergeneration
© O
EC
D/IE
A, 2
018

10. RENEWABLE ENERGY
122
the second-largest renewable source for electricity generation and provided 23% of the total renewable power generation in 2017, mainly used at co-generation1 plants.
Figure 10.5 Renewable energy and waste in electricity generation, 1973-2017
*Negligible. Note: Includes non-renewable waste. Source: IEA (2018), World Energy Balances 2018, www.iea.org/statistics/.
Solar power generation grew rapidly from 57 gigawatt hours (GWh) in 2010 to 715 GWh in 2014, after the introduction of the feed-in tariff (FiT). The exponential boom in solar photovoltaics (PV) created both technical and financial challenges, and in recent years the government cut back the support levels, which stalled the growth in solar power. In 2017, solar power accounted for 10% of the renewable electricity generation and 2.5% of the total electricity generation, same levels as in 2016.
Similar to the renewable share of TPES, the Slovak Republic has around the median share of renewable energy in electricity generation among the IEA member countries, which is significantly higher than several of its neighbouring countries (Figure 10.6). The share of wind power in electricity generation is the lowest in the comparison.
Figure 10.6 Renewable energy in power generation in IEA member countries, 2017
Source: IEA (2018), World Energy Balances 2018, www.iea.org/statistics/.
1 Co-generation refers to the combined production of heat and power.
0%
4%
8%
12%
16%
20%
24%
28%
0
1
2
3
4
5
6
7
1973 1977 1981 1985 1989 1993 1997 2001 2005 2009 2013 2017
TWh Biofuels and waste
Hydro
Solar
Wind*
Renewables share(right axis)
0%
20%
40%
60%
80%
100%
Biofuels and waste Solar Geothermal Wind Hydro
© O
EC
D/IE
A, 2
018

10. RENEWABLE ENERGY
123
EN
ER
GY
SY
STE
M T
RA
NS
FOR
MA
TIO
N Renewable energy potential
The overarching principle that guides the use of renewable energy in the Slovak Republic is cost-effectiveness. The government prioritises RES that put the least burden on final energy prices.
Biomass and waste In the 2014 Energy Policy (MoE, 2014), biomass is considered to have the largest renewable energy potential, with a theoretical capacity of 120 petajoules, or 2.9 Mtoe, and it has been the government’s priority to fulfil this potential to achieve the national RES targets. Biomass has particularly good prospects for heating, mainly in the form of solid biomass (primary forest residues and hay for central heating, briquettes and pellets for households). The government also sees biomass use well aligned with the emphasis on efficient co-generation, as biomass can be combusted with fossil fuels, in practice coal, both at thermal power plants and in co-generation plants.
However, there are concerns that the Slovak Republic’s forests in several regions are threatened by excessive logging and inadequate forest management. Logging is rising and negatively impacts the stability of the Slovak Republic’s ecosystems (EC, 2018a). Another concern is how to set the right balance between the competing priorities of energy and non-energy sectors for biomass use.
Hydropower The government notes that only about half of the hydropower potential is being utilised overall and only about 25% of the potential for small hydropower generation. The government is in the process of defining the potential for exploitable hydropower, taking into account the requirements of the EU Water Framework Directive 2000/60/EU.
Gabčíkovo, with an installed capacity of 720 megawatts (MW), is the Slovak Republic’s largest hydropower plant. Its annual production averages around 2.2 TWh, or roughly half of the total hydropower generation. Čierny Váh (735 MW) is the country’s largest pumped storage plant. The upper reservoir, located at the altitude of 1 160 metres, has no in-flows of its own and mainly provides grid support services to the power system. Both of these hydropower plants are expected to continue their operations beyond 2035.
The government recognises that hydropower, which includes pumped storage, can help balance load and thus add to the flexibility of the electricity system. Small, locally distributed hydropower plants equipped with smart technologies could further advance the role of hydropower with no disruptions in the transmission network.
Solar energy From 2010 to 2011, solar PV installations jumped from 19 MW to 496 MW, overachieving the original 2020 target capacity. Installed solar capacity totalled 533 MW at the end of 2013 and has stayed flat since then. After the unexpected solar PV boom, support for additional construction was halted through a legislative amendment to avoid problems in managing the electricity grid and escalating electricity prices. The government affirmed it has no plans to expand the current capacity until 2020 and the transmission system operator has defined the variable renewables, such as solar power and wind power, as “non-predictable RES” that require more stringent administrative procedures for development. The government prefers decentralised solar power generation used on buildings.
© O
EC
D/IE
A, 2
018

10. RENEWABLE ENERGY
124
Wind energy Wind resource potential is low to moderate in most of the country. The best wind conditions are in the mountainous areas (up to 2 500 full-load hours a year), but the installation of wind turbines in these areas is a challenge, and many locations are off-limits because of environmental protection (e.g. bird sanctuaries account for about 23% of the country’s territory). Nevertheless, the western part of the country, which borders on the Austrian Pamdorfer Plain, is flatter and offers around 2 000 full-load hours of wind a year. Given the experienced Austrian wind developers and geographical proximity, technical potential exists to develop transnational joint wind projects (AURES, 2016).
Geothermal The Slovak Republic’s geology is favourable to develop geothermal energy. Twenty-seven geothermal areas or structures, around 34% of the country’s territory, have been identified as potential areas for exploitable geothermal resources. The country has thermal waters, which range from low to high temperatures, that can be utilised for various purposes, but at present their use is limited to spas/swimming, DH, greenhouse heating and fish farming.
Institutions The Ministry of Economy (MoE) holds the main responsibility to develop policies and regulations on renewable energy. It analyses various RES to develop legislation and strategic plans, and permits and licences energy infrastructure. Externally, it engages with the European Union to promote the effective deployment of renewables in the country (e.g. EU structural funds)
The Ministry of Environment is responsible to develop and implement domestic sustainability criteria. It monitors the compliance of environmental criteria and conducts environmental impact assessments of various kinds of projects.
The Ministry of Agriculture and Rural Development co-operates with the MoE to set criteria and prepare strategic plans for using biomass and biofuels.
The Regulatory Office for Network Industries (RONI) regulates the network industries (electricity, natural gas, heat and water management). It also sets FiT rates, issues certificates of origin for electricity generated from renewable energy supplies and licenses business operations.
Policies and measures Targets The European Union’s renewable energy directive (2009/28/EC) sets a binding target for a 20% share of renewable energy in the gross final energy consumption by 2020 for the European Union as a whole. For the Slovak Republic, the target is 14%, a significant increase from 6.7% in 2005. The government plans to meet this target through an increase in the share of RES to 24% in electricity generation, to 14.6% in heating and
© O
EC
D/IE
A, 2
018

10. RENEWABLE ENERGY
125
EN
ER
GY
SY
STE
M T
RA
NS
FOR
MA
TIO
N cooling, and to 10% in transport (Table 10.1). The national target for the transport sector
is identical to the European Union’s common target of 10% renewable energy by 2020.
The 2010 Slovak National Renewable Energy Action Plan projected a 15.3% share of RES in the gross final energy consumption by 2020 (higher than the EU target of 14%) and the country is on track to reach this share (Table 10.2). The national 2020 target of 24% of RES in electricity generation was reached in 2016. The European Union has also set a 2030 target of 27% RES in the gross final consumption of energy, which will be binding at the EU level, but by the time of writing (May 2018), the negotiations on the new directive had not yet been concluded and it is too early to say in detail what the 2030 EU level target would imply for the Slovak Republic.
Table 10.1 National targets for renewable energy by sector, 2005 to 2020
Year 2005 2010 2011 2012 2013 2014 2015 2016 2017 2018 2019 2020 Heating (%) 6.1 7.6 8.0 8.5 9.2 10.2 10.9 11.7 12.5 13.3 14.1 14.6 Electricity (%) 16.7 19.1 19.3 20.2 21.0 21.5 23.0 23.3 23.3 23.7 23.9 24.0
Transport (%) 0.6 4.1 4.2 4.3 4.4 5.0 6.0 6.3 6.8 8.3 8.5 10.0 Total share of RES in gross final energy consumption (%)
6.7 9.5 8.2 8.2 8.9 8.9 10.0 10.0 11.4 11.4 13.2 14.0
Source: National Renewable Energy Action Plan, Bratislava, 2010.
Table 10.2 Progress with meeting the national targets for RES, 2004-15
Renewables in gross final energy (%)
2004 2005 2006 2007 2008 2009 2010 2011 2012 2013 2014 2015
Overall RES with aviation cap (%)
6.4 6.4 6.6 7.8 7.7 9.4 9.1 10.3 10.4 10.1 11.7 12.9
Heating (%) 5.1 5.0 4.5 6.2 6.1 8.2 7.9 9.3 8.8 7.9 8.9 10.8 Electricity (%) 15.4 15.7 16.6 16.5 17.0 17.8 17.8 19.3 20.1 20.8 22.9 22.7 Transport (%) 1.4 1.6 3.4 4.0 4.3 5.3 5.3 5.5 5.4 6.0 7.6 8.5 Source: Eurostat.
Overview of support framework The Slovak Republic has explicitly emphasised the government’s focus to promote RES for heat generation, mainly from biomass and waste, and a gradual decrease in support for renewable electricity. The government anticipates that the recent amendments to renewable energy legislation2 would trigger a more efficient, market-oriented development of RES in the country.
Financial support for renewables includes technology-specific FiTs for electricity generation, investment subsidies and tax credits (Table 10.3). FiTs are guaranteed for 15 years. However, the government decided to phase out FiTs in the coming years. 2 Act No. 309/2009 Coll. on Promotion of Renewable Energy Sources and High-Efficiency Co-generation, which sets an overarching framework for developing renewable energy in the country.
© O
EC
D/IE
A, 2
018

10. RENEWABLE ENERGY
126
Renewable energy use for heat production receives investment subsidies. As for tax incentives, renewable electricity is exempt from the excise duty. In the transport sector, biofuels are exempt from the mineral oil tax.
Table 10.3 Overview of financial support schemes to promote renewable energy by sector, 2017
Regulatory policies
Fiscal incentives and public finances
FiTs
Feed
-in p
rem
ium
Tend
ers
Quo
ta o
blig
atio
n w
ith tr
adab
le
gree
n ce
rtific
ates
Quo
ta o
blig
atio
n w
ithou
t Tr
adab
le g
reen
cer
tific
ates
Net
met
erin
g/ne
t billi
ng
Inve
stm
ent s
ubsi
dies
(i)
Tax
cred
its m
echa
nism
(ii)
Tax
cred
its m
echa
nism
(iii)
Sof
t loa
ns
RES-E Offshore wind
Onshore wind X X X Solar X X X
Hydropower X X Geothermal X X
Solid biomass X X
Biogas X X
RES- H/C
Solar thermal X Geothermal X Biomass X
Biogas X
Small-scale installations, e.g. solar thermal collectors, heat pumps, biomass boilers and pellet stoves
X
Others, i.e. aerothermal, hydrothermal
X
RES-T
Biogasoline X X
Biodiesel X X
Notes: (i) Granted by the Operational Programme Quality of Environment from the ERDF (European Regional Development Fund). (ii) Exception from excise duty for generators of renewable electricity from RES. (iii) Biofuels are fully exempt and the biofuels part of blended transport fuels is partially exempt (proportional to the share of biofuels component) of the mineral oil tax. Source: EurObserv’ER (2017), Slovakia Renewable Energy Policy Factsheet, www.eurobserv-er.org/pdf/renewable-energy-policy-factsheet-2017-slovakia/.
© O
EC
D/IE
A, 2
018

10. RENEWABLE ENERGY
127
EN
ER
GY
SY
STE
M T
RA
NS
FOR
MA
TIO
N Renewable electricity (RES-E)
The support for renewable electricity generation consists of three measures: FiTs, a priority connection to the network and exemption from balancing responsibility.
Feed-in tariffs The government mainly employs technology-specific FiTs that guarantee a fixed price for a duration of 15 years after the commissioning or a renovation. The final price of the FiT, determined by RONI, consists of two elements: the regulated price at which the distribution system operator (DSO) is obliged to uptake the generated electricity (called “electricity for losses”) plus a subsidy (surcharge) that covers the potential difference between the production cost and the regulated price. The subsidy also applies to electricity produced at high-efficiency co-generation plants with a total generating capacity of up to 125 MW, or up to 200 MW if more than 30% of the energy used is from renewable sources.
Since their introduction in 2009, the FiTs have been gradually reduced in pursuit of the government’s goal to achieve market-based optimisation of renewable electricity prices. As the country witnessed an unplanned solar boom as a result of generous FiTs in 2011, the size of solar installations qualified for subsidies was scaled back from 125 MW to 100 kW, and the FiT rates were nearly halved. As for other renewable sources, which included biomass and hydropower, the support limit was maintained at 125 MW.
In 2013, the Renewable Energy Act was further amended to limit the subsidies for solar PV to only rooftop installations of at most 30 kW of capacity. Subsidies for hydropower were also substantially reduced, as the maximum capacity for installations eligible for subsidies was reduced from 125 MW to 5 MW. For all other renewable energy plants with more than 5 MW of installed capacity (15 MW for wind power), the surcharge is paid only for the share of electricity generated that corresponds to the 5 MW capacity limit.
In 2016, the average subsidy for electricity generated from renewable sources and high-efficiency co-generation was euro (EUR) 133 per megawatt-hour (MWh). The total subsidy was around EUR 375 million and the gross electricity generated was 2.81 TWh. The FiT rates for installations taken into use in 2017 are shown in Table 10.4.
Operators of PV and wind power installations are eligible for investment subsidies under the Operational Programme Quality of Environment, in the case of which the FiTs will not be available. The use of RES is further encouraged through an exemption from excise tax. Since 2010, the tax on electricity has been stable at around EUR 1.32/MWh.
Table 10.4. FiT rates for new installations, 2017
Generating technology Capacity EUR/MWh Hydropower with the total installed capacity of the facility
Up to 100 kW inclusive 111.25 From 100 kW to 200 kW inclusive 109.15 From 200 kW to 500 kW inclusive 106.80 From 500 kW to 1 MW inclusive 105.11 From 1 MW to 5 MW inclusive 97.95
Solar energy with the total installed capacity of the facility
up to 30 kW 44.18
Wind energy 44.18
© O
EC
D/IE
A, 2
018

10. RENEWABLE ENERGY
128
Geothermal energy 108.71 Combustion in co-generation Of purposely growing biomass 70.31
Biomass sewage 74.3 Boliquids 80.86
Combustion of biomass/sewage with fossil fuels 74.83 Landfill gas or gas from sewage water treatment plants
58.66
Biomethane from biogas 95.95 Biogas generated by anaerobic fermentative technology with the total electric capacity of the facility
Up to 250 kW 102.00 From 251 kW to 500 kW 95.89 From 501 kW to 750 kW 91.61
More than 751 kW 90.02 Thermochemical gasification in the gasification generator
84.72
Fermented mixture produced by aerobic fermentation of biodegradable waste
78.42
Source. MoE.
Priority connection to the network To facilitate the integration of renewable energy into the network, the government warrants: (i) priority connection of such energy facilities to the regional distribution system and (ii) priority access to the grid (transmission and distribution) and supply of electricity, without any discriminatory limit based on the size of installed capacity.
In practice, however, connecting new facilities to the grid has stalled since 2013, because all three regional DSOs suspended distribution grid connection requests from all power facilities, both renewables and fossil fuel-based, with an installed capacity of more than 10 kW, out of a concern for grid stability and security.
The concerns were largely triggered by loop flows from Germany (Chapter 6). The government considers that the main challenge is the low capacity of the transmission system that ensures the efficient and stable deployment of RES technologies into the electricity system. It also considers that the sharp fluctuation degrades the quality of voltage in the distribution system, for which the legislation of the electricity industry is imposing increasingly stringent standards. As of 2018, this regulatory suspension still remains.
Although new facilities of more than 10 kW are, for the time being, not connected to the grid, since 2014 the legislation has been amended to simplify the process to connect renewable sources of up to 10 kW in households. These small facilities no longer require a construction permit. Only a simple, one-off information obligation is required without a further need to report. A national pilot project “Green Household” promotes the uptake of renewable electricity and heat generation in households. It is funded by the Operational Programme Environmental Quality and has been allocated EUR 45 million for its first phase (2014-18).
As another measure to enable the grid integration of decentralised, small RES, the government facilitates the wide-scale deployment of intelligent metering systems (IMS) (Chapter 6), an essential component of future intelligent networks. Currently, IMS is at its implementation phase, which targets around 400 000 intelligent meters deployed by the
© O
EC
D/IE
A, 2
018

10. RENEWABLE ENERGY
129
EN
ER
GY
SY
STE
M T
RA
NS
FOR
MA
TIO
N end of 2020. The government also supports the local level, widespread testing of
intelligent networks to promote intelligent cities, towns and regions by 2035. It is also considering developing energy storage capacity, another crucial component of the Slovak intelligent network.
Exemption from balancing responsibility The renewable electricity producers can transfer the liability for deviations, such as the difference between the actual electricity production and projected production, to the regional DSOs. This exemption from balancing responsibility is offered for the entire lifetime for plants with less than 500 kW of installed capacity and for 15 years for plants with at most 1 MW of installed capacity.
Heat from renewable energy (RES-H) The Slovak Republic relies mainly on the heating sector to achieve its 2020 RES target share of 14.6%. In 2015, the share of RES in heating was 10.8%, only slightly less than the projected share of 10.9%.
Solid biomass accounts for around 95% of the renewable energy for heating. The rest includes small volumes of biogas and negligible volumes of geothermal (apart from heat pumps) and solar energy. Biomass has proved effective in replacing coal and natural gas use for heating, especially for DH systems (Chapter 11), and is not subsidised. Although renewable energy is used mostly for DH, the government is also working to increase its role in individual heating.
Investment support is the principal form of support for renewable heating. All RES-H technologies, not just biomass, can benefit from the Operational Programme Quality of Environment, funded by the European Regional Development Fund (ERDF) for the seven-year period 2014-20. The fund aims to promote the smart construction and management of renewable energy production and consumption, and it prioritises renewable heating plants, which include co-generation installations. The programme prioritises renewables for DH, households (the “Green Household” initiative), heat distribution (Chapter 11) and RES for heating and cooling in public buildings.
The eligible projects include:
To convert fossil fuel plants with a maximum thermal input of 20 MW to use biomass.
To construct plants that:
produce biomethane
use hydropower
use aerothermal, hydrothermal or geothermal energy using heat pumps
use geothermal energy directly to produce heat, possibly co-generation
produce and use biogas, landfill gas and gas from sewage treatment plants. Households are eligible for subsidies to install biomass boilers and small heat pumps for their own use.
Renewable energy in transport (RES-T) Biodiesel is by far the largest RES for transport in the country, at around three-quarters of the total. The rest is bioethanol and RES electricity.
© O
EC
D/IE
A, 2
018

10. RENEWABLE ENERGY
130
The primary support scheme for RES-T is an obligation for producers and importers of transport fuels (petrol and diesel) to blend in a certain share of biofuels. The minimum content of biofuels in petrol and diesel is legally defined (Table 10.5). The Slovak government was the first among the Central and Eastern European states to introduce a biofuels blending obligation.
In 2017, the Slovak parliament set biofuels targets for the years 2018-30 inclusive. From 2017-18, the target increases from 5.8% of biofuels in transport to 7.6% in 2020. For the nine-year period 2022-30, the target is 8.2%.
Table 10.5 National targets for biofuels in transport and progress towards them
Year 2010 2011 2012 2013 2014 2015 2016 2017 2018 2019 2020 2021 2022-30
Target (%) 3.7 3.8 3.9 4.0 4.5 5.5 5.5 5.8 5.8 6.9 7.6 8.0 8.2
Actual share (%) 3.8 4.5 4.2 4.6 5.7 5.8
Source. MoE.
Biofuels are also supported through tax incentives. Diesel must contain at least 6.9% of biodiesel from 2018. Petrol must contain at least 5.9% of bioethanol in 2018, 6.2% in 2019 and 7.4% in 2020.
According to the trajectory for the share of biofuels in transport fuels, as presented in the Slovak Republic’s third biennial report to the UNFCCC, the country is likely to reach the 2020 target for the share of bioethanol in petrol (a 7.4% share is projected), but seems likely to miss the target for the share of biodiesel in diesel (a 6.9% share is projected).
To reach the RES-T target, the government prioritises the development of second-generation biofuels over the potential role of electric vehicles. Currently, the government is working on accelerating the use of second-generation biofuels produced from non-food crops, such as organic waste and wood, which do not conflict with the needs of food production. From 2020 on, a specific share of second-generation biofuels is required for a reduced rate of petrol duty: 0.5% in 2020, 1.0% in 2021 and 1.5% from 2022.
Assessment Renewable energy use has grown rapidly in the Slovak Republic over the last, mostly from biofuels and waste, which account for around four-fifths of the total supply, but also from some solar power.
Renewables deployment has been driven by binding EU targets for 2020 and the related ambitious national targets. The EU targets for 2020 are 14% renewables in the gross final consumption of energy (6.7% in 2005) and 10% renewables in transport. The Slovak Republic’s national targets for 2020, laid out in the 2010 National Renewable Energy Action Plan, are higher: 15.3% renewables in the gross final consumption, 24% of electricity from RES, 14.6% of heat from RES and 10% RES in transport.
© O
EC
D/IE
A, 2
018

10. RENEWABLE ENERGY
131
EN
ER
GY
SY
STE
M T
RA
NS
FOR
MA
TIO
N The national 2020 target of 24% renewables in electricity generation was reached in
2016. In 2015, biofuels accounted for 6.6% of the total energy consumption of the transport sector, driven by a blending obligation, and electricity for another 2.4%. The IEA congratulates the government for setting ambitious national targets and making clear progress on meeting them.
In its renewable energy policy, the government continues to give priority to biomass and its use for heat. The country has extensive forests, and biomass is thus a significant domestic low-carbon energy resource. In contrast, the cost-effective potential for renewable electricity seems more limited at the moment.
The focus on heat in renewable energy policy is also driven by the desire to minimise costs and also apply an integrated approach to utilise RES and decrease greenhouse gas emissions. This appears to make sense. In practice, biomass can replace coal use and also natural gas use in heating. This is especially true for DH systems for which, according to the government, the use of biomass as well as biogas and geothermal energy will lead to a significant reduction in natural gas consumption. Also, biomass use is not subsidised. Successful switches from fossil fuels to biomass in DH systems are also seen in countries such as Denmark, Sweden and Finland. A point of critical importance, the government should ensure that biomass is grown and sourced in an environmentally sustainable manner.
More generally, however, the government should identify the most cost-effective ways to meet the EU target on the share of renewables in the gross final consumption of energy. These ways can be to increase the renewables supply (for heat and electricity and transport) and/or energy efficiency. The IEA is not aware of any public assessments of the comparative cost-effectiveness of renewable and efficiency policies in the Slovak Republic and encourages the government to develop such an assessment to help meet future targets (2030 and beyond) in an optimal way.
To increase the renewable electricity supply is not a policy priority. The available hydropower capacity is already in use, and wind, solar and geothermal power, for the moment, require significant subsidies to be widely exploited. Also, the large-scale deployment of wind and solar power, in addition to being expensive with current technology in the Slovak Republic, appears a challenge for electricity networks system management. Low-carbon sources already generate 80% of electricity and the country has a significant generating capacity over peak demand (7.7 GW vs. 4.5 GW). Furthermore, another 940 MW of nuclear capacity is to come online in 2018-19. There simply does not appear to be a need for more low-carbon power capacity.
In 2009, the Slovak Republic introduced a technology-specific FiT as the main support instrument for renewable electricity generation. The tariffs are valid for 15 years. Solar power was initially subsidised at a high level, and as the total subsidies were not capped, they soon ballooned out of control. Similar costly policy failures were witnessed early this decade in other countries as well. To limit the damage, the government slashed the subsidy (to EUR 44/MWh) which in hindsight was the right thing to do. In 2016, the average subsidy per MWh generated from RES and high-efficiency co-generation was EUR 133, according to the government, around three times higher than wholesale electricity prices (EC, 2018b).
As a lesson learnt, it is important to apply a predictable and transparent monitoring process for the support costs, to analyse regularly their effectiveness and to adjust them
© O
EC
D/IE
A, 2
018

10. RENEWABLE ENERGY
132
for future facilities, or, preferably, introduce other systems, such as tenders. This still encourages investments, but avoids placing an excessive burden on consumers.
As solar and also wind power technologies continue to become cheaper, they may also one day be competitive without subsidies in the Slovak context. The government should require the three main DSOs to analyse how to prepare the electricity system to integrate higher shares of solar and wind power, for example by looking at international best practice.
Recommendations The government of the Slovak Republic should:
Identify the most cost-effective ways to meet the EU target on the share of renewables in the gross final consumption of energy through an increase in renewables supply for heat and electricity and/or energy efficiency, and focus efforts on these.
Monitor the cost‐effectiveness of the promotion mechanisms for RES and revise them periodically, in a transparent way, to reflect the technology learning curve.
Assess the technical and economic potential of individual domestic sources of renewable energy, taking into account environmental sustainability, and design promotion policies on that basis; ensure that the biomass used is from sustainable sources.
Require the DSOs to analyse how to prepare the electricity system to integrate higher shares of solar and wind power, for example by looking for international best practices.
References
AURES (2016), Implementation of Auctions for Renewable Energy Support in Slovakia: a case study, Fraunhofer ISI, Karlsruhe, www.auresproject.eu/files/media/documents/wp7_-_case_study_slovakia_3.pdf.
EC (European Commission) (2018a), “Country Report Slovakia”, 2018 European Semester: Assessment of Progress on Structural Reforms, Prevention and Correction of Macroeconomic Imbalances, and Results of In-Depth Reviews Under Regulation (EU) No 1176/2011, Brussels, https://ec.europa.eu/info/sites/info/files/2018-european-semester-country-report-slovakia-en.pdf.
EC (2018b), Quarterly Report on European Electricity Markets, Vol 10/4, Market Observatory for Energy, DG Energy, Brussels, https://ec.europa.eu/energy/sites/ener/files/documents/quarterly_report_on_european_electricity_markets_q4_2017_final.pdf.
IEA (International Energy Agency) (2018), World Energy Balances 2018 [database], OECD/IEA, Paris, www.iea.org/statistics/.
MoE (Ministry of Energy) (2014), Energy Policy of the Slovak Republic, MoE, Bratislava, www.economy.gov.sk/uploads/files/47NgRIPQ.pdf.
© O
EC
D/IE
A, 2
018

133
EN
ER
GY
SY
STE
M T
RA
NS
FOR
MA
TIO
N
11. Focus area: Heat and district heating
Key data (2015)
Heat consumption in buildings: 39.1 TWh (district heating 53%, individual heating 47%)
District heat generation*: 20.9 TWh (natural gas 44%, coal 16%, wood fuels 16%, nuclear 4%, others (including oil products, municipal waste and industrial heat) 20%)
Sold district heat: 14.0 TWh (apartments 39%, other 61%)
Exchange rate: euro: EUR 1 = USD 1.12 (2017)
*Breakdown in fuels based on 2014 data.
Sources: RONI (2017); MoE.
Overview of the heating sector The heating sector is a focus area for energy system transformation in the Slovak Republic. The country’s large and important district heating (DH) industry supplies most of heat demand in buildings. Natural gas is the main heat source, both in DH production and in individual boilers. A decline in heat demand and a shift away from fossil fuels are a challenge the DH sector, and a modernisation of the industry is necessary to adapt to these new conditions.
Heat consumption Heat is consumed in the form of space and water heating in buildings and as process heat in industry. The industrial process heat demand depends on the type of industries in a country and has little in common with space and water heating in buildings. This chapter focuses on heating in buildings, in particular on DH.
Energy savings from building insulation improvements have led to a decline in heat demand. Over half of multifamily residences have been renovated in recent years. Between 2000 and 2016, the overall energy intensity for heating per floor area of buildings was reduced by half (IEA, 2018). In 2015, the primary energy consumption for heat in buildings was 39.1 TWh, a decline by 10% since 2010 (Figure 11.1). The largest decline in heat demand was in space heating, whereas the water heating demand is less affected by energy efficiency measures.
Heat demand is projected to continue to decline slightly to just below 40 TWh in the coming decade, although continued energy efficiency improvements could reduce the demand further. In 2015, DH accounted for 53% of the total heat supply, and the remaining heat was produced in individual boilers using mainly natural gas (Figure 11.1).
© O
EC
D/IE
A, 2
018

11. HEAT AND DISTRICT HEATING
134
Figure 11.1 Heat consumption and projection for buildings by heat source, 2010-25
*The share between individual and DH in 2015 is estimated. Notes: The figures refer to primary energy supply. Year 2014 had an exceptionally low number of heating degree-days, which explains the large decline in heat consumption. Source: MoE, country submission, 2017.
In accordance with the European Union (EU) Energy Efficiency Directive (2012/27/EU), the Slovak Republic has constructed a “heat map” that shows the heat demand per municipality as well as the available production sites and DH. Cities and municipalities are obliged to regularly present thermal energy development plans. Furthermore, a national assessment is being developed to determine the potential for energy savings in the supply of heat and cooling.
Policy objectives Efficient heating systems in general and DH in particular are an important part of the energy transformation in the Slovak Republic. The 2014 Energy Policy (MoE, 2014) states four objectives for the thermal energy area:
deliver a sustainable heat supply, that is, a secure, reliable, reasonably priced, efficient and environmentally sustainable heat supply, from centralised heat supply systems in particular
increase the share of heat from locally available renewable energy sources (RES)
increase the efficiency in heat production and distribution
develop efficient DH systems.
The 2014 Energy Policy (MoE, 2014) lists several measures to achieve these objectives, which include the support of locally available RES and to create a long-term stable and predictable regulatory framework. Another focus is to create conditions for infrastructure refurbishment and future demand for heat as improvements in building insulation continue.
The Slovak Republic has set a target of 14% renewable energy in the final consumption by 2020, with a complementary non-binding target of 14.6% renewable energy in heat production. According to the government, renewable wood fuels and biogas accounted for 11% of the total heat production in 2014, up from 3% in 2010. More renewables in DH production is the main reason for the increased share of renewable heat overall. The Slovak Republic is thus on a good path towards the 2020 RES target. Yet, more efforts
0
10
20
30
40
50
2010 2011 2012 2013 2014 2015* 2017 2019 2021 2023 2025
TWh
Individual heating
District heating
Actual heat consumption Assumed heat consumption
© O
EC
D/IE
A, 2
018

11. HEAT AND DISTRICT HEATING
135
EN
ER
GY
SY
STE
M T
RA
NS
FOR
MA
TIO
N are needed and the country is focused on an increase in the share of renewable energy
in the heat sector, rather than in electricity generation (Chapter 10).
DH supply and demand The Slovak Republic’s DH system is one of the most developed in Europe, and it supplies 1.8 million citizens (one-third of the population) in 335 municipalities (RONI, 2017). DH networks were first introduced during the communist era, built to supply large parts of the population with a stable heat supply. Recent developments with milder winters in combination with more energy-efficient buildings have led to decreasing DH demand. Furthermore, the DH market has lost customers to individual heating solutions, mainly natural gas boilers. DH systems have not been adapted to the fall in demand and the existing infrastructure is old and inefficient, producing heat at excess capacity.
DH production In 2015, total DH production was 20.9 TWh (Figure 11.2) and heat sold by DH suppliers was 14.0 TWh (RONI, 2017). Distribution losses of roughly 10% account for part of the difference between produced and sold DH (Table 11.1), and the remaining difference can be explained by heat that is produced in industrial heat plants and used internally at the industry rather than sold on the DH market. In recent years, DH supply has steadily decreased, as heat demand falls. Bratislavská teplárenská, the largest DH supplier in Bratislava, reports a 43% decline in DH supply from 2001 to 2016. They claim that reasons for the decline are both energy savings and disconnection of residential and industry customers that switch to individual gas heating.
Figure 11.2 DH generation by fuel, 2010-14
*Other fuels includes oil products, municipal waste, industrial heat and process gases, geothermal and electric heat. Source: MoE, country submission, 2017.
Natural gas accounts for nearly half of the total DH generation, but the share has fallen from 52% in 2010 to 47% in 2015. Coal has declined even more significantly, from 23% in 2010 to 15% in 2015. Wood fuels have, however, increased rapidly from 5% of total DH generation in 2010 to 15% in 2015. In heat generation, wood fuels more than doubled over these years to offset the declines in coal and natural gas. The Slovak Republic has large domestic biomass resources in forests, so wood fuel output may increase further. Questions remain, however, on how sustainable an increased wood fuel production would be, and sustainability criteria were developed for the
0
5
10
15
20
25
2010 2011 2012 2013 2014 2015
TWh
Other fuels*
Nuclear energy
Wood fuels
Coal
Natural gas
© O
EC
D/IE
A, 2
018

11. HEAT AND DISTRICT HEATING
136
Operational Programme Quality of Environment, which supports the use of biomass in rural areas. Another concern that has been raised is the local emissions of particulate matter (PM) from burning biomass. This concerns especially small-scale heat producers whose emissions are not monitored in the same way as large production facilities, which are increasingly introducing cleaning technology to cope with emissions.
Besides wood fuels, biogas also has increased rapidly in DH production in recent years. Over a hundred biogas-fired power plants were built in recent years, of which around one-third are co-generation1 plants that also supplied DH. Biogas is mainly produced through anaerobic digestion of different organic wastes, and it accounted for around 2% of the total DH in 2015 (Euroheat & Power, 2017). Biogas production is a good option for managing organic waste, such as waste water sludge, and it thus brings environmental benefits beyond renewable energy production.
Other fuels and technologies Heat from nuclear power generation accounts for around 5% of the total DH production. The Bohunice V2 nuclear power plant supplies heat to the nearby city of Trava through a connection that was built in 1987, two years after the plant was commissioned. The heat network also supplies the towns of Leopoldov, Hlohovec and Jaslovské Bohunice (SE, 2017). There are no plans to expand DH generation from nuclear surplus heat.
Waste incineration accounts for only a minor share of DH production. There are two waste incineration plants in the Slovak Republic; one in Bratislava in the west and one in Košice in the east of the country, but only the Košice plant produce heat for DH. In 2016, around 10% of total municipal waste was incinerated, while two-thirds of the waste was put on landfill (Eurostat, 2017). Not all landfilled waste should be used in incineration, as recycling has a higher priority than energy recovery in the EU waste management hierarchy. Furthermore, some waste that contains toxic compounds is not suitable for incineration. Nevertheless, there is a large potential to increase waste incineration in the country, and to use more of that for DH production.
Geothermal heat for DH is produced at four towns in the southwest of the country, where geothermal energy covers large shares of the total DH production. The largest production is in Galanta, where geothermal heat accounted for 97% of the DH generation in 2013 (Halás, 2015). On a national level, however, geothermal is a small source of energy, with an annual heat production of roughly 30 GWh, but it can increase. The Slovak Republic has large geothermal resources, and geothermal DH can potentially reach a larger share of the population (GeoDH, 2014). However, the case for geothermal energy can be limited by the costs of geological surveys and equipment for mining and processing, and uncertainties remain about the potential to increase geothermal energy in DH.
Heat pumps can produce roughly three to four times as much useful heat as does consumed electricity, depending on the outdoor temperature and technology used, and become an attractive heating option with no local emissions. Large-scale heat pumps can also operate in DH systems. Most heat pumps use ambient air, ground source heat or exhaust air from ventilation to produce heat for space and water heating. Ground
1 Co-generation refers to the combined production of heat and power.
© O
EC
D/IE
A, 2
018

11. HEAT AND DISTRICT HEATING
137
EN
ER
GY
SY
STE
M T
RA
NS
FOR
MA
TIO
N source heat pumps have a higher performance, particularly in cold weather when
air-sourced heat pumps require more electricity or a backup heat source. Heat pump applications are not used to a large extent in the Slovak Republic today. As a comparison, in Finland, which has a similar population and a comparable DH market to the Slovak Republic one, over 800 000 were installed over the recent decades (SULPU, 2018).
Co-generation of heat and power In 2016, 55% of the DH in the Slovak Republic was produced in co-generation with electricity in co-generation plants (RONI, 2017). Most co-generation in the country uses co-generation plants with steam turbines, fuelled by mainly coal or biomass. In 2014, steam turbine co-generation accounted for 81% of the co-generated heat and 53% of the co-generated electricity. Gas-fuelled co-generation plants, which have a higher efficiency in power generation, accounted for only 9% of the heat in co-generation but 22% of the electricity (Ministry of Economy [MoE]).
Co-generation and RES are supported in Act No. 309/2009, “Support of Renewable Energy Sources and High Efficiency CHP”, which implements the EU Directive 2004/8/EC. The Act provides support for the electricity produced by RES or co-generation plants. The support includes connection to the regional distribution network and preferential access to the grid, as well as a guaranteed uptake of electricity by the distribution system operator for the regulated price (called “electricity for losses”) plus a subsidy that covers the potential difference between the production cost and the regulated tariff. The subsidy applies to electricity produced from high-efficiency co-generation plants with a total generating capacity of up to 125 MW, or up to 200 MW if more than 30% of the energy used is from renewable sources. This allows co-generation plants to operate without economic risk.
DH markets and infrastructure Market structure In 2016, 338 heat suppliers were licensed to produce and/or distribute heat, of which 87% were both producers and distributors (RONI, 2017). Most of these suppliers are small DH companies that operate in a single municipality, but some large national and international companies, e.g. Veolia, are also present in the market. For the larger cities, multiple companies may operate in the same city. The state owns and operates large co-generation plants that produce DH and electricity in six cities (Bratislava, Košice, Žilina, Trnava, Zvolen and Martin). Multiple companies can operate in one city, which is the case in larger cities.
A large share of DH is produced by small natural gas heat boilers connected to blocks of buildings. In 2014, nearly 40% of the total DH generation was from natural gas boilers, other than co-generation (MoE, country submission). As these small-scale natural gas boilers are placed in boiler houses next to apartment buildings, the heat supply is referred to as centralised heating, rather than DH (but included in the DH statistics). As the boiler houses are in cities and towns, they cannot easily be replaced by boilers that use more-polluting fuels, such as biomass.
© O
EC
D/IE
A, 2
018

11. HEAT AND DISTRICT HEATING
138
Infrastructure Large parts of the DH infrastructure are old and in need of replacement. Nearly half of the installed boilers are over 20 years old, and many over 30 years. Older boilers tend to be less energy efficient; on average, in the Slovak Republic boilers older than 20 years have a guaranteed efficiency of around 88% and newer boilers of around 90%.
The heat distribution system consists of 2 800 kilometres (km) of pipes that transport steam and water in primary and secondary networks (Table 11.1). Primary networks transport heat from the production sites via heat exchangers to secondary networks that reach the customers. Warm and hot water are the most common heat carriers, but older high-pressure steam transport still accounts for around one-quarter of the primary distribution, which results in more losses in the system. On average, the heat distribution networks are 15-30 years old, and many need upgrades to reduce the heat losses. With the recent decline in heat demand, parts of the heat distribution system have operated on excess capacity, which has resulted in increased losses. Distribution losses are higher in the Slovak Republic than the EU average (Euroheat & Power, 2017).
Table 11.1 DH distribution network parameters
Type of network Total length (km) Heat input (GWh) Heat output (GWh) Efficiency
Primary steam 70 2258 1889 83.7%
Primary warm water 817 3306 2968 89.8%
Primary hot water 734 2600 2431 93.5%
Secondary 1182 2049 1937 94.5%
Total 2803 10213 9225 90.5%*
*The total efficiency is calculated as the average efficiency of the different technologies, weighted based on heat output. Source: MoE, country submission.
Two support programmes have been used to incentivise investments to upgrade heat production and DH networks (Table 11.2). The Operational Programme Environmental Quality, part of the EU structural funds, focuses on the construction and upgrading of heat distribution systems and high-efficiency co-generation plants with a maximum thermal input of 20 MW. This programme will continue to fund investments until 2020. The SlovSEFF programme provides loans and grants for energy efficiency projects broadly and is funded partly by sales of greenhouse gas emission quotas. As of the end of 2017, another state aid scheme was introduced that will allocate EUR 100 million during three years to different projects that improve energy efficiency and environmental protection, and include projects to construct, reconstruct and modernise DH systems.
In the three-year period 2014-16, the programmes provided EUR 21 million to the heating network and plant investments, with the private sector as the largest contributor. The investments that resulted are presented in Table 11.3. The investment funds seem to have had a positive effect, as planned investments increased in the years 2014-16. However, the investment data are spread too broadly over different categories for clear conclusions to be made on the effectiveness of the financial schemes.
The DH sector in the Slovak Republic, as in many other Central Eastern European countries, struggles with legacy DH systems that were built to supply larger volumes of high-temperature heat and are overdimensioned today. Researchers have proposed a
© O
EC
D/IE
A, 2
018

11. HEAT AND DISTRICT HEATING
139
EN
ER
GY
SY
STE
M T
RA
NS
FOR
MA
TIO
N fourth generation of DH (4GDH) as a way to modernise the DH technology and
infrastructure to better meet future demand. 4DGH represents the supply of low-temperature heat, which is more suitable for well-insulated houses and to utilise RES (Box 11.1). This development addresses the challenges for the Slovak Republic’s DH markets. New DH technology also offers a smart and efficient integration with other energy systems.
Table 11.2 Investment programmes in the heating sector (euro million)
Programmes 2014-16 EU funds State budget Private budget Total Operational Programme Quality of Environment
4.3 0.761 5.082 10.153 SlovSEFF III 0.58 0.103 10.199 10.882
Source: MoE, presentation at the IDR visit, 2017.
Table 11.3 Investments in the heating sector, 2014-16
Investments (EUR million) 2014 2015 2016 Heat production facilities 23.4 28.6 1.6
Heat distribution facilities 27.0 10.3 75.4
Planned general repairs 6.9 0.2 4.7
Other* 4.1 49.8 12.0
Total 61.4 88.8 93.7
*Other includes environmental improvements and construction of small steam engines for electricity generation. Source: RONI (2017), Annual Report 2016, www.urso.gov.sk/sites/default/files/RONI_AR_2016.pdf.
4GDH development has the potential to enable efficient DH systems to increase as the heat demand per customer is further reduced. DH companies can benefit from taking an active role in energy efficiency projects to ensure a good integration with the DH supply. However, this requires new business models for DH companies to collaborate more with different customers.
DH regulation An earlier IEA study on challenges for the DH markets in transition economies stated that the DH sectors are faced by a poor customer focus, low efficiency, excess production capacity and an uneven playing field. The study outlines two potential paths to address these issues and allow the sector to achieve its full potential: increased competition or better regulation (IEA, 2004).
Whether a country should increase competition or improve regulation depends on the structure of the heat market. An open heat market approach can work if DH is considered to compete with other heat supply technologies. The market will ensure a balance between supply and demand, and DH will survive where competitive. This requires that other energy markets are also open for competition without price regulation, and that barriers for customers to switch between technologies are not too high. A free and competitive heat market still allows for policy measures, such as energy and carbon taxes, to steer towards more low-carbon energy sources.
© O
EC
D/IE
A, 2
018

11. HEAT AND DISTRICT HEATING
140
Box 11.1 4GDH and integrating heat and electricity systems
Since its introduction in the late 19th century, DH technology has evolved through three generations characterised by the type and temperature of the transport media, and towards lower network-temperature levels: the first generation was based on steam, the second generation uses high-pressure water with supply temperatures above 100°C and the third generation represents the current DH systems with supply temperatures between 80°C and 100°C (Dalla Rosa et al., 2014).
The fourth-generation DH systems emerge as low-temperature networks that, compared with existing DH systems, reduce the supply temperature to around 50°C in flow pipes from the producer and 20°C in the return pipes to better match the heat demand profile (Lund et al., 2014). A 4GDH network should be able to recycle heat from low-temperature sources and distribute it with low losses in the network. Lower temperatures enable the use of more industrial waste heat and renewable heat sources, such as geothermal energy and solar heat. Low-temperature DH is tested in pilot projects, for example, in Lystrup in Denmark, where a DH of 50°C is supplied to low-energy houses (Schmidt et al., 2017).
Furthermore, a 4GDH system should be able to integrate with other energy systems, which include the electricity grid and the natural gas grid, and form an integrated part of smart energy networks to improve the system efficiency and enable synergies from sector coupling. Heat and electricity systems are integrated in several ways, for example, in the co-generation of electricity and heat, or when DH is produced in electric boilers or heat pumps. Heat can be stored more easily than electricity, and so can be used for system balancing of variable power generation. An effective integration requires communication between energy production, distribution and consumption, as well effective automation and control.
DH networks differ from electricity and gas networks in that they are local and often supplied by one producer that also owns the distribution grid. Customers are thus unable to switch DH suppliers. DH networks are often considered to be natural monopolies and, as such, subject to monopoly regulation to protect customers from paying too high a price. Regulation affects both how prices are set on the market and how access to the DH network is restricted or enforced for suppliers and customers. The regulatory framework can vary from strict regulation to unregulated free market competition via different regulatory models (Figure 11.3).
Figure 11.3 Regulation models for DH networks
PRICE REGULATION
• Prices set directly by government
• Prices regulated by regulator• Cost-plus regulation • Price regulation by alternative cost regulation• Price regulation by benchmarking
• No price regulation, competitive heat market
STRICT REGULATION
FREE COMPETITION
ACCESS REGULATION
• Connection requirements for all customers
• Conditional access• Connection requirements in some areas• Conditional connection requirements • Conditional third party access
• No connection requirements for customers
© O
EC
D/IE
A, 2
018

11. HEAT AND DISTRICT HEATING
141
EN
ER
GY
SY
STE
M T
RA
NS
FOR
MA
TIO
N In the Slovak Republic, heat supply is regulated under two laws: Act No. 657/2004 Coll.
on thermal energy regulates access to DH networks, and Act No. 250/2012 on regulation in network industries regulates the heat price. The Regulatory Office for Network Industries (RONI) was established in 2001 as an independent regulator for DH, as well as for electricity, gas and water. RONI provides licences for DH production and distribution, and regulates the prices for each DH supplier and network.
Access regulation In terms of access to DH networks, regulation sets the conditions for both customers and heat suppliers. Customers in an area with access to DH networks can be obliged to connect and be unable to switch to another heat supply source. This obligation can also be conditional, based on local conditions or environmental performance of the alternative heat source.
Countries that use stricter price regulation tend to also have a stricter regulation of access and connection to the DH networks to provide stability for the industry. In unregulated DH markets, such as in Sweden and Finland, there is typically no regulation on customer switching between heating technologies, as this would disrupt the free market competition. Some countries allow for municipalities to set up local DH connection requirements, which is the case in, e.g. Norway.
DH customers in the Slovak Republic are allowed to switch from DH to another heat source, but only on certain conditions:
if the customer and supplier agree to the switch
if the supplier does not meet important essentials of the contract of heat supplies
if an alternative heat supply has a share of renewable energy that is 20% higher than the share in the DH supply (if the DH supply has over 60% renewables, the alternative heat must be 100% renewable energy for a switch to be allowed).
Over 90% of Slovak households are connected to a gas network, which provides an accessible heating alternative, and DH companies have reported a loss of customers to natural gas heating in recent years. However, the regulation limits the possibilities to switch from DH.
Besides the access requirements for DH customers, the Slovak Republic also regulates how new heat producers can be established on the market. A licence is required to construct a heat-producing facility of installed capacity above 10 MW. The licences are issued by the MoE and granted only to heat production that does not have negative impacts on the operational efficiency of existing heating systems or on the environment.
For heat suppliers, third-party access (TPA) to DH distribution grids can be allowed in regulation as a way to increase the use of surplus heat sources from other industries and improve competition in unregulated DH systems. The development of low-temperature DH networks will enable more such TPA collaboration, if the regulation allows for it. However, TPA is complicated, as it can interfere with existing DH production in the grid, and TPA is not available in DH networks in the Slovak Republic. Sweden has adopted a conditional TPA regulation, and has started to see initiatives on TPA collaboration on market premises, such as Stockholm Exergi’s open DH concept (Stockholm Exergi, 2018).
© O
EC
D/IE
A, 2
018

11. HEAT AND DISTRICT HEATING
142
Price regulation In terms of prices, regulation varies from strict price setting by governments to completely unregulated markets in which the DH supplier decides the price in competition with other heating technologies. Hungary is an example of a strictly regulated DH market, in which the heat price is set by recommendation from the government. A DH subsidy is required to compensate companies that otherwise would make losses when the production costs are higher than the set price (IEA, 2017a). Sweden and Finland are examples of unregulated DH markets, in which DH is considered to compete with other heat sources, such as heat pumps.
In between strict regulation and free market prices are price regulations by the regulator. Prices can be regulated in a cost-plus model, in which the heat supplier is allowed to cover its production costs and obtain a reasonable return on its investments. This is the case for the Slovak Republic. Another model for price regulation is to set a cap on the DH price and allow for any price models below that cap. The price cap can be based on best practice through a market benchmark or defined by an alternative heat supply technology (Box 11.2).
In the Slovak Republic, DH is relatively heavily regulated in a cost-plus model. RONI sets the heat price separately for each local DH network, based on a fixed and a variable component. The fixed component includes a reasonable return on investments, based on delivered capacity two years previously. The fixed costs may increase only in the case of investments to make heat generation and distribution more efficient. At the end of each year, actual costs need to be submitted by the company to RONI, and if actual costs were lower than approved costs, the surplus must be returned to the customers.
The price is the same for all customers in the network, irrespective of size, for instance, and set annually during a regulatory period (the most recent five-year period was 2012-16, with a new one from 2017). There is no flexibility for suppliers to differentiate their fees over customer groups or over time of the year. Unlike natural gas and electricity prices, however, DH prices can vary significantly between different networks. There are no energy efficiency requirements for the DH suppliers, but a possible “fuel bonus” as part of the variable cost component, if the fuel costs are lower than expected costs.
When free competition is not considered a suitable option, IEA (2004) recommends a sound price regulation that:
Covers the current operational costs, which include replacement cost and return on investment.
Is competitive with other heat sources and protect customers from unjustifiable prices.
Provides DH companies with incentives to reduce costs.
Gives heat suppliers and customers incentives to save energy.
Is transparent and easy to understand for customers.
© O
EC
D/IE
A, 2
018

11. HEAT AND DISTRICT HEATING
143
EN
ER
GY
SY
STE
M T
RA
NS
FOR
MA
TIO
N
Box 11.2 Price cap models for DH
A main criticism presented against cost-plus regulation is that it does not provide enough incentives to improve the operation efficiency, as cost savings in one year lead to a lower price margin in the next. To increase the efficiency incentives in regulated DH systems without exposing customers to unreasonable prices, a price cap regulatory model can be used. The two main models for DH markets are alternative cost regulation and benchmark regulation. Alternative cost regulation of DH is used in the Netherlands and Norway. In the Netherlands, the DH price is capped by the price of natural gas, the competitive heating alternative, whereas Norway uses a price cap based on the electricity price. Regulation based on alternative energy prices protects DH customers from unfairly high prices and ensures that the DH option is price competitive. It does not, however, take into account the actual cost of producing the heat, and companies can experience a large price fluctuation if the price of the alternative heat source changes. Benchmark regulation refers to defining a price cap based on the market average cost levels or the best practice defined in a benchmark analysis. This approach to price regulation is not only used in DH markets, but also in many network industries or other monopolistic sectors, such as health care. A new benchmarking regulation for DH is about to be implemented in Denmark (IEA, 2017b). Benchmark regulation has the benefits that it creates a competitive environment for cost efficiency improvements, and inefficient suppliers can learn best practice from other companies. The major challenge in benchmark regulation is to define the right benchmark, especially for DH markets in which local conditions have a significant impact on cost structures. Besides operational efficiency, production cost is also affected by factors such as population density, heat consumption patterns and boiler and fuel type. An analysis of benchmarking in Lithuania’s DH market concluded that local variations were too large to set prices based on only one factor. However, when subdivided into several factors and the production costs at different heat volumes, network loading intensity, fuels and technology looked at, the study found correlations that could be used to construct the relevant benchmarks (Sarma and Bazbauers, 2016). A thorough analysis is needed to identify the relevant benchmarks in a specific market.
Table 11.4 provides a summary of the price regulation models with regards to the five recommendations for sound price regulation. The table gives a simplistic overview, and variations can occur. Nevertheless, it shows that no price regulation in its basic form fulfils all the recommendations.
Table 11.4 Summary assessment of DH price regulation models
Recommendations for sound price regulation
Cost-plus regulation Alternative price regulation
Benchmarking regulation
Covers the current operational costs
Yes No Partly – depending on the performance
© O
EC
D/IE
A, 2
018

11. HEAT AND DISTRICT HEATING
144
Protects customers from unjust prices
Yes, but prices can vary between systems and be higher than alternatives
Yes Yes, but can be more expensive than
alternatives
Provides cost reduction incentives
No Yes Yes
Provides energy efficiency incentives
Not necessarily, but can be included
Not necessarily, but can be included
Not necessarily, but can be included
Is transparent and easy to understand
Yes, if clear cost parameters are defined
Yes Can be complicated to construct and understand
Assessment Renewable energy and decarbonisation potential in heat supply The heating sector in general and DH in particular are essential for the energy transformation in the Slovak Republic. Natural gas is the dominant fuel in both individual heating and in DH, and together with coal it accounts for 60% of the total DH production. However, biomass has more than doubled in DH over the past four years and replaced fossil fuels, which has improved both the sustainability and security of the heat supply. Further transition should be encouraged, with the aim to develop heating systems based on renewable and other low-emission energy sources used in high-efficiency production technologies, such as co-generation plants and ground source heat pumps. Initially, the remaining coal in DH should be phased out and replaced by cleaner energy sources, especially in the state-owned large co-generation plants.
The Slovak Republic has large forests and the uptake of domestic biomass could increase further; however, the forest management needs to be sustainable. There are also forest areas that are protected from exploitation. In line with EU recommendations, strict sustainability criteria should be applied for the use of domestic biomass to ensure that forest resources are managed well. Furthermore, concerns over local air pollution from biomass combustion should be addressed. Under the Industrial Emissions Directive, the EU limits PM emissions and provides advice on the best available technology for flue gas cleaning in large biomass heat and power plants (JRC, 2017).
Heat pumps can replace fossil fuels in DH systems and provide attractive complements to natural gas boilers in residential areas. Except in a few pilot projects, heat pumps are not used in the current DH production in the Slovak Republic. The technology is available, and deployment of heat pumps could be incentivised through stronger environmental taxation (e.g. carbon taxation) or through investment support schemes. Small shares of DH are produced from waste incineration, biogas, geothermal energy and surplus heat from nuclear power and other industries. These heat sources can all increase and further decarbonise the DH supply. Waste incineration provides especially large potential and can be incentivised through, for example, landfill restrictions.
New DH generation technology and low-carbon heat sources The current DH infrastructure was built mainly during the 1960s and 1980s, and, although a valuable asset, the overall decline in heat demand and customer shift to individual heating solutions has left DH systems overdimensioned and inefficient. In
© O
EC
D/IE
A, 2
018

11. HEAT AND DISTRICT HEATING
145
EN
ER
GY
SY
STE
M T
RA
NS
FOR
MA
TIO
N recent years, the sector has made large investments, supported by the state and EU
funds, to increase the share of renewable energy sources and energy efficiency in DH systems. However, further investments are required to modernise and improve the efficiency of the Slovak DH systems, in line with 4GDH development. Furthermore, the potential for renewable and waste heat utilisation would increase further if low-temperature heat could be used in the networks. Based on the “heat map”, the government should assess strategic investments in DH infrastructure modernisation, and direct public and private investment funds towards these areas.
The government should also review its policy on research, development and demonstration (RD&D) to better align the RD&D resources with its targets on energy and environment. New technologies for DH networks and the control of energy consumption in buildings can improve the performance in the sector. Regulation should allow for innovation in the heat supply and distribution, and encourage integration with smart and energy-efficient buildings. To speed up the development, the government can direct RD&D funds at, for example, waste heat utilisation, distributed renewable heat generation or pilot projects for the smart integration of low-temperature DH with other energy systems. The DH industry should be invited to take an active part in RD&D projects and funding for new DH solutions.
Flexible regulatory framework and long-term investments As energy efficiency improvements continue to lower the heat demand, DH suppliers need to adopt new business models to remain profitable. This includes a closer relationship between heat producers, distributors and customers to realise the potential for energy savings. The current regulatory framework with fixed prices for each DH system does not provide enough flexibility to develop new and innovative business and price models. Furthermore, DH suppliers apply the same DH price throughout the DH system and year, which does not reflect differences in heat loads and production costs. The DH industry has expressed the need to be able to negotiate prices with customers and offer differentiated prices that help optimise the system operation. A diversified price model enables price signals that steer towards a more efficient production and consumption, which would benefit both customers and DH suppliers. Furthermore, the regulation should increase the opportunities for TPA and decentralised heat production.
Within the cost-based price regulatory model, DH suppliers lack a strong incentive to improve cost-effectiveness in the systems. Other countries are trying out different regulatory models to increase the efficiency in the sector and the Slovak Republic can learn from international experience. Denmark’s new benchmarking price regulation should be followed closely to gain experience in how they define relevant market benchmarks and promote efficiency improvements. Likewise, the regulatory model in the Netherlands can provide lessons on alternative price regulation. Based on international best practice, the Slovak Republic should create a new regulatory model that incentivises efficiency improvements and allows more market flexibility to encourage long-term investments by the industry. The government can start by investigating the design of a possible benchmarking system and adopting efficiency requirements within the current regulatory framework.
For DH to remain relevant, DH market development must go hand-in-hand with further improvements to energy efficiency and increased utilisation of the sustainable energy sources. In some places, DH might be replaced by heat pumps, and in other areas DH networks can continue to grow and be modernised, supplied by a range of low-carbon
© O
EC
D/IE
A, 2
018

11. HEAT AND DISTRICT HEATING
146
heat sources. This development should follow from market-based business decisions under a more flexible regulatory framework. Finally, energy policy and regulation must be aligned across the energy sectors for DH to compete on fair market terms with other heating alternatives. Unlike gas and electricity consumption, DH prices can vary significantly across systems. With the regulated fixed tariff for natural gas, more customers will probably want to switch from DH to individual gas heating. The government needs to take a broad perspective on energy market regulation and co-ordinate between the sectors.
Recommendations The government of the Slovak Republic should:
Utilise domestically available renewable and low-emission energy sources to reduce further the carbon dioxide emissions and local air pollution in the heating sector and to improve the security of supply:
> Assess the potential for further growth in the supply of domestic biomass and apply clear sustainability criteria for its uptake and consumption.
> Accelerate the replacement of coal in state-owned co-generation plants with lower emission sources, with the preference given to renewable energy, such as domestic biomass, biogas, geothermal energy and non-recyclable waste.
> Encourage the use of efficient heat pumps in DH and individual heating, for example, through investment support and carbon-based fuel taxes.
Identify strategic areas for investments in energy efficiency and DH infrastructure improvements, and direct funding and RD&D support towards projects that modernise DH systems in line with 4GDH development.
Implement a new regulatory framework that enhances the efficiency and flexibility in the DH market and creates a long-term stable environment for investments:
> Allow companies more flexibility to negotiate prices and use, for example, benchmarking or alternative cost regulation to protect consumers from unfair price increases.
> Enable third-party access to DH networks to increase the opportunity for waste heat utilisation.
> Introduce efficiency improvement targets for DH suppliers and encourage DH industries to participate in public energy efficiency projects.
References
Dalla Rosa, A. et al. (2014), Annex X Report: Toward 4th Generation District Heating, IEA/DHC/CHP, IEA, Paris.
Eurostat (2017), “Municipal waste generation and treatment, by type of treatment method”, in Sustainable Consumption and Production, European Commission, Brussels, http://ec.europa.eu/eurostat/web/sdi/eu-sds/sustainable-consumption-and-production.
© O
EC
D/IE
A, 2
018
11. HEAT AND DISTRICT HEATING
147
EN
ER
GY
SY
STE
M T
RA
NS
FOR
MA
TIO
N JRC (Joint Research Centre) (2017), Best Available Techniques Reference Document for
Large Combustion Plants, EC, Brussels, http://eippcb.jrc.ec.europa.eu/reference/BREF/LCP/JRC107769_LCP_bref2017.pdf.
Euroheat & Power (2017), “District Energy in Slovakia”, Country Profiles, Euroheat & Power, Brussels, www.euroheat.org/knowledge-centre/country-profiles/.
Stockholm Exergi (2018), “Open district heating”, Stockholm Exergi, Stockholm, www.opendistrictheating.com/.
GeoDH (European Geothermal Energy Council) (2014), D2.2 Geothermal DH Potential in Europe, GeoDH, Brussels, http://geodh.eu/wp-content/uploads/2014/11/GeoDH-Report-D-2.2-final.pdf.
Halás, O. (2015), “Geothermal District Heating Systems in Slovakia – Current Status and Plans”, Proceedings of the World Geothermal Congress 2015, International Geothermal Association, Bochum.
IEA (International Energy Agency) (2018 forthcoming), Energy Efficiency Indicators Highlights 2018 (preliminary), OECD/IEA, Paris, www.iea.org/statistics/.
IEA (2017a), “Hungary 2017”, Energy Policies of IEA Countries series, OECD/IEA, Paris, www.iea.org/statistics/.
IEA (2017b), “Denmark 2017”, Energy Policies of IEA Countries series, OECD/IEA, Paris, www.iea.org/statistics/.
IEA (2004), Coming in from the Cold, Improving District Heating Policy in Transition Economies, OECD/IEA, Paris, www.iea.org/statistics/.
MoE (Ministry of Energy) (2014), Energy Policy of the Slovak Republic, MoE, Bratislava, www.economy.gov.sk/uploads/files/47NgRIPQ.pdf..
RONI (Regulatory Office for Network Industries) (2017), Annual Report 2016, RONI, Bratislava, www.urso.gov.sk/sites/default/files/RONI_AR_2016.pdf.
Sarma, U. and G. Bazbauers (2016), District Heating Regulation: Parameters for the Benchmarking Model”, Institute of Energy Systems and Environment, Riga Technical University, Riga.
Schmidt, D. et al. (2017), “Low temperature district heating for future energy systems”, Energy Procedia Vol. 116, Elsevier, Amsterdam, pp. 26-38.
SE (Slovenské Elektrárne a.s.) (2017), Bohunice nuclear power plant, SE, Bratislava, www.seas.sk/bohunice-nuclear-power-plant.
SULPU (Finnish Heat Pump Association) (2018), Heat Pump Investments up to Half a Billion a Year in Finland, SULPU, Turku, www.sulpu.fi/documents/184029/0/Press%20Realaese%20-%20Heat%20Pump%20Investments%20up%20to%20a%20Half%20Billion%20a%20Year%20in%20Finland%2C%202.pdf.
© O
EC
D/IE
A, 2
018

148
© O
EC
D/IE
A, 2
018

149
EN
ER
GY
SY
STE
M T
RA
NS
FOR
MA
TIO
N
12. Energy technology research, development and demonstration
Key data (2016)
Government energy RD&D spending: EU 18.5 million
Share of GDP: 0.023% (IEA* median: 0.024% average: 0.030%)
RD&D per capita: EUR 3.40
Exchange rate: euro: EUR 1 = USD 1.12 (2017) * Median of 17 IEA member countries for which 2016 data are available.
Overview The overall responsibility for science and technology policy is in the Ministry of Education, Science, Research and Sport (MESRS). The orientation of energy research, development and innovation (RDI) is derived from the state technical and energy policy of the Slovak Republic. In practice, the responsibility to develop the energy policy of the Slovak Republic and implement it is in the Ministry of Economy (MoE). Energy policy directions are outlined in the 2014 Energy Policy (MoE, 2014).
The priority in energy research and development (R&D) is safeguarding sustainable energy in the Slovak Republic. The “Research and Innovation Strategy for Smart Specialisation of the Slovak Republic 2014-2020” comprises the following priorities linked to energy:
production and transmission of electricity: increase the transmission capacity and safety of the electricity system in the Slovak Republic
nuclear power: R&D projects on fast reactor ALLEGRO to increase the safety and efficiency of nuclear power plant decommissioning and waste management
smart grid technology: smart grids, self-sufficient regions and microgrids, renewable energy, electromobility and smart metering
materials for energy: construction materials, functional materials, technological processing and production of materials
heat: combined production of electricity, heat and cooling to cut costs and materials, and improve energy recovery from waste.
© O
EC
D/IE
A, 2
018
12. ENERGY TECHNOLOGY RESEARCH, DEVELOPMENT AND DEMONSTRATION
150
As laid out in the 2014 Energy Policy document (MoE, 2014), R&D will focus on new and renewable, ecologically friendly energy sources, and the rationalisation of energy consumption in all sectors of the economy and energy distribution such as:
exploration of domestic reserves of energy raw materials, geothermal energy and their efficient exploitation
development of technologies to obtain electricity and heat from renewable energy sources (RES) (hydropower, solar energy, wind and biomass)
research in nuclear focused on security and waste management
research into fourth-generation reactors and nuclear fusion (the Slovak Republic's involvement in the worldwide ITER and DEMO projects1)
development of new energy transmission systems (power cabling without stray electric and magnetic fields)
development of technology to increase energy efficiency and to decrease energy intensity.
Institutions General Responsibilities for general RDI policy are split among several ministries and implementing agencies. The main body in the sector is MESRS. It implements the Operational Programme Research and Development and the Operational Programme Education.2 The Slovak Government Council for Science, Technology and Innovation, placed under the Office of the Deputy Prime Minister, is the key body for RDI co-ordination. Each ministry manages its own network of agencies.
Overall, the research, development and demonstration (RD&D) system is relatively fragmented, as it comprises 34 higher education institutions and the Slovak Academy of Science.
On funding, the MESRS administers funds for 23 public higher education institutions. It also directs funding agencies for basic research (VEGA, KEGA), applied research (the Slovak Research and Development Agency [SRDA]), and the Research Agency. The Operational Programme Research and Innovation (OPRI) is responsible for funding public research projects.
For programme management, the SRDA plays a key role in managing R&D grant schemes and is responsible for R&D promotion in all research fields, which includes international research co-operation.
Innovation policy measures are implemented by the MoE and its agencies (the Slovak Business Agency, the Slovak Investment and Trade Development Agency and the Slovak Innovation and Energy Agency [SIEA]). The MoE implements the Operational
1 International Thermonuclear Experimental Reactor (ITER), Demonstration Fusion Power Plant (DEMO). 2 Operational programmes are detailed plans set out by EU member states that allocate funding from the ESIF for the programming period.
© O
EC
D/IE
A, 2
018

12. ENERGY TECHNOLOGY RESEARCH, DEVELOPMENT AND DEMONSTRATION
151
EN
ER
GY
SY
STE
M T
RA
NS
FOR
MA
TIO
N Programme of Competitiveness and Economic Growth. The SIEA and the Research
Agency implement innovation-related and other projects funded by OPRI (Baláž et al., 2018).
Historically there are two main pillars of RDI in the Slovak Republic: nuclear and renewables. Since 2011 renewables represents over half of the R&D budget allocations.
Nuclear research The principal nuclear engineering and research organisation in the Slovak Republic is VÚJE. Established in 1977 to carry out research related to nuclear science and engineering, there are currently over 700 employees. After the establishment of the Slovak Republic in 1991, funding for nuclear research represented a small share of the overall R&D. In 1994, Slovenské Elektrárne (originally a state-owned nuclear research institute) became a joint stock company, mainly owned by current and former employees. Changes in the ownership structure from a public to private company also led to a diversification of work and a transformation from primarily a research organisation into an engineering company. VÚJE carries out a wide range of activities related to the design, construction, operation and decommissioning of nuclear and non-nuclear energy installations – including hydropower, fossil and wind power plants. It also serves as the technical support organisation for the nuclear safety regulator, Úrad jadrového dozoru.
Renewable energy The Slovak University of Technology (SUT) hosts the National Centre for Renewable Energy Research and Applications. The Centre focuses on research on biomass, solar energy and hydropower. Four SUT faculties are involved in the Centre’s work: Chemical and Food Technology, Electrical Engineering and Information Technology, Mechanical Engineering and the Faculty of Civil Engineering. The Centre is financially supported by the OPRI.
Funding General The total government budget appropriations or outlays for research and development, (GBAORD) peaked at 0.46% of gross domestic product (GDP) in 2011, but dropped to 0.34% in 2016 (for comparison, the European Union 28 (EU28) was 0.64% of GDP in 2016). On the one hand, nominal GDP grew faster than nominal GBAORD and projects under the new European Union (EU) funding cycle (2014-20) were slow to start, including in the RDI area (Baláž et al., 2018; EC, 2017).
Since 2009, the total budget allocations for energy RD&D declined only slightly despite a significant reduction in 2015 (Figure 12.1). Over the same period, budgets by energy source have varied. Since 2013, budget allocations for nuclear declined substantially, yet budgets for renewables represent more than half of the overall funding, which includes 72% for biofuels.
Public budgets are allocated primarily for the universities and the Slovak Academy of Sciences. RDI in the private sector is mostly carried out by a few large, domestically owned companies in the automotive and information and communication technology
© O
EC
D/IE
A, 2
018

12. ENERGY TECHNOLOGY RESEARCH, DEVELOPMENT AND DEMONSTRATION
152
sectors and in R&D departments of a few multinational enterprises. There is little R&D co-operation between industry and academia (Baláž et al., 2018).
RDI in the Slovak Republic is also funded from EU sources, which include the Horizon 2020 framework programme and the operational programmes of the European Structural and Investment Funds (ESIF). The ESIF are the main source of public sector RDI funding in the country. In 2015, the Slovak Republic received euro (EUR) 470 million in EU funding for public sector R&D (which represents 50.7% overall), the fifth-highest total among EU countries.
To support R&D expenditure, the R&D performers can deduct from their tax bases 125% of all R&D costs, up to 25% of labour costs in the current year, and 25% of all R&D costs accrued in the previous year. The total deductible R&D cost was raised to 200% as from 2018 (Baláž et al., 2018).
Energy In 2016, the government spent EUR 18 million on energy-related RD&D (Figure 12.1). This was slightly less than in recent years, when spending was in the range EUR 20-25 million per year.
Renewable energy technology receives over half of the RD&D money, and only small shares are directed towards energy efficiency, power storage and nuclear technology. Nuclear research spending has decreased, in contrast with the country’s continuing investment efforts in new nuclear power generation.
The Slovak Republic’s public energy RD&D spending per GDP is on the lower half in a comparison with the International Energy Agency (IEA) member countries. In 2016, the Slovak Republic spent 0.023% of GDP, just below that of neighbouring Hungary (Figure 12.2), and significantly below the highest shares in the comparison.
As to the EC Horizon 2020 programme, the Slovak Republic has so far received 0.2% of the EU contribution devoted to the “secure, clean and efficient energy” part of the programme. As of January 2017, 23 participations by 17 Slovak organisations in Horizon 2020 energy projects had been awarded EUR 2.7 million.
Figure 12.1 Government energy RD&D spending by category, 2009-16
Source: IEA (2018), IEA Energy Technology RD&D Statistics (database), www.iea.org/statistics/.
0
5
10
15
20
25
30
2009 2010 2011 2012 2013 2014 2015 2016
EUR million (nominal)Other
Other power andstorage technologiesHydrogen and fuel cells
Nuclear
Energy efficiency
Fossil fuels
Renewables
© O
EC
D/IE
A, 2
018

12. ENERGY TECHNOLOGY RESEARCH, DEVELOPMENT AND DEMONSTRATION
153
EN
ER
GY
SY
STE
M T
RA
NS
FOR
MA
TIO
N Figure 12.2 Government energy RD&D spending as a ratio of GDP in IEA member
countries, 2016
Note: Data are not available for Greece, Ireland, Italy, Luxembourg and Portugal. Source: IEA (2018), IEA Energy Technology RD&D Statistics (database), www.iea.org/statistics/.
Monitoring and evaluation There are currently no mechanisms to monitor and evaluate the progress and cost‐effectiveness of public spending on energy R&D specifically.
Each agency or institution that provides funding or incentives for R&D has a separate system and criteria to evaluate the effectiveness of research and assess the overall effectiveness of R&D spending or incentives and R&D outputs, including the MESRS.
Projects funded by the SRDA are monitored during the project and three years after the end of the project on the basis of criteria in six categories:
number of publications and citations
number of patents (SVK, EU or global patents)
number of applicable results (models, prototypes and verified technologies)
added value (revenues, new job positions and profitability)
outputs for education and the popularisation of science
other results (mainly related to the dissemination of R&D results).
International collaboration International collaboration on energy RDI Is organised through bilateral agreements on scientific and technical co-operation and through EU programmes, most importantly Horizon 2020. The government provides financial support for programmes that are partially supported by the European Union or other international sources. The MESRS monitors these activities.
The Slovak Republic is not a very active contributor to the ongoing work of the European Strategic Energy Technology (SET) Plan, which aims to accelerate the deployment of low-carbon technologies. It only participates in two of 15 temporary
0.00.51.01.52.02.53.0
RDD spending per 1 000 GDP units
Nuclear
© O
EC
D/IE
A, 2
018

12. ENERGY TECHNOLOGY RESEARCH, DEVELOPMENT AND DEMONSTRATION
154
working groups for the implementation of the integrated SET Pian, those on energy efficiency in industry and nuclear safety.
In May 2016, SIEA joined the IEA Technology Collaboration Programme (TCP) on Solar Heating and Cooling. In 2014, the Slovak Association for Electromobility attended an Executive Committee meeting of the TCP on Hybrid and Electric Vehicles to explore future co-operation.
Assessment The energy RDI priorities in the Slovak Republic are based on the objectives of its national energy policy: increase efficiency in power generation and energy end use, reduce energy intensity, reduce dependence on energy imports, expand the use of nuclear power, increase the share of RES and support alternative fuels for transport. Overall responsibility for science and technology policy rests with the MESRS. The RDI strategy of the Slovak Republic to 2020 includes the following priorities linked to energy: production and transmission of electricity, nuclear power, smart grid technology, materials for energy and the heat industry.
The Slovak Republic has dozens of public sector bodies involved in RDI. At the same time, co-operation between the industry and academia is rather weak. The government should ensure an effective co-ordination across the relevant ministries and public bodies to improve the implementation of energy RDI. It should also step up efforts to promote industry-academia co-operation on energy RDI.
Funding is a critical component of energy RDI policy. A large part of public funding comes through EU funds and from the European Commission. The government should ensure the funding is allocated robustly and transparently. It should also strengthen the focus on and improve the capacity to access and use funds for energy RDI from these EU-related sources.
To monitor and evaluate progress is an essential part of RDI efforts. In the Slovak Republic, this is an area for further improvement. The government is encouraged to implement effective mechanisms to monitor and evaluate progress in energy RDI to maximise the cost‐effectiveness of public spending. As part of this process, it should also co-operate better with industry.
International co-operation is an effective way to optimise R&D spending. The Slovak Republic participates in international co‐operation programmes through bilateral and multilateral arrangements, largely within the framework of the European Union. It should also consider participating in the TCPs of the IEA.
© O
EC
D/IE
A, 2
018
12. ENERGY TECHNOLOGY RESEARCH, DEVELOPMENT AND DEMONSTRATION
155
EN
ER
GY
SY
STE
M T
RA
NS
FOR
MA
TIO
N Recommendations
The government of the Slovak Republic should:
In line with the priorities in energy research policy as set out in the RDI strategy of the Slovak Republic for 2014-20, ensure its effective co-ordination across the relevant ministries and public bodies to improve its effective and timely implementation.
Establish a robust and transparent process to allocate research funding.
Implement effective mechanisms to monitor and evaluate progress in energy R&D to maximise the cost‐effectiveness of public spending.
Strengthen the focus on and improve the capacity to access and use funds for energy R&D available via EU funding programmes such as Horizon 2020 and ESIF.
Enhance the opportunities for energy R&D activities by industry, including through fiscal incentives and partnerships with government and academic programmes and projects to advance and deploy energy technologies and practices.
References
Baláž, V., K. Frank and T. Ojala, T. (2018), RIO Country Report 2017: Slovak Republic, EC, Luxembourg, https://ec.europa.eu/jrc/en/publication/eur-scientific-and-technical-research-reports/rio-country-report-2017-slovak-republic.
EC (European Commission) (2017), Energy Union Factsheet Slovak Republic, EC, Brussels.
IEA (International Energy Agency) (2018), IEA Energy Technology RD&D [database], www.iea.org/statistics/.
MoE (Ministry of Energy) (2014), Energy Policy of the Slovak Republic, MoE, Bratislava, www.economy.gov.sk/uploads/files/47NgRIPQ.pdf.
© O
EC
D/IE
A, 2
018

© O
EC
D/IE
A, 2
018

157
AN
NE
XE
S
ANNEX A: Organisations visited
Review criteria The Shared Goals, which were adopted by the IEA Ministers at their 4 June 1993 meeting in Paris,
provide the evaluation criteria for the in-depth reviews (IDRs) conducted by the International Energy
Agency (IEA). The Shared Goals are presented in Annex C.
Review team and preparation of the report
The IEA in-depth review team visited the Slovak Republic from 9-13 October 2017. The team met with
government officials, energy suppliers, interest groups and other organisations. This report was drafted
on the basis of the review team’s preliminary assessment of the country’s energy policy and information
on subsequent policy developments from the government and private-sector sources. The members of
the team were:
IEA member countries
Mr Andrej Miller, the United Kingdom (team leader)
Mr Jon Audun Kvalbein, Norway
Ms Bernie Comey, Ireland
Mr Márton Csordás, Hungary
Ms Helena Leander, Sweden
Mr Carlos Oliveira, Portugal
Mr Paweł Pikus, Poland
European Commission
Mr Vladimir Zuberec
IEA Secretariat
Mr Aad van Bohemen
Mr Oskar Kvarnström
Mr Miika Tommila
The team is grateful for the co-operation and assistance of the many people it met throughout the
visit. Thanks to their kind hospitality, openness and willingness to share information, the visit was
highly informative, productive and enjoyable. The team expresses its gratitude to State Secretary
Vojtech Ferencz for his time and encouragement. The team also appreciates Director General Ján
Petrovič and his staff at the Ministry of Economy, in particular, Director Alena Žáková and Mr Radovan
Mačuga, and Ms Bronislava Žemberová from the Slovak Republic’s Permanent Representation to the
Organisation for Economic Co-operation and Development (OECD) for the professionalism they
displayed throughout the review process.
© O
EC
D/IE
A, 2
018

ANNEXES
158
Miika Tommila managed the review process and drafted Chapters 1-2, 5-6 and 12. Chapters 3 and 4
were drafted by Sean Calvert, Chapter 7 by OECD Nuclear Energy Agency, Chapters 8 and 10 by
Jihyun Lee with Miika Tommila, and Chapters 9 and 11 by Oskar Kvarnström. Jihyun Lee and Oskar
Kvarnström drafted the supply and demand sections of the report.
The report was prepared under the guidance of Aad van Bohemen, Head of Energy Policy and
Security Division. Helpful comments and updates were provided by the review team members and the
following IEA staff: Ute Collier, Carlos Fernandez Alvarez, Rebecca Gaghen, Christina Hood, Kevin
Lane, Cesar Alejandro Hernandez, Volker Kraayvanger, Simon Mueller, Cedric Philibert and Carrie
Pottinger.
Oskar Kvarnström and Jihyun Lee prepared the figures and Bertrand Sadin prepared the maps.
Roberta Quadrelli and Rémi Gigoux provided support on the statistics. Therese Walsh managed the
editing process, and Astrid Dumond and Katie Russell managed the production process.
Organisations visited
Administration of State Material Reserves Association of Energy Service Providers AZZZ SR, Federation of employers' associations of the Slovak Republic Bratislavská teplárenská CECED Slovakia Comenius University, Department of Political Science EOSA, Emergency Oil Stocks Agency Eustream Globsec – Energy Programme Hlavný banský úrad (Main Mining Authority) HBP, Hornonitrianske bane Prievidza (coal mining company) Institute for Passive Houses Slovakia JAVYS, Nuclear Decommissioning Company Ministry of Economy Ministry of Education, Science, Research and Sport Ministry of Environment Ministry of Finance Ministry of Transport NJF, National Nuclear Fund POZAGAS RONI, Regulatory Office for Network Industries SAPPO, Slovak Association of Petroleum Industry and Trade SE, Slovenské elektrárne SEPS, Slovak Electricity Transmission System Operator SIEA, Slovak Innovation and Energy Agency Slovak Association of Heat Producers Slovak Foreign Policy Association Slovak Technical University Slovnaft SPP, National Gas Company SPP-D SSE-D Stredoslovenská energetika - distribúcia Tepláreň Košice Thermosolar Transpetrol ÚJD, Nuclear Regulatory Authority Veolia VÚJE, Nuclear Power Research Institute Združenie BIOMASA ZSD, Západoslovenská distribučná
© O
EC
D/IE
A, 2
018

ANNEXES
159
ANNEX B: Energy balances and key statistical data
Unit: MtoeSUPPLY 1973 1990 2000 2010 2015 2016 2017E
TOTAL PRODUCTION 2.58 5.28 6.33 6.21 6.59 6.45 6.67
Coal 1.70 1.40 1.02 0.61 0.50 0.45 0.45Peat - - - - - - -Oil 0.13 0.08 0.06 0.21 0.24 0.23 0.31Natural gas 0.39 0.34 0.13 0.09 0.08 0.08 0.09Biofuels and w aste1 0.18 0.17 0.42 0.97 1.39 1.37 1.36Nuclear 0.06 3.14 4.30 3.86 3.99 3.90 4.01Hydro 0.11 0.16 0.40 0.45 0.33 0.38 0.39Wind - - - 0.00 0.00 0.00 -Geothermal - - - 0.01 0.01 0.01 0.01
Solar/other2 - - - 0.01 0.05 0.05 0.06TOTAL NET IMPORTS3 12.96 16.42 11.51 11.33 9.71 9.83 10.61Coal Exports - 0.09 0.04 0.26 0.05 0.06 0.05
Imports 6.26 6.21 3.47 3.22 2.82 2.74 2.96Net imports 6.26 6.12 3.43 2.95 2.77 2.68 2.91
Oil Exports 1.70 1.81 2.93 3.43 4.46 4.18 4.14Imports 6.97 6.31 5.56 6.84 7.56 7.55 7.47Int'l marine and aviation bunkers - - -0.03 -0.04 -0.04 -0.05 -0.04Net imports 5.27 4.50 2.61 3.37 3.06 3.32 3.29
Natural Gas Exports - - - - - - -Imports 1.17 5.35 5.71 5.00 3.69 3.62 4.15Net imports 1.17 5.35 5.71 5.00 3.69 3.62 4.15
Electricity Exports 0.02 0.18 0.74 0.54 1.08 0.91 1.08Imports 0.26 0.62 0.51 0.63 1.29 1.14 1.34Net imports 0.24 0.45 -0.23 0.09 0.21 0.23 0.26
TOTAL STOCK CHANGES -0.01 -0.37 -0.09 0.29 0.10 0.22 -0.29
TOTAL SUPPLY (TPES)4 15.52 21.33 17.74 17.83 16.39 16.50 17.00Coal 7.96 7.83 4.27 3.90 3.28 3.22 3.32Peat - - - - - - -Oil 5.39 4.49 2.82 3.62 3.27 3.47 3.70Natural gas 1.56 5.09 5.78 5.01 3.88 3.90 3.89Biofuels and w aste1 0.19 0.17 0.41 0.89 1.38 1.34 1.35Nuclear 0.06 3.14 4.30 3.86 3.99 3.90 4.01Hydro 0.11 0.16 0.40 0.45 0.33 0.38 0.39Wind - - - 0.00 0.00 0.00 -Geothermal - - - 0.01 0.01 0.01 0.01Solar/other2 - - - 0.01 0.05 0.05 0.06Electricity trade5 0.24 0.45 -0.23 0.09 0.21 0.23 0.26Shares in TPES (%)Coal 51.3 36.7 24.1 21.9 20.0 19.5 19.6Peat - - - - - - -Oil 34.7 21.1 15.9 20.3 19.9 21.1 21.8Natural gas 10.1 23.9 32.6 28.1 23.7 23.6 22.9Biofuels and waste 1 1.2 0.8 2.3 5.0 8.4 8.1 8.0Nuclear 0.4 14.7 24.2 21.6 24.4 23.6 23.6Hydro 0.7 0.8 2.2 2.5 2.0 2.3 2.3Wind - - - - - - -Geothermal - - - 0.0 0.0 0.0 0.0Solar/other 2 - - - 0.0 0.3 0.3 0.3Electricity trade 5 1.6 2.1 -1.3 0.5 1.3 1.4 1.50 is negligible, - is nil, .. is not available, x is not applicable. Please note: rounding may cause totals to differ from the sum of the elements.
© O
EC
D/IE
A, 2
018

ANNEXES
160
Unit: MtoeDEMAND
FINAL CONSUMPTION 1973 1990 2000 2010 2015 2016 2017E
TFC 10.86 15.75 11.42 11.44 10.03 10.25 ..Coal 3.85 4.11 1.41 1.18 0.89 0.85 ..Peat - - - - - - ..Oil 3.83 4.89 3.01 3.07 2.74 2.93 ..Natural gas 1.40 3.92 4.17 3.70 2.87 2.90 ..Biofuels and w aste1 0.19 0.17 0.32 0.56 0.80 0.75 ..Geothermal - - - 0.00 0.00 0.00 ..Solar/other2 - - - 0.00 0.01 0.01 ..Electricity 1.06 2.01 1.89 2.08 2.10 2.15 ..Heat 0.53 0.65 0.62 0.85 0.63 0.67 ..Shares in TFC (%) Coal 35.4 26.1 12.4 10.3 8.9 8.3 ..Peat - - - - - - ..Oil 35.3 31.0 26.4 26.8 27.3 28.6 ..Natural gas 12.9 24.9 36.5 32.4 28.6 28.3 ..Biofuels and waste 1 1.7 1.1 2.8 4.9 8.0 7.3 ..Geothermal - - - 0.0 0.0 0.0 ..Solar/other 2 - - - 0.0 0.0 0.0 ..Electricity 9.8 12.8 16.6 18.1 20.9 21.0 ..Heat 4.9 4.1 5.4 7.4 6.3 6.5 ..TOTAL INDUSTRY6 6.14 7.69 5.00 4.30 4.41 4.32 ..Coal 2.66 1.93 1.16 0.85 0.76 0.76 ..Peat - - - - - - ..Oil 1.73 2.95 1.55 0.92 0.76 0.73 ..Natural gas 0.83 1.33 1.12 1.10 1.18 1.13 ..Biofuels and w aste1 0.19 0.17 0.32 0.39 0.57 0.52 ..Geothermal - - - - - - ..Solar/other2 - - - - - - ..Electricity 0.72 1.29 0.84 0.94 1.00 1.04 ..Heat 0.02 0.02 0.02 0.11 0.15 0.13 ..Shares in total industry (%) Coal 43.3 25.1 23.1 19.6 17.3 17.7 ..Peat - - - - - - ..Oil 28.2 38.3 31.0 21.5 17.2 16.9 ..Natural gas 13.4 17.3 22.3 25.5 26.6 26.3 ..Biofuels and waste 1 3.1 2.3 6.4 9.0 12.9 12.1 ..Geothermal - - - - - - ..Solar/other 2 - - - - - - ..Electricity 11.7 16.8 16.8 21.9 22.6 24.1 ..Heat 0.3 0.2 0.4 2.5 3.4 3.0 ..TRANSPORT4 1.68 1.45 1.43 2.59 2.18 2.45 ..OTHER7 3.05 6.62 4.99 4.55 3.44 3.49 ..Coal 1.19 2.18 0.26 0.33 0.13 0.09 ..Peat - - - - - - ..Oil 0.48 0.60 0.11 0.10 0.09 0.08 ..Natural gas 0.58 2.58 3.05 2.21 1.60 1.63 ..Biofuels and w aste1 - - 0.00 0.07 0.09 0.09 ..Geothermal - - - 0.00 0.00 0.00 ..Solar/other2 - - - 0.00 0.01 0.01 ..Electricity 0.29 0.62 0.97 1.09 1.05 1.06 ..Heat 0.51 0.63 0.60 0.75 0.48 0.54 ..Shares in other (%) Coal 39.0 33.0 5.1 7.3 3.7 2.5 ..Peat - - - - - - ..Oil 15.8 9.0 2.2 2.2 2.5 2.4 ..Natural gas 19.0 39.0 61.1 48.5 46.5 46.6 ..Biofuels and waste 1 - - - 1.5 2.6 2.5 ..Geothermal - - - 0.0 0.0 0.0 ..Solar/other 2 - - - 0.1 0.2 0.2 ..Electricity 9.5 9.4 19.5 23.9 30.4 30.3 ..Heat 16.7 9.5 12.0 16.4 14.0 15.5 ..
© O
EC
D/IE
A, 2
018

ANNEXES
161
Unit: MtoeDEMAND
ENERGY TRANSFORMATION AND LOSSES 1973 1990 2000 2010 2015 2016 2017E
ELECTRICITY GENERATION8
Input (Mtoe) 2.64 6.91 7.92 7.20 6.85 6.77 ..Output (Mtoe) 1.06 2.19 2.65 2.36 2.29 2.31 2.27Output (TWh) 12.30 25.50 30.80 27.46 26.63 26.82 26.35Output Shares (%)Coal 64.4 31.9 19.8 14.9 12.5 12.2 11.4Peat - - - - - - -Oil 17.7 6.4 0.7 2.2 1.4 1.8 1.6Natural gas 5.3 7.1 10.9 8.0 6.0 5.7 4.3Biofuels and waste 1 - - 0.1 2.5 6.3 6.5 5.8Nuclear 1.9 47.2 53.6 53.1 56.9 55.1 57.4Hydro 10.7 7.4 15.0 19.1 14.5 16.3 17.0Wind - - - - - - -Geothermal - - - - - - -Solar/other 2 - - - 0.2 2.3 2.5 2.5TOTAL LOSSES 3.36 5.86 5.94 6.35 6.32 6.23 ..of w hich:Electricity and heat generation9 0.82 3.91 4.40 3.68 3.69 3.57 ..Other transformation 1.67 0.49 0.34 0.89 0.81 0.87 ..Ow n use and transmission/distribution losses10 0.87 1.46 1.20 1.77 1.82 1.80 ..Statistical Differences 1.31 -0.28 0.39 0.05 0.04 0.01 ..
INDICATORS 1973 1990 2000 2010 2015 2016 2017E
GDP (billion 2010 USD) 37.20 51.10 55.49 89.50 101.31 104.68 108.24Population (millions) 4.64 5.30 5.40 5.43 5.42 5.43 5.44TPES/GDP (toe/1000 USD)11 0.42 0.42 0.32 0.20 0.16 0.16 0.16Energy production/TPES 0.17 0.25 0.36 0.35 0.40 0.39 0.39Per capita TPES (toe/capita) 3.34 4.03 3.29 3.28 3.02 3.04 3.13Oil supply/GDP (toe/1000 USD)11 0.14 0.09 0.05 0.04 0.03 0.03 0.03TFC/GDP (toe/1000 USD)11 0.29 0.31 0.21 0.13 0.10 0.10 ..Per capita TFC (toe/capita) 2.34 2.97 2.11 2.11 1.85 1.89 ..CO2 emissions from fuel combustion (MtCO2)12 41.0 54.8 36.9 34.6 29.4 30.2 -CO2 emissions from bunkers (MtCO2)12 - - 0.1 0.1 0.1 0.2 -
GROWTH RATES (% per year) 73-90 90-00 00-10 10-14 14-15 15-16 16-17
TPES 1.9 -1.8 0.0 -2.7 2.8 0.6 3.0Coal -0.1 -5.9 -0.9 -3.2 -4.1 -1.8 3.1Peat - - - - - - -Oil -1.1 -4.5 2.5 -4.5 8.7 6.4 6.6Natural gas 7.2 1.3 -1.4 -6.8 2.9 0.4 -0.1Biofuels and w aste1 -0.5 9.0 8.0 6.4 20.3 -2.5 0.8Nuclear 26.1 3.2 -1.1 1.4 -2.2 -2.4 3.0Hydro 2.1 9.4 1.3 -5.4 -8.3 13.0 2.7Wind - - - - - - -Geothermal - - - -3.3 - 14.3 -Solar/other2 - - - 77.1 -13.6 3.9 9.4TFC 2.2 -3.2 0.0 -3.9 3.0 2.2 ..Electricity consumption 3.9 -0.6 0.9 0.0 0.9 2.5 ..Energy production 4.3 1.8 -0.2 1.4 0.3 -2.0 3.4Net oil imports -0.9 -5.3 2.6 -4.0 7.0 8.7 -0.9GDP 1.9 0.8 4.9 2.2 3.9 3.3 3.4TPES/GDP 0.0 -2.6 -4.6 -4.8 -1.0 -2.6 -0.4TFC/GDP 0.3 -4.0 -4.7 -6.0 -0.8 -1.1 ..0 is negligible, - is nil, .. is not available, x is not applicable. Please note: rounding may cause totals to differ from the sum of the elements.
© O
EC
D/IE
A, 2
018

ANNEXES
162
Footnotes to energy balances and key statistical data
1. Biofuels and waste comprises solid biofuels, liquid biofuels, biogases, industrial waste and municipal waste. Data are often based on partial surveys and may not be comparable between countries.
2. Other includes ambient heat used in heat pumps.
3. In addition to coal, oil, natural gas and electricity, total net imports also include biofuels and waste and trade of heat.
4. Excludes international marine bunkers and international aviation bunkers.
5. Total supply of electricity represents net trade. A negative number in the share of TPES indicates that exports are greater than imports.
6. Industry includes non-energy use.
7. Other includes residential, commercial and public services, agriculture/forestry, fishing and other non-specified.
8. Inputs to electricity generation include inputs to electricity, CHP and heat plants. Output refers only to electricity generation.
9. Losses arising in the production of electricity and heat at main activity producer utilities and autoproducers. For non-fossil-fuel electricity generation, theoretical losses are shown based on plant efficiencies of approximately 33% for nuclear and solar thermal and 100% for hydro, wind and solar photovoltaic.
10. Data on “losses” for forecast years often include large statistical differences covering differences between expected supply and demand and mostly do not reflect real expectations on transformation gains and losses.
11. Toe per thousand US dollars at 2010 prices and exchange rates.
12. “CO2 emissions from fuel combustion” have been estimated using the IPCC Tier I Sectoral Approach from the 2006 IPCC Guidelines. In accordance with the IPCC methodology, emissions from international marine and aviation bunkers are not included in national totals.
© O
EC
D/IE
A, 2
018

ANNEXES
163
ANNEX C: International Energy Agency “Shared Goals”
The member countries* of the International Energy Agency (IEA) seek to create conditions in which the
energy sectors of their economies can make the fullest possible contribution to sustainable economic
development and to the well-being of their people and of the environment. In formulating energy
policies, the establishment of free and open markets is a fundamental point of departure, though energy
security and environmental protection need to be given particular emphasis by governments. IEA
countries recognise the significance of increasing global interdependence in energy. They therefore
seek to promote the effective operation of international energy markets and encourage dialogue with all
participants. In order to secure their objectives, member countries therefore aim to create a policy
framework consistent with the following goals:
1. Diversity, efficiency and flexibility within the energy sector are basic conditions for longer-term energy
security: the fuels used within and across sectors and the sources of those fuels should be as diverse
as practicable. Non-fossil fuels, particularly nuclear and hydro power, make a substantial contribution to
the energy supply diversity of IEA countries as a group.
2. Energy systems should have the ability to respond promptly and flexibly to energy emergencies. In
some cases this requires collective mechanisms and action: IEA countries co-operate through the
Agency in responding jointly to oil supply emergencies.
3. The environmentally sustainable provision and use of energy are central to the achievement of these
shared goals. Decision-makers should seek to minimise the adverse environmental impacts of energy
activities, just as environmental decisions should take account of the energy consequences.
Government interventions should respect the Polluter Pays Principle where practicable.
4. More environmentally acceptable energy sources need to be encouraged and developed. Clean and
efficient use of fossil fuels is essential. The development of economic non-fossil sources is also a
priority. A number of IEA member countries wish to retain and improve the nuclear option for the future,
at the highest available safety standards, because nuclear energy does not emit carbon dioxide.
Renewable sources will also have an increasingly important contribution to make.
5. Improved energy efficiency can promote both environmental protection and energy security in a cost-
effective manner. There are significant opportunities for greater energy efficiency at all stages of the
energy cycle from production to consumption. Strong efforts by governments and all energy users are
needed to realise these opportunities.
6. Continued research, development and market deployment of new and improved energy technologies
make a critical contribution to achieving the objectives outlined above. Energy technology policies
should complement broader energy policies. International co-operation in the development and
dissemination of energy technologies, including industry participation and co-operation with non-
member countries, should be encouraged.
© O
EC
D/IE
A, 2
018

ANNEXES
164
7. Undistorted energy prices enable markets to work efficiently. Energy prices should not be held
artificially below the costs of supply to promote social or industrial goals. To the extent necessary and
practicable, the environmental costs of energy production and use should be reflected in prices.
8. Free and open trade and a secure framework for investment contribute to efficient energy markets
and energy security. Distortions to energy trade and investment should be avoided.
9. Co-operation among all energy market participants helps to improve information and understanding,
and encourages the development of efficient, environmentally acceptable and flexible energy systems
and markets worldwide. These are needed to help promote the investment, trade and confidence
necessary to achieve global energy security and environmental objectives.
(The Shared Goals were adopted by IEA Ministers at the meeting of 4 June 1993 Paris, France.)
* Australia, Austria, Belgium, Canada, the Czech Republic, Denmark, Estonia, Finland, France, Germany, Greece,Hungary, Ireland, Italy, Japan, Korea, Luxembourg, the Netherlands, New Zealand, Norway, Poland, Portugal, theSlovak Republic, Spain, Sweden, Switzerland, Turkey, the United Kingdom, the United States.
© O
EC
D/IE
A, 2
018

ANNEXES
165
ANNEX D: Glossary and list of abbreviations
In this report, abbreviations and acronyms are substituted for a number of terms used within the
International Energy Agency. Although these terms generally have been written out on first mention, this
glossary provides a quick and central reference for the abbreviations used.
Acronyms and abbreviations AAU assigned amount unit
AEA Annual Emissions Allocation
ASMR Administration of State Material Reserves
BAU business-as-usual
BSP Bratislava-Schwechat Pipeline
CH4 methane
CEGH Central European Gas Hub
CNG compressed natural gas
CO2 carbon dioxide
DH district heating
DSO distribution system operator
EBRD European Bank for Reconstruction and Development
EC European Commission
EED Energy Efficiency Directive
EOSA Emergency Oil Stocks Agency
EPBD Energy Performance of Buildings Directive
EPH Energeticky a Prumyslovy Holding
ERDF European Regional Development Fund
ESCO energy service company
ESD Effort Sharing Decision
ESIF European Structural Investment Funds
ETS Emissions Trading System
EU European Union
EUA EU Allowance
EUAA EU Aviation Allowance
EUR euro
EV electric vehicle
FiT feed-in tariff
GBAORD government budget appropriations or outlays for research and development
GDP gross domestic product
GHG greenhouse gas
HBP Hornonitrianske bane Prievidza
HFCs hydrofluorocarbons
IEA International Energy Agency
© O
EC
D/IE
A, 2
018

ANNEXES
166
IDR in-depth reviews
IMS intelligent metering systems
IPCC International Panel on Climate Change
IROP Integrated Regional Operational Programme
ISFS interim spent fuel storage
ITO independent transmission system operator
JESSICA Joint European Support for Sustainable Investment in City Areas
JAVYS Jadrová a vyrad�ovacia spoloc�nost�
LNG liquefied natural gas
MC IMS Managing Committee for Introducing Intelligent Measuring Systems
ME Ministry of Environment
MESRS Ministry of Education, Science, Research and Sport
MoE Ministry of Economy
N2O nitrous oxide
NEEAP National Energy Efficiency Action Plan
NESO National Emergency Strategy Organisation
NPP nuclear power plant
OECD Organisation of Economic Co-operation and Development
OPII Operational Programme Integrated Infrastructure
OPRI Operational Programme Research and Innovation
OTC over-the-counter
PCI projects of common interest
PM particulate matter
PM2.5 particulate matter less than 2.5 micrometres in diameter
PM10 particulate matter less than 10 micrometres in diameter
PN pressure normal
PPP purchasing power parity
PSR Periodic Safety Reviews
PV photovoltaic
R&D research and development
RD&D research, development and demonstration
RDI research, development and innovation
RES Renewable energy sources
RONI Regulatory Office for Network Industries
RWE Rheinisch-Westfälisches Elektrizitätswerk
SE Slovenské Elektrárne
SEE South-Eastern Europe
SEPS Slovenska Elektrizacna Prenosova Sustava
SETP Strategic Energy Technology Plan
SF spent fuel
SF6 sulphur hexafluoride
© O
EC
D/IE
A, 2
018

ANNEXES
167
SHMI Slovak Hydrometeorological Institute
SIEA Slovak Innovation and Energy Agency
SME small and medium-sized enterprises
SPH Slovak Power Holding
SPP-D SPP-Distribúcia
SPS Spoločnosť pre skladovanie
SRDA Slovak Research and Development Agency
SSD Stredoslovenská distribúcia
SSE Stredoslovenská energetika
SUT Slovak University of Technology
TCP Technology Collaboration Programme
TFC total final consumption
TPA third-party access
TPES total primary energy supply
TSO transmission system operator
TYNDP Ten-Year Network Development Plan
UNFCCC United Nations Framework Convention on Climate Change
ÚJD Úrad jadrového dozoru
USD United States dollar
VSD Východoslovenská distribučná
VTP Virtual Trading Point
ZSD Západoslovenská distribučná
Units of measurebcm billion cubic metres
gCO2/km grammes of CO2 per kilometre
gCO2/kWh grammes of CO2 per kilowatt-hour
GJ/dW gigajoule per deciwatt
GJ/m2 gigajoule per square metre
GW gigawatt
GWh gigawatt-hour
kb/d thousand barrels per day
kgCO2 kilogramme of CO2
km2 square kilometre
ktoe thousand tonnes of oil equivalent
kV kilovolt
kW kilowatt
© O
EC
D/IE
A, 2
018

ANNEXES
168
m2 square metres
m3/d cubic metres per day
mb million barrels
Mm3 million cubic metres
MPa megapascal
Mt million tonnes
Mt/yr million tonnes per year
Mtoe million tonnes of oil equivalent
MW megawatt
MWe megawatt electrical
MWh megawatt-hour
MWh/yr megawatt-hour per year
PJ petajoules (PJ)
TJ terajoules
toe tonne of oil equivalent
TWh terawatt-hour
W/m2K watts per square metre Kelvin
© O
EC
D/IE
A, 2
018
Onl
in
e bookshopPDF versions at 20% discount
web
store
.iea.org
Inte
rnat
iona
l Energy Agency
Secure Sustain
able T
oget
her
World Energy Outlook series
World Energy
Investment series
Energy Statistics series
Energy Policiesof IEA
Countriesseries
Energy Technology
Perspectives series
E-mail: books@
iea.org
Market ReportSeries
Oil
Coal
RenewableEnergy Energy
Efficiency
Gas
Global Gas Security series
EnergyPolicies
Beyond IEA Countriesseries

This publication reflects the views of the IEA Secretariat but does not necessarily reflect those of individual IEA member countries. The IEA makes no representation or warranty, express or implied, in respect of the publication’s contents (including its completeness or accuracy) and shall not be responsible for any use of, or reliance on, the publication.
Unless otherwise indicated, all material presented in figures and tables is derived from IEA data and analysis.
This publication and any map included herein are without prejudice to the status of or sovereignty over any territory, to the delimitation of international frontiers and boundaries and to the name of any territory, city or area.
IEA/OECD possible corrigenda on: www.oecd.org/about/publishing/corrigenda.htm
IEA PublicationsInternational Energy Agency
Website: www.iea.orgContact information: www.iea.org/about/contact
Typeset in France by IEA - November 2018 Cover design: IEA; Photo credits: © GraphicObsession

ENERGYPOLICIES
OF IEACOUNTRIESSlovak Republic
2018 Review
Since 2016, the International Energy Agency’s (IEA) in-depth country policy reviews focus on key energy security challenges in fast-changing global energy markets as well as on the transition to clean-energy systems.
The latest review of the Slovak Republic’s energy policies finds the country has made significant progress on several fronts. Along with its neighbours, and with support from the European Union, it has strengthened cross-border connections for electricity, natural gas and oil, improving its energy security and increasing market competition.
The Slovak Republic 2018 Review looks at the challenges the Slovak Republic faces and provides recommendations for further policy improvements. The report is intended to help guide the country towards a more secure and sustainable energy future.
The recommendations include updating its 2014 Energy Policy, and incorporating ambitious targets for 2030 on energy security, CO2 emissions and energy markets; continuing to decarbonise the heating sector; developing a clear and transparent programme for eliminating administratively determined end-user prices of electricity and natural gas; and taking further measures to limit energy-related CO2 emissions, in particular in the transport sector.