energy recovery from waste water - arpa-e - … · energy recovery from waste water mark shannon,...
TRANSCRIPT
www.arpa-e.energy.gov
ENERGY RECOVERY FROM WASTE WATER
Mark Shannon, Professor, University of Illinois at Urbana Champaign
March 1, 2010
ARPA-E Pre-Summit Workshop
Why Energy from Wastewater Technologies?
Workshop Structure and Approach
Workshop Keynote and Breakout Session Highlights
Workshop Takeaways

UNITED STATES WATER USAGE
Public and Self-supplied Potable Water
40,738.5(12%)
Industrial-Mining27,159.0-
(8%)
Irrigation-Livestock139,189.7 MGD
(41%)
• Total water withdrawn per year 123.9 trillion gallons, which is ~ yearly outflow of Mississippi river
Water Withdrawn in the US for All Uses
Thermoelectric Power132,400.0
(39%)
Costs directly
related to
withdrawals:
Source matters
“Consumptive Water Use for U.S. Power Production,
P. Torcellini, et.al., National Renewable Energy Laboratory, 2003.

INCREASE IN WATER DEMAND
WITH POPULATION GROWTH
Population Data form US Census Bureau
The Blueprint 2030 forecast share of the revised United States population growth forecast from 2000 to 2030 was 1.14%
%
Increase
Millio
ns
(p
eo
ple
an
d a
cre
-ft
of
wa
ter)

% Increase
0-25
25-50
51-100
101-300
301-1000
2030 PROJECTED % INCREASE
(SINCE 2000)
Averages don’t tell the real story: Growth &
supply problems will be local.
Population data and projections from U.S. Census Bureau
(http://www.census.gov/population/www/projections/stproj.html, http://www.census.gov/popest/datasets.html)
Water Use Data from USGS (http://web1.er.usgs.gov/NAWQAMapTheme/index.jsp)
Projections for water use based on Texas Water Use 60 yr projections
(http://www.twdb.state.tx.us/publications/reports/State_Water_Plan/2007/2007StateWaterPlan/2007StateWaterPlan.htm)
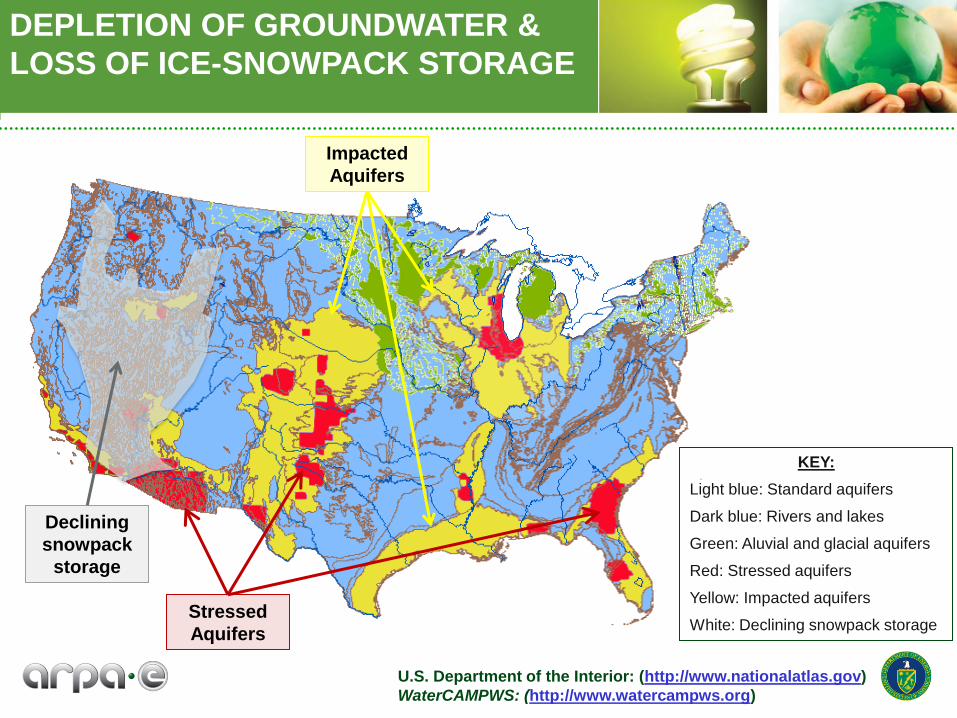
DEPLETION OF GROUNDWATER &
LOSS OF ICE-SNOWPACK STORAGE
U.S. Department of the Interior: (http://www.nationalatlas.gov)
WaterCAMPWS: (http://www.watercampws.org)
KEY:
Light blue: Standard aquifers
Dark blue: Rivers and lakes
Green: Aluvial and glacial aquifers
Red: Stressed aquifers
Yellow: Impacted aquifers
White: Declining snowpack storage
Declining
snowpack
storage
Stressed
Aquifers
Impacted
Aquifers

SALTING FROM SEAWATER INTRUSION,
AGRICULTURAL PRACTICES,
INDUSTRY, & WATER TREATMENT
Fresno County CA
experiencing 0.5 Mton/yr salting
rate since 1945 with an average salt
concentration now of 1,150 mg/liter [Schoups et al., PNAS 102:43, p. 15352-15356 (2005)]
Darkened:
Regions with
excess salting
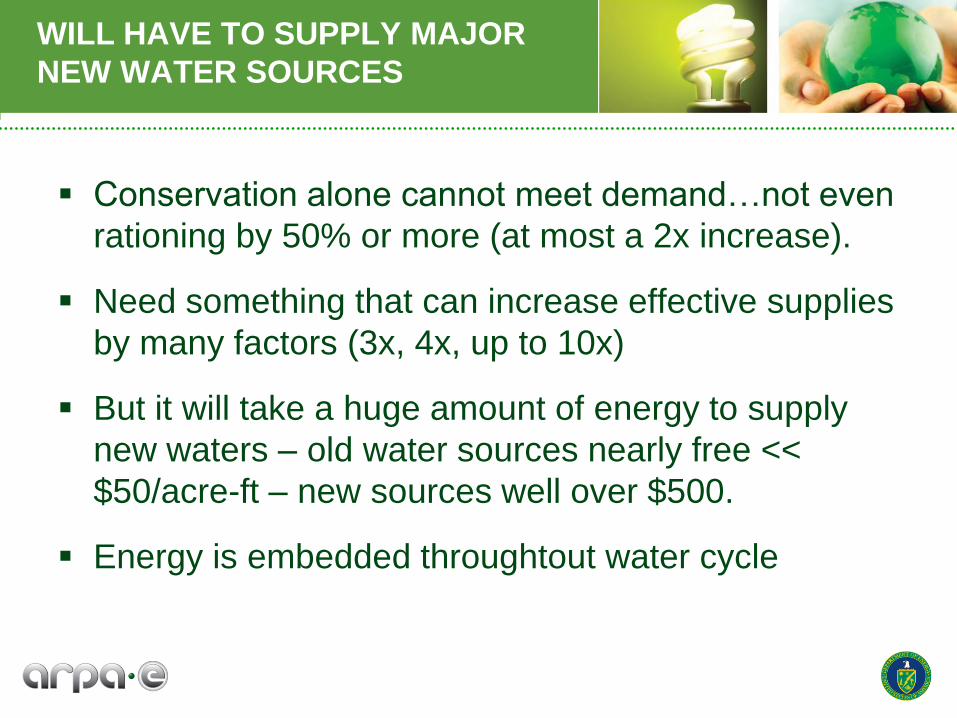
WILL HAVE TO SUPPLY MAJOR
NEW WATER SOURCES
Conservation alone cannot meet demand…not even
rationing by 50% or more (at most a 2x increase).
Need something that can increase effective supplies
by many factors (3x, 4x, up to 10x)
But it will take a huge amount of energy to supply
new waters – old water sources nearly free <<
$50/acre-ft – new sources well over $500.
Energy is embedded throughtout water cycle
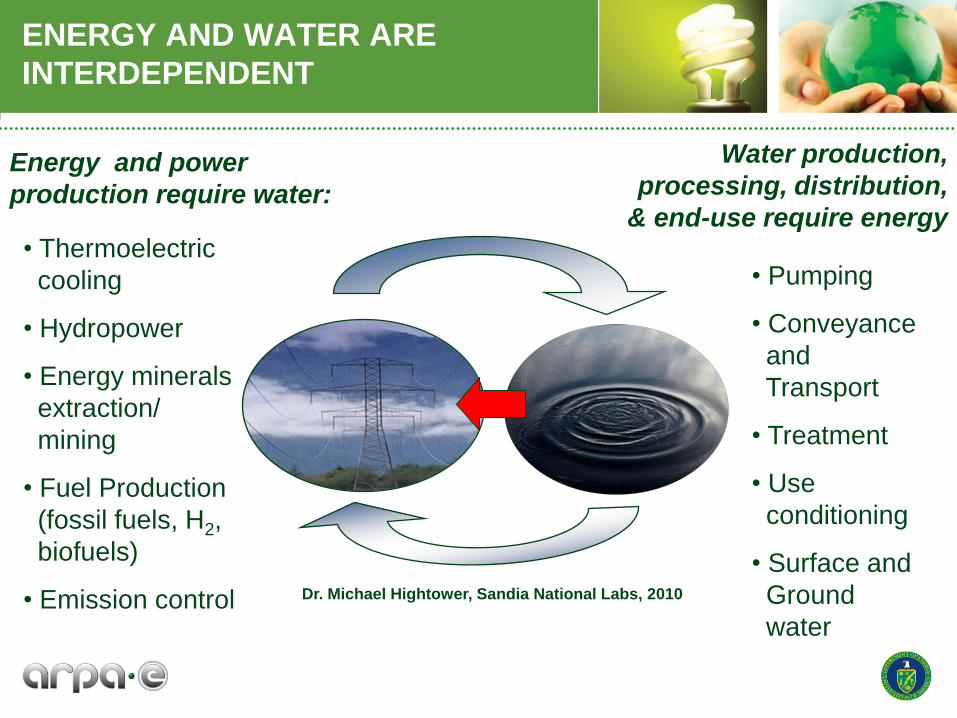
ENERGY AND WATER ARE
INTERDEPENDENT
• Thermoelectric
cooling
• Hydropower
• Energy minerals
extraction/
mining
• Fuel Production
(fossil fuels, H2,
biofuels)
• Emission control
• Pumping
• Conveyance
and
Transport
• Treatment
• Use
conditioning
• Surface and
Ground
water
Dr. Michael Hightower, Sandia National Labs, 2010
Energy and power
production require water:
Water production,
processing, distribution,
& end-use require energy

A MAJOR SOLUTION FOR WATER:
REUSE
~80 to 90% of industrial &
domestic use can be
reclaimed.
Reuse can effectively
increase supplies by an
order of magnitude.
Reclaimed water currently
costs near desalinated
water. 1
10
100
0 20 40 60 80 100
% wastewater recovered from inlet water
Mu
ltip
lier
of
fres
h w
ater
su
pp
ly
Can recharge ground water
(as in Orange county & coming to San Diego).
Challenge: How can reuse be made cost effective?

HOW TO MAKE IT AFFORDABLE:
EXTRACT ENERGY
U.S. municiple wastewater contains 7.2x10⁹ kg of “dry solids”
annually.
– ~ 25 MJ/kg (7 kW.hr/kg) of energy content
– Total energy available ~2x10¹⁷ J (51 billion kW.hr).
Currently, most municipalities do not generate energy from
biosolids:
– 49% treated & applied to land, 45% incinerated or landfilled, 6% to
other
U.S. 2008/2009 electrically generated: 14x1018 J
Energy content in wastewater is ~2% of US electrical demand
New energy demands to supply new water: Up to 20% of
electrical usage of total U.S. if western states model followed.

Why Energy from Wastewater Technologies?
Workshop Structure and Approach
Workshop Keynote and Breakout Session Highlights
Workshop Takeaways

ARPA-E GATHERED INPUT FROM LEADING
TECHNICAL EXPERTS AND CUSTOMERS IN
WASTEWATER ENERGY TECHNOLOGIES
Purpose: Allow DOE to gather input about the most promising
R&D pathways to radically improve simultaneous net energy
extraction and clean water from wastewater.
Topical areas discussed:
– Emerging methods of generating clean water and associated
science and technology challenges.
– Emerging methods of extracting energy from wastewater and
associated science and technology challenges.
– Quality and costs needed for clean usuable water
– Barriers (Infrastructure, codes, permits, etc) and incentives
needed
– Metrics and outcomes needed for pilot demonstrations
– Barriers to adoption and technology transition strategies
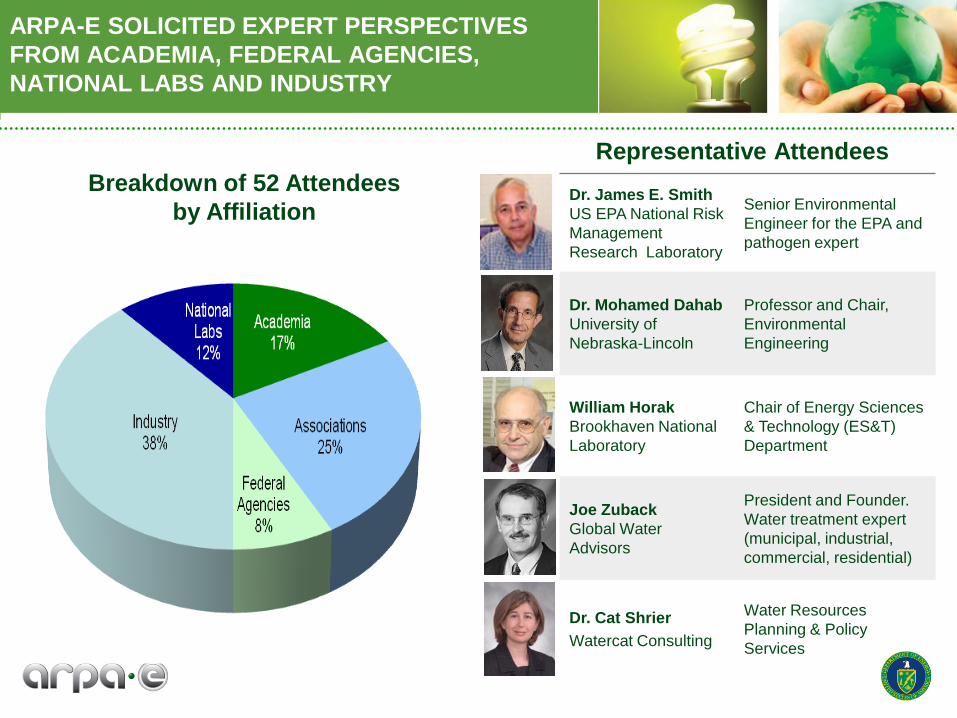
ARPA-E SOLICITED EXPERT PERSPECTIVES
FROM ACADEMIA, FEDERAL AGENCIES,
NATIONAL LABS AND INDUSTRY
Dr. James E. Smith
US EPA National Risk
Management
Research Laboratory
Senior Environmental
Engineer for the EPA and
pathogen expert
Dr. Mohamed Dahab
University of
Nebraska-Lincoln
Professor and Chair,
Environmental
Engineering
William Horak
Brookhaven National
Laboratory
Chair of Energy Sciences
& Technology (ES&T)
Department
Joe Zuback
Global Water
Advisors
President and Founder.
Water treatment expert
(municipal, industrial,
commercial, residential)
Dr. Cat Shrier
Watercat Consulting
Water Resources
Planning & Policy
Services
25%
Breakdown of 52 Attendees
by Affiliation
Representative Attendees
14
Why Energy from Wastewater Technologies?
Workshop Structure and Approach
Workshop Keynote and Breakout Session Highlights
Workshop Takeaways

BECAUSE OF ENERGY AND WATER
INTERDEPENDENCY AND GROWING WATER
DEMAND, ADVANCED WATER TECHNOLOGIES
WILL BE CRITICAL
Dr. Michael Hightower,
Sandia National Laboratories
Embedded Energy for Water Supply
Alternatives
Emerging consideration of wastewater for
energy production
Many municipal and industrial processes
have large waste water streams
Embedded nutrients, embedded energy,
and available utilization of byproducts
such as biomass, heat, CO2
Substantial growth in the use of non-
traditional water resources
Water reuse analysis shows energy savings
over other water options (desalination or
fresh water import)
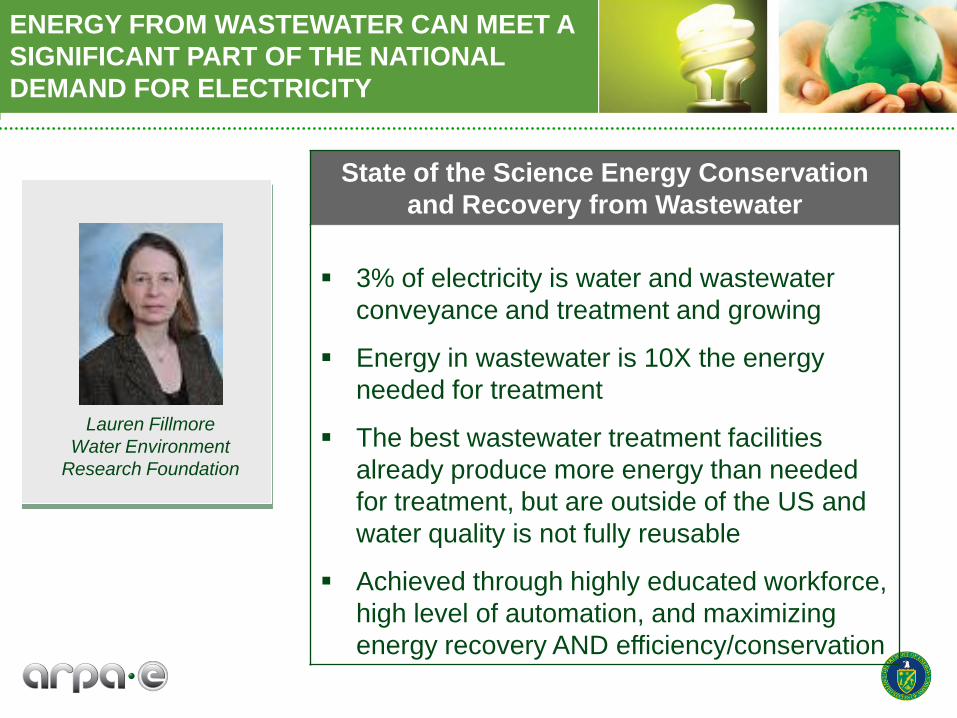
ENERGY FROM WASTEWATER CAN MEET A
SIGNIFICANT PART OF THE NATIONAL
DEMAND FOR ELECTRICITY
Lauren Fillmore
Water Environment
Research Foundation
State of the Science Energy Conservation
and Recovery from Wastewater
3% of electricity is water and wastewater
conveyance and treatment and growing
Energy in wastewater is 10X the energy
needed for treatment
The best wastewater treatment facilities
already produce more energy than needed
for treatment, but are outside of the US and
water quality is not fully reusable
Achieved through highly educated workforce,
high level of automation, and maximizing
energy recovery AND efficiency/conservation
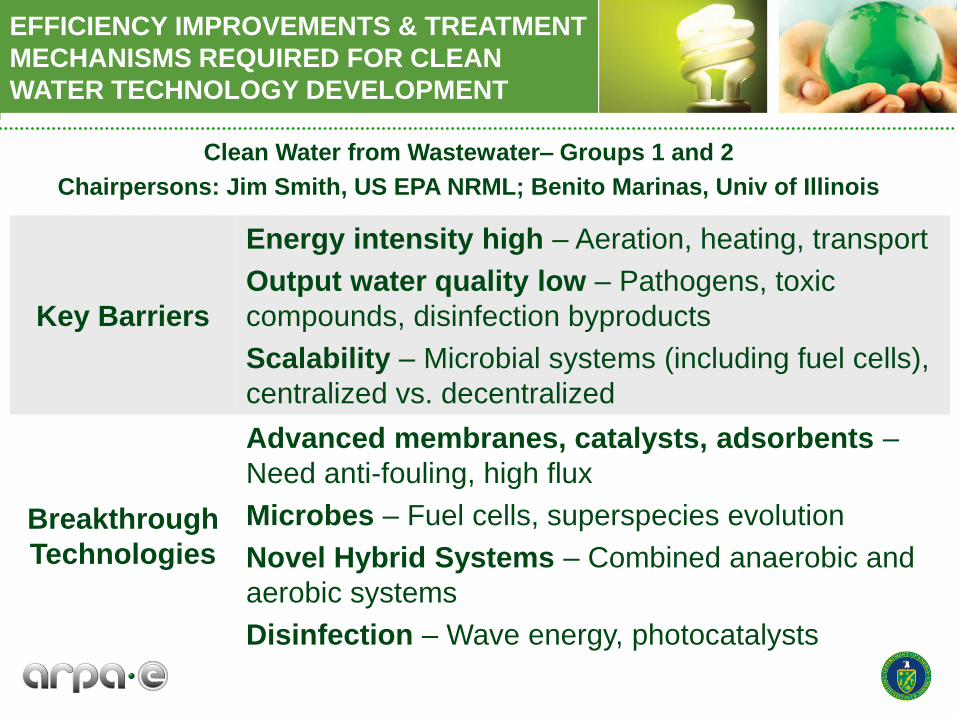
Clean Water from Wastewater– Groups 1 and 2
Chairpersons: Jim Smith, US EPA NRML; Benito Marinas, Univ of Illinois
EFFICIENCY IMPROVEMENTS & TREATMENT
MECHANISMS REQUIRED FOR CLEAN
WATER TECHNOLOGY DEVELOPMENT
Key Barriers
Energy intensity high – Aeration, heating, transport
Output water quality low – Pathogens, toxic
compounds, disinfection byproducts
Scalability – Microbial systems (including fuel cells),
centralized vs. decentralized
Breakthrough
Technologies
Advanced membranes, catalysts, adsorbents –
Need anti-fouling, high flux
Microbes – Fuel cells, superspecies evolution
Novel Hybrid Systems – Combined anaerobic and
aerobic systems
Disinfection – Wave energy, photocatalysts
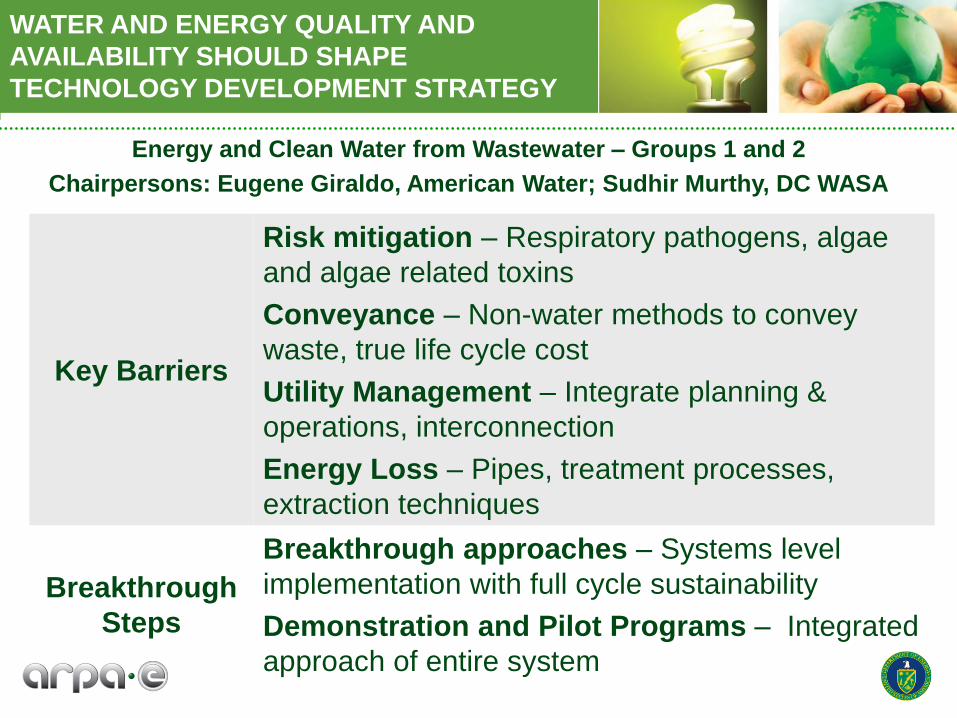
Energy and Clean Water from Wastewater – Groups 1 and 2
Chairpersons: Eugene Giraldo, American Water; Sudhir Murthy, DC WASA
WATER AND ENERGY QUALITY AND
AVAILABILITY SHOULD SHAPE
TECHNOLOGY DEVELOPMENT STRATEGY
Key Barriers
Risk mitigation – Respiratory pathogens, algae
and algae related toxins
Conveyance – Non-water methods to convey
waste, true life cycle cost
Utility Management – Integrate planning &
operations, interconnection
Energy Loss – Pipes, treatment processes,
extraction techniques
Breakthrough
Steps
Breakthrough approaches – Systems level
implementation with full cycle sustainability
Demonstration and Pilot Programs – Integrated
approach of entire system
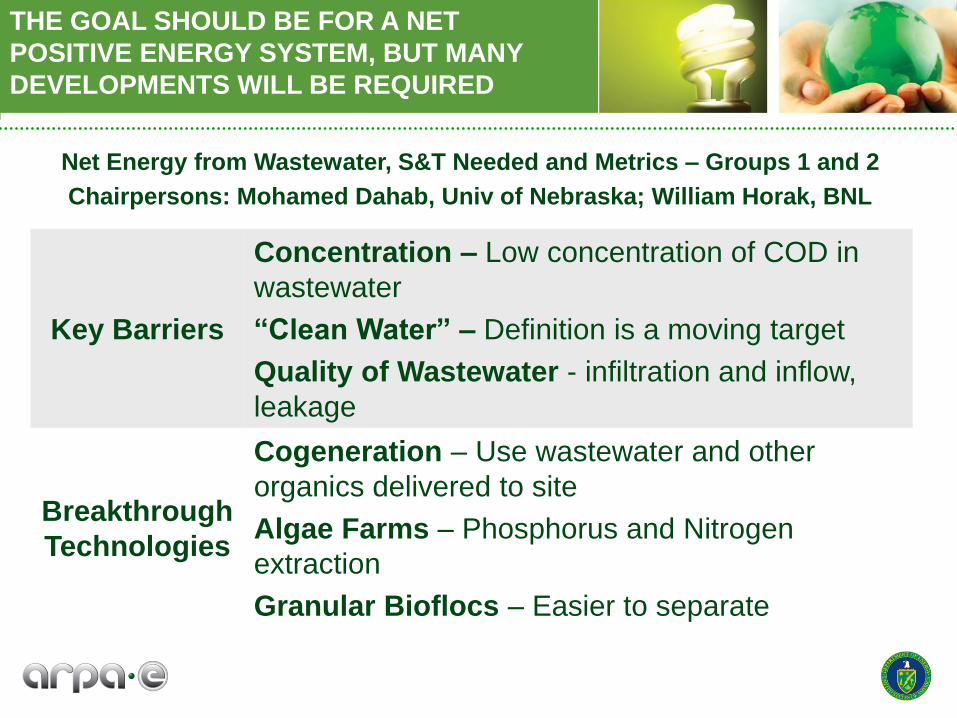
Net Energy from Wastewater, S&T Needed and Metrics – Groups 1 and 2
Chairpersons: Mohamed Dahab, Univ of Nebraska; William Horak, BNL
THE GOAL SHOULD BE FOR A NET
POSITIVE ENERGY SYSTEM, BUT MANY
DEVELOPMENTS WILL BE REQUIRED
Key Barriers
Concentration – Low concentration of COD in
wastewater
“Clean Water” – Definition is a moving target
Quality of Wastewater - infiltration and inflow,
leakage
Breakthrough
Technologies
Cogeneration – Use wastewater and other
organics delivered to site
Algae Farms – Phosphorus and Nitrogen
extraction
Granular Bioflocs – Easier to separate
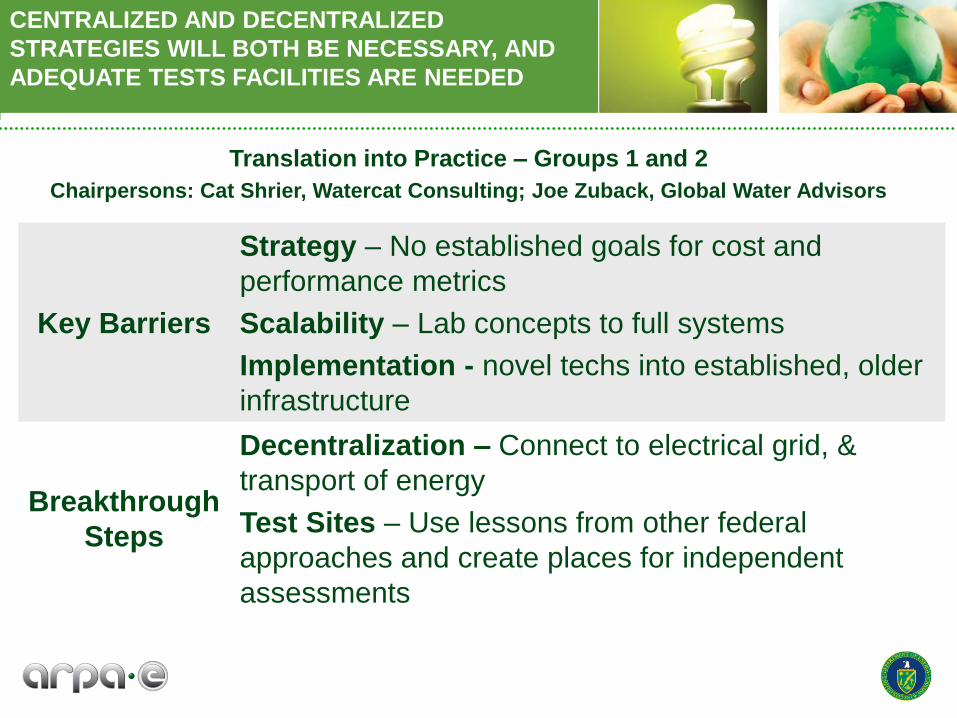
Translation into Practice – Groups 1 and 2
Chairpersons: Cat Shrier, Watercat Consulting; Joe Zuback, Global Water Advisors
CENTRALIZED AND DECENTRALIZED
STRATEGIES WILL BOTH BE NECESSARY, AND
ADEQUATE TESTS FACILITIES ARE NEEDED
Key Barriers
Strategy – No established goals for cost and
performance metrics
Scalability – Lab concepts to full systems
Implementation - novel techs into established, older
infrastructure
Breakthrough
Steps
Decentralization – Connect to electrical grid, &
transport of energy
Test Sites – Use lessons from other federal
approaches and create places for independent
assessments
21
Why Energy from Wastewater Technologies?
Workshop Structure and Approach
Workshop Keynote and Breakout Session Highlights
Workshop Takeaways

CURRENT TREATMENT METHOD
Many points of energy inputs and losses.
Energy and water recovery in an secondary treatment plant

CURRENT METHODS TO EXTRACT
ENERGY
Anaerobic digestion: Out of 16,000
municipal wastewater treatment plants in
the U.S, 3500 large plants employ
anaerobic digestion to produce ~60%
methane biogas.
Biogass heat used to complete the
digestion process.
Only 2% produce electricity using
scrubbed gas of hydrogen sulfide, CO2
and H2O.
Methane concentration can reach 95%,
but not without additional strengthening
(energy input).
Reciprocating engine fueled with
digester gas at work in Washington State
(Federal Energy Management Program)
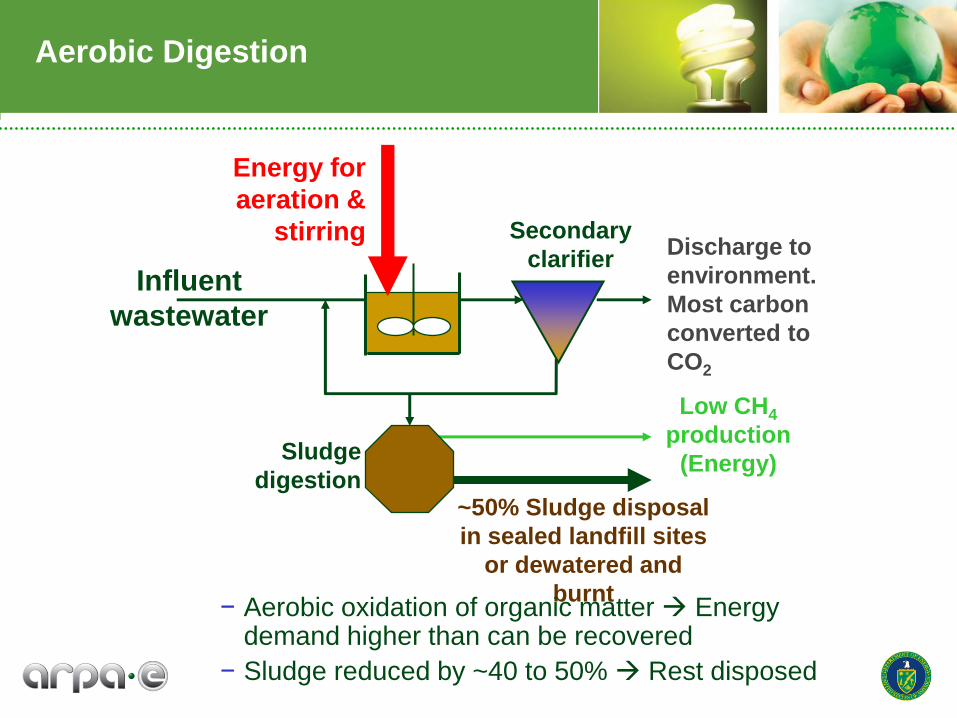
~50% Sludge disposal
in sealed landfill sites
or dewatered and
burnt
Aerobic Digestion
− Aerobic oxidation of organic matter Energy demand higher than can be recovered
− Sludge reduced by ~40 to 50% Rest disposed
Low CH4
production
(Energy)
Influent
wastewater
Secondary
clarifier
Energy for
aeration &
stirring
Sludge
digestion
Discharge to
environment.
Most carbon
converted to
CO2
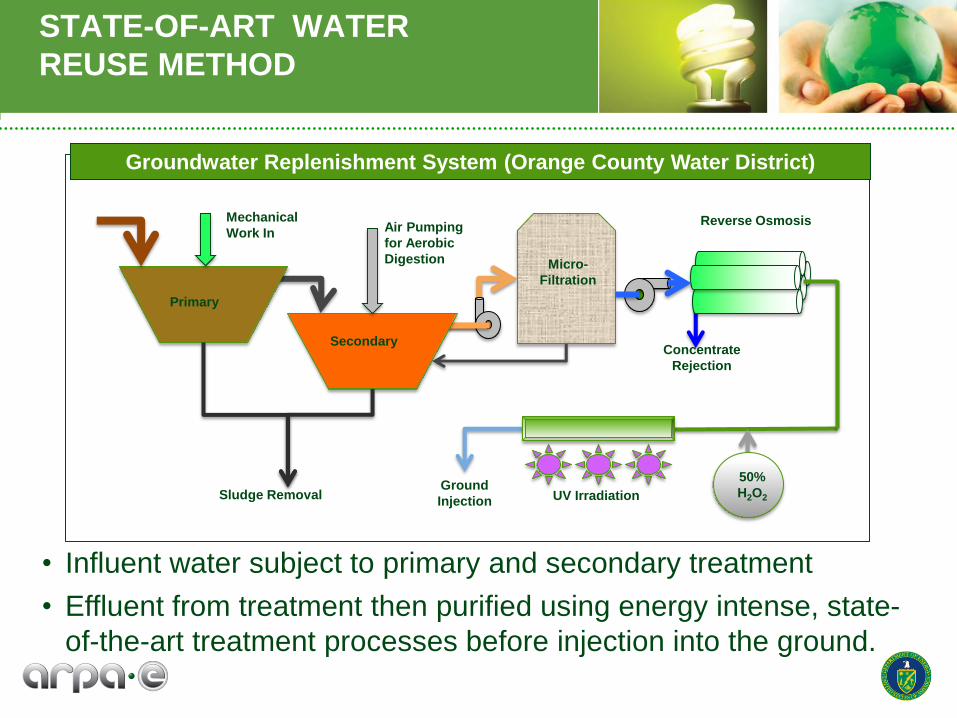
STATE-OF-ART WATER
REUSE METHOD
Primary
Secondary
Sludge Removal
Micro-
Filtration
Reverse Osmosis
Concentrate
Rejection
50%
H2O2
Ground
Injection UV Irradiation
Mechanical
Work In Air Pumping
for Aerobic
Digestion
• Influent water subject to primary and secondary treatment
• Effluent from treatment then purified using energy intense, state-
of-the-art treatment processes before injection into the ground.
Groundwater Replenishment System (Orange County Water District)

ACHIEVING NET ENERGY & CLEAN
WATER OUTPUT
Primary
Secondary
Micro-
Filtration
Reverse Osmosis
Concentrate
Rejection
50%
H2O2
All Water Out
UV Irradiation
Mechanical Stirring
& Fluid Shearing
Work
Air Pumping
for Aerobic
Digestion
Waste In
All Chemical
Energy In
All Work & Heat In All Work In All Work In
All Electrical
Energy In
Control Volume for Energy Balance Considerations
All Energy
OutAll Materials Out:
Dewatering, Hauling,
Burning
Balancing all inputs & outputs from source water to output is challenging!
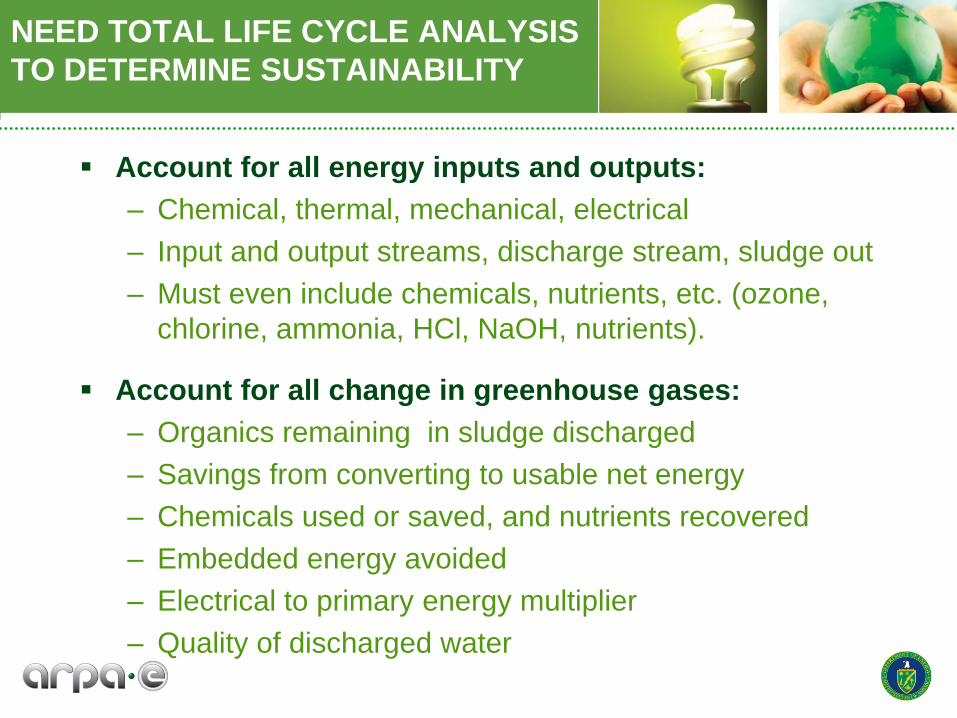
NEED TOTAL LIFE CYCLE ANALYSIS
TO DETERMINE SUSTAINABILITY
Account for all energy inputs and outputs:
– Chemical, thermal, mechanical, electrical
– Input and output streams, discharge stream, sludge out
– Must even include chemicals, nutrients, etc. (ozone,
chlorine, ammonia, HCl, NaOH, nutrients).
Account for all change in greenhouse gases:
– Organics remaining in sludge discharged
– Savings from converting to usable net energy
– Chemicals used or saved, and nutrients recovered
– Embedded energy avoided
– Electrical to primary energy multiplier
– Quality of discharged water
PROBLEM WITH RECOVERING
ENERGY: WATER!
Water content does not add to energy
– Need to extract energy from multiphase waste at cost per
kW-hr that is competitive with other sources of energy.
Dewatering waste takes lots of energy
– Taking it all the way to dry mass takes a lot of energy
(latent heat of evaporation ~2,260 kJ/kg of water content)
Separating out solids and volatiles energy intensive
– Settling: cheap, but slow and limited in performance
– Flocculation: leaves chemical residual
– Spinning: capital intensive
– Vacuum stripping: energy-capital intensive
– Evaporation: very energy intensive
Low strength (< 500 mg/liter) very hard to extract net energy
Wastewater highly variable
Contain clays, hard salts, sulfur compounds, etc.
Pathogens in abundance
Small toxic compounds pass through many processes
Long retention times (many hours to days) typically needed
MORE PROBLEMS TO OVERCOME

Direct incineration
– Net heat generated depends on water content, and pollution
controls needed. Breakeven for dewatering >> 3 MGD
Pyrolysis gasification of solids
– Conversion of biomass solids to char (600°C) then to syngas.
– Unclear if or where there is breakeven point.
Plasma processing
– Dewatered solids and volatiles passed through plasma arc.
– Unproven claims of net energy generation, but everything
burns, unlike other methods.
Each needs high concentration of biosolids that have been pre-
separated from water…energy of separation not considered,
nor water quality of effulent from separation, or volatiles
METHODS FOR ENERGY FROM
WASTEWATER: THERMAL
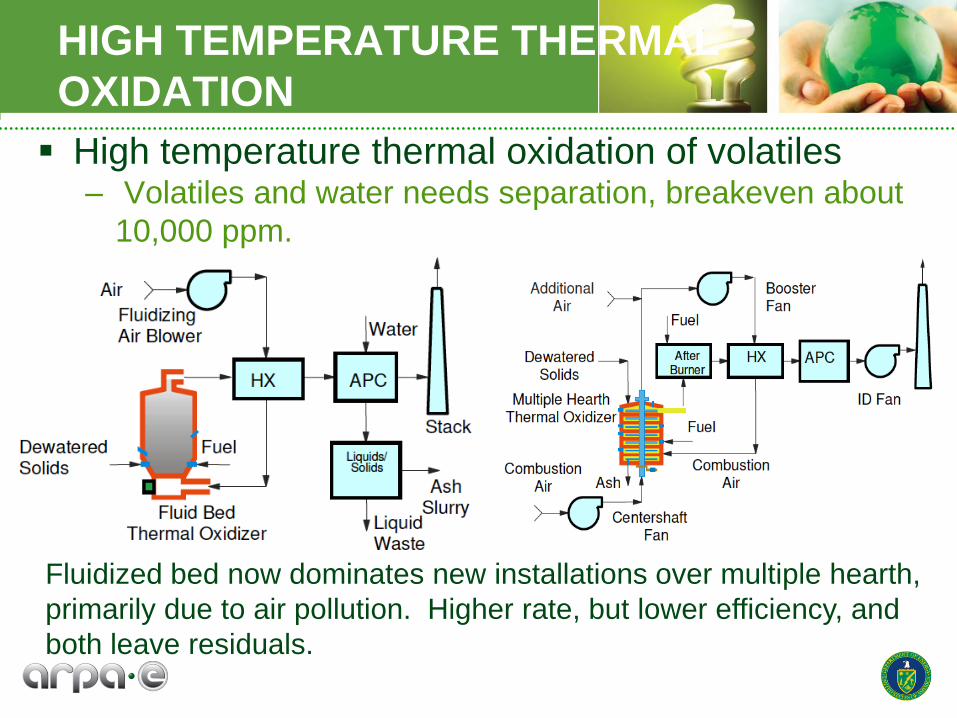
High temperature thermal oxidation of volatiles – Volatiles and water needs separation, breakeven about
10,000 ppm.
HIGH TEMPERATURE THERMAL
OXIDATION
Fluidized bed now dominates new installations over multiple hearth,
primarily due to air pollution. Higher rate, but lower efficiency, and
both leave residuals.
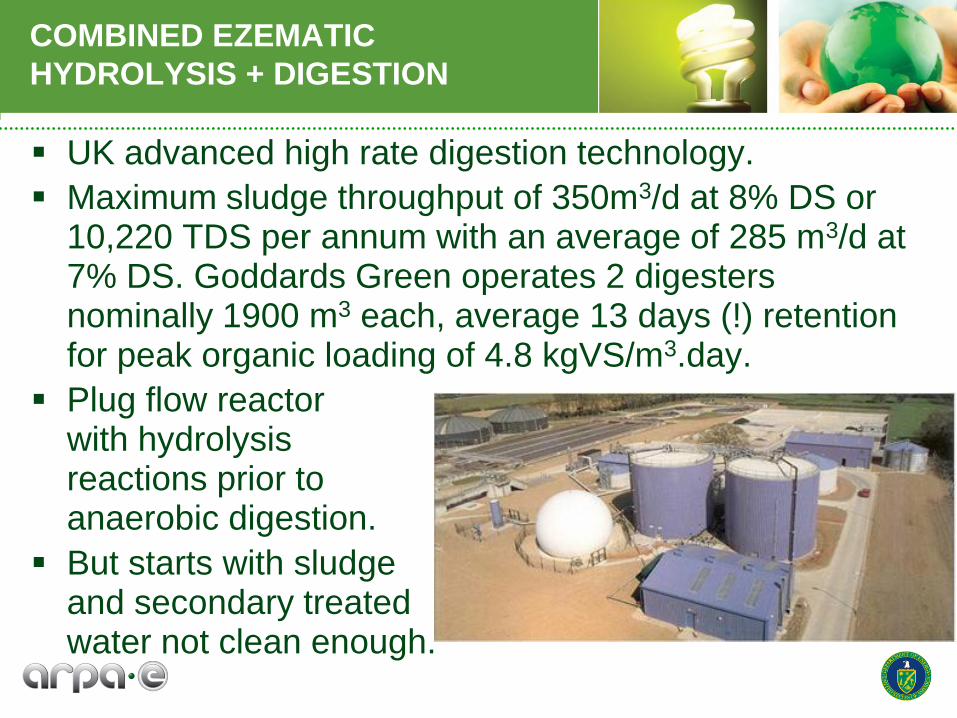
UK advanced high rate digestion technology.
Maximum sludge throughput of 350m3/d at 8% DS or 10,220 TDS per annum with an average of 285 m3/d at 7% DS. Goddards Green operates 2 digesters nominally 1900 m3 each, average 13 days (!) retention for peak organic loading of 4.8 kgVS/m3.day.
Plug flow reactor with hydrolysis reactions prior to anaerobic digestion.
But starts with sludgeand secondary treatedwater not clean enough.
COMBINED EZEMATIC
HYDROLYSIS + DIGESTION

Chemical hydrolysis + heat
– Net energy output not goal of method.
Algae
– Proposed, but no known operating systems.
– May be a great connection to co-generation and CO2 capture
and processing to liquid fuels.
Anaerobic digestion + heat
– Most common method to produce methane
– Can be used with membrane separation in Membrane
Bioreactors (MBRs), but must solve fouling
Enzymatic hydrolysis + heat
– Enzymes are expensive, need low cost synthesis technology
METHODS TO EXTRACT ENERGY:
COMBINED CHEMICAL/BIOLOGICAL &
THERMAL METHODS
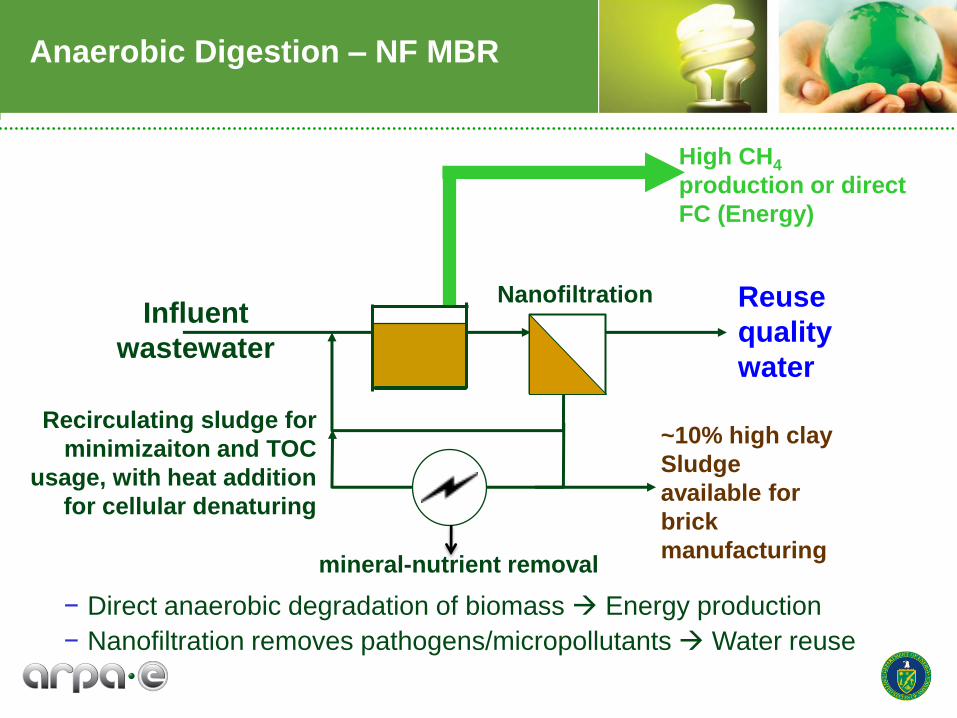
Anaerobic Digestion – NF MBR
− Direct anaerobic degradation of biomass Energy production
− Nanofiltration removes pathogens/micropollutants Water reuse
Influent
wastewater
Nanofiltration
Recirculating sludge for
minimizaiton and TOC
usage, with heat addition
for cellular denaturing
High CH4
production or direct
FC (Energy)
~10% high clay
Sludge
available for
brick
manufacturing
Reuse
quality
water
mineral-nutrient removal

METHODS TO EXTRACT ENERGY:
OTHER
Microbial Fuel Cells
– Efficiency potential: directly produce electrical energy.
– Conversion efficiency, kinetics, and robustness are major
issues.
Takeaway: Likely will take a combination of methods to
achieve net energy generation at common wastewater TOC
– With currently known methods will need combination like
enzymatic hydrolysis + anaerobic digestion with thermal
heating to exploiting high CH4 production of extremophiles
– Need to develop new materails, biological compounds, and
systems than used the to leapfrog to orders of magnitude gain
in permformance.

New Materials Development
– Non-fouling membranes to obviate extreme fouling
– Functionalized dendritic materials for binding nutrients.
– Blue light active photocatalysis to degrade complex
hydrocarbons to volatiles, destroy pathogens, and degrade
toxic organic compounds.
New biological microbes
– Increase production of methane and butanol
– Low cost enzymes for hydrolysis
Hybrid system development
– Ab initio system development of total process from intake to
output, with zero-discharge of wastes.
EXCITING NEW ADVANCEMENTS
POSSIBLE