energy saving and process optimization with liquiline control
TRANSCRIPT

02/13/2017
Products Solutions Services
Energy Saving & Process Optimization with Liquiline Control
Efficiency Up, Costs Down in WWTP with Liquiline Control
Slide 1 Jeff Low

02/13/2017
Energy Saving & Process Optimization with Liquiline Control
Content
• Introduction of WWTP process • Biological treatment• Nitrification & De-Nitrification process• Design of modern biological treatment • Energy Consumption of typical WWTP• Control Strategies • Endress+Hauser Instrumentation offering• Application reference
Slide 2 Jeff Low

02/13/2017
Treatment technologies
Energy Saving & Process Optimization with Liquiline Control
Wastewater components
Biological processesMechanical/physical processes
Non soluble soluble
deposable floated suspended organic inorganic
Flotation,Filtration
Sedimentation,Filtration
Flocculation,Filtration
anaerobe aerobe Physical/Chemical-physical/ thermal processes
Biological degradable
Non or difficult biological degradable
Common in municipal WWTP Not common in municipal WWTP
Slide 3 Jeff Low

02/13/2017
Biological treatment - Pollutants removal
Most modern WWTPs have to reduce • C: organic matter (molecules with organic carbon) • N: Nitrogen compounds (ammonium, nitrate, nitrite) • P: Phosphate
Energy Saving & Process Optimization with Liquiline Control
Biological treatment by using
• aeration basins (to reduce organics and
ammonium),
• anoxic basins (to reduce nitrate), and by
• adding flocculants (to reduce phosphate).
Slide 4 Jeff Low

02/13/2017
Energy Saving & Process Optimization with Liquiline Control
Wastewater pollutants
E+H ConductaSlide 5 / 114
• Gross pollutants, floating material, screenings, …• Sand, wood, plastics, … • Removal by screens, sieves, grit chamber
• Oxygen consuming substances (COD, BOD5)• Causes: Oxygen depletion in rivers, lakes (aerobic to anaerobic)• All degradable organic substances and ammonia• Removal by sedimentation and biological degradation
• Nutrients (N, P)• Causes: Growth of algae (eutrophication), oxygen depletion, toxicity• Nitrogen (ammonia, nitrate), phosphorus• Removal by biological conversion and/or chemical methods
• Pathogens (E.coli, Enterococci, … )• Risk when bathing and eating seafood• Removal by disinfection or membrane filtration
02/13/2017
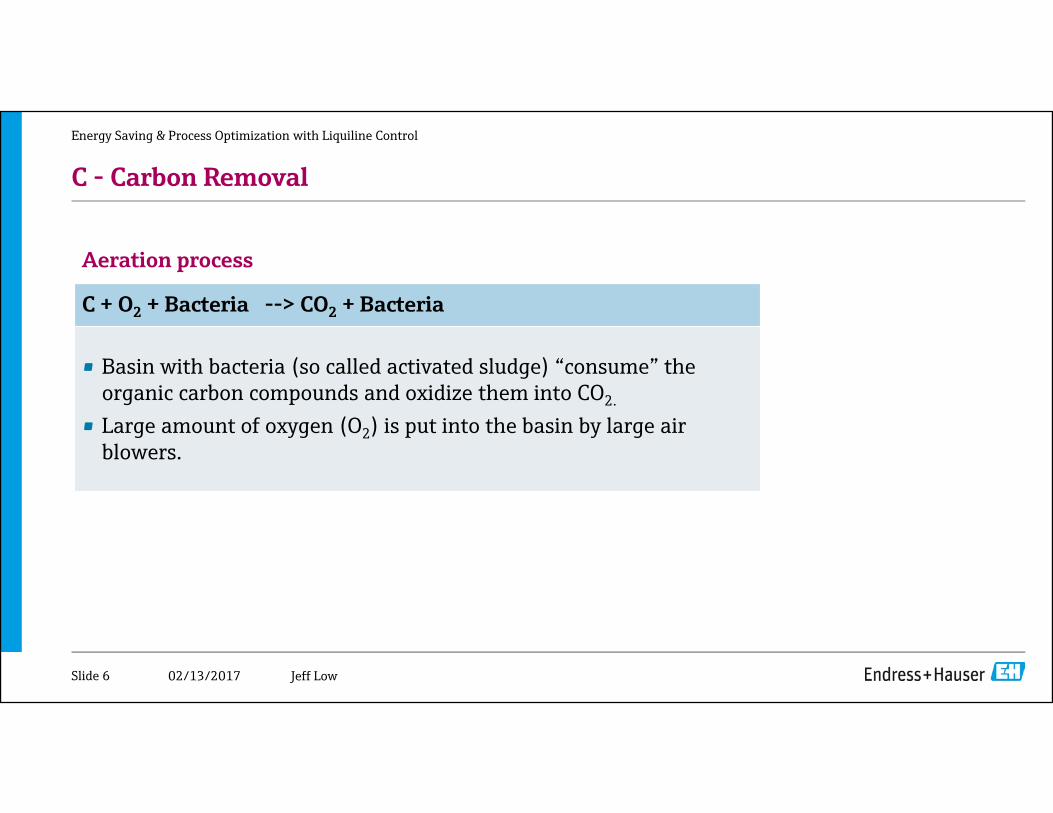
C - Carbon Removal
Energy Saving & Process Optimization with Liquiline Control
Aeration process
C + O2 + Bacteria --> CO2 + Bacteria
• Basin with bacteria (so called activated sludge) “consume” the organic carbon compounds and oxidize them into CO2.
• Large amount of oxygen (O2) is put into the basin by large air blowers.
Slide 6 Jeff Low

02/13/2017
N - Nitrogen Removal
Energy Saving & Process Optimization with Liquiline Control
Nitrification NH4 + O2 + Bacteria ----> NO2 + O2 ----> NO3
• Most of the Nitrogen comes in as Ammonium (NH4). • First step, bacteria convert (NH4) into Nitrite(NO2) and other
bacteria in the same basin convert Nitrite into Nitrate(NO3).
De-NitrificationNO3 + C + Bacteria ----> N2 gas
• Second step, bacteria convert Nitrate(NO3) into Nitrogen gas (N2). • Nitrogen gas then goes out of the water. • This process does not require oxygen.
Slide 7 Jeff Low

02/13/2017
DE-NITRIFICATION
NITRIFICATION
Energy Saving & Process Optimization with Liquiline Control
Oxygen – Ammonia - Nitrate
Organic Carbon + Oxygen Carbon Dioxide + Water + BacteriaCn + O2 CO2 + H2O + new Bacteria
Ammonia + Oxygen Nitrate
NH4 + O2 NO2 NO3
Nitrate + organic Carbon Nitrogen ()
NO3 + Corg N2
“Aerobic conditions”
Aeration ON
Aeration OFF
“Anoxic Conditions”
Slide 8 / 33 Industry Management
02/13/2017
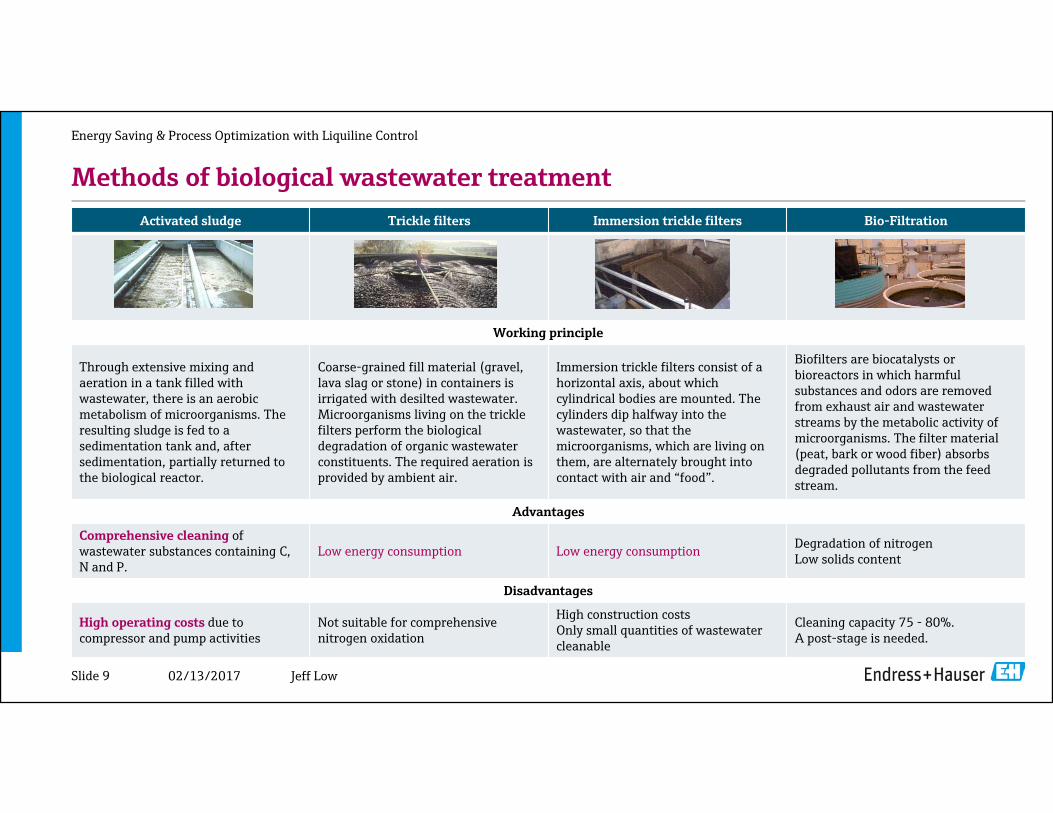
Methods of biological wastewater treatment
Energy Saving & Process Optimization with Liquiline Control
Activated sludge Trickle filters Immersion trickle filters Bio-Filtration
Working principle
Through extensive mixing and aeration in a tank filled with wastewater, there is an aerobic metabolism of microorganisms. The resulting sludge is fed to a sedimentation tank and, after sedimentation, partially returned to the biological reactor.
Coarse-grained fill material (gravel, lava slag or stone) in containers is irrigated with desilted wastewater. Microorganisms living on the trickle filters perform the biological degradation of organic wastewater constituents. The required aeration is provided by ambient air.
Immersion trickle filters consist of a horizontal axis, about which cylindrical bodies are mounted. The cylinders dip halfway into the wastewater, so that the microorganisms, which are living on them, are alternately brought into contact with air and “food”.
Biofilters are biocatalysts or bioreactors in which harmful substances and odors are removed from exhaust air and wastewater streams by the metabolic activity of microorganisms. The filter material (peat, bark or wood fiber) absorbs degraded pollutants from the feed stream.
Advantages
Comprehensive cleaning ofwastewater substances containing C,N and P.
Low energy consumption Low energy consumption Degradation of nitrogenLow solids content
Disadvantages
High operating costs due to compressor and pump activities
Not suitable for comprehensive nitrogen oxidation
High construction costsOnly small quantities of wastewater cleanable
Cleaning capacity 75 - 80%. A post-stage is needed.
Slide 9 Jeff Low

02/13/2017
Activated Sludge Processes
Energy Saving & Process Optimization with Liquiline Control
Slide 10 / 114 E+H Conducta
Continuous Activated Sludge (CAS) Sequence Batch Reactor (SBR) Membrane Reactor (MBR)
Principle Principle PrincipleBeside mechanical cleaning, disinfection and sludgemanagement, the main treatment in a continuoussystem takes place in anoxic, aerobic andsettlement zones.
Microorganisms suspended in the activated sludge(activated sludge flocs) react under oxygen inlet anddegradate pollutant substances. Settling isolates sludge and clarified water. Toensure stable biomass values in the system settledsludge is recycled.
The aeration is done by surface aerators or finebubble diffusor hardware and compressors.
The processes of equalization, aeration andclarification are all done in one basin.
SBR systems consist of five common steps: 1) Fill2) React (aeration)3) Settle (sedimentation/clarification)4) Draw (decanted)5) Idle
The SBR acts as an equalization system when fillingthe tank which tolerates peak flows or huge loads.
The aeration is mainly done by fine bubble diffusorsand compressors.
Membrane bioreactors (MBR) combine activatedsludge processing with a membrane liquid-solid seperation process. There is no need of clarificationand tertiary filtration due to membrane micro- orultrafiltration.
The system allows to drive at high sludge valuesbetween 8 – 12g/l. Limitations due to bad settlingcharacteristics of sludge are avoided and thereforehigher loading rates can be driven.
The aeration is done by fine bubble diffusors andcompressors mainly.

02/13/2017
Biological treatment
Energy Saving & Process Optimization with Liquiline Control
Slide 11 Jeff Low
Aeration basin and Second clarifier

02/13/2017
Products Solutions Services
What is the energy consumption and How to reduce cost
Jeff LowSlide 12

02/13/2017
Energy: 15%
Maintenance: 14%Non
personneland other
costs: 13%
Sludge disposal and treatment:
31%
Personnel: 27%
Share of total operating costs
Op-Ex in a middle sized German WWTP (50,000-100,000 PE)
Energy Saving & Process Optimization with Liquiline Control
50,000 – 100,000 inhabitants; Bode, Grünbaum
Slide 13 Jeff Low
Biological treatment
and secondary
clarification: 67%
Flocculation filtration:
8%
Sludge treatment:
11%
Infrastructure and other: 6%
Sewage lift station: 5%
Primary treatment: 3%
Energy consumption in detail Aeration (blowers) and sludge handling (pumps) are the main energy consumers in WWTP
Biggest Savings potential
02/13/2017
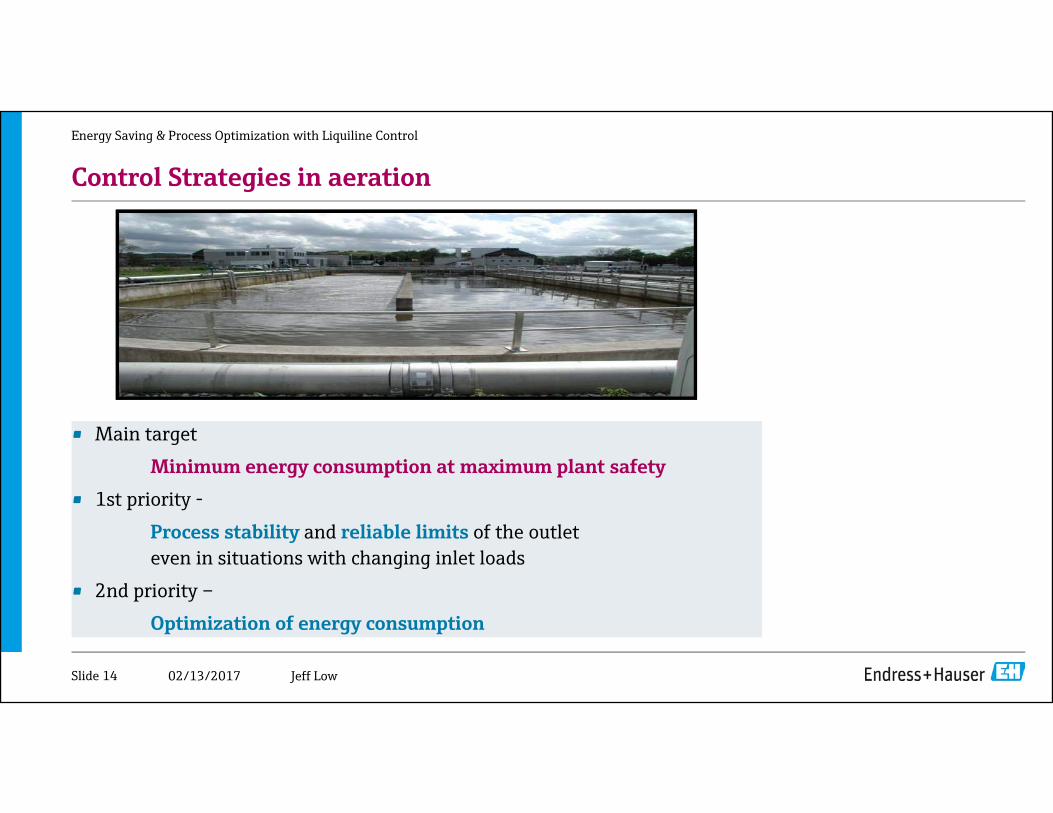
Control Strategies in aeration
• Main target Minimum energy consumption at maximum plant safety
• 1st priority -Process stability and reliable limits of the outlet even in situations with changing inlet loads
• 2nd priority –Optimization of energy consumption
Energy Saving & Process Optimization with Liquiline Control
Slide 14 Jeff Low
02/13/2017
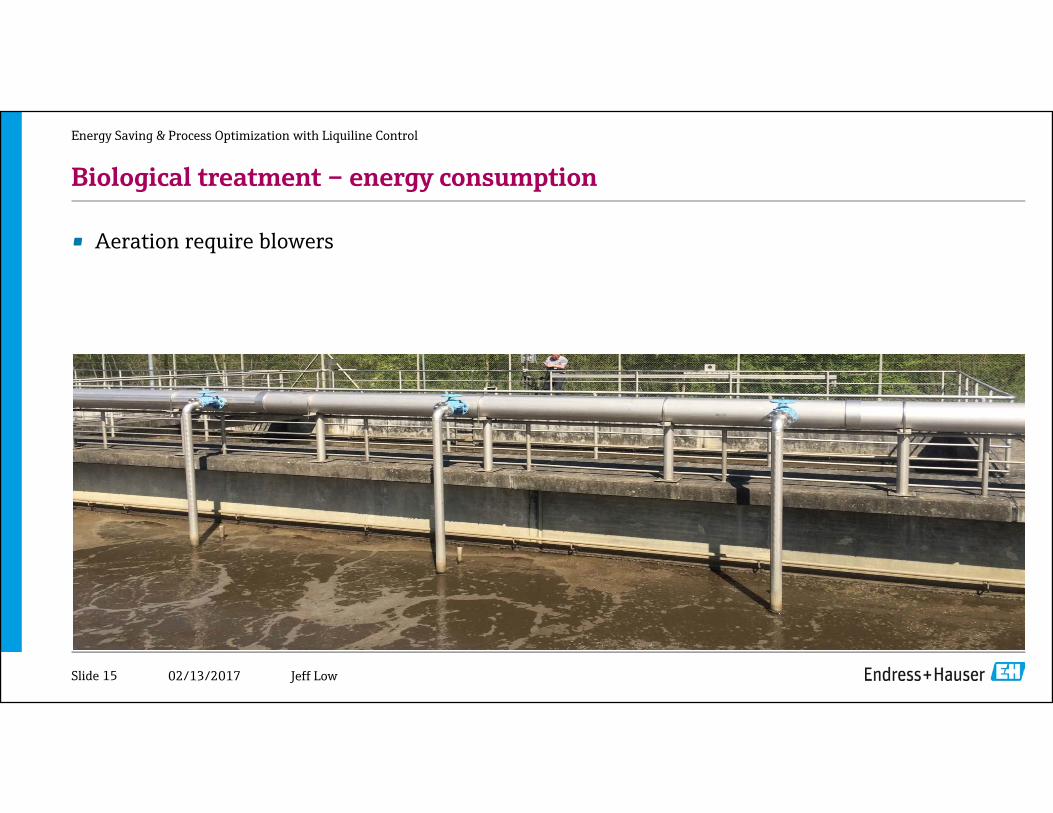
Biological treatment – energy consumption
• Aeration require blowers
Energy Saving & Process Optimization with Liquiline Control
Slide 15 Jeff Low

02/13/2017
How much Oxygen is really needed?
Below 1 mg/l DO the bacteria activity is decreasing significantly limits and process in danger!
Energy Saving & Process Optimization with Liquiline Control
100 100
Oxygen concentration mg/l
Rel.
perf
orm
ance
of
nitr
ified
bac
teria
[%
]
0 1 2 3 4
50
0
50
0
12
To optimize the aeration process, the Oxygen concentration range between 1.2 … 2 mg/l has the ideal cost efficiency ratio!
DO-concentration above 2,5 … 3,0 mg/l don´t result in higher bacteria activity and better results but increase the energy demand waste of energy!
Slide 16 / 33 Industry Management
12
02/13/2017
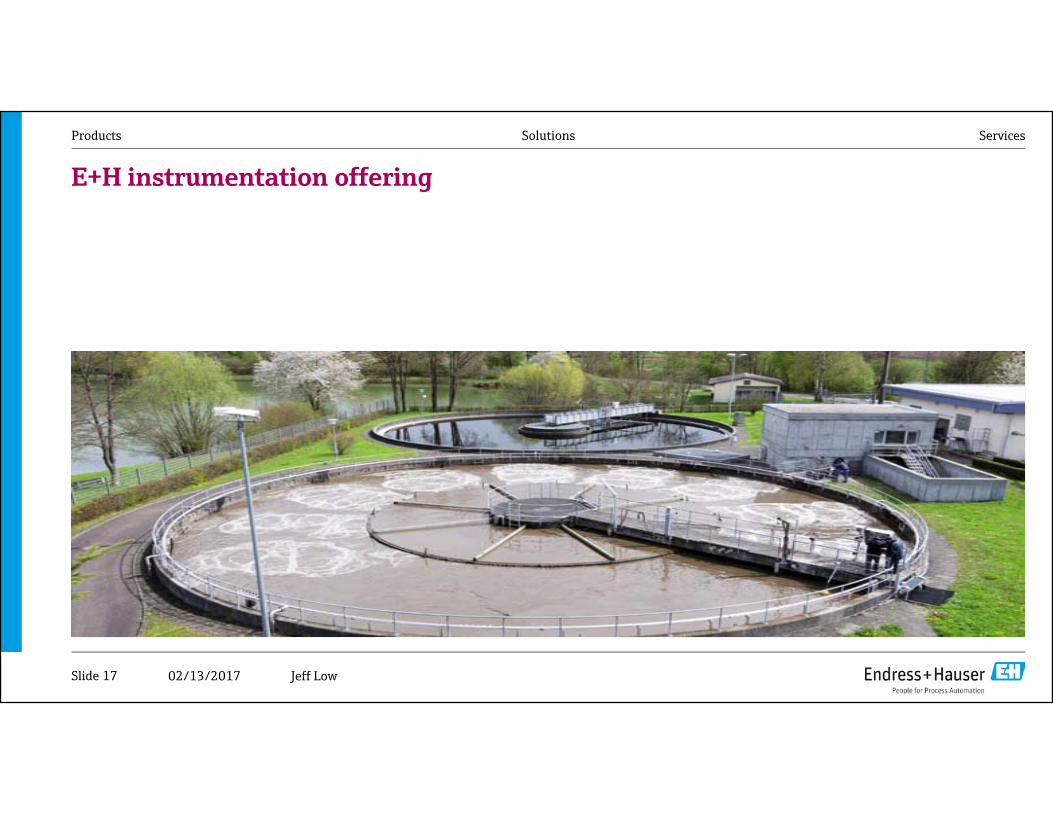
Products Solutions Services
E+H instrumentation offering
Jeff LowSlide 17

02/13/2017
Measured parameters
• Most modern WWTPs for process control it makes great sense to measure online :
• Dissolved oxygen (DO)• Ammonium (NH4)• Nitrate (NO3)
Sometimes also• Ortho-phosphate (PO4) • Total organic carbon (TOC)• Chemical Oxygen Demand (COD)
Energy Saving & Process Optimization with Liquiline Control
Slide 18 Jeff Low

02/13/2017
Full instrumentation of a biological process with Deni/Nitri (1)
Energy Saving & Process Optimization with Liquiline Control
Slide 19 / 33
Example simultaneous aeration
pH/Temp
Monitored, important parameter for bacterial activity
Susp. Solids
Controlled, indicates bacteria concentration
Oxygen Controlled, guarantee air supply for bacteria
NH4 Monitored, indicates the success of Nitrification
NO3 Monitored, indicates success of Denitrification
(ORP) Especially in SBR and intermitted process to monitor the aeration/non aeration periods Waste activated sludge (WAS)
02/13/2017
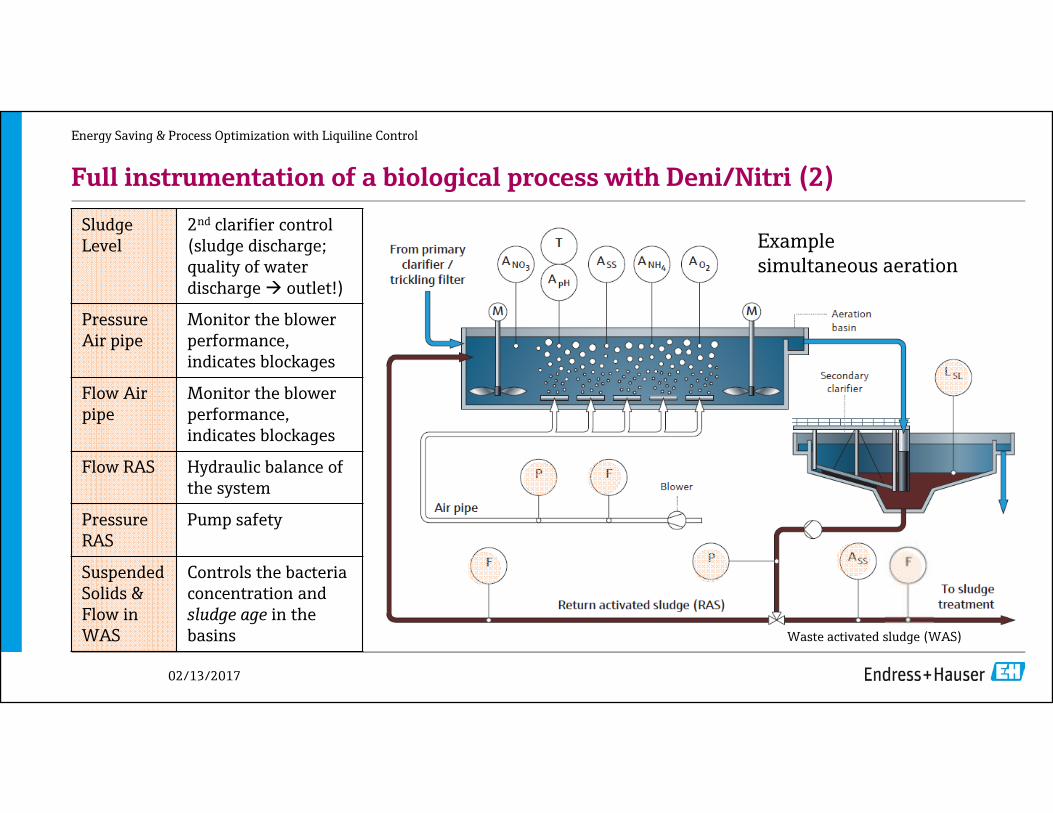
Full instrumentation of a biological process with Deni/Nitri (2)
Energy Saving & Process Optimization with Liquiline Control
Example simultaneous aeration
Sludge Level
2nd clarifier control (sludge discharge; quality of water discharge outlet!)
Pressure Air pipe
Monitor the blower performance, indicates blockages
Flow Air pipe
Monitor the blower performance, indicates blockages
Flow RAS Hydraulic balance of the system
Pressure RAS
Pump safety
SuspendedSolids & Flow in WAS
Controls the bacteria concentration and sludge age in the basins Waste activated sludge (WAS)

02/13/2017
Aeration control with Ammonia and Oxygen
• Standard control:Oxygen measurement for oxygen concentration control (min… max)
• Enhanced control:The comparison of Ammonia value and Ammonia set-point defines the O2-set point of the Oxygen control.
• In both cases the actuating variable is the O2- feed (blower)
Energy Saving & Process Optimization with Liquiline Control
Industry ManagementSlide 21 / 33
Waste activated sludge (WAS)
02/13/2017
Energy Saving & Process Optimization with Liquiline Control
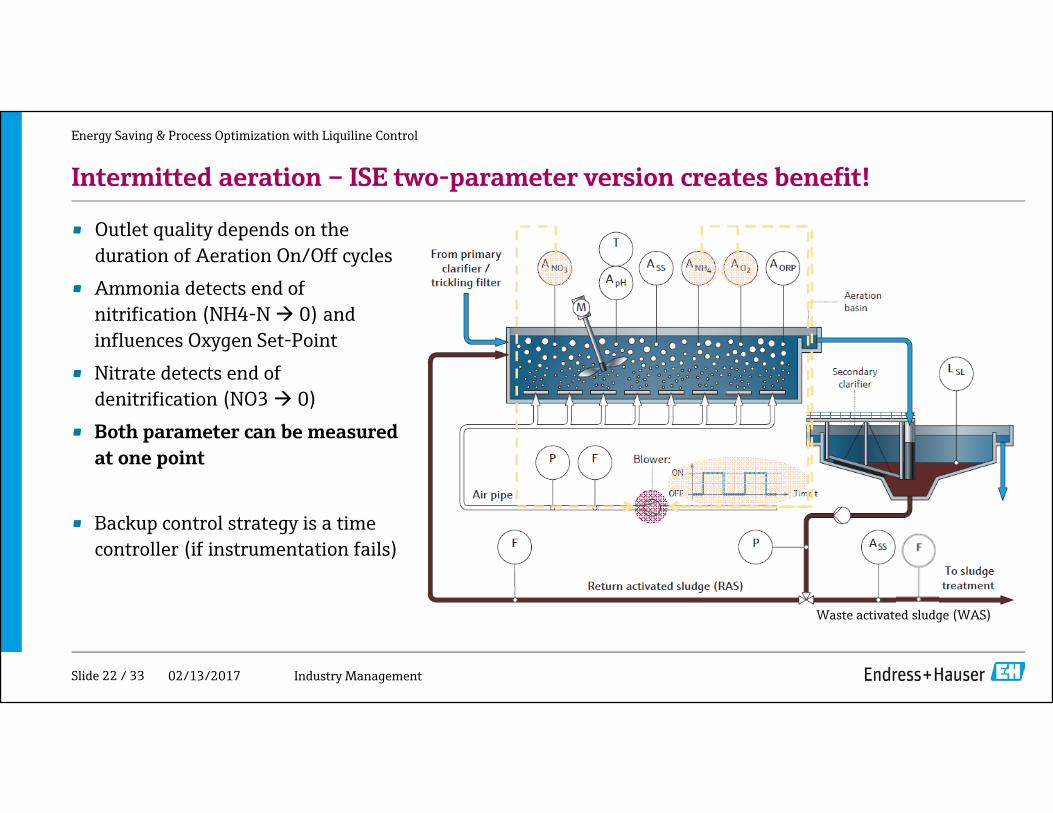
Intermitted aeration – ISE two-parameter version creates benefit!
Industry ManagementSlide 22 / 33
• Outlet quality depends on the duration of Aeration On/Off cycles
• Ammonia detects end of nitrification (NH4-N 0) and influences Oxygen Set-Point
• Nitrate detects end of denitrification (NO3 0)
• Both parameter can be measured at one point
• Backup control strategy is a time controller (if instrumentation fails)
Waste activated sludge (WAS)

02/13/2017
Energy Saving & Process Optimization with Liquiline Control
Control of Waste Activated Sludge
Industry ManagementSlide 23 / 33
• The sludge concentration in the aeration basin is controlled by the sludge amount which is taken off the biological system (waste activated sludge WAS)
Task• Adjustment of sludge concentration in the
basin (SS) by QWAS
• Adjustment of sludge age by QWAS and SSWAS
• Avoidance of overloading the 2nd clarifier
Waste activated sludge (WAS)

02/13/2017
Liquiline Control : Applications
E+H ConductaSlide 24 / 114
Aeration controlcontinuously
Aeration controlintermittent
Precipitant dosing controlOrtho-phosphate
The following processes can be optimised by the use of Liquiline Control.
Energy Saving & Process Optimization with Liquiline Control

02/13/2017
Products Solutions Services
Liquiline Control
Slide 25 Jeff Low

02/13/2017
Intermitent Aeration Control
Energy Saving & Process Optimization with Liquiline Control
Slide 26 Jeff Low

02/13/2017
Continuous Aeration Control Energy Saving & Process Optimization with Liquiline Control
Slide 27 Jeff Low

02/13/2017
Energy Saving & Process Optimization with Liquiline Control
Key Message
By monitoring the concentration of Oxygen(DO), Ammonium(NH4)and Nitrate (NO3), we can control the efficiency of aeration process thus optimize in energy consumption
Slide 28 Jeff Low

02/13/2017
Products Solutions Services
Application Reference
Slide 29 Jeff Low

02/13/2017
Results from the process - intermittent
Energy Saving & Process Optimization with Liquiline Control
E+H ControlCustomer Control
NH4-NNO3-N
Pressure in PipeValve activity
O2
Total nitrogen values above limit
Safe total nitrogen values
Effluent limit: Total nitrogen 12 mg/l
Slide 30 Jeff Low

02/13/2017
Results from the process - continuous
Energy Saving & Process Optimization with Liquiline Control
E+H control Inflow NH4-NCustomer control
Customer control: High valve activity -> High energy use
E+H control: Less valve activity -> 20 % energy savings
Slide 31 Jeff Low

02/13/2017
Energy Saving & Process Optimization with Liquiline Control
Endress+Hauser ConductaSlide 32 / 114
References“I was amazed by how fast and smoothly it went. Within a few hours, the controller was up and running. After just a few weeks, we saw that we were able to operate the system at a very stable level while almost halving aeration times. Obviously, this saves energy.“Michael Szegedi, Operating Manager of Waldhausen Wastewater Treatment Plant

02/13/2017
Case studies from R+E (Middle sized plant)
Energy Saving & Process Optimization with Liquiline Control
Christoph HerbSlide 33 / 114
Plant details : • 80 000 PE • 12 Ml/d
R+E projects:• Energy monitoring • Continuous aeration control • Phopshate precipitant dosing (in preparation)

02/13/2017
Results from plant (80 000 PE) – ROI analysis
Energy Saving & Process Optimization with Liquiline Control
Energy costs (1 kWh) € 0,12 Sum of power blower 80 kWSavings by optimization: 20 %
Energy consumption before E+H: € 82 000,- / p. a. (average)Energy consumption with E+H: € 66 355,- / p. a. (average)
Annual energy savings: € 15 644,- (20 %)
Energy savings per day: € 45,-
Return on invest: appr. 1 year
Calculation based on real customer data.
Slide 34 Jeff Low

02/13/2017
Customer benefit in a nutshell
• Meet total nitrogen and NH4-N effluent directives
• Optimize your process and increase plant efficiency.
• Save energy, thus operating costs (Op-Ex).
• Have less investments and a fast ROI
• Less actuators use demand less MRO for blower.
Energy Saving & Process Optimization with Liquiline Control
Slide 35 Jeff Low

02/13/2017
3-years story together with a customerWWTP Faellanden – Bachwis in Switzerland45,000 PE
2008energy costs of 110,000 - CHF per yearintermitted aeration with time controlnew blower was necessary
2009Investment into Oxygen instrumentation and implementation of an oxygen based control strategy-> yearly energy costs: 79,000 - CHF
2010Investment into ISE sensor for NH4 and NO3 to improve the control strategy-> yearly energy costs: 63,000 - CHF
-39 % energy costs
-25 % energy costs
Energy Saving & Process Optimization with Liquiline Control
Slide 36 Jeff Low

02/13/2017
Municipal WWTP Tomaszow Mazowiecki
Energy Saving & Process Optimization with Liquiline Control
• Project: 4 intermittent aeration controller + 4 phosphate elimination controller in bio-reactors
• Plant size: 150 000 PE (22,5 Mld)• 2xCDC81, 4xCAS40D, 4xCOS61D, 4xCM44X,
4xCA80PH, 4xCAT820• Process consulting, commissioning &
optimization of instrumentation + control• First installation in Poland regarding
automation solutions in wastewater
Slide 37 Jeff Low
02/13/2017
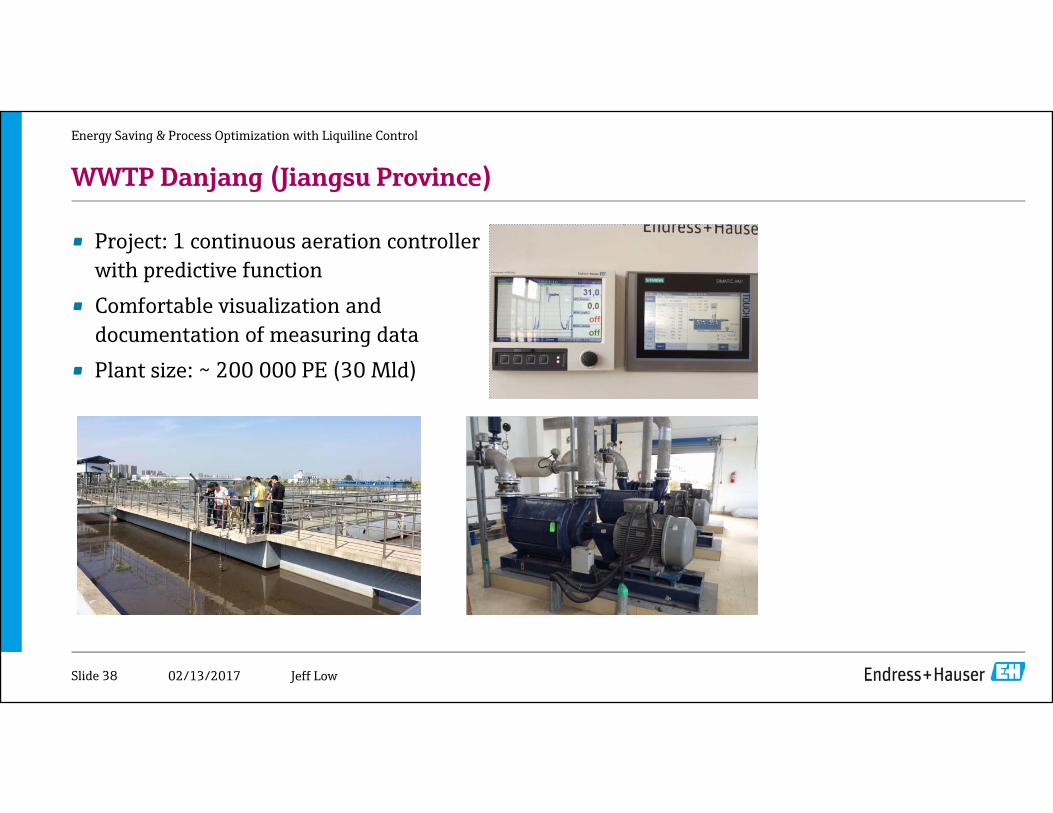
WWTP Danjang (Jiangsu Province)
Energy Saving & Process Optimization with Liquiline Control
• Project: 1 continuous aeration controller with predictive function
• Comfortable visualization and documentation of measuring data
• Plant size: ~ 200 000 PE (30 Mld)
Slide 38 Jeff Low

02/13/2017
WWTP Danjang (Jiangsu Province)
Energy Saving & Process Optimization with Liquiline Control
• CDC81, CAS40D, COS61D, CM44X, RSG40 • Process consulting • Commissioning & optimization of new aeration control
system including instrumentation • First installation in China regarding automation solutions in
wastewater
Slide 39 Jeff Low
02/13/2017
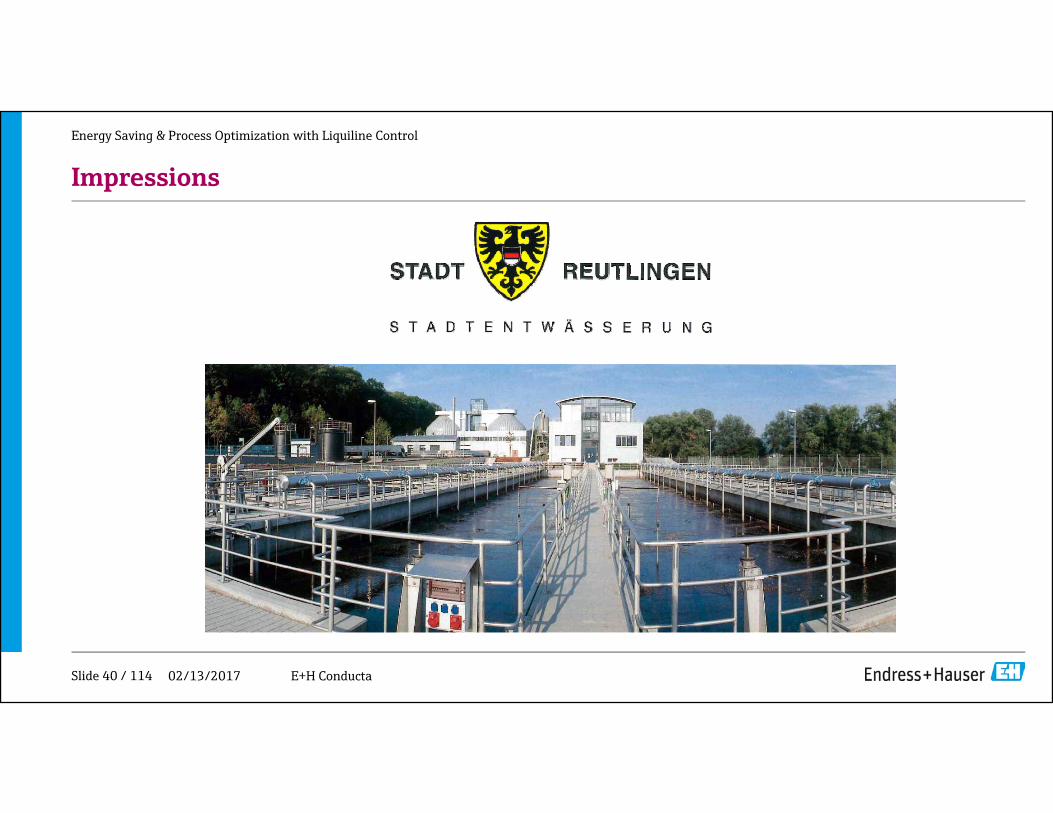
Impressions
Energy Saving & Process Optimization with Liquiline Control
Slide 40 / 114 E+H Conducta

02/13/2017
Plant layout
Energy Saving & Process Optimization with Liquiline Control
Slide 41 / 114 E+H Conducta
Hydaulical loadPE 79 000 Ml/d (m³/d) 12
Biological loadBOD5 load 5000 kg/d N load 620 kg/d P load 134 kg/d
C:N:P ratio 37:4,6:1
PartsMechanical-biological purification includingnitrification, denitrification and phosphoruselimination.
Anaerobic sludge digestion including sludge dewatering.

02/13/2017
Technical information
Energy Saving & Process Optimization with Liquiline Control
Slide 42 / 114 E+H Conducta
BasinsPre-clarifier 2 x 567 m³Anoxic zone (Bio-P) 3 x 502 m³
2 biological zones 4932 m³35 % Denitrification 1726 m³ Daily Ø ret. Time 5
Compressor 3 x 2300 m³/hFine bubble diffusors
Post-clarifier 2 x 3250 m³

02/13/2017
Instrumentation
Energy Saving & Process Optimization with Liquiline Control
Slide 43 / 114 E+H Conducta

02/13/2017
Instrumentation
Energy Saving & Process Optimization with Liquiline Control
Slide 44 / 114 E+H Conducta

02/13/2017
Instrumentation
Energy Saving & Process Optimization with Liquiline Control
Slide 45 / 114 E+H Conducta

02/13/2017
Products Solutions Services
Thank you very much for your attention
Slide 46 Jeff Low