energy savings potential and r&d opportunities for ... · this report was prepared as an...
TRANSCRIPT

Building Technologies Office
Energy Savings Potential and Research & Development Opportunities for Commercial Refrigeration September 2009
i
NOTICE
This report was prepared as an account of work sponsored by an agency of the
United States Government. Neither the United States Government, nor any
agency thereof, nor any of their employees, nor any of their contractors,
subcontractors, or their employees, makes any warranty, express or implied, or
assumes any legal liability or responsibility for the accuracy, completeness, or
usefulness of any information, apparatus, product, or process disclosed, or
represents that its use would not infringe privately owned rights. Reference
herein to any specific commercial product, process, or service by trade name,
trademark, manufacturer, or otherwise, does not necessarily constitute or imply its
endorsement, recommendation, or favoring by the United States Government or
any agency, contractor or subcontractor thereof. The views and opinions of
authors expressed herein do not necessarily state or reflect those of the United
States Government or any agency thereof.
Available electronically at http://www.osti.gov/home/

ii
Energy Savings Potential and R&D Opportunities for Commercial
Refrigeration
Prepared for:
U.S. Department of Energy
Office of Energy Efficiency and Renewable Energy
Building Technologies Office
http://www.eere.energy.gov/buildings
Prepared by:
Navigant Consulting, Inc.
77 South Bedford Street, Suite 400
Burlington, MA 01803
William Goetzler
Shalom Goffri
Sam Jasinski
Rebecca Legett
Heather Lisle
Aris Marantan
Matthew Millard
Daniel Pinault
Detlef Westphalen
Robert Zogg
September 23, 2009
iii
Table of Contents
Table of Contents ............................................................................................................... iii List of Figures .................................................................................................................... vi
List of Tables ................................................................................................................... viii List of Abbreviations ........................................................................................................ xii Executive Summary ......................................................................................................... xiv 1 Introduction ................................................................................................................. 1
1.1 Approach .............................................................................................................. 2
1.2 Overview of Commercial Refrigeration Industry ................................................ 3
2 Overview of Commercial Refrigeration Equipment Types ........................................ 7
2.1 Supermarket Refrigeration Systems ..................................................................... 8
2.2 Walk-in Coolers and Freezers ............................................................................ 11
2.3 Refrigerated Food Service Equipment ............................................................... 13
2.4 Reach-ins ............................................................................................................ 15
2.5 Beverage Merchandisers .................................................................................... 18
2.6 Ice Machines ...................................................................................................... 20
2.7 Refrigerated Vending Machines......................................................................... 25
3 Description of Baseline Equipment .......................................................................... 28
3.1 Supermarket Refrigeration Systems ................................................................... 28
3.1.1 Equipment Description and Illustrations .................................................... 28
3.1.2 Energy Consumption .................................................................................. 35 3.1.3 Purchase and Installation Costs .................................................................. 42
3.1.4 Life, Reliability, and Maintenance Characteristics ..................................... 44 3.1.5 Major Manufacturers and Distribution Channels ....................................... 45
3.1.6 Major End-Users ......................................................................................... 46
3.2 Walk-In Coolers and Freezers ............................................................................ 47
3.2.1 Equipment Description and Illustrations .................................................... 47 3.2.2 Energy Consumption .................................................................................. 50
3.2.3 Purchase and Installation Costs .................................................................. 54 3.2.4 Life, Reliability, and Maintenance Characteristics ..................................... 55
3.2.5 Major Manufacturers .................................................................................. 55 3.2.6 Major End-Users ......................................................................................... 55
3.3 Refrigerated Food Service Equipment ............................................................... 56
3.3.1 Equipment Description and Illustrations .................................................... 56
3.3.2 Energy Consumption .................................................................................. 57 3.3.3 Purchase and Installation Costs .................................................................. 59 3.3.4 Life, Reliability, and Maintenance Characteristics ..................................... 59 3.3.5 Major Manufacturers .................................................................................. 60 3.3.6 Major End-Users ......................................................................................... 60
3.4 Reach-Ins ............................................................................................................ 60
3.4.1 Equipment Description and Illustrations .................................................... 60 3.4.2 Energy Consumption .................................................................................. 64 3.4.3 Purchase and Installation Costs .................................................................. 69
iv
3.4.4 Life, Reliability, and Maintenance Characteristics ..................................... 70
3.4.5 Major Manufacturers .................................................................................. 70 3.4.6 Major End-Users ......................................................................................... 71
3.5 Beverage Merchandisers .................................................................................... 71
3.5.1 Equipment Description and Illustrations .................................................... 71 3.5.2 Energy Consumption .................................................................................. 73
3.5.3 Purchase and Installation Costs .................................................................. 74 3.5.4 Life, Reliability, and Maintenance Characteristics ..................................... 75 3.5.5 Major Manufacturers .................................................................................. 75 3.5.6 Major End-Users ......................................................................................... 75
3.6 Ice Machines ...................................................................................................... 76
3.6.1 Equipment Description ............................................................................... 76
3.6.2 Energy Consumption .................................................................................. 78 3.6.3 Purchase and Installation Costs .................................................................. 84
3.6.4 Life, Reliability, and Maintenance Characteristics ..................................... 85 3.6.5 Major Manufacturers .................................................................................. 85
3.7 Refrigerated Vending Machines......................................................................... 87
3.7.1 Equipment Description and Illustrations .................................................... 87
3.7.2 Energy Consumption .................................................................................. 90 3.7.3 Purchase and Installation Costs .................................................................. 91 3.7.4 Life, Reliability, and Maintenance Characteristics ..................................... 92
3.7.5 Major Manufacturers .................................................................................. 92 3.7.6 Major End-Users ......................................................................................... 93
4 Energy Savings Potential Using Current Technologies ............................................ 94
4.1 Currently Available Technologies ..................................................................... 95
4.1.1 Insulation..................................................................................................... 96 4.1.2 Fans ............................................................................................................. 97
4.1.3 Compressors .............................................................................................. 101 4.1.4 Heat Exchangers ....................................................................................... 104 4.1.5 Anti-Sweat Heaters ................................................................................... 106
4.1.6 Doors ......................................................................................................... 107
4.1.7 Defrost....................................................................................................... 108 4.1.8 Lighting ..................................................................................................... 109 4.1.9 Controls ..................................................................................................... 111
4.2 Supermarket Refrigeration Systems ................................................................. 123
4.2.1 Economic Analysis ................................................................................... 123
4.2.2 Barriers to Implementation in Supermarkets ............................................ 127
4.3 Walk-In Cooler & Freezers .............................................................................. 128
4.3.1 Economic Analysis ................................................................................... 128 4.3.2 Barriers to Implementation for Improved-Efficiency Walk-Ins ............... 132
4.4 Refrigerated Food Service Equipment ............................................................. 133
4.4.1 Economic Analysis ................................................................................... 133 4.4.2 Barriers to Implementation for Improved-Efficiency Food Service
Equipment ............................................................................................................... 135
4.5 Reach-Ins .......................................................................................................... 135

v
4.5.1 Economic Analysis ................................................................................... 135
4.5.2 Barriers to Implementation for Improved-Efficiency Reach-Ins .............. 137
4.6 Beverage Merchandisers .................................................................................. 137
4.6.1 Economic Analysis ................................................................................... 137 4.6.2 Barriers to Implementation for Improved-Efficiency Beverage
Merchandisers ......................................................................................................... 139
4.7 Ice Machines .................................................................................................... 140
4.7.1 Economic Analysis ................................................................................... 140
4.7.2 Barriers to Implementation for Improved-Efficiency Ice Machines ......... 141
4.8 Refrigerated Vending Machines....................................................................... 141
4.8.1 Economic Analysis ................................................................................... 141 4.8.2 Barriers to Implementation for Improved-Efficiency Refrigerated Vending
Machines ................................................................................................................. 144 5 Advanced Energy Saving Technologies and Tools ................................................ 145
5.1 Alternative Refrigeration System Technologies .............................................. 146
5.2 Advanced Compressors .................................................................................... 155
5.3 Advanced Insulation ......................................................................................... 157
5.4 Heat Exchangers ............................................................................................... 159
5.5 Alternative Refrigerants ................................................................................... 161
5.6 Advanced Lighting ........................................................................................... 163
5.7 Fan Blades ........................................................................................................ 165
5.8 Modeling, Monitoring and Tools ..................................................................... 165
6 Impact of Regulatory and Voluntary Efficiency Programs .................................... 167
6.1 Regulatory Programs ........................................................................................ 168
6.1.1 Federal Energy Conservation Standards ................................................... 168 6.1.2 State Energy Conservation Standards ....................................................... 173
6.2 Voluntary Programs ......................................................................................... 174
6.2.1 ENERGY STAR ....................................................................................... 175
6.2.2 Consortium for Energy Efficiency Commercial Kitchens Initiative ........ 177
6.2.3 Federal Energy Management Program ..................................................... 180 7 Recommendations ................................................................................................... 182
7.1 Mandatory Minimum Efficiency Standards ..................................................... 182
7.2 Voluntary Programs ......................................................................................... 183
7.2.1 Expand ENERGY STAR Program ........................................................... 183 7.2.2 Expand Consortium for Energy Efficiency (CEE) Programs ................... 183
7.2.3 Leverage Technology Validation and Market Introduction and Retailer
Energy Alliance Programs ...................................................................................... 184 7.2.4 Modeling & Design Tools for Manufacturers .......................................... 185
7.3 Support Research and Development of Advanced Technologies .................... 185
References ....................................................................................................................... 187 Image References ............................................................................................................ 196
Appendix A Explanation of Markups and Inflation Factors ...................................... 197
Appendix B Electricity Rate Data ............................................................................. 200

vi
List of Figures
Figure ES-1: Annual US Primary Energy Use of Commercial Buildings by End Use,
2006................................................................................................................................... xv
Figure ES-2: Annual Primary Energy Usage of Commercial Refrigeration by
Equipment Type (2008) ................................................................................................. xvi
Figure ES-3: Annual Potential Primary Energy Savings from Commercially
Available Technologies ................................................................................................. xvii Figure 1-1: U.S. Primary Energy Consumption by Sector, 2006 ................................. 3
Figure 1-2: Annual US Primary Energy Use of Commercial Buildings by End Use,
2006..................................................................................................................................... 4
Figure 1-3: Annual Primary Energy Usage of Commercial Refrigeration by
Equipment Type ................................................................................................................ 6 Figure 2-1: Self-Contained Refrigeration Circuit .......................................................... 8
Figure 2-2: Supermarket Refrigeration System Compressor Rack ........................... 10 Figure 2-3: Walk-ins by Temperature Level (2008) – 1,000,000 units total .............. 12
Figure 2-4: Walk-ins by End Use Applications (2008) – 1,000,000 units total .......... 12 Figure 2-5: Refrigerated Food Service Table Types .................................................... 14
Figure 2-6: Reach-In Installed Base Trends (1995-2008) ............................................ 17 Figure 2-7: 2008 Estimated Installed Base of Beverage Merchandisers. ................... 19 Figure 2-8: Ice Machine Equipment Types .................................................................. 21
Figure 2-9: Ice Types ...................................................................................................... 21 Figure 2-10: Ice Machine Installed Base Trend (1995-2008) ...................................... 23
Figure 2-11: Commercial Ice Machine Shipments in 2006 by Product Type ........... 24
Figure 2-12: Refrigerated Vending Machines – 2007 Equipment Inventory ............ 25
Figure 2-13: Refrigerated Packaged Beverage Vending Machines –
Owner/Operator Inventory Share ................................................................................. 26
Figure 3-1: Typical Supermarket Layout ..................................................................... 29 Figure 3-2: Typical Supermarket Refrigeration Circuit ............................................. 30 Figure 3-3: Vertical Open Multi-Deck Dairy Display Case ........................................ 31
Figure 3-4: Vertical Glass Door Reach-In Display Case for Frozen Food ................ 32
Figure 3-5: Semi-Vertical Open Multi-Deck Meat Display Case ............................... 32 Figure 3-6: Open Island Display Case for Frozen Food .............................................. 33 Figure 3-7: Annual Electricity Consumption Breakdown for Typical Supermarket36
Figure 3-8: Typical Supermarket Refrigeration System Electricity Consumption
Breakdown ....................................................................................................................... 37
Figure 3-9: Installed Cost Breakdown for a 100 Ton Supermarket Refrigeration
System ($2008) ................................................................................................................. 43
Figure 3-10: U.S. Market Share of Major Refrigerated Display Case Manufacturers
........................................................................................................................................... 45
Figure 3-11: Packaged Walk-In with Wall-Mounted Refrigeration System (Typical
of Restaurants) ................................................................................................................ 48
Figure 3-12: Packaged Walk-In with Top-Mounted Refrigeration System (Typical
of Restaurants) ................................................................................................................ 48
Figure 3-13: Walk-In Cooler with Merchandising Doors (Typical of Convenience
Stores)............................................................................................................................... 48
vii
Figure 3-14: Typical Walk-In Condensing Unit .......................................................... 49
Figure 3-15: Typical Walk-In Unit Cooler ................................................................... 49 Figure 3-16: Walk-In Cooler Schematic ....................................................................... 49 Figure 3-17: Typical Preparation Table ....................................................................... 56
Figure 3-18: Refrigerated Food Service Equip. Energy Consumption vs. Capacity
(all equipment types)....................................................................................................... 57 Figure 3-19: One-Door Solid-door Reach-In Freezer.................................................. 61 Figure 3-20: Reach-in Refrigerators ............................................................................. 62 Figure 3-21: Two-door, Solid-door Reach-in Refrigerator-Freezer .......................... 64
Figure 3-22: Manufacturer Market Shares for Commercial Refrigerators as of 2007
........................................................................................................................................... 70 Figure 3-23: Beverage Merchandiser - Equipment Illustration ................................. 72
Figure 3-24: Ice Machine Energy Consumption versus Capacity (all equipment
types) ................................................................................................................................ 80 Figure 3-25: Potable Water Consumption versus Capacity (all equipment types) ........... 81
Figure 3-26: Condenser Water Consumption versus Capacity (water-cooled only) 82 Figure 3-27: Freeze Cycle Energy Consumption by Load .......................................... 84
Figure 3-28: Refrigerated Packaged Beverage Vending Machine (Fully-Cooled) .. 88 Figure 3-29: Refrigerated Packaged Beverage Vending Machine (Zone-Cooled) ... 89 Figure 4-1: Vapor Injection Circuit for Low Temperature Applications ............... 102
Figure 4-2: Water-Cooled Distributed Refrigeration System .................................. 115 Figure 5-1: Thermo-magnetic Cycle. .......................................................................... 147
Figure 5-2: Rotary Magnetic Refrigerators ............................................................... 147 Figure 5-3: Entropy and Temperature Change vs. Magnetic Field ......................... 148 Figure 5-4: Operation of Thermoacoustic Refrigerators .......................................... 150
Figure 5-5. Thermoelectric heat engines. .................................................................... 151
Figure 5-6: ZT of State-of-the-Art Materials ............................................................. 153
Figure 5-7: Secondary Loop used with Vapor-Compression Refrigeration. (A)
Diagram of a direct expansion loop. (B) Diagram of a secondary refrigeration loop
......................................................................................................................................... 155 Figure 5-8: Linear and reciprocating compressor design diagrams. ....................... 156
Figure 5-9: Schematics of a typical open refrigerated vertical display case and air
circulation pattern (side view). Image taken from DOE 2009a. ............................... 158
Figure 5-10: Micro-channel heat exchanger. Image taken from Delphi. ................. 159
Figure 5-11: CO2 transcritical cycle and R-22 subcritical cycle at an ambient
temperature of 35C (95F) with baseline UA values. .................................................. 161
Figure 5-12: Principal COP behavior CO2 system and conventional (baseline)
systems at varying ambient temperatures. ................................................................. 162 Figure 6-1: Efficiency Standards for Solid Door Reach-Ins ..................................... 170
Figure 7-1: Advanced CRE Technologies Classified by Technology Maturity and
Potential ......................................................................................................................... 186 Figure A-0-1: Markup Relationships .......................................................................... 197 Figure A-0-2: Distribution Channels for Refrigerated Display Cases ..................... 198

viii
List of Tables
Table ES-1: Comparison of Annual CRE Energy Consumption Estimates ............. xv Table 1-1: Report Organization ...................................................................................... 1 Table 1-2: Comparison of Annual CRE Energy Consumption Estimates .................. 5 Table 2-1: 2008 Installed Base and Total Energy Consumption by Equipment Type 7 Table 2-2: Number of Stores and Average Sales in the Grocery Industry as of 2007 8
Table 2-3: Display Case Shipments (1999-2008) ............................................................ 9 Table 2-4: Supermarket Walk-In Unit Types .............................................................. 10 Table 2-5: Commercial Sector Overview - Walk-in Coolers and Freezers ............... 13 Table 2-6: Food Service Equipment Installed Base Data ............................................ 14 Table 2-7: Food Service Equipment Unit Energy Consumption ................................ 14
Table 2-8: Food Service Equipment Energy Consumption Summary ...................... 15 Table 2-9: Reach-in Freezer Installed Base Data ......................................................... 16
Table 2-10: Reach-in Refrigerator Installed Base Data .............................................. 17 Table 2-11: Reach-In Energy Consumption Summary ............................................... 18
Table 2-12: Beverage Merchandiser – 2008 Equipment Installed Base .................... 20 Table 2-13: Ice Machine Equipment Types .................................................................. 20
Table 2-14: Ice Machine Installed Base Data ............................................................... 23 Table 2-15: Ice Machine Energy Consumption Summary .......................................... 24
Table 2-16: Refrigerated Packaged Beverage Vending Machine Energy
Consumption (2008) ........................................................................................................ 27 Table 3-1: Evaporator Coil Temperature Ranges by Application ............................. 31
Table 3-2: Vertical, Open, Medium Temperature – Baseline Display Case
Description ....................................................................................................................... 34
Table 3-3: Supermarket Refrigeration Energy Consumption .................................... 37 Table 3-4: Supermarket Display Case Thermal Load Breakdown (Btu/hr) ............. 38
Table 3-5: Average Unit Energy Consumption of Supermarket Display Cases ....... 38
Table 3-6: Energy Consumption Breakdown for Baseline Supermarket Display
Cases (Typical New) ........................................................................................................ 39
Table 3-7: Supermarket Compressor Energy Consumption1 ..................................... 40
Table 3-8: Supermarket Compressor Rack Primary Energy Use .............................. 40 Table 3-9: Supermarket Condenser Energy Consumption ........................................ 41 Table 3-10: Supermarket Walk-In Energy Consumption .......................................... 42 Table 3-11: Refrigerated Display Case Total Installed Cost ($2008) ......................... 43 Table 3-12: Compressor Rack Total Installed Cost ($2008) ....................................... 43
Table 3-13: Major Food Retail Chains ......................................................................... 46 Table 3-14: Characteristics of the Baseline Cooler and Freezer ................................ 50
Table 3-15: Walk-in Refrigeration Load Breakdown (Btu/h) .................................... 52 Table 3-16: Baseline Walk-in Heat Exchangers ........................................................... 52 Table 3-17: Merchandising Walk-in Cooler - Energy Consumption Breakdown .... 53 Table 3-18: Storage-only Walk-in Freezer - Energy Consumption Breakdown....... 54 Table 3-19: Walk-in Total Installed Cost ($2008) ........................................................ 55
Table 3-20: Compressor Description and Operating Temperatures (Baseline Prep
Table) ............................................................................................................................... 58 Table 3-21: Electrical Energy Consumption Breakdown (Baseline Prep Table) ..... 58
ix
Table 3-22: Prep Table Characteristics ........................................................................ 59
Table 3-23: Refrigerated Food Service Equipment Total Installed Costs ($2008) ... 59 Table 3-24: Baseline Refrigerated cabinet description – Reach-In Freezers ............ 61 Table 3-25: Refrigerated Cabinet Description – Reach-in refrigerators ................... 63
Table 3-26: Derivation of Typical Reach-in Freezer Unit Energy Consumption ..... 65
Table 3-27: Compressor Description and Operating Temperatures (Baseline Reach-
In Freezer) ....................................................................................................................... 65
Table 3-28: Electrical Energy Consumption Breakdown (Baseline Reach-In Freezer)
........................................................................................................................................... 66
Table 3-29: Thermal Load Breakdown (Reach-in Freezers) ...................................... 66
Table 3-30: Derivation of Typical Reach-in Refrigerator Unit Energy Consumption
........................................................................................................................................... 67 Table 3-31: Component Description (Baseline Reach-in Refrigerator) ..................... 68
Table 3-32: Electrical Energy Consumption Breakdown (Baseline Reach-in
Refrigerators) .................................................................................................................. 68
Table 3-33: Thermal Load Breakdown (Reach-in Refrigerators) ............................. 69 Table 3-34: Reach-In List Prices ................................................................................... 69
Table 3-35: Reach-In Total Installed Cost ($2008) ...................................................... 69 Table 3-36: Physical Characteristics of Baseline Beverage Merchandiser................ 72 Table 3-37: Baseline Beverage Merchandiser - Compressor Data ............................. 73
Table 3-38: Beverage Merchandiser Load Breakdown ............................................... 74
Table 3-39: Energy Usage Breakdown for Baseline Beverage Merchandiser (One-
Door)................................................................................................................................. 74 Table 3-40: Beverage Merchandiser List Prices ($2008) ............................................. 75 Table 3-41: Beverage Merchandiser Total Installed Cost ($2008) ............................. 75
Table 3-42: Unit Energy Consumption by Equipment Type ...................................... 79
Table 3-43: Derivation of Typical Ice Machine Unit Energy Consumption .................... 82 Table 3-44: Estimated Annual Energy Consumption by Component
1 ...................... 83
Table 3-45: Ice Machine Total Installed Cost ($2008) ................................................. 85
Table 3-46: Major Ice Machine Manufacturers and Approximate Market Share .. 86 Table 3-47: Machines by Major Manufacturer and Equipment Type ...................... 86
Table 3-48: Baseline Refrigerated Beverage Vending Machine (Fully-Cooled) –
Cabinet Description ........................................................................................................ 88
Table 3-49: Baseline Refrigerated Packaged Beverage Vending Machine (Zone-
Cooled) – Cabinet Description ....................................................................................... 89
Table 3-50: Baseline Refrigerated Packaged Beverage Vending Machine –
Refrigeration Component Description .......................................................................... 90
Table 3-51: Packaged Beverage Vending Machine Refrigeration Load Breakdown
........................................................................................................................................... 90
Table 3-52: Baseline Refrigerated Beverage Vending Machine (Fully-Cooled) –
Energy Consumption Breakdown ................................................................................. 91
Table 3-53: Baseline Refrigerated Beverage Vending Machine (Zone-Cooled) –
Energy Consumption Breakdown ................................................................................. 91 Table 3-54: Refrigerated Vending Machine Total Installed Cost ($2008)................. 92 Table 4-1: Electricity Price Scenarios ........................................................................... 94 Table 4-2: Currently Available Energy Saving Technologies .................................... 95

x
Table 4-3: Fan Motor Typical Efficiencies and Costs ($2008) ................................... 99
Table 4-4: Equipment Specifications and Duty Cycle Assumptions ........................ 116 Table 4-5: Technology Option Parameter Definitions .............................................. 118 Table 4-6: Economic Analysis for Medium-Temp Open Display Cases .................. 123
Table 4-7: Economic Analysis for Low-Temp Glass-Door Display Cases ............... 124 Table 4-8: Economic Analysis for Medium-Temp Glass-Door Display Cases ........ 124 Table 4-9: Economic Analysis of Compressor Racks ................................................ 125 Table 4-10: Economic Analysis of Supermarket Condensers ................................... 126 Table 4-11: Economic Analysis of Supermarket Control System ............................ 126
Table 4-12: Max Tech Supermarket Combination .................................................... 127 Table 4-13: Economic Analysis for Walk-In Coolers ................................................ 129 Table 4-14: Economic Analysis for Walk-In Freezers ............................................... 130 Table 4-15: National Energy Savings Potential for Non-Supermarket Walk-ins ... 131
Table 4-16: National Energy Savings Potential for Supermarket Walk-ins ........... 131 Table 4-17: Economic Analysis for Refrigerated Food Service Equipment ............ 134
Table 4-18: National Energy Savings Potential for Food Service Equipment ........ 134 Table 4-19: Economic Analysis for Reach-In Freezers ............................................. 135
Table 4-20: Economic Analysis for Reach-In Refrigerators ..................................... 136 Table 4-21: National Energy Savings Potential for Reach-ins ................................. 137 Table 4-22: Economic Analysis for Beverage Merchandisers .................................. 138
Table 4-23: National Energy Savings Potential for Beverage Merchandisers ........ 139 Table 4-24: Economic Analysis for Ice Machines ...................................................... 140
Table 4-25: National Energy Savings Potential for Ice Machines ............................ 141
Table 4-26: Economic Analysis for Refrigerated Vending Machines (Fully-Cooled)
......................................................................................................................................... 142
Table 4-27 Economic Analysis for Refrigerated Vending Machines (Zone-Cooled)
......................................................................................................................................... 143
Table 4-28: National Energy Savings Potential for Refrigerated Vending Machines
......................................................................................................................................... 144
Table 5-1: Advanced Technology Options and Tools for Commercial Refrigeration
......................................................................................................................................... 145
Table 6-1: Schedule of Energy-Conservation Standards and Voluntary Efficiency
Programs ........................................................................................................................ 167
Table 6-2: Standards for Reach-in Cabinets – EPACT 2005 ................................... 169
Table 6-3: Standards for Automatic Commercial Ice Machines - EPACT 2005 and
State of California ......................................................................................................... 169
Table 6-4: Federal Energy Conservation Standards for Commercial Refrigeration
Equipment that Apply as of January 1, 2012) ............................................................ 171
Table 6-5: State Energy Conservation Standards for Commercial Refrigerators and
Freezers .......................................................................................................................... 173
Table 6-6 California Energy Conservation Standards for Packaged Beverage
Vending Machines ......................................................................................................... 174 Table 6-7: ENERGY STAR and FEMP Efficiency Criteria for Reach-ins
1 ........... 175
Table 6-8: ENERGY STAR Efficiency Requirements (Air-Cooled Cubers Only) 176
Table 6-9 ENERGY STAR and FEMP* Criteria for Refrigerated Beverage Vending
Machines ........................................................................................................................ 176

xi
Table 6-10: CEE Efficiency Specifications for Reach-Ins ......................................... 177
Table 6-11 CEE Tier Requirements (Air-Cooled Cubers) ........................................ 178 Table 6-12 CEE Tier Requirements (Water-Cooled Cubers)................................... 179 Table 6-13: FEMP Efficiency Recommendations for Ice Machines ........................ 180
Table 7-1: Key Technology Options for Technology Validation and Market
Introduction ................................................................................................................... 184
Table A-0-1: Distribution Channel Shares for New and Replacement Construction
......................................................................................................................................... 198 Table A-0-2: Producer Price Index for CRE .............................................................. 199
xii
List of Abbreviations
ADL Arthur D. Little, Inc
AHRI Air-conditioning and Refrigeration Institute
AMR Active magnetic regenerator
ASHRAE American Society of Heating, Refrigerating, and Air-Conditioning
Engineers
BF Ballast factor
BT U.S. Department of Energy, Office of Energy Efficiency and
Renewable Energy, Building Technologies Program
Btu British thermal unit
CBECS Commercial Buildings Energy Consumption Survey
CEC California Energy Commission
CEE Consortium for Energy Efficiency
CFM Cubic feet per minute
COP Coefficient of performance
CRE Commercial refrigeration equipment
DOE U.S. Department of Energy
ECM Electronically commutated permanent magnet
EER Energy efficiency ratio
EERE U.S. Department of Energy, Office of Energy Efficiency and
Renewable Energy
EEV Electronic expansion valves
EHD Electro-hydrodynamic
EIA U.S. Department of Energy, Energy Information Administration
EISA Energy Independence and Security Act of 2007
EPACT Energy Policy Act of 2005
FEMP Federal Energy Management Program
GWP Global warming potential
HFC Hydrofluorocarbon
HID High intensity discharge
HP Horse power
HVAC Heating, ventilation, and air-conditioning
IMH Ice-making head
kWh Kilowatt-hour
LED Light-emitting diode
LPW Lumens per watt
MCE Magnetocaloric effect
MMBtu Million British thermal units
MR Magnetic refrigeration
NAFEM North American Food Equipment Manufacturers
NCI Navigant Consulting, Inc
OEM Original equipment manufacturer
PBP Payback period
PSC Permanent split capacitor

xiii
Quad Quadrillion (1015
) British thermal units
RCU Remote condensing unit
R&D Research and development
R, D & D Research, Development, and Demonstration
RTTC Southern California Edison Refrigeration and Thermal Test Center
SCU Self-contained unit
SEER Seasonal energy efficiency rating
SMMA Motor and Motion Association
SPM Shaded pole motor
TA Thermoacoustic
TBtu Trillion (1012
) British thermal units
TDA Total display area
TE Thermo-electric
TWh Terawatt-hour (1019
kWh)
TXV Thermostatic expansion valve
UEC Unit energy consumption
VIP Vacuum-insulated pane

xiv
Executive Summary
This study documents the energy consumption of commercial refrigeration equipment (CRE) in
the U.S. and evaluates the energy savings potential of various technologies and energy efficiency
measures that could be applied to such equipment. The equipment and systems considered in
this analysis include all major commercial refrigeration equipment categories, specifically:
Supermarket refrigeration systems, including:
Display cases and walk-in coolers/freezers
Machine rooms (with compressor racks),
Condensing units
Interconnecting piping
Controls
Self-contained food service equipment (preparation tables, buffet tables, etc.),
Self-contained beverage merchandisers,
Self-contained reach-in refrigerators and freezers,
Self-contained ice machines,
Self-contained refrigerated vending machines,
Walk-in coolers and freezers having dedicated refrigeration systems (i.e., those not
cooled by supermarket refrigeration systems).
This study does not include equipment types that do not consume substantial amounts of energy
on a national basis, such as:
Refrigerated water coolers (drinking-water fountains and bubblers)
Self-contained merchandisers other than beverage merchandisers (such as merchandisers
for bagged ice and ice cream).
Further, while they may consume significant amounts of energy, refrigeration systems used in
food distribution warehouses are normally considered industrial refrigeration and were therefore
beyond the scope of this study.
Energy Consumption
Estimates of commercial refrigeration energy consumption have varied significantly in recent
years, ranging from approximately 0.73 to 1.10 quadrillion Btu (quad)1 of primary energy
consumption2, representing 4.1 to 6.3% of the total primary energy used in commercial buildings
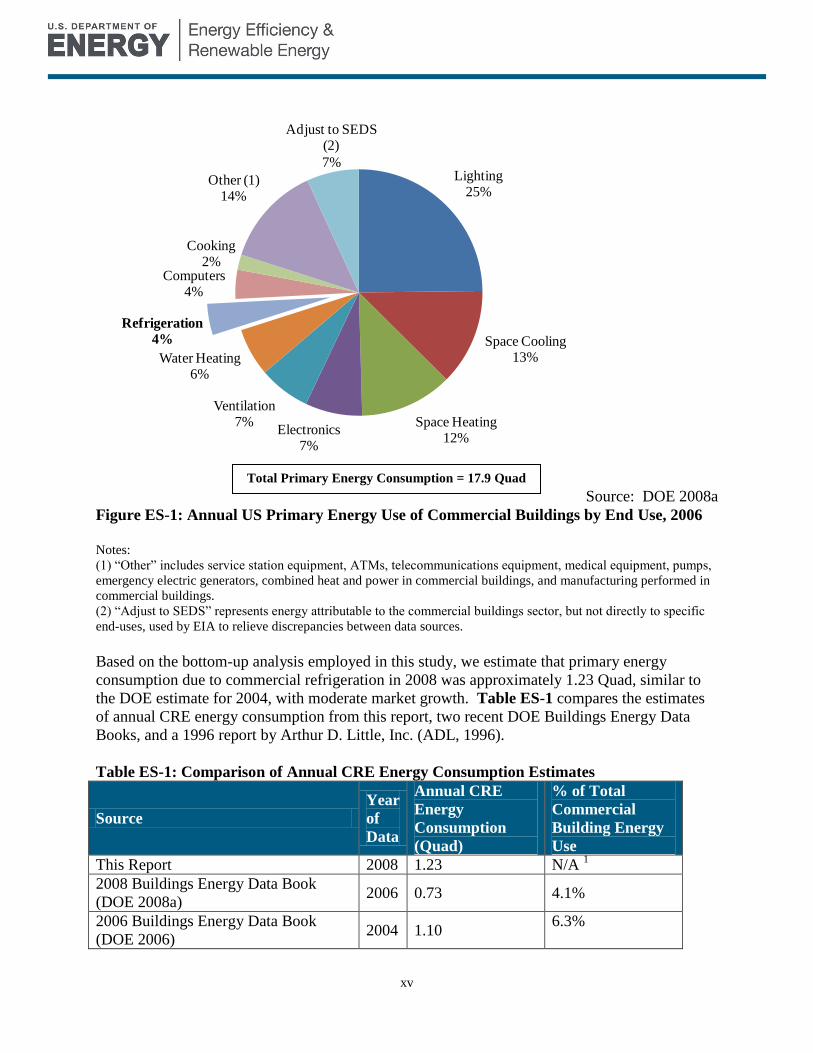
(DOE 2006, DOE 2008a). Figure ES-1 shows the 2006 annual primary energy consumption in
commercial buildings by end use according to the 2006 Buildings Energy Data Book (DOE
2008a), indicating that commercial refrigeration equipment accounts for about 4% of total
commercial building energy consumption. The 2006 data is the most recent information
published by the DOE.
1 A quad is a unit of energy equal to one quadrillion (10
15) British thermal units.
2 Primary energy includes energy consumed in the generation, transmission, and distribution of electricity.
xv
Source: DOE 2008a
Figure ES-1: Annual US Primary Energy Use of Commercial Buildings by End Use, 2006
Notes:
(1) “Other” includes service station equipment, ATMs, telecommunications equipment, medical equipment, pumps,
emergency electric generators, combined heat and power in commercial buildings, and manufacturing performed in
commercial buildings.
(2) “Adjust to SEDS” represents energy attributable to the commercial buildings sector, but not directly to specific
end-uses, used by EIA to relieve discrepancies between data sources.
Based on the bottom-up analysis employed in this study, we estimate that primary energy
consumption due to commercial refrigeration in 2008 was approximately 1.23 Quad, similar to
the DOE estimate for 2004, with moderate market growth. Table ES-1 compares the estimates
of annual CRE energy consumption from this report, two recent DOE Buildings Energy Data
Books, and a 1996 report by Arthur D. Little, Inc. (ADL, 1996).
Table ES-1: Comparison of Annual CRE Energy Consumption Estimates
Source
Year
of
Data
Annual CRE
Energy
Consumption
(Quad)
% of Total
Commercial
Building Energy
Use
This Report 2008 1.23 N/A 1
2008 Buildings Energy Data Book
(DOE 2008a) 2006 0.73 4.1%
2006 Buildings Energy Data Book
(DOE 2006) 2004 1.10
6.3%
Lighting25%
Space Cooling13%
Space Heating12%
Electronics7%
Ventilation7%
Water Heating6%
Refrigeration
4%
Computers4%
Cooking2%
Other (1) 14%
Adjust to SEDS (2)
7%
Total Primary Energy Consumption = 17.9 Quad

xvi
ADL 1996 1996 0.99 7.0% 1 Data regarding commercial building energy usage in 2008 has not yet been published.
1.23 Quad would amount to 7.1 % of 2006 commercial building energy consumption.
Figure ES-2 shows an estimated breakdown of total CRE energy consumption by equipment
segment. Compressor racks, display cases, condensers, and supermarket walk-ins, which
together represent supermarket refrigeration systems, use over 50 percent of the total energy used
by commercial refrigeration. Walk-in coolers and freezers (other than supermarket walk-ins),
which are typically used for food storage in food service applications, are the next largest
energy-consuming category at 12 percent.
Figure ES-2: Annual Primary Energy Usage of Commercial Refrigeration by Equipment
Type (2008)
Energy-Savings Opportunities using Commercially Available Technologies
Results of this study suggest that approximately 0.12 quad/yr could be saved if the installed base
were simply replaced by typical new equipment. An additional 0.41 quad in annual CRE energy
use could be saved by incorporating technologies and components that are currently
commercially available but not widely implemented,3 as shown in Figure ES-3. The
technologies and components considered for this estimate could be implemented with simple
payback periods of 7 years or less. High efficiency fan motors and compressors are applicable to
many equipment types and are the most common improvements represented by this estimate.
Supermarket refrigeration systems account for most of the potential energy savings in the CRE
industry, followed by walk-ins and refrigerated vending machines.
3 These commercially available technologies are not necessarily available in current equipment packages.
Supermarket
Refrigeration
56%
Walk Ins
12%
Reach Ins
9%
Refrigerated
Vending
Machines
8%
Ice Machines
7%
Beverage
Merchandisers
4%
Food Service
Equipment
4%
Total = 1.23 Quad

xvii
Nearly all refrigeration energy savings in supermarkets and up to 80 percent in CRE with
dedicated refrigeration systems can be achieved using better controls, improved fan motors, high
efficiency compressors, high efficiency lighting, and advanced door technologies.
Figure ES-3: Annual Potential Primary Energy Savings from Commercially Available
Technologies
Energy Savings Opportunities Requiring Research, Development, and Demonstration
This study also identified technologies under development or investigation that are not yet
commercially available, but that have the potential for significant additional energy savings.
While technologies such as light-emitting diode (LED) lighting and high efficiency fan blades
have already begun to enter the market, they are not yet cost-competitive for commercial
refrigeration applications and require further cost-reduction to assure widespread adoption. A
range of higher risk technologies continue to be investigated by companies and universities, and
DOE could play a prominent role in supporting research, development and demonstration
(RD&D) for these technologies. Alternative refrigeration systems, such as thermo-electric,
thermo-acoustic, and magnetic refrigeration, theoretically have the potential to save up to 30
percent of system energy use, but significant breakthroughs in areas such as materials are needed
before they can compete economically with conventional vapor-compression refrigeration.
Vacuum panel insulation also has the potential to offer substantial system energy savings, once
cost and performance issues have been resolved.
Compressor
Racks
5%
Display Cases
17%
Supermarket
Condensers
2%
Supermarket
Controls
19%
Supermarket
Walk-ins
5%
Walk Ins
19%
Refrigerated
Vending
Machines
8%
Reach Ins
9%
Food Service
Equipment
7%
Ice Machines
5%
Beverage
Merchandisers
4%
Total Energy Savings = 0.41 Quad/year

xviii
Barriers
Significant barriers in the commercial refrigeration industry make the widespread
implementation of high efficiency options difficult. Equipment buyers are under pressure to keep
upfront cost low, reliability high, and refrigerated space maximized. In some segments such as
vending machines and beverage merchandisers, split incentives are a formidable barrier. The
equipment is often specified and provided for free to the customer by a bottler or vending
machine operator who does not pay the energy bill and thus has little incentive to specify high
efficiency equipment. In addition, across many segments, there is limited awareness of energy
savings potential, although it is growing with the rising cost of energy and the introduction of
ENERGY STAR qualified products.
For supermarket chains, energy costs are a substantial portion of operating costs, and they also
have access to engineering resources that enable them to evaluate new technologies.
Consequently, they are more likely than other CRE customer segments to adopt advanced, high
efficiency equipment.
Recommendations
The DOE Building Technologies Program has the opportunity to accelerate the development and
adoption of energy saving technologies in a number of ways, including the establishment of new
and revised energy efficiency standards, support of demonstration activities for emerging
technologies, and support of research and development for advanced technologies. Detailed
recommendations are included in section 8 of this report.
1
1 Introduction
The U.S. Department of Energy (DOE), Office of Energy Efficiency and Renewable
Energy (EERE), Building Technologies Program (BT) has sponsored this study of
commercial refrigeration equipment (CRE) to:
Provide an overview of CRE applications
Characterize equipment types
Assess the energy savings potential for CRE in the U.S.
Outline key barriers to widespread adoption of energy-savings technologies
Summarize the status of regulatory and voluntary efficiency programs
Recommend initiatives that might help increase energy savings based on currently
available technologies
Recommend opportunities for advanced energy saving technology research.
This report is modeled after the 1996 report, “Energy Savings Potential for Commercial
Refrigeration Equipment”, by Arthur D. Little, Inc. (ADL 1996). Relative to the 1996
report, this report:
Updates information
Examines more equipment types
Outlines long-term research and development opportunities.
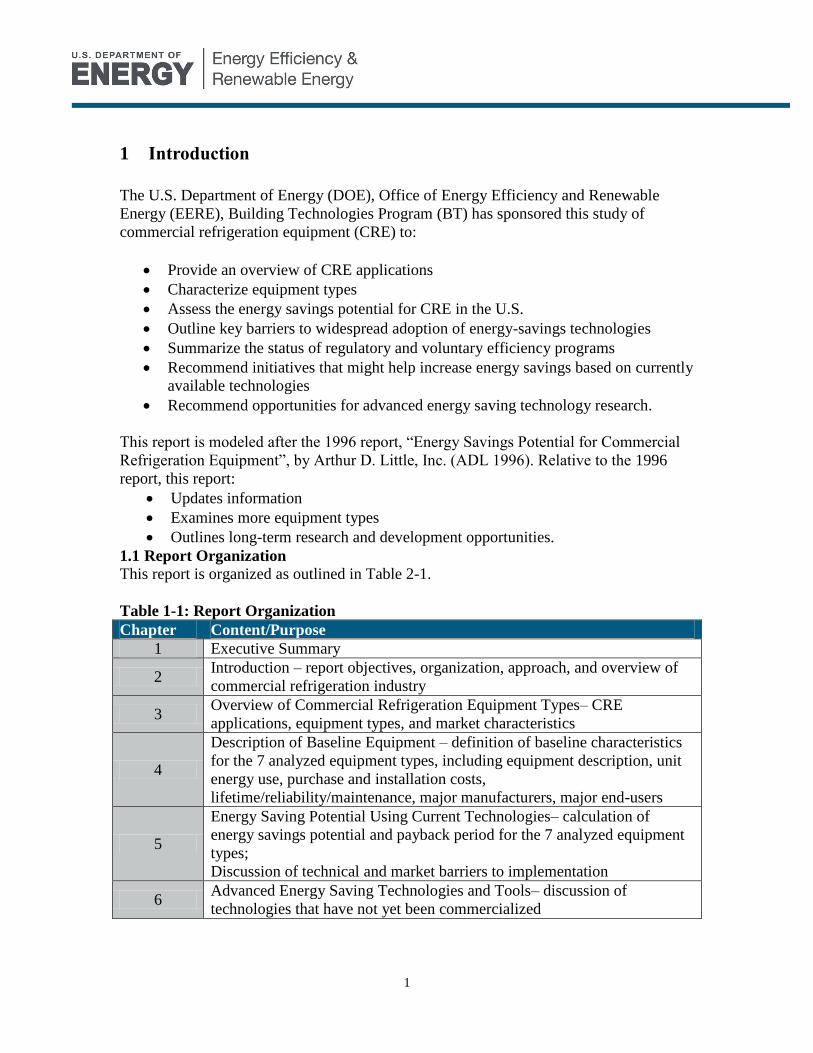
1.1 Report Organization
This report is organized as outlined in Table 2-1.
Table 1-1: Report Organization
Chapter Content/Purpose
1 Executive Summary
2 Introduction – report objectives, organization, approach, and overview of
commercial refrigeration industry
3 Overview of Commercial Refrigeration Equipment Types– CRE
applications, equipment types, and market characteristics
4
Description of Baseline Equipment – definition of baseline characteristics
for the 7 analyzed equipment types, including equipment description, unit
energy use, purchase and installation costs,
lifetime/reliability/maintenance, major manufacturers, major end-users
5
Energy Saving Potential Using Current Technologies– calculation of
energy savings potential and payback period for the 7 analyzed equipment
types;
Discussion of technical and market barriers to implementation
6 Advanced Energy Saving Technologies and Tools– discussion of
technologies that have not yet been commercialized
2
7
Impact of Regulatory and Voluntary Efficiency Programs – summary of
federal and state energy conservation standards as well as ENERGY STAR
and Consortium for Energy Efficiency criteria for the 7 analyzed
equipment types.
8 Recommendations
References ---
1.1 Approach
To understand the amount of energy savings possible using more efficient technology in
the commercial refrigeration equipment, we evaluated the seven most important types of
commercial refrigeration equipment:
Supermarket refrigeration systems
Walk-in coolers and freezers
Food preparation and service equipment
Reach-in refrigerators and freezers
Beverage Merchandisers
Ice machines
Refrigerated Vending Machines
For each of the seven equipment types, we defined the baseline equipment for making
energy-use comparisons. The baseline equipment represents the typical new piece of
equipment sold in 2008, which is often more efficient than typical equipment in the field.
By using this new equipment baseline, energy-savings estimates exclude the savings that
will be achieved with no DOE action, through normal equipment replacement cycles.
We gathered information for this study by:
Conducting interviews with major CRE manufacturers
Reviewing product information on manufacturer websites
Researching the status of relevant high efficiency technologies
To estimate energy savings potentials for each equipment type, we:
1. Estimated the unit energy use for a typical installed unit in 2008
2. Estimated the unit energy use for a typical new unit in 2008
3. Identified all currently commercialized technology options that would increase
efficiency
4. Estimated energy use reduction in terms of system energy use for each technology
option
5. Estimated end-user cost premium, for each technology option4
6. Calculated the simple payback period (PBP) for each technology option5
4 See 0 0for a discussion of inflation and markup factors used in order to update costs to $2008 and to
reflect the appropriate stage of the distribution chain. 5 Simple PBP (yrs) = Cost Premium ($) / [Energy Use Reduction (kWh/yr) x Electricity Price ($/kWh)]

3
7. Calculated the energy use reduction, cost premium, and simple PBP for a realistic
combination of technology options deemed to be the maximum energy savings
potential technologically feasible with currently commercialized technologies,
referred to as “max tech”.
Using the savings percentage that we calculated for each equipment type, we estimate the
national energy savings potential by applying it to the entire installed base. In our final
estimate of national energy savings, we include all currently commercialized
technologies that have a simple payback period of less than 7 years.
We characterized each advanced technology option in terms of three variables:
a rough unit energy savings potential (percent)
a classification of technical risk (high, medium, or low)
an estimated time to commercialization
We did not estimate costs for advanced technologies given the high level of uncertainty
involved.
1.2 Overview of Commercial Refrigeration Industry
Commercial buildings consume approximately 18% of the total primary energy used in
the U.S (Figure 1-1). Figure 1-2 shows the annual primary energy consumption in
commercial buildings by end use from the 2008 Buildings Energy Data Book (DOE
2008a). Commercial refrigeration, at 4 percent of the total, follows lighting, space
cooling and heating, electronics, ventilation, and water heating in annual primary energy
consumption. Estimates from 2 years earlier suggested that commercial refrigeration
accounted for over 6% of primary energy usage, so considerable uncertainty exists.
Total Consumption = 99.5 Quad
Source: DOE 2008a
Figure 1-1: U.S. Primary Energy Consumption by Sector, 2006
Industry
33%
Transportation
28%
Residential
Buildings
21%
Commercial
Buildings
18%
Buildings
39%
U.S. Primary Energy Consumption by Sector, 2006

4
Source: DOE 2008a
Figure 1-2: Annual US Primary Energy Use of Commercial Buildings by End Use,
2006 Notes:
(1) “Other” includes service station equipment, ATMs, telecommunications equipment, medical equipment,
pumps, emergency electric generators, combined heat and power in commercial buildings, and
manufacturing performed in commercial buildings.
(2) “Adjust to SEDS” represents energy attributable to the commercial buildings sector, but not directly to
specific end-uses, used by EIA to relieve discrepancies between data sources.
While the commercial refrigeration sector includes all types of refrigeration equipment
used in commercial buildings, most of this equipment is associated with food
preservation. Food preservation has become essential to our wellbeing as it gives us
affordable year-round access to a variety of fresh food and drink. Food preservation is
needed for both food sales, (primarily supermarkets, convenience stores), and food
service (primarily restaurants and cafeterias). Remote vending of refrigerated beverages
and food has also developed into an important application of commercial refrigeration. In
addition, ice machines and drinking-water coolers are widely used.
A number of different types of equipment are used in the various applications of
commercial refrigeration, depending on the intended purpose of the equipment. This
report considers the following seven equipment types to be representative of the
commercial refrigeration equipment:
Supermarket refrigeration systems (consisting of display cases and walk-in
refrigerators and freezers using remote compressor racks and condensers)
Walk-in coolers and freezers
Food preparation and service equipment
Lighting25%
Space Cooling13%
Space Heating12%
Electronics7%
Ventilation7%
Water Heating6%
Refrigeration
4%
Computers4%
Cooking2%
Other (1) 14%
Adjust to SEDS (2)
7%
Total = 17.9 Quad

5
Reach-in refrigerators and freezers
Beverage Merchandisers
Ice Machines (excluding ice dispensers)
Refrigerated Vending Machines
The following equipment types, even though they fall within the category of CRE, were
not evaluated in this report due to their small contribution to overall energy use:
Water coolers
Milk coolers and dispensers
Ice Dispensers
Cold-plate counter tops
Further, while they may consume significant amounts of energy, refrigeration systems
used in distribution warehouses were beyond the scope of this study.
As detailed in this report, we estimate that primary energy consumption in the
commercial refrigeration sector is approximately 1.23 Quadrillion Btu per year (Quad),
slightly over the Buildings Energy Data Book estimate for 2006. Table 1-2 compares the
estimates of annual CRE energy consumption from this report, two recent DOE Buildings
Energy Data Books, and the 1996 ADL report.
Table 1-2: Comparison of Annual CRE Energy Consumption Estimates
Source
Year
of
Data
Annual CRE
Energy
Consumption
(Quad)
% of Total
Commercial
Building Energy
Use
This Report 2008 1.23 N/A 1
2008 Buildings Energy Data Book
(DOE 2008a) 2006 0.73
4.1%
2006 Buildings Energy Data Book
(DOE 2006) 2004 1.10
6.3%
ADL 1996 1996 0.99 7.0% 1 Data regarding commercial building energy usage in 2008 has not yet been published.
1.23 quads would amount to 7.1 % of 2006 commercial building energy consumption
The breakdown by the seven analyzed equipment types is shown in Figure ES-2.
Supermarket refrigeration systems use 55 percent of the total energy used by commercial
refrigeration. Walk-in coolers and freezers, which are typically used for food storage in
the food service industry, are the next largest energy-consuming category with 13
percent.

6
Figure 1-3: Annual Primary Energy Usage of Commercial Refrigeration by
Equipment Type
Supermarket
Refrigeration
55%
Walk Ins
13%
Reach Ins
9%
Refrigerated
Vending
Machines
8%
Ice Machines
8%
Beverage
Merchandisers
4%
Food Service
Equipment
3%
Total Consumption = 1.23 Quad
7
2 Overview of Commercial Refrigeration Equipment Types
A description of the market for each equipment type, including the estimated installed
base and overall energy consumption, are provided below.
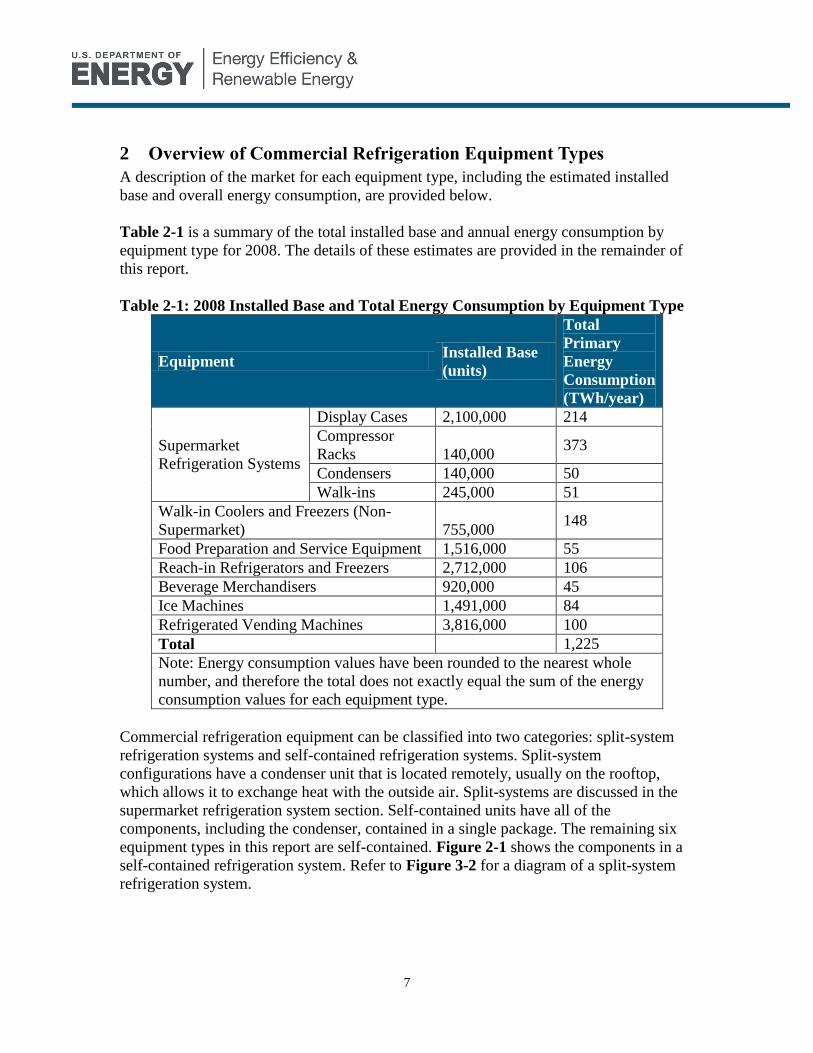
Table 2-1 is a summary of the total installed base and annual energy consumption by
equipment type for 2008. The details of these estimates are provided in the remainder of
this report.
Table 2-1: 2008 Installed Base and Total Energy Consumption by Equipment Type
Equipment Installed Base
(units)
Total
Primary
Energy
Consumption
(TWh/year)
Supermarket
Refrigeration Systems
Display Cases 2,100,000 214
Compressor
Racks 140,000 373
Condensers 140,000 50
Walk-ins 245,000 51
Walk-in Coolers and Freezers (Non-
Supermarket) 755,000 148
Food Preparation and Service Equipment 1,516,000 55
Reach-in Refrigerators and Freezers 2,712,000 106
Beverage Merchandisers 920,000 45
Ice Machines 1,491,000 84
Refrigerated Vending Machines 3,816,000 100
Total 1,225
Note: Energy consumption values have been rounded to the nearest whole
number, and therefore the total does not exactly equal the sum of the energy
consumption values for each equipment type.
Commercial refrigeration equipment can be classified into two categories: split-system
refrigeration systems and self-contained refrigeration systems. Split-system
configurations have a condenser unit that is located remotely, usually on the rooftop,
which allows it to exchange heat with the outside air. Split-systems are discussed in the
supermarket refrigeration system section. Self-contained units have all of the
components, including the condenser, contained in a single package. The remaining six
equipment types in this report are self-contained. Figure 2-1 shows the components in a
self-contained refrigeration system. Refer to Figure 3-2 for a diagram of a split-system
refrigeration system.

8
Figure 2-1: Self-Contained Refrigeration Circuit
2.1 Supermarket Refrigeration Systems
There are approximately 35,000 supermarkets in the United States (Progressive Grocer
2008). Food sales from supermarkets represent roughly $535 billion annually, or 56% of
the overall food sales market (Progressive Grocer 2008). Supermarkets are distinguished
from smaller grocery stores by having revenues exceeding two million dollars, according
to Progressive Grocer Magazine.
Table 2-2 shows the allocation of food sales and the number of stores for various store
types. In recent years, the trend for supermarkets has been towards smaller numbers of
larger stores. Convenience stores are full-line, self-service grocery stores which are open
long hours and offer a limited line of high-convenience items. Military convenience
stores tend to be larger than civilian stores, and are listed separately in the table.
Table 2-2: Number of Stores and Average Sales in the Grocery Industry as of 2007
Store Type Number of Stores
(1,000’s)
US Annual Sales
($ Billions)
Supermarket 35.0 535.4
Convenience 145.9 306.6
Grocery (<$2 million) 13.7 18.2
Wholesale Clubs 1.2 101.5
Military Convenience Stores 0.4 2.2
Total 196.2 963.9
Source: Progressive Grocer 2008
Supermarket complexity has increased in recent years, as supermarkets have increased
their sales in a variety of specialty areas such as deli and bakery. Many supermarkets sell
a variety of non-food products, such as personal hygiene, paper products, cleaning
CONDENSER EVAPORATOR
COMPRESSOR
SUCTION LINE
CAPILLARY TUBE
HEAT EXCHANGER
STRAINER-DRIER
9
products, flowers, etc. Supermarkets are also shifting into food service (i.e., prepared
meals), which represents one of the largest growing food service sectors.
To quantify supermarket refrigeration energy use, we consider the energy use of display
cases (which contain the refrigerated merchandise), compressor racks (which are the sets
of compressors that run the refrigeration system), condensers, and walk-ins.
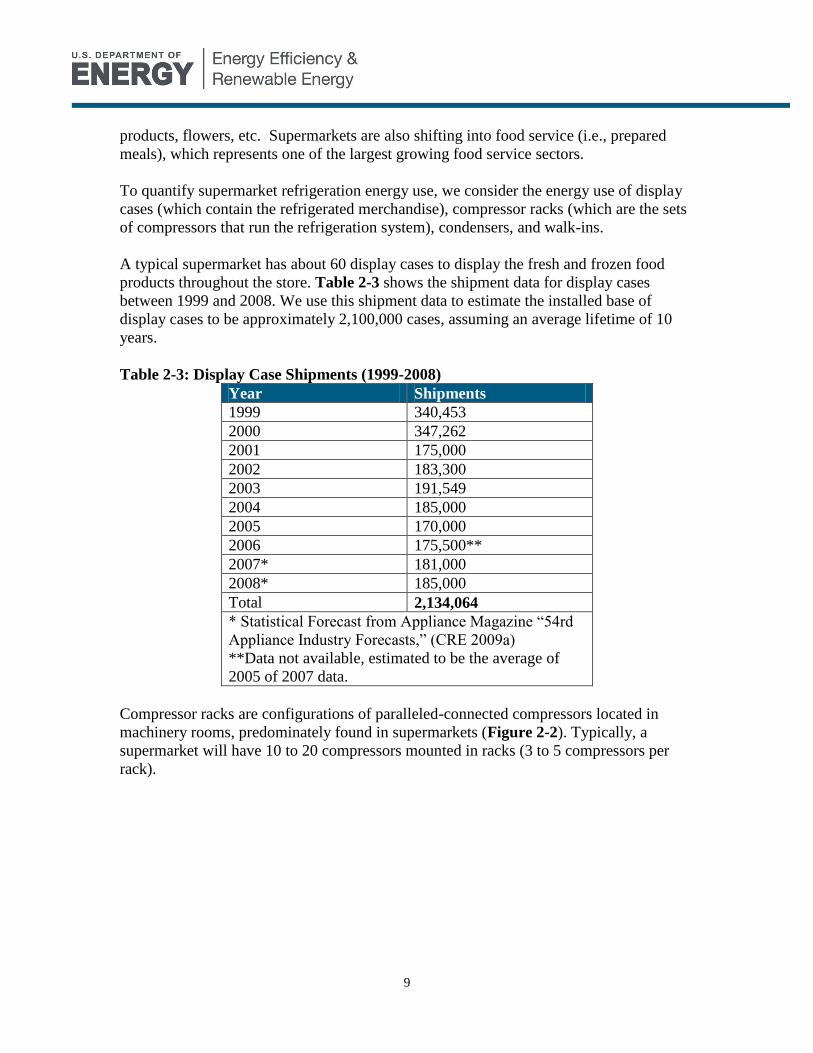
A typical supermarket has about 60 display cases to display the fresh and frozen food
products throughout the store. Table 2-3 shows the shipment data for display cases
between 1999 and 2008. We use this shipment data to estimate the installed base of
display cases to be approximately 2,100,000 cases, assuming an average lifetime of 10
years.
Table 2-3: Display Case Shipments (1999-2008)
Year Shipments
1999 340,453
2000 347,262
2001 175,000
2002 183,300
2003 191,549
2004 185,000
2005 170,000
2006 175,500**
2007* 181,000
2008* 185,000
Total 2,134,064
* Statistical Forecast from Appliance Magazine “54rd
Appliance Industry Forecasts,” (CRE 2009a)
**Data not available, estimated to be the average of
2005 of 2007 data.
Compressor racks are configurations of paralleled-connected compressors located in
machinery rooms, predominately found in supermarkets (Figure 2-2). Typically, a
supermarket will have 10 to 20 compressors mounted in racks (3 to 5 compressors per
rack).
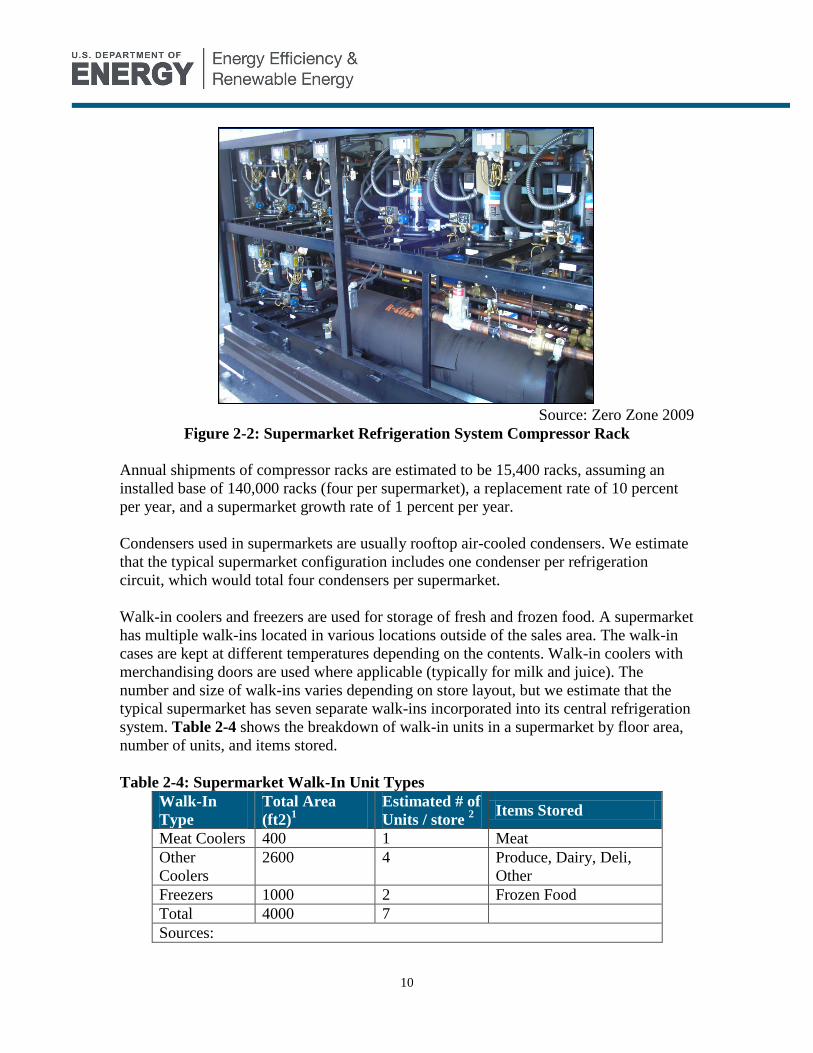
10
Source: Zero Zone 2009
Figure 2-2: Supermarket Refrigeration System Compressor Rack
Annual shipments of compressor racks are estimated to be 15,400 racks, assuming an
installed base of 140,000 racks (four per supermarket), a replacement rate of 10 percent
per year, and a supermarket growth rate of 1 percent per year.
Condensers used in supermarkets are usually rooftop air-cooled condensers. We estimate
that the typical supermarket configuration includes one condenser per refrigeration
circuit, which would total four condensers per supermarket.
Walk-in coolers and freezers are used for storage of fresh and frozen food. A supermarket
has multiple walk-ins located in various locations outside of the sales area. The walk-in
cases are kept at different temperatures depending on the contents. Walk-in coolers with
merchandising doors are used where applicable (typically for milk and juice). The
number and size of walk-ins varies depending on store layout, but we estimate that the
typical supermarket has seven separate walk-ins incorporated into its central refrigeration
system. Table 2-4 shows the breakdown of walk-in units in a supermarket by floor area,
number of units, and items stored.
Table 2-4: Supermarket Walk-In Unit Types
Walk-In
Type
Total Area
(ft2)1
Estimated # of
Units / store 2
Items Stored
Meat Coolers 400 1 Meat
Other
Coolers
2600 4 Produce, Dairy, Deli,
Other
Freezers 1000 2 Frozen Food
Total 4000 7
Sources:

11
1 ADL 1996
2 NCI Estimate
The following section discusses walk-ins with dedicated refrigeration systems, which is a
configuration generally found in non-supermarket applications.
2.2 Walk-in Coolers and Freezers
Walk-in coolers and freezers, also known as walk-ins, are large, insulated refrigerated
spaces with access doors large enough for people to enter. Walk-ins are used for food
storage and merchandising in the food service and food sales applications. Walk-ins
found in supermarkets are generally cooled by central supermarket refrigeration systems
and are discussed within the supermarket refrigeration system section. In the following
section, we discuss walk-ins with dedicated refrigeration systems.
There are two major classes of walk-ins: low refrigerated space temperature (-20 to -
10F) and medium refrigerated space temperature (10 to 35F). Although walk-ins can be
used in a wide variety of areas, they are primarily used in food service and food sales
(Freedonia 2004). Examples of non-food applications are blood and flower storage, but
these sectors account for a small proportion of walk-ins. A list of establishments that use
walk-ins includes:
Restaurants and Bars
Convenience Stores
Cafeterias
Florists
Research Laboratories
Assuming all walk-ins are used in commercial applications, there is an installed base of
1,000,000 walk-ins based on inventory estimates from major walk-in manufacturers. Of
this total installed base, roughly 245,000 are assumed to be part of supermarket
refrigeration systems (seven per supermarket), and the remaining 755,000 are assumed to
be installed in non-supermarket applications with dedicated refrigeration systems. Annual
walk-in sales are estimated to be 40,000 units per year (Caroll Coolers 2008, Freedonia
2004). The market value for sales in 2008 is estimated to be $800 million (Freedonia
2004). Figure 2-3 and Figure 2-4 show the estimated installed base broken out by
temperature level and end user category, respectively.

12
Freezers
310,000
Units
31%
Coolers
620,000
Units
62%
Combination
70,000 Units
7%
Sources: Major Manufacturers, ADL 1996
Figure 2-3: Walk-ins by Temperature Level (2008) – 1,000,000 units total
Other
390,000
Units
39%
Food Service
360,000
Units
36%
Food Sales
250,000
Units
5%
Sources: CBECS 2003, Major Manufacturers
Figure 2-4: Walk-ins by End Use Applications (2008) – 1,000,000 units total
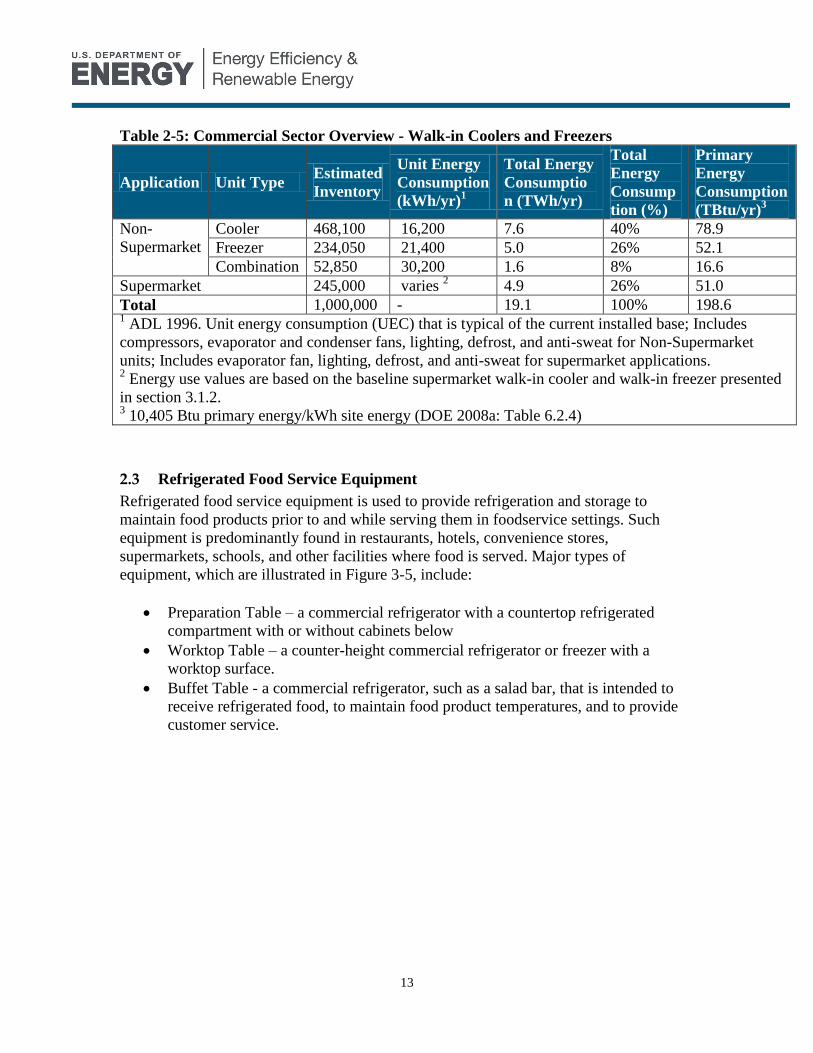
Based on discussions with manufacturers, walk-ins are estimated to consume
approximately 19.1 TWh annually, which represents approximately 199 trillion Btu
primary energy (see Table 3-3).
13
Table 2-5: Commercial Sector Overview - Walk-in Coolers and Freezers
Application Unit Type Estimated
Inventory
Unit Energy
Consumption
(kWh/yr)1
Total Energy
Consumptio
n (TWh/yr)
Total
Energy
Consump
tion (%)
Primary
Energy
Consumption
(TBtu/yr)3
Non-
Supermarket
Cooler 468,100 16,200 7.6 40% 78.9
Freezer 234,050 21,400 5.0 26% 52.1
Combination 52,850 30,200 1.6 8% 16.6
Supermarket 245,000 varies 2 4.9 26% 51.0
Total 1,000,000 - 19.1 100% 198.6 1 ADL 1996. Unit energy consumption (UEC) that is typical of the current installed base; Includes
compressors, evaporator and condenser fans, lighting, defrost, and anti-sweat for Non-Supermarket
units; Includes evaporator fan, lighting, defrost, and anti-sweat for supermarket applications. 2 Energy use values are based on the baseline supermarket walk-in cooler and walk-in freezer presented
in section 3.1.2. 3 10,405 Btu primary energy/kWh site energy (DOE 2008a: Table 6.2.4)
2.3 Refrigerated Food Service Equipment
Refrigerated food service equipment is used to provide refrigeration and storage to
maintain food products prior to and while serving them in foodservice settings. Such
equipment is predominantly found in restaurants, hotels, convenience stores,
supermarkets, schools, and other facilities where food is served. Major types of
equipment, which are illustrated in Figure 3-5, include:
Preparation Table – a commercial refrigerator with a countertop refrigerated
compartment with or without cabinets below
Worktop Table – a counter-height commercial refrigerator or freezer with a
worktop surface.
Buffet Table - a commercial refrigerator, such as a salad bar, that is intended to
receive refrigerated food, to maintain food product temperatures, and to provide
customer service.

14
a) Preparation Table b) Worktop Table c) Buffet Table
Sources: McCall Refrigeration (a, b), Electrolux Refrigeration (c)
Figure 2-5: Refrigerated Food Service Table Types
As shown in Table 3-6, the installed base of refrigerated food service equipment is
estimated to be approximately 1,516,000 units. The unit energy consumption is estimated
using the models available in the CEC appliance database (Table 2-7). The national
energy consumption of food service equipment is 5.27 TWh/yr, shown in Table 2-8.
Table 2-6: Food Service Equipment Installed Base Data
Building
Type
FSE /
Building1
# of Food
Service
Buildings,
20032
Installed
Base, 2003
Annual
FSE
Shipments1
Installed
Base, 2008
Foodservice 3 297,000 891,000 125,000 1,516,000
Sources: 1
NCI Estimate 2 CBECS 2003
Table 2-7: Food Service Equipment Unit Energy Consumption
Unit Type
Number of
Units Listed
in CEC
Database
% of Units
Listed in
CEC
Database
Average
Volume (ft3)
Average Unit
Energy
Consumption
(kWh/yr)1
Prep Table 219 62% 16 3,927
Buffet Table 44 13% 3.9 1,994
Worktop
Table 89 25% 13.5 1,857
Weighted Average UEC (Typical New): 3,162
Weighted Average UEC (Typical Installed): 3,478
Source: CEC 2008. 1 We assume that the CEC database represents the models available on the
market, and therefore the average value represents the energy use of a typical
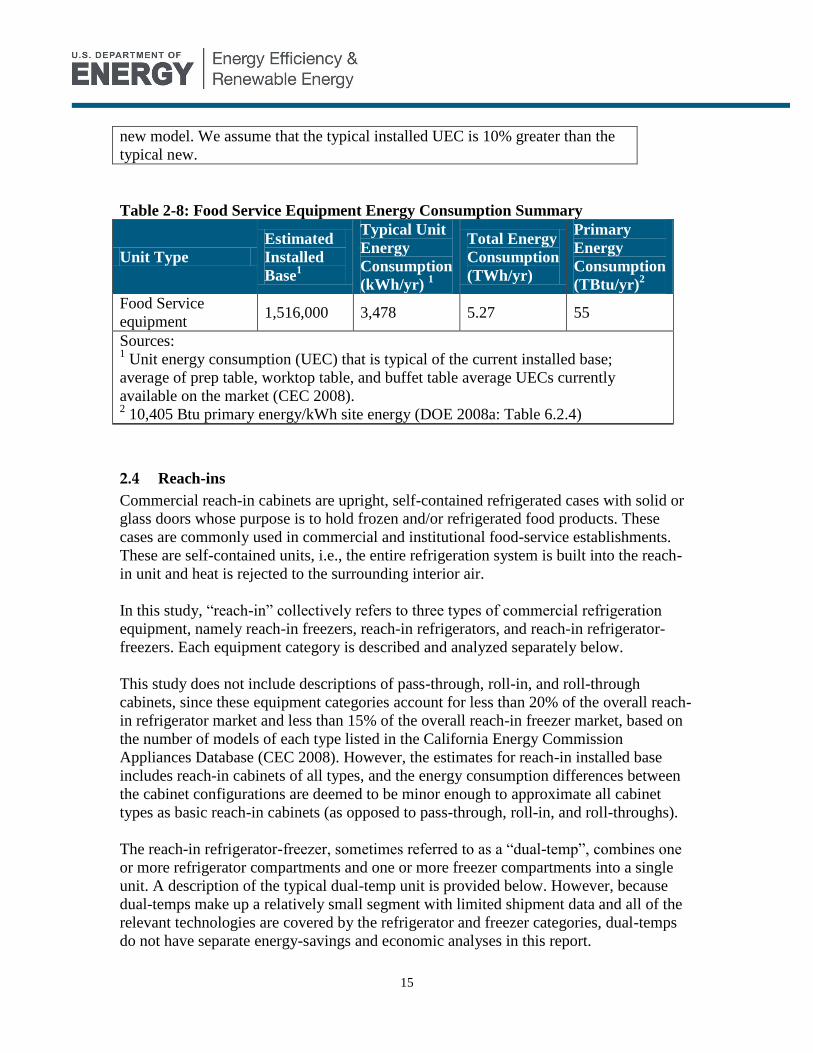
15
new model. We assume that the typical installed UEC is 10% greater than the
typical new.
Table 2-8: Food Service Equipment Energy Consumption Summary
Unit Type
Estimated
Installed
Base1
Typical Unit
Energy
Consumption
(kWh/yr) 1
Total Energy
Consumption
(TWh/yr)
Primary
Energy
Consumption
(TBtu/yr)2
Food Service
equipment 1,516,000 3,478 5.27 55
Sources: 1 Unit energy consumption (UEC) that is typical of the current installed base;
average of prep table, worktop table, and buffet table average UECs currently
available on the market (CEC 2008). 2 10,405 Btu primary energy/kWh site energy (DOE 2008a: Table 6.2.4)
2.4 Reach-ins
Commercial reach-in cabinets are upright, self-contained refrigerated cases with solid or
glass doors whose purpose is to hold frozen and/or refrigerated food products. These
cases are commonly used in commercial and institutional food-service establishments.
These are self-contained units, i.e., the entire refrigeration system is built into the reach-
in unit and heat is rejected to the surrounding interior air.
In this study, “reach-in” collectively refers to three types of commercial refrigeration
equipment, namely reach-in freezers, reach-in refrigerators, and reach-in refrigerator-
freezers. Each equipment category is described and analyzed separately below.
This study does not include descriptions of pass-through, roll-in, and roll-through
cabinets, since these equipment categories account for less than 20% of the overall reach-
in refrigerator market and less than 15% of the overall reach-in freezer market, based on
the number of models of each type listed in the California Energy Commission
Appliances Database (CEC 2008). However, the estimates for reach-in installed base
includes reach-in cabinets of all types, and the energy consumption differences between
the cabinet configurations are deemed to be minor enough to approximate all cabinet
types as basic reach-in cabinets (as opposed to pass-through, roll-in, and roll-throughs).
The reach-in refrigerator-freezer, sometimes referred to as a “dual-temp”, combines one
or more refrigerator compartments and one or more freezer compartments into a single
unit. A description of the typical dual-temp unit is provided below. However, because
dual-temps make up a relatively small segment with limited shipment data and all of the
relevant technologies are covered by the refrigerator and freezer categories, dual-temps
do not have separate energy-savings and economic analyses in this report.

16
Table 2-9 and Table 2-10 provide an overview of the reach-in market size for freezers
and refrigerators, respectively, based on commercial refrigeration by building type as
reported by the Commercial Building Energy Consumption Survey since 1995 (CBECS
1995, 1999, and 2003). The three most recent editions of CBECS were used to estimate
the 2008 installed bases for reach-in freezers and refrigerators, using a linear trend line,
as shown in Figure 2-6. Table 2-11 summarizes the annual energy consumption of the
total reach-in installed base.
Table 2-9: Reach-in Freezer Installed Base Data
Building
Type
RIF /
Buildin
g1
2003 1999 1995
Building
s w/
CRE
(1,000)2
Installed
Base
(1,000s)
Building
s w/
CRE
(1,000)3
Installed
Base
(1,000s)
Building
s w/
CRE
(1,000)4
Installed
Base
(1,000s)
Education 2 93 186 84 168 97 194
Food Sales 1 205 205 159 159 136 136
Food
Service 1 283 283 334 334 272 272
Health
Care 2 23 46 12 24 15 30
Lodging 1 42 42 30 30 36 36
Retail 3 98 294 97 291 101 304
Office 1 53 53 26 26 26 26
Total –
2003 797 1,109 742 1,032 683 998
Sources: 1
Estimated by NCI confirmed through communication with a major reach-in manufacturer
in May 2008. 2 CBECS 2003
3 CBECS 1999
4 CBECS 1995
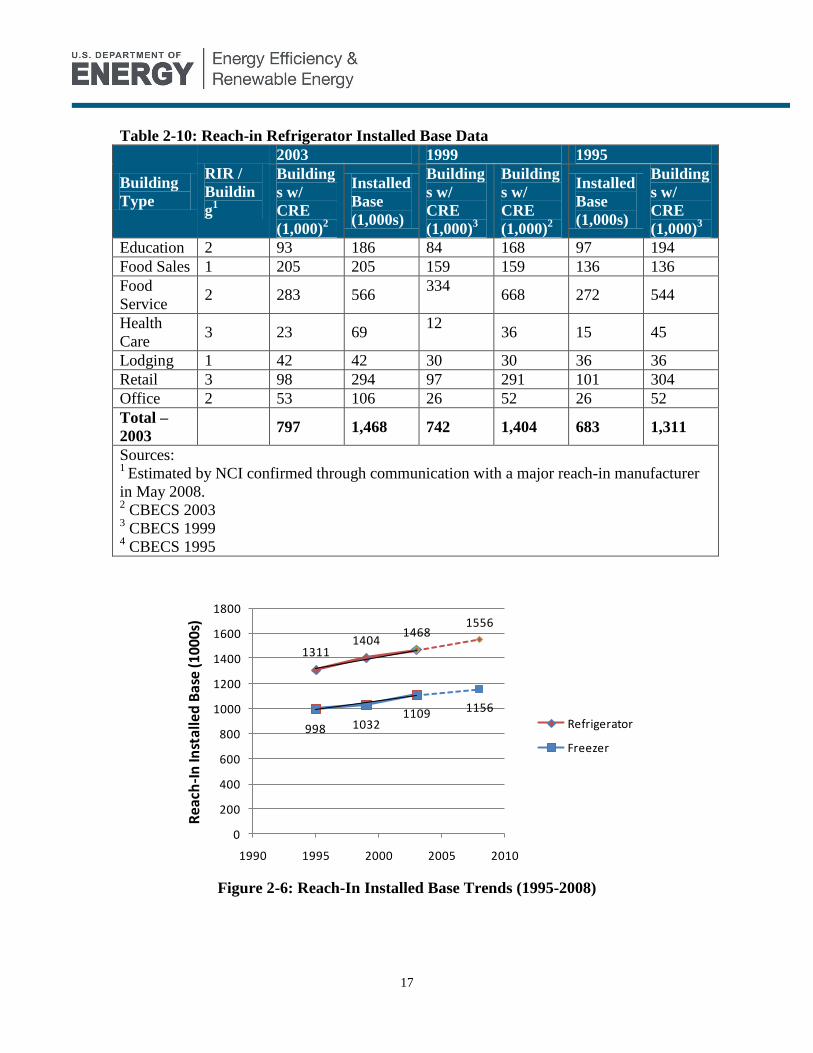
17
Table 2-10: Reach-in Refrigerator Installed Base Data
Building
Type
RIR /
Buildin
g1
2003 1999 1995
Building
s w/
CRE
(1,000)2
Installed
Base
(1,000s)
Building
s w/
CRE
(1,000)3
Building
s w/
CRE
(1,000)2
Installed
Base
(1,000s)
Building
s w/
CRE
(1,000)3
Education 2 93 186 84 168 97 194
Food Sales 1 205 205 159 159 136 136
Food
Service 2 283 566
334 668 272 544
Health
Care 3 23 69
12 36 15 45
Lodging 1 42 42 30 30 36 36
Retail 3 98 294 97 291 101 304
Office 2 53 106 26 52 26 52
Total –
2003 797 1,468 742 1,404 683 1,311
Sources: 1
Estimated by NCI confirmed through communication with a major reach-in manufacturer
in May 2008. 2 CBECS 2003
3 CBECS 1999
4 CBECS 1995
Figure 2-6: Reach-In Installed Base Trends (1995-2008)
13111404
1468
998 1032
1556
1109 1156
0
200
400
600
800
1000
1200
1400
1600
1800
1990 1995 2000 2005 2010
Re
ach
-In
Inst
alle
d B
ase
(100
0s)
Refrigerator
Freezer
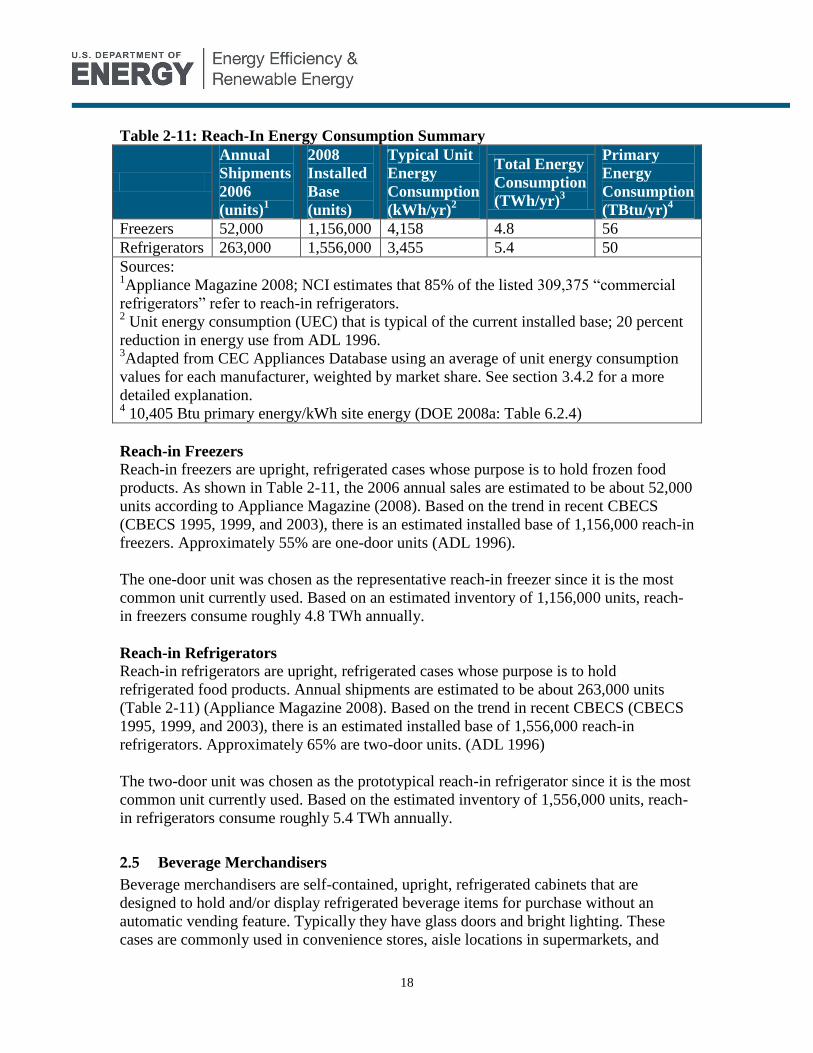
18
Table 2-11: Reach-In Energy Consumption Summary
Annual
Shipments
2006
(units)1
2008
Installed
Base
(units)
Typical Unit
Energy
Consumption
(kWh/yr)2
Total Energy
Consumption
(TWh/yr)3
Primary
Energy
Consumption
(TBtu/yr)4
Freezers 52,000 1,156,000 4,158 4.8 56
Refrigerators 263,000 1,556,000 3,455 5.4 50
Sources: 1Appliance Magazine 2008; NCI estimates that 85% of the listed 309,375 “commercial
refrigerators” refer to reach-in refrigerators. 2 Unit energy consumption (UEC) that is typical of the current installed base; 20 percent
reduction in energy use from ADL 1996. 3Adapted from CEC Appliances Database using an average of unit energy consumption
values for each manufacturer, weighted by market share. See section 3.4.2 for a more
detailed explanation. 4 10,405 Btu primary energy/kWh site energy (DOE 2008a: Table 6.2.4)
Reach-in Freezers
Reach-in freezers are upright, refrigerated cases whose purpose is to hold frozen food
products. As shown in Table 2-11, the 2006 annual sales are estimated to be about 52,000
units according to Appliance Magazine (2008). Based on the trend in recent CBECS
(CBECS 1995, 1999, and 2003), there is an estimated installed base of 1,156,000 reach-in
freezers. Approximately 55% are one-door units (ADL 1996).
The one-door unit was chosen as the representative reach-in freezer since it is the most
common unit currently used. Based on an estimated inventory of 1,156,000 units, reach-
in freezers consume roughly 4.8 TWh annually.
Reach-in Refrigerators
Reach-in refrigerators are upright, refrigerated cases whose purpose is to hold
refrigerated food products. Annual shipments are estimated to be about 263,000 units
(Table 2-11) (Appliance Magazine 2008). Based on the trend in recent CBECS (CBECS
1995, 1999, and 2003), there is an estimated installed base of 1,556,000 reach-in
refrigerators. Approximately 65% are two-door units. (ADL 1996)
The two-door unit was chosen as the prototypical reach-in refrigerator since it is the most
common unit currently used. Based on the estimated inventory of 1,556,000 units, reach-
in refrigerators consume roughly 5.4 TWh annually.
2.5 Beverage Merchandisers
Beverage merchandisers are self-contained, upright, refrigerated cabinets that are
designed to hold and/or display refrigerated beverage items for purchase without an
automatic vending feature. Typically they have glass doors and bright lighting. These
cases are commonly used in convenience stores, aisle locations in supermarkets, and

19
some retail stores and small foodservice establishments. Because the refrigeration system
is self-contained, the heat is rejected to the building interior, and their energy use is not
included in the supermarket refrigeration section above.
The majority of beverage merchandisers are owned by bottling and vending companies,
such as Coca-Cola and Pepsi. Beverage merchandisers are also sold directly to retailers.
Bottling and vending companies place the merchandisers in retail locations such as
convenience stores and supermarkets and are responsible for delivering the beverages to
the site, filling the merchandisers, and maintaining and servicing the merchandiser. The
retail operator is responsible for paying energy costs in both cases.
Supermarkets and convenience stores use centralized systems to refrigerate most of their
display cases. However, beverage merchandisers use a self-contained refrigeration
system and have the ability to be located in areas to maximize sales. They are easy to
install in locations away from central refrigeration equipment and easy to relocate. For
example, in supermarkets beverage merchandisers are put near locations such as the
checkout lane to lure customers into an “impulse buy”.
Beverage merchandiser annual sales are estimated to be approximately 80,000, or 10
percent of the installed base (NCI estimate). According to a leading manufacturer’s
estimate6, there is an installed base of between 750,000 and 1,000,000 beverage
merchandisers. Approximately 50% are one-door units. Figure 2-7 shows the beverage
merchandiser installed-base breakdown for the commercial sector.
Source: Adapted from ADL 1996
Figure 2-7: 2008 Estimated Installed Base of Beverage Merchandisers. Note: Total estimated 2008 inventory - 920,000 units; Assumes 15% growth since 1996.
6 From conversation between Daniel Pinault of NCI and leading beverage merchandiser manufacturer in
May 2008.
One-Door
460,000
50%Two-Door
414,000
45%
Three-Door+
46,000
5%
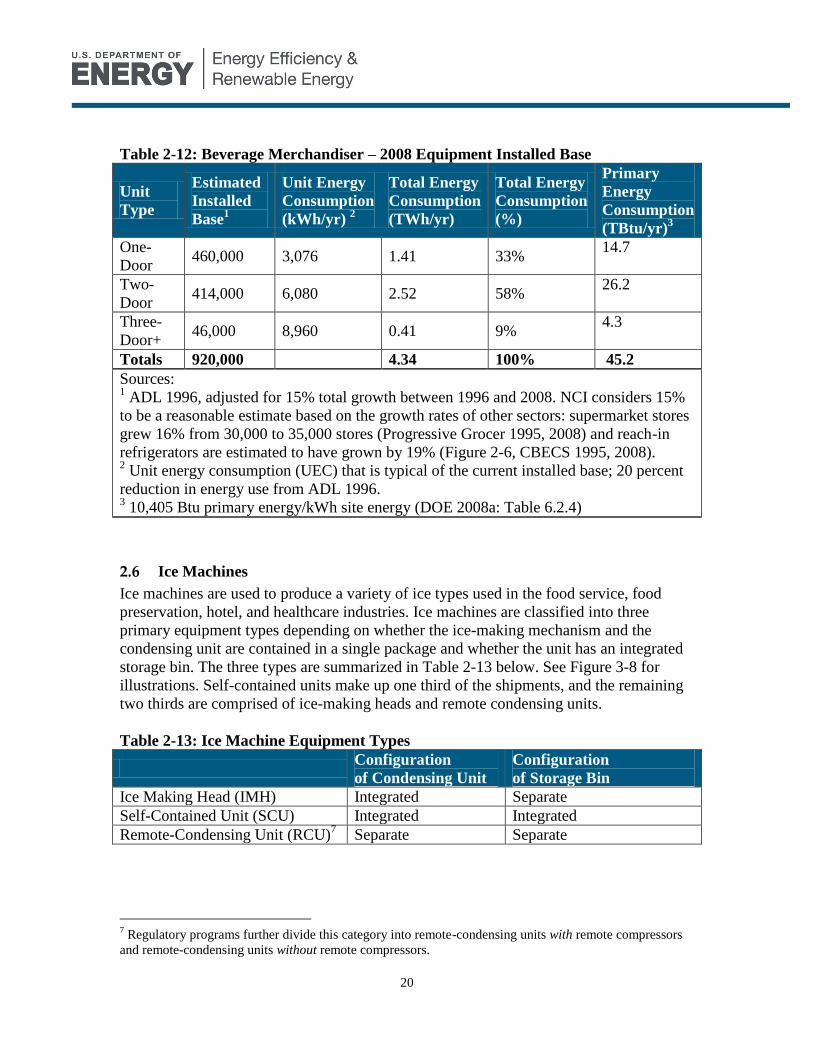
20
Table 2-12: Beverage Merchandiser – 2008 Equipment Installed Base
Unit
Type
Estimated
Installed
Base1
Unit Energy
Consumption
(kWh/yr) 2
Total Energy
Consumption
(TWh/yr)
Total Energy
Consumption
(%)
Primary
Energy
Consumption
(TBtu/yr)3
One-
Door 460,000 3,076 1.41 33%
14.7
Two-
Door 414,000 6,080 2.52 58%
26.2
Three-
Door+ 46,000 8,960 0.41 9%
4.3
Totals 920,000 4.34 100% 45.2
Sources: 1 ADL 1996, adjusted for 15% total growth between 1996 and 2008. NCI considers 15%
to be a reasonable estimate based on the growth rates of other sectors: supermarket stores
grew 16% from 30,000 to 35,000 stores (Progressive Grocer 1995, 2008) and reach-in
refrigerators are estimated to have grown by 19% (Figure 2-6, CBECS 1995, 2008). 2 Unit energy consumption (UEC) that is typical of the current installed base; 20 percent
reduction in energy use from ADL 1996. 3 10,405 Btu primary energy/kWh site energy (DOE 2008a: Table 6.2.4)
2.6 Ice Machines
Ice machines are used to produce a variety of ice types used in the food service, food
preservation, hotel, and healthcare industries. Ice machines are classified into three
primary equipment types depending on whether the ice-making mechanism and the
condensing unit are contained in a single package and whether the unit has an integrated
storage bin. The three types are summarized in Table 2-13 below. See Figure 3-8 for
illustrations. Self-contained units make up one third of the shipments, and the remaining
two thirds are comprised of ice-making heads and remote condensing units.
Table 2-13: Ice Machine Equipment Types
Configuration
of Condensing Unit
Configuration
of Storage Bin
Ice Making Head (IMH) Integrated Separate
Self-Contained Unit (SCU) Integrated Integrated
Remote-Condensing Unit (RCU)7 Separate Separate
7 Regulatory programs further divide this category into remote-condensing units with remote compressors
and remote-condensing units without remote compressors.
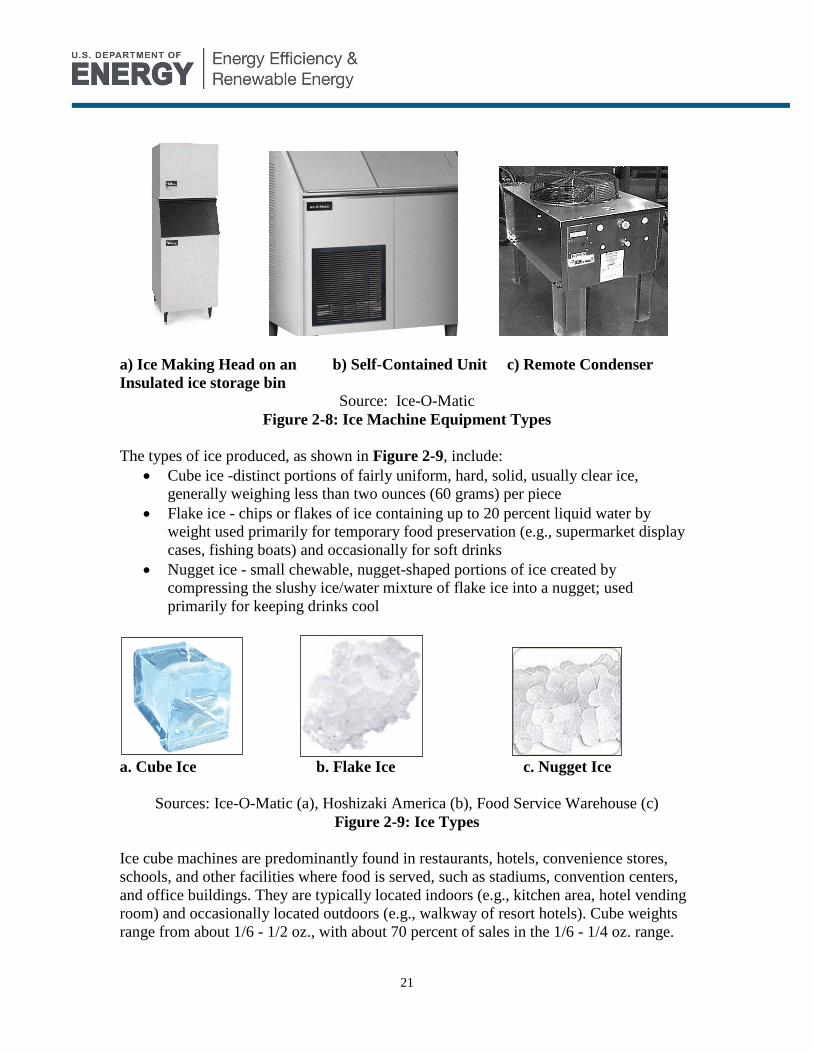
21
a) Ice Making Head on an b) Self-Contained Unit c) Remote Condenser
Insulated ice storage bin
Source: Ice-O-Matic
Figure 2-8: Ice Machine Equipment Types
The types of ice produced, as shown in Figure 2-9, include:
Cube ice -distinct portions of fairly uniform, hard, solid, usually clear ice,
generally weighing less than two ounces (60 grams) per piece
Flake ice - chips or flakes of ice containing up to 20 percent liquid water by
weight used primarily for temporary food preservation (e.g., supermarket display
cases, fishing boats) and occasionally for soft drinks
Nugget ice - small chewable, nugget-shaped portions of ice created by
compressing the slushy ice/water mixture of flake ice into a nugget; used
primarily for keeping drinks cool
a. Cube Ice b. Flake Ice c. Nugget Ice
Sources: Ice-O-Matic (a), Hoshizaki America (b), Food Service Warehouse (c)
Figure 2-9: Ice Types
Ice cube machines are predominantly found in restaurants, hotels, convenience stores,
schools, and other facilities where food is served, such as stadiums, convention centers,
and office buildings. They are typically located indoors (e.g., kitchen area, hotel vending
room) and occasionally located outdoors (e.g., walkway of resort hotels). Cube weights
range from about 1/6 - 1/2 oz., with about 70 percent of sales in the 1/6 - 1/4 oz. range.

22
Cube shapes include cubic, rectangular, crescent, lenticular, and pillow. The cube shape
is usually unique to a particular manufacturer, and thus is used to distinguish one
manufacturer from another. The maximum cube dimension is about 1 1/4", depending on
the cube shape. Desirable ice cube characteristics include minimal liquid content, smooth
ice to minimize carbonation loss in soft drinks, high displacement to minimize the drink
serving amount, slow melting to reduce drink dilution, and clarity.
Flake ice machines are used primarily for food preservation in the food sales industry.
They are often made for high ice-production capacity needs. Fish displays and salad bars
are common grocery applications for flake ice.
Nugget ice has become increasingly popular as drink ice, because it is more chewable
than traditional cubes. Each major ice machine manufacturer has now developed its own
brand of nugget ice, including Chewblet, Cubelet, Chunklet, and Pearl Ice (see Table
3-47). Between 2003 and 2006, sales of nugget ice machines rose 23% to 16,673 units
(WSJ 2008).
There are two distinct ice-making processes governing the ice-types produced:
The batch process, which involves alternate freezing and harvesting periods, is
used to make cube ice. Water flows over an evaporator where it freezes until
cubes are fully formed. The ice cubes are then harvested and moved to storage.
The ice may be in cube shape, or in a variation of a solid shape.
The continuous process is used to make flake and nugget ice, usually in a barrel-
shaped evaporator. Ice flakes are either a) formed on the inside of a stationary
evaporator and scraped off by a rotating auger, or b) formed on the outside of the
rotating evaporator and scraped off by a stationary scraper. Nugget machines
compress the ice flakes to form nuggets. (ARI 2007, ENERGY STAR 2008)
Machines are referred to by their nominal capacity, or harvest rate, defined as the weight
of ice produced per 24-hour period. Nominal capacities refer to operation in an ambient
temperature of 90°F, inlet water temperature of 70°F, and inlet water pressure of 30 ± 3
psig (ARI 2007). Commercial ice machine capacities range from 50 lbs/24 hrs to 2500
lbs/24 hrs.
Table 2-14 provides an overview of the ice machine market size for freezers and
refrigerators, respectively, based on commercial refrigeration by building type as reported
by the Commercial Building Energy Consumption Survey since 1995 (CBECS 1995,
1999, and 2003). The three most recent editions of CBECS were used to estimate the
2008 installed bases for ice machines, using a linear trend line, as shown in Figure 2-10.
Table 2-11 summarizes the annual energy consumption of the total ice machine installed
base.
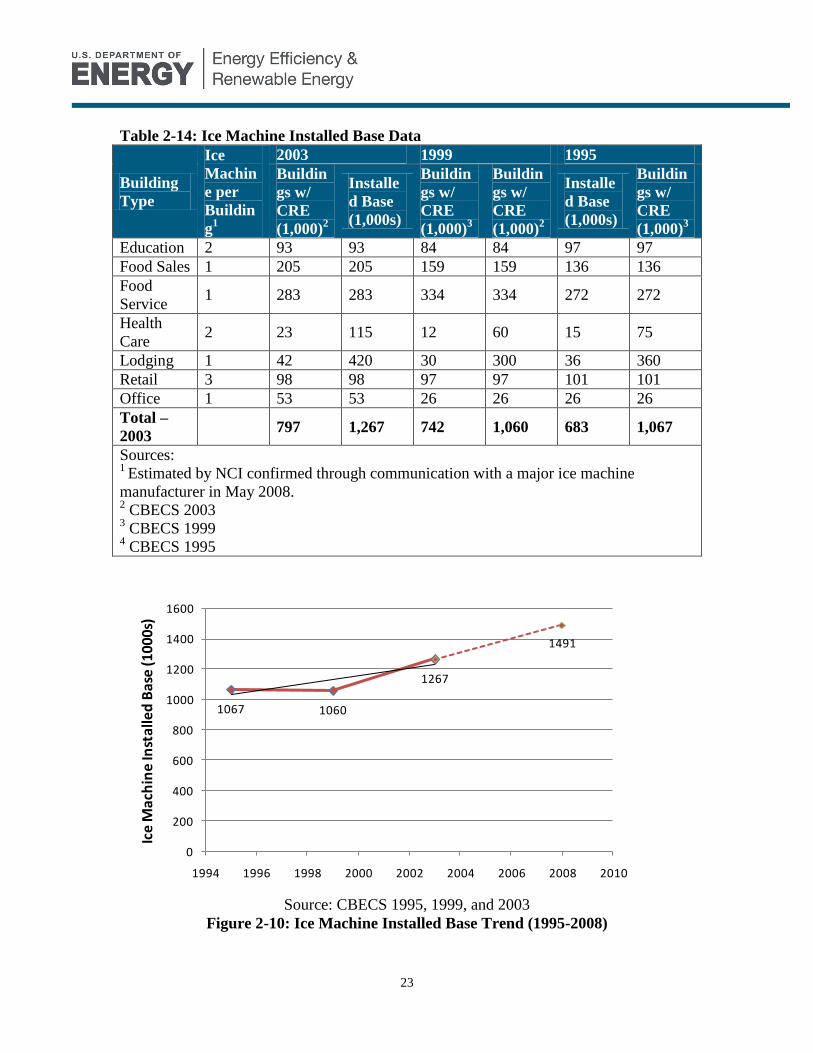
23
Table 2-14: Ice Machine Installed Base Data
Building
Type
Ice
Machin
e per
Buildin
g1
2003 1999 1995
Buildin
gs w/
CRE
(1,000)2
Installe
d Base
(1,000s)
Buildin
gs w/
CRE
(1,000)3
Buildin
gs w/
CRE
(1,000)2
Installe
d Base
(1,000s)
Buildin
gs w/
CRE
(1,000)3
Education 2 93 93 84 84 97 97
Food Sales 1 205 205 159 159 136 136
Food
Service 1 283 283 334 334 272 272
Health
Care 2 23 115 12 60 15 75
Lodging 1 42 420 30 300 36 360
Retail 3 98 98 97 97 101 101
Office 1 53 53 26 26 26 26
Total –
2003 797 1,267 742 1,060 683 1,067
Sources: 1
Estimated by NCI confirmed through communication with a major ice machine
manufacturer in May 2008. 2 CBECS 2003
3 CBECS 1999
4 CBECS 1995
Source: CBECS 1995, 1999, and 2003
Figure 2-10: Ice Machine Installed Base Trend (1995-2008)
1067 1060
1267
1491
0
200
400
600
800
1000
1200
1400
1600
1994 1996 1998 2000 2002 2004 2006 2008 2010
Ice
Mac
hin
e In
stal
led
Ba
se (1
000s
)

24
Table 2-15: Ice Machine Energy Consumption Summary
Annual
Shipments
2006
(units)1
2008
Installed
Base
(units)
Unit Energy
Consumption
(kWh/yr)2
Total Energy
Consumption
(TWh/yr)3
Primary
Energy
Consumption
(TBtu/yr)4
Ice
Machines 197,000 1,491,000
5,429 8.1
84.2
Sources: 1
Appliance Magazine 2007 2 Unit energy consumption (UEC) that is typical of the current installed base; Assumed to
have 20 percent higher energy use than the typical new ice machine on the market in
2008 (5250 kWh/yr). See section 3.6.2 for a more detailed explanation. 3Assumes 50% system duty cycle per year, which calculates to 5270 kWh/year per unit.
4 10,405 Btu primary energy/kWh site energy (DOE 2008a: Table 6.2.4)
Total shipments of commercial ice machines in 2006 were approximately 197,000 units.
Annual ice machine shipments have averaged 191,000 units over the period between
1998 and 2006, according to Appliance Magazine (2007). Figure 2-11 summarizes the
shipments by equipment type.
Source: DoC 2007
Figure 2-11: Commercial Ice Machine Shipments in 2006 by Product Type Note: Self-contained cube machines with a capacity less than 200 lbs/24 hours have been excluded from
the graph above, because they are predominantly sold in the residential market. Total Shipments amounted
to 194,637 units, according to the Department of Commerce. Appliance Magazine reports total shipments
to be 197,880 units. Assume nugget machines are included in the flaker segment and the IMH/RC category
includes all three types.
Commercial Ice Machine Shipments in 2006
by Product Type
All Ice-Making
Head & Remote-
Condensing Units
64%
Self-Contained
Flakers
10%
Self-Contained
Cubers
(> 200 lb)
26%
Total = 197,000 units

25
2.7 Refrigerated Vending Machines
Refrigerated vending machines are upright, refrigerated cases whose purpose is to hold
cold beverages and/or food products and vend them in exchange for currency or tokens.
The most common locations are: offices and office complexes; public locations; plants
and factories; hospitals and nursing homes; colleges and universities; primary and
secondary schools; government and military buildings (Vending Times 2008a). The
refrigerated vending machine is self-contained, i.e., the entire refrigeration system is built
into the machine and heat is rejected to the surrounding air.
There is an estimated installed base of about 3.8 million refrigerated vending machines.
Refrigerated packaged beverage vending machines account for almost 90% of the
installed base. The packaged beverage vending machine was chosen for analysis in this
report since it is the most common unit. There are approximately 342,000 packaged
beverage vending machines shipped per year (DOE 2008b). It is expected that its energy
consumption characteristics will be similar to those of other types of refrigerated vending
machines. Figure 2-12 shows the refrigerated vending machine inventory breakdown for
the commercial sector.
Source: Vending Times 2008a
Figure 2-12: Refrigerated Vending Machines – 2007 Equipment Inventory
About 70% of all beverage vending machines are purchased directly from the
manufacturer by bottling companies (i.e., Coca-Cola, Pepsi, etc.) (Automatic
Merchandiser 2007). Some of these units are supplied to independent vending operators
on consignment while the remaining units are owned and operated by the bottlers
themselves (Figure 2-13). The other 30% of beverage vending machines are purchased by
Packaged Beverage,
88%
Cup Beverage, 2%
Milk, 2%
Ice Cream, 4% Food, 4%
Total Estimated 2007 Installed Base: 3,816,000 Units
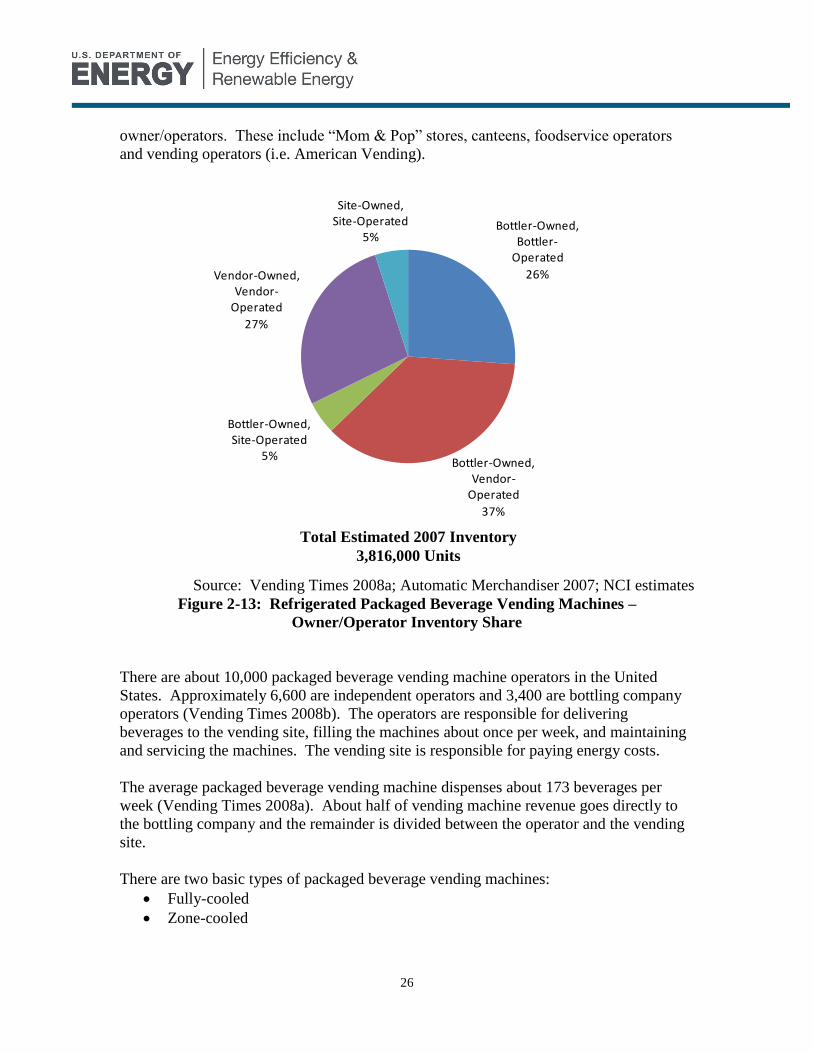
26
owner/operators. These include “Mom & Pop” stores, canteens, foodservice operators
and vending operators (i.e. American Vending).
Source: Vending Times 2008a; Automatic Merchandiser 2007; NCI estimates
Figure 2-13: Refrigerated Packaged Beverage Vending Machines –
Owner/Operator Inventory Share
There are about 10,000 packaged beverage vending machine operators in the United
States. Approximately 6,600 are independent operators and 3,400 are bottling company
operators (Vending Times 2008b). The operators are responsible for delivering
beverages to the vending site, filling the machines about once per week, and maintaining
and servicing the machines. The vending site is responsible for paying energy costs.
The average packaged beverage vending machine dispenses about 173 beverages per
week (Vending Times 2008a). About half of vending machine revenue goes directly to
the bottling company and the remainder is divided between the operator and the vending
site.
There are two basic types of packaged beverage vending machines:
Fully-cooled
Zone-cooled
Bottler-Owned, Bottler-
Operated
26%
Bottler-Owned,Vendor-
Operated
37%
Bottler-Owned, Site-Operated
5%
Vendor-Owned, Vendor-
Operated
27%
Site-Owned, Site-Operated
5%
Total Estimated 2007 Inventory
3,816,000 Units
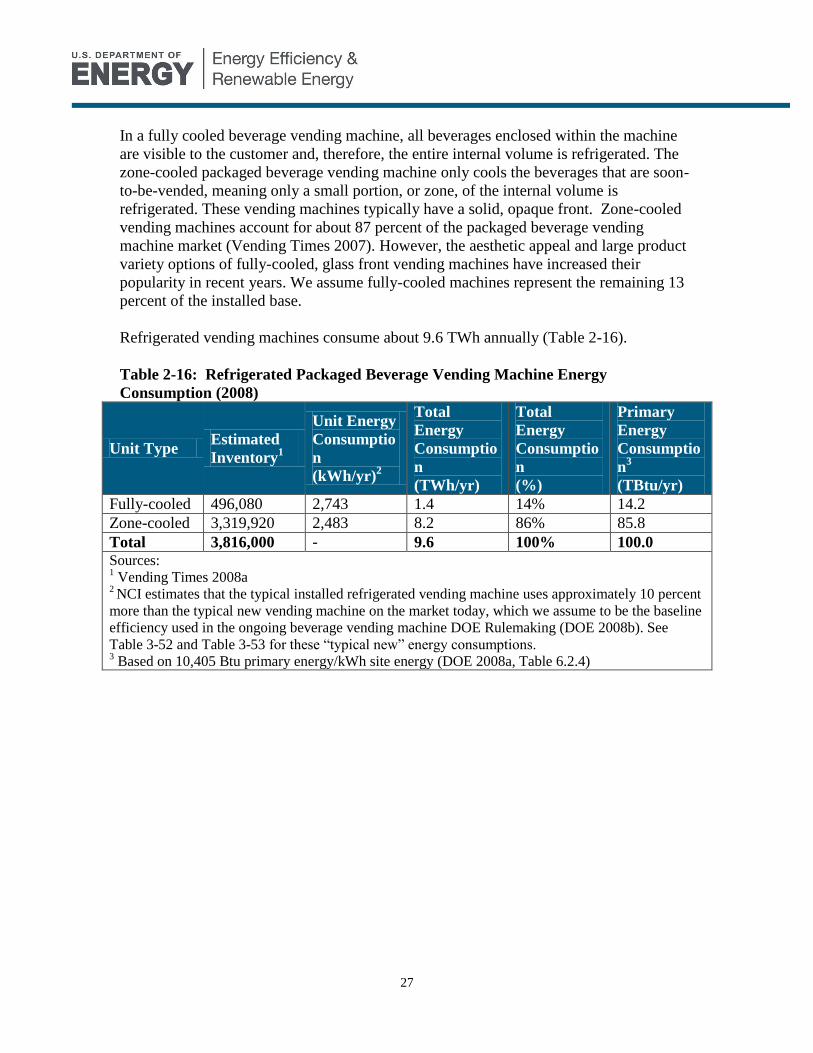
27
In a fully cooled beverage vending machine, all beverages enclosed within the machine
are visible to the customer and, therefore, the entire internal volume is refrigerated. The
zone-cooled packaged beverage vending machine only cools the beverages that are soon-
to-be-vended, meaning only a small portion, or zone, of the internal volume is
refrigerated. These vending machines typically have a solid, opaque front. Zone-cooled
vending machines account for about 87 percent of the packaged beverage vending
machine market (Vending Times 2007). However, the aesthetic appeal and large product
variety options of fully-cooled, glass front vending machines have increased their
popularity in recent years. We assume fully-cooled machines represent the remaining 13
percent of the installed base.
Refrigerated vending machines consume about 9.6 TWh annually (Table 2-16).
Table 2-16: Refrigerated Packaged Beverage Vending Machine Energy
Consumption (2008)
Unit Type Estimated
Inventory1
Unit Energy
Consumptio
n
(kWh/yr)2
Total
Energy
Consumptio
n
(TWh/yr)
Total
Energy
Consumptio
n
(%)
Primary
Energy
Consumptio
n3
(TBtu/yr)
Fully-cooled 496,080 2,743 1.4 14% 14.2
Zone-cooled 3,319,920 2,483 8.2 86% 85.8
Total 3,816,000 - 9.6 100% 100.0 Sources: 1 Vending Times 2008a
2 NCI estimates that the typical installed refrigerated vending machine uses approximately 10 percent
more than the typical new vending machine on the market today, which we assume to be the baseline
efficiency used in the ongoing beverage vending machine DOE Rulemaking (DOE 2008b). See
Table 3-52 and Table 3-53 for these “typical new” energy consumptions. 3 Based on 10,405 Btu primary energy/kWh site energy (DOE 2008a, Table 6.2.4)

28
3 Description of Baseline Equipment
This section describes the baseline equipment characteristics (unit energy consumptions,
costs, manufacturers, and end-users) for each of the seven commercial refrigeration
equipment types addressed in this report:
Supermarket refrigeration systems (display cases, compressor racks, and
condensers)
Walk-in coolers and freezers
Food preparation, worktop, and buffet tables
Reach-in refrigerators and freezers
Beverage Merchandisers
Ice machines
Refrigerated Vending Machines
Throughout the report, “baseline” equipment is used to refer to a typical new piece of
equipment sold in 2009. The baseline equipment definitions will serve as a basis for
comparison in our energy savings analysis in section 4.
3.1 Supermarket Refrigeration Systems
3.1.1 Equipment Description and Illustrations
General System Description
The purpose of supermarket refrigeration systems is to preserve and merchandise food
products. Refrigerated food products are generally stored in walk-in coolers and freezers
prior to transfer to the refrigerated display cases on the retail floor, from which customers
can access them for purchase. The layout of a typical supermarket is depicted in Figure
3-1. The refrigerated display cases are generally located at the periphery of the store near
their associated walk-in coolers/freezers used for food storage.
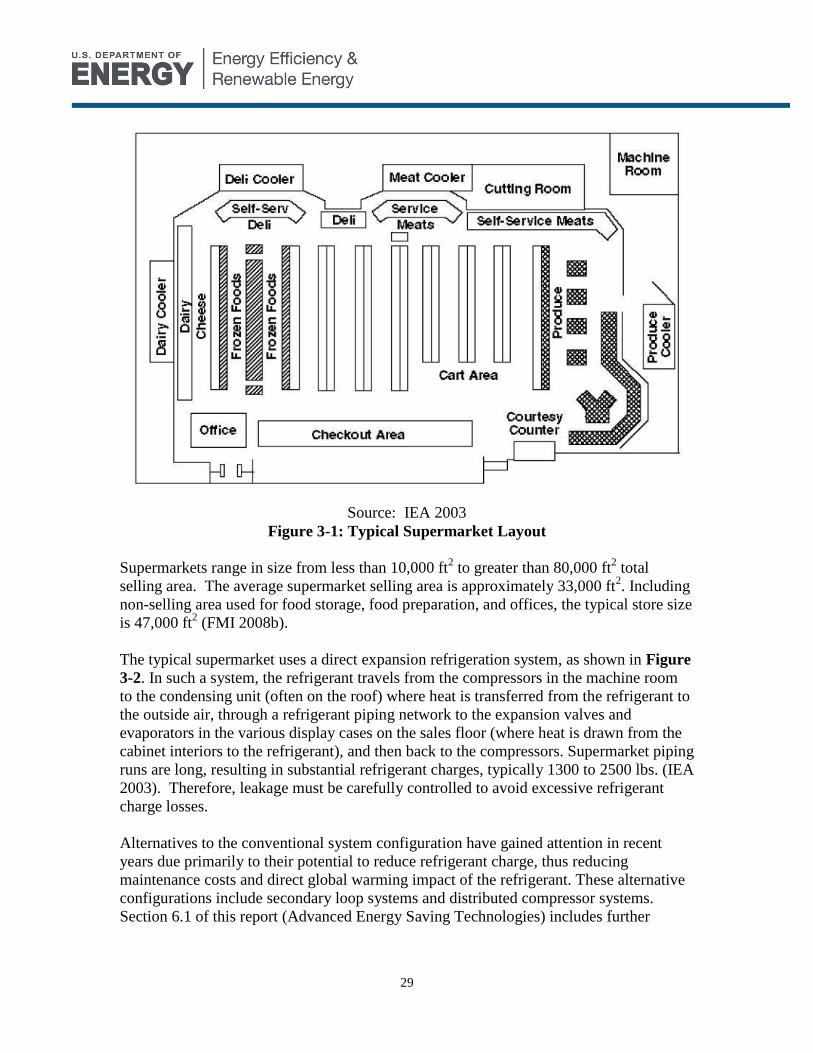
29
Source: IEA 2003
Figure 3-1: Typical Supermarket Layout
Supermarkets range in size from less than 10,000 ft2 to greater than 80,000 ft
2 total
selling area. The average supermarket selling area is approximately 33,000 ft2. Including
non-selling area used for food storage, food preparation, and offices, the typical store size
is 47,000 ft2 (FMI 2008b).
The typical supermarket uses a direct expansion refrigeration system, as shown in Figure
3-2. In such a system, the refrigerant travels from the compressors in the machine room
to the condensing unit (often on the roof) where heat is transferred from the refrigerant to
the outside air, through a refrigerant piping network to the expansion valves and
evaporators in the various display cases on the sales floor (where heat is drawn from the
cabinet interiors to the refrigerant), and then back to the compressors. Supermarket piping
runs are long, resulting in substantial refrigerant charges, typically 1300 to 2500 lbs. (IEA
2003). Therefore, leakage must be carefully controlled to avoid excessive refrigerant
charge losses.
Alternatives to the conventional system configuration have gained attention in recent
years due primarily to their potential to reduce refrigerant charge, thus reducing
maintenance costs and direct global warming impact of the refrigerant. These alternative
configurations include secondary loop systems and distributed compressor systems.
Section 6.1 of this report (Advanced Energy Saving Technologies) includes further

30
discussion of these technologies. The components of the direct expansion system,
including display cases, compressor racks, and condensers, are described in detail below.
Figure 3-2: Typical Supermarket Refrigeration Circuit
Display Cases
The purpose of supermarket cases is to display food attractively for purchase by
customers. Display cases vary by temperature and orientation in order to adequately
display the range of fresh products sold in a supermarket. The evaporator coil
temperature ranges and their associated applications are shown in Table 3-1. About half
of the 60 display cases in a typical supermarket will be low or very low temperature
cases.
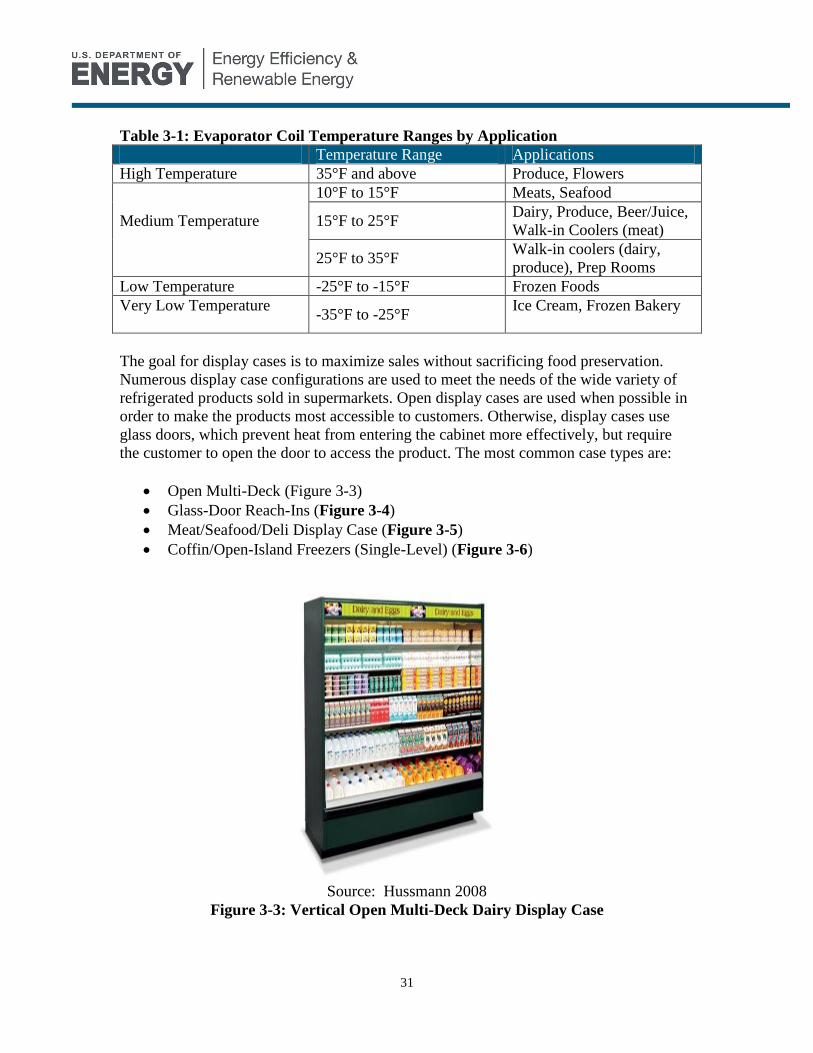
31
Table 3-1: Evaporator Coil Temperature Ranges by Application
Temperature Range Applications
High Temperature 35°F and above Produce, Flowers
Medium Temperature
10°F to 15°F Meats, Seafood
15°F to 25°F Dairy, Produce, Beer/Juice,
Walk-in Coolers (meat)
25°F to 35°F Walk-in coolers (dairy,
produce), Prep Rooms
Low Temperature -25°F to -15°F Frozen Foods
Very Low Temperature
-35°F to -25°F
Ice Cream, Frozen Bakery
The goal for display cases is to maximize sales without sacrificing food preservation.
Numerous display case configurations are used to meet the needs of the wide variety of
refrigerated products sold in supermarkets. Open display cases are used when possible in
order to make the products most accessible to customers. Otherwise, display cases use
glass doors, which prevent heat from entering the cabinet more effectively, but require
the customer to open the door to access the product. The most common case types are:
Open Multi-Deck (Figure 3-3)
Glass-Door Reach-Ins (Figure 3-4)
Meat/Seafood/Deli Display Case (Figure 3-5)
Coffin/Open-Island Freezers (Single-Level) (Figure 3-6)
Source: Hussmann 2008
Figure 3-3: Vertical Open Multi-Deck Dairy Display Case

32
Source: Hussmann 2008
Figure 3-4: Vertical Glass Door Reach-In Display Case for Frozen Food
Source: Hussmann 2008
Figure 3-5: Semi-Vertical Open Multi-Deck Meat Display Case
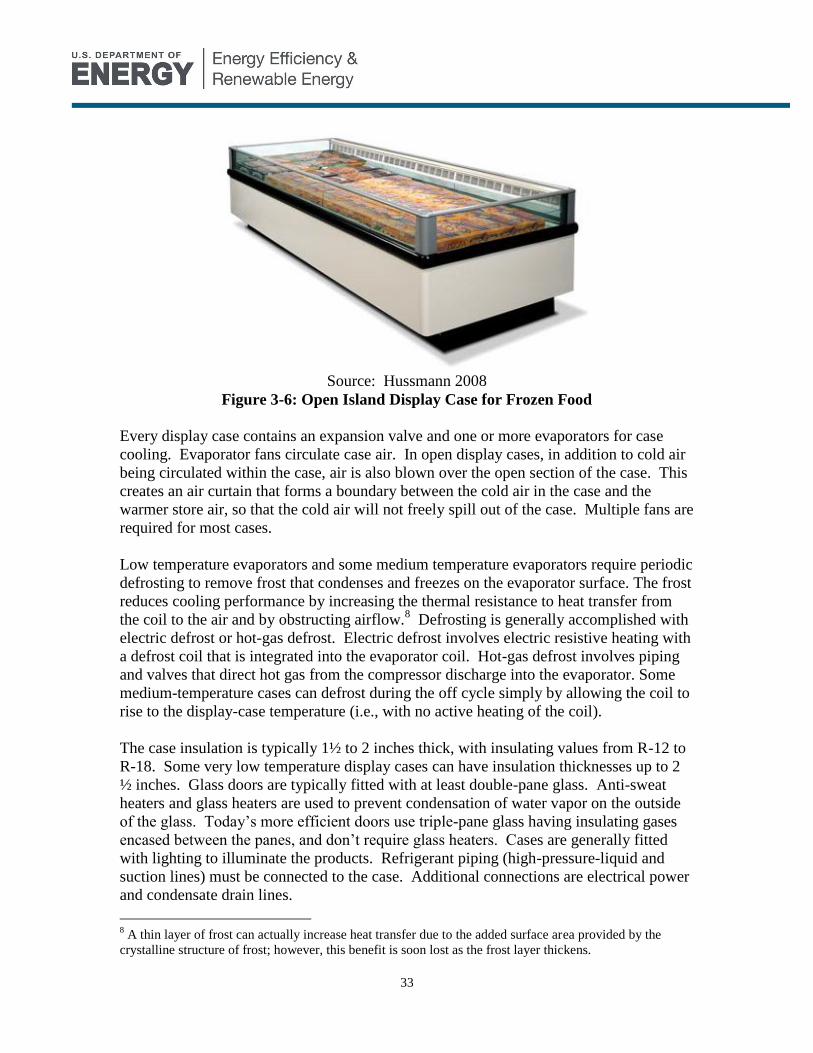
33
Source: Hussmann 2008
Figure 3-6: Open Island Display Case for Frozen Food
Every display case contains an expansion valve and one or more evaporators for case
cooling. Evaporator fans circulate case air. In open display cases, in addition to cold air
being circulated within the case, air is also blown over the open section of the case. This
creates an air curtain that forms a boundary between the cold air in the case and the
warmer store air, so that the cold air will not freely spill out of the case. Multiple fans are
required for most cases.
Low temperature evaporators and some medium temperature evaporators require periodic
defrosting to remove frost that condenses and freezes on the evaporator surface. The frost
reduces cooling performance by increasing the thermal resistance to heat transfer from
the coil to the air and by obstructing airflow.8 Defrosting is generally accomplished with
electric defrost or hot-gas defrost. Electric defrost involves electric resistive heating with
a defrost coil that is integrated into the evaporator coil. Hot-gas defrost involves piping
and valves that direct hot gas from the compressor discharge into the evaporator. Some
medium-temperature cases can defrost during the off cycle simply by allowing the coil to
rise to the display-case temperature (i.e., with no active heating of the coil).
The case insulation is typically 1½ to 2 inches thick, with insulating values from R-12 to
R-18. Some very low temperature display cases can have insulation thicknesses up to 2
½ inches. Glass doors are typically fitted with at least double-pane glass. Anti-sweat
heaters and glass heaters are used to prevent condensation of water vapor on the outside
of the glass. Today’s more efficient doors use triple-pane glass having insulating gases
encased between the panes, and don’t require glass heaters. Cases are generally fitted
with lighting to illuminate the products. Refrigerant piping (high-pressure-liquid and
suction lines) must be connected to the case. Additional connections are electrical power
and condensate drain lines.
8 A thin layer of frost can actually increase heat transfer due to the added surface area provided by the
crystalline structure of frost; however, this benefit is soon lost as the frost layer thickens.
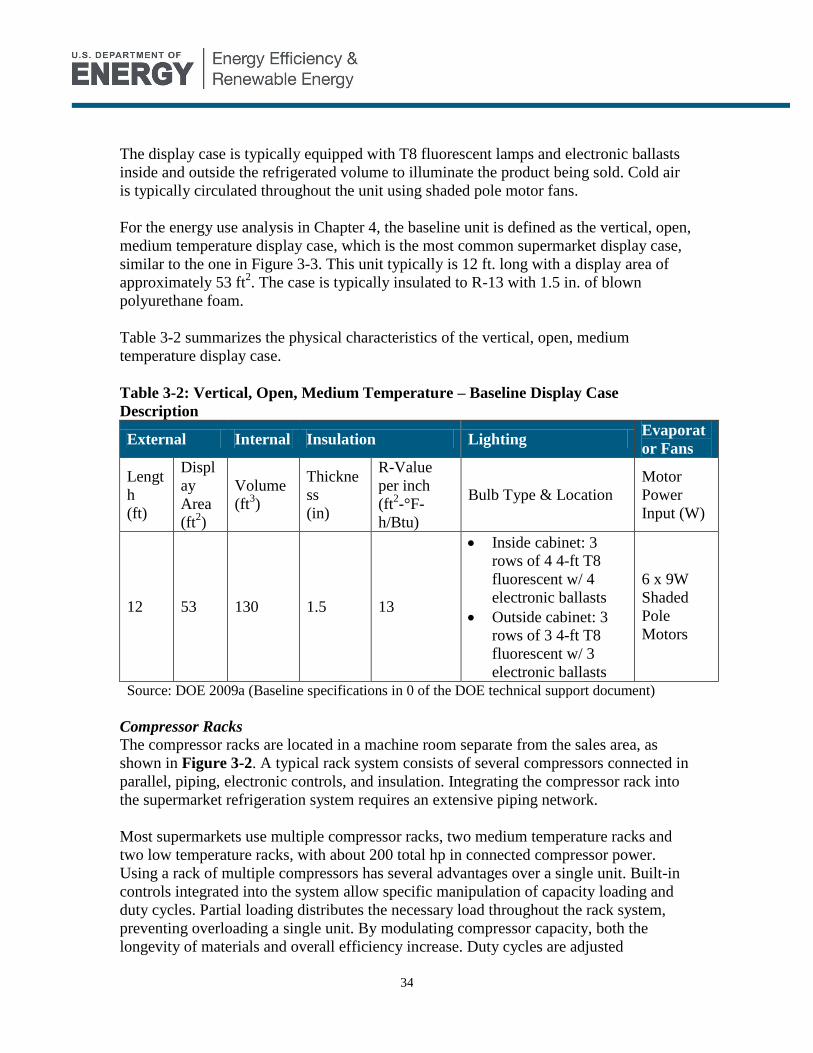
34
The display case is typically equipped with T8 fluorescent lamps and electronic ballasts
inside and outside the refrigerated volume to illuminate the product being sold. Cold air
is typically circulated throughout the unit using shaded pole motor fans.
For the energy use analysis in Chapter 4, the baseline unit is defined as the vertical, open,
medium temperature display case, which is the most common supermarket display case,
similar to the one in Figure 3-3. This unit typically is 12 ft. long with a display area of
approximately 53 ft2. The case is typically insulated to R-13 with 1.5 in. of blown
polyurethane foam.
Table 3-2 summarizes the physical characteristics of the vertical, open, medium
temperature display case.
Table 3-2: Vertical, Open, Medium Temperature – Baseline Display Case
Description
External Internal Insulation Lighting Evaporat
or Fans
Lengt
h
(ft)
Displ
ay
Area
(ft2)
Volume
(ft3)
Thickne
ss
(in)
R-Value
per inch
(ft2-°F-
h/Btu)
Bulb Type & Location
Motor
Power
Input (W)
12 53 130 1.5 13
Inside cabinet: 3
rows of 4 4-ft T8
fluorescent w/ 4
electronic ballasts
Outside cabinet: 3
rows of 3 4-ft T8
fluorescent w/ 3
electronic ballasts
6 x 9W
Shaded
Pole
Motors
Source: DOE 2009a (Baseline specifications in 0 of the DOE technical support document)
Compressor Racks
The compressor racks are located in a machine room separate from the sales area, as
shown in Figure 3-2. A typical rack system consists of several compressors connected in
parallel, piping, electronic controls, and insulation. Integrating the compressor rack into
the supermarket refrigeration system requires an extensive piping network.
Most supermarkets use multiple compressor racks, two medium temperature racks and
two low temperature racks, with about 200 total hp in connected compressor power.
Using a rack of multiple compressors has several advantages over a single unit. Built-in
controls integrated into the system allow specific manipulation of capacity loading and
duty cycles. Partial loading distributes the necessary load throughout the rack system,
preventing overloading a single unit. By modulating compressor capacity, both the
longevity of materials and overall efficiency increase. Duty cycles are adjusted

35
accordingly to necessary load requirements, reducing any extraneous energy
consumption. A rack of compressors can contain compressors of different cooling
capacities in a configuration called “uneven parallel”, which the most widely used
approach. By incorporating compressors having different cooling capacities, a larger
range of loads can be served efficiently than if all compressors were of equal capacities.
There are several types of compressors available:
Reciprocating – Reliable and efficient, most widely used compressor.
Scroll – Compression process enables high efficiency, light weight, minimal
refrigerant loss; market share is modest, but growing (Emerson 2009).
Screw – Reliable and ideal compressor for variable speed and efficient partial
loads; very small market share.
This study assumes the baseline compressor rack configuration for a supermarket is two
medium temperature racks and two low temperature racks of scroll compressors.
Condensers
A typical supermarket uses a set of rooftop condensers to exchange the heat of the
refrigerated cabinets with the outside air. The typical capacity of a set of condensers is
1,520 MBtu, which is comprised of two low temperature condensers (THRL = 240
MBtu/hr each, suction temperature = -25°F, condensing temperature 110°F) and two
medium temperature (THRM = 520 MBtu/hr each, suction temperature = 15°F,
condensing temperature = 115°F) condensers (EIA 2008).9
Walk-ins
Walk-ins are located around the periphery of the sales area for temporary food storage.
To enabling more efficient restocking of display cases, each walk-in tends to store the
food for the nearest section of display cases. Typical categories include produce, dairy,
deli, meat, and frozen food (see Figure 3-1). See Section 3.2 for a more detailed
equipment description for walk-in coolers and freezers.
3.1.2 Energy Consumption
Supermarkets typically use on the order of 3,000,000 kWh of electricity per year
according to the EPA Supermarket Energy Use Profile (EPA 2007). The typical
breakdown of this usage among building systems is shown below in Figure 3-7.
Refrigeration represents 60 percent of supermarket energy use according to the EPA.
However, other sources state that the percentage is as low as 30 to 50 percent (Lazzarin
2008).
9 THR = Total Heat Rejected

36
Source: EPA 2007
Figure 3-7: Annual Electricity Consumption Breakdown for Typical Supermarket
(33,000 ft2 selling area)
1 Based on EPA analysis of data from the Energy Information Administration’s 2003 Commercial Building
Energy Consumption Survey. 2 10,405 Btu primary energy/kWh site energy (DOE 2008a, Table 6.2.4)
A supermarket with 47,500 ft2 total area and 24 hour-per-day operation is chosen as the
baseline for the energy consumption and savings. This store area is the median size of
existing supermarkets, which is just above the average size of new stores at 46,000 ft2,
but well below the 55,000 ft2 range of the 1990s (FMI 2008a). Most large supermarkets
are open between 18 and 24 hours per day. For this analysis, we decided to analyze the
upper limit of the range of operating hours. Since the refrigeration equipment operates 24
hours/day regardless of store hours, the differences are largely associated with additional
product pull-down loads and more door openings (assuming higher sales volumes as store
hours increase).
The typical breakdown of the refrigeration electricity consumed by refrigeration systems
is shown below in Figure 3-8.
Refrigeration 60%
Lighting18%
HVAC15%
Other, 4%
Water Heating 2% Bakery, 1%
Total Annual Electricity Consumption = ~ 3,000,000 kWh (Site Energy) 1
or ~ 31,215 Million Btu (Primary Energy) 2

37
Sources: Manufacturer Spec Sheets, Manufacturer Interviews, and NCI Estimates
Figure 3-8: Typical Supermarket Refrigeration System Electricity Consumption
Breakdown
We estimate the typical supermarket energy consumption to be 1.9 million kWh/yr, as
shown in Table 3-3. Following the table are details on the energy consumption of each
component, including display cases, compressors, condensers, and walk-ins.
Table 3-3: Supermarket Refrigeration Energy Consumption
Estimate
d
Inventor
y per
Store1
Unit
Energy
Use
(kWh/yr)
Store
Energy
Use
(kWh/yr)
Total
Energy
Use 2
(TWh/yr
)
Total
Energy
Use (%)
Primary
Energy
Use
(TBtu/yr
) 3
Display Cases 60 9,783 586,980 20.5 31% 214
Compressors 1 1,023,333 1,023,333 35.8 54% 373
Condensers 1 138,000 138,000 4.8 7% 50
Walk-ins 7 varies 139,905 4.9 8% 51
Total
1,888,218
66.1 100% 688
Source: DOE 2009a 1
NCI estimates 2Assume 35,000 supermarkets installed in the U.S.
3 10,405 Btu primary energy/kWh site energy (DOE 2008a: Table 6.2.4)
Note: Energy use values have been rounded to the nearest whole number, and therefore
the total may not exactly equal the sum of the energy use values for each equipment
type.
Case Lighting18%
Fans9%
Anti-Sweat Heaters
13%
Compressors55%
Defrost Mechanisms
3%
Misc.2%

38
Display Cases
Table 3-4 shows the steady state thermal load breakdowns for a typical vertical medium
temperature supermarket display case without doors.
Table 3-4: Supermarket Display Case Thermal Load Breakdown (Btu/hr)
Component
Vertical Glass
Door Medium
Temp
Vertical Glass
Door Low
Temp
Vertical Open
Medium Temp
Evaporator Fan 512 491 920
Lighting 1,188 1,188 1,700
Defrost n/a 677 n/a
Anti-sweat 1,195 2,391 n/a
Infiltration 524 865 16,070
Conduction 631 915 590
Radiation 1,456 2,756 1,450
Total 5,507 9,283 20,730
Note: Thermal load values have been rounded to the nearest whole number,
and therefore the total may not exactly equal the sum of the thermal load
values for each component.
Source: DOE 2009a
Table 3-5 shows the energy consumption for each of the seven most common display
case types. We generate a weighted average energy consumption of 8,894 kWh/yr for
display cases using the estimated installed base by type.
Table 3-5: Average Unit Energy Consumption of Supermarket Display Cases
Display Case
Type1
Installed Base
(units)
Weighting
Factor
Unit Energy
Consumption
(kWh/yr)
VOP.RC.M 387,430 28% 7,986
SVO.RC.M 295,520 22% 6,030
HZO.RC.M 45,410 3% 2,314
VCT.RC.M 27,670 2% 8,688
SOC.RC.M 93,120 7% 7,965
VCT.RC.L 384,830 28% 14,893
HZO.RC.L 142,780 10% 3,854
Weighted Average UEC (Typical New): 8,894
Weighted Average UEC (Typical Installed)2: 9,783
Source: DOE 2009a 1 VOP = vertical open, SVO = semi-vertical open, HZO = horizontal
open,
VCT = vertical transparent doors, SOC = service over counter, RC =
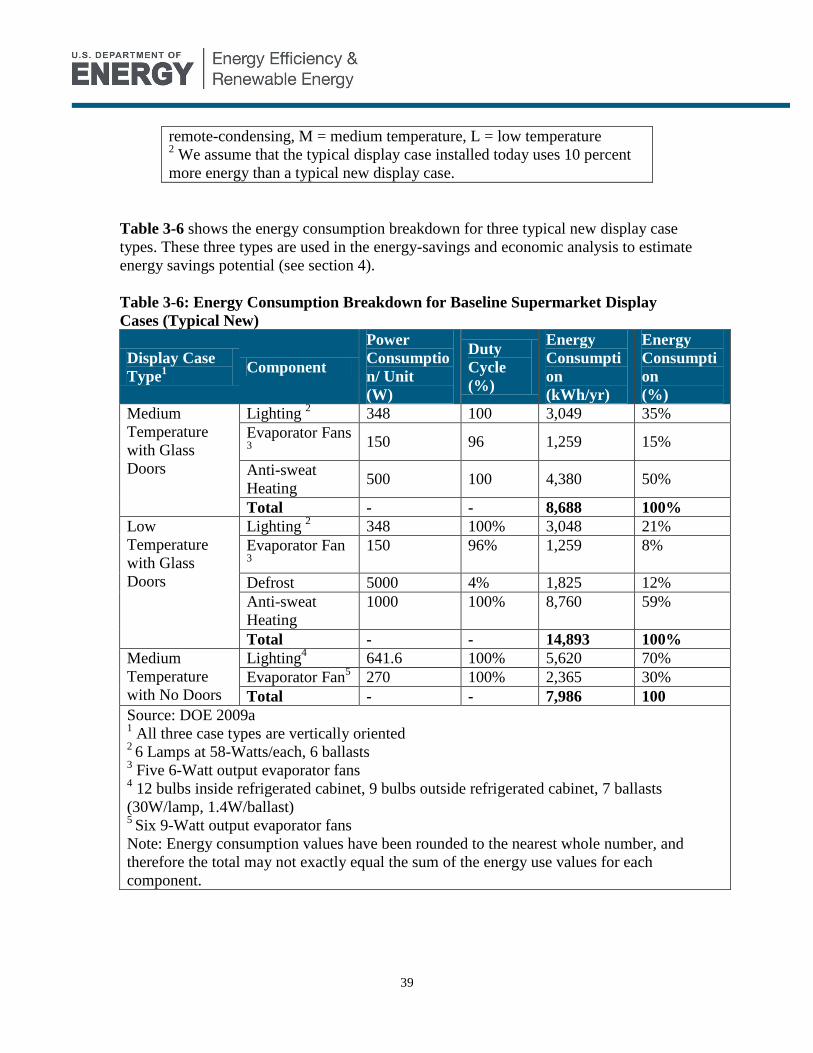
39
remote-condensing, M = medium temperature, L = low temperature 2 We assume that the typical display case installed today uses 10 percent
more energy than a typical new display case.
Table 3-6 shows the energy consumption breakdown for three typical new display case
types. These three types are used in the energy-savings and economic analysis to estimate
energy savings potential (see section 4).
Table 3-6: Energy Consumption Breakdown for Baseline Supermarket Display
Cases (Typical New)
Display Case
Type1
Component
Power
Consumptio
n/ Unit
(W)
Duty
Cycle
(%)
Energy
Consumpti
on
(kWh/yr)
Energy
Consumpti
on
(%)
Medium
Temperature
with Glass
Doors
Lighting 2 348 100 3,049 35%
Evaporator Fans 3
150 96 1,259 15%
Anti-sweat
Heating 500 100 4,380 50%
Total - - 8,688 100%
Low
Temperature
with Glass
Doors
Lighting 2 348 100% 3,048 21%
Evaporator Fan 3
150 96% 1,259 8%
Defrost 5000 4% 1,825 12%
Anti-sweat
Heating
1000 100% 8,760 59%
Total - - 14,893 100%
Medium
Temperature
with No Doors
Lighting4 641.6 100% 5,620 70%
Evaporator Fan5 270 100% 2,365 30%
Total - - 7,986 100
Source: DOE 2009a 1 All three case types are vertically oriented
2 6 Lamps at 58-Watts/each, 6 ballasts
3 Five 6-Watt output evaporator fans
4 12 bulbs inside refrigerated cabinet, 9 bulbs outside refrigerated cabinet, 7 ballasts
(30W/lamp, 1.4W/ballast) 5
Six 9-Watt output evaporator fans
Note: Energy consumption values have been rounded to the nearest whole number, and
therefore the total may not exactly equal the sum of the energy use values for each
component.
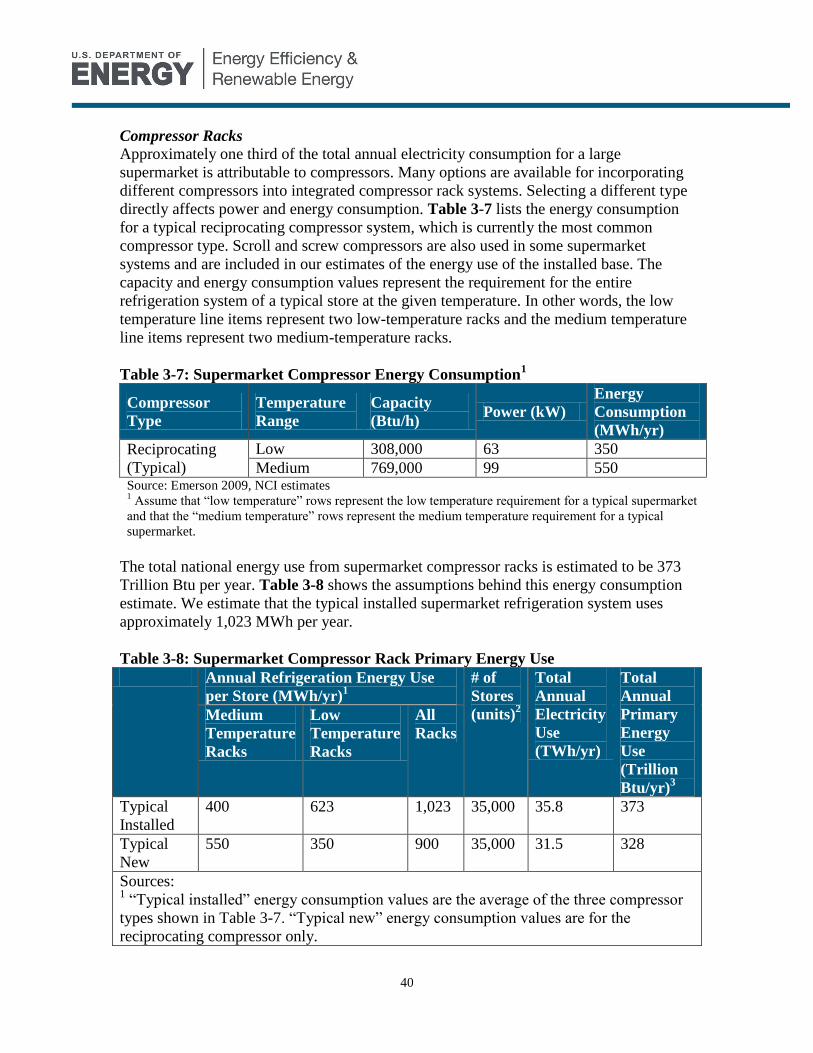
40
Compressor Racks
Approximately one third of the total annual electricity consumption for a large
supermarket is attributable to compressors. Many options are available for incorporating
different compressors into integrated compressor rack systems. Selecting a different type
directly affects power and energy consumption. Table 3-7 lists the energy consumption
for a typical reciprocating compressor system, which is currently the most common
compressor type. Scroll and screw compressors are also used in some supermarket
systems and are included in our estimates of the energy use of the installed base. The
capacity and energy consumption values represent the requirement for the entire
refrigeration system of a typical store at the given temperature. In other words, the low
temperature line items represent two low-temperature racks and the medium temperature
line items represent two medium-temperature racks.
Table 3-7: Supermarket Compressor Energy Consumption1
Compressor
Type
Temperature
Range
Capacity
(Btu/h) Power (kW)
Energy
Consumption
(MWh/yr)
Reciprocating
(Typical)
Low 308,000 63 350
Medium 769,000 99 550 Source: Emerson 2009, NCI estimates 1 Assume that “low temperature” rows represent the low temperature requirement for a typical supermarket
and that the “medium temperature” rows represent the medium temperature requirement for a typical
supermarket.
The total national energy use from supermarket compressor racks is estimated to be 373
Trillion Btu per year. Table 3-8 shows the assumptions behind this energy consumption
estimate. We estimate that the typical installed supermarket refrigeration system uses
approximately 1,023 MWh per year.
Table 3-8: Supermarket Compressor Rack Primary Energy Use
Annual Refrigeration Energy Use
per Store (MWh/yr)1
# of
Stores
(units)2
Total
Annual
Electricity
Use
(TWh/yr)
Total
Annual
Primary
Energy
Use
(Trillion
Btu/yr)3
Medium
Temperature
Racks
Low
Temperature
Racks
All
Racks
Typical
Installed
400 623 1,023 35,000 35.8 373
Typical
New
550 350 900 35,000 31.5 328
Sources: 1 “Typical installed” energy consumption values are the average of the three compressor
types shown in Table 3-7. “Typical new” energy consumption values are for the
reciprocating compressor only.

41
2From Progressive Grocer (2008)
3Primary energy includes the energy associated with generation (for electricity only),
transmission, and distribution to the end user. This report uses the national average
efficiency for 2006 (10,405 Btu primary energy/kWh site energy) (DOE 2008a, Table
6.2.4).
Condensers
Supermarket condensers use approximately eight percent of supermarket refrigeration
energy consumption to power the fan motors, which blow air across the condenser coil to
assist in heat transfer. Supermarkets most commonly use one remote air-cooled
condenser for each refrigeration circuit, all with 3-phase induction fan motors. We
assume the typical supermarket uses four condenser coils (one per compressor rack).
Table 3-9 shows the condenser energy consumption for a typical supermarket installed
today.
Table 3-9: Supermarket Condenser Energy Consumption
Power
(kW)
Unit Energy
Consumption
(kWh/yr)
Total Annual
Electricity Use
(TWh/yr)
Total Annual
Primary Energy
Use (Trillion
Btu/yr)1
Typical
Installed 25 138,000 4.8 50
Typical New 22 120,000 4.2 44
Source: EIA 2008. 1Primary energy includes the energy associated with generation (for electricity only),
transmission, and distribution to the end user. This report uses the national average
efficiency for 2006 (10,405 Btu primary energy/kWh site energy) (DOE 2008a, Table
6.2.4).
Walk-ins
Supermarket walk-ins also use approximately eight percent of supermarket refrigeration
energy consumption to power the evaporator fan motors, lighting, and electric defrost.
Table 3-10 shows the walk-in energy consumption for a typical supermarket installed
today.
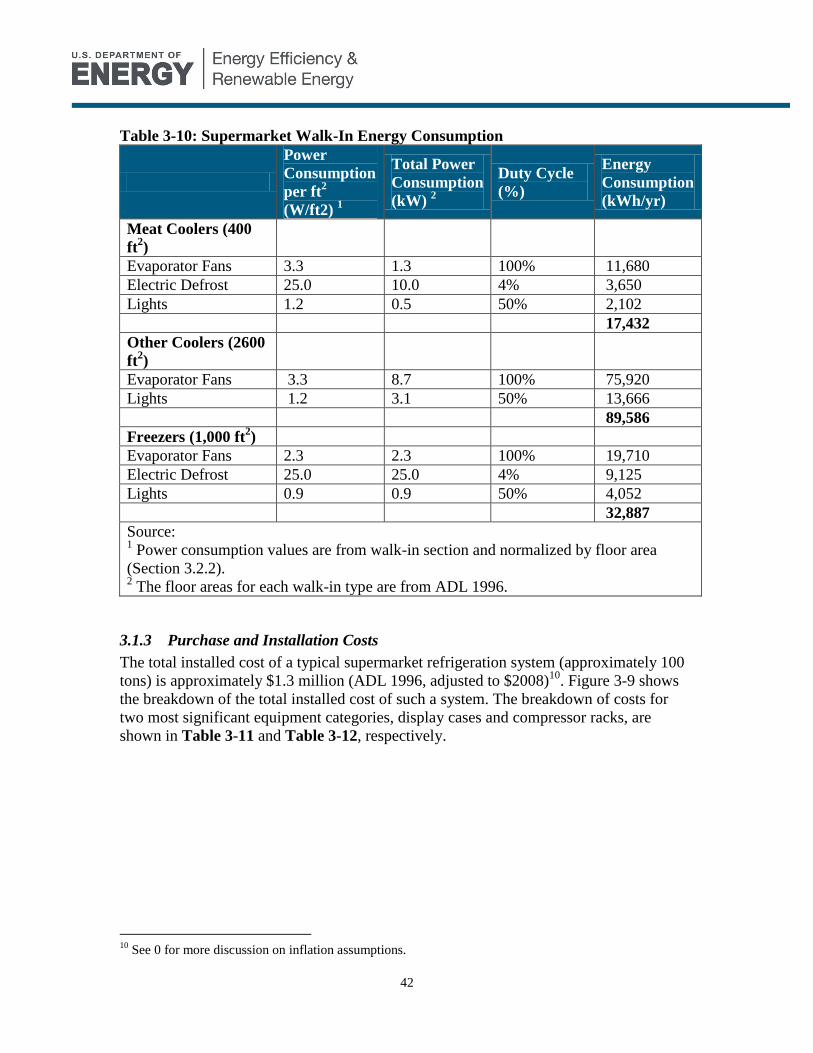
42
Table 3-10: Supermarket Walk-In Energy Consumption
Power
Consumption
per ft2
(W/ft2) 1
Total Power
Consumption
(kW) 2
Duty Cycle
(%)
Energy
Consumption
(kWh/yr)
Meat Coolers (400
ft2)
Evaporator Fans 3.3 1.3 100% 11,680
Electric Defrost 25.0 10.0 4% 3,650
Lights 1.2 0.5 50% 2,102
17,432
Other Coolers (2600
ft2)
Evaporator Fans 3.3 8.7 100% 75,920
Lights 1.2 3.1 50% 13,666
89,586
Freezers (1,000 ft2)
Evaporator Fans 2.3 2.3 100% 19,710
Electric Defrost 25.0 25.0 4% 9,125
Lights 0.9 0.9 50% 4,052
32,887
Source: 1 Power consumption values are from walk-in section and normalized by floor area
(Section 3.2.2). 2 The floor areas for each walk-in type are from ADL 1996.
3.1.3 Purchase and Installation Costs
The total installed cost of a typical supermarket refrigeration system (approximately 100
tons) is approximately $1.3 million (ADL 1996, adjusted to $2008)10
. Figure 3-9 shows
the breakdown of the total installed cost of such a system. The breakdown of costs for
two most significant equipment categories, display cases and compressor racks, are
shown in Table 3-11 and Table 3-12, respectively.
10
See 0 for more discussion on inflation assumptions.

43
Source: ADL 1996
Figure 3-9: Installed Cost Breakdown for a 100 Ton Supermarket Refrigeration
System ($2008)
Table 3-11: Refrigerated Display Case Total Installed Cost ($2008)
Cost per Case Cost per Store1
Equipment Purchase
Price $ 9,700 $ 773,000
Installation $ 2,000 $ 160,000
Total Installed $ 11,700 $ 933,000
Source: DOE 2009a 1Assumes 80 cases per supermarket.
Table 3-12: Compressor Rack Total Installed Cost ($2008)
Cost per
Rack Cost per Store
1
Equipment Purchase
Price $200,000
2 $798,000
Installation2 $20,000 $80,000
Total Installed $220,000 $878,000
Source: Adapted from ADL 1996 1
Assumes 4 compressor racks for a typical supermarket. 2 Equipment purchase price ranges from $70-$115,000
per case. 3 Installation includes machine delivery, placement,
electric connections, and piping configuration and ranges
between $15,000 and $25,000.
Display Cases
47%
Installation
21%
Compressor
Racks
14%
Condensers
4%
Walk-in
Evaporators
2%
Misc. Electronics
5%
Walk-in Boxes
7%
Total Installed Cost = $1.3 million
(increased from $1.05 million in ADL 1996; see 0 for
discussion on cost escalation assumptions.)
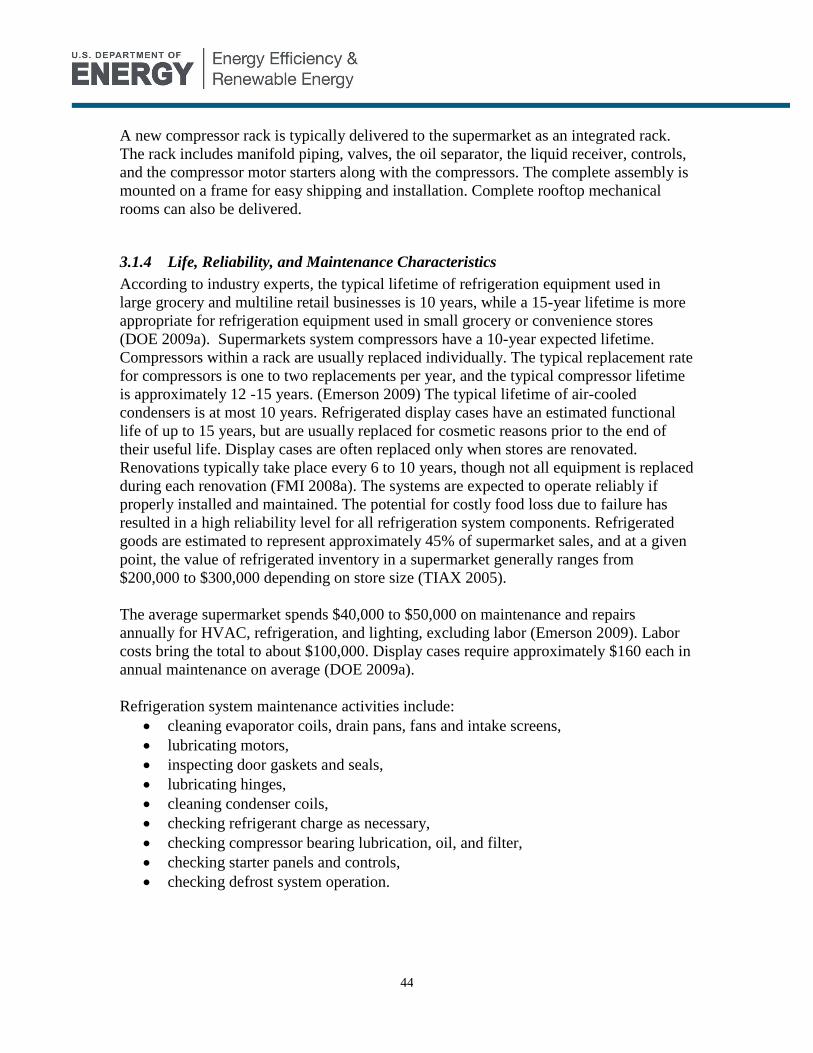
44
A new compressor rack is typically delivered to the supermarket as an integrated rack.
The rack includes manifold piping, valves, the oil separator, the liquid receiver, controls,
and the compressor motor starters along with the compressors. The complete assembly is
mounted on a frame for easy shipping and installation. Complete rooftop mechanical
rooms can also be delivered.
3.1.4 Life, Reliability, and Maintenance Characteristics
According to industry experts, the typical lifetime of refrigeration equipment used in
large grocery and multiline retail businesses is 10 years, while a 15-year lifetime is more
appropriate for refrigeration equipment used in small grocery or convenience stores
(DOE 2009a). Supermarkets system compressors have a 10-year expected lifetime.
Compressors within a rack are usually replaced individually. The typical replacement rate
for compressors is one to two replacements per year, and the typical compressor lifetime
is approximately 12 -15 years. (Emerson 2009) The typical lifetime of air-cooled
condensers is at most 10 years. Refrigerated display cases have an estimated functional
life of up to 15 years, but are usually replaced for cosmetic reasons prior to the end of
their useful life. Display cases are often replaced only when stores are renovated.
Renovations typically take place every 6 to 10 years, though not all equipment is replaced
during each renovation (FMI 2008a). The systems are expected to operate reliably if
properly installed and maintained. The potential for costly food loss due to failure has
resulted in a high reliability level for all refrigeration system components. Refrigerated
goods are estimated to represent approximately 45% of supermarket sales, and at a given
point, the value of refrigerated inventory in a supermarket generally ranges from
$200,000 to $300,000 depending on store size (TIAX 2005).
The average supermarket spends $40,000 to $50,000 on maintenance and repairs
annually for HVAC, refrigeration, and lighting, excluding labor (Emerson 2009). Labor
costs bring the total to about $100,000. Display cases require approximately $160 each in
annual maintenance on average (DOE 2009a).
Refrigeration system maintenance activities include:
cleaning evaporator coils, drain pans, fans and intake screens,
lubricating motors,
inspecting door gaskets and seals,
lubricating hinges,
cleaning condenser coils,
checking refrigerant charge as necessary,
checking compressor bearing lubrication, oil, and filter,
checking starter panels and controls,
checking defrost system operation.

45
3.1.5 Major Manufacturers and Distribution Channels
Four companies represent approximately 85 percent of the U.S. refrigerated display case
market, with approximately 185,000 units shipped in 2004 (DOE 2009a). However,
Appliance Magazine provides no precise definition of a refrigerated display case and it is
therefore unclear what specific types of equipment the data covers – equipment that is
self-contained versus remote condensing, and equipment with doors versus without
doors. As of 2004, Hussmann Corporation, a division of Ingersoll Rand, was the largest
domestic manufacturer of refrigerated display cases, holding approximately 48 percent of
the U.S. market. Other manufacturers make up the remaining 52 percent of U.S. market
share. Figure 3-10 shows the breakdown of the U.S. refrigeration equipment market
among major manufacturers.
Source: Appliance Magazine 2005
Figure 3-10: U.S. Market Share of Major Refrigerated Display Case Manufacturers Note: Appliance Magazine has not published updated shipment and market share data for display cases
since 2005.
Larger supermarket chains typically involve central engineering staff in design, selection,
and installation of equipment. The manufacturer and/or consultant or contractor have a
larger role in equipment selection for independent operators.
Major compressor rack manufacturers include:
Hussman
Kysor-Warren
Heatcraft
Tyler Refrigeration
Hill Phoenix
Zero Zone
Major compressor manufacturers include:
Copeland
Hussman
48%
Tyler
Refrigeration
16%
Hill Phoenix
15%
Kysor/Warren
6%
Other
15%
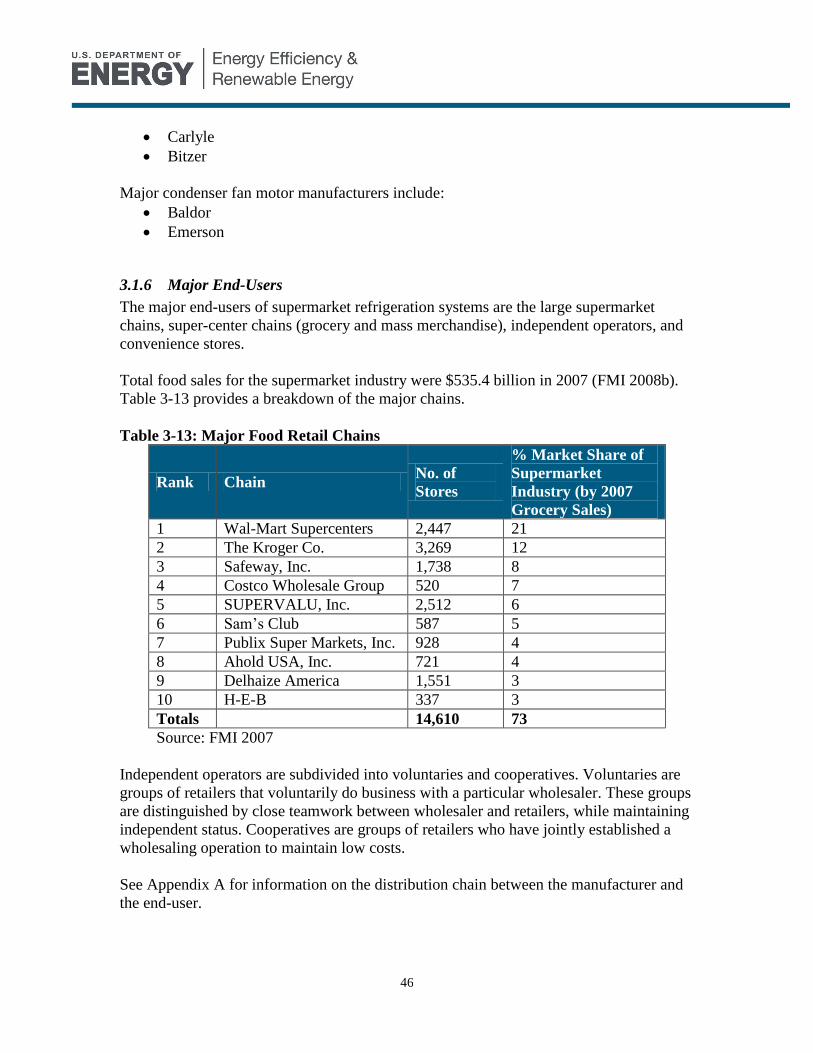
46
Carlyle
Bitzer
Major condenser fan motor manufacturers include:
Baldor
Emerson
3.1.6 Major End-Users
The major end-users of supermarket refrigeration systems are the large supermarket
chains, super-center chains (grocery and mass merchandise), independent operators, and
convenience stores.
Total food sales for the supermarket industry were $535.4 billion in 2007 (FMI 2008b).
Table 3-13 provides a breakdown of the major chains.
Table 3-13: Major Food Retail Chains
Rank Chain No. of
Stores
% Market Share of
Supermarket
Industry (by 2007
Grocery Sales)
1 Wal-Mart Supercenters 2,447 21
2 The Kroger Co. 3,269 12
3 Safeway, Inc. 1,738 8
4 Costco Wholesale Group 520 7
5 SUPERVALU, Inc. 2,512 6
6 Sam’s Club 587 5
7 Publix Super Markets, Inc. 928 4
8 Ahold USA, Inc. 721 4
9 Delhaize America 1,551 3
10 H-E-B 337 3
Totals 14,610 73
Source: FMI 2007
Independent operators are subdivided into voluntaries and cooperatives. Voluntaries are
groups of retailers that voluntarily do business with a particular wholesaler. These groups
are distinguished by close teamwork between wholesaler and retailers, while maintaining
independent status. Cooperatives are groups of retailers who have jointly established a
wholesaling operation to maintain low costs.
See Appendix A for information on the distribution chain between the manufacturer and
the end-user.

47
3.2 Walk-In Coolers and Freezers
Walk-ins have the basic components of a refrigeration system (evaporator, condenser and
compressor) and use either a self-contained or split-system arrangement. Generally,
packaged units are used in systems less than 3 hp while split-system units are used in
systems greater than 3 hp. This section focuses on walk-ins with dedicated refrigeration
systems. However, as discussed in section 3.1, walk-ins are also found as part of
supermarket refrigeration systems, and we assume that the supermarket refrigeration load
includes the necessary walk-in loads. Therefore, the compressor and condenser fan
energy use is represented in the supermarket refrigeration energy use. However, we
assume that the characteristics of the evaporator fans, lighting, defrost, and anti-sweat
heaters discussed in this chapter still apply to supermarket walk-ins.
A self-contained walk-in system consists of a manufactured package that contains all the
basic components. The refrigeration system is mounted either on the roof or wall of the
insulated room and is configured such that the condenser has access to the outside of the
room and the evaporator has access to the inside of the room. These units are less
expensive due to the simplification of the construction and installation (ADL 1996).
However, since they are shipped as a single package, they are limited to smaller sizes.
Split systems have a separate condensing unit (condenser and compressor) and unit
cooler (evaporator, fans and expansion device). The condensing unit is usually located on
the building rooftop or outside at ground level. Generally, refrigeration components and
controls are ordered separately and assembled on site by local refrigeration contractors.
This configuration is advantageous for walk-ins that are inside buildings because heat and
noise can be kept outdoors. Also, it is generally more energy efficient to reject heat
directly outdoors, rather than rely on the space-conditioning system to reject the heat.
3.2.1 Equipment Description and Illustrations
The purpose of walk-ins is to temporarily store refrigerated or frozen food or non-food
products. Walk-ins range from 80 to 250 square feet of floor area and are approximately
8 feet in height. Figure 3-11 and Figure 3-12 are packaged walk-in units with the
condensing unit attached to the side wall and roof, respectively, which are typical of full-
service restaurants. Figure 3-13 shows a walk-in typically used in a convenience store.

48
Source: Nor-Lake 2008
Figure 3-11: Packaged Walk-In with Wall-Mounted Refrigeration System (Typical
of Restaurants)
Source: Nor-Lake 2008
Figure 3-12: Packaged Walk-In with Top-Mounted Refrigeration System (Typical
of Restaurants)
Source: Hussmann 2008
Figure 3-13: Walk-In Cooler with Merchandising Doors (Typical of Convenience
Stores)
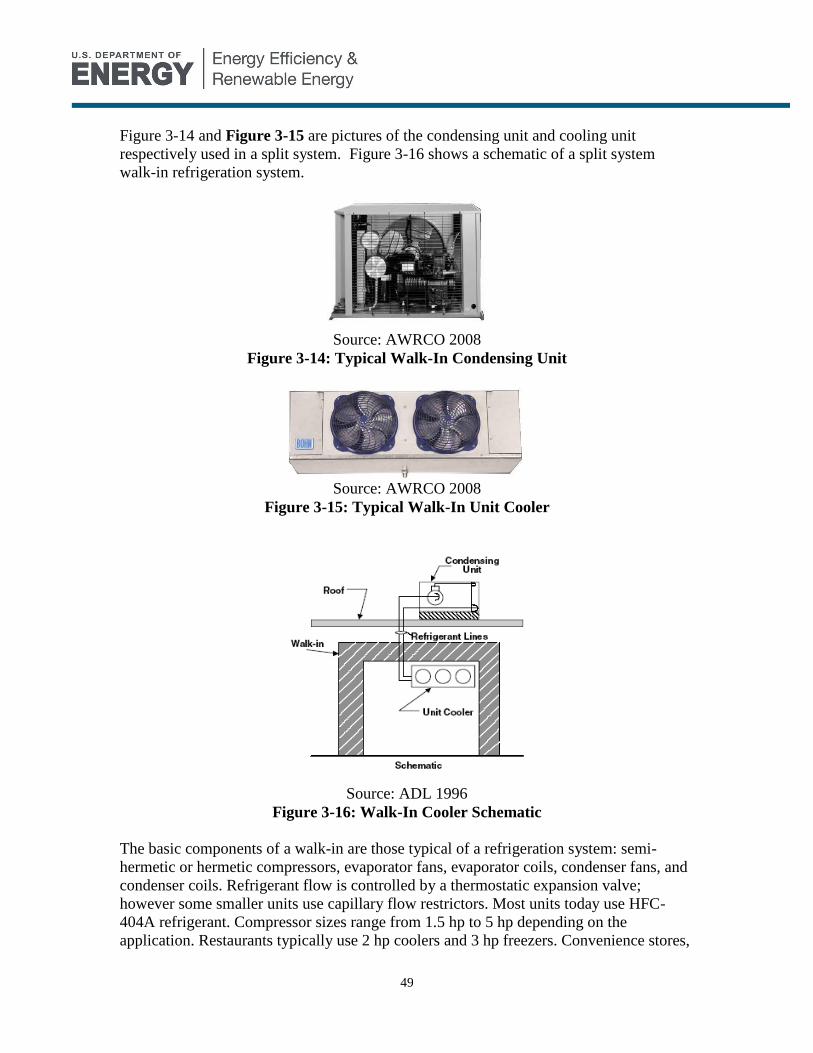
49
Figure 3-14 and Figure 3-15 are pictures of the condensing unit and cooling unit
respectively used in a split system. Figure 3-16 shows a schematic of a split system
walk-in refrigeration system.
Source: AWRCO 2008
Figure 3-14: Typical Walk-In Condensing Unit
Source: AWRCO 2008
Figure 3-15: Typical Walk-In Unit Cooler
Source: ADL 1996
Figure 3-16: Walk-In Cooler Schematic
The basic components of a walk-in are those typical of a refrigeration system: semi-
hermetic or hermetic compressors, evaporator fans, evaporator coils, condenser fans, and
condenser coils. Refrigerant flow is controlled by a thermostatic expansion valve;
however some smaller units use capillary flow restrictors. Most units today use HFC-
404A refrigerant. Compressor sizes range from 1.5 hp to 5 hp depending on the
application. Restaurants typically use 2 hp coolers and 3 hp freezers. Convenience stores,
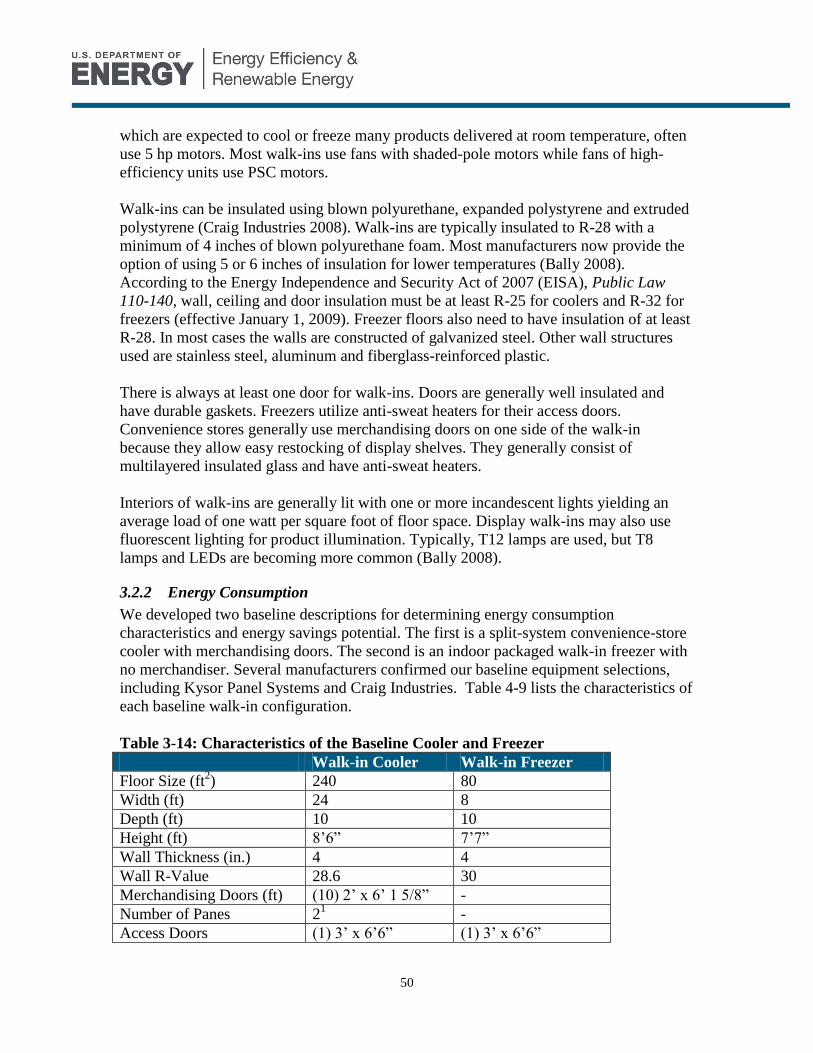
50
which are expected to cool or freeze many products delivered at room temperature, often
use 5 hp motors. Most walk-ins use fans with shaded-pole motors while fans of high-
efficiency units use PSC motors.
Walk-ins can be insulated using blown polyurethane, expanded polystyrene and extruded
polystyrene (Craig Industries 2008). Walk-ins are typically insulated to R-28 with a
minimum of 4 inches of blown polyurethane foam. Most manufacturers now provide the
option of using 5 or 6 inches of insulation for lower temperatures (Bally 2008).
According to the Energy Independence and Security Act of 2007 (EISA), Public Law
110-140, wall, ceiling and door insulation must be at least R-25 for coolers and R-32 for
freezers (effective January 1, 2009). Freezer floors also need to have insulation of at least
R-28. In most cases the walls are constructed of galvanized steel. Other wall structures
used are stainless steel, aluminum and fiberglass-reinforced plastic.
There is always at least one door for walk-ins. Doors are generally well insulated and
have durable gaskets. Freezers utilize anti-sweat heaters for their access doors.
Convenience stores generally use merchandising doors on one side of the walk-in
because they allow easy restocking of display shelves. They generally consist of
multilayered insulated glass and have anti-sweat heaters.
Interiors of walk-ins are generally lit with one or more incandescent lights yielding an
average load of one watt per square foot of floor space. Display walk-ins may also use
fluorescent lighting for product illumination. Typically, T12 lamps are used, but T8
lamps and LEDs are becoming more common (Bally 2008).
3.2.2 Energy Consumption
We developed two baseline descriptions for determining energy consumption
characteristics and energy savings potential. The first is a split-system convenience-store
cooler with merchandising doors. The second is an indoor packaged walk-in freezer with
no merchandiser. Several manufacturers confirmed our baseline equipment selections,
including Kysor Panel Systems and Craig Industries. Table 4-9 lists the characteristics of
each baseline walk-in configuration.
Table 3-14: Characteristics of the Baseline Cooler and Freezer
Walk-in Cooler Walk-in Freezer
Floor Size (ft2) 240 80
Width (ft) 24 8
Depth (ft) 10 10
Height (ft) 8’6” 7’7”
Wall Thickness (in.) 4 4
Wall R-Value 28.6 30
Merchandising Doors (ft) (10) 2’ x 6’ 1 5/8” -
Number of Panes 21 -
Access Doors (1) 3’ x 6’6” (1) 3’ x 6’6”

51
Refrigerant Type R-404A R-404A
Compressor HP 5 1 ½
Compressor Type Semi-Hermetic
Reciprocating
Semi-Hermetic
Reciprocating
Ambient Temperature (°F) 95 90
Walk-in Temperature (°F) 35 -10
Condensing Temperature
(°F) 105 113
Evaporating Temperature
(°F) 25 -26
Compressor Capacity
(kBtuh) 45.0 4.9
Compressor Power (W) 3850 1445
EER (Btu/W) 11.7 3.41
Liquid Suction Heat
Exchanger Yes Yes
Anti-sweat Wattage (W) 3004
2303
Anti-sweat Control None None
Defrost Wattage (W) - 1500
Defrost Control -
Time Initiated /
Temperature
Terminated
Pan Heater Wattage (W) - 500
Pan Heater Control -
Time Initiated /
Temperature
Terminated
Source: Adapted from ADL 1996, updated with interview with major
manufacturer in May 2008 1 Double pane insulated (inert gas) door
2 Actual ambient temperature varies – reported temperature is compressor
design point 3 Access door anti-sweat
4 Merchandising doors only
The steady-state loads for the walk-ins are presented in Table 3-15. The over sizing of the
compressor is greater for the cooler as it is sized for pulling product temperature down
and due to the frequent opening of the merchandising doors.
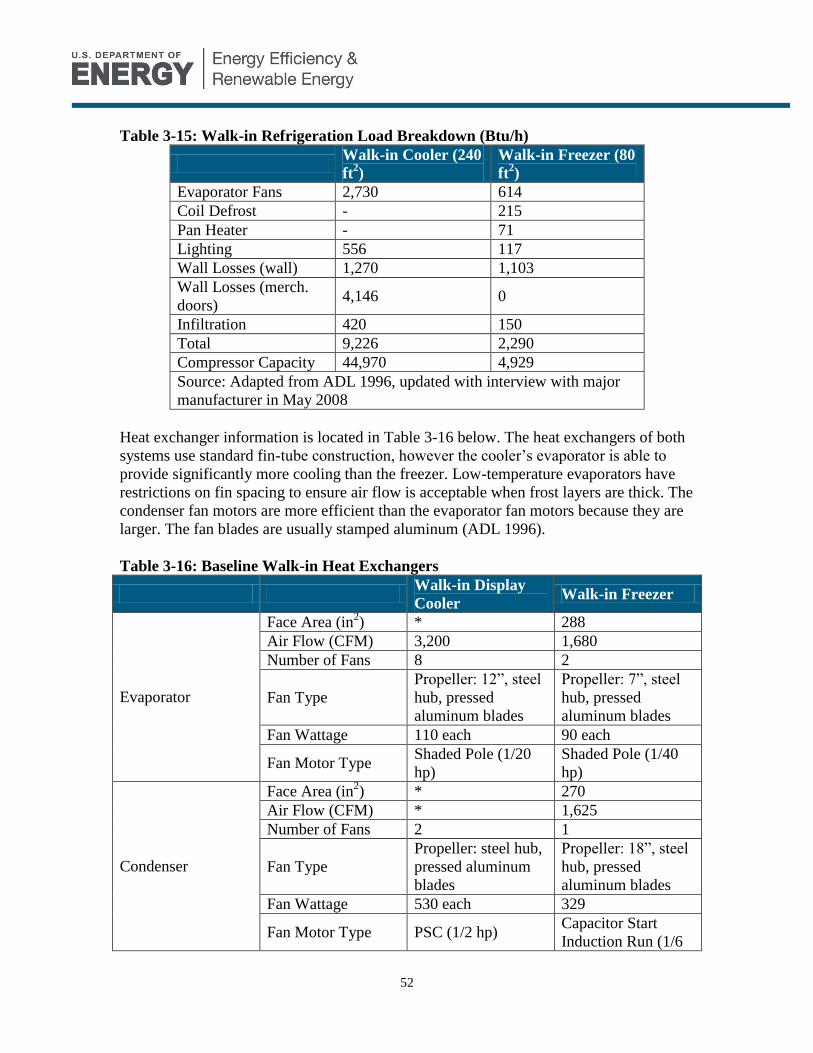
52
Table 3-15: Walk-in Refrigeration Load Breakdown (Btu/h)
Walk-in Cooler (240
ft2)
Walk-in Freezer (80
ft2)
Evaporator Fans 2,730 614
Coil Defrost - 215
Pan Heater - 71
Lighting 556 117
Wall Losses (wall) 1,270 1,103
Wall Losses (merch.
doors) 4,146 0
Infiltration 420 150
Total 9,226 2,290
Compressor Capacity 44,970 4,929
Source: Adapted from ADL 1996, updated with interview with major
manufacturer in May 2008
Heat exchanger information is located in Table 3-16 below. The heat exchangers of both
systems use standard fin-tube construction, however the cooler’s evaporator is able to
provide significantly more cooling than the freezer. Low-temperature evaporators have
restrictions on fin spacing to ensure air flow is acceptable when frost layers are thick. The
condenser fan motors are more efficient than the evaporator fan motors because they are
larger. The fan blades are usually stamped aluminum (ADL 1996).
Table 3-16: Baseline Walk-in Heat Exchangers
Walk-in Display
Cooler Walk-in Freezer
Evaporator
Face Area (in2) * 288
Air Flow (CFM) 3,200 1,680
Number of Fans 8 2
Fan Type
Propeller: 12”, steel
hub, pressed
aluminum blades
Propeller: 7”, steel
hub, pressed
aluminum blades
Fan Wattage 110 each 90 each
Fan Motor Type Shaded Pole (1/20
hp)
Shaded Pole (1/40
hp)
Condenser
Face Area (in2) * 270
Air Flow (CFM) * 1,625
Number of Fans 2 1
Fan Type
Propeller: steel hub,
pressed aluminum
blades
Propeller: 18”, steel
hub, pressed
aluminum blades
Fan Wattage 530 each 329
Fan Motor Type PSC (1/2 hp) Capacitor Start
Induction Run (1/6
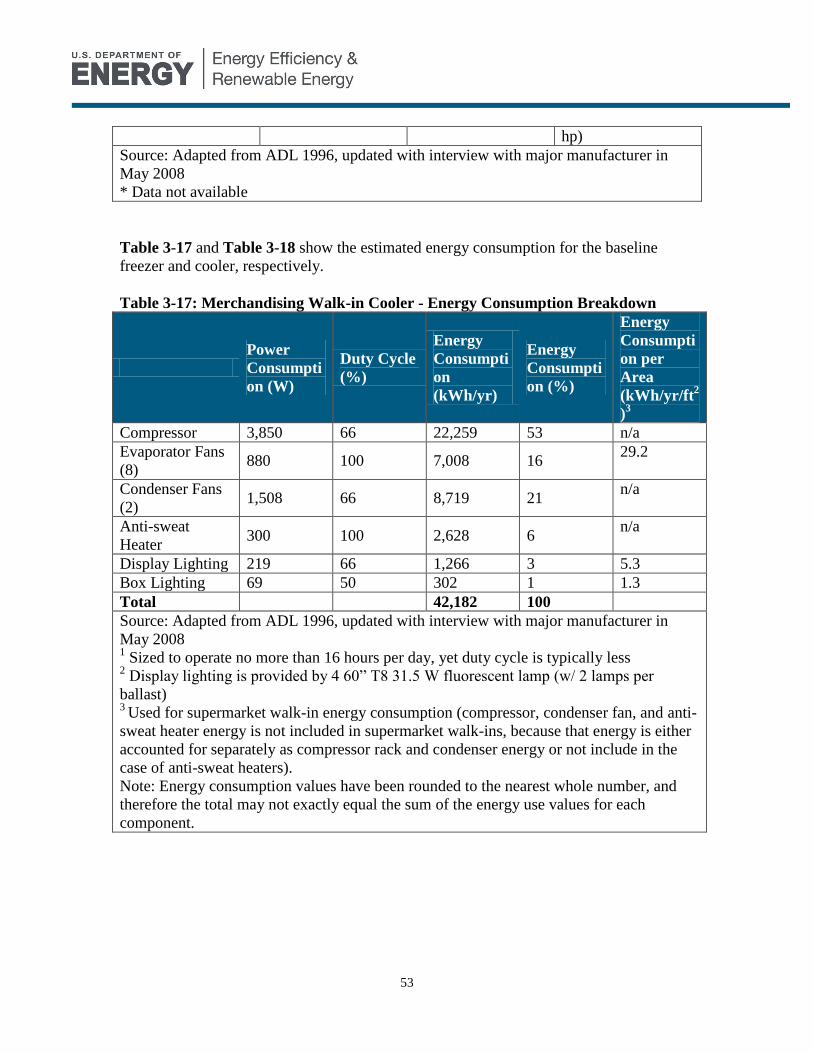
53
hp)
Source: Adapted from ADL 1996, updated with interview with major manufacturer in
May 2008
* Data not available
Table 3-17 and Table 3-18 show the estimated energy consumption for the baseline
freezer and cooler, respectively.
Table 3-17: Merchandising Walk-in Cooler - Energy Consumption Breakdown
Power
Consumpti
on (W)
Duty Cycle
(%)
Energy
Consumpti
on
(kWh/yr)
Energy
Consumpti
on (%)
Energy
Consumpti
on per
Area
(kWh/yr/ft2
)3
Compressor 3,850 66 22,259 53 n/a
Evaporator Fans
(8) 880 100 7,008 16
29.2
Condenser Fans
(2) 1,508 66 8,719 21
n/a
Anti-sweat
Heater 300 100 2,628 6
n/a
Display Lighting 219 66 1,266 3 5.3
Box Lighting 69 50 302 1 1.3
Total 42,182 100
Source: Adapted from ADL 1996, updated with interview with major manufacturer in
May 2008 1 Sized to operate no more than 16 hours per day, yet duty cycle is typically less
2 Display lighting is provided by 4 60” T8 31.5 W fluorescent lamp (w/ 2 lamps per
ballast) 3
Used for supermarket walk-in energy consumption (compressor, condenser fan, and anti-
sweat heater energy is not included in supermarket walk-ins, because that energy is either
accounted for separately as compressor rack and condenser energy or not include in the
case of anti-sweat heaters).
Note: Energy consumption values have been rounded to the nearest whole number, and
therefore the total may not exactly equal the sum of the energy use values for each
component.

54
Table 3-18: Storage-only Walk-in Freezer - Energy Consumption Breakdown
Power
Consumpti
on (W)
Duty Cycle
(%)
Energy
Consumpti
on
(kWh/yr)
Energy
Consumpti
on (%)
Energy
Consumpti
on per
Area
(kWh/yr/ft2
)3
Compressor 1,445 70 8,861 57 n/a
Evaporator Fans
(2) 180 100 1,577 10
19.7
Condenser Fan 329 70 2,017 13 n/a
Coil Defrost 1 1,500 4 548 4 6.8
Drip Pan Heater
2
500 4 183 1 2.3
Anti-sweat
Heater 230 100 2,015 13
n/a
Lighting 74 50 324 2 4.1
Total 15,524 100
Source: Adapted from ADL 1996, updated with interview with major manufacturer in
May 2008 1, 2
Coil defrost and drip pan heater operated for 60 minutes every 24 hours 3
Used for supermarket walk-in energy consumption (compressor, condenser fan, and anti-
sweat heater energy is not included in supermarket walk-ins, because that energy is either
accounted for separately as compressor rack and condenser energy or not include in the
case of anti-sweat heaters).
Note: Energy consumption values have been rounded to the nearest whole number, and
therefore the total may not exactly equal the sum of the energy use values for each
component.
3.2.3 Purchase and Installation Costs
The purchase prices for a 10’ x 24’ cooler with a floor and merchandising doors and an 8’
x 10’ packaged freezer are shown in Table 3-19. These two units represent the baseline
units described above.
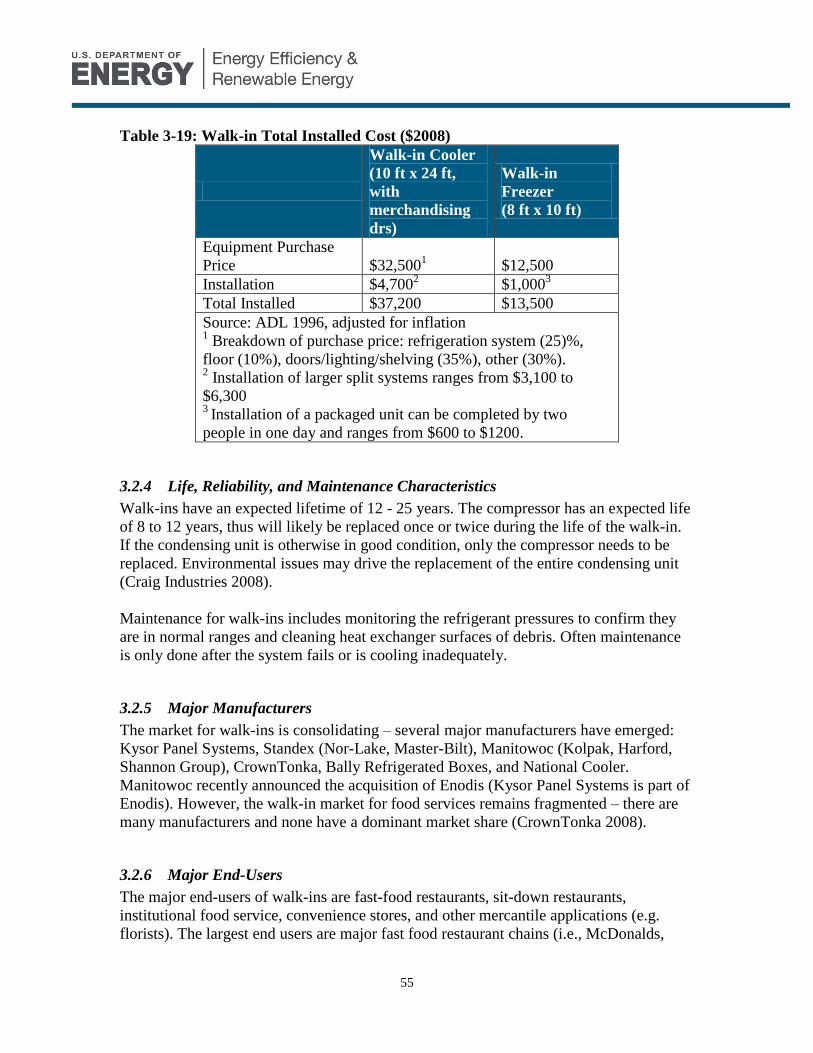
55
Table 3-19: Walk-in Total Installed Cost ($2008)
Walk-in Cooler
(10 ft x 24 ft,
with
merchandising
drs)
Walk-in
Freezer
(8 ft x 10 ft)
Equipment Purchase
Price $32,5001 $12,500
Installation $4,7002 $1,000
3
Total Installed $37,200 $13,500
Source: ADL 1996, adjusted for inflation 1 Breakdown of purchase price: refrigeration system (25)%,
floor (10%), doors/lighting/shelving (35%), other (30%). 2 Installation of larger split systems ranges from $3,100 to
$6,300 3
Installation of a packaged unit can be completed by two
people in one day and ranges from $600 to $1200.
3.2.4 Life, Reliability, and Maintenance Characteristics
Walk-ins have an expected lifetime of 12 - 25 years. The compressor has an expected life
of 8 to 12 years, thus will likely be replaced once or twice during the life of the walk-in.
If the condensing unit is otherwise in good condition, only the compressor needs to be
replaced. Environmental issues may drive the replacement of the entire condensing unit
(Craig Industries 2008).
Maintenance for walk-ins includes monitoring the refrigerant pressures to confirm they
are in normal ranges and cleaning heat exchanger surfaces of debris. Often maintenance
is only done after the system fails or is cooling inadequately.
3.2.5 Major Manufacturers
The market for walk-ins is consolidating – several major manufacturers have emerged:
Kysor Panel Systems, Standex (Nor-Lake, Master-Bilt), Manitowoc (Kolpak, Harford,
Shannon Group), CrownTonka, Bally Refrigerated Boxes, and National Cooler.
Manitowoc recently announced the acquisition of Enodis (Kysor Panel Systems is part of
Enodis). However, the walk-in market for food services remains fragmented – there are
many manufacturers and none have a dominant market share (CrownTonka 2008).
3.2.6 Major End-Users
The major end-users of walk-ins are fast-food restaurants, sit-down restaurants,
institutional food service, convenience stores, and other mercantile applications (e.g.
florists). The largest end users are major fast food restaurant chains (i.e., McDonalds,
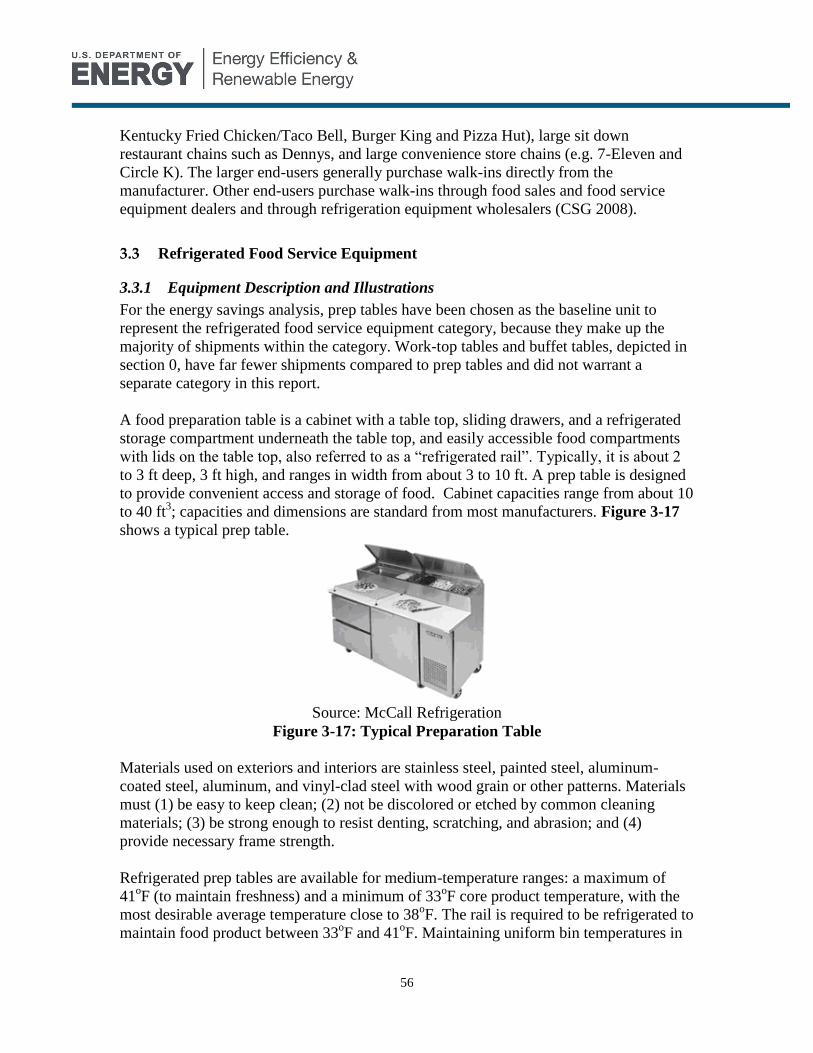
56
Kentucky Fried Chicken/Taco Bell, Burger King and Pizza Hut), large sit down
restaurant chains such as Dennys, and large convenience store chains (e.g. 7-Eleven and
Circle K). The larger end-users generally purchase walk-ins directly from the
manufacturer. Other end-users purchase walk-ins through food sales and food service
equipment dealers and through refrigeration equipment wholesalers (CSG 2008).
3.3 Refrigerated Food Service Equipment
3.3.1 Equipment Description and Illustrations
For the energy savings analysis, prep tables have been chosen as the baseline unit to
represent the refrigerated food service equipment category, because they make up the
majority of shipments within the category. Work-top tables and buffet tables, depicted in
section 0, have far fewer shipments compared to prep tables and did not warrant a
separate category in this report.
A food preparation table is a cabinet with a table top, sliding drawers, and a refrigerated
storage compartment underneath the table top, and easily accessible food compartments
with lids on the table top, also referred to as a “refrigerated rail”. Typically, it is about 2
to 3 ft deep, 3 ft high, and ranges in width from about 3 to 10 ft. A prep table is designed
to provide convenient access and storage of food. Cabinet capacities range from about 10
to 40 ft3; capacities and dimensions are standard from most manufacturers. Figure 3-17
shows a typical prep table.
Source: McCall Refrigeration
Figure 3-17: Typical Preparation Table
Materials used on exteriors and interiors are stainless steel, painted steel, aluminum-
coated steel, aluminum, and vinyl-clad steel with wood grain or other patterns. Materials
must (1) be easy to keep clean; (2) not be discolored or etched by common cleaning
materials; (3) be strong enough to resist denting, scratching, and abrasion; and (4)
provide necessary frame strength.
Refrigerated prep tables are available for medium-temperature ranges: a maximum of
41oF (to maintain freshness) and a minimum of 33
oF core product temperature, with the
most desirable average temperature close to 38oF. The rail is required to be refrigerated to
maintain food product between 33oF and 41
oF. Maintaining uniform bin temperatures in
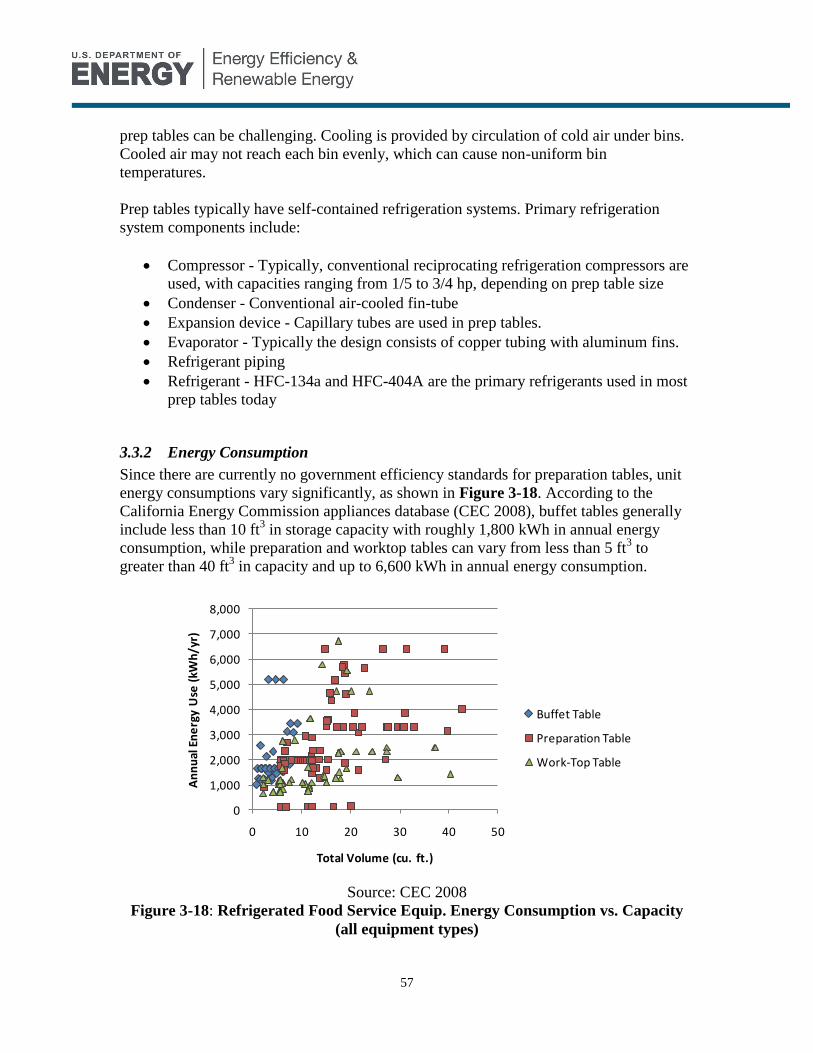
57
prep tables can be challenging. Cooling is provided by circulation of cold air under bins.
Cooled air may not reach each bin evenly, which can cause non-uniform bin
temperatures.
Prep tables typically have self-contained refrigeration systems. Primary refrigeration
system components include:
Compressor - Typically, conventional reciprocating refrigeration compressors are
used, with capacities ranging from 1/5 to 3/4 hp, depending on prep table size
Condenser - Conventional air-cooled fin-tube
Expansion device - Capillary tubes are used in prep tables.
Evaporator - Typically the design consists of copper tubing with aluminum fins.
Refrigerant piping
Refrigerant - HFC-134a and HFC-404A are the primary refrigerants used in most
prep tables today
3.3.2 Energy Consumption
Since there are currently no government efficiency standards for preparation tables, unit
energy consumptions vary significantly, as shown in Figure 3-18. According to the
California Energy Commission appliances database (CEC 2008), buffet tables generally
include less than 10 ft3 in storage capacity with roughly 1,800 kWh in annual energy
consumption, while preparation and worktop tables can vary from less than 5 ft3 to
greater than 40 ft3 in capacity and up to 6,600 kWh in annual energy consumption.
Source: CEC 2008
Figure 3-18: Refrigerated Food Service Equip. Energy Consumption vs. Capacity
(all equipment types)
0
1,000
2,000
3,000
4,000
5,000
6,000
7,000
8,000
0 10 20 30 40 50
An
nu
al E
ne
rgy
Use
(kW
h/y
r)
Total Volume (cu. ft.)
Buffet Table
Preparation Table
Work-Top Table
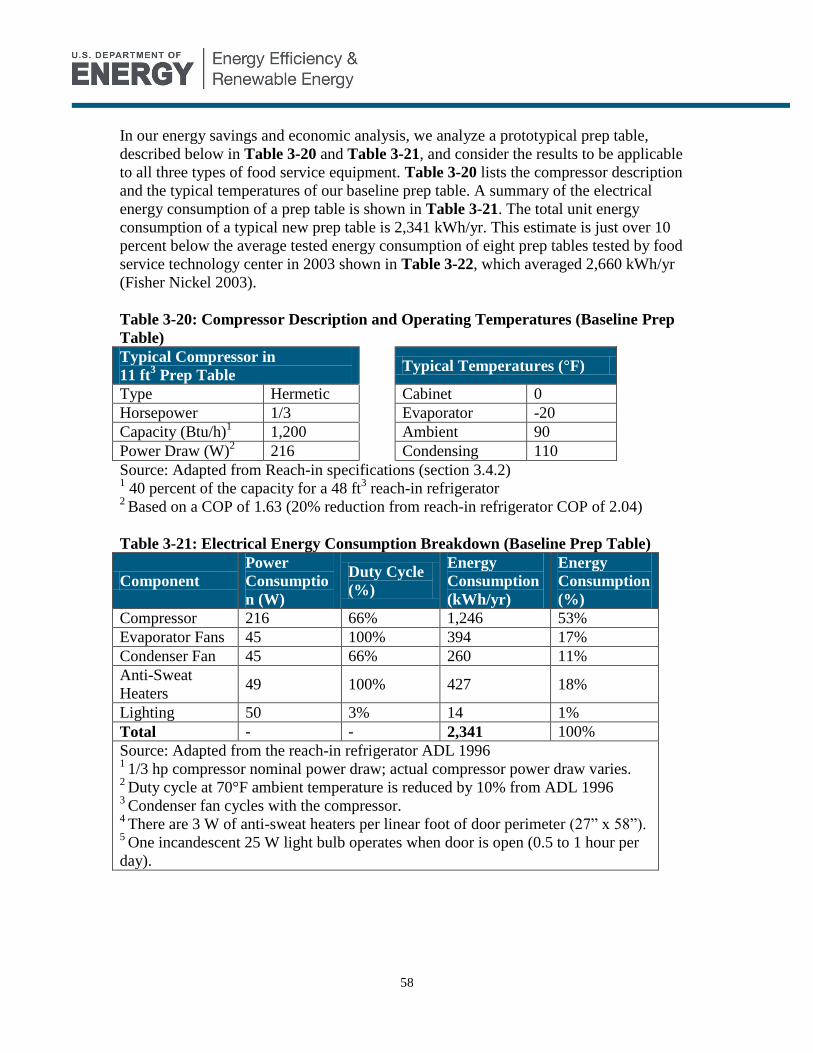
58
In our energy savings and economic analysis, we analyze a prototypical prep table,
described below in Table 3-20 and Table 3-21, and consider the results to be applicable
to all three types of food service equipment. Table 3-20 lists the compressor description
and the typical temperatures of our baseline prep table. A summary of the electrical
energy consumption of a prep table is shown in Table 3-21. The total unit energy
consumption of a typical new prep table is 2,341 kWh/yr. This estimate is just over 10
percent below the average tested energy consumption of eight prep tables tested by food
service technology center in 2003 shown in Table 3-22, which averaged 2,660 kWh/yr
(Fisher Nickel 2003).
Table 3-20: Compressor Description and Operating Temperatures (Baseline Prep
Table)
Typical Compressor in
11 ft3 Prep Table
Typical Temperatures (°F)
Type Hermetic Cabinet 0
Horsepower 1/3 Evaporator -20
Capacity (Btu/h)1 1,200 Ambient 90
Power Draw (W)2 216 Condensing 110
Source: Adapted from Reach-in specifications (section 3.4.2) 1 40 percent of the capacity for a 48 ft
3 reach-in refrigerator
2 Based on a COP of 1.63 (20% reduction from reach-in refrigerator COP of 2.04)
Table 3-21: Electrical Energy Consumption Breakdown (Baseline Prep Table)
Component
Power
Consumptio
n (W)
Duty Cycle
(%)
Energy
Consumption
(kWh/yr)
Energy
Consumption
(%)
Compressor 216 66% 1,246 53%
Evaporator Fans 45 100% 394 17%
Condenser Fan 45 66% 260 11%
Anti-Sweat
Heaters 49 100% 427 18%
Lighting 50 3% 14 1%
Total - - 2,341 100%
Source: Adapted from the reach-in refrigerator ADL 1996 1
1/3 hp compressor nominal power draw; actual compressor power draw varies. 2
Duty cycle at 70°F ambient temperature is reduced by 10% from ADL 1996 3
Condenser fan cycles with the compressor. 4
There are 3 W of anti-sweat heaters per linear foot of door perimeter (27” x 58”). 5
One incandescent 25 W light bulb operates when door is open (0.5 to 1 hour per
day).

59
Table 3-22: Prep Table Characteristics
Test Unit
Dimensions
(in)
(W x D x H)
Refrigerated
Storage
Volume (ft3)
Power Draw
(W)
(Lid Up/Lid
Down1
Unit Energy
Consumption
(kWh/yr)
1 44 x 20 x 17.5 8.9 208 / 151 1,717
2 26 x 25.5 x
17.5 6.7 376 / 298 2,912
3 45 x 27 x 26 18.3 268 / 167 1,882
4 41.5 x 17 x 22 9.0 463 / 232 3,004
5 44.5 x 24.5 x
24.5 15.5 304 / 255 2,416
6 44 x 24 x 20 12.2 423 / 413 3,611
7 41.5 x 17 x 22 9.0 334 / 324 2,842
8 26 x 25.5 x
17.5 6.7 386 / 281 2,880
Average 10.8 2,660
Source: Fisher-Nickel 2003 1
Lid refers to the cover over the bins on the refrigerated rail.
3.3.3 Purchase and Installation Costs
The refrigerated food service equipment market is very competitive with many
manufacturers, resulting in little price increase over the past few years. Table 3-23 lists
typical 2008 equipment and installation costs for these refrigerators. This report
designates the preparation table to be the baseline unit for the energy savings analysis.
Table 3-23: Refrigerated Food Service Equipment Total Installed Costs ($2008)
Preparation
Table Worktop Table
Buffet Table
Equipment Purchase
Price $1,200-$3,800 $1,600-$4,300
$1,700-$2,900
Installation $150 $150 $150
Total Installed $1,350-$3,950 $1,750-$4,450 $1,850-$3,050
Source: List prices from refrigerated food service equipment manufacturer websites
were converted to equipment purchase prices using the markups described in 0.
Installation cost estimated by NCI.
3.3.4 Life, Reliability, and Maintenance Characteristics
According to the North American Food Equipment Manufacturers (NAFEM), the typical
life of a reach-in is 8 to 10 years (see discussion in Section 4.4 below). Refrigerated food

60
service equipment is estimated to have the comparable life expectancy to reach-in
refrigerators because of their similar construction.
Recommended refrigeration system maintenance includes cleaning the condenser coil to
keep it clear of debris and dust.
3.3.5 Major Manufacturers
Major refrigerated food service equipment manufacturers include:
True Manufacturing Company
Delfield Refrigeration
Continental Refrigerator
McCall Refrigeration
Victory Refrigeration
Beverage-Air
3.3.6 Major End-Users
Refrigerated food service equipment is used in full-service restaurants, fast-food
restaurants, and institutional foodservice establishments in buildings such as hospitals,
schools, and office buildings. The largest end-users are large fast-food chains. The
market for these equipment types is very fragmented due to the large variety and number
of restaurants and other users.
3.4 Reach-Ins
3.4.1 Equipment Description and Illustrations
Reach-In Freezers
Reach-in freezers store frozen food products for commercial and institutional foodservice
establishments. This section describes the characteristics of a baseline reach-in freezer,
which are assumed to be typical of a new unit today.
Figure 3-19 shows a typical one-door reach-in freezer. Its storage capacity is about 24 ft3.
The case is typically insulated to an R-value between 15 and 20 with 2 to 2.5 inches of
blown polyurethane foam. The unit typically stands on four casters (as shown in Figure
3-19) or adjustable legs. The cabinet and the doors are usually stainless steel. Anti-sweat
heaters located along the door perimeter prevent condensation and frosting on the gasket
and cabinet frame regions adjacent to the gasket. There is one incandescent light
(typically 25W) inside the freezer that operates when the freezer door is open. The
evaporator coil has an electric defrost heater with about 600W capacity that utilizes timed
initiation and temperature termination control. This control scheme involves initiation of
defrost based on a time schedule, and termination of defrost when the evaporator has
reached a temperature indicating that frost has melted.

61
Source: Beverage-Air
Figure 3-19: One-Door Solid-door Reach-In Freezer
Table 3-24 summarizes the physical characteristics of the prototypical baseline reach-in
freezer. The refrigeration system is located at the top of the unit. This configuration keeps
refrigeration components away from spills and other debris unique to foodservice
establishments, and reduces accumulation of dust on the condenser.
Table 3-24: Baseline Refrigerated cabinet description – Reach-In Freezers
Exterior
Dimensions
Interior
Dimensions Insulation Shelves Door
W
(in)
D
(in)
H
(in)
W
(in
)
D
(in)
H
(in
)
Thickne
ss (in)
R-
Value/in
(ft2°F/Btu
h)
#
Tot.
Shelf
Space(ft2)
Type
30 32 83 25 27 58 2-2.5 6.5-7 3 15 Stainless
Steel
Source: ADL 1996, confirmed with a survey of product literature found on major
manufacturer websites
The refrigeration system components of the baseline reach-in freezer consist of a ½ hp
hermetic compressor, one 9-Watt shaded pole evaporator fan and one 1/20 hp PSC
condenser fan. Refrigerant flow is governed by a thermostatic expansion valve. Most
units manufactured today use either shaded pole or permanent split capacitor fan motors.
Reach-in freezers typically use R-404A, as do most low temperature self-contained
equipment.
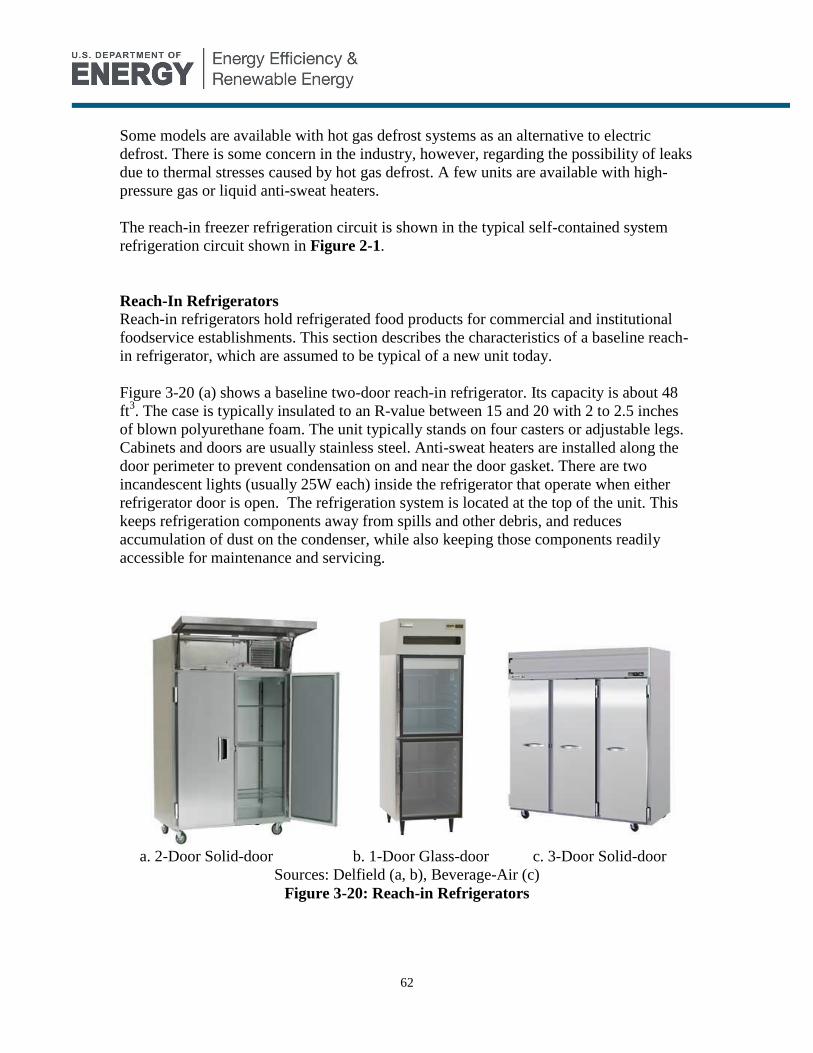
62
Some models are available with hot gas defrost systems as an alternative to electric
defrost. There is some concern in the industry, however, regarding the possibility of leaks
due to thermal stresses caused by hot gas defrost. A few units are available with high-
pressure gas or liquid anti-sweat heaters.
The reach-in freezer refrigeration circuit is shown in the typical self-contained system
refrigeration circuit shown in Figure 2-1.
Reach-In Refrigerators
Reach-in refrigerators hold refrigerated food products for commercial and institutional
foodservice establishments. This section describes the characteristics of a baseline reach-
in refrigerator, which are assumed to be typical of a new unit today.
Figure 3-20 (a) shows a baseline two-door reach-in refrigerator. Its capacity is about 48
ft3. The case is typically insulated to an R-value between 15 and 20 with 2 to 2.5 inches
of blown polyurethane foam. The unit typically stands on four casters or adjustable legs.
Cabinets and doors are usually stainless steel. Anti-sweat heaters are installed along the
door perimeter to prevent condensation on and near the door gasket. There are two
incandescent lights (usually 25W each) inside the refrigerator that operate when either
refrigerator door is open. The refrigeration system is located at the top of the unit. This
keeps refrigeration components away from spills and other debris, and reduces
accumulation of dust on the condenser, while also keeping those components readily
accessible for maintenance and servicing.
a. 2-Door Solid-door b. 1-Door Glass-door c. 3-Door Solid-door
Sources: Delfield (a, b), Beverage-Air (c)
Figure 3-20: Reach-in Refrigerators

63
Table 3-25 summarizes the physical characteristics of the baseline two-door reach-in
refrigerator.
Table 3-25: Refrigerated Cabinet Description – Reach-in refrigerators
Exterior
Dimensions
Interior
Dimensions Insulation Shelves Door
W
(in)
D
(in)
H
(in)
W
(in)
D
(in)
H
(in)
Thicknes
s (in)
R-
Value/in
(ft2°F/Btu
h)
#
Tot.
Shelf
Space(ft2)
Type
52 32 83 48 27 58 2-2.5 6.5-7 6 30 Stainles
s Steel
Source: ADL 1996
The baseline refrigeration system components consist of a 1/3 hp hermetic compressor,
two 9-Watt PSC evaporator fans and one 1/20 hp PSC condenser fan. Refrigerant flow is
governed by a capillary tube expansion device. Most units manufactured today use either
shaded pole or permanent split capacitor fan motors. Like most medium temperature
self-contained equipment, reach-in refrigerators typically use HFC-134a refrigerant.
Although reach-in refrigerators typically do not use defrost heaters, they do make use of
off-cycle defrost to prevent build-up of frost on the evaporator. During an off-cycle, the
evaporator fan continues to run to assure adequate evaporation of moisture to keep
internal humidity levels appropriate for such foods as produce.
The reach-in refrigerator refrigeration circuit is well represented by the typical self-
contained system refrigeration circuit shown in Figure 2-1.
Reach-In Refrigerator-Freezers
Reach-in refrigerator-freezers hold refrigerated and frozen food products for commercial
and institutional foodservice establishments.
Figure 3-21 shows a typical two-door reach-in refrigerator-freezer. Its capacity is about
48 ft3. The case is typically insulated to an R-value between 15 and 20 with 2 to 2.5
inches of blown polyurethane foam. Cabinets and doors are usually stainless steel. Anti-
sweat heaters are installed along the door perimeter to prevent condensation on and near
the door gasket. There are two incandescent lights (usually 25W each) inside the
refrigerator that operate when either refrigerator door is open.

64
Source: Traulsen
Figure 3-21: Two-door, Solid-door Reach-in Refrigerator-Freezer
Refrigerator-Freezers typically have separate refrigeration systems serving the freezer
and refrigerator compartments. They use R-404A in for the freezer compartment and R-
134a for the refrigerator compartment. Most units manufactured today use either shaded
pole or permanent split capacitor fan motors. Standard operating temperatures are 34 to
38°F for the refrigerator compartment and -5 to 0°F for the freezer compartment.
3.4.2 Energy Consumption
Reach-in Freezers
Characterization of the energy consumption breakdown for the baseline reach-in freezer
is based on the one-door unit because it is the most common unit.
The annual unit energy consumption (UEC) of a typical reach-in freezer was estimated
using the data found in the California Energy Commission Appliances Database (CEC
2008). The CEC Appliances Database contains all appliances, including reach-in
freezers, currently certified to the CEC by their manufacturers as meeting currently-
applicable efficiency standards (federal efficiency standards, in the case of reach-ins).
The database lists the physical characteristics and the daily unit energy consumption as
tested by the manufacturer. To estimate the typical UEC, we considered the UEC of all
freezer models between 20 and 28 ft3, the most common size for reach-in freezers. From
that subset, we then found the average UEC by manufacturer and took an average of
those values weighted by manufacturer market share. Table 3-26 shows the data used for
these calculations.
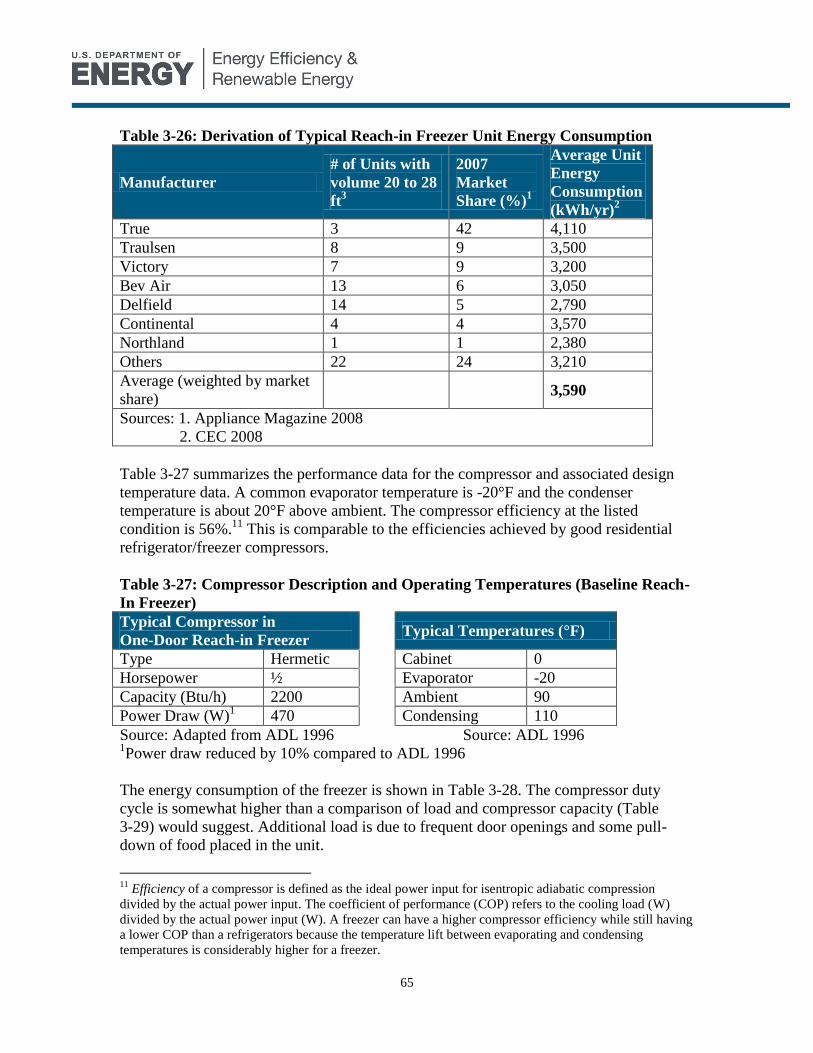
65
Table 3-26: Derivation of Typical Reach-in Freezer Unit Energy Consumption
Manufacturer
# of Units with
volume 20 to 28
ft3
2007
Market
Share (%)1
Average Unit
Energy
Consumption
(kWh/yr)2
True 3 42 4,110
Traulsen 8 9 3,500
Victory 7 9 3,200
Bev Air 13 6 3,050
Delfield 14 5 2,790
Continental 4 4 3,570
Northland 1 1 2,380
Others 22 24 3,210
Average (weighted by market
share) 3,590
Sources: 1. Appliance Magazine 2008
2. CEC 2008
Table 3-27 summarizes the performance data for the compressor and associated design
temperature data. A common evaporator temperature is -20°F and the condenser
temperature is about 20°F above ambient. The compressor efficiency at the listed
condition is 56%.11
This is comparable to the efficiencies achieved by good residential
refrigerator/freezer compressors.
Table 3-27: Compressor Description and Operating Temperatures (Baseline Reach-
In Freezer)
Typical Compressor in
One-Door Reach-in Freezer Typical Temperatures (°F)
Type Hermetic Cabinet 0
Horsepower ½ Evaporator -20
Capacity (Btu/h) 2200 Ambient 90
Power Draw (W)1 470 Condensing 110
Source: Adapted from ADL 1996 Source: ADL 1996 1Power draw reduced by 10% compared to ADL 1996
The energy consumption of the freezer is shown in Table 3-28. The compressor duty
cycle is somewhat higher than a comparison of load and compressor capacity (Table
3-29) would suggest. Additional load is due to frequent door openings and some pull-
down of food placed in the unit.
11
Efficiency of a compressor is defined as the ideal power input for isentropic adiabatic compression
divided by the actual power input. The coefficient of performance (COP) refers to the cooling load (W)
divided by the actual power input (W). A freezer can have a higher compressor efficiency while still having
a lower COP than a refrigerators because the temperature lift between evaporating and condensing
temperatures is considerably higher for a freezer.

66
Table 3-28: Electrical Energy Consumption Breakdown (Baseline Reach-In Freezer)
Component
Power
Consumptio
n (W)
Duty Cycle
(%)
Energy
Consumption
(kWh/yr)
Energy
Consumption
(%)
Compressor 4701 65
2 2,670 67.5
Evaporator Fans 21 100 184 4.5
Condenser Fan 70 652, 3
398.5 10
Anti-Sweat
Heaters 43
4 100 372 9.5
Electric Defrost 600 6.25 328.5 8
Lighting 25 3.1255
7 0.5
Total 3,960 100.0
Source: Adapted from ADL 1996 1
1/3 hp compressor nominal power draw; actual compressor power draw varies. 2
Duty cycle at 70°F ambient temperature is reduced by 10% from ADL 1996 3
Condenser fan cycles with the compressor. 4
There are 3 W of anti-sweat heaters per linear foot of door perimeter (27” x 58”). 5
One incandescent 25 W light bulb operates when door is open (0.5 to 1 hour per
day).
Note: Energy consumption values have been rounded to the nearest whole number,
and therefore the total may not exactly equal the sum of the energy use values for
each component.
Table 3-29 shows the typical load breakdown for the baseline reach-in freezer.
Table 3-29: Thermal Load Breakdown (Reach-in Freezers)
Component Thermal Load
(Btu/h)
Evaporator Fans 68
Lighting 3
Infiltration 41
Wall Losses 329
Defrost 128
Anti-sweat Heating 73*
Total 642
Compressor Capacity 2200
Source: Adapted from ADL 1996
*Includes an estimated 50% of anti-sweat consumption that contributes to the cabinet
load.
Reach-In Refrigerators
To characterize the energy consumption breakdown for the baseline reach-in refrigerator,
we chose the two-door unit since it is the most common unit currently used.

67
The same method of calculation of annual UEC that was used for reach-in freezers above
was used for reach-in refrigerators, but in this case, we considered refrigerator models
between 42 and 56 ft3, the most common size for reach-in refrigerators. Table 3-30
shows the data used for the refrigerator calculations.
Table 3-30: Derivation of Typical Reach-in Refrigerator Unit Energy Consumption
Manufacturer
# of Units in
Database with
Volume 42 to 56
ft3
2007
Market
Share (%)1
Average Unit
Energy
Consumption
(kWh/day)2
True 9 42 2,320
Traulsen 20 9 2,510
Victory 12 9 2,200
Bev Air 13 6 2,310
Delfield 28 5 1,930
Continental 4 4 1,650
Others 93 25 2,380
Average (weighted by market
share) 2,270
Sources: 1. Appliance Magazine 2008
2. CEC 2008
The annual energy consumption of a typical reach-in refrigerator is estimated using the
California Energy Commission Appliances Database (CEC 2008). The average unit
energy consumption of current models is assumed to be 2,270 kWh per year.
Table 3-31 summarizes the characteristics of the compressor and the associated design
temperatures. The evaporator temperature is usually about 20°F and the condenser
temperature typically runs about 20°F above ambient air temperature. The compressor
efficiency at the listed condition is 48%. This compares with efficiencies in the high 50’s,
which are achieved with good residential refrigerator compressors. There has historically
been little incentive to develop high efficiency compressors for commercial refrigeration
due to the lack of stringent federal standards until recently, the far lower sales volumes of
these compressors compared to the residential market, and the perceived need for instant
restart in commercial applications due to the severe duty cycle that results from frequent
door openings. For instant restart, the starting circuit must be much more powerful than
is necessary for residential compressors.
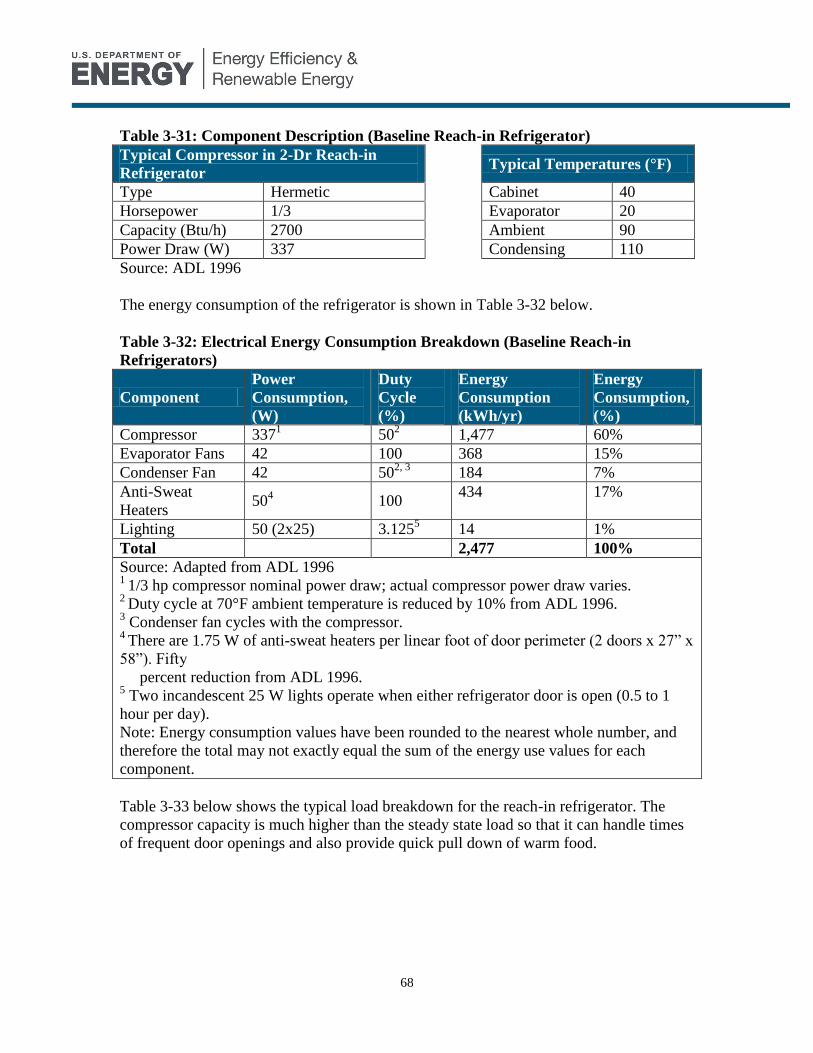
68
Table 3-31: Component Description (Baseline Reach-in Refrigerator)
Typical Compressor in 2-Dr Reach-in
Refrigerator Typical Temperatures (°F)
Type Hermetic Cabinet 40
Horsepower 1/3 Evaporator 20
Capacity (Btu/h) 2700 Ambient 90
Power Draw (W) 337 Condensing 110
Source: ADL 1996
The energy consumption of the refrigerator is shown in Table 3-32 below.
Table 3-32: Electrical Energy Consumption Breakdown (Baseline Reach-in
Refrigerators)
Component
Power
Consumption,
(W)
Duty
Cycle
(%)
Energy
Consumption
(kWh/yr)
Energy
Consumption,
(%)
Compressor 3371
502
1,477 60%
Evaporator Fans 42 100 368 15%
Condenser Fan 42 502, 3
184 7%
Anti-Sweat
Heaters 50
4 100
434 17%
Lighting 50 (2x25) 3.1255 14 1%
Total 2,477 100%
Source: Adapted from ADL 1996 1
1/3 hp compressor nominal power draw; actual compressor power draw varies. 2
Duty cycle at 70°F ambient temperature is reduced by 10% from ADL 1996. 3 Condenser fan cycles with the compressor.
4 There are 1.75 W of anti-sweat heaters per linear foot of door perimeter (2 doors x 27” x
58”). Fifty
percent reduction from ADL 1996. 5 Two incandescent 25 W lights operate when either refrigerator door is open (0.5 to 1
hour per day).
Note: Energy consumption values have been rounded to the nearest whole number, and
therefore the total may not exactly equal the sum of the energy use values for each
component.
Table 3-33 below shows the typical load breakdown for the reach-in refrigerator. The
compressor capacity is much higher than the steady state load so that it can handle times
of frequent door openings and also provide quick pull down of warm food.
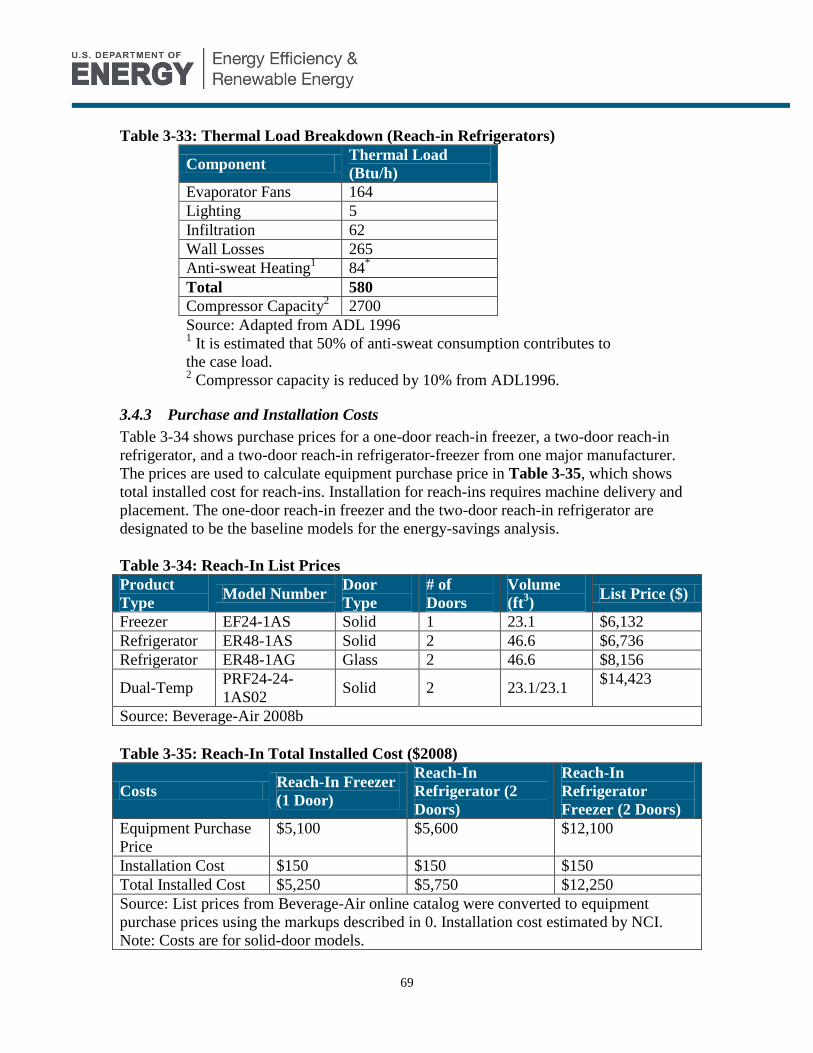
69
Table 3-33: Thermal Load Breakdown (Reach-in Refrigerators)
Component Thermal Load
(Btu/h)
Evaporator Fans 164
Lighting 5
Infiltration 62
Wall Losses 265
Anti-sweat Heating1 84
*
Total 580
Compressor Capacity2 2700
Source: Adapted from ADL 1996 1 It is estimated that 50% of anti-sweat consumption contributes to
the case load. 2 Compressor capacity is reduced by 10% from ADL1996.
3.4.3 Purchase and Installation Costs
Table 3-34 shows purchase prices for a one-door reach-in freezer, a two-door reach-in
refrigerator, and a two-door reach-in refrigerator-freezer from one major manufacturer.
The prices are used to calculate equipment purchase price in Table 3-35, which shows
total installed cost for reach-ins. Installation for reach-ins requires machine delivery and
placement. The one-door reach-in freezer and the two-door reach-in refrigerator are
designated to be the baseline models for the energy-savings analysis.
Table 3-34: Reach-In List Prices
Product
Type Model Number
Door
Type
# of
Doors
Volume
(ft3)
List Price ($)
Freezer EF24-1AS Solid 1 23.1 $6,132
Refrigerator ER48-1AS Solid 2 46.6 $6,736
Refrigerator ER48-1AG Glass 2 46.6 $8,156
Dual-Temp PRF24-24-
1AS02 Solid 2 23.1/23.1
$14,423
Source: Beverage-Air 2008b
Table 3-35: Reach-In Total Installed Cost ($2008)
Costs Reach-In Freezer
(1 Door)
Reach-In
Refrigerator (2
Doors)
Reach-In
Refrigerator
Freezer (2 Doors)
Equipment Purchase
Price
$5,100 $5,600 $12,100
Installation Cost $150 $150 $150
Total Installed Cost $5,250 $5,750 $12,250
Source: List prices from Beverage-Air online catalog were converted to equipment
purchase prices using the markups described in 0. Installation cost estimated by NCI.
Note: Costs are for solid-door models.

70
3.4.4 Life, Reliability, and Maintenance Characteristics
The typical life of a reach-in is 8 to 10 years. According to the North American Food
Equipment Manufacturers (NAFEM), roughly 50% of units purchased by restaurants are
of used equipment.
Typical regular maintenance requirements are to keep the condenser coil clear of debris
and dust. Generally, however, maintenance is only done when there is a problem.
3.4.5 Major Manufacturers
Figure 3-22 shows market share figures for reach-in manufacturers. Reach-ins are
typically marketed as “standard-line” or “specification-line”. Standard-line reach-ins,
which represent about 70% of 200,000 annual sales, are sold primarily to commercial
food establishments. Specification-line reach-ins, which represent the remaining 30% of
sales, are sold to institutional foodservice establishments. There are differences between
the two in cosmetics and durability, but not necessarily in energy consumption.
Within the standard-line market, True Manufacturing is the dominant player, followed by
Beverage-Air. Within the specification-line, Traulsen has the largest market share.
Hobart has historically been another strong player and has recently established a
partnership with Traulsen. Both companies currently sell their reach-ins under the
Traulsen brand. Victory also maintains a large share of the spec-line market.
Source: Appliance Magazine 2008
Figure 3-22: Manufacturer Market Shares for Commercial Refrigerators as of 2007
Reach-In Manufacturer Market Shares (Appliance Mag Sept 2008)
True
Manufacturing
42%
Others
24%
Continental
4%
Northland
1%
Delfield
5%
Beverage Air
6%Traulsen
9%
Victory
9%

71
3.4.6 Major End-Users
Reach-ins are used in full-service restaurants, fast-food restaurants, and institutional
foodservice establishments in buildings such as hospitals, schools, and office buildings.
The largest end-users are large fast-food chains. The market for reach-in refrigerators and
freezers is very fragmented due to the large variety and number of restaurants and other
users.
3.5 Beverage Merchandisers
3.5.1 Equipment Description and Illustrations
Beverage merchandisers hold and display cold beverages (canned or bottled) for self-
service sales in convenience stores, supermarkets, retail stores, and small foodservice
establishments.
Since beverage merchandisers are evaluated primarily on sales enhancement, they must:
maintain a cold beverage temperature (~ 35°F)
make the beverages look appealing (with bright lighting, logo, etc.)
hold a high volume of beverages (~ 900 12 oz. cans maximum without special
organizers)
Bottling companies (Coca-Cola, Pepsi, etc.) who sell their products through these
merchandisers provide refrigeration system performance specifications (pull-down time,
holding temperature, etc.) and merchandiser aesthetics specifications to the manufacturer.
Figure 3-23 shows the physical characteristics of a typical one-door beverage
merchandiser. Its capacity is about 27 ft3. The case is typically insulated to R-11.5 with
1.5 inches of blown polyurethane foam. Doors on most merchandisers in the United
States are made of triple-pane, insulated glass. Double-pane glass with a low-emissivity
coating, a less efficient alternative to triple-pane glass, is used internationally. Some
manufacturers also supply open beverage merchandisers (i.e. without a door). They
represent approximately 5% of the inventory (Beverage-Air 2008a).
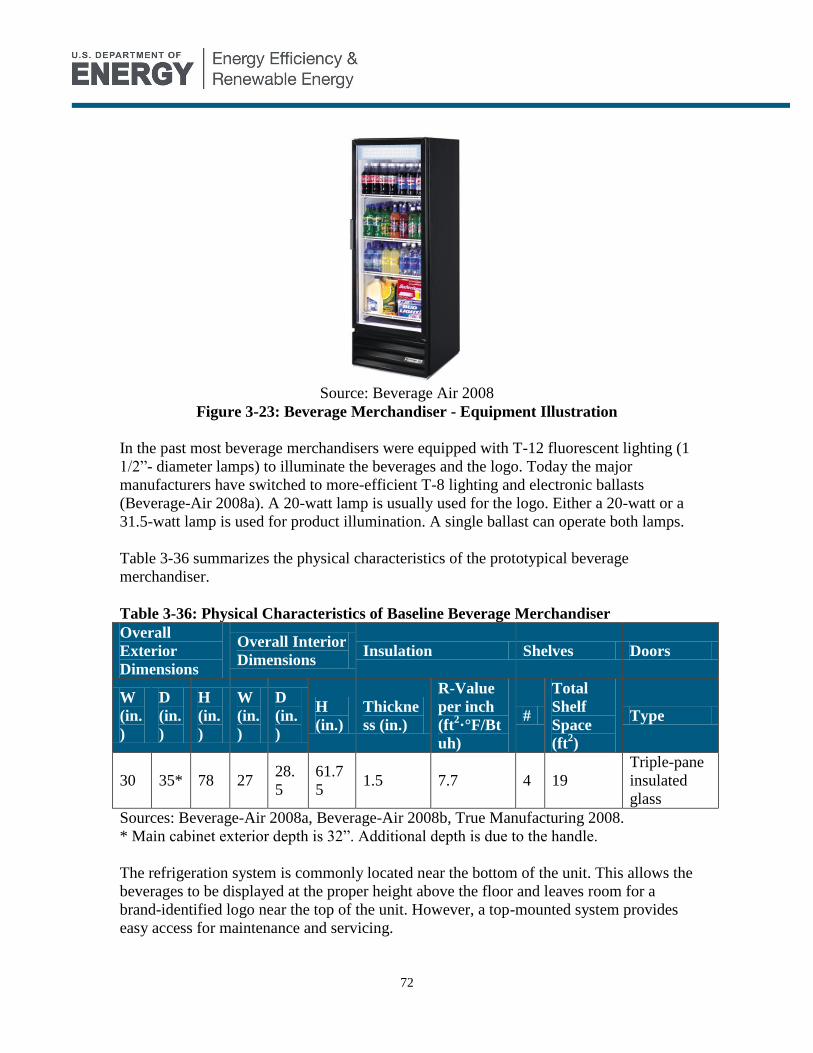
72
Source: Beverage Air 2008
Figure 3-23: Beverage Merchandiser - Equipment Illustration
In the past most beverage merchandisers were equipped with T-12 fluorescent lighting (1
1/2”- diameter lamps) to illuminate the beverages and the logo. Today the major
manufacturers have switched to more-efficient T-8 lighting and electronic ballasts
(Beverage-Air 2008a). A 20-watt lamp is usually used for the logo. Either a 20-watt or a
31.5-watt lamp is used for product illumination. A single ballast can operate both lamps.
Table 3-36 summarizes the physical characteristics of the prototypical beverage
merchandiser.
Table 3-36: Physical Characteristics of Baseline Beverage Merchandiser
Overall
Exterior
Dimensions
Overall Interior
Dimensions Insulation Shelves Doors
W
(in.
)
D
(in.
)
H
(in.
)
W
(in.
)
D
(in.
)
H
(in.)
Thickne
ss (in.)
R-Value
per inch
(ft2·°F/Bt
uh)
#
Total
Shelf
Space
(ft2)
Type
30 35* 78 27 28.
5
61.7
5 1.5 7.7 4 19
Triple-pane
insulated
glass
Sources: Beverage-Air 2008a, Beverage-Air 2008b, True Manufacturing 2008.
* Main cabinet exterior depth is 32”. Additional depth is due to the handle.
The refrigeration system is commonly located near the bottom of the unit. This allows the
beverages to be displayed at the proper height above the floor and leaves room for a
brand-identified logo near the top of the unit. However, a top-mounted system provides
easy access for maintenance and servicing.
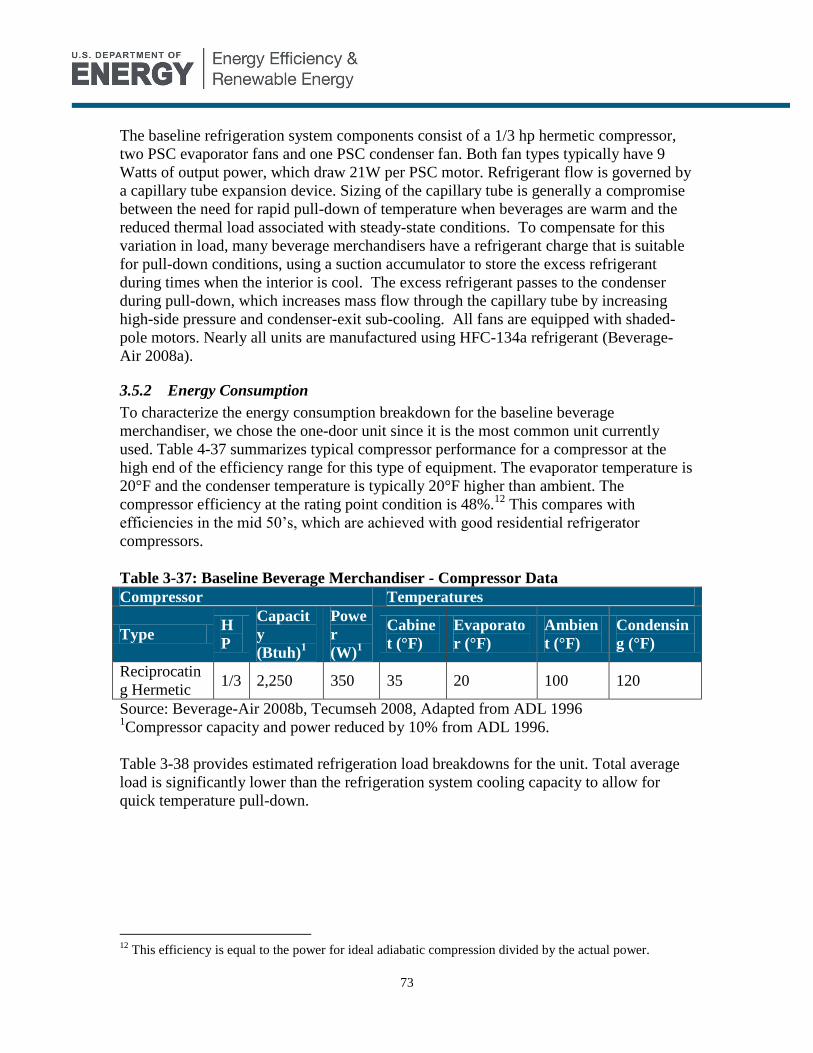
73
The baseline refrigeration system components consist of a 1/3 hp hermetic compressor,
two PSC evaporator fans and one PSC condenser fan. Both fan types typically have 9
Watts of output power, which draw 21W per PSC motor. Refrigerant flow is governed by
a capillary tube expansion device. Sizing of the capillary tube is generally a compromise
between the need for rapid pull-down of temperature when beverages are warm and the
reduced thermal load associated with steady-state conditions. To compensate for this
variation in load, many beverage merchandisers have a refrigerant charge that is suitable
for pull-down conditions, using a suction accumulator to store the excess refrigerant
during times when the interior is cool. The excess refrigerant passes to the condenser
during pull-down, which increases mass flow through the capillary tube by increasing
high-side pressure and condenser-exit sub-cooling. All fans are equipped with shaded-
pole motors. Nearly all units are manufactured using HFC-134a refrigerant (Beverage-
Air 2008a).
3.5.2 Energy Consumption
To characterize the energy consumption breakdown for the baseline beverage
merchandiser, we chose the one-door unit since it is the most common unit currently
used. Table 4-37 summarizes typical compressor performance for a compressor at the
high end of the efficiency range for this type of equipment. The evaporator temperature is
20°F and the condenser temperature is typically 20°F higher than ambient. The
compressor efficiency at the rating point condition is 48%.12
This compares with
efficiencies in the mid 50’s, which are achieved with good residential refrigerator
compressors.
Table 3-37: Baseline Beverage Merchandiser - Compressor Data
Compressor Temperatures
Type H
P
Capacit
y
(Btuh)1
Powe
r
(W)1
Cabine
t (°F)
Evaporato
r (°F)
Ambien
t (°F)
Condensin
g (°F)
Reciprocatin
g Hermetic 1/3 2,250 350 35 20 100 120
Source: Beverage-Air 2008b, Tecumseh 2008, Adapted from ADL 1996 1Compressor capacity and power reduced by 10% from ADL 1996.
Table 3-38 provides estimated refrigeration load breakdowns for the unit. Total average
load is significantly lower than the refrigeration system cooling capacity to allow for
quick temperature pull-down.
12
This efficiency is equal to the power for ideal adiabatic compression divided by the actual power.
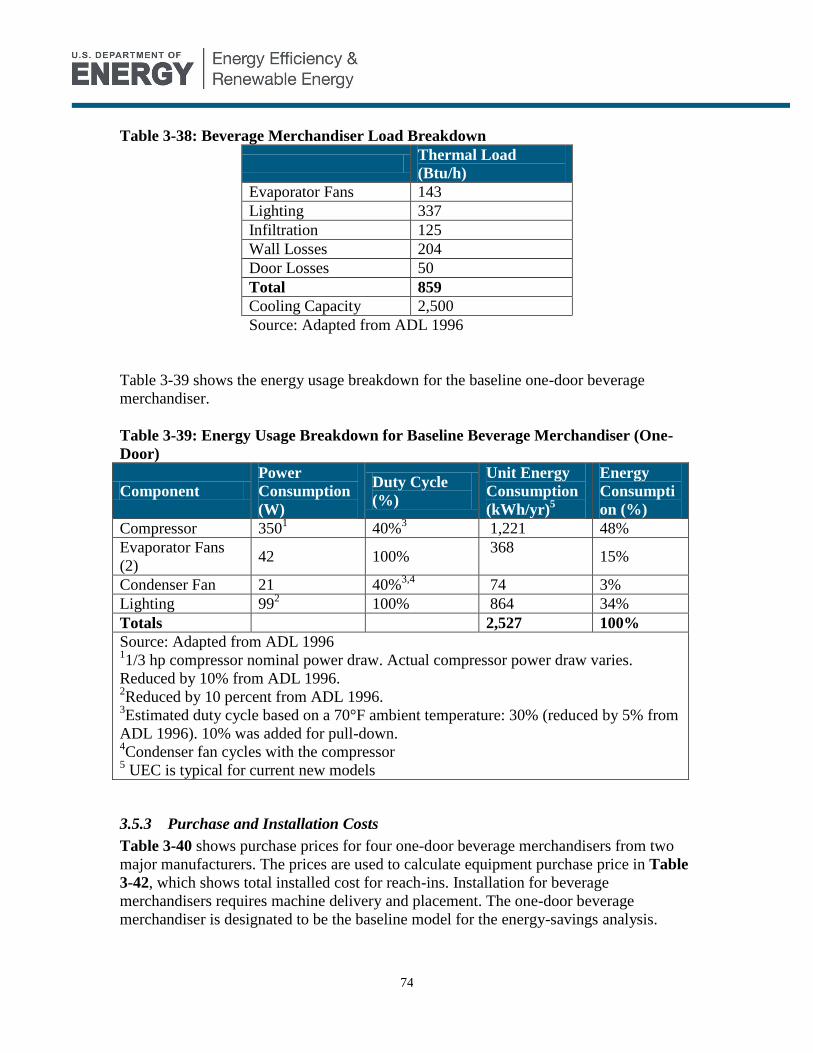
74
Table 3-38: Beverage Merchandiser Load Breakdown
Thermal Load
(Btu/h)
Evaporator Fans 143
Lighting 337
Infiltration 125
Wall Losses 204
Door Losses 50
Total 859
Cooling Capacity 2,500
Source: Adapted from ADL 1996
Table 3-39 shows the energy usage breakdown for the baseline one-door beverage
merchandiser.
Table 3-39: Energy Usage Breakdown for Baseline Beverage Merchandiser (One-
Door)
Component
Power
Consumption
(W)
Duty Cycle
(%)
Unit Energy
Consumption
(kWh/yr)5
Energy
Consumpti
on (%)
Compressor 3501 40%
3 1,221 48%
Evaporator Fans
(2) 42 100%
368 15%
Condenser Fan 21 40%3,4
74 3%
Lighting 992 100% 864 34%
Totals 2,527 100%
Source: Adapted from ADL 1996 11/3 hp compressor nominal power draw. Actual compressor power draw varies.
Reduced by 10% from ADL 1996. 2Reduced by 10 percent from ADL 1996.
3Estimated duty cycle based on a 70°F ambient temperature: 30% (reduced by 5% from
ADL 1996). 10% was added for pull-down. 4Condenser fan cycles with the compressor
5 UEC is typical for current new models
3.5.3 Purchase and Installation Costs
Table 3-40 shows purchase prices for four one-door beverage merchandisers from two
major manufacturers. The prices are used to calculate equipment purchase price in Table
3-42, which shows total installed cost for reach-ins. Installation for beverage
merchandisers requires machine delivery and placement. The one-door beverage
merchandiser is designated to be the baseline model for the energy-savings analysis.

75
Table 3-40: Beverage Merchandiser List Prices ($2008)
Manufacturer Model
Number
Volume
(ft3)
Overall Exterior
Dimensions List Price
($) W (in.) D (in.) H (in.)
Beverage-Air MT21 21 27 27.5* 78 3,012
Beverage-Air MT27 27 30 32* 78 3,178
True Manufacturing GDM-23 23 27 29.5 78.25 3,021
True Manufacturing GDM-23 26 30.25 78.25 78.25 3,139
Source: Beverage-Air and True Manufacturing online catalogs
Table 3-41: Beverage Merchandiser Total Installed Cost ($2008)
Costs
Beverage
Merchandiser
(1-Door)
Reach-In
Refrigerator (2
Doors)
Reach-In
Refrigerator
Freezer (2 Doors)
Equipment Purchase
Price
$2,600 $5,600 $12,100
Installation Cost $150 $150 $150
Total Installed Cost $2,750 $5,750 $12,250
Source: List prices from Beverage-Air and True Manufacturing online catalog were
converted to equipment purchase prices using the markups described in 0. Installation
cost estimated by NCI.
3.5.4 Life, Reliability, and Maintenance Characteristics
The typical life of a beverage merchandiser is 7 to 10 years. Since almost all units are
trade-identified, there is no significant used equipment market in the US for beverage
merchandisers. Bottling companies do not want their brand identity (i.e., the logo) to be
misused. After the typical lifetime of 7 to 10 years, the bottling company will choose to:
scrap the unit for parts,
sell the unit overseas, or
refurbish the unit for continued use in the same or a different location.
3.5.5 Major Manufacturers
The beverage merchandiser equipment market is dominated by two manufacturers:
Beverage-Air and True Manufacturing.
3.5.6 Major End-Users
Nearly all beverage merchandisers are purchased directly from manufacturers by bottling
companies for use in convenience stores, supermarkets, retail stores and small
foodservice establishments. Major bottlers such as Coca-Cola and Pepsi account for 85-
76
90% of purchases. Smaller bottlers, such as Snapple and Clearly Canadian, account for
less than 10%.
3.6 Ice Machines
3.6.1 Equipment Description
A typical ice machine consists of a refrigeration system, a water supply system, a case,
and insulation. We assume a 500-lb air-cooled ice-making head that produces cube-type
ice to be a representative baseline unit for the energy-savings analysis. Refer to section 0
for a definition of the three ice machine types and the three ice types. This section
provides a general description of ice-making equipment.
Ice-making heads are the most versatile of the three types and are available in the widest
range of capacities. They are generally mounted on top of a separately sold storage bin.
Remote-condensing units are similar to IMHs, except that they have a remote condenser
usually located outdoors, rejecting heat directly to the outside air without heating the air
inside the building. Self-contained units are generally manufactured with smaller
capacities than IMHs and RCUs.
Storage bins generally have a full-width door for user access to the ice. Ice production
capacity can be expanded for non-self-contained machines either by stacking an
additional machine on top of the first machine or by positioning a second machine
adjacent to the first machine on top of a single ice storage bin. When the machines are
stacked, ice produced in the upper machine falls through the lower machine into the
storage bin. Drains must be provided for removal of the excess water from the ice
machine and melting of the ice in the bin.
In ice cube machines, the ice is formed by passing a film of water over the evaporator,
allowing some of the water to freeze, while some of the water falls to the sump and is
recirculated with a pump. The ice layer gradually grows. Because not all the water
freezes, solids and gases dissolved in the water are not captured in the ice layer and are
instead carried away by the remaining liquid, which is drained from the sump when the
ice cube batch is complete. This process allows production of clear ice with ice cube
machines. Typical potable water consumption ranges from 15 - 40 gallons/100 lb of ice
produced, compared to 12 gallons/100 lb. contained in the ice produced.
Flake and nugget machines do not produce clear ice and hence do not require water
purging--the resulting ice retains the impurities, similar to ice production in residential
refrigerators.
An ice machine consists of two major subsystems: the refrigeration system and water
supply/ circulation/purge system. All commercially available ice machines use vapor
compression refrigeration to produce the refrigeration needed for ice production. Ice
machines use either air-cooled or water-cooled condensers. About 80 percent of ice
77
machines have air-cooled condensers. Although water-cooled condensers increase energy
efficiency slightly, they result in much higher water consumption since condenser water
is most often drained after it is used to cool the condenser. (Communication with a major
manufacturer in May 2008)
Primary refrigeration system components include:
Compressor - Typically, conventional reciprocating compressors are used, with
capacities of 1/3 to 3 hp, depending on ice machine capacity.
Condenser - Conventional air-cooled fin-tube or water-cooled concentric tube
heat exchangers are used. Air-cooled condensers are designed such that
condensing temperatures are 20 - 25°F above the ambient temperature. Water-
cooled condensers are controlled to maintain a constant preset condensing
temperature by varying the water flow rate.
Expansion device - Both thermostatic expansion valves and capillary tubes are
used in ice machines.
Evaporator - Typically the design consists of copper tubing attached to copper or
stainless steel ice making surfaces.
Liquid line/suction line heat exchanger
Refrigerant piping
Hot gas bypass line (cubers only) - This directs refrigerant directly from
compressor to evaporator for harvesting the ice.
Hot-gas solenoid valve (cubers only) - This controls hot gas refrigerant flow to
the condenser during ice production and to the evaporator during ice harvest.
Refrigerant - R-404A is the primary refrigerant used in all ice machines today. R-
134a and R-22 are still used in a few select models.
May have a suction accumulator
The water system consists of the following components:
Potable water supply connection and water supply control valve
Water sump
Water circulation pump
Water circuit - plastic tubing and evaporator water distributor
Purge drain (cube machines only)
The batch process, used by cube machines, is described in detail as follows (ADL 1996):
1. Water fills the sump. The sump usually contains 10 - 40 percent more water than
required to make a given batch of ice.
2. The refrigeration system is activated and sump water is circulated over the
evaporator plate. During the freeze cycle the compressor, condenser fan (for air-
cooled machines) and the water circulating pump are activated.
3. The water is cooled down and gradually freezes on the evaporator plate.
4. Ice builds up on the plate till the proper ice batch weight is detected by some
means: sump water level, compressor suction pressure, or thickness of ice on the
plate.
78
5. Upon reaching the prescribed ice weight, the machine switches to the harvest
mode. Most machines use hot-gas harvest, in which hot refrigerant vapor is
directed from the compressor to the evaporator to warm the evaporator and melt
enough ice to free the ice on the plate. Typically about 10 - 20 percent of the ice is
melted during the harvest process. Once free, the ice falls by gravity and/or
mechanical assistance into the storage bin below. During the harvest process the
condenser fan for air-cooled machines is off and the water circulating pump may
be operating, depending on the design. Some machines use a limited amount of
hot gas for meltage combined with mechanical means for removing the ice.
6. During the harvest process, water remaining in the sump is purged from the
system and fresh, potable water is flushed through the system to remove
impurities and purged.
7. Water fills the sump and the system returns to the freeze mode as detected by
evaporator temperature and/or time.
Some ice machines utilize the incoming potable water stream to assist in the harvest
process by directing the incoming water behind the evaporator plate or over the ice. The
water can provide more than 50 percent of the energy required for harvest resulting in
reduced harvest input energy and prechills the water for the next batch of ice.
Except for the evaporator, all of the components used in the ice machine are fairly
conventional refrigeration components. The evaporator is constructed of copper tubing
attached to copper or stainless steel ice making surfaces. There may be plastic attached to
the ice making surface to act as an insulator to promote the formation of individual cubes.
Evaporator design requires finding a careful balance between the ice growth behavior,
water flow rate over the evaporator, localized water distribution, materials selection, and
harvest performance (e.g., successful ice detachment, amount of meltage). Evaporator
design is a complex process not amenable to analysis, and developing a successful
evaporator design requires many hours of laboratory testing. Manufacturers are very
reluctant to make changes to the evaporator design once a successful design has been
developed.
Manufacturers generally produce one or at most two evaporator sizes, which are used in
multiples across the product line matched with the appropriately sized compressor. This
manufacturing strategy contributes to variations of energy efficiency across the product
line due to the fact the evaporator/compressor combination cannot be optimized for each
machine, resulting in some machines with undersized evaporators with oversized
compressors to achieve the target production rate and correspondingly higher energy
consumption. (Scotsman 2008)
3.6.2 Energy Consumption
Ice machine performance (capacity, energy consumption, and water consumption) is
usually presented for operating conditions prescribed by the Air-Conditioning, Heating,

79
and Refrigeration Institute (AHRI), which are for a 90°F ambient temperature, a 70°F
inlet water temperature, and an inlet water pressure of 30 ± 3 psig (AHRI 2007).
Table 3-42 lists the unit energy consumption in kWh per 100 lbs of ice broken down by
equipment type, cooling type, harvest rate, and ice type. The first value in each box is the
average unit energy consumption, and inside the parentheses is the range of values for
each category. The data set includes all ice-machines, air- and water-cooled, currently on
the market.
Table 3-42: Unit Energy Consumption by Equipment Type
Equip. Type Condenser
Cooling
Harvest Rate
lbs ice/24hrs
Unit Energy Consumption
kWh / 100 lbs Ice
Average (Min – Max)
Cube Flake Nugget
IMH
Water
< 500 5.4 (4.2-
9.9)
4.4 (3.8-
5.6)
4.6 (4.2-
4.9)
≥ 500 and <
1436
4.3 (3.6-
6.0)
3.5 (2.5-
4.7)
3.7 (3.0-
4.7)
≥ 1436 3.9 ( 3.4-
4.3)
2.7 (2.2-
3.5) 2.7
Air
< 450 6.8 (5.4-
8.2)
5.6 (4.8-
6.6)
6.2 (5.2-
7.4)
≥ 450 5.5 (4.6-
7.5)
3.8 (0.6-
5.8)
4.5 (3.5-
6.4)
RCU w/o
Remote
Compressor
Air
< 1000 5.8 (4.7-
7.1)
4.9 (3.4-
6.2)
5.3 (4.1-
6.2)
≥ 1000 4.9 (4.2-
6.0)
3.4 (2.8-
4.0)
3.8 (3.6 –
4.2)
RCU w/
Remote
Compressor
Air
< 934 5.8 (5.0-
6.7) 4.5
4.6 (4.1-
5.1)
≥ 934 4.7 (4.3-
5.0) 3.9
4.2 (3.9-
4.8)
SCU
Water
< 200 7.8 (6.6-
9.8) N/A N/A
≥ 200 6.5 (5.7-
7.3)
5.0 (4.9-
5.0)
4.6 (4.0-
5.1)
Air
< 175 13.0 (8.4-
20.4) N/A 8.0
≥ 175 9.1 (6.8-
13.0)
5.5 (4.1-
6.7)
6.5 (5.3-
7.6) Source: Survey of AHRI Ice Machine Directory (2008), CEC Appliances Database (2008), and ENERGY
STAR Database (2009); confirmed by literature on manufacturer websites where possible
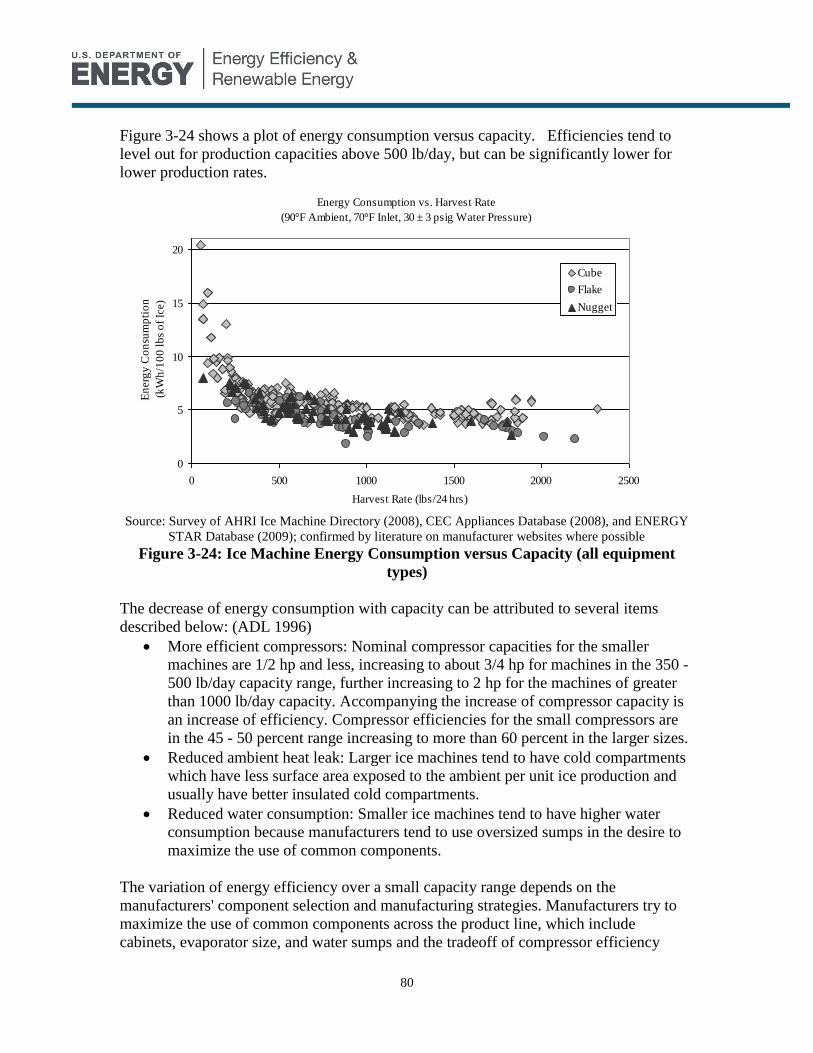
80
Figure 3-24 shows a plot of energy consumption versus capacity. Efficiencies tend to
level out for production capacities above 500 lb/day, but can be significantly lower for
lower production rates.
Source: Survey of AHRI Ice Machine Directory (2008), CEC Appliances Database (2008), and ENERGY
STAR Database (2009); confirmed by literature on manufacturer websites where possible
Figure 3-24: Ice Machine Energy Consumption versus Capacity (all equipment
types)
The decrease of energy consumption with capacity can be attributed to several items
described below: (ADL 1996)
More efficient compressors: Nominal compressor capacities for the smaller
machines are 1/2 hp and less, increasing to about 3/4 hp for machines in the 350 -
500 lb/day capacity range, further increasing to 2 hp for the machines of greater
than 1000 lb/day capacity. Accompanying the increase of compressor capacity is
an increase of efficiency. Compressor efficiencies for the small compressors are
in the 45 - 50 percent range increasing to more than 60 percent in the larger sizes.
Reduced ambient heat leak: Larger ice machines tend to have cold compartments
which have less surface area exposed to the ambient per unit ice production and
usually have better insulated cold compartments.
Reduced water consumption: Smaller ice machines tend to have higher water
consumption because manufacturers tend to use oversized sumps in the desire to
maximize the use of common components.
The variation of energy efficiency over a small capacity range depends on the
manufacturers' component selection and manufacturing strategies. Manufacturers try to
maximize the use of common components across the product line, which include
cabinets, evaporator size, and water sumps and the tradeoff of compressor efficiency
Energy Consumption vs. Harvest Rate
(90°F Ambient, 70°F Inlet, 30 ± 3 psig Water Pressure)
0
5
10
15
20
0 500 1000 1500 2000 2500
Harvest Rate (lbs/24 hrs)
En
erg
y C
on
sum
pti
on
(kW
h/1
00
lb
s o
f Ic
e)
Cube
Flake
Nugget

81
level and cost. The more efficient machines tend to have larger evaporators for a given
production rate, resulting in a higher evaporating temperature and higher resulting
operating COP.
Figure 3-25 shows a plot of potable water consumption versus capacity. The minimum
potable water consumption necessary to make 100 lbs of ice is 12 gallons. Flake and
nugget machines convert all potable water to ice using the continuous process, and
therefore only use 12 gallons/100 lbs of ice, not counting losses due to melting in the
storage bin. Cube machine potable water use ranges from 15-50 gallons/100 lbs of ice,
with the highest consumption rates at the lowest capacities.
Sources: Survey of AHRI Ice Machine Directory (2008), CEC Appliances Database (2008), and ENERGY
STAR Database (2009); confirmed by literature on manufacturer websites where possible
Figure 3-25: Potable Water Consumption versus Capacity (all equipment types)
Figure 3-26 shows a plot of condenser water consumption versus capacity, for units with
water-cooled condensers. Condenser water consumptions range from 60 – 190
gallons/100 lbs of ice. Cube machines use the greatest amount of condenser water.
Potable Water Consumption vs. Harvest Rate
(90°F Ambient, 70°F Inlet, 30 ± 3 psig Water Pressure)
0
10
20
30
40
50
60
0 500 1000 1500 2000 2500
Harvest Rate (lbs/24 hrs)
Po
tab
le W
ate
r C
on
sum
pti
on
(Gal/
10
0 l
bs
of
Ice)
Cube
Flake
Nugget
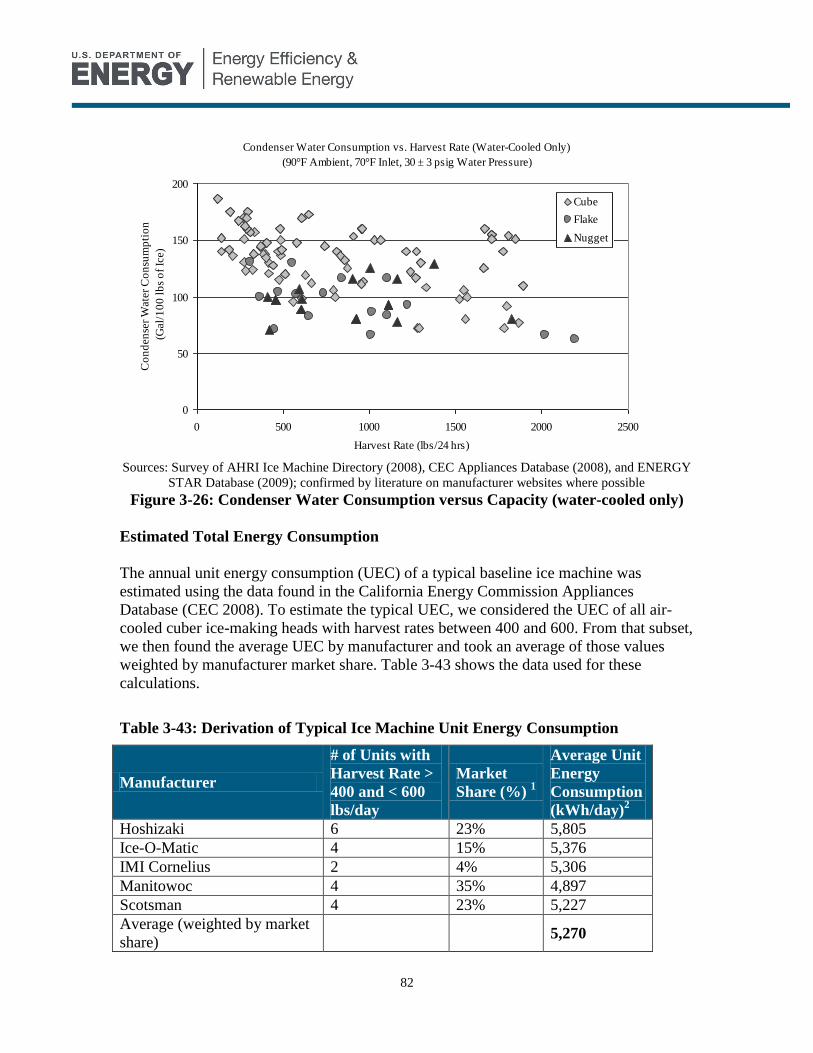
82
Sources: Survey of AHRI Ice Machine Directory (2008), CEC Appliances Database (2008), and ENERGY
STAR Database (2009); confirmed by literature on manufacturer websites where possible
Figure 3-26: Condenser Water Consumption versus Capacity (water-cooled only)
Estimated Total Energy Consumption
The annual unit energy consumption (UEC) of a typical baseline ice machine was
estimated using the data found in the California Energy Commission Appliances
Database (CEC 2008). To estimate the typical UEC, we considered the UEC of all air-
cooled cuber ice-making heads with harvest rates between 400 and 600. From that subset,
we then found the average UEC by manufacturer and took an average of those values
weighted by manufacturer market share. Table 3-43 shows the data used for these
calculations.
Table 3-43: Derivation of Typical Ice Machine Unit Energy Consumption
Manufacturer
# of Units with
Harvest Rate >
400 and < 600
lbs/day
Market
Share (%) 1
Average Unit
Energy
Consumption
(kWh/day)2
Hoshizaki 6 23% 5,805
Ice-O-Matic 4 15% 5,376
IMI Cornelius 2 4% 5,306
Manitowoc 4 35% 4,897
Scotsman 4 23% 5,227
Average (weighted by market
share) 5,270
Condenser Water Consumption vs. Harvest Rate (Water-Cooled Only)
(90°F Ambient, 70°F Inlet, 30 ± 3 psig Water Pressure)
0
50
100
150
200
0 500 1000 1500 2000 2500
Harvest Rate (lbs/24 hrs)
Co
nd
en
ser
Wate
r C
on
sum
pti
on
(Gal/
10
0 l
bs
of
Ice)
Cube
Flake
Nugget
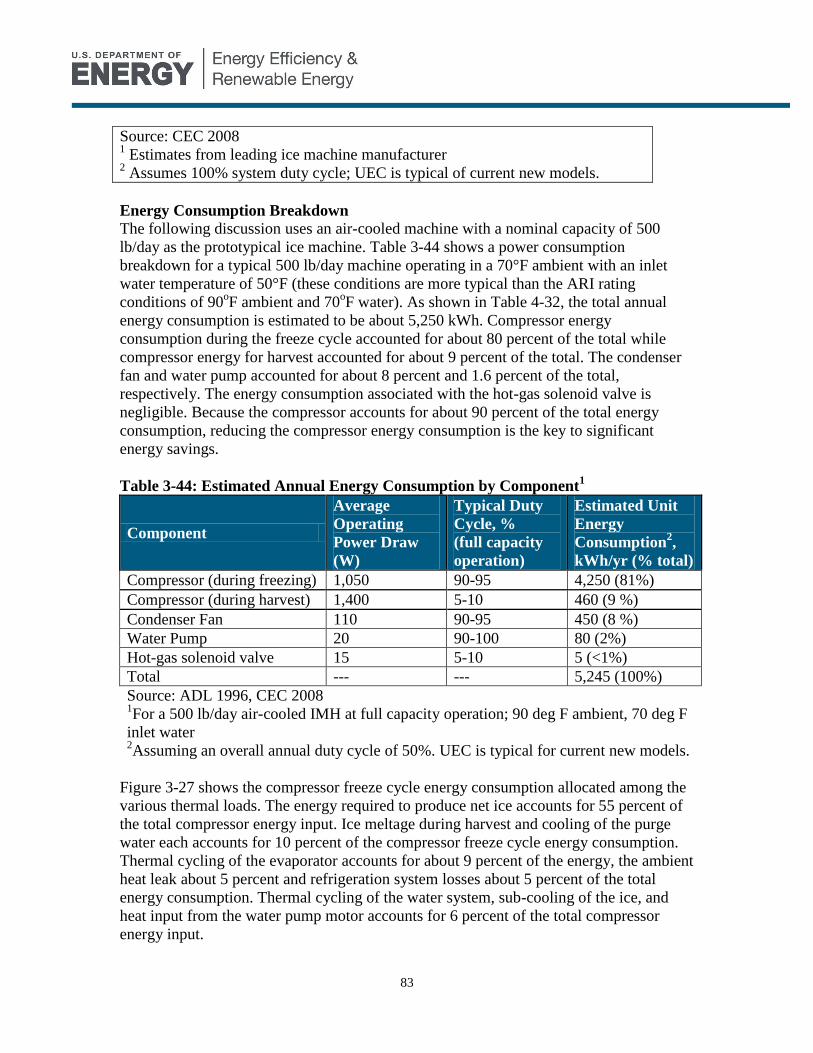
83
Source: CEC 2008 1 Estimates from leading ice machine manufacturer
2 Assumes 100% system duty cycle; UEC is typical of current new models.
Energy Consumption Breakdown
The following discussion uses an air-cooled machine with a nominal capacity of 500
lb/day as the prototypical ice machine. Table 3-44 shows a power consumption
breakdown for a typical 500 lb/day machine operating in a 70°F ambient with an inlet
water temperature of 50°F (these conditions are more typical than the ARI rating
conditions of 90oF ambient and 70
oF water). As shown in Table 4-32, the total annual
energy consumption is estimated to be about 5,250 kWh. Compressor energy
consumption during the freeze cycle accounted for about 80 percent of the total while
compressor energy for harvest accounted for about 9 percent of the total. The condenser
fan and water pump accounted for about 8 percent and 1.6 percent of the total,
respectively. The energy consumption associated with the hot-gas solenoid valve is
negligible. Because the compressor accounts for about 90 percent of the total energy
consumption, reducing the compressor energy consumption is the key to significant
energy savings.
Table 3-44: Estimated Annual Energy Consumption by Component1
Component
Average
Operating
Power Draw
(W)
Typical Duty
Cycle, %
(full capacity
operation)
Estimated Unit
Energy
Consumption2,
kWh/yr (% total)
Compressor (during freezing) 1,050 90-95 4,250 (81%)
Compressor (during harvest) 1,400 5-10 460 (9 %)
Condenser Fan 110 90-95 450 (8 %)
Water Pump 20 90-100 80 (2%)
Hot-gas solenoid valve 15 5-10 5 (<1%)
Total --- --- 5,245 (100%)
Source: ADL 1996, CEC 2008 1For a 500 lb/day air-cooled IMH at full capacity operation; 90 deg F ambient, 70 deg F
inlet water 2Assuming an overall annual duty cycle of 50%. UEC is typical for current new models.
Figure 3-27 shows the compressor freeze cycle energy consumption allocated among the
various thermal loads. The energy required to produce net ice accounts for 55 percent of
the total compressor energy input. Ice meltage during harvest and cooling of the purge
water each accounts for 10 percent of the compressor freeze cycle energy consumption.
Thermal cycling of the evaporator accounts for about 9 percent of the energy, the ambient
heat leak about 5 percent and refrigeration system losses about 5 percent of the total
energy consumption. Thermal cycling of the water system, sub-cooling of the ice, and
heat input from the water pump motor accounts for 6 percent of the total compressor
energy input.

84
Source: ADL 1996
Figure 3-27: Freeze Cycle Energy Consumption by Load13
Based on the results shown in Figure 3-27, reductions in energy consumption could be
obtained through a combination of reducing the thermal loads to the system and
refrigeration system improvements. Major parasitic thermal loads identified above
include ice meltage during harvest, cooling of purge water, thermal cycling of the
evaporator, and ambient heat leak, which account for over 30 percent of the compressor
freeze cycle energy input. Refrigeration system improvements can be realized by utilizing
the traditional methods applied to all vapor compression systems: increase compressor
efficiency, reduce condensing temperature, raise average evaporating temperature, and
reduce losses.
3.6.3 Purchase and Installation Costs
The ice machine market is very competitive with many producers, resulting in little price
increase over the past few years. Table 3-45 shows total installed cost for a typical
baseline ice machine. Installation for ice machines requires machine delivery and
placement, and connection of electric power, water supply, and drainage piping. The cost
is estimated to be $500. Machines with remote condensers involve additional cost of
about $100 for installation of the condenser. (ADL 1996, verified by Scotsman 2008)
13
Source indicates that calculations are for a typical ice machine using the program FREEZE (ADL 1996).
Source indicates that the model was validated by comparing with confidential test data of three
manufacturer’s machines
Meltage10%
Cooling of Purge Water
10%
Evaporator Thermal Cycling
9%
Ambient Heat Leak5%
Refrigeration System Losses
5%
Water System Thermal Cycling
3%Ice Subcooling and
Pump Load
3%
Net Ice55%
Total Compressor
Freeze Cycle
Energy Consumption:
4.3 kWh/100lb
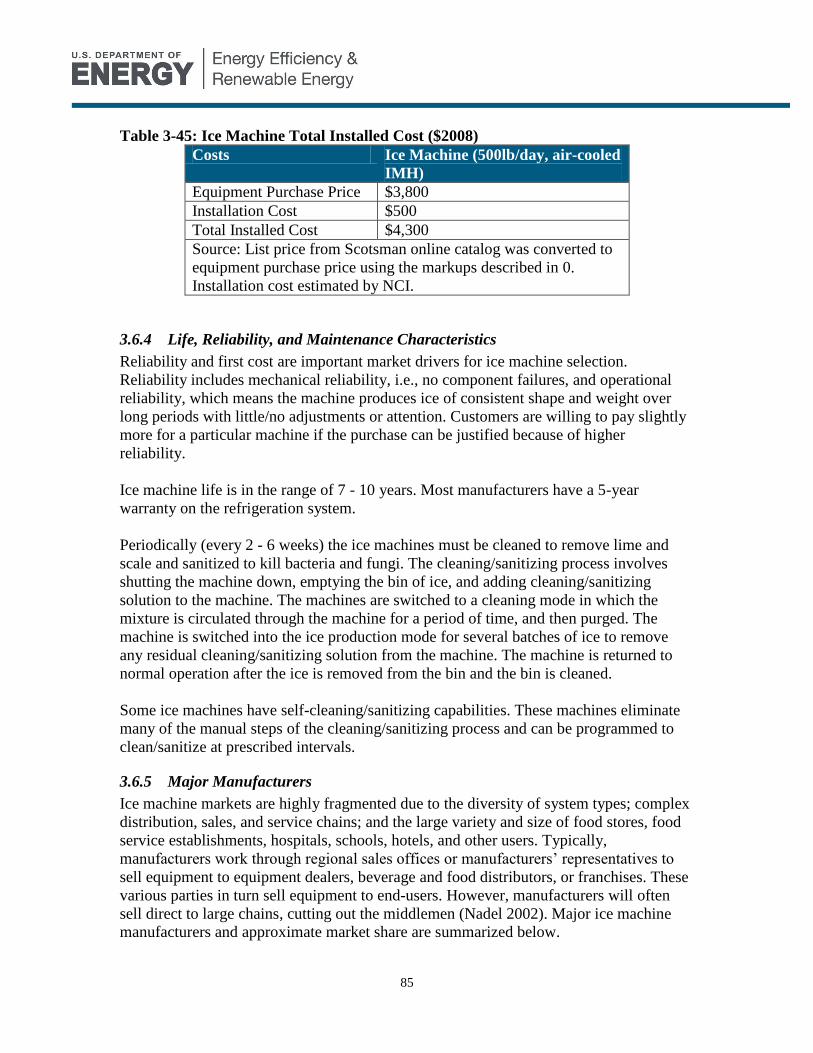
85
Table 3-45: Ice Machine Total Installed Cost ($2008)
Costs Ice Machine (500lb/day, air-cooled
IMH)
Equipment Purchase Price $3,800
Installation Cost $500
Total Installed Cost $4,300
Source: List price from Scotsman online catalog was converted to
equipment purchase price using the markups described in 0.
Installation cost estimated by NCI.
3.6.4 Life, Reliability, and Maintenance Characteristics
Reliability and first cost are important market drivers for ice machine selection.
Reliability includes mechanical reliability, i.e., no component failures, and operational
reliability, which means the machine produces ice of consistent shape and weight over
long periods with little/no adjustments or attention. Customers are willing to pay slightly
more for a particular machine if the purchase can be justified because of higher
reliability.
Ice machine life is in the range of 7 - 10 years. Most manufacturers have a 5-year
warranty on the refrigeration system.
Periodically (every 2 - 6 weeks) the ice machines must be cleaned to remove lime and
scale and sanitized to kill bacteria and fungi. The cleaning/sanitizing process involves
shutting the machine down, emptying the bin of ice, and adding cleaning/sanitizing
solution to the machine. The machines are switched to a cleaning mode in which the
mixture is circulated through the machine for a period of time, and then purged. The
machine is switched into the ice production mode for several batches of ice to remove
any residual cleaning/sanitizing solution from the machine. The machine is returned to
normal operation after the ice is removed from the bin and the bin is cleaned.
Some ice machines have self-cleaning/sanitizing capabilities. These machines eliminate
many of the manual steps of the cleaning/sanitizing process and can be programmed to
clean/sanitize at prescribed intervals.
3.6.5 Major Manufacturers
Ice machine markets are highly fragmented due to the diversity of system types; complex
distribution, sales, and service chains; and the large variety and size of food stores, food
service establishments, hospitals, schools, hotels, and other users. Typically,
manufacturers work through regional sales offices or manufacturers’ representatives to
sell equipment to equipment dealers, beverage and food distributors, or franchises. These
various parties in turn sell equipment to end-users. However, manufacturers will often
sell direct to large chains, cutting out the middlemen (Nadel 2002). Major ice machine
manufacturers and approximate market share are summarized below.
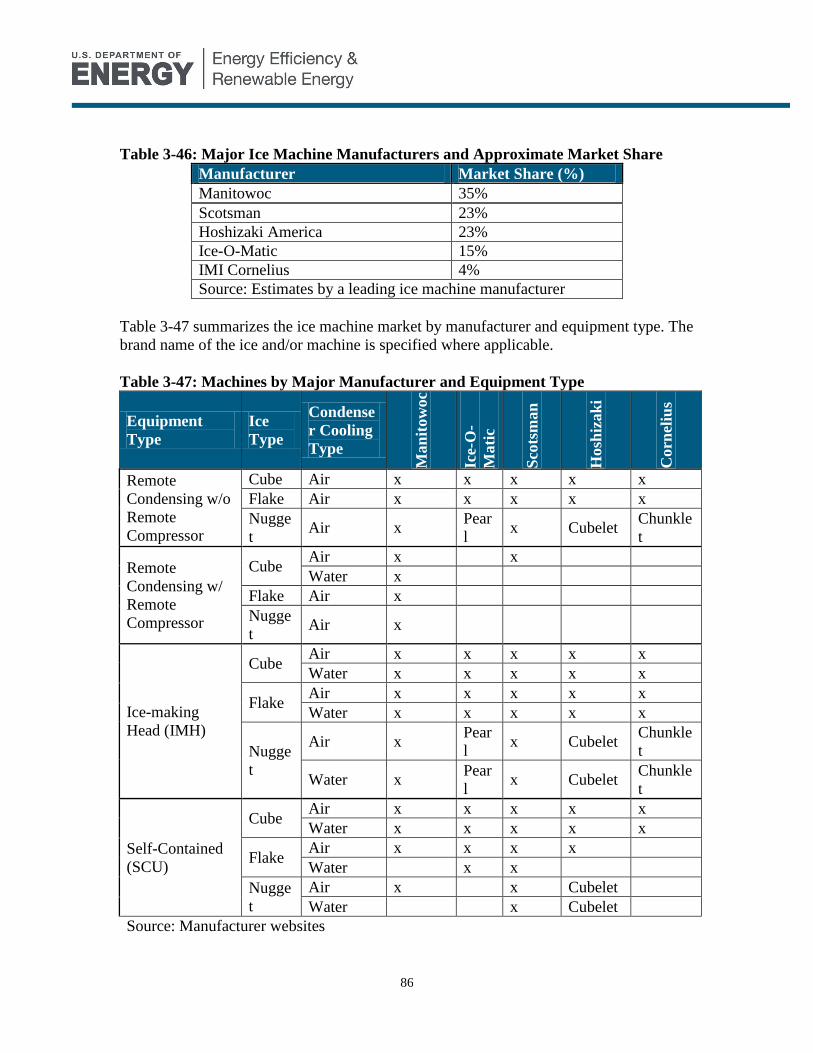
86
Table 3-46: Major Ice Machine Manufacturers and Approximate Market Share
Manufacturer Market Share (%)
Manitowoc 35%
Scotsman 23%
Hoshizaki America 23%
Ice-O-Matic 15%
IMI Cornelius 4%
Source: Estimates by a leading ice machine manufacturer
Table 3-47 summarizes the ice machine market by manufacturer and equipment type. The
brand name of the ice and/or machine is specified where applicable.
Table 3-47: Machines by Major Manufacturer and Equipment Type
Equipment
Type
Ice
Type
Condense
r Cooling
Type
Man
itow
oc
Ice-
O-
Mati
c
Sco
tsm
an
Hosh
izak
i
Corn
eliu
s
Remote
Condensing w/o
Remote
Compressor
Cube Air x x x x x
Flake Air x x x x x
Nugge
t Air x
Pear
l x Cubelet
Chunkle
t
Remote
Condensing w/
Remote
Compressor
Cube Air x x
Water x
Flake Air x
Nugge
t Air x
Ice-making
Head (IMH)
Cube Air x x x x x
Water x x x x x
Flake Air x x x x x
Water x x x x x
Nugge
t
Air x Pear
l x Cubelet
Chunkle
t
Water x Pear
l x Cubelet
Chunkle
t
Self-Contained
(SCU)
Cube Air x x x x x
Water x x x x x
Flake Air x x x x
Water x x
Nugge
t
Air x x Cubelet
Water x Cubelet
Source: Manufacturer websites

87
1.1.1 Major End-Users
Major classes of end-users include food service establishments (e.g., restaurants,
institutional cafeterias, fast food establishments, delicatessens, and bars), food sales (e.g.,
supermarkets and convenience stores), hospitals, and hotels (Nadel 2002).
The largest machines are used in airline and airport food service industries, very large
restaurants, stadiums, schools, and industrial processes. The smallest machines are sold to
bars, restaurants, and office buildings.
3.7 Refrigerated Vending Machines
3.7.1 Equipment Description and Illustrations
Fifty-two percent of refrigerated vending machines are beverage vending machines,
making beverage vending machines a good proxy for all refrigerated vending machines
(Vending Times 2008a). A refrigerated packaged beverage vending machine is “a
commercial refrigerator that cools bottled or canned beverages and dispenses the bottled
or canned beverages on payment.” (42 U.S.C. 6291(40))
Beverage vending machines must:
achieve quick pull-down temperature
maintain a cold beverage temperature (~ 35°F)
attract customers (with bright lighting, attractive logo, etc.)
hold a high volume of beverages (~ 400-800 12 oz. cans)
be theft-resistant
Bottling companies purchase vending machines directly from the manufacturer. They
will often specify all the aesthetics of the machine (light output, logo, etc.) and its
refrigeration performance requirements (pull-down time, holding temperature, etc.).
These performance requirements vary among the different bottling companies. Aside
from these differences, however, all vending machines are similar.
As mentioned in section 2.7, refrigerated vending machines come in two configurations:
fully-cooled and zone-cooled.
Fully-cooled vending machines typically have a glass or transparent polymer front.
Figure 3-28 shows a typical fully-cooled packaged beverage vending machine. Its
capacity is about 410 12 oz. cans. The case is typically insulated to R-8 with 1 inch of
blown polyurethane foam. The unit has a clear air-filled, two-pane glass front with an
aluminum frame.
The fully cooled unit is typically equipped with two 4-foot T8 fluorescent lamps (1-1/2
inch diameter tubes), on one ballast. The lighting is located within the refrigerated
volume to provide the best illumination of the product. The most common lighting
configuration is two 32-watt bulbs. Lighting can have a significant effect on energy use
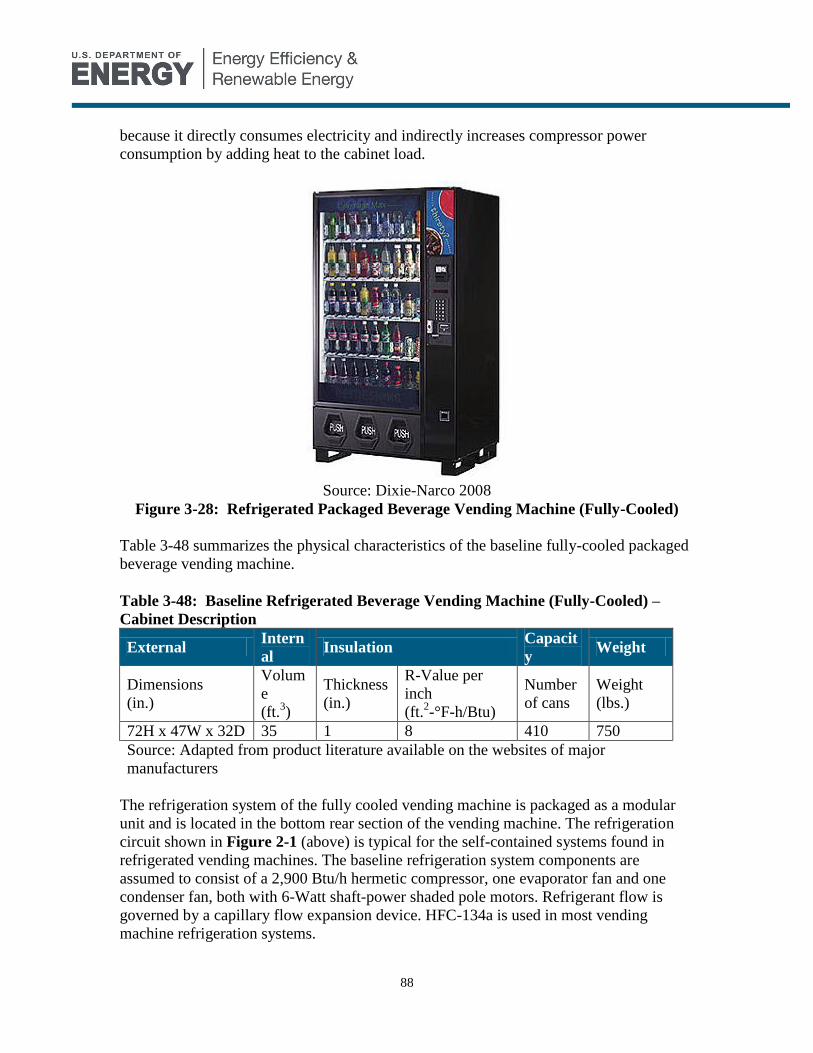
88
because it directly consumes electricity and indirectly increases compressor power
consumption by adding heat to the cabinet load.
Source: Dixie-Narco 2008
Figure 3-28: Refrigerated Packaged Beverage Vending Machine (Fully-Cooled)
Table 3-48 summarizes the physical characteristics of the baseline fully-cooled packaged
beverage vending machine.
Table 3-48: Baseline Refrigerated Beverage Vending Machine (Fully-Cooled) –
Cabinet Description
External Intern
al Insulation
Capacit
y Weight
Dimensions
(in.)
Volum
e
(ft.3)
Thickness
(in.)
R-Value per
inch
(ft.2-°F-h/Btu)
Number
of cans
Weight
(lbs.)
72H x 47W x 32D 35 1 8 410 750
Source: Adapted from product literature available on the websites of major
manufacturers
The refrigeration system of the fully cooled vending machine is packaged as a modular
unit and is located in the bottom rear section of the vending machine. The refrigeration
circuit shown in Figure 2-1 (above) is typical for the self-contained systems found in
refrigerated vending machines. The baseline refrigeration system components are
assumed to consist of a 2,900 Btu/h hermetic compressor, one evaporator fan and one
condenser fan, both with 6-Watt shaft-power shaded pole motors. Refrigerant flow is
governed by a capillary flow expansion device. HFC-134a is used in most vending
machine refrigeration systems.

89
Figure 3-29 shows a typical zone-cooled packaged beverage vending machine, which is
assumed to be a representative baseline. Its capacity is approximately 800 12 oz. cans.
The case is typically insulated to R-8 with 1 inch of blown polyurethane foam.
There are two doors on zone-cooled vending machines. An insulated inner door allows
access to the refrigerated space where the cans are stored. An outer door houses the logo
and its associated lighting equipment.
The zone-cooled unit is typically equipped with two 6-foot T8 fluorescent lamps (1-1/2
inch diameter tubes), on one ballast, to illuminate the logo. The lighting is located outside
of the refrigerated volume. The most common lighting configuration is two 49-watt
bulbs.
Source: SandenVendo 2008
Figure 3-29: Refrigerated Packaged Beverage Vending Machine (Zone-Cooled)
Table 3-49 summarizes the physical characteristics of the baseline zone-cooled packaged
beverage vending machine.
Table 3-49: Baseline Refrigerated Packaged Beverage Vending Machine (Zone-
Cooled) – Cabinet Description
External Internal Insulation Capacit
y Weight
Dimensions
(in.)
Volume
(ft.3)
Thickness
(in.)
R-Value per
inch
(ft.2-°F-h/Btu)
Number
of cans
Weight
(lbs.)
79H x 40W x
35D 31 1 8 800 700
Source: Adapted from product literature available on the websites of major
manufacturers
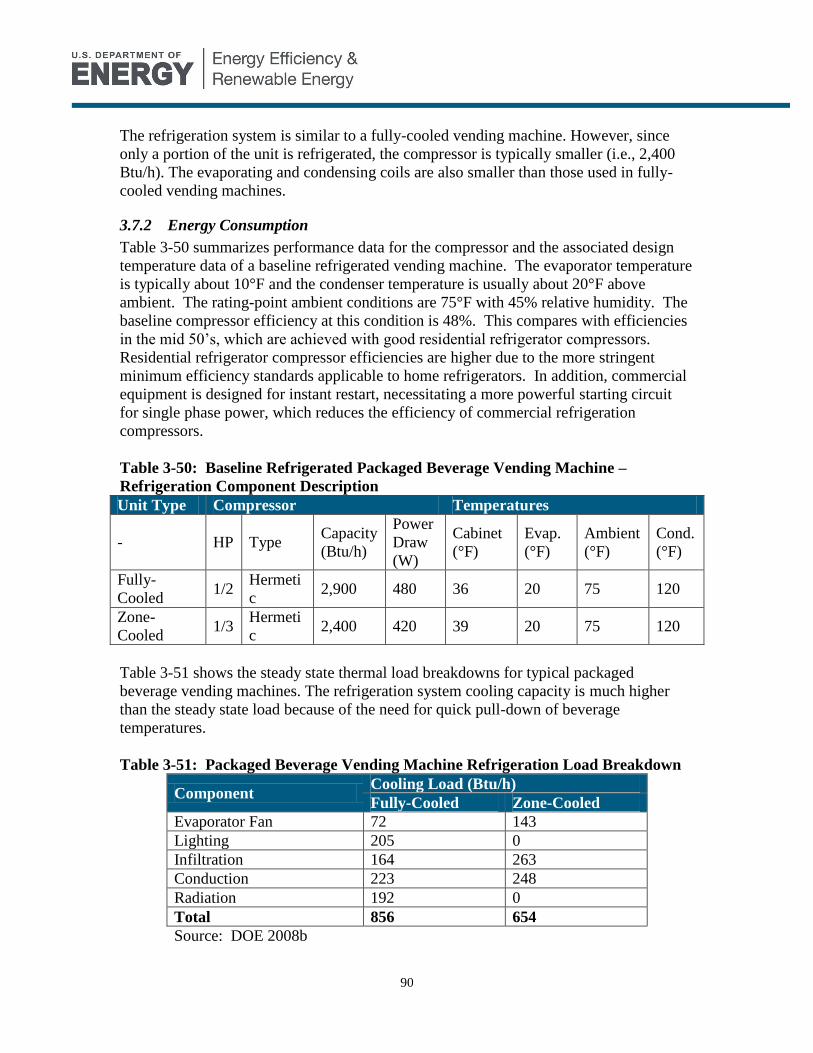
90
The refrigeration system is similar to a fully-cooled vending machine. However, since
only a portion of the unit is refrigerated, the compressor is typically smaller (i.e., 2,400
Btu/h). The evaporating and condensing coils are also smaller than those used in fully-
cooled vending machines.
3.7.2 Energy Consumption
Table 3-50 summarizes performance data for the compressor and the associated design
temperature data of a baseline refrigerated vending machine. The evaporator temperature
is typically about 10°F and the condenser temperature is usually about 20°F above
ambient. The rating-point ambient conditions are 75°F with 45% relative humidity. The
baseline compressor efficiency at this condition is 48%. This compares with efficiencies
in the mid 50’s, which are achieved with good residential refrigerator compressors.
Residential refrigerator compressor efficiencies are higher due to the more stringent
minimum efficiency standards applicable to home refrigerators. In addition, commercial
equipment is designed for instant restart, necessitating a more powerful starting circuit
for single phase power, which reduces the efficiency of commercial refrigeration
compressors.
Table 3-50: Baseline Refrigerated Packaged Beverage Vending Machine –
Refrigeration Component Description
Unit Type Compressor Temperatures
- HP Type Capacity
(Btu/h)
Power
Draw
(W)
Cabinet
(°F)
Evap.
(°F)
Ambient
(°F)
Cond.
(°F)
Fully-
Cooled 1/2
Hermeti
c 2,900 480 36 20 75 120
Zone-
Cooled 1/3
Hermeti
c 2,400 420 39 20 75 120
Table 3-51 shows the steady state thermal load breakdowns for typical packaged
beverage vending machines. The refrigeration system cooling capacity is much higher
than the steady state load because of the need for quick pull-down of beverage
temperatures.
Table 3-51: Packaged Beverage Vending Machine Refrigeration Load Breakdown
Component Cooling Load (Btu/h)
Fully-Cooled Zone-Cooled
Evaporator Fan 72 143
Lighting 205 0
Infiltration 164 263
Conduction 223 248
Radiation 192 0
Total 856 654
Source: DOE 2008b

91
Table 3-52 and Table 3-53 show the energy consumption breakdown for typical packaged
beverage vending machines.
Table 3-52: Baseline Refrigerated Beverage Vending Machine (Fully-Cooled) –
Energy Consumption Breakdown
Component
Power
Consumption
(W)
Duty Cycle
(%)
Unit Energy
Consumption
(kWh/yr)1
Energy
Consumption
(%)
Compressor 520 35% 1,594 64%
Evaporator Fan 21 100% 184 7%
Condenser Fan 53 35% 163 7%
Lighting 63 100% 552 22%
Dispensing
Mechanism 120
~ 0% 1 0%
Total - - 2,494 100%
Source: DOE 2008b 1These UECs are typical of current new models.
Table 3-53: Baseline Refrigerated Beverage Vending Machine (Zone-Cooled) –
Energy Consumption Breakdown
Component
Power
Consumption
(W)
Duty Cycle
(%)
Unit Energy
Consumption
(kWh/yr)1
Energy
Consumption
(%)
Compressor 447 30% 1,175 52%
Evaporator Fan 21 100% 184 8%
Condenser Fan 53 30% 139 6%
Lighting 87 100% 759 34%
Dispensing
Mechanism 120 ~ 0% 1 0%
Total - - 2,258 100%
Source: DOE 2008b 1These UECs are typical of current new models.
3.7.3 Purchase and Installation Costs
Table 3-54 shows total installed cost for a typical baseline ice machine. Installation costs,
which include profit and overhead, are estimated to be $100.
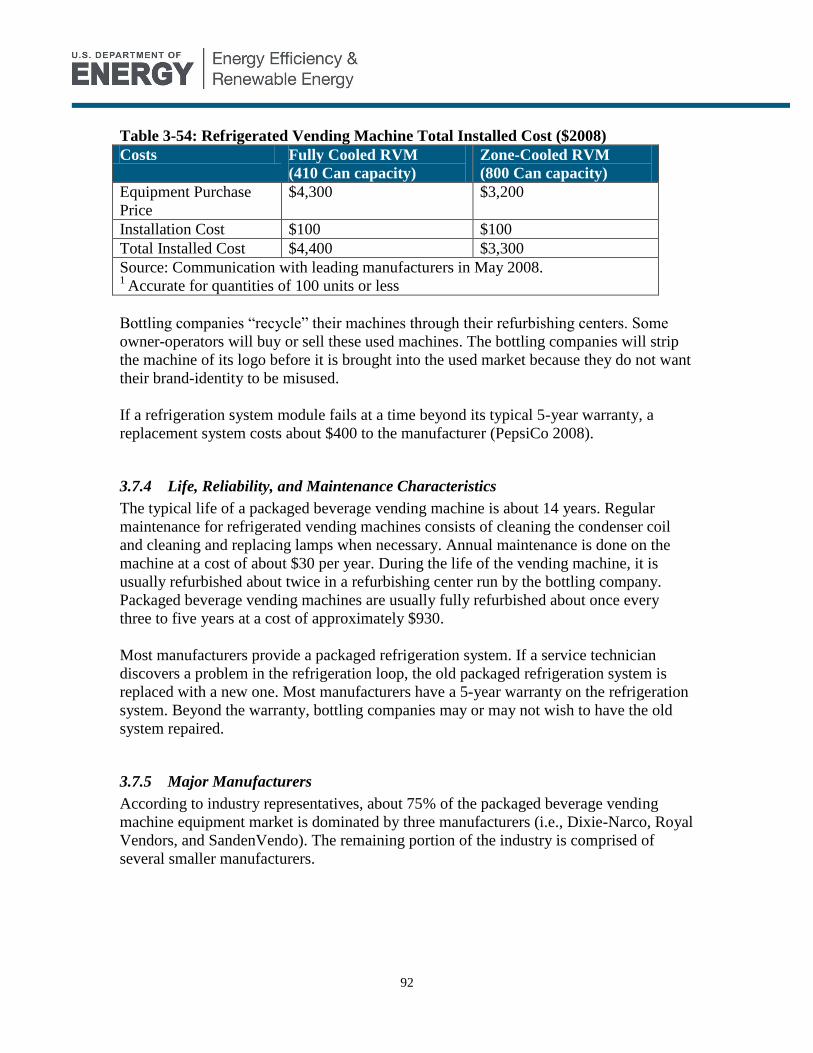
92
Table 3-54: Refrigerated Vending Machine Total Installed Cost ($2008)
Costs Fully Cooled RVM
(410 Can capacity)
Zone-Cooled RVM
(800 Can capacity)
Equipment Purchase
Price
$4,300 $3,200
Installation Cost $100 $100
Total Installed Cost $4,400 $3,300
Source: Communication with leading manufacturers in May 2008. 1
Accurate for quantities of 100 units or less
Bottling companies “recycle” their machines through their refurbishing centers. Some
owner-operators will buy or sell these used machines. The bottling companies will strip
the machine of its logo before it is brought into the used market because they do not want
their brand-identity to be misused.
If a refrigeration system module fails at a time beyond its typical 5-year warranty, a
replacement system costs about $400 to the manufacturer (PepsiCo 2008).
3.7.4 Life, Reliability, and Maintenance Characteristics
The typical life of a packaged beverage vending machine is about 14 years. Regular
maintenance for refrigerated vending machines consists of cleaning the condenser coil
and cleaning and replacing lamps when necessary. Annual maintenance is done on the
machine at a cost of about $30 per year. During the life of the vending machine, it is
usually refurbished about twice in a refurbishing center run by the bottling company.
Packaged beverage vending machines are usually fully refurbished about once every
three to five years at a cost of approximately $930.
Most manufacturers provide a packaged refrigeration system. If a service technician
discovers a problem in the refrigeration loop, the old packaged refrigeration system is
replaced with a new one. Most manufacturers have a 5-year warranty on the refrigeration
system. Beyond the warranty, bottling companies may or may not wish to have the old
system repaired.
3.7.5 Major Manufacturers
According to industry representatives, about 75% of the packaged beverage vending
machine equipment market is dominated by three manufacturers (i.e., Dixie-Narco, Royal
Vendors, and SandenVendo). The remaining portion of the industry is comprised of
several smaller manufacturers.
93
3.7.6 Major End-Users
The major bottling companies that purchase packaged beverage vending machines are:
Coca-Cola Company
PepsiCo, Inc.
Dr. Pepper Company
Seven-Up Company

94
4 Energy Savings Potential Using Current Technologies
This section describes the energy saving potentials achievable using currently available
technologies that are applicable to commercial refrigeration equipment, performs a
simple economic analysis, and discusses the technical and market barriers to
implementation. By “currently available” we mean that the technology has been
integrated into commercially available commercial refrigeration equipment. Technologies
that are not currently available are discussed in Section 5.
The list of current technologies remains similar to the 1996 Arthur D. Little report, with a
few changes. LED lighting has recently become a commercially available lighting option
in the commercial refrigeration applications. See section 4.1 for equations defining how
the energy and cost figures were calculated for each technology option. The variables for
each of the equipment types are defined in Table 4-4 at the end of section 4.1. In general,
for cases where more recent cost data were not available, we adapted the data from ADL
1996 according to several assumptions to bring the cost figures up to 2008 dollars.
Specifically, we doubled retooling costs and inflated equipment costs according to the
producer price index (discussed in 0).
We present the results of the economic analysis for each equipment type in the form of
simple payback period. For walk-ins, reach-ins, and refrigerated vending machines, we
conducted separate analyses for the two types of cabinets (i.e. refrigerator and freezer,
zone-cooled and fully-cooled). For each equipment type, the table of results is followed
by explanations of the origination of the energy use reduction and cost premium values.
kWh Pricey Electricit
yr
kWh ingsEnergy Sav Annual
($) Premium Cost InstalledPBP
$
The results include three scenarios, each involving a different price for electricity. Table
4-1 lists the electricity prices used to calculate operating cost savings and payback period.
These electricity prices use state average commercial retail electricity rates published by
the Energy Information Administration. The low electricity rate scenario is the average of
the 19 lowest-priced states weighted by state population, comprising 25 percent of the
U.S. population. Likewise, the high electricity rate scenario is the average of the 10
highest-priced states weighted by state population, comprising 25 percent of the U.S.
population.14
The medium electricity rate is the average of the electricity prices from the
remaining 22 states, weighted by population. See Appendix B for the raw electricity price
data used to calculate the three rates.
Table 4-1: Electricity Price Scenarios
14
The top 25 percent section includes Washington, DC, as a state.

95
Electricity Price ($/kWh)
Low Electricity Rate $0.0711
Medium Electricity Rate $0.0993
High Electricity Rate $0.1627
Source: EIA 2009
4.1 Currently Available Technologies
This section includes a description of each current technology option as well as the
equations and assumptions used in order to calculate the energy savings potential and
installed cost premium for each technology. Table 4-2 shows which technologies apply
to which equipment types.
Table 4-2: Currently Available Energy Saving Technologies
S
up
erm
ark
et
Ref
rig.
Syst
ems
Walk
-in
s R
efri
g. F
ood
Ser
vic
e
Eq
uip
. B
ever
age
Mer
chan
dis
er
s Rea
ch-i
ns
Ice
Mach
ines
V
end
ing
Mach
.
Insulation Thicker Insulation
Fans
High-Efficiency Fan Motors
Fan Motor Controllers
High-Efficiency Fan Blades
Compress
ors
High Efficiency Compressors
Variable Capacity Compressor
Heat
Exchanger
s
Evaporator Design (Enhanced UA
Evap. Coil)
Condenser Design
Reduced Evaporator Thermal Cycling
Doors
Advanced Door Technologies
Low Heat Doors
Strip Curtains
Auto-Door Closer
Anti-
Sweat
Heaters
Hot Gas Anti-Sweat
Anti-sweat Heat Controls
Defrost Hot Gas Defrost
Defrost Control
Lighting LED Lighting
Lighting - High-Lumen Bulb, Low BF
Controls Case Controller & EEV
Reduced Meltage During Harvest

96
Floating Head-Pressure Control
Ambient Subcooling
Smart Proximity Sensor
Distributed Refrigeration
4.1.1 Insulation
Either increasing the insulation thickness or reducing insulation thermal conductivity will
reduce the energy consumption of commercial refrigeration equipment. Typical
insulation thicknesses range from 1 to 2 inches. Blow-in polyurethane foam is used for
most equipment. We assume an increase in total wall resistance, including inside and
outside air layers.
Much work has been done over the years to develop lower-conductivity foam insulation.
Reducing the conductivity would reduce the cabinet heat leak. A number of approaches
have been tried to reduce conductivity, including adjustment of the foam blowing process
or chemistry to allow formation of smaller air cells, use of opacity additives, use of foam
blowing gases with reduced conductivity, reduction of foam cell wall thickness, etc. The
state of the art in attainable foam insulation conductivity levels has remained relatively
unchanged in the past 10 years. However, new developments in this area may still be
possible.
Equations for the thicker insulation (TI) option:
W/kW 1000
hours/yr CycleDuty
COP
Reduction (W) Load Thermal
yr
kWhingsEnergy Sav SystemTI
8760(%)
(%)
SC
2
2
TI
MarkupDealer Markuprer Manufactu
($) Cost Retooling Unit )(ft Area Wallft
$ Cost Material
Premium Cost Installed
($)
Where for food service equipment, reach-ins and beverage merchandisers,
(yrs) Lifetime Line Product Retooled % (units) SalesAnnual
($) Cost Retooling Total
Cost Retooling Unit TI
($)
And for walk-ins, there are not retooling costs associated with thicker insulation.
The energy savings and cost premium for the thicker insulation option for display cases
and refrigerated vending machines are estimated using the engineering analysis
spreadsheets from the DOE standards rulemakings for commercial refrigeration

97
equipment (DOE 2009a) and beverage vending machines (DOE 2008b). We used the
“VCT.RC.M” classification for display cases, the “Large Class A” classification for
fully-cooled vending machines and “Large Class B” for zone-cooled vending machines.
For these equipment types, we present the overall installed cost premium, which includes
the added material cost and retooling costs for thicker insulation as calculated in the
respective rulemakings.
See Appendix A for the markups and Table 4-4 and Table 4-5 for the remaining
equation variables.
4.1.2 Fans
High Efficiency Fan Motors
Fan motors move air across the evaporator or condenser coil and typically run at one
speed. The manufacturer will match the motor size and blade to the coil to meet the
expected load under most operating conditions. Higher efficiency fan motors reduce
energy consumption by requiring less electrical power to generate motor shaft output
power. There are a variety of types and sizes of motors, depending on the application.
Key defining motor characteristics include shaft power output, power supply (AC or DC,
voltage, frequency, single or multiple phases), type of motor cooling, environmental
conditions, design life, etc. Motors used in commercial refrigeration applications in the
U.S. typically use AC power, with power input either single phase 60 Hz at 115 volts or
230 volts, or, for some larger condenser fan motors, three phase 60 Hz 208 volts or 460
volts. They have shaft power output ranging from 6W to multiple horsepower for large
condenser fan motors.
Electric motors operate based on the interaction between the magnetic fields of the rotor
and the stator. Induction motors are very common, and these motors have no magnets,
generating magnetic fields in the rotor by inducing current flow in the rotor windings.
Some motors have permanent magnets, leading, in some cases, to more efficient designs.
Single-phase induction motors require separate starting windings to assure proper start
rotation and sufficient starting torque. The type of start-up differentiates the three main
types of single phase induction motors, which include the shaded pole motor, the
permanent split capacitor motor (PSC), and the electronically commutated permanent
magnet motor (ECM). In a shaded-pole motor, the starting windings are “shaded” by a
copper loop. The interactions between the magnetic field generated by the shaded
portion and that generated by the un-shaded portion induce rotation when the motor is
powered. The imbalance between the shaded and un-shaded portions of the magnet
remains throughout operation. As a result, shaded-pole motors used in commercial
refrigeration applications with shaft power output ranging from 6W to 37W are
inefficient, with typical motor efficiencies less than 20 percent (Heinecke 2006). Shaded-
pole motors are, however, electrically simple and inexpensive.
In a PSC motor, a smaller, start-up winding is present in addition to the main winding.
The start-up winding is electrically connected in parallel with the main winding and in

98
series with a capacitor. At start-up, the interactions between the magnetic field generated
by the start up winding and that generated by the main winding induce rotation. Because
of the capacitor, however, the current to the start-up winding is cut off as the motor
reaches steady state. Because of this, PSC motors are more energy efficient than their
shaded-pole counterparts, with efficiencies for motors with shaft power ranging from 6W
to 37W in the range 50 to 70 percent. Like shaded-pole motors, PSC motors are
produced in large quantities and are relatively inexpensive (DOE 1997). The brushless
motor offers a 50 to 60 percent reduction in wattage.
A third type of electric motor, the electronically commutated permanent magnet (ECM)
motor (also known as a brushless permanent magnet motor), is more energy-efficient
than either shaded-pole or PSC motors. ECM motors are more complex than either
shaded pole or PSC motors, particularly for commercial refrigeration applications,
because they are internally powered with DC power. A power supply is required to
convert from AC line power to DC, and control electronics are required to handle the
electronic commutation, i.e. switching the power to the motor windings in
synchronization with motor rotation. For this reason, ECM motors can weigh more than
shaded pole or PSC motors, and they are more expensive.
Evaporator fans save additional energy due to the reduced refrigeration load and less
compressor energy required to remove it from the cabinet.
Energy savings equations for the PSC and ECM fan options:
W/kW 1000
hours/yr CycleDuty
Fans of Number WPower - (W)Poweryr
kWhingsEnergy Sav
Fan Cond
PSCBaseCond PSC,
8760(%)
))((
W/kW 1000
hours/yr CycleDuty
Fans of Number WPower - (W)Poweryr
kWhingsEnergy Sav
Fan Cond
ECMBaseCond ECM,
8760(%)
))((
W/kW 1000
hours/yr CycleDuty
Fans of Number WPower - (W)Poweryr
kWhingsEnergy Sav
Fan Cond
PSCBaseCond ECM,
8760(%)
))((
W/kW 1000
hours/yr
COPCycleDuty
Fans of Number WPower - (W)Poweryr
kWhingsEnergy Sav
Fan Evap
ECMBaseEvap ECM,
876011(%)
))((
Installed cost premium equation for PSC and ECM fan options:

99
SC
BaselinePSC
PSC
MarkupDealer Markuprer Manufactu
Fans of Number ($)) Cost OEM($) Cost EMO
Premium Cost Installed
(
($)
SC
BaselineECM
ECM
MarkupDealer Markuprer Manufactu
Fans of Number ($)) Cost OEM($) Cost EMO
Premium Cost Installed
(
($)
Table 4-3 shows typical power input and OEM costs for shaded pole, PSC, and ECM
motors for a range of shaft power levels relevant for commercial refrigeration.
Table 4-3: Fan Motor Typical Efficiencies and Costs ($2008)
Rated
Shaft
Output
(W)
SPM PSC ECM
Power
Input (W)
OEM
Cost
Power Input
(W)
OEM
Cost
Power Input
(W)
OEM
Cost
373 (1/2
hp) - 530 $75.23 450 $94.04
249 (1/3
hp) 370 $57.00 304 $71.00
125 (1/6
hp) 329 $50.15 202 $63.94 155 $80.24
50 (1/15
hp) 90 $53.91 65 $67.71
37 (1/20
hp) 110 $37.61 70 $50.15 49 $65.20
25 100 $31.35 51 $46.39 33 $60.18
20 90 $25.08 42 $43.88 27 $56.42
15 75 $18.81 33 $41.38 20.5 $52.66
9 53 $12.95 21 $17.35 12.5 $27.96
6 40 $12.17 15 $16.57 8.5 $27.19
Source: Communication with the Motor and Motion Association (SMMA)
See Appendix A for the markups and Table 4-4 and Table 4-5 for the remaining
equation variables.
Variable-Speed Control of Fan Motors
Variable-speed operation can reduce evaporator fan energy consumption and the
associated fan-heat load when cooling capacity requirements permit lower evaporator air
flows. However, under full-capacity operation, there is no energy savings benefit with
condenser fan motor controllers.
Equations for the evaporator fan control (EFC) option:
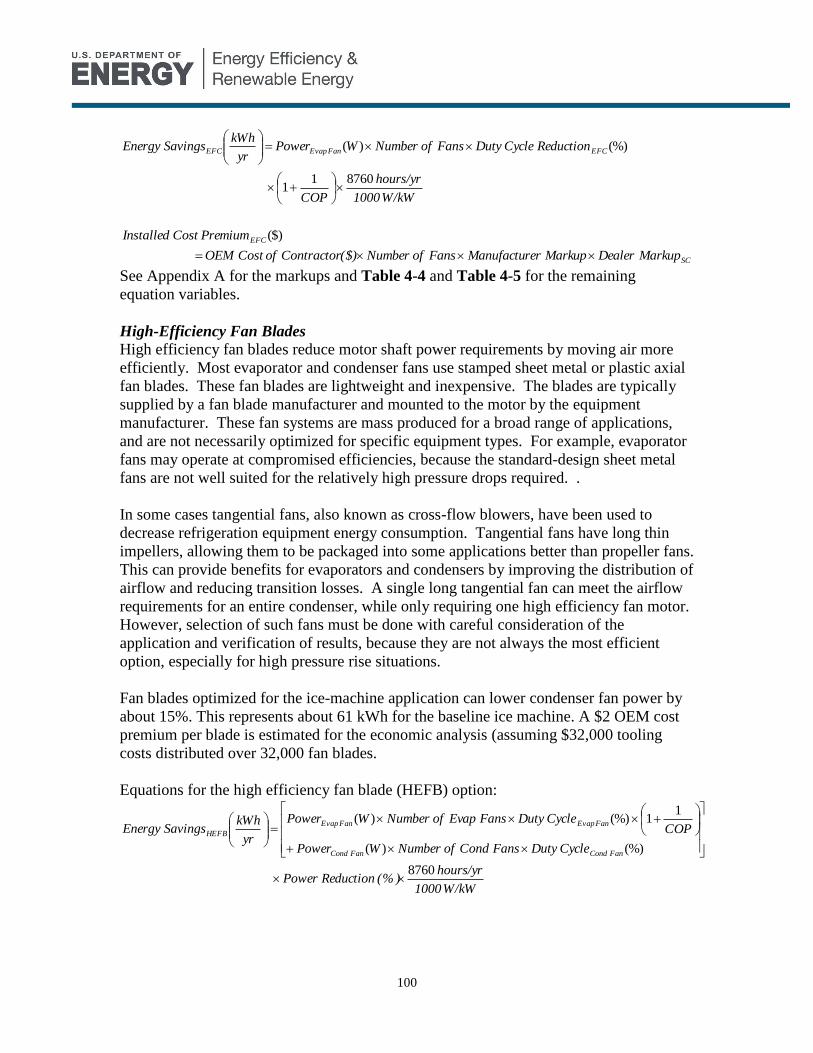
100
W/kW 1000
hours/yr
COP
Reduction CycleDuty Fans of Number WPower yr
kWhingsEnergy Sav EFCFan EvapEFC
876011
(%))(
SC
EFC
MarkupDealer Markuprer ManufactuFans of Number($)Contractor of Cost EMO
Premium Cost Installed
($)
See Appendix A for the markups and Table 4-4 and Table 4-5 for the remaining
equation variables.
High-Efficiency Fan Blades
High efficiency fan blades reduce motor shaft power requirements by moving air more
efficiently. Most evaporator and condenser fans use stamped sheet metal or plastic axial
fan blades. These fan blades are lightweight and inexpensive. The blades are typically
supplied by a fan blade manufacturer and mounted to the motor by the equipment
manufacturer. These fan systems are mass produced for a broad range of applications,
and are not necessarily optimized for specific equipment types. For example, evaporator
fans may operate at compromised efficiencies, because the standard-design sheet metal
fans are not well suited for the relatively high pressure drops required. .
In some cases tangential fans, also known as cross-flow blowers, have been used to
decrease refrigeration equipment energy consumption. Tangential fans have long thin
impellers, allowing them to be packaged into some applications better than propeller fans.
This can provide benefits for evaporators and condensers by improving the distribution of
airflow and reducing transition losses. A single long tangential fan can meet the airflow
requirements for an entire condenser, while only requiring one high efficiency fan motor.
However, selection of such fans must be done with careful consideration of the
application and verification of results, because they are not always the most efficient
option, especially for high pressure rise situations.
Fan blades optimized for the ice-machine application can lower condenser fan power by
about 15%. This represents about 61 kWh for the baseline ice machine. A $2 OEM cost
premium per blade is estimated for the economic analysis (assuming $32,000 tooling
costs distributed over 32,000 fan blades.
Equations for the high efficiency fan blade (HEFB) option:
W/kW 1000
hours/yr (% ) Reduction Power
CycleDuty Fans Cond of Number WPower
COPCycleDuty Fans Evap of Number WPower
yr
kWhingsEnergy Sav
Fan CondFan Cond
Fan EvapFan Evap
HEFB
8760
(%))(
11(%))(

101
MarkupDealer Markuprer Manufactu(% ) Increase Cost
Fans Evap of Number($) Blade Evaporator of ostC
Fans Cond of Number($) Blade Condenser of ostC Premium Cost Installed
Baseline
Baseline
HEFB
($)
See Appendix A for the markups and Table 4-4 and Table 4-5 for the remaining
equation variables.
4.1.3 Compressors
High-Efficiency Compressors
Several technologies exist to increase the efficiency of compressors. High efficiency
reciprocating and scroll compressors, which often incorporate variable-speed motors are
found in some supermarket refrigeration systems. These compressors have higher
efficiencies over a wide operating range than the traditional reciprocating compressors
commonly used in small, self-contained commercial refrigeration equipment.
However, for equipment types such as self contained refrigerators and vending machines
where the rating test procedure and efficiency standards are based on single operating
points, the efficiency advantages of variable speed compressors are not apparent.
Variable speed compressors may have similar or even lower efficiency than single speed
units at the rating point condition. Consequently, current efficiency standards for these
equipment types does not reward the application of variable speed compressors, which do
involve substantial additional costs.
Embraco supplies small, high-efficiency compressors to manufacturers of residential
refrigerator-freezers (i.e. Whirlpool, GE, Frigidaire, etc.). These compressors are low-
suction pressure units ranging from 600 Btu/h to 950 Btu/h in capacity. HFC-134a is the
refrigerant used. Reported compressor efficiencies for the Embraco EGX are up to 6.26
EER at -10°F evaporator temperature and 130°F condensing temperature. These
compressors are used as a basis for the achievable efficiencies of hermetic reciprocating
compressors. The theoretical maximum (isentropic) EER for the -10/130 rating condition
is 10.2. The overall efficiency of the 6.26 EER Embraco compressor is, therefore, 61%.
The prototypical beverage merchandiser compressor could be modified to achieve similar
efficiency by use of a higher-efficiency motor (80%), reducing suction gas pressure
losses, reducing the valve clearance gap, reducing the heating of suction gas within the
compressor shell, reducing pressure drop through the discharge valve, and reducing
mechanical losses. Improvement in the compressor to achieve a 60% overall efficiency
would result in a 20% reduction in the electric load.
For ice machines, energy savings are conservatively based on savings during the freeze
cycle only, since the savings associated with ice harvest is not well understood.
Scroll compressors compress gas in a fundamentally different manner from reciprocating
compressors—between two spirals, one fixed and one orbiting. High efficiency

102
reciprocating compressors are as efficient, or more efficient, than scroll compressors.
However, some drawbacks exist including noise, cost and reliability, compared to scroll
compressors.
Equations for the high efficiency compressor (HEC) option:
W/kW 1000
hours/yr
CycleDuty COPCOP
WCapacity yr
kWhingsEnergy Sav Compressor
HiEffBaseline
CompressorHEC
8760
(%)11
)(
SCHEC MarkupDealer Markuprer Manufactu($) Cost Compressor OEM Premium Cost Installed ($)
See Appendix A for the markups and Table 4-4 and Table 4-5 for the remaining
equation variables.
Vapor Injection (Supermarket Refrigeration only)
Some designs of scroll compressors incorporate an intermediate-pressure vapor inlet port,
which allows the compressor to be used in dual-stage configurations, for example the
Copeland ZF series (see Figure 4-1 for refrigeration circuit). The intermediate port can
accept refrigerant vapor from a liquid sub-cooling heat exchanger or from an intermediate
pressure flash tank. This approach improves efficiency by allowing part of the refrigerant
load to be served by compression of refrigerant from the higher intermediate pressure
level rather than from the lower suction pressure level. It allows implementation of
mechanical sub-cooling without use of a separate compressor.
Source: Emerson Climate Technologies 2007
Figure 4-1: Vapor Injection Circuit for Low Temperature Applications
ECM Compressor Motor
Improvement in compressor efficiency could also be achieved with the use of an ECM
compressor motor. Data for these motors in 1/3 and 1/2 hp sizes are presented in Table
4-3. Currently such compressors are only available in limited numbers for special order.
Equations for the ECM compressor motor (ECM) option:
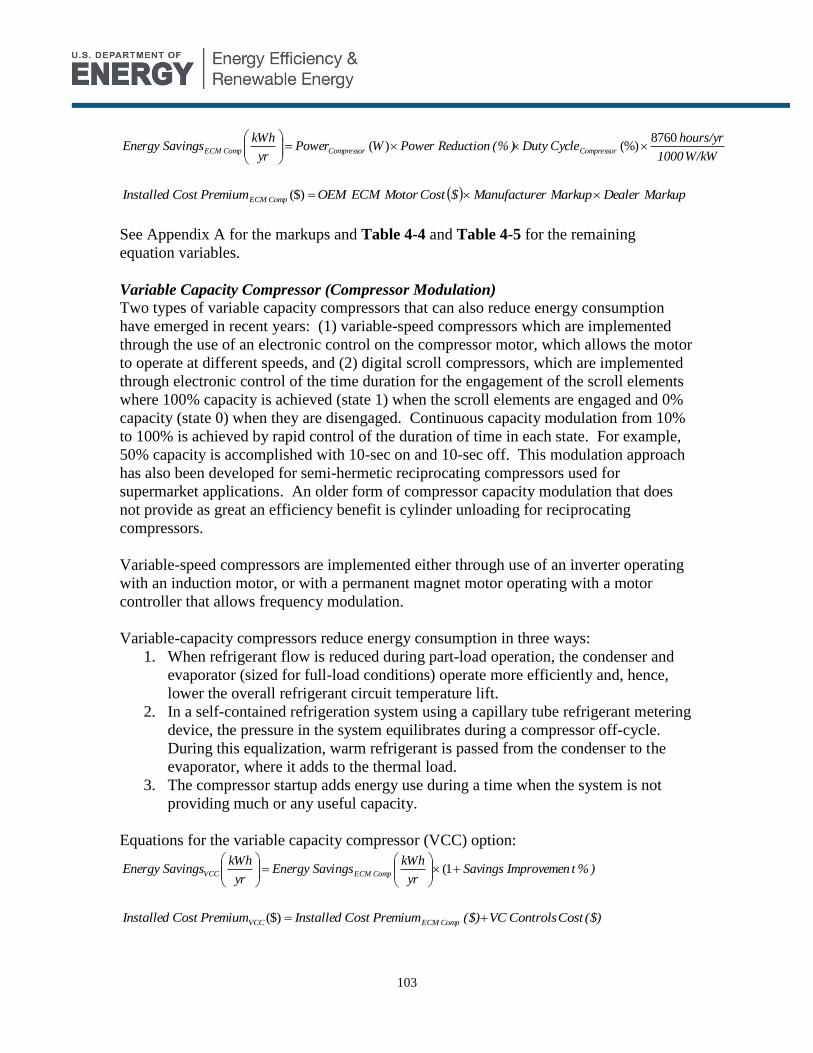
103
W/kW 1000
hours/yr CycleDuty (% ) Reduction PowerWPower
yr
kWhingsEnergy Sav CompressorCompressorComp ECM
8760(%))(
MarkupDealer Markuprer Manufactu$ Cost MotorECM OEM Premium Cost Installed Comp ECM ($)
See Appendix A for the markups and Table 4-4 and Table 4-5 for the remaining
equation variables.
Variable Capacity Compressor (Compressor Modulation)
Two types of variable capacity compressors that can also reduce energy consumption
have emerged in recent years: (1) variable-speed compressors which are implemented
through the use of an electronic control on the compressor motor, which allows the motor
to operate at different speeds, and (2) digital scroll compressors, which are implemented
through electronic control of the time duration for the engagement of the scroll elements
where 100% capacity is achieved (state 1) when the scroll elements are engaged and 0%
capacity (state 0) when they are disengaged. Continuous capacity modulation from 10%
to 100% is achieved by rapid control of the duration of time in each state. For example,
50% capacity is accomplished with 10-sec on and 10-sec off. This modulation approach
has also been developed for semi-hermetic reciprocating compressors used for
supermarket applications. An older form of compressor capacity modulation that does
not provide as great an efficiency benefit is cylinder unloading for reciprocating
compressors.
Variable-speed compressors are implemented either through use of an inverter operating
with an induction motor, or with a permanent magnet motor operating with a motor
controller that allows frequency modulation.
Variable-capacity compressors reduce energy consumption in three ways:
1. When refrigerant flow is reduced during part-load operation, the condenser and
evaporator (sized for full-load conditions) operate more efficiently and, hence,
lower the overall refrigerant circuit temperature lift.
2. In a self-contained refrigeration system using a capillary tube refrigerant metering
device, the pressure in the system equilibrates during a compressor off-cycle.
During this equalization, warm refrigerant is passed from the condenser to the
evaporator, where it adds to the thermal load.
3. The compressor startup adds energy use during a time when the system is not
providing much or any useful capacity.
Equations for the variable capacity compressor (VCC) option:
% ) tImprovemen Savingsyr
kWhngsnergy SaviE
yr
kWhingsEnergy Sav Comp ECMVCC
1(
($) Cost Controls VC($) Premium Cost Installed Premium Cost Installed Comp ECMVCC ($)
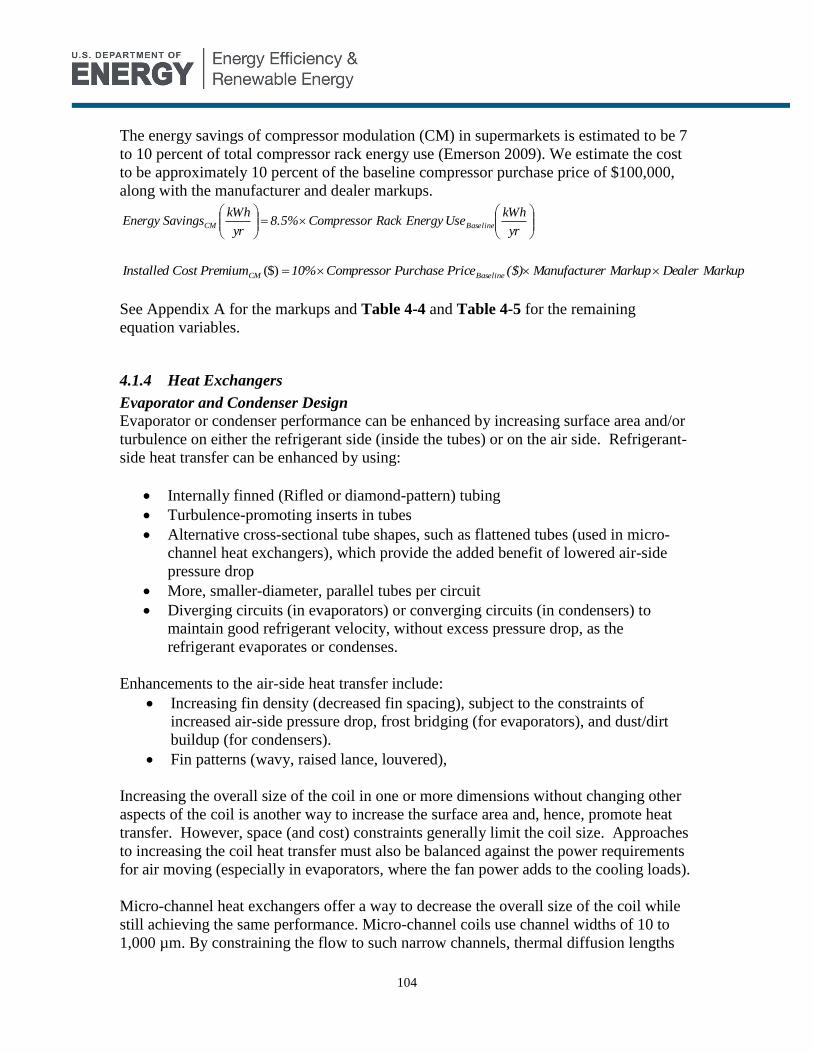
104
The energy savings of compressor modulation (CM) in supermarkets is estimated to be 7
to 10 percent of total compressor rack energy use (Emerson 2009). We estimate the cost
to be approximately 10 percent of the baseline compressor purchase price of $100,000,
along with the manufacturer and dealer markups.
yr
kWhUseEnergy Rack ompressorC 8.5%
yr
kWhingsEnergy Sav BaselineCM
MarkupDealer Markuprer Manufactu($) Price Purchase Compressor10% Premium Cost Installed BaselineCM ($)
See Appendix A for the markups and Table 4-4 and Table 4-5 for the remaining
equation variables.
4.1.4 Heat Exchangers
Evaporator and Condenser Design
Evaporator or condenser performance can be enhanced by increasing surface area and/or
turbulence on either the refrigerant side (inside the tubes) or on the air side. Refrigerant-
side heat transfer can be enhanced by using:
Internally finned (Rifled or diamond-pattern) tubing
Turbulence-promoting inserts in tubes
Alternative cross-sectional tube shapes, such as flattened tubes (used in micro-
channel heat exchangers), which provide the added benefit of lowered air-side
pressure drop
More, smaller-diameter, parallel tubes per circuit
Diverging circuits (in evaporators) or converging circuits (in condensers) to
maintain good refrigerant velocity, without excess pressure drop, as the
refrigerant evaporates or condenses.
Enhancements to the air-side heat transfer include:
Increasing fin density (decreased fin spacing), subject to the constraints of
increased air-side pressure drop, frost bridging (for evaporators), and dust/dirt
buildup (for condensers).
Fin patterns (wavy, raised lance, louvered),
Increasing the overall size of the coil in one or more dimensions without changing other
aspects of the coil is another way to increase the surface area and, hence, promote heat
transfer. However, space (and cost) constraints generally limit the coil size. Approaches
to increasing the coil heat transfer must also be balanced against the power requirements
for air moving (especially in evaporators, where the fan power adds to the cooling loads).
Micro-channel heat exchangers offer a way to decrease the overall size of the coil while
still achieving the same performance. Micro-channel coils use channel widths of 10 to
1,000 µm. By constraining the flow to such narrow channels, thermal diffusion lengths

105
are short, and the characteristic heat transfer coefficients are very high. With such high
thermal performance, relatively short flow passages are required, and with many flow
passages in parallel in a small device, the pressure drop can also be small (PNL 2008).
Studies have shown that both the COP and cooling capacity of systems using a micro-
channel condenser were higher than those for the round-tube condenser (International
Journal of Refrigeration 2008b). Micro-channel technology is currently used widely for
condensers in automotive air-conditioning and is starting to be adopted in other HVAC
applications, where small size and low weight is important and/or where need for a very
large amount of heat exchanger surface area makes the technology cost effective. In this
report, micro-channel technology is considered an existing technology but omitted from
the economic analysis due to its low market penetration in the refrigeration market. The
technology is not appropriate for refrigeration evaporators and is typically not cost
effective for sizes needed for the condensers of most of the equipment discussed in the
report. However, for large supermarket condensers, micro-channel technology might
become cost effective.
The energy savings and cost premium for the enhanced evaporator option in display cases
is estimated for the vertical, remote-condensing display case with transparent doors using
the engineering analysis spreadsheet from the DOE standards rulemaking for display
cases (DOE 2009a).
The energy savings and cost premium for the enhanced condenser option for refrigerated
vending machines is estimated using the engineering analysis spreadsheet from the DOE
standards rulemaking for beverage vending machines (DOE 2008b). We used the “Large
Class A” classification for fully-cooled vending machines and “Large Class B” for zone-
cooled vending machines.
Supermarket condensers can achieve energy savings through the use of both higher
efficiency fan motors and variable frequency drive (VFD) of the fan motors. High
efficiency fan motors use an electronically commutated motor (ECM) and can achieve up
to 90 percent motor efficiency, therefore requiring less power to produce the same
amount of air flow. VFD can be implemented as a stand-alone option, but it is
increasingly incorporated into the overall refrigeration control system. The EIA gives an
estimate for energy savings using a set of high efficiency remote air-cooled condensers to
be 27 percent, with an associated cost premium of $5,000.
Reduced Thermal Cycling of the Evaporator (Ice Machines only)
In the baseline ice machine, the thermal cycling of the evaporator accounts for about 9%
of the compressor input energy during the freeze cycle. The prototypical evaporator
design is a copper serpentine attached to the rear of plated copper waffle ice-making
surfaces. Copper has a high thermal conductivity, but also a high thermal mass.
Assuming the thermal mass could be reduced by a factor of two with no change in
thermal conductivity, a savings of about 4-5%, or about 230-290 kWh/yr could be
realized. Realistically, a reduction of the thermal mass for this evaporator design would
106
probably result in lower thermal conductivity, which would offset some of the projected
savings for the ideal case.
Equations for the reduced thermal cycling (RTC) option:
See Table 4-4 for definitions of the equation variables. The installed cost premium is
adapted directly from ADL 1996 to approximately $25 using the inflation factor
described in 0.
External Heat Rejection (Walk-in Freezers only)
Some smaller walk-in coolers and freezers with packaged refrigeration systems are
installed in interior spaces and reject heat to the interior space, for the convenience of
installation. Efficiency of these systems could be improved by external rejection of heat.
This would require external placement of the condenser or of the entire condensing unit.
The use of internal heat rejection will also impact energy requirements for space
conditioning either (1) due to the increased make-up air requirement associated with
exhausting the heat, or (2) by directly impacting the air-conditioning load. For the
representative city, Washington D.C., the walk-in freezer compressor and condenser duty
cycle is reduced from 70% to 61% (ADL 1996). The cost premium represents the
additional installation labor required, which we assume to be 8 hours of work by two
workers at a wage of $63/hr (ADL 1996, adjusted for inflation).
Equations for external heat rejection (EHR) option:
W/kW 1000
hours/yr WPowerWPowerCycleDuty educedR
yr
kWhingsEnergy Sav Fan CondenserCompressorEHREHR
8760))()(((%)
(hrs) Time onInstallati hr
$ workersof # Premium Cost Installed ASC
($)
See Table 4-4 and Table 4-5 for definitions of the equation variables.
4.1.5 Anti-Sweat Heaters
Hot Gas Anti-Sweat Heating
It is possible that electric anti-sweat heaters (ASH) could be replaced by a hot refrigerant
gas line running around the doorframe. This technology is used extensively in residential
freezers. Implementation in self-contained commercial refrigerators and freezers has
begun due to increased interest in high efficiency technologies, despite concerns of
durability compared to the electric heating option. Implementation in supermarket display
cases is complicated because it would require additional piping runs to the cases. Some
display cases use hot gas defrost, and these cases would have a source for the hot gas
needed to supply such an ASH loop. However, the refrigerant leaving this loop may not
be completely condensed, and hence feeding the exit refrigerant into the evaporator may
(% ) Reduction UseEnergy yr
kWhUseEnergy ompressorC
yr
kWhingsEnergy Sav BaselineRTC
107
be counterproductive. For both supermarket and self-contained products, another
consideration is the possibility of the operators penetrating the anti-sweat loop with
fasteners, something that is much more likely to occur in commercial than residential
settings.
Equations for hot gas anti-sweat (HGAS) option:
(%))( ASHASHHGAS CycleDuty WPower yr
kWhingsEnergy Sav
(ft) Doors of Perimeter ft
$ Cost PipeCost Retooling Unit Premium Cost Installed HGASHGAS
($)($)
Where,
rs)Lifetime(y Line ProductRetooled %(units) SalesAnnual
Cost Retooling Total Cost Retooling Unit HGAS
HGAS
($)
($)
See Table 4-4 and Table 4-5 for definitions of the equation variables.
Anti-Sweat Heater Control
Anti-sweat heaters (ASH) are necessary to prevent condensation on door-gasket surfaces
and glass (for display cases and beverage merchandisers), the temperatures of which can
be below the ambient air dew point. ASHs often operate continuously. ASH controllers
can lower energy consumption during low-humidity conditions by operating heaters only
as needed to maintain surface temperatures above the dew-point temperature. A heater
can be turned on when the temperature of the heated surface falls below the dew point, or
the heaters can be cycled with on-times increasing with increasing dew-point
temperature. We assume that anti-sweat-heater controls lower the total anti-sweat
heating load by 1/3. Reducing ASH on-time also yields refrigeration energy savings,
since ASHs contribute to case heat load. We assume that half of the anti-sweat heating
load contributes to the refrigeration load. Installed cost of sensor and controller is
approximately $627.
Equations for anti-sweat heater control (ASHC) option:
COPReduction PowerWPower
yr
kWhingsEnergy Sav ASHCASHASHC
2
11(%))(
Cost($) Controller & SensorPremium Cost Installed ASHC ($)
See Table 4-4 and Table 4-5 for definitions of the equation variables.
4.1.6 Doors
Display-Case Door Technologies
Doors to refrigerated display cases can be improved by using both anti-sweat heater
control and better materials. Instead of an aluminum frame, a less-conductive vinyl-
composite frame can be used. Also, the doors can be constructed using glass that lowers
both thermal radiation and heat conduction.
108
The energy savings and cost premium for the improved display case door option are
estimated for the vertical, remote-condensing display case with transparent doors using
the engineering analysis spreadsheet from the DOE standards rulemaking for display
cases (DOE 2009a).
Automatic Door Closer (Walk-ins only)
The automatic door closer is a device that automatically closes the door when it is left
open. This reduces ambient air infiltration and decreases the refrigeration load. Energy
savings and cost data is taken directly from the analysis in PG&E 2004.
Strip Curtains (Walk-ins only)
Strip curtains are clear flexible strips located at the opening of a walk-in cooler or freezer.
They reduce ambient air infiltration when the door is open. Energy savings and cost data
is taken directly from the analysis in PG&E 2004.
High Efficiency Low/No Heat Reach in Doors (Walk-ins only)
Walk-ins with reach-in doors can have gas-filled, multi-pane glass that reduces or
eliminates use of anti-sweat heaters. The insulated glass panels also reduce the heat
conducted into the refrigerated space and thus decrease the refrigeration load. Energy
savings and cost data is taken directly from the analysis in PG&E 2004.
4.1.7 Defrost
Defrost Mechanisms
There are three methods available for defrosting the evaporator coil in this case: off-cycle
defrost, electric defrost, and hot gas defrost. Off-cycle defrost involves shutting off
refrigerant flow to the coil while leaving the evaporator fan running. This method is used
in refrigerators where cabinet air is above the freezing point of water and can be used to
melt the frost. Electric defrost is used in freezers where the air temperature is not high
enough to defrost the coil, and where defrost must occur quickly to prevent any
significant rise in product temperature. Electric defrost involves melting frost by briefly
turning on an electric resistance heater, which is in contact with or near the evaporator
coil. Hot-gas defrost involves piping and valves that direct hot gas from the compressor
discharge into the evaporator that would otherwise be waste heat, therefore using energy
more efficiently. Control of the defrost cycle can also lead to increased energy savings.
Costs would increase due to additional controls and refrigerant piping.
Equations for the hot gas defrost (HGD) option:
kWW
yrhrs
CycleDuty WPower yr
kWhingsEnergy Sav DefrostDefrostHGD
1000
8760(%))(
Installed cost premium is based on research from ADL 1996 related to HGD in
supermarkets, where the total cost was $3,800 for 46 circuits in 1996. We assumed twice
109
the cost for the same number of circuits equaling $165 per circuit. Here, we use the price
for one circuit as the installed cost premium.
circuit ($)circuit per Cost Premium Cost Installed HGDHGD 1($)
See Table 4-4 and Table 4-5 for definitions of the equation variables.
Defrost Control (Reach-in Freezers only)
The most promising defrost technique involves monitoring the temperature drop across
cooling coils to determine whether air flow rates have dropped. Defrost control is
estimated to eliminate half of the required defrost energy for the six cooler months of the
year, with additional compressor energy savings due to reduced internal load (ADL
1996).
Equations for defrost control (DC) option:
kWW
yrhrs
COPyear) of 0.5
(% ) ReductionEnergy CycleDuty WPower yr
kWhingsEnergy Sav DefrostDefrostDC
1000
87601
1(
(%))(
($) Controls & Sensors2 of Cost Premium Cost Installed DC ($)
See Table 4-4 and Table 4-5 for definitions of the equation variables.
4.1.8 Lighting
High Efficiency Lighting
Efficiency in lighting is commonly measured as efficacy (lumens/watt), or the quantity of
light output (measured in lumens) divided by electrical power input (measured in Watts).
For display cases, beverage merchandisers, and vending machines, since sales levels
strongly correlate with lighting levels, energy savings will most likely be accomplished
through use of high-efficiency lamps and ballasts, rather than reduction in light output.
The refrigeration industry has transitioned into the use of T-8 and fluorescent lighting in
commercial refrigeration equipment with lighting, which is substantially more efficacious
than T-12 lighting.
T-8 lighting is predominantly used with electronic ballasts, which are more efficient than
magnetic ballasts commonly used in T-12 lighting. Electronic ballasts use solid state
electronics to modulate power provided to fluorescent lamps. Electronic ballasts, which
convert power at high frequency, have lower electrical resistance losses compared to
magnetic ballasts which operate at line frequency. Fluorescent lamps also operate more
efficiently at the higher frequency provided by electronic ballasts. In addition to the

110
direct reductions in electrical power consumption, heat generated by the lighting and the
lighting ballast contributes to the cabinet or case heat load, since these components are
typically installed in the refrigerated space. Therefore, increasing ballast and/or lamp
efficiency reduces refrigeration loads. We assume that approximately two thirds of the
heat from lighting enters the refrigerated space.
An even more recent trend is the use of light emitting diode (LED) technology. Although
LEDs are currently less efficacious than fluorescent technology, they are more directional
than linear fluorescent bulbs, allowing for comparable illumination with less total
wattage. In addition, they are more amenable to rapid on/off control than fluorescents, so
they are more suitable to be used with proximity sensors, and they may be more
amenable to low-temperatures operations. There have been recent advancements in LED
efficacy as well as the adoption of LED technology. For example, Seaga Manufacturing
uses LEDs in their new Premium Collection of refrigerated beverage vending machines.
Research by the Lighting Resource Center indicates that lighted display cases using
LEDs are attractive to consumers. LEDs are predicted to steadily increase in efficacy and
decrease in cost as the technology improves (RPI 2002).
An estimated potential energy savings of 6% could be achieved through the use high
efficient bulbs and low ballast factor. An estimated potential energy savings of 74%
could be achieved through the use of LED lighting.
Equations for high efficiency fluorescent lighting (HEF) option:
kWW
yrhrs
CycleDuty CycleDuty COP
Ballasts of WPower BallastWPower Ballast
Bulbs of # WPower BulbWPower (Bulb
yr
kWhingsEnergy Sav
LightingSystem
HEFBaseline
HEFBaseline
HEF
1000
8760(%)(%)
321
#))()((
))()(
MarkupDealer Markuprer Manufactu Bulbs of #
bulb
$Cost Ballast OEM
bulb
$Cost Bulb OEM -
bulb
$Cost Ballast OEM
bulb
$Cost Bulb OEM
Premium Cost Installed
HEFHEF
HEFHEF
HEF
($)
Equations for LED lighting (LED) option:
kWW
yrhrs
CycleDuty CycleDuty COP
Ballasts of WPower Ballast
)Bulbs of # WPower BulbBulbs of # WPower (Bulb
yr
kWhingsEnergy Sav
LightingSystem
Baseline
LEDLEDBaselineBaseline
LED
1000
8760(%)(%)
11
#)(
)()(

111
MarkupDealer Markuprer Manufactu
bulb
$Cost Ballast OEM Bulbs of #
bulb
$Cost Bulb OEM -Bulbs of #
bulb
$Cost Bulb OEM
Premium Cost Installed
BaselineBaseline
BaselineLEDLED
LED
($)
See Appendix A for the markups and Table 4-4 and Table 4-5 for the remaining
equation variables.
The energy savings and cost premium for both lighting options in display cases is
estimated for the vertical, remote-condensing display case with transparent doors using
the engineering analysis spreadsheet from the DOE standards rulemaking for display
cases (DOE 2009a).
The same information for refrigerated vending machines is estimated using the
engineering analysis spreadsheet from the DOE standards rulemaking for beverage
vending machines (DOE 2008b). We used the “Large Class A” classification for fully-
cooled vending machines and “Large Class B” for zone-cooled vending machines.
Beverage merchandisers are assumed to use the same lighting as fully-cooled refrigerated
vending machines.
4.1.9 Controls
Supermarket Controls
Control systems for supermarket refrigeration systems have evolved significantly over
the years. Most systems now use electronic controls using temperature and pressure
sensors to monitor operating conditions and sequence rack compressor operation. Much
more sophisticated control algorithms can be implemented with these controls than could
be achieved with older mechanical controls, which are now no longer common. The
increased communications capability of such systems also allows feedback of display
case conditions to the compressor controllers, which allows the rack suction pressure set
points to be floated upwards if all case temperature set points are being met.
High Efficiency Expansion Valves (Supermarkets Only)
Expansion valves are refrigerant metering devices whose purpose is to control the amount
of refrigerant flowing to the evaporator coil. In doing so, they simultaneously decrease
the temperature and pressure of the refrigerant, creating a cold liquid-vapor mixture. The
low temperature refrigerant leaving the expansion valve can absorb the heat of the
refrigerated space in the evaporator.
The most basic type of expansion device is a capillary tube. The capillary tube is a long
thin tube that imposes a pressure drop in between the condenser and the evaporator as the
refrigerant flows through it. Capillary tubes must be sized to the particular application
and cannot adjust for variations in load or ambient operating conditions. They are often

112
oversized for worst-case conditions, and therefore may operate at reduced efficiency
during normal operation. Capillary tubes are used in most self-contained commercial
refrigeration equipment. They have the advantage of allowing easy integration with the
suction line to form a suction line heat exchanger.
Two alternative expansion valve technologies are thermostatic expansion valves (i.e.,
TXVs) and electronic expansion valves (i.e., EEVs). TXVs are mechanical control
devices which adjust refrigerant flow to control the refrigerant superheat leaving the
evaporator. They work by application of two pressures balancing forces on opposite
sides of the valve plunger, the evaporating pressure and the pressure of a thermostatic
bulb in contact with the evaporator exit piping. By appropriate selection of the “charge”
within the bulb and adjustment of a counterbalance spring, the desired level of superheat
is achieved over a range of evaporating pressures and conditions. TXVs are commonly
used in refrigerated display cases.
EEVs are valves with actuation motors that are controlled electronically, based on sensor
input representing the evaporating temperature and the evaporator exit temperature. By
controlling superheat more precisely, EEVs provide better assurance that evaporators are
optimally utilized, which provides more margin for raising of the suction pressure set
point. EEVs also have a much wider flow range, which allows floating head pressure
control to be set for lower minimum condensing temperatures. Electronic evaporator
pressure regulators allow for more precise case temperature control, which also provides
more margin on suction pressure set points. These controls can help keep the system
operating with minimized pressure lift, thus reducing the required compressor power
input.
Reducing Meltage During Harvest (Ice Machines only)
Ice meltage during harvest is assumed to be 15% for the baseline ice machine, based on
performance measurements of a machine similar to the baseline machine described in
Section 3.6.1 (ADL 1996). Meltage can be reduced by reducing the time the ice is
exposed to the ice-making surface that has been warmed for harvest. The baseline design
uses gravity to pull the ice off the plate. Assisting gravity in pulling the ice off the plate
will reduce the time the ice is in contact with the warmed ice-making surface. One
manufacturer uses a mechanical assist to push the ice off the ice-making surface. Another
manufacturer uses a patented design involving a series of plastic baffles to separate the
ice cubes, to which the ice does not adhere. Ice is removed after an 8-second application
of hot gas to the evaporator. The manufacturer claims that ice meltage is negligible
(ADL 1996).
Assuming the meltage rate can be reduced by 50%, the energy consumption required for
the freeze cycle can be reduced by about 5%. Figure 3-27 shows that the cooling
associated with the meltage water amount is about 10% of the total freeze cycle thermal
load.
Equations for reduced meltage during harvest (RM) option:

113
(%)RMCycle FreezeRM Reduction UseEnergy yr
kWhEnergy
yr
kWhingsEnergy Sav
MarkupDealer Markuprer Manufactu ($) Cost OEMPremium Cost Installed RM ($)
See Appendix A for the markups and Table 4-4 and Table 4-5 for the remaining
equation variables.
Floating Head Pressure (Walk-ins only)
Better expansion valve and control technologies allow the head pressure of the
compressor to float and, therefore, take advantage of the lower temperature lifts that are
theoretically achievable at lower ambient temperatures. This decreases the load on the
compressor.
Equations for floating heat pressure (FHP) option:
)Fan CondenserCompressorFHPFHP Power(Power (% ) CycleDuty Reduced yr
kWhingsEnergy Sav
Modified expansion valves and head pressure control have the same per-circuit cost
premium for floating head pressure as assumed for supermarkets. Installed cost premium
is based on research from ADL 1996 related to FHP in supermarkets, where the total cost
was $8,000 for 46 circuits in 1996. We assumed twice the cost for the same number of
circuits equaling $348 per circuit. Here, we use the price for one circuit as the installed
cost premium.
circuit ($) circuit per CostPremium Cost Installed FHP 1($)
See Table 4-4 and Table 4-5 for definitions of the equation variables.
Ambient Sub-Cooling (Walk-ins only)
Ambient subcooling is accomplished using a heat exchanger (subcooler) to further cool
further the refrigerant leaving the condenser to boost refrigeration capacity with no
increase in compressor power draw. We assume that the refrigeration system purchase
price is half of the list price ($7,000 in ADL 1996, $8777 inflated to 2008), and that
ambient sub-cooling adds 10% to the purchase price.
Equations for ambient sub-cooling (ASC) option:
)Fan CondenserCompressorASCASC Power(Power (% ) CycleDuty Reduced yr
kWhingsEnergy Sav
Premium ($) Cost SystemionRefrigeratPremium Cost Installed ASC %10($)
114
See Table 4-4 and Table 4-5 for definitions of the equation variables.
Energy Management System (EMS)
These technologies have the ability to save energy through detection of the surrounding
environment and adapting the energy consumption in real time. These technologies range
from simple proximity sensors that simply turn off the lighting to more complex sensors
that control the cooling load as well. In this report we will consider the more complex
technology as an energy-saving option in our analysis. These advanced sensors learn the
behavior of the surrounding environment and adapt to it in real time. They apply learning
algorithms to real time conditions and in effect learn their surroundings, thus improving
with time. Because they have the capability of reducing both lighting and cooling loads
they can save up to 35 percent of the annual energy consumption in beverage
merchandisers and 20 percent in refrigerated vending machines (Elstat 2009). The
savings include 60% due to lighting and 40% due to cooling.
Equations for the energy management system (EMS) option:
yr
kWh nConsumptioEnergy nitU (% ) ReductionEnergy
yr
kWhingsEnergy Sav EMSEMS
100$($) EMSPremium Cost Installed
See Table 4-4 and Table 4-5 for definitions of the equation variables. Installed cost is
estimated based on conversation with leading manufacturer of an EMS (Elstat 2009).
Distributed Refrigeration (Supermarket Refrigeration only)
Distributed refrigeration systems use multiple compressors that have been arranged in
cabinets located near the loads they serve. The heat from the display cases is rejected
either using air-cooled condensers located on the rooftop above the compressor cabinets
or using a glycol loop that connects the cabinets to a fluid cooler (See Figure 4-2). The
balance has tipped almost completely to air-cooled condensers in new installations,
because the installation and maintenance costs are cheaper without the fluid cooler
(Emerson 2009). Scroll compressors are used due to their low noise and vibration levels
since they are located in the sales area. Such a configuration requires 50-70 percent less
refrigerant charge than a multiplex direct expansion system. Using simulation tools, the
energy savings of distributed refrigeration using evaporative-cooled fluid coolers have
been estimated to be 11 percent compared to a baseline air-cooled multiplex refrigeration
system, with an added cost of $60,000 per store. However, approximately 8 percent of the
savings are associated with evaporative cooling (IEA 2003).
Implementation of distributed refrigeration systems in new supermarket construction is
becoming more common, because supermarkets are under increasing pressure to reduce
refrigerant charge, but energy use is generally not significantly reduced compared to
conventional rack systems. Consequently, we do not analyze distributed systems in our
energy savings analysis.

115
Source: IEA 2003
Figure 4-2: Water-Cooled Distributed Refrigeration System

116
Table 4-4: Equipment Specifications and Duty Cycle Assumptions
Dis
pla
y C
ase
s
Com
pre
ssor
Rack
s
Su
per
mark
et
Con
den
sers
Walk
In
Coole
rs
Walk
In
Fre
eze
rs
Food
Ser
vic
e
Eq
uip
.
Annual Energy Use (kWh/yr) 8,688 1,000,
000
138,00
0 42182 15524 3472
Compressor COP 4.04 1.71 ---- 3.42 1.00 2.04
Compressor Capacity (Btu/hr) ---- 1,080,
000 ---- 44,926 4,930 1,250
Compressor Power (W) ---- 185,00
0 ---- 3,850 1,445 180
Wall Area (ft2) ---- ---- ---- 648 353 67.85
Wall Thickness (in) 204 ---- ---- 4 4 2.25
Glass Area (ft2) 1.5 ---- ---- ---- ---- ----
Evaporator Fan Motor Output
(W) 2610 ---- ---- 37 20 6
Evaporator Fan Motor Power
Input (W) 65 ---- ---- 100 90 15
Number of Evaporator Fans Shade
d Pole ---- ---- 8 2 1
Condenser Fan Motor Output
(W) 6 ---- ? 373 125 9
Condenser Fan Motor Power
Input (W) 30 ---- ? 530 329 53
Number of Condenser Fans 5 ---- ? 2 1 1
Defrost Power (W) ---- ---- ---- ---- 2000 ----
Hot Gas Solenoid (W) 1 ---- ---- ---- ---- ---- ----
Anti-sweat Heater Power (W) ---- ---- ---- 300 230 50.60
Lighting Type
---- ---- ----
T-8,
Elec
Ballast
Incand
-escent
T-8,
Elec
Ballast
Number of Bulbs/Ballasts ---- ---- ---- 4/1 2 ----
Bulb Power (W/bulb) ---- ---- ---- 72 40 ----
Ballast Power (W/bulb) 500 ---- ---- ? ---- ----
System
T-8,
Elec
Ballast
100% 100% 100% 100% 100%
Compressor 6 0.0 ---- 66% 70% 65%
Evaporator Fan 58 ---- ---- 100% 100% 100%
Condenser Fan 0 ---- 0 66% 70% 65%
Anti-sweat Heater 100% ---- ---- 100% 100% 100%
Defrost ---- ---- ---- 4% 6%
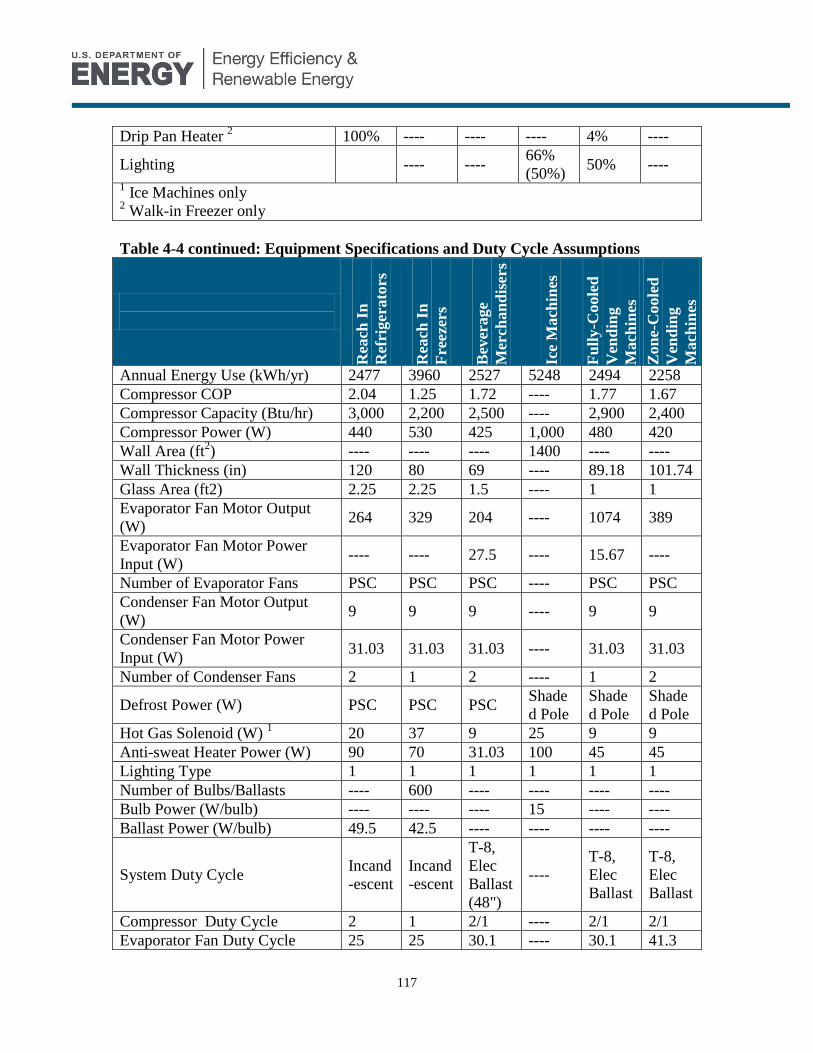
117
Drip Pan Heater 2 100% ---- ---- ---- 4% ----
Lighting ---- ---- 66%
(50%) 50% ----
1 Ice Machines only
2 Walk-in Freezer only
Table 4-4 continued: Equipment Specifications and Duty Cycle Assumptions
Rea
ch I
n
Ref
rigera
tors
Rea
ch I
n
Fre
eze
rs
Bev
erage
Mer
chan
dis
ers
Ice
Mach
ines
Fu
lly
-Coole
d
Ven
din
g
Mach
ines
Zon
e-C
oole
d
Ven
din
g
Mach
ines
Annual Energy Use (kWh/yr) 2477 3960 2527 5248 2494 2258
Compressor COP 2.04 1.25 1.72 ---- 1.77 1.67
Compressor Capacity (Btu/hr) 3,000 2,200 2,500 ---- 2,900 2,400
Compressor Power (W) 440 530 425 1,000 480 420
Wall Area (ft2) ---- ---- ---- 1400 ---- ----
Wall Thickness (in) 120 80 69 ---- 89.18 101.74
Glass Area (ft2) 2.25 2.25 1.5 ---- 1 1
Evaporator Fan Motor Output
(W) 264 329 204 ---- 1074 389
Evaporator Fan Motor Power
Input (W) ---- ---- 27.5 ---- 15.67 ----
Number of Evaporator Fans PSC PSC PSC ---- PSC PSC
Condenser Fan Motor Output
(W) 9 9 9 ---- 9 9
Condenser Fan Motor Power
Input (W) 31.03 31.03 31.03 ---- 31.03 31.03
Number of Condenser Fans 2 1 2 ---- 1 2
Defrost Power (W) PSC PSC PSC Shade
d Pole
Shade
d Pole
Shade
d Pole
Hot Gas Solenoid (W) 1 20 37 9 25 9 9
Anti-sweat Heater Power (W) 90 70 31.03 100 45 45
Lighting Type 1 1 1 1 1 1
Number of Bulbs/Ballasts ---- 600 ---- ---- ---- ----
Bulb Power (W/bulb) ---- ---- ---- 15 ---- ----
Ballast Power (W/bulb) 49.5 42.5 ---- ---- ---- ----
System Duty Cycle Incand
-escent
Incand
-escent
T-8,
Elec
Ballast
(48")
----
T-8,
Elec
Ballast
T-8,
Elec
Ballast
Compressor Duty Cycle 2 1 2/1 ---- 2/1 2/1
Evaporator Fan Duty Cycle 25 25 30.1 ---- 30.1 41.3
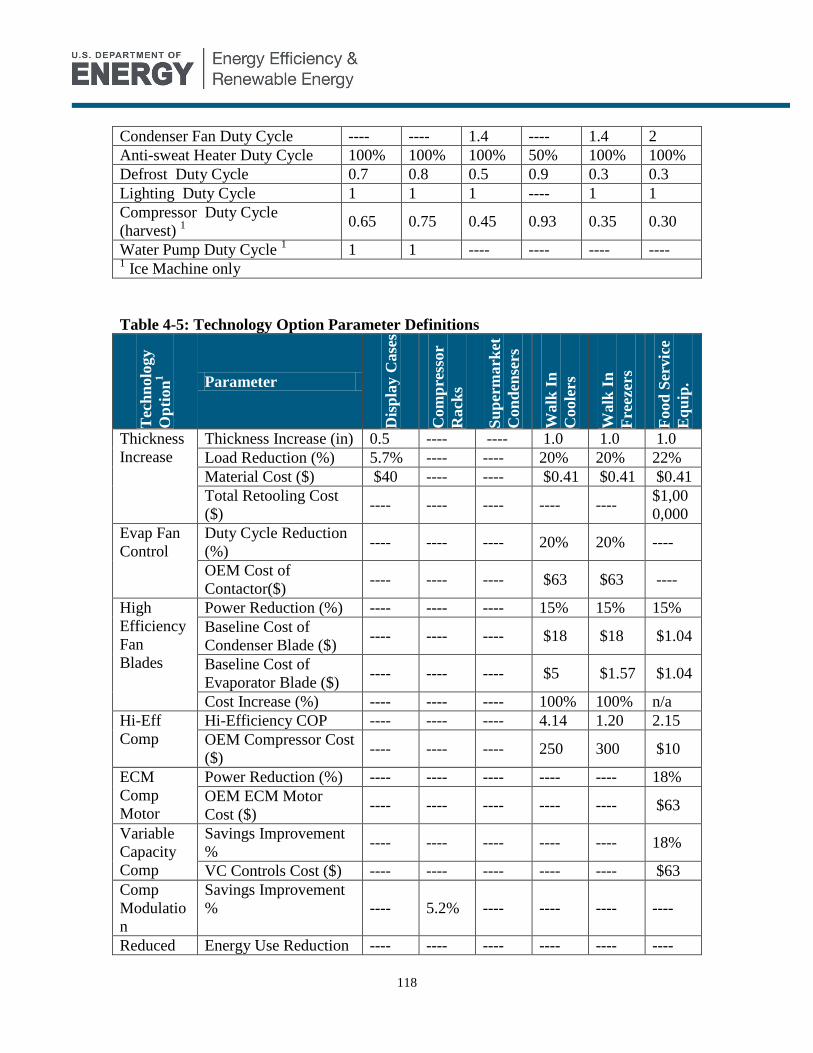
118
Condenser Fan Duty Cycle ---- ---- 1.4 ---- 1.4 2
Anti-sweat Heater Duty Cycle 100% 100% 100% 50% 100% 100%
Defrost Duty Cycle 0.7 0.8 0.5 0.9 0.3 0.3
Lighting Duty Cycle 1 1 1 ---- 1 1
Compressor Duty Cycle
(harvest) 1
0.65 0.75 0.45 0.93 0.35 0.30
Water Pump Duty Cycle 1 1 1 ---- ---- ---- ----
1 Ice Machine only
Table 4-5: Technology Option Parameter Definitions
Tec
hn
olo
gy
Op
tion
1
Parameter D
isp
lay C
ase
s
Com
pre
ssor
Rack
s
Su
per
ma
rket
Con
den
sers
Walk
In
Coole
rs
Walk
In
Fre
eze
rs
Food
Ser
vic
e
Eq
uip
.
Thickness
Increase
Thickness Increase (in) 0.5 ---- ---- 1.0 1.0 1.0
Load Reduction (%) 5.7% ---- ---- 20% 20% 22%
Material Cost ($) $40 ---- ---- $0.41 $0.41 $0.41
Total Retooling Cost
($) ---- ---- ---- ---- ----
$1,00
0,000
Evap Fan
Control
Duty Cycle Reduction
(%) ---- ---- ---- 20% 20% ----
OEM Cost of
Contactor($) ---- ---- ---- $63 $63 ----
High
Efficiency
Fan
Blades
Power Reduction (%) ---- ---- ---- 15% 15% 15%
Baseline Cost of
Condenser Blade ($) ---- ---- ---- $18 $18 $1.04
Baseline Cost of
Evaporator Blade ($) ---- ---- ---- $5 $1.57 $1.04
Cost Increase (%) ---- ---- ---- 100% 100% n/a
Hi-Eff
Comp
Hi-Efficiency COP ---- ---- ---- 4.14 1.20 2.15
OEM Compressor Cost
($) ---- ---- ---- 250 300 $10
ECM
Comp
Motor
Power Reduction (%) ---- ---- ---- ---- ---- 18%
OEM ECM Motor
Cost ($) ---- ---- ---- ---- ---- $63
Variable
Capacity
Comp
Savings Improvement
% ---- ---- ---- ---- ---- 18%
VC Controls Cost ($) ---- ---- ---- ---- ---- $63
Comp
Modulatio
n
Savings Improvement
% ---- 5.2% ---- ---- ---- ----
Reduced Energy Use Reduction ---- ---- ---- ---- ---- ----

119
Thermal
Cycling
(%)
External
Heat
Rejection
Reduced Duty Cycle
(%) ---- ---- ---- ---- 61% ----
Cost of Installation ($)
---- ---- ---- ----
$1,00
3
----
Hot Gas
Anti-sweat
Perimeter of Doors (ft) ---- ---- ---- 250 50 21
Total Retooling Cost
($) ---- ---- ----
$2,00
0,000
$1,00
0,000
$1,00
0,000
Anti-
Sweat
Heater
Control
Power Reduction (%) ---- ---- ---- 33% 33% ----
Sensor & Controller
Cost ($) ---- ---- ---- $627 $627 ----
Hot Gas
Defrost
Cost per circuit ($) ---- ---- ---- ---- $104 ----
Defrost
Control
Energy Reduction (%) ---- ---- ---- ---- 50% ----
Cost of 2 Sensors &
Controls ($) ---- ---- ---- ---- $63 ----
Lighting Baseline OEM Bulb
Cost ($/bulb) 11 ---- ---- $1.64 ---- ----
Baseline OEM Ballast
Cost ($/bulb) 14 ---- ---- $5.50 ---- ----
High
Efficiency
Fluorescen
t
Hi-Eff Bulb Power
(W/bulb) ---- ---- ---- 72.0 ---- ----
Hi-Eff Ballast Power
(W/bulb) ---- ---- ---- 0 ---- ----
Hi-Eff OEM Bulb Cost
($/bulb) ---- ---- ---- $3.68 ---- ----
Hi-Eff OEM Ballast
Cost ($/bulb) ---- ---- ---- $7.00 ---- ----
LED Number of Bulbs 5 ---- ----
4
(60in) ---- ----
LED Power (W/bulb) 29 ---- ---- 74.9 ---- ----
LED OEM Cost
($/bulb) $115 ---- ---- $86 ---- ----
Reduced
Meltage
During
Harvest
Freeze Cycle Energy
(kWh/yr) ---- ---- ---- ---- ---- ----
Energy Use Reduction
(%) ---- ---- ---- ---- ---- ----
OEM Cost ($) ---- ---- ---- ---- ---- ----
Floating
Head
Pressure
Reduced Duty Cycle
(%) ---- ---- ---- 50% ---- ----
Cost per circuit ($) ---- ---- ---- $348 ---- ----
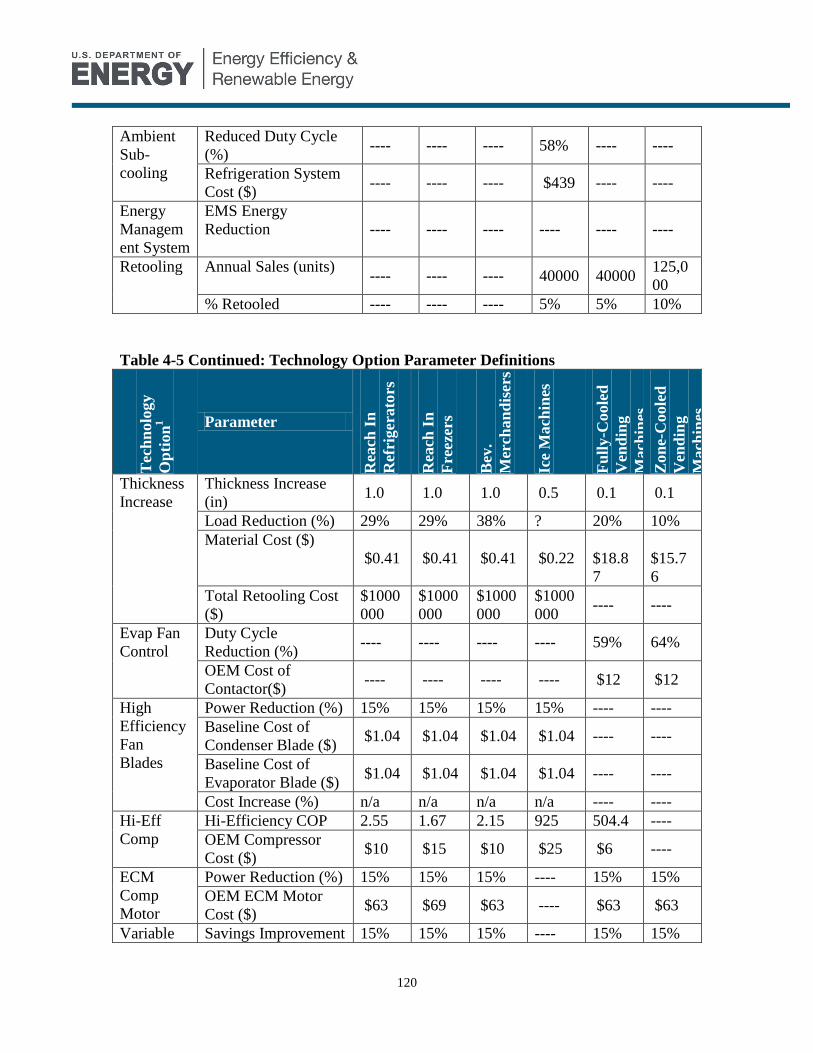
120
Ambient
Sub-
cooling
Reduced Duty Cycle
(%) ---- ---- ---- 58% ---- ----
Refrigeration System
Cost ($) ---- ---- ---- $439 ---- ----
Energy
Managem
ent System
EMS Energy
Reduction ---- ---- ---- ---- ---- ----
Retooling Annual Sales (units) ---- ---- ---- 40000 40000
125,0
00
% Retooled ---- ---- ---- 5% 5% 10%
Table 4-5 Continued: Technology Option Parameter Definitions
Tec
hn
olo
gy
Op
tion
1 Parameter
Rea
ch I
n
Ref
rigera
tors
Rea
ch I
n
Fre
eze
rs
Bev
.
Mer
chan
dis
ers
Ice
Mach
ines
Fu
lly
-Coole
d
Ven
din
g
Mach
ines
Zon
e-C
oole
d
Ven
din
g
Mach
ines
Thickness
Increase
Thickness Increase
(in) 1.0 1.0 1.0 0.5 0.1 0.1
Load Reduction (%) 29% 29% 38% ? 20% 10%
Material Cost ($)
$0.41 $0.41 $0.41 $0.22
$18.8
7
$15.7
6
Total Retooling Cost
($)
$1000
000
$1000
000
$1000
000
$1000
000 ---- ----
Evap Fan
Control
Duty Cycle
Reduction (%) ---- ---- ---- ---- 59% 64%
OEM Cost of
Contactor($) ---- ---- ---- ---- $12 $12
High
Efficiency
Fan
Blades
Power Reduction (%) 15% 15% 15% 15% ---- ----
Baseline Cost of
Condenser Blade ($) $1.04 $1.04 $1.04 $1.04 ---- ----
Baseline Cost of
Evaporator Blade ($) $1.04 $1.04 $1.04 $1.04 ---- ----
Cost Increase (%) n/a n/a n/a n/a ---- ----
Hi-Eff
Comp
Hi-Efficiency COP 2.55 1.67 2.15 925 504.4 ----
OEM Compressor
Cost ($) $10 $15 $10 $25 $6 ----
ECM
Comp
Motor
Power Reduction (%) 15% 15% 15% ---- 15% 15%
OEM ECM Motor
Cost ($) $63 $69 $63 ---- $63 $63
Variable Savings Improvement 15% 15% 15% ---- 15% 15%

121
Capacity
Comp
%
VC Controls Cost ($) $63 $63 $63 ---- $63 $63
Comp
Modulatio
n
Savings Improvement
% ---- ---- ---- ---- ---- ----
Reduced
Thermal
Cycling
Energy Use
Reduction (%) ---- ---- ---- 4.5% ---- ----
External
Heat
Rejection
Reduced Duty Cycle
(%) ---- ---- ---- ---- ---- ----
Cost of Installation
($) ---- ---- ---- ---- ---- ----
Hot Gas
Anti-sweat
Perimeter of Doors
(ft) 36 18 ---- ---- ---- ----
Total Retooling Cost
($)
$1,00
0,000
$1,00
0,000 ---- ---- ---- ----
Anti-
Sweat
Heater
Control
Power Reduction (%) ---- ---- ---- ---- ---- ----
Sensor & Controller
Cost ($) ---- ---- ---- ---- ---- ----
Hot Gas
Defrost
Cost per circuit ($) ---- $104 ---- ---- ---- ----
Defrost
Control
Energy Reduction
(%) ---- 45% ---- ---- ---- ----
Cost of 2 Sensors &
Controls ($) ---- $63 ---- ---- ---- ----
Lighting Baseline OEM Bulb
Cost ($/bulb) ---- ---- $1.64 ---- $1.64 $5.63
Baseline OEM
Ballast Cost ($/bulb) ---- ---- $5.50 ---- $5.50 $7.75
High
Efficiency
Fluorescen
t
Hi-Eff Bulb Power
(W/bulb) ---- ---- 30.1 ---- 30.1 ----
Hi-Eff Ballast Power
(W/bulb) ---- ---- 1.4 ---- 1.4 ----
Hi-Eff OEM Bulb
Cost ($/bulb) ---- ---- $3.68 ---- $3.68 ----
Hi-Eff OEM Ballast
Cost ($/bulb) ---- ---- $7.00 ---- $7.00 ----
LED Number of Bulbs ---- ----
2 (48
in) ----
2(48in
)
2
(48in)
LED Power (W/bulb) ---- ---- 11.6 ---- 11.6 33.8
LED OEM Cost
($/bulb) ---- ---- $62 ---- $62 $210

122
Reduced
Meltage
During
Harvest
Freeze Cycle Energy
(kWh/yr) ---- ---- ---- 4251 ---- ----
Energy Use
Reduction (%) ---- ---- ---- 5% ---- ----
OEM Cost ($) ---- ---- ---- $50 ---- ----
Floating
Head
Pressure
Reduced Duty Cycle
(%) ---- ---- ---- ---- ---- ----
Cost per circuit ($) ---- ---- ---- ---- ---- ----
Ambient
Sub-
cooling
Reduced Duty Cycle
(%) ---- ---- ---- ---- ---- ----
Refrigeration System
Cost ($) ---- ---- ---- ---- ---- ----
Energy
Managem
ent System
EMS Energy
Reduction ---- ---- 35% ---- 20% 20%
Retooling Annual Sales (units) 26100
0 51500 ---- ---- ---- ----
% Retooled 10% 15% ---- ---- ---- ----

123
4.2 Supermarket Refrigeration Systems
This section presents the energy savings potential of the energy savings technologies applicable
to supermarket refrigeration systems and the barriers to implementation of these technologies.
Refer to section 4.1 for detailed calculations of the energy savings and economics.
4.2.1 Economic Analysis
The economic analysis for supermarket refrigeration systems is presented in Table 4-6 through
Table 4-11, which summarize the installed cost premium, annual energy savings, and the simple
payback period for each technology considered for refrigerated display cases, compressor racks,
condensers, and the central control system. The energy savings percentage compares the reduced
energy to the baseline energy use. Refer back to Chapter 3 for descriptions of baseline
equipment.
Refrigerated Display Cases
The baseline unit is a typical new medium-temperature vertical case with transparent doors and
an energy consumption of 9,107 kWh/yr (DOE 2009a).
Table 4-6: Economic Analysis for Medium-Temp Open Display Cases
Technology Option
Installe
d- Cost
Premiu
m
Energy
Savings
(kWh/y
r)
Energ
y
Savin
gs (%)
Simple Payback Periods
(yrs)
High
Rate
($0.162
7
/kWh)
Mediu
m Rate
($0.099
3
/kWh)
Low
Rate
($0.071
1
/kWh)
1 Thicker Insulation - 1.0 -
1.125 in $76 109 1% 4.3 7.0 9.7
2 PSC Evap. Fan Motor (6W,
5 fans) $50 916 11% 0.3 0.6 0.8
3 ECM Evap. Fan Motor
(6W, 5 fans) $171 2,150 25% 0.5 0.8 1.1
4 Lighting, High-Lumen
Bulb, Low BF $121 531 1% 1.4 2.3 3.2
5 LED Lighting $5,434 1,678 19% 19.9 32.6 45.6
6 Enhanced Evaporator Coil 1 $355 469 5% 4.6 7.6 10.6
Max Tech (2,3,4) $343 2,048 26% 1.0 1.7 2.4
Source: DOE 2009a 1 Higher UA value of evaporator coil due to increased fin pitch and surface area.

124
Table 4-7: Economic Analysis for Low-Temp Glass-Door Display Cases
Technology Option
Installe
d- Cost
Premiu
m
Energy
Savings
(kWh/y
r)
Energ
y
Savin
gs (%)
Simple Payback Periods
(yrs)
High
Rate
($0.162
7
/kWh)
Mediu
m Rate
($0.099
3
/kWh)
Low
Rate
($0.071
1
/kWh)
1 Thicker Insulation - 1.0 to
1.125 in $76 205 2% 2.3 3.7 5.2
2 PSC Evap. Fan Motor (6W,
5 fans) $42 594 7% 0.4 0.7 1.0
3 ECM Evap. Fan Motor
(6W, 5 fans) $143 1,333 15% 0.7 1.1 1.5
4 LED Lighting $808 2,219 26% 2.2 3.7 5.1
5 High Performance Doors 1 $1,825 4,763 55% 2.4 3.9 5.4
6 Enhanced Evaporator Coil 2 $159 153 2% 6.4 10.4 14.6
Max Tech (1 - 5) $2,893 6,596 44% 2.7 4.4 6.2
Source: DOE 2009a 1 Install high-performance doors with more efficient anti-sweat heating, vinyl/composite
frame, and high-performance glass. 2 Higher UA value of evaporator coil due to increased fin pitch and surface area.
Table 4-8: Economic Analysis for Medium-Temp Glass-Door Display Cases
Technology Option
Installe
d- Cost
Premiu
m
Energy
Savings
(kWh/y
r)
Energ
y
Savin
gs (%)
Simple Payback Periods
(yrs)
High
Rate
($0.162
7
/kWh)
Mediu
m Rate
($0.099
3
/kWh)
Low
Rate
($0.071
1
/kWh)
1 Thicker Insulation - 1.0 to
1.125 in $76 95 1% 4.9 8.0 11.2
2 PSC Evap. Fan Motor (6W,
5 fans) $42 509 6% 0.5 0.8 1.2
3 ECM Evap. Fan Motor
(6W, 5 fans) $143 1,143 13% 0.8 1.3 1.8
4 LED Lighting $808 2,219 26% 2.2 3.7 5.1
5 High Performance Doors 1 $1,435 2,322 27% 66.7 109.2 152.6
6 Enhanced Evaporator Coil 2 $94 66 1% 8.8 14.4 20.2
Max Tech (2 - 4) $992 2,694 31% 2.3 3.7 5.2
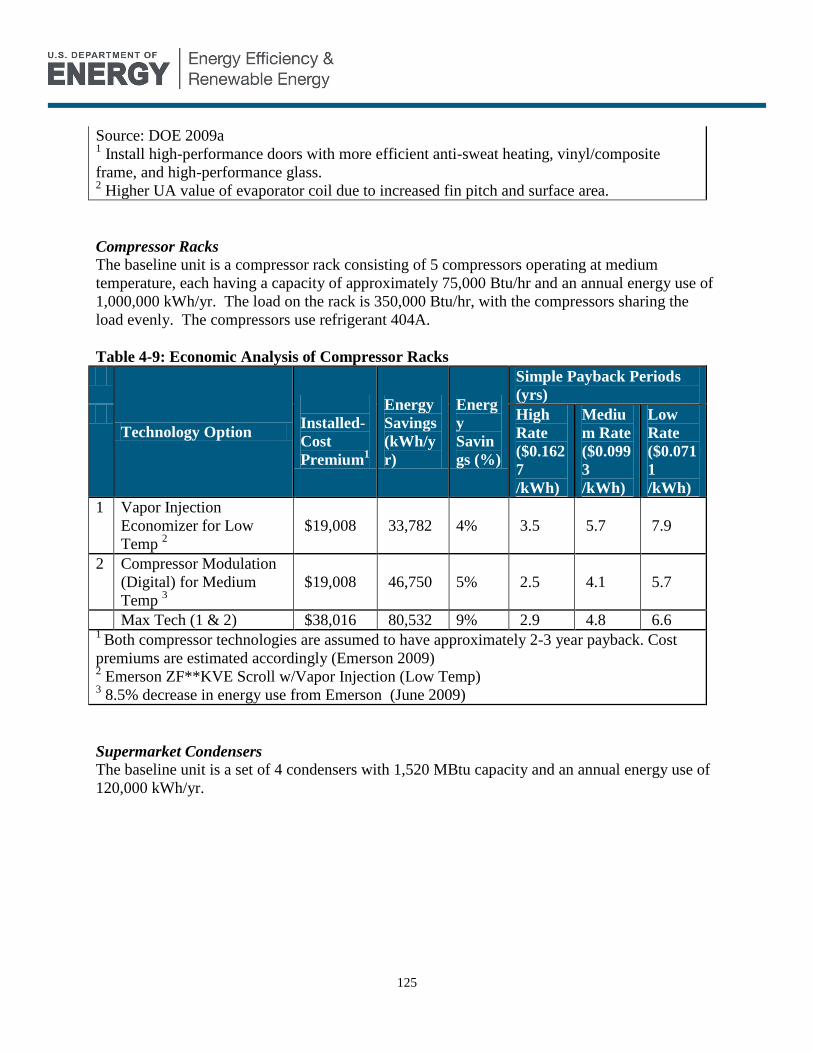
125
Source: DOE 2009a 1 Install high-performance doors with more efficient anti-sweat heating, vinyl/composite
frame, and high-performance glass. 2 Higher UA value of evaporator coil due to increased fin pitch and surface area.
Compressor Racks
The baseline unit is a compressor rack consisting of 5 compressors operating at medium
temperature, each having a capacity of approximately 75,000 Btu/hr and an annual energy use of
1,000,000 kWh/yr. The load on the rack is 350,000 Btu/hr, with the compressors sharing the
load evenly. The compressors use refrigerant 404A.
Table 4-9: Economic Analysis of Compressor Racks
Technology Option
Installed-
Cost
Premium1
Energy
Savings
(kWh/y
r)
Energ
y
Savin
gs (%)
Simple Payback Periods
(yrs)
High
Rate
($0.162
7
/kWh)
Mediu
m Rate
($0.099
3
/kWh)
Low
Rate
($0.071
1
/kWh)
1 Vapor Injection
Economizer for Low
Temp 2
$19,008 33,782 4% 3.5 5.7 7.9
2 Compressor Modulation
(Digital) for Medium
Temp 3
$19,008 46,750 5% 2.5 4.1 5.7
Max Tech (1 & 2) $38,016 80,532 9% 2.9 4.8 6.6 1
Both compressor technologies are assumed to have approximately 2-3 year payback. Cost
premiums are estimated accordingly (Emerson 2009) 2 Emerson ZF**KVE Scroll w/Vapor Injection (Low Temp)
3 8.5% decrease in energy use from Emerson (June 2009)
Supermarket Condensers
The baseline unit is a set of 4 condensers with 1,520 MBtu capacity and an annual energy use of
120,000 kWh/yr.
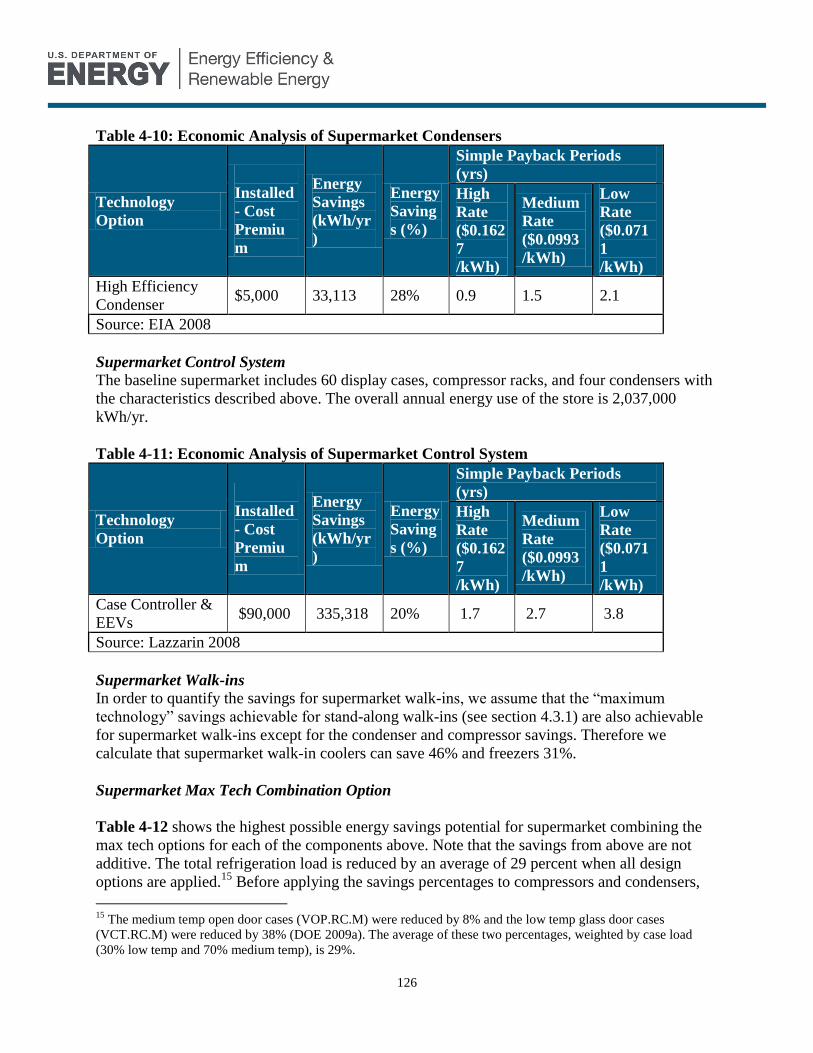
126
Table 4-10: Economic Analysis of Supermarket Condensers
Technology
Option
Installed
- Cost
Premiu
m
Energy
Savings
(kWh/yr
)
Energy
Saving
s (%)
Simple Payback Periods
(yrs)
High
Rate
($0.162
7
/kWh)
Medium
Rate
($0.0993
/kWh)
Low
Rate
($0.071
1
/kWh)
High Efficiency
Condenser $5,000 33,113 28% 0.9 1.5 2.1
Source: EIA 2008
Supermarket Control System
The baseline supermarket includes 60 display cases, compressor racks, and four condensers with
the characteristics described above. The overall annual energy use of the store is 2,037,000
kWh/yr.
Table 4-11: Economic Analysis of Supermarket Control System
Technology
Option
Installed
- Cost
Premiu
m
Energy
Savings
(kWh/yr
)
Energy
Saving
s (%)
Simple Payback Periods
(yrs)
High
Rate
($0.162
7
/kWh)
Medium
Rate
($0.0993
/kWh)
Low
Rate
($0.071
1
/kWh)
Case Controller &
EEVs $90,000 335,318 20% 1.7 2.7 3.8
Source: Lazzarin 2008
Supermarket Walk-ins
In order to quantify the savings for supermarket walk-ins, we assume that the “maximum
technology” savings achievable for stand-along walk-ins (see section 4.3.1) are also achievable
for supermarket walk-ins except for the condenser and compressor savings. Therefore we
calculate that supermarket walk-in coolers can save 46% and freezers 31%.
Supermarket Max Tech Combination Option
Table 4-12 shows the highest possible energy savings potential for supermarket combining the
max tech options for each of the components above. Note that the savings from above are not
additive. The total refrigeration load is reduced by an average of 29 percent when all design
options are applied.15
Before applying the savings percentages to compressors and condensers,
15
The medium temp open door cases (VOP.RC.M) were reduced by 8% and the low temp glass door cases
(VCT.RC.M) were reduced by 38% (DOE 2009a). The average of these two percentages, weighted by case load
(30% low temp and 70% medium temp), is 29%.

127
we reduced their baseline energy consumption by 29 percent to account for the lower case load
resulting from the display case improvements. Applying all technologies with payback periods of
under 7 years yields supermarket primary energy savings of 196 TBtu/yr.
Table 4-12: Max Tech Supermarket Combination
Technology
Option
“Typica
l New”
UEC
(kWh/y
r)
Energy
Reduction
(%)
Max
Tech
UEC
(kWh/yr)
Store
Energy
Savings
(kWh/yr
)
Total
Electricit
y
Savings
(TWh/yr
)
Primar
y
Energy
Savings
(TBtu/y
r)
Display Cases 8,894 35% 5,799 185,695 6.5 68
Compressor
Racks
637,681 1
9% 580,621 57,060 2.0 21
Condensers 85,024 1 28% 61,563 23,462 0.8 9
Walk-ins2 Varies Varies 59,119 2.1 22
Total Refrig System 118
Add Case Controllers & EEVs 3 212,037 7.4 77
Total Max Tech Supermarket Savings: 196
Source: Lazzarin 2008 1 Reduced by 29%
2 See Table 4-16 for detail on walk-in savings calculation.
3 20% energy reduction of store refrigeration energy use
4.2.2 Barriers to Implementation in Supermarkets
Key barriers to improving supermarket refrigeration system efficiency include:
1) Display Cases: Supermarket chain marketing groups select display cases based on how
well they present the product, i.e., to maximize sales. Energy consumption is often not
considered. In fact, some of the characteristics that improve product presentation run
counter to energy-efficient design. For example, display cases often forego doors (to
make product more attractive and make it easier for shoppers to pick up), and they
generally have aspect ratios resulting in large surface areas compared to the volume of
product stored. Return on investment is considered better for design features which
enhance sales than for energy-saving features.
2) Supermarkets tend to operate on very narrow margins and generally have limited capital
for making energy-efficiency investments. Paybacks of 2 to 3 years are required by most
supermarkets. Some supermarkets even require paybacks of less than one year.
3) Reliability (and the perception of reliability) is extremely important. As mentioned in
section 3.1.4, refrigerated goods are estimated to represent approximately 45% of
128
supermarket sales, and at a given point, the value of refrigerated inventory in a
supermarket generally ranges from $200,000 to $300,000 depending on store size (TIAX
2005). Unproven technology is not readily accepted. New technologies will have to be
field tested and proven before they are generally accepted. Some large supermarket
chains test new technologies in demonstration stores to show reliability before deploying
the new technology widely.
4) Implementation of Energy Conservation Standards: Design practices for supermarket
refrigeration systems vary widely and require significant site-specific engineering,
making it difficult for DOE to establish energy conservation standards. Interactions with
the supermarket HVAC system and building shell further complicate establishing
standards.
5) Evaporative Condensers add maintenance and water costs when compared with air-
cooled condensers. This technology does not have significant market penetration except
in dry areas such as the southwest. In contrast, evaporative condensers are used almost
exclusively in warehouse and food processing refrigeration applications, resulting in a
95°F typical design condenser temperature (compared with 110°F to 115°F for
supermarkets). The desire to keep maintenance costs to a minimum is a key issue with
supermarkets.
6) Display Cases: It can be difficult and expensive to incorporate LED lighting in display
cases. Certain food products require specific lighting color and quality to maximize their
customer appeal. Obtaining consistent lighting color and quality requires LED
manufacturers to select LED chips by hand, which raises the price of LEDs for
commercial refrigeration equipment.
4.3 Walk-In Cooler & Freezers
This section presents the energy savings potential of the energy savings technologies applicable
to walk-in coolers and freezers and the barriers to implementation of these technologies. Refer
to section 4.1 for detailed calculations of the energy savings and economics.
4.3.1 Economic Analysis
The results of the economic analysis for walk-ins is summarized in Table 4-13 and Table 4-14,
including installed-cost premium, annual energy savings, and the simple payback period for each
technology considered for walk-in coolers and freezers, respectively. The energy savings
percentage compares the energy saved to the baseline energy use. Refer back to Chapter 3 for
descriptions of baseline equipment.
Walk-in Coolers
The baseline unit is a typical new self-contained walk-in cooler with an annual energy
consumption of 42,182 kWh/yr.
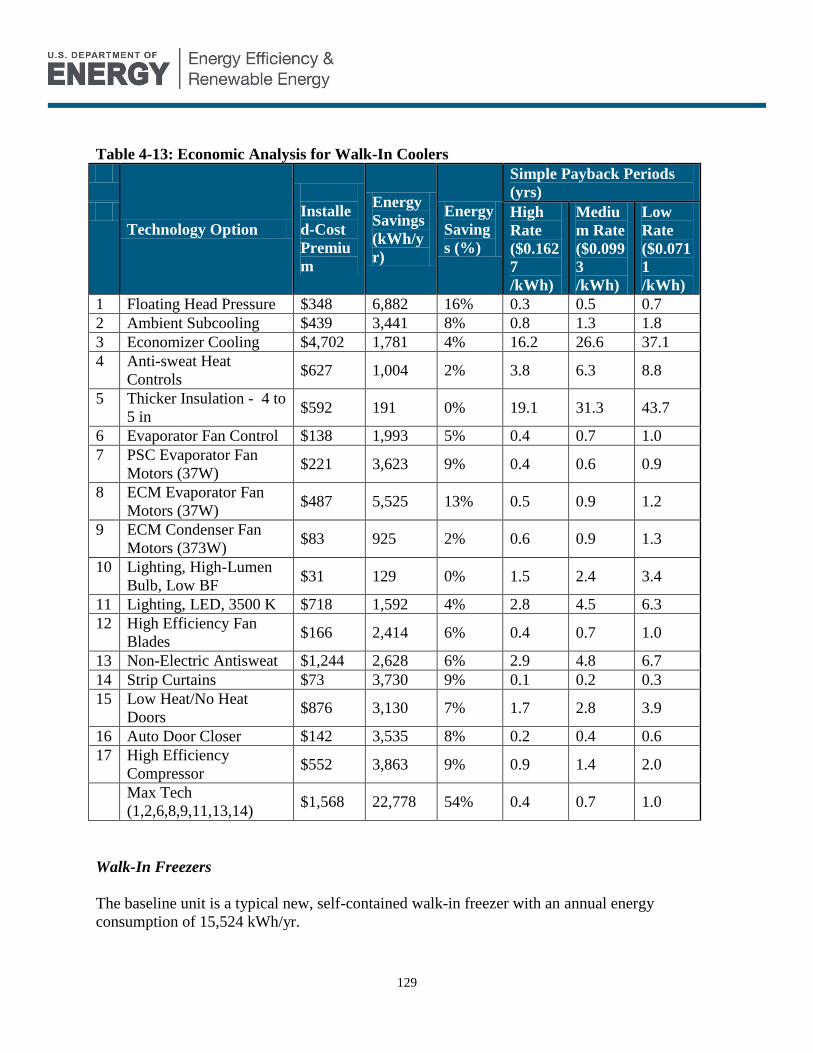
129
Table 4-13: Economic Analysis for Walk-In Coolers
Technology Option
Installe
d-Cost
Premiu
m
Energy
Savings
(kWh/y
r)
Energy
Saving
s (%)
Simple Payback Periods
(yrs)
High
Rate
($0.162
7
/kWh)
Mediu
m Rate
($0.099
3
/kWh)
Low
Rate
($0.071
1
/kWh)
1 Floating Head Pressure $348 6,882 16% 0.3 0.5 0.7
2 Ambient Subcooling $439 3,441 8% 0.8 1.3 1.8
3 Economizer Cooling $4,702 1,781 4% 16.2 26.6 37.1
4 Anti-sweat Heat
Controls $627 1,004 2% 3.8 6.3 8.8
5 Thicker Insulation - 4 to
5 in $592 191 0% 19.1 31.3 43.7
6 Evaporator Fan Control $138 1,993 5% 0.4 0.7 1.0
7 PSC Evaporator Fan
Motors (37W) $221 3,623 9% 0.4 0.6 0.9
8 ECM Evaporator Fan
Motors (37W) $487 5,525 13% 0.5 0.9 1.2
9 ECM Condenser Fan
Motors (373W) $83 925 2% 0.6 0.9 1.3
10 Lighting, High-Lumen
Bulb, Low BF $31 129 0% 1.5 2.4 3.4
11 Lighting, LED, 3500 K $718 1,592 4% 2.8 4.5 6.3
12 High Efficiency Fan
Blades $166 2,414 6% 0.4 0.7 1.0
13 Non-Electric Antisweat $1,244 2,628 6% 2.9 4.8 6.7
14 Strip Curtains $73 3,730 9% 0.1 0.2 0.3
15 Low Heat/No Heat
Doors $876 3,130 7% 1.7 2.8 3.9
16 Auto Door Closer $142 3,535 8% 0.2 0.4 0.6
17 High Efficiency
Compressor $552 3,863 9% 0.9 1.4 2.0
Max Tech
(1,2,6,8,9,11,13,14) $1,568 22,778 54% 0.4 0.7 1.0
Walk-In Freezers
The baseline unit is a typical new, self-contained walk-in freezer with an annual energy
consumption of 15,524 kWh/yr.
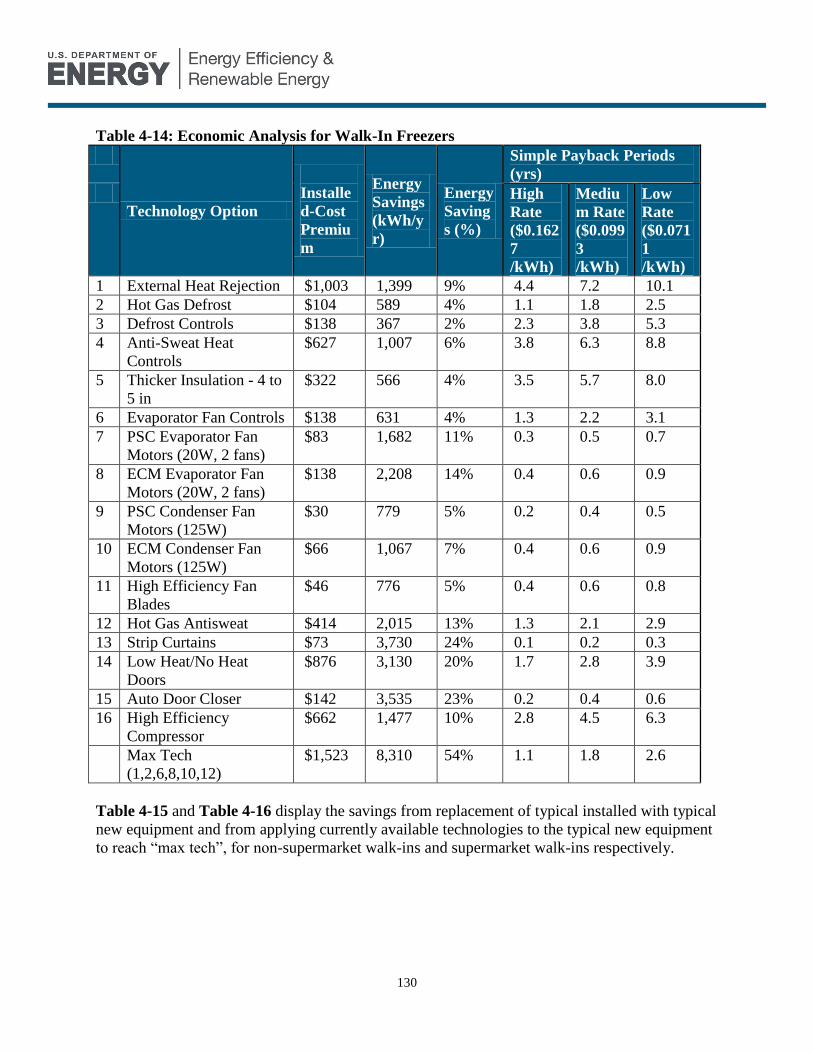
130
Table 4-14: Economic Analysis for Walk-In Freezers
Technology Option
Installe
d-Cost
Premiu
m
Energy
Savings
(kWh/y
r)
Energy
Saving
s (%)
Simple Payback Periods
(yrs)
High
Rate
($0.162
7
/kWh)
Mediu
m Rate
($0.099
3
/kWh)
Low
Rate
($0.071
1
/kWh)
1 External Heat Rejection $1,003 1,399 9% 4.4 7.2 10.1
2 Hot Gas Defrost $104 589 4% 1.1 1.8 2.5
3 Defrost Controls $138 367 2% 2.3 3.8 5.3
4 Anti-Sweat Heat
Controls
$627 1,007 6% 3.8 6.3 8.8
5 Thicker Insulation - 4 to
5 in
$322 566 4% 3.5 5.7 8.0
6 Evaporator Fan Controls $138 631 4% 1.3 2.2 3.1
7 PSC Evaporator Fan
Motors (20W, 2 fans)
$83 1,682 11% 0.3 0.5 0.7
8 ECM Evaporator Fan
Motors (20W, 2 fans)
$138 2,208 14% 0.4 0.6 0.9
9 PSC Condenser Fan
Motors (125W)
$30 779 5% 0.2 0.4 0.5
10 ECM Condenser Fan
Motors (125W)
$66 1,067 7% 0.4 0.6 0.9
11 High Efficiency Fan
Blades
$46 776 5% 0.4 0.6 0.8
12 Hot Gas Antisweat $414 2,015 13% 1.3 2.1 2.9
13 Strip Curtains $73 3,730 24% 0.1 0.2 0.3
14 Low Heat/No Heat
Doors
$876 3,130 20% 1.7 2.8 3.9
15 Auto Door Closer $142 3,535 23% 0.2 0.4 0.6
16 High Efficiency
Compressor
$662 1,477 10% 2.8 4.5 6.3
Max Tech
(1,2,6,8,10,12)
$1,523 8,310 54% 1.1 1.8 2.6
Table 4-15 and Table 4-16 display the savings from replacement of typical installed with typical
new equipment and from applying currently available technologies to the typical new equipment
to reach “max tech”, for non-supermarket walk-ins and supermarket walk-ins respectively.
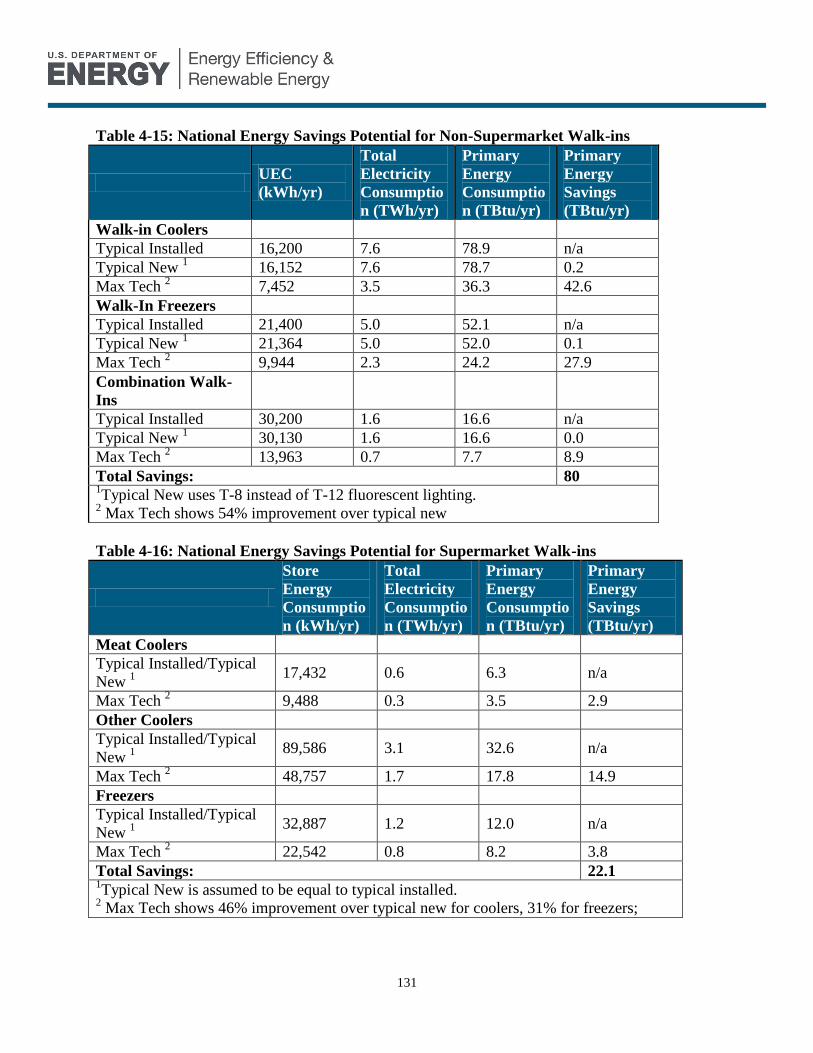
131
Table 4-15: National Energy Savings Potential for Non-Supermarket Walk-ins
UEC
(kWh/yr)
Total
Electricity
Consumptio
n (TWh/yr)
Primary
Energy
Consumptio
n (TBtu/yr)
Primary
Energy
Savings
(TBtu/yr)
Walk-in Coolers
Typical Installed
16,200 7.6 78.9 n/a
Typical New 1 16,152 7.6 78.7 0.2
Max Tech 2 7,452 3.5 36.3 42.6
Walk-In Freezers
Typical Installed
21,400 5.0 52.1 n/a
Typical New 1 21,364 5.0 52.0 0.1
Max Tech 2 9,944 2.3 24.2 27.9
Combination Walk-
Ins
Typical Installed
30,200 1.6 16.6 n/a
Typical New 1 30,130 1.6 16.6 0.0
Max Tech 2 13,963 0.7 7.7 8.9
Total Savings: 80 1Typical New uses T-8 instead of T-12 fluorescent lighting.
2 Max Tech shows 54% improvement over typical new
Table 4-16: National Energy Savings Potential for Supermarket Walk-ins
Store
Energy
Consumptio
n (kWh/yr)
Total
Electricity
Consumptio
n (TWh/yr)
Primary
Energy
Consumptio
n (TBtu/yr)
Primary
Energy
Savings
(TBtu/yr)
Meat Coolers
Typical Installed/Typical
New 1
17,432 0.6 6.3 n/a
Max Tech 2 9,488 0.3 3.5 2.9
Other Coolers
Typical Installed/Typical
New 1
89,586 3.1 32.6 n/a
Max Tech 2 48,757 1.7 17.8 14.9
Freezers
Typical Installed/Typical
New 1
32,887 1.2 12.0 n/a
Max Tech 2 22,542 0.8 8.2 3.8
Total Savings: 22.1 1Typical New is assumed to be equal to typical installed.
2 Max Tech shows 46% improvement over typical new for coolers, 31% for freezers;

132
4.3.2 Barriers to Implementation for Improved-Efficiency Walk-Ins
Barriers to widespread deployment of energy-savings technologies in walk-ins include:
1) Purchase decisions for walk-ins are generally not made based on life-cycle cost or
payback considerations. A general contractor installing a walk-in has incentive to select
the lowest cost equipment that meets energy efficiency specifications. Frequently, there is
insufficient cash flow at the time of equipment purchase for consideration of future
benefits to sway the decision. As discussed in previous sections, the long-term prospects
for new start-up restaurants are not solid, and these establishments generally select the
lowest-cost equipment. In many cases, used refrigeration equipment is purchased, if
available.
2) It can be difficult for end-users to properly assess whether the added cost of energy-
saving technologies will be recovered quickly enough through savings. Complicating
factors include:
The complexity of refrigeration systems can make energy savings difficult to
predict.
The complexity of commercial electric rate structures. Commercial electric rates
can be complex, having both demand and energy usage components, which can
vary with time of electricity usage. A further complication arises for convenience
stores or restaurants chains that seek to apply standard design specifications
across their establishments, but face differing electric rate structures in different
locations.
Emergency replacements severely limit the time available to evaluate equipment
alternatives, and make financing more difficult.
3) The walk-in market is very competitive, with many suppliers, none of whom have a
dominant market position. First cost is generally the primary basis of differentiation
among competitors. In addition, there are many supply options: an end-user can purchase
the walk-in box from a walk-in manufacturer and purchase the refrigeration equipment
elsewhere. Or, the entire system can be purchased from the walk-in manufacturer.
Installation can be provided by the walk-in manufacturer or by a refrigeration contractor.
Small walk-ins can be purchased as prefabricated units or can be assembled on-site.
Walk-ins generally consist of an insulated box section having coolers mounted
inside it. There is minimal integration of these two parts of the walk-in (besides
proper location of the evaporator within the box), and they are generally
manufactured by different companies. This makes implementation of non-electric
anti-sweat difficult, because it would require the walk-in box manufacturer to
install refrigerant tubing and provide connections for the refrigeration system.
4) A number of market structure barriers hinder the increased use of energy saving
technologies for walk-ins.
133
Several of the technologies discussed (i.e. floating head pressure, ambient
subcooling, demand defrost control, and evaporator fan shutdown) represent
additional complexity for the refrigeration system and its control. Training would
be required for most refrigeration service technicians providing service for walk-
in systems.
As mentioned in the beginning of Section 4.3, the use of floating head-pressure
control would require the use of balanced-port expansion valves to allow
satisfactory refrigerant flow over a range of head pressures. Implementing
floating head pressure control would require coordination among the refrigeration
controls manufacturer, the refrigeration system manufacturer, and the walk-in
manufacturer. Such cooperation is possible, but takes initiative and represents a
barrier to implementation.
ECM motors are not widely available in the sizes required for walk-in fans. Even
if a unit cooler with ECM motors was installed, finding a replacement motor
would be difficult, and represent additional down time. These motors will have to
break into the market and develop a larger supply network before the risk of not
being able to quickly find a replacement is diminished.
The market for walk-ins is fairly fragmented. Many manufacturers must
successfully introduce an energy-saving technology to capture a significant
portion of the market. Furthermore, there is no trade association that represents
the walk-in manufacturers that would provide a forum for discussion of technical
issues for this application. There has in the past been insufficient interest in such
an association among manufacturers.
4.4 Refrigerated Food Service Equipment
This section presents the energy savings potential of the energy savings technologies applicable
to refrigerated food service equipment and the barriers to implementation of these technologies.
Refer back to section 4.1 for detailed calculations of the energy savings and economics.
4.4.1 Economic Analysis
The economic analysis for refrigerated food service equipment is summarized in Table 4-17,
including the installed-cost premium, annual energy savings, and the simple payback period for
each technology considered for food service equipment. The energy savings percentage
compares the energy saved to the baseline energy use. Refer back to Chapter 3 for descriptions
of baseline equipment.
The baseline unit is a typical new, self-contained preparation table with an annual energy
consumption of 2,341 kWh/yr.
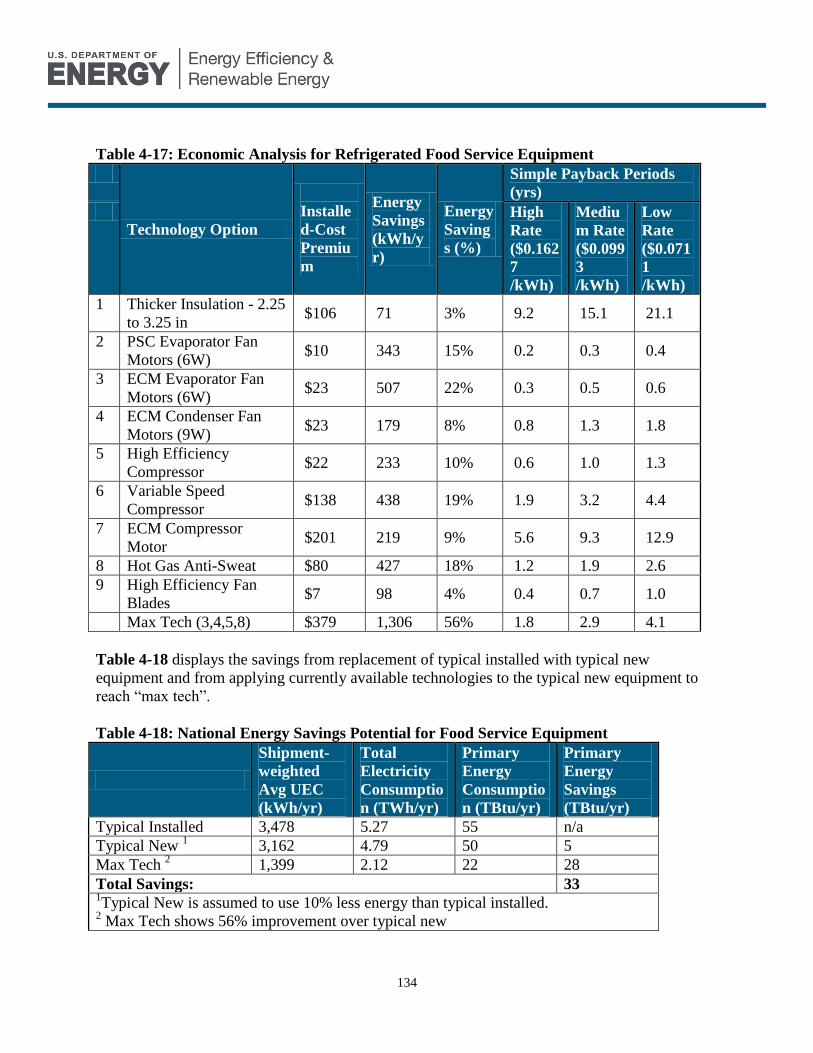
134
Table 4-17: Economic Analysis for Refrigerated Food Service Equipment
Technology Option
Installe
d-Cost
Premiu
m
Energy
Savings
(kWh/y
r)
Energy
Saving
s (%)
Simple Payback Periods
(yrs)
High
Rate
($0.162
7
/kWh)
Mediu
m Rate
($0.099
3
/kWh)
Low
Rate
($0.071
1
/kWh)
1 Thicker Insulation - 2.25
to 3.25 in $106 71 3% 9.2 15.1 21.1
2 PSC Evaporator Fan
Motors (6W) $10 343 15% 0.2 0.3 0.4
3 ECM Evaporator Fan
Motors (6W) $23 507 22% 0.3 0.5 0.6
4 ECM Condenser Fan
Motors (9W) $23 179 8% 0.8 1.3 1.8
5 High Efficiency
Compressor $22 233 10% 0.6 1.0 1.3
6 Variable Speed
Compressor $138 438 19% 1.9 3.2 4.4
7 ECM Compressor
Motor $201 219 9% 5.6 9.3 12.9
8 Hot Gas Anti-Sweat $80 427 18% 1.2 1.9 2.6
9 High Efficiency Fan
Blades $7 98 4% 0.4 0.7 1.0
Max Tech (3,4,5,8) $379 1,306 56% 1.8 2.9 4.1
Table 4-18 displays the savings from replacement of typical installed with typical new
equipment and from applying currently available technologies to the typical new equipment to
reach “max tech”.
Table 4-18: National Energy Savings Potential for Food Service Equipment
Shipment-
weighted
Avg UEC
(kWh/yr)
Total
Electricity
Consumptio
n (TWh/yr)
Primary
Energy
Consumptio
n (TBtu/yr)
Primary
Energy
Savings
(TBtu/yr)
Typical Installed
3,478 5.27 55 n/a
Typical New 1 3,162 4.79 50 5
Max Tech 2 1,399 2.12 22 28
Total Savings: 33 1Typical New is assumed to use 10% less energy than typical installed.
2 Max Tech shows 56% improvement over typical new
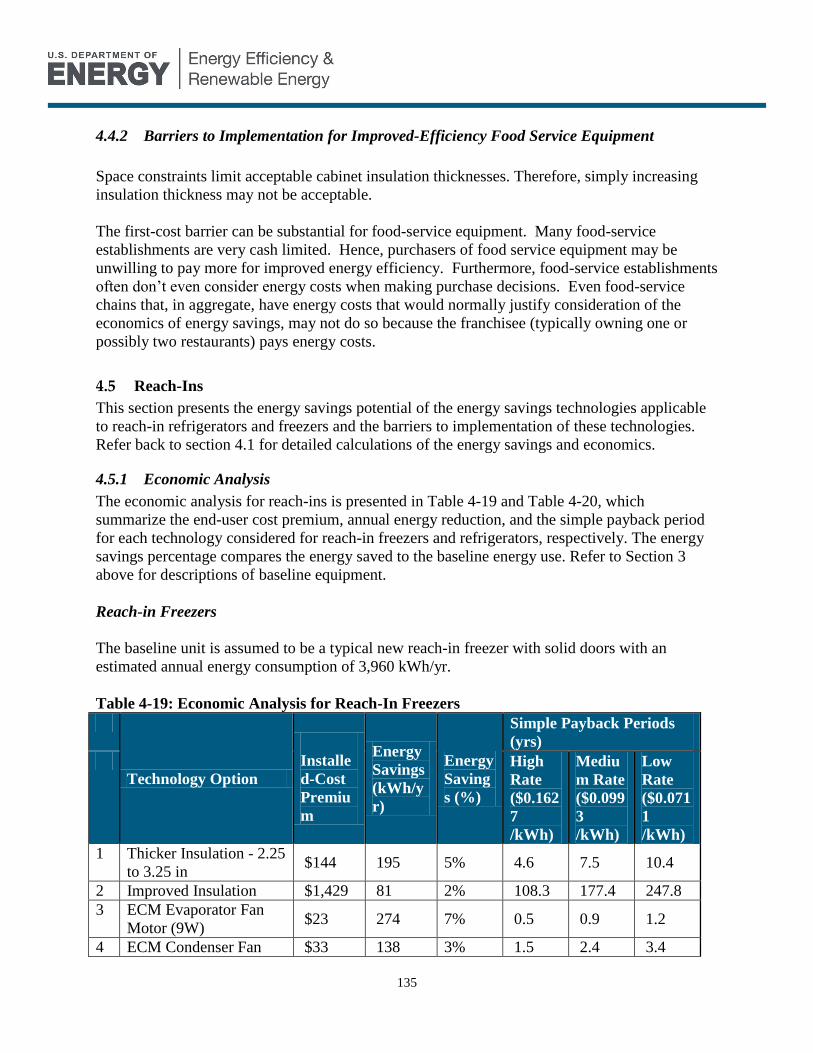
135
4.4.2 Barriers to Implementation for Improved-Efficiency Food Service Equipment
Space constraints limit acceptable cabinet insulation thicknesses. Therefore, simply increasing
insulation thickness may not be acceptable.
The first-cost barrier can be substantial for food-service equipment. Many food-service
establishments are very cash limited. Hence, purchasers of food service equipment may be
unwilling to pay more for improved energy efficiency. Furthermore, food-service establishments
often don’t even consider energy costs when making purchase decisions. Even food-service
chains that, in aggregate, have energy costs that would normally justify consideration of the
economics of energy savings, may not do so because the franchisee (typically owning one or
possibly two restaurants) pays energy costs.
4.5 Reach-Ins
This section presents the energy savings potential of the energy savings technologies applicable
to reach-in refrigerators and freezers and the barriers to implementation of these technologies.
Refer back to section 4.1 for detailed calculations of the energy savings and economics.
4.5.1 Economic Analysis
The economic analysis for reach-ins is presented in Table 4-19 and Table 4-20, which
summarize the end-user cost premium, annual energy reduction, and the simple payback period
for each technology considered for reach-in freezers and refrigerators, respectively. The energy
savings percentage compares the energy saved to the baseline energy use. Refer to Section 3
above for descriptions of baseline equipment.
Reach-in Freezers
The baseline unit is assumed to be a typical new reach-in freezer with solid doors with an
estimated annual energy consumption of 3,960 kWh/yr.
Table 4-19: Economic Analysis for Reach-In Freezers
Technology Option
Installe
d-Cost
Premiu
m
Energy
Savings
(kWh/y
r)
Energy
Saving
s (%)
Simple Payback Periods
(yrs)
High
Rate
($0.162
7
/kWh)
Mediu
m Rate
($0.099
3
/kWh)
Low
Rate
($0.071
1
/kWh)
1 Thicker Insulation - 2.25
to 3.25 in $144 195 5% 4.6 7.5 10.4
2 Improved Insulation $1,429 81 2% 108.3 177.4 247.8
3 ECM Evaporator Fan
Motor (9W) $23 274 7% 0.5 0.9 1.2
4 ECM Condenser Fan $33 138 3% 1.5 2.4 3.4
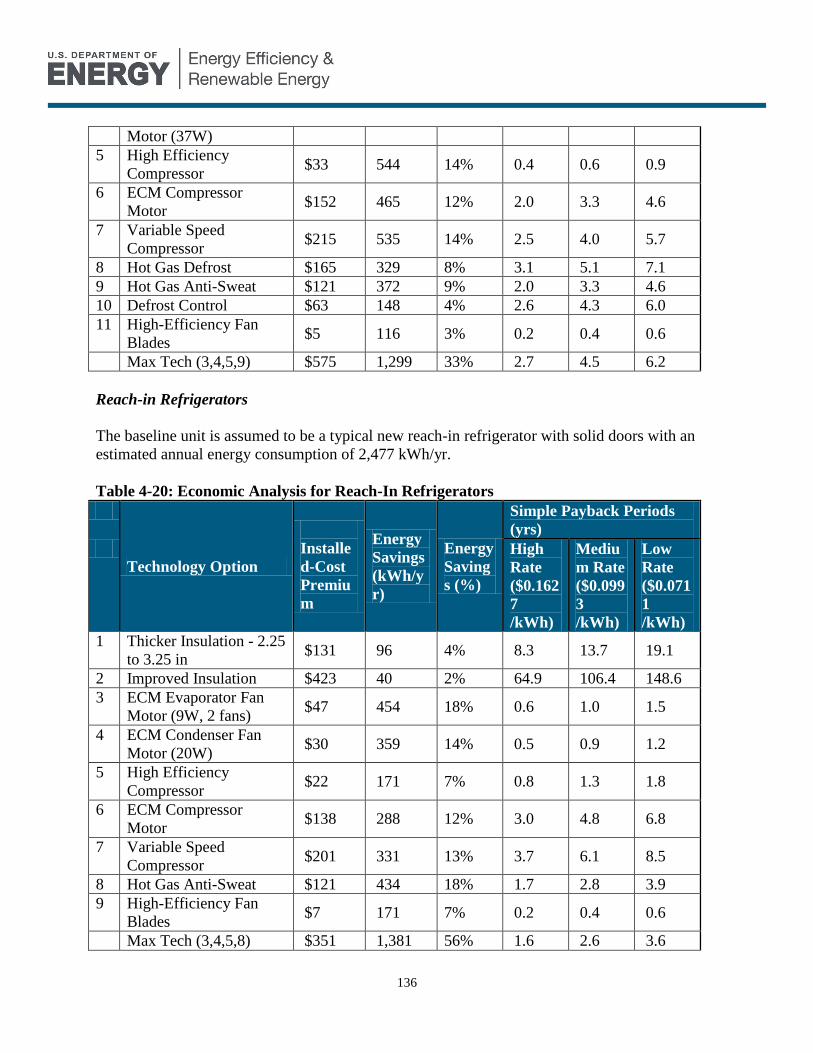
136
Motor (37W)
5 High Efficiency
Compressor $33 544 14% 0.4 0.6 0.9
6 ECM Compressor
Motor $152 465 12% 2.0 3.3 4.6
7 Variable Speed
Compressor $215 535 14% 2.5 4.0 5.7
8 Hot Gas Defrost $165 329 8% 3.1 5.1 7.1
9 Hot Gas Anti-Sweat $121 372 9% 2.0 3.3 4.6
10 Defrost Control $63 148 4% 2.6 4.3 6.0
11 High-Efficiency Fan
Blades $5 116 3% 0.2 0.4 0.6
Max Tech (3,4,5,9) $575 1,299 33% 2.7 4.5 6.2
Reach-in Refrigerators
The baseline unit is assumed to be a typical new reach-in refrigerator with solid doors with an
estimated annual energy consumption of 2,477 kWh/yr.
Table 4-20: Economic Analysis for Reach-In Refrigerators
Technology Option
Installe
d-Cost
Premiu
m
Energy
Savings
(kWh/y
r)
Energy
Saving
s (%)
Simple Payback Periods
(yrs)
High
Rate
($0.162
7
/kWh)
Mediu
m Rate
($0.099
3
/kWh)
Low
Rate
($0.071
1
/kWh)
1 Thicker Insulation - 2.25
to 3.25 in $131 96 4% 8.3 13.7 19.1
2 Improved Insulation $423 40 2% 64.9 106.4 148.6
3 ECM Evaporator Fan
Motor (9W, 2 fans) $47 454 18% 0.6 1.0 1.5
4 ECM Condenser Fan
Motor (20W) $30 359 14% 0.5 0.9 1.2
5 High Efficiency
Compressor $22 171 7% 0.8 1.3 1.8
6 ECM Compressor
Motor $138 288 12% 3.0 4.8 6.8
7 Variable Speed
Compressor $201 331 13% 3.7 6.1 8.5
8 Hot Gas Anti-Sweat $121 434 18% 1.7 2.8 3.9
9 High-Efficiency Fan
Blades $7 171 7% 0.2 0.4 0.6
Max Tech (3,4,5,8) $351 1,381 56% 1.6 2.6 3.6
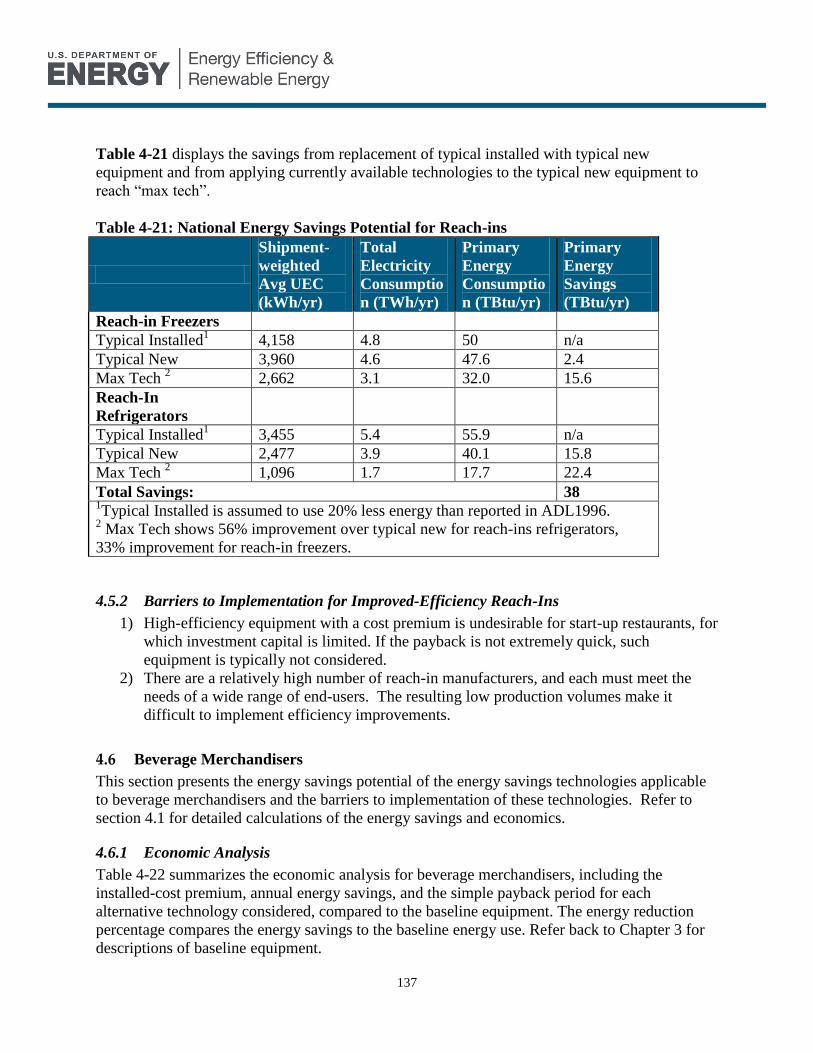
137
Table 4-21 displays the savings from replacement of typical installed with typical new
equipment and from applying currently available technologies to the typical new equipment to
reach “max tech”.
Table 4-21: National Energy Savings Potential for Reach-ins
Shipment-
weighted
Avg UEC
(kWh/yr)
Total
Electricity
Consumptio
n (TWh/yr)
Primary
Energy
Consumptio
n (TBtu/yr)
Primary
Energy
Savings
(TBtu/yr)
Reach-in Freezers
Typical Installed1
4,158 4.8 50 n/a
Typical New 3,960 4.6 47.6 2.4
Max Tech 2 2,662 3.1 32.0 15.6
Reach-In
Refrigerators
Typical Installed1
3,455 5.4 55.9 n/a
Typical New 2,477 3.9 40.1 15.8
Max Tech 2 1,096 1.7 17.7 22.4
Total Savings: 38 1Typical Installed is assumed to use 20% less energy than reported in ADL1996.
2 Max Tech shows 56% improvement over typical new for reach-ins refrigerators,
33% improvement for reach-in freezers.
4.5.2 Barriers to Implementation for Improved-Efficiency Reach-Ins
1) High-efficiency equipment with a cost premium is undesirable for start-up restaurants, for
which investment capital is limited. If the payback is not extremely quick, such
equipment is typically not considered.
2) There are a relatively high number of reach-in manufacturers, and each must meet the
needs of a wide range of end-users. The resulting low production volumes make it
difficult to implement efficiency improvements.
4.6 Beverage Merchandisers
This section presents the energy savings potential of the energy savings technologies applicable
to beverage merchandisers and the barriers to implementation of these technologies. Refer to
section 4.1 for detailed calculations of the energy savings and economics.
4.6.1 Economic Analysis
Table 4-22 summarizes the economic analysis for beverage merchandisers, including the
installed-cost premium, annual energy savings, and the simple payback period for each
alternative technology considered, compared to the baseline equipment. The energy reduction
percentage compares the energy savings to the baseline energy use. Refer back to Chapter 3 for
descriptions of baseline equipment.
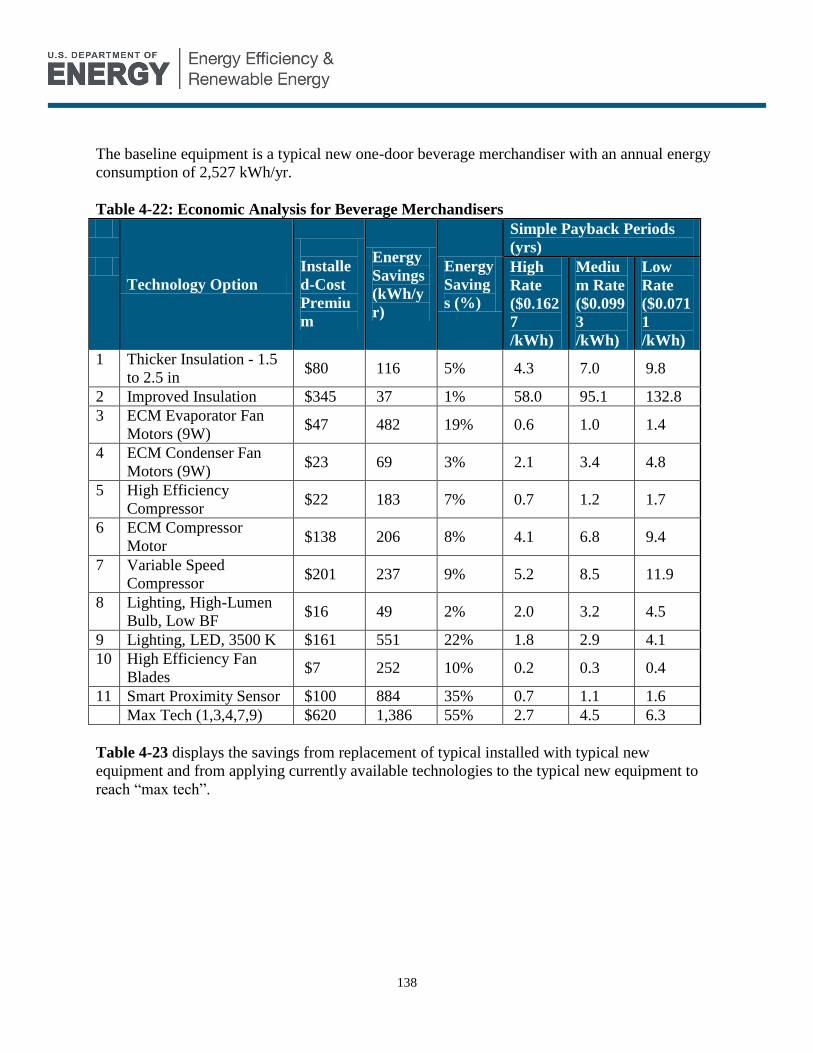
138
The baseline equipment is a typical new one-door beverage merchandiser with an annual energy
consumption of 2,527 kWh/yr.
Table 4-22: Economic Analysis for Beverage Merchandisers
Technology Option
Installe
d-Cost
Premiu
m
Energy
Savings
(kWh/y
r)
Energy
Saving
s (%)
Simple Payback Periods
(yrs)
High
Rate
($0.162
7
/kWh)
Mediu
m Rate
($0.099
3
/kWh)
Low
Rate
($0.071
1
/kWh)
1 Thicker Insulation - 1.5
to 2.5 in $80 116 5% 4.3 7.0 9.8
2 Improved Insulation $345 37 1% 58.0 95.1 132.8
3 ECM Evaporator Fan
Motors (9W) $47 482 19% 0.6 1.0 1.4
4 ECM Condenser Fan
Motors (9W) $23 69 3% 2.1 3.4 4.8
5 High Efficiency
Compressor $22 183 7% 0.7 1.2 1.7
6 ECM Compressor
Motor $138 206 8% 4.1 6.8 9.4
7 Variable Speed
Compressor $201 237 9% 5.2 8.5 11.9
8 Lighting, High-Lumen
Bulb, Low BF $16 49 2% 2.0 3.2 4.5
9 Lighting, LED, 3500 K $161 551 22% 1.8 2.9 4.1
10 High Efficiency Fan
Blades $7 252 10% 0.2 0.3 0.4
11 Smart Proximity Sensor $100 884 35% 0.7 1.1 1.6
Max Tech (1,3,4,7,9) $620 1,386 55% 2.7 4.5 6.3
Table 4-23 displays the savings from replacement of typical installed with typical new
equipment and from applying currently available technologies to the typical new equipment to
reach “max tech”.

139
Table 4-23: National Energy Savings Potential for Beverage Merchandisers
Shipment-
weighted
Avg UEC
(kWh/yr)
Total
Electricity
Consumptio
n (TWh/yr)
Primary
Energy
Consumptio
n (TBtu/yr)
Primary
Energy
Savings
(TBtu/yr)
One-Door
Typical Installed
3,076 1.4 14.7 n/a
Typical New 1 2,527 1.2 12.1 2.6
Max Tech 2 1,141 0.5 5.5 6.6
Two-Door
Typical Installed
6,080 2.5 26.2 n/a
Typical New 1 3,489 1.4 15.0 11.2
Max Tech 2 1,575 0.7 6.8 8.2
Three-Door
Typical Installed
8,960 0.4 4.3 n/a
Typical New 1 4,592 0.2 2.2 2.1
Max Tech 2 2,073 0.1 1.0 1.2
Total Savings: 32 1Typical Installed is assumed to use 20% less energy than is reported in ADL 1996.
2 Max Tech shows 55% improvement over typical new
4.6.2 Barriers to Implementation for Improved-Efficiency Beverage Merchandisers
1) Majority of beverage merchandisers are owned by bottling companies, such as Coca
Cola. The bottling companies do not pay utility bills for the buildings where the
merchandisers are located, which eliminates incentive for them to reduce energy
consumption.
2) Energy costs are small compared with beverage sales revenues, so manufacturers tend to
overlook energy issues in favor of sales-boosting design changes such as increases in
lighting intensity.
3) Increasing insulation thickness is difficult due to space constraints in beverage
merchandisers. Reducing the storage capacity of a given machine is generally not
acceptable.
4) Engineering and tooling costs associated with manufacturing commercial equipment are
not easily absorbed due to low production volumes.
5) Rating standards such as the DOE efficiency standard are based on steady state operation,
so technologies such as energy management systems that turn off lights or allow
temperatures to float do not receive credit for energy savings using those test procedures.
Similarly, variable speed compressors save energy at off-design conditions rather than at

140
rating conditions, so manufacturers have limited incentive to implement these expensive
technologies, even if they save substantial amounts of energy.
4.7 Ice Machines
This section presents the energy savings potential of the energy savings technologies applicable
to ice machines and the barriers to implementation of these technologies. Refer back to section
4.1 for detailed calculations of the energy savings and economics.
4.7.1 Economic Analysis
The economic analysis for ice machines is summarized in Table 4-24, including the installed-
cost premium, annual energy savings, and the simple payback period for each energy-saving
technology considered. The energy reduction percentage compares the energy saved to the
baseline energy use. Refer back to Chapter 3 for descriptions of baseline equipment.
The baseline unit is a typical new self-contained, air-cooled ice machine with an annual energy
consumption of 5,248 kWh/yr. Refer to Section 4 above for a description of the baseline unit.
Table 4-24: Economic Analysis for Ice Machines
Technology Option
Installe
d-Cost
Premiu
m
Energy
Savings
(kWh/y
r)
Energy
Saving
s (%)
Simple Payback Periods
(yrs)
High
Rate
($0.162
7
/kWh)
Mediu
m Rate
($0.099
3
/kWh)
Low
Rate
($0.071
1
/kWh)
1 Thicker Insulation - 0.5
to 1 in $77 157 3% 3.0 4.9 6.9
2 PSC Condenser Fan
Motor (25W) $33 200 4% 1.0 1.7 2.3
3 ECM Condenser Fan
Motor (25W) $64 273 5% 1.4 2.3 3.3
4 High Efficiency
Compressor $55 306 6% 1.1 1.8 2.5
5 Reduced Meltage
During Harvest $110 213 4% 3.2 5.2 7.3
6 Reduced Evaporator
Thermal Cycling $25 236 5% 0.7 1.1 1.5
7 High Efficiency Fan
Blades $2 61 1% 0.2 0.4 0.5
8 Max Tech (1, 3-7) $334 1,221 23% 1.7 2.8 3.8
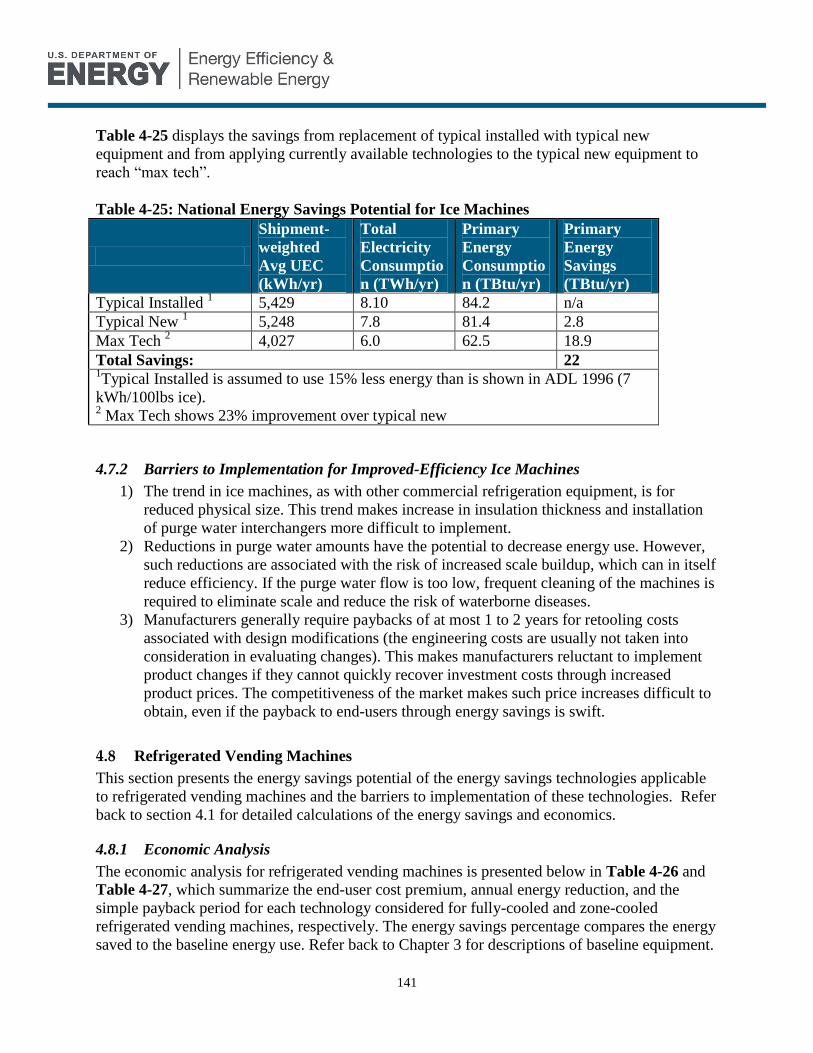
141
Table 4-25 displays the savings from replacement of typical installed with typical new
equipment and from applying currently available technologies to the typical new equipment to
reach “max tech”.
Table 4-25: National Energy Savings Potential for Ice Machines
Shipment-
weighted
Avg UEC
(kWh/yr)
Total
Electricity
Consumptio
n (TWh/yr)
Primary
Energy
Consumptio
n (TBtu/yr)
Primary
Energy
Savings
(TBtu/yr)
Typical Installed 1 5,429 8.10 84.2 n/a
Typical New 1 5,248 7.8 81.4 2.8
Max Tech 2 4,027 6.0 62.5 18.9
Total Savings: 22 1Typical Installed is assumed to use 15% less energy than is shown in ADL 1996 (7
kWh/100lbs ice). 2 Max Tech shows 23% improvement over typical new
4.7.2 Barriers to Implementation for Improved-Efficiency Ice Machines
1) The trend in ice machines, as with other commercial refrigeration equipment, is for
reduced physical size. This trend makes increase in insulation thickness and installation
of purge water interchangers more difficult to implement.
2) Reductions in purge water amounts have the potential to decrease energy use. However,
such reductions are associated with the risk of increased scale buildup, which can in itself
reduce efficiency. If the purge water flow is too low, frequent cleaning of the machines is
required to eliminate scale and reduce the risk of waterborne diseases.
3) Manufacturers generally require paybacks of at most 1 to 2 years for retooling costs
associated with design modifications (the engineering costs are usually not taken into
consideration in evaluating changes). This makes manufacturers reluctant to implement
product changes if they cannot quickly recover investment costs through increased
product prices. The competitiveness of the market makes such price increases difficult to
obtain, even if the payback to end-users through energy savings is swift.
4.8 Refrigerated Vending Machines
This section presents the energy savings potential of the energy savings technologies applicable
to refrigerated vending machines and the barriers to implementation of these technologies. Refer
back to section 4.1 for detailed calculations of the energy savings and economics.
4.8.1 Economic Analysis
The economic analysis for refrigerated vending machines is presented below in Table 4-26 and
Table 4-27, which summarize the end-user cost premium, annual energy reduction, and the
simple payback period for each technology considered for fully-cooled and zone-cooled
refrigerated vending machines, respectively. The energy savings percentage compares the energy
saved to the baseline energy use. Refer back to Chapter 3 for descriptions of baseline equipment.

142
Fully-Cooled Refrigerated Vending Machines
The baseline unit is a typical new fully-cooled refrigerated vending machine with an annual
energy consumption of 2,494 kWh/yr.
Table 4-26: Economic Analysis for Refrigerated Vending Machines (Fully-Cooled)
Technology Option
Installe
d-Cost
Premiu
m
Energy
Savings
(kWh/y
r)
Energy
Saving
s (%)
Simple Payback Periods
(yrs)
High
Rate
($0.162
7
/kWh)
Mediu
m Rate
($0.099
3
/kWh)
Low
Rate
($0.071
1
/kWh)
1 Thicker Insulation - 1.0
to 1.125 in $42 311 12% 0.8 1.3 1.9
2 ECM Evap. Fan Motor
(9W) $23 238 10% 0.6 1.0 1.4
3 ECM Cond. Fan Motor
(9W) $33 95 4% 2.1 3.5 4.9
4 Low BF T8 Lighting (4
bulbs) $16 55 2% 1.8 2.9 4.0
5 LED Lighting $242 546 22% 2.7 4.5 6.2
6 Evaporator Fan
Controller $26 252 10% 0.6 1.1 1.5
7 Enhanced Glass Pack $446 139 6% 19.7 32.3 45.1
8 Enhanced Condenser
Coil $28 101 4% 1.7 2.8 3.9
9 Hi-h Single Speed
Hermetic Compressor $13 47 2% 1.6 2.7 3.7
10 ECM Compressor
Motor $138 236 9% 3.6 5.9 8.2
11 Variable Speed
Compressor $201 272 11% 4.6 7.5 10.4
12 Energy Management
System $100 499 20% 1.2 2.0 2.8
Max Tech
(1,2,3,5,6,8,9,12) $507 1,353 54% 2.3 3.8 5.3
Zone-Cooled Refrigerated Vending Machines
The baseline unit is a typical new zone-cooled refrigerated vending machine with an annual
energy consumption of 2,258 kWh/yr.

143
Table 4-27 Economic Analysis for Refrigerated Vending Machines (Zone-Cooled)
Technology Option
Installe
d-Cost
Premiu
m
Energy
Savings
(kWh/y
r)
Energy
Saving
s (%)
Simple Payback Periods
(yrs)
High
Rate
($0.162
7
/kWh)
Mediu
m Rate
($0.099
3
/kWh)
Low
Rate
($0.071
1
/kWh)
1 Thicker Insulation - 1.0
to 1.125 in $35 55 2% 3.9 6.4 8.9
2 ECM Evap. Fan Motor
(9W, 2 fans) $47 487 22% 0.6 1.0 1.4
3 ECM Cond. Fan Motor
(9W) $23 46 2% 3.2 5.2 7.2
4 LED Lighting $865 739 33% 7.2 11.8 16.5
5 Evaporator Fan
Controller $26 554 25% 0.3 0.5 0.7
6 Enhanced Condenser
Coil $33 99 4% 2.0 3.3 4.7
7 ECM Compressor
Motor $138 176 8% 4.8 7.9 11.0
8 Variable Speed
Compressor $201 203 9% 6.1 10.0 14.0
9 Energy Management
System $100 452 20% 1.4 2.2 3.1
Max Tech (1,2,3,5,6,9) $264 751 33% 2.2 3.5 5.0
Table 4-28 displays the savings from replacement of typical installed with typical new
equipment and from applying currently available technologies to the typical new equipment to
reach “max tech”.
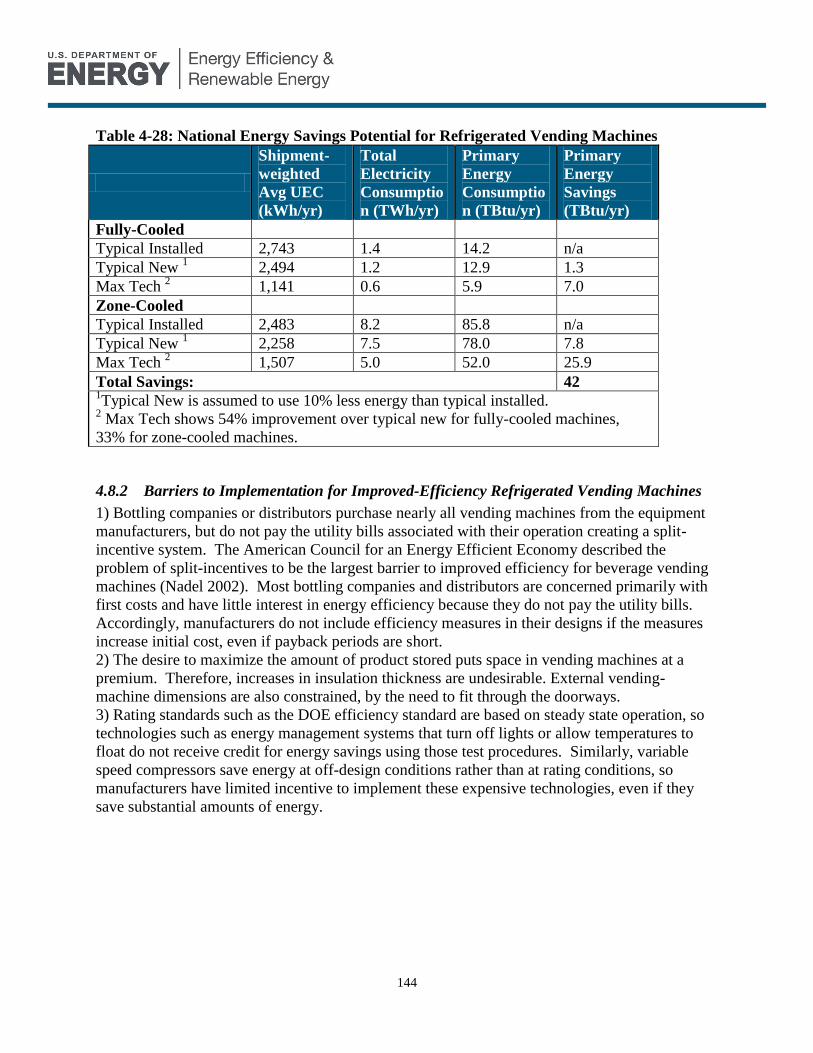
144
Table 4-28: National Energy Savings Potential for Refrigerated Vending Machines
Shipment-
weighted
Avg UEC
(kWh/yr)
Total
Electricity
Consumptio
n (TWh/yr)
Primary
Energy
Consumptio
n (TBtu/yr)
Primary
Energy
Savings
(TBtu/yr)
Fully-Cooled
Typical Installed
2,743 1.4 14.2 n/a
Typical New 1 2,494 1.2 12.9 1.3
Max Tech 2 1,141 0.6 5.9 7.0
Zone-Cooled
Typical Installed
2,483 8.2 85.8 n/a
Typical New 1 2,258 7.5 78.0 7.8
Max Tech 2 1,507 5.0 52.0 25.9
Total Savings: 42 1Typical New is assumed to use 10% less energy than typical installed.
2 Max Tech shows 54% improvement over typical new for fully-cooled machines,
33% for zone-cooled machines.
4.8.2 Barriers to Implementation for Improved-Efficiency Refrigerated Vending Machines
1) Bottling companies or distributors purchase nearly all vending machines from the equipment
manufacturers, but do not pay the utility bills associated with their operation creating a split-
incentive system. The American Council for an Energy Efficient Economy described the
problem of split-incentives to be the largest barrier to improved efficiency for beverage vending
machines (Nadel 2002). Most bottling companies and distributors are concerned primarily with
first costs and have little interest in energy efficiency because they do not pay the utility bills.
Accordingly, manufacturers do not include efficiency measures in their designs if the measures
increase initial cost, even if payback periods are short.
2) The desire to maximize the amount of product stored puts space in vending machines at a
premium. Therefore, increases in insulation thickness are undesirable. External vending-
machine dimensions are also constrained, by the need to fit through the doorways.
3) Rating standards such as the DOE efficiency standard are based on steady state operation, so
technologies such as energy management systems that turn off lights or allow temperatures to
float do not receive credit for energy savings using those test procedures. Similarly, variable
speed compressors save energy at off-design conditions rather than at rating conditions, so
manufacturers have limited incentive to implement these expensive technologies, even if they
save substantial amounts of energy.

145
5 Advanced Energy Saving Technologies and Tools
This section introduces commercial refrigeration technologies that are not yet fully developed,
but have significant energy savings potential. Table 5-1 characterizes advanced technologies
based on the following criteria: (1) energy savings potential, (2) technological risk, (3) time to
commercialization. Energy savings potential represents the percent of system energy use that can
be saved by implementing the given technology, assuming RD&D programs are successful in
achieving target performance levels. Technical risk is classified as low for technologies that are
well-understood and demonstrated, medium for technologies that have been credibly
demonstrated with some aspects left to resolve, and high for technologies for which a number of
unknowns still remain. Table 6-1 describes each technology, including energy savings potential,
research needs, and barriers to implementation. In addition to technologies, other technical
resources such as modeling tools and design guides are discussed in this section.
We did not conduct detailed economic analyses for advanced technologies because credible cost
forecasts are generally not available.
Table 5-1: Advanced Technology Options and Tools for Commercial Refrigeration
Technology
System
Energy
Savings
Potential %
Technical
Risk
(Low/
Med/
High)
Time to
Commercializat
ion (<5 , 5-10,
>10 yrs)
Overall System
Magnetic Refrigeration 20-30 High >10
Thermoacoustic
Refrigeration
10-20 High >10
Thermoelectric
Refrigeration
>20 High >10
Ground Coupled
Supermarket Refrigeration
System
20-30 Medium <5
Secondary Refrigeration
Loops/CO2 Cascade
Systems
<10 Low 5-10
Compressors
Linear Compressors 10-15 Medium <5
Insulation
Vacuum Insulation Panels
and Aerogels
10-15 Medium <5
Advanced Air-Curtains 5-10 Low <5
Heat Exchangers
EHD 5-10 Medium 5-10

146
Micro-Channel Heat
Exchangers
<10 Low <5
Refrigerants
Natural Refrigerants 0-10 Medium <5
Nanoparticle Additives 5-20 High 5-10
Lighting
Solid State Plasma Lighting 20-30 % High 5-10
Fiber Optic Lighting 20-30 % Medium <5
LEDs 15-20 % Low <5
Fan Blades
Whale Fins 20% Low <5
Modeling, Monitoring, and Tools
Modeling and Design
Guides
10-20% Low <5
Monitoring 10-20% Low <5
Best Practice and Design
Guides
10-20% Low <5
Sources: See text descriptions in sections 5.1 to 5.8
5.1 Alternative Refrigeration System Technologies
Several alternatives to the conventional air-to-air vapor-compression refrigeration cycle are in
various stages of development, including magnetic refrigeration, thermoacoustic refrigeration,
thermoelectric refrigeration, ground-coupled refrigeration, and secondary loop configurations.
Magnetic Refrigeration
Magnetic refrigeration (MR) is based on the magnetocaloric effect (MCE). MCE is a magneto-
thermodynamic phenomenon in which a reversible change in temperature of a paramagnetic
material is caused by exposing it to a changing magnetic field (measured in Tesla, T). In the
magnetic refrigeration cycle, randomly oriented magnetic spins in a paramagnetic material are
aligned via a magnetic field, resulting in a rise in temperature. This heat is removed from the
material to ambient by means of heat transfer. Upon removal of the magnetic field, the magnetic
spins return to its randomized state thus cooling the material to below ambient temperature. The
material is then used to absorb heat from the refrigerated volume thus cooling that space and
returning the paramagnetic material to its original state and the cycle starts again (Figure 5-1 and
Figure 5-2).
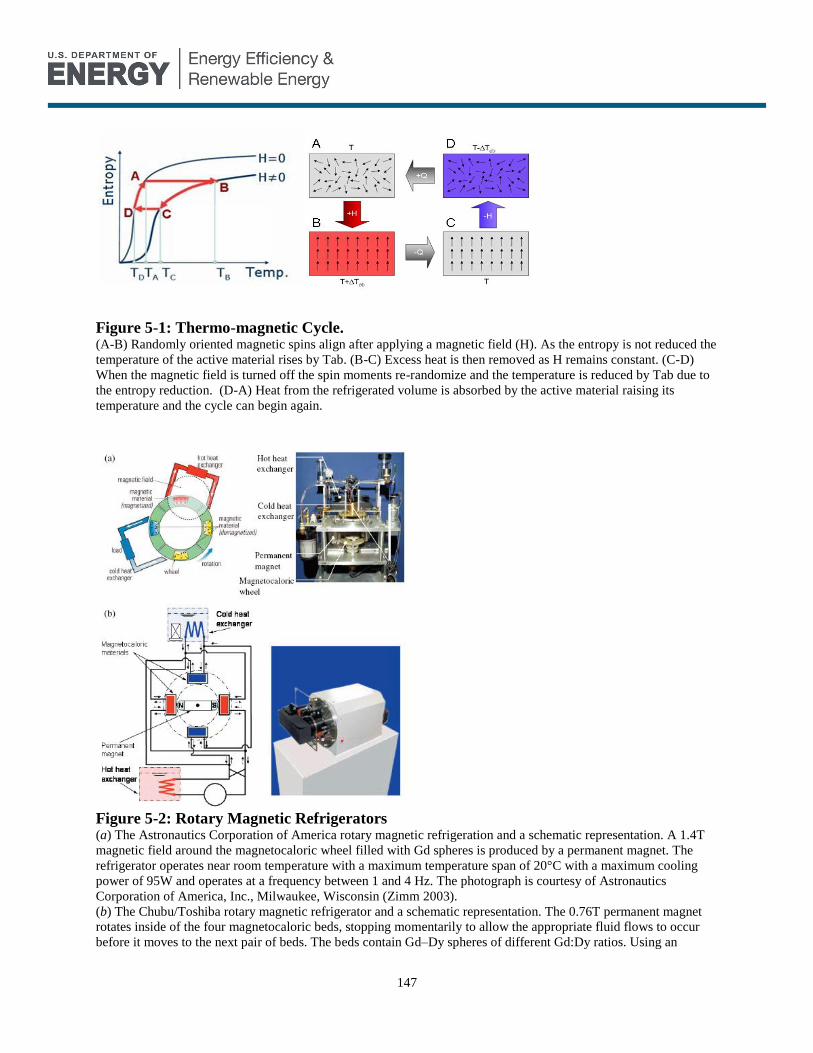
147
Figure 5-1: Thermo-magnetic Cycle. (A-B) Randomly oriented magnetic spins align after applying a magnetic field (H). As the entropy is not reduced the
temperature of the active material rises by Tab. (B-C) Excess heat is then removed as H remains constant. (C-D)
When the magnetic field is turned off the spin moments re-randomize and the temperature is reduced by Tab due to
the entropy reduction. (D-A) Heat from the refrigerated volume is absorbed by the active material raising its
temperature and the cycle can begin again.
Figure 5-2: Rotary Magnetic Refrigerators (a) The Astronautics Corporation of America rotary magnetic refrigeration and a schematic representation. A 1.4T
magnetic field around the magnetocaloric wheel filled with Gd spheres is produced by a permanent magnet. The
refrigerator operates near room temperature with a maximum temperature span of 20°C with a maximum cooling
power of 95W and operates at a frequency between 1 and 4 Hz. The photograph is courtesy of Astronautics
Corporation of America, Inc., Milwaukee, Wisconsin (Zimm 2003).
(b) The Chubu/Toshiba rotary magnetic refrigerator and a schematic representation. The 0.76T permanent magnet
rotates inside of the four magnetocaloric beds, stopping momentarily to allow the appropriate fluid flows to occur
before it moves to the next pair of beds. The beds contain Gd–Dy spheres of different Gd:Dy ratios. Using an

148
alcohol water solution as the heat transfer fluid a cooling power of 40W was obtained at a frequency of 0.28 Hz. The
photograph and schematic is courtesy of Chubu Electric Power Co., Inc., Nagoya, Japan (Hirano 2003).
For room temperature applications, materials are needed that have a Curie temperature (the
temperature above which ferromagnetic materials loss their permanent magnetism) around 295
K. Gadolinium and Gadolinium alloys have a large MCE around this temperature range and they
are among the most widely used materials for room temperature refrigeration and space cooling
applications. By using such materials and applying a 2 Tesla(T) magnetic field, researchers have
demonstrated temperature differences of 9ºF (~5°C). Higher temperature differentials can be
reached by increasing the magnetic field. For example, with a 10T field a temperature
differential of 45ºF has been demonstrated. However, using such large magnetic fields is
problematic as they require expensive and energy-hungry superconducting electromagnets such
as the ones found in MRI machines. Using MR in practical applications will likely require a
permanent magnet with magnetic fields between 1-2T to be economic and energy-efficient. The
use of such small fields provides a challenge for applications such as air conditioning and
refrigeration. This is because the small magnetic field is not enough to provide the required
temperature lift. The primary obstacle is finding a refrigerant material that exhibits sufficient
MCE in magnetic fields produced by permanent magnets (see Figure 5-3).
Figure 5-3: Entropy and Temperature Change vs. Magnetic Field
(a) Isothermal entropy change as a function of the magnetic field change for various materials.
(b) Adiabatic temperature rise as a function of the magnetic field change for different materials
(Gschneidner 2005). (1Tesla = 10 kiloOersted or kOe)
There are four main hurdles that have to overcome before MCE materials could be practically
used in commercial applications:
Producing such materials at high volume and at acceptable cost.
MCE materials are usually brittle and will not withstand a 15 year lifetime.
Hysteresis effects.(although researchers have recently shown that this problem can be
ad to
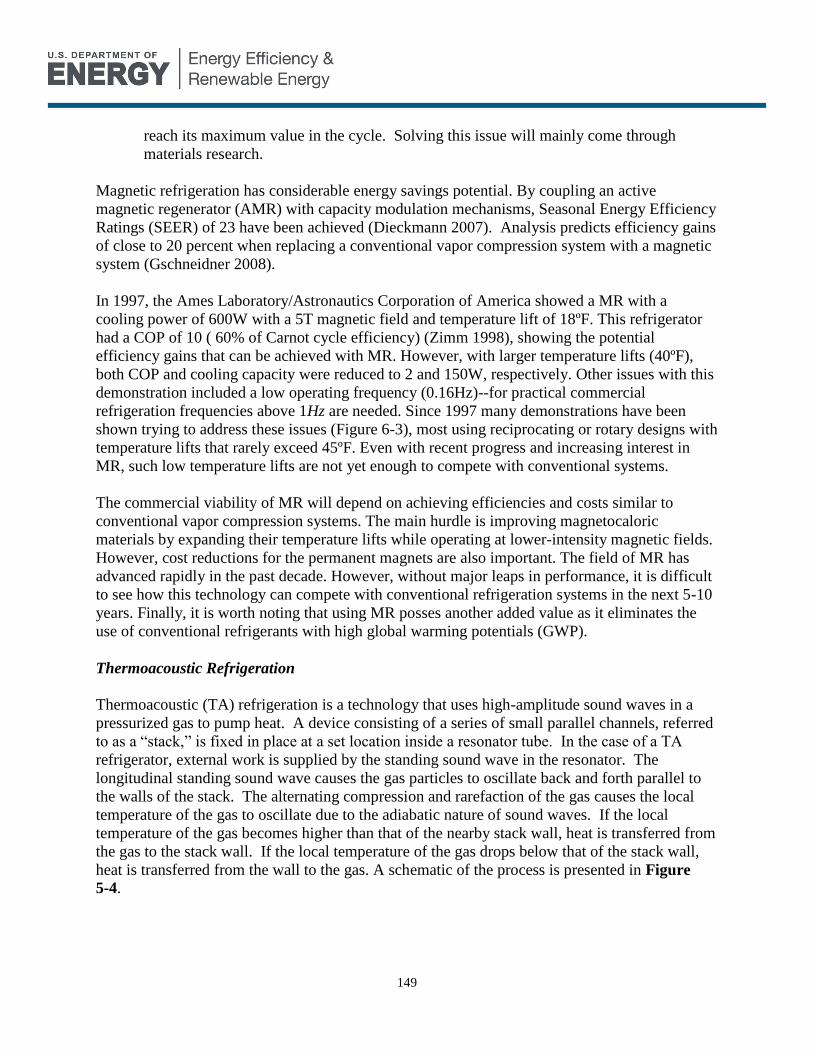
149
reach its maximum value in the cycle. Solving this issue will mainly come through
materials research.
Magnetic refrigeration has considerable energy savings potential. By coupling an active
magnetic regenerator (AMR) with capacity modulation mechanisms, Seasonal Energy Efficiency
Ratings (SEER) of 23 have been achieved (Dieckmann 2007). Analysis predicts efficiency gains
of close to 20 percent when replacing a conventional vapor compression system with a magnetic
system (Gschneidner 2008).
In 1997, the Ames Laboratory/Astronautics Corporation of America showed a MR with a
cooling power of 600W with a 5T magnetic field and temperature lift of 18ºF. This refrigerator
had a COP of 10 ( 60% of Carnot cycle efficiency) (Zimm 1998), showing the potential
efficiency gains that can be achieved with MR. However, with larger temperature lifts (40ºF),
both COP and cooling capacity were reduced to 2 and 150W, respectively. Other issues with this
demonstration included a low operating frequency (0.16Hz)--for practical commercial
refrigeration frequencies above 1Hz are needed. Since 1997 many demonstrations have been
shown trying to address these issues (Figure 6-3), most using reciprocating or rotary designs with
temperature lifts that rarely exceed 45ºF. Even with recent progress and increasing interest in
MR, such low temperature lifts are not yet enough to compete with conventional systems.
The commercial viability of MR will depend on achieving efficiencies and costs similar to
conventional vapor compression systems. The main hurdle is improving magnetocaloric
materials by expanding their temperature lifts while operating at lower-intensity magnetic fields.
However, cost reductions for the permanent magnets are also important. The field of MR has
advanced rapidly in the past decade. However, without major leaps in performance, it is difficult
to see how this technology can compete with conventional refrigeration systems in the next 5-10
years. Finally, it is worth noting that using MR posses another added value as it eliminates the
use of conventional refrigerants with high global warming potentials (GWP).
Thermoacoustic Refrigeration
Thermoacoustic (TA) refrigeration is a technology that uses high-amplitude sound waves in a
pressurized gas to pump heat. A device consisting of a series of small parallel channels, referred
to as a “stack,” is fixed in place at a set location inside a resonator tube. In the case of a TA
refrigerator, external work is supplied by the standing sound wave in the resonator. The
longitudinal standing sound wave causes the gas particles to oscillate back and forth parallel to
the walls of the stack. The alternating compression and rarefaction of the gas causes the local
temperature of the gas to oscillate due to the adiabatic nature of sound waves. If the local
temperature of the gas becomes higher than that of the nearby stack wall, heat is transferred from
the gas to the stack wall. If the local temperature of the gas drops below that of the stack wall,
heat is transferred from the wall to the gas. A schematic of the process is presented in Figure
5-4.

150
Figure 5-4: Operation of Thermoacoustic Refrigerators (A) Operation of one pore in the TA refrigerator stack. In step 1 gas is compressed increasing pressure and excess
heat is transferred to the nearby walls. In step 2 the gas moved towards the cooler side of the stack still transferring
heat to the side walls. In step 3 the pressure is reduced causing the gas molecules to expand and absorb heat from the
sidewalls. In step 4 the cooler gas moves back towards the high temperature side absorbing heat from the side wall.
Finally, the cycle is repeated as the gas molecules are initiated to their starting phase in stage 1. It is worthy to note
that heat transfer in steps 2 and 4 are equal and opposite, resulting in net heat transfer through steps 1 and 3 only.
This leads to net heat transfer up the temperature gradient (Rossing 2007).
(B) Schematic of a TA refrigerator. Acoustic power is provided by the driver piston resulting in thermal power being
absorbed and rejected from the system (indicated by red and blue arrows).
Prototypes of TA refrigerators have been demonstrated for refrigeration applications. A
prototype TA refrigeration unit designed for an ice-cream freezer has been measured to be as
efficient as the vapor compression unit it replaces (COP = 0.81 or 19% relative to the Carnot
COP) (PSU 2009). Researchers expect TA technology to improve in efficiency with further
development of heat exchangers and other subsystems. It is also likely that efficiency in many
applications could improve because TA refrigerators are well suited to proportional control,
where the cooling capacity can be continuously controlled so that the output can be adjusted to
match varying load conditions. TA refrigeration also has the environmental benefit of being
refrigerant-free.
TA refrigeration is still in the early design stages. Issues include a lack of suppliers that produce
vital parts such as inexpensive loudspeakers or heat exchangers that are optimized for high-
frequency oscillatory flow of compressed gases (PSU 2009); however this is a common issue for
many early stage technologies. TA freezers have been demonstrated in some applications.
Funded by substantial investments from Ben and Jerry’s Ice Cream, engineers at Pennsylvania
State University are building TA freezers, based on a proven prototype, to replace conventional
ice cream freezers in the company’s stores (Newman 2006). Due to high costs and other
aforementioned issues, it is difficult to see a clear pathway where TA refrigeration can compete
with conventional refrigeration systems in the next 5-10 years.

151
Thermoelectric Refrigeration
Thermoelectric (TE) refrigeration is similar to magnetic refrigeration. However, instead of using
a magnetic field to induce temperature changes they use electrical current. TE devices are solid
state, semiconducting systems that directly convert electrical power to thermal energy for either
cooling or heating. These systems also have potential to reduce CO2 and greenhouse gas
emissions as they do not use fluorocarbon refrigerants. TE systems are simple compared to
vapor-compression systems that need to compress and expand working fluids like fluorocarbon
refrigerants to operate; they instead use electrons as their “working fluid” (Bell 2008). However,
TE systems have not been used broadly thus far due to their lower efficiency and higher cost
compared to vapor compression. On exception is portable beverage coolers that can be plugged
into automotive lighters for power. These are convenient for providing a small amount of
cooling when ac power is not available, but the cooling capacity required is very small and the
efficiency is not a major concern due to the low overall cooling requirements.
TE effects arise due to charge carrier’s freedom to move like gas molecules that can carry heat as
well. In the presence of a temperature gradient, carriers at the hot end tend to migrate towards the
cold end. The charge build up results in an electrical potential (voltage) between the hot and cold
reverse, the Seebeck effect can be used as a cooling system. Applying a DC voltage to the
system can drive an electrical current (I) and heat flow (Q), thereby cooling one surface due to
The efficiency of a thermoelectric material for cooling and heating applications is determined by
its figure of merit, ZT (see details below). ZT describes the efficiency of the n-type and p-type
materials that make up the TE couple. Currently the best TE systems have a ZT value around 1
(COP=0.66). However, as ZT scales nonlinearly with efficiency, values around 9.2 need to be
achieved to match the energy efficiency of current conventional systems (Bell 2008).
Figure 5-5. Thermoelectric heat engines. (A) When current is applied across the TE device depending on its direction heating or cooling occurs via the Peltier
effect. (B) TE module showing device architecture of a practical TE generator. In this case multiple TE junctions are
connected together in series.

152
In the mid 1990’s, Hick and Dresselhouse published theoretical predictions showing possibilities
of making substantial TE efficiency gains using nanostructural engineering. These efforts led to
experimental demonstration of proof-of principle and high-efficiency materials (Dresselhaus
2007, Chen 2003).
Highly efficient TE materials are very difficult to develop as they have a conflicting combination
of physical properties. To maximize the ZT value of a material high thermo-power (Seebeck
conductivity. High Seebeck coefficients are present in insulators and semiconductors but such
materials also have low electrical conductivity. Finding a combination of these properties in a
single material remains a challenge.
Additional material design conflicts stem from the necessity for low thermal conductivity.
Glasses exhibit some of the lowest lattice thermal conductivities but they also have very low
charge carrier mobility, making them poor TE materials. On the other hand, good TE materials
require a ‘phonon-glass electron-crystal’ material, which is a crystalline material that scatters
phonons (thermal lattice vibrations) with minimal disruption to its electrical conductivity. The
crystalline requirement results from the desire for high conductivity, whereas the phonon-glass
requirement results from the need for low lattice thermal conductivity (Snyder 2008).
Different TE materials are used to match the operating temperature range of the application. For
an application that rejects heat at room-temperature, the most common materials used are alloys
of Bi2Te3 (p-type) and Sb2Te3 (n-type) due to their relatively high ZT values of approximately 1.
By changing the alloy composition it is possible to adjust or tune the carrier concentration
allowing ZT to be optimized to peak at different temperatures (Figure 5-6) (Snyder 2008). For
cooling applications below RT, alloys of BiSb have been used in n-type legs coupled with legs of
(Bi,Sb)2(Te,Se)3. However the poor mechanical properties of BiSb leave much room for
improvement.
Despite significant improvements in recent years that increased ZT significantly on the
nanoscale, scaling up to practical applications has proven to very difficult. However, TE devices
are mass produced for cooling applications in several niche markets where size and convenience
make them attractive. Current applications include portable coolers which are quiet and vibration
free. They are also widely used as replacements for wine cabinets, mini-refrigerators, and water
coolers.

153
Figure 5-6: ZT of State-of-the-Art Materials Includes materials used or being developed commercially or by NASA for thermoelectric power generation. (a), p-
type and (b), n-type. Most of these materials are complex alloys with dopants. (c) Altering the doping concentration
changes not only the peak ZT but also the temperature where the peak occurs. As the dopant concentration in n-type
PbTe increases (darker blue lines indicate higher doping) the ZT peak increases in temperature (Snyder 2008).
Researchers claim that, once fully developed, thermoelectric refrigeration cycles could be 50
percent more efficient than current vapor compression ones. With refrigeration equipment
accounting for a large percentage of national energy consumption, this means dramatic energy
savings potential. Like magnetic refrigeration, electrocaloric cycles do not require a compressor,
are more inclined to efficiency boosting controls, and could potentially operate without using
refrigerants with high GWP (DOE 2000).
Currently, scientists have only been able to electrically induce 12°C temperature ranges in
certain ceramics at room-temperature (Neese 2008). This temperature difference is not sufficient
for room-temperature refrigeration applications, which require temperature differences around
40°C. Finding an economical material that is capable of producing the necessary temperature
gradient is the primary barrier of implementation. Once overcome, thermoelectric refrigeration
could be a practical, environmentally friendly replacement for vapor compression refrigeration
(Patel-Predd 2008).
In summary, for TE refrigeration to become competitive with conventional vapor compression
technology, some major advances must occur. They include increasing the hot and cold
temperature differences ranges from around 12ºC to 40ºC as well as reducing the operating
temperature. To achieve energy efficiencies that can compete with conventional refrigerators TE
device efficiency needs to improve by a factor of four which translates to increasing ZT values
from 1 to 9.2. Such advances are directly correlated to improvements in TE materials. While the
field has been advancing rapidly in the past few years, without major leaps in performance it is
difficult to see how TE technology can compete with conventional refrigeration systems in the
next 5-10 years.
Ground-Coupled Supermarket Refrigeration Systems
Similar to ground-source (or “geothermal”) heat pumps, a ground-coupled supermarket
refrigeration system would reject heat to the ground rather than to ambient air. The advantage of
this configuration is that the ground provides a stable and low temperature heat sink, unlike
ambient air. Cooling water would be used to cool the condenser and it would then be circulated
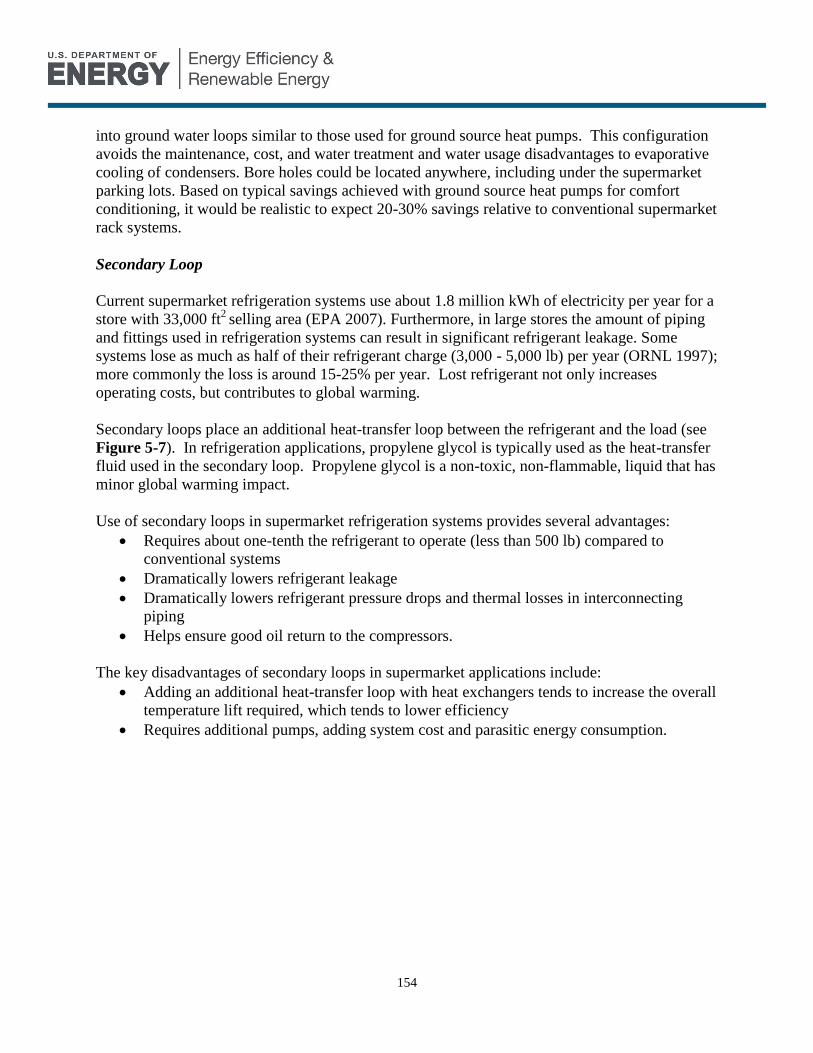
154
into ground water loops similar to those used for ground source heat pumps. This configuration
avoids the maintenance, cost, and water treatment and water usage disadvantages to evaporative
cooling of condensers. Bore holes could be located anywhere, including under the supermarket
parking lots. Based on typical savings achieved with ground source heat pumps for comfort
conditioning, it would be realistic to expect 20-30% savings relative to conventional supermarket
rack systems.
Secondary Loop
Current supermarket refrigeration systems use about 1.8 million kWh of electricity per year for a
store with 33,000 ft2
selling area (EPA 2007). Furthermore, in large stores the amount of piping
and fittings used in refrigeration systems can result in significant refrigerant leakage. Some
systems lose as much as half of their refrigerant charge (3,000 - 5,000 lb) per year (ORNL 1997);
more commonly the loss is around 15-25% per year. Lost refrigerant not only increases
operating costs, but contributes to global warming.
Secondary loops place an additional heat-transfer loop between the refrigerant and the load (see
Figure 5-7). In refrigeration applications, propylene glycol is typically used as the heat-transfer
fluid used in the secondary loop. Propylene glycol is a non-toxic, non-flammable, liquid that has
minor global warming impact.
Use of secondary loops in supermarket refrigeration systems provides several advantages:
Requires about one-tenth the refrigerant to operate (less than 500 lb) compared to
conventional systems
Dramatically lowers refrigerant leakage
Dramatically lowers refrigerant pressure drops and thermal losses in interconnecting
piping
Helps ensure good oil return to the compressors.
The key disadvantages of secondary loops in supermarket applications include:
Adding an additional heat-transfer loop with heat exchangers tends to increase the overall
temperature lift required, which tends to lower efficiency
Requires additional pumps, adding system cost and parasitic energy consumption.

155
Figure 5-7: Secondary Loop used with Vapor-Compression Refrigeration. (A) Diagram of
a direct expansion loop. (B) Diagram of a secondary refrigeration loop
Supermarket refrigeration systems with secondary loops have been demonstrated in the field. A
study by Southern California Edison in 2004 describes a field test comparison between a
secondary loop system and a conventional supermarket refrigeration system with evaporative
condensing (CEC 2004). Although the field test showed modest savings for the secondary loop
system, the source of these savings is unclear, and the comparison may not be a fair “apples-to-
apples” comparison. In general, due to the extra heat exchange process, all other things being
equal, secondary loop systems are not expected to show substantial energy savings advantages
over a conventional system. (Emerson 2009)
The major advantage of secondary loop systems is the reduction in refrigerant charge (by up to a
factor of 10), which results in far lower refrigerant leakage. Consequently, secondary loop
systems have substantially lowers greenhouse gas emissions and can dramatically improve
maintainability, thus reducing operation and maintenance costs. However, the installed cost of
secondary loop refrigeration systems is higher than that of conventional systems, and secondary
loop systems are unfamiliar to many contractors and supermarkets. Consequently, supermarkets
are wary of adopting what they may perceive as a risky technology, but as the importance of
direct greenhouse emissions from fluorocarbon refrigerants increases, secondary loop systems
will likely receive greater attention.
5.2 Advanced Compressors
Linear Compressors
Linear compressors employ a different design than either reciprocating or rotary compressors
and are reportedly more efficient than either. A diagram showing the differences between a
linear and reciprocating design is presented in Figure 5-8. The first version of the design was
developed by Sunpower for integration into refrigerators for the European market using
isobutene (R-600a) as a refrigerant (Sunpower 1999).
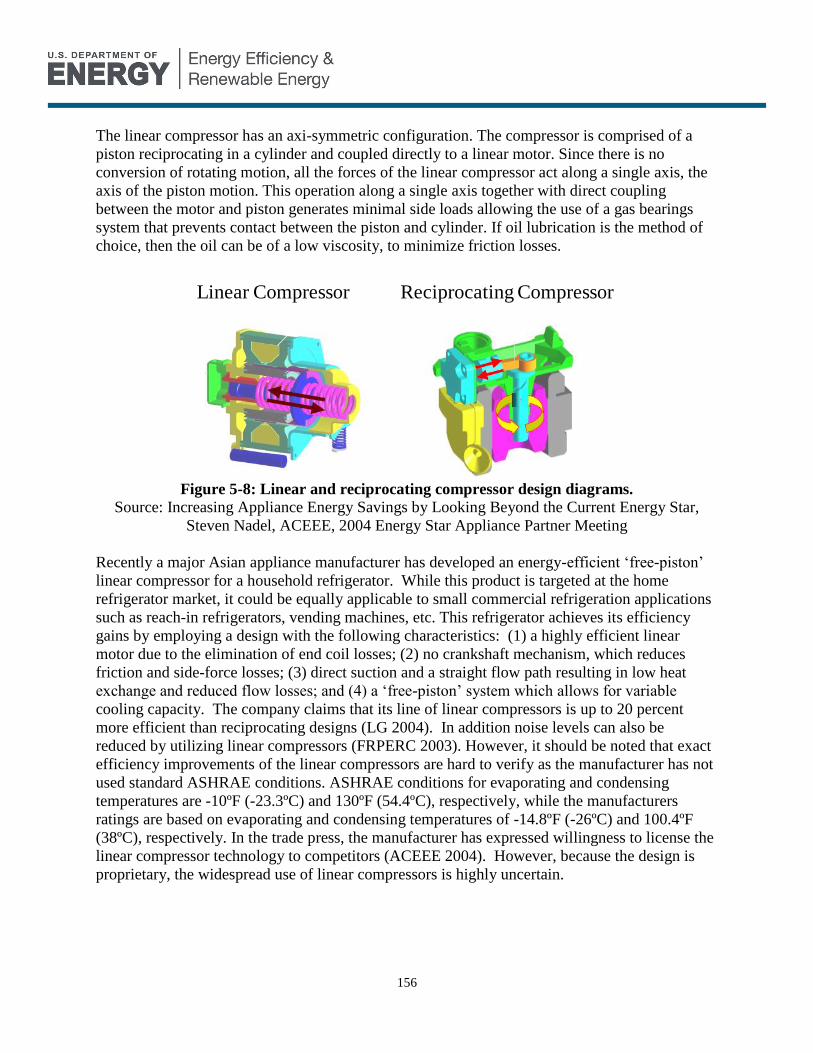
156
The linear compressor has an axi-symmetric configuration. The compressor is comprised of a
piston reciprocating in a cylinder and coupled directly to a linear motor. Since there is no
conversion of rotating motion, all the forces of the linear compressor act along a single axis, the
axis of the piston motion. This operation along a single axis together with direct coupling
between the motor and piston generates minimal side loads allowing the use of a gas bearings
system that prevents contact between the piston and cylinder. If oil lubrication is the method of
choice, then the oil can be of a low viscosity, to minimize friction losses.
Figure 5-8: Linear and reciprocating compressor design diagrams.
Source: Increasing Appliance Energy Savings by Looking Beyond the Current Energy Star,
Steven Nadel, ACEEE, 2004 Energy Star Appliance Partner Meeting
Recently a major Asian appliance manufacturer has developed an energy-efficient ‘free-piston’
linear compressor for a household refrigerator. While this product is targeted at the home
refrigerator market, it could be equally applicable to small commercial refrigeration applications
such as reach-in refrigerators, vending machines, etc. This refrigerator achieves its efficiency
gains by employing a design with the following characteristics: (1) a highly efficient linear
motor due to the elimination of end coil losses; (2) no crankshaft mechanism, which reduces
friction and side-force losses; (3) direct suction and a straight flow path resulting in low heat
exchange and reduced flow losses; and (4) a ‘free-piston’ system which allows for variable
cooling capacity. The company claims that its line of linear compressors is up to 20 percent
more efficient than reciprocating designs (LG 2004). In addition noise levels can also be
reduced by utilizing linear compressors (FRPERC 2003). However, it should be noted that exact
efficiency improvements of the linear compressors are hard to verify as the manufacturer has not
used standard ASHRAE conditions. ASHRAE conditions for evaporating and condensing
temperatures are -10ºF (-23.3ºC) and 130ºF (54.4ºC), respectively, while the manufacturers
ratings are based on evaporating and condensing temperatures of -14.8ºF (-26ºC) and 100.4ºF
(38ºC), respectively. In the trade press, the manufacturer has expressed willingness to license the
linear compressor technology to competitors (ACEEE 2004). However, because the design is
proprietary, the widespread use of linear compressors is highly uncertain.
Linear Compressor Reciprocating Compressor

157
5.3 Advanced Insulation
Vacuum Insulation Panels
Vacuum insulation panels (VIPs) exploit the virtually zero thermal conductivity of evacuated
space to provide insulation. Multiple thermal-radiation barriers are typically included, along
with a low-conductivity core material to provide structural integrity. Conventional insulation
panels achieve R-values around 8 hr-sqft-˚F/Btu or less per inch, while commercially available
VIP claim R-values of 30 hr-sqft-˚F/Btu per inch or greater (Glacier Bay 2009a). VIPs could,
therefore, significantly reduce refrigeration loads without increasing insulation thickness—
perhaps while even reducing insulation thickness.. VIPs are particularly attractive in
applications like self-contained refrigerators (e.g. reach-ins, beverage merchandisers) where
increasing the refrigerator outer dimensions or reducing refrigerated volume is unacceptable.
The energy savings potential of VIPs depends greatly on the application. In a Class A beverage
vending machine, use of VIP at an R-value of 30 would decrease energy consumption by 10
percent, according to NCI simulations.
To date, lifespan concerns, inconsistent results from prototype testing, and high costs have
prevented widespread use of VIPs. The core materials of VIPs provide structural support and
also limit the mean free path of the gas molecules remaining in the panel. Typical core materials
include mineral powder, mineral fiber, fiberglass and silica, all of which are costly after being
processed for VIP applications (Glacier Bay 2009b).
Results of prototype tests have been inconsistent, partly due to the impacts of edge losses. The
films encasing the core materials of VIPs often include metals to provide impermeability, but
this can lead to high levels of conduction and consequent thermal losses around the edges of
panels,. Further development could address some of the VIP performance issues and reduce
their price to make them cost competitive with conventional insulation materials.
One possible approach to reducing the cost premium of VIPs would be to explore “active”
vacuum panel insulation, particular for closed-door supermarket display cases. One of the
factors that makes VIPs complex and expensive to manufacture is the difficulty of ensuring that
vacuum is maintained for many years. However, it is conceivable that “active” vacuum panels
could be developed that use small, built-in, vacuum pumps to maintain vacuum, which would
enable far simpler and cheaper manufacturing techniques. The additional cost of the vacuum
pump and associated hardware might more than offset the cost reduction associated with
manufacturing simpler panels that do not need to maintain a high vacuum over many years. The
parasitic electric consumption of the vacuum pump should be modest, assuming that leakage
paths are minimal.
Advanced Air Curtains
Open refrigerated display cases are attractive to retailers because they allow consumers easy
access to products. As described in section 3.1.1, open display cases generally incorporate
circulated air curtains to help keep cold air inside the case. They effectively create invisible

158
barrier between the cold air inside the display case and the ambient temperature air outside. Air
curtains are planar jets of air with a large aspect ratio that have more momentum than the
surrounding air molecules. They are mainly responsible for separating the cooling zone in the
display case from the ambient air outside the display case (see Figure 5-9). However, other than
temperature separation air curtains have other benefits, they also act as barriers for air-born
particles and help maintain the relative humidity inside the display case.
Improved air-curtain design is aimed at reducing the impact of infiltration by reducing the
entrainment of warm ambient air. While mixing between the cold air curtain and warm store air
cannot be avoided as part of the cold air spills over the display case and is replaced by the
outside air, making the air curtain flow as laminar as possible reduces entrainment (see Figure
5-9). This can be achieved by configuring the air profile before the air curtain discharge air grille
(DAG) using a honeycomb grille to align the airstreams. This in turn encourages laminar flow of
air and improves performance by reducing the infiltration load (DOE 2009a).
Figure 5-9: Schematics of a typical open refrigerated vertical display case and air
circulation pattern (side view). Image taken from DOE 2009a.
The amount of warm air that moves into the display case through the DAG, the infiltration rate,
is responsible for most of the cooling load and thereby the power consumption. Since roughly 80
percent of the refrigeration load in open refrigerators is caused by warm air infiltration, air
curtain performance becomes a problem of interest. It is possible to control the infiltration rate
by changing various parameters of the air curtain such as velocity and throw angle (DOE 2009a,
ORNL 2008)). For example, in a report from ORNL they show a reduction of 8% in the
infiltration rate by changing the velocity and throw angle of the air curtain (ORNL 2008). This
reduction in infiltration rate in turn impacts the compressor load and results in a 4% daily power
reduction. Additional savings of 9%, or a total of 13% savings, were observed by optimizing the
suction pressure while maintaining product temperatures below 41°F. Simulations by ORNL
show that turbulences in the return air grille (RAG) are also an important factor in reducing

159
infiltration. By reducing turbulence in the RAG further improvements can be made and the
infiltration rate can be reduced by an additional 8% from the current value of 14% to around 2%
(ORNL 2008).
Overall, ORNL shows that a very limited and simple geometrical and flow alteration can reduce
the infiltration rate by 8% and reduce compressor energy consumption by 4%. Simulations and
experiments suggest there is more room for improvement.
5.4 Heat Exchangers
Micro-Channel Heat Exchangers
Micro-channel heat exchangers transfer heat through multiple flat, fluid-filled tubes containing
small channels (10-
current fin-tube heat exchangers, the air passing over the heat exchanger has a longer dwell time,
thus increasing both the efficiency and the rate of heat transfer.
By constraining the flow to such narrow channels, thermal diffusion lengths are short, and the
characteristic heat-transfer coefficients are very high. Since the thermal performance is so strong,
relatively short flow passages are required, and with many flow passages in parallel in a small
device, the pressure drop can be small as well (PNL 2008). This increase in heat exchanger
effectiveness allows the micro-channel heat exchanger to be of smaller dimensions and maintain
similar performance compared to a regular heat exchanger. It is possible to get improved
performance for the same volume as a conventional heat exchanger. Micro-channel technology is
very common for automotive air conditioning application due to its small size and reduced
weight. They have also been introduced in some stationary a/c applications due to compact size
considerations. This is an indication that the technology can overcome the critical manufacturing
huddles.
Figure 5-10: Micro-channel heat exchanger. Image taken from Delphi.

160
Studies show that systems using micro-channel heat exchangers show about 15% improvement
in heat exchanger efficiency. This translates to a 5% improvement in energy saving potential
compared conventional heat exchangers (ACEEE2004, International Journal of Refrigeration
2008b).
Electro-Hydrodyamically Enhanced Heat Transfer (EHD) Heat transfer techniques, including electro-hydrodynamically (EHD) enhanced heat transfer, can
improve the heat transfer duty of heat exchangers. These techniques can be divided into two
main groups, active and passive. Active techniques require the use of external forces to the heat
transfer surface, such as surface vibration, acoustic or electric fields, passive techniques are
based on application of specific surface geometries with surface augmentation. The effectiveness
of both techniques strongly depends on the mode of heat transfer, single phase or multiphase.
Besides the improvement of the heat exchanger performance for the same area, heat transfer
enhancement enables a decrease in the physical size of a heat exchanger while maintaining its
performance.
Electro-hydrodynamic (EHD) enhancement of heat transfers refers to the coupling of an electric
field with the fluid field in a dielectric fluid medium. In this technique, either a DC or an AC
high-voltage low-current electric field is applied in the dielectric field medium flowing between
a charged and a receiving (grounded) electrode. The applied electric field destabilizes the
thermal boundary layer, thereby producing better mixing of the bulk fluid flow and, thereby,
increasing the net heat-transfer coefficient. EHD appears to be more effective when applied to
phase-change processes (e.g., boiling and condensation).
EHD is typically used to electronically control the capacity of a heat exchanger by adjusting the
applied voltage to adjust the heat transfer. Therefore, the heat exchanger can be sized to operate
conventionally during non-peak periods and use EHD during peak-load periods. EHD can
replace, or work in conjunction with, enhanced surface heat exchangers.
To use EHD, an electrical voltage (from a few volts to thousands of volts) is applied to the heat
exchanger. However, because heat-transfer fluids are typically dielectrics (of low electrical
conductivity), even high voltages produce very little current. This low current helps keep the
power (voltage x current), and the associated energy penalty, low.
By using the EHD-enhanced heat transfer it is possible to calculate the COP of the system. Using
experimental results of the EHD-enhanced heat transfer Al-Dadah et al. calculated the increase in
COP for an R-22 vapor compression refrigerator. Their model showed an increase of 8% in the
system COP (Al-Dadah, 1992). Eames and Sabir showed in their calculation that if enhancement
is applied simultaneously to the condenser and evaporator significant increase in COP can be
achieved. For this calculation they used material properties described in the literature to calculate
a COP increase on the order of 40% (Eames 1997).

161
5.5 Alternative Refrigerants
Carbon Dioxide
CO2 (R-744) was widely used as refrigerant in the early 20th century; however, during the
middle of the 20th
century, it was replaced by the fluorocarbons. Over the last several decades,
chemical companies have introduced new refrigerants in response to government mandates for
ozone friendly, chlorine free, refrigerants. When introduced, many expected hydrofluorocarbon
(HFC) refrigerants to provide a permanent solution, but due to their global warming impact,
future use of these refrigerants may be restricted. Use of natural refrigerants, such as CO2, that
are chlorine free and have low global-warming potential are gaining increased attention (Kyoto
Protocol 1997). CO2 refrigerant has a favorable global-warming potential (GWP) (GWP of 1,
compared to 1300 for HFC-134a). As an additional benefit, there is no need to capture the CO2
during maintenance, thereby simplifying handling and providing cost savings as well.
CO2 is both non-toxic and non-flammable; furthermore, it is abundant and inexpensive. CO2 has
an operating pressure 3-10 times higher than for conventional refrigerants (7.38 MPa). CO2 has a
low critical temperature (31.1°C) thus requiring a transcritical refrigeration cycle. In a
transcritical cycle, the condenser is replaced by a gas cooler. The refrigerant evaporates in the
subcritical region and rejects heat at temperatures above the critical point in the gas cooler
(Figure 5-11). The high operating pressures of CO2 systems present both a challenge and an
opportunity, as system size and weight can potentially be reduced.
Source: Brown 2002
Figure 5-11: CO2 transcritical cycle and R-22 subcritical cycle at an ambient temperature
of 35C (95F) with baseline UA values.
Currently, CO2 is drawing most interest in systems with high refrigerant leakage rates that are
significant enough to attract regulatory attention (such as automotive air conditioning and
supermarket rack systems) as well as in high-temperature heat-pump applications and selected
military cooling applications where it is attractive for logistical reasons.
However, the use of CO2 has its drawbacks. The thermodynamic efficiency of CO2 cycles is
lower than for conventional systems, especially at high ambient temperatures (Figure 5-12). This
162
efficiency reduction can counter the environmental benefits of CO2 systems, and may not be
acceptable from both a regulatory and a marketing standpoint. Therefore, efficiency must be
improved before CO2 systems can be widely adopted (Topping 2004).
Source: Nekså
Figure 5-12: Principal COP behavior CO2 system and conventional (baseline) systems at
varying ambient temperatures.
The use of new, economical screw and scroll compressors could significantly improve the
efficiencies of CO2 systems working near, or above, the critical temperature. Currently available
screw compressors are capable of providing up to 100 bar (gauge), but these compressors are not
designed for refrigeration use. However, market demand for CO2 compressors could possibly
result in development of high-pressure screw compressors for refrigeration applications.
Carbon dioxide is likely to be more widely used as the low-temperature stage of cascade systems
and, when economical CO2 compressors become available, as a single-stage system for air
conditioning and refrigeration. The use of CO2 may present significant benefits for air
conditioning and refrigeration applications. Benefits include better heat transfer, much smaller
piping, reduced pumping power, and the elimination of chilled water (Pearson). Currently, CO2
systems have a higher cost than conventional systems, but, with better designs that require less
raw materials and manufacturing learning curves, can lead to cost reductions. If CO2 becomes
more widely adopted, costs could rival conventional system costs within several years
(Antonijevic 2008).
Nanoparticle Refrigerant Additives
Nanomaterials are materials with dimensions on the order of nanometers. These materials
include nanoparticles, quantum dots, and carbon nanotubes. Nanomaterials are being
investigated for numerous applications due to their superior electrical, optical, mechanical, and
chemical performance, among many other favorable properties. Researchers at NIST have found
that the use of nanoparticles, especially ones made of copper oxide, have a beneficial effects
when they are mixed in a common polyester lubricant and added to a refrigerant (HFC-134a).
NIST observed a heat-transfer improvement of between 50 and 275% (Kedzierski 2007).
163
However, the mechanism behind the improved performance is not well understood yet, and
performance benefits are sensitive to material selection and concentration
A partial explanation for how nanoparticles improve heat transfer is that highly thermally
conductive nanoparticles increase the overall thermal conductivity of the fluid. This, however,
accounts for only a about 20% of the total increase in system performance (Kedzierski 2007).
One theory holds that, when present in sufficient concentrations, highly thermally conductive
nanoparticles further enhance heat transfer by encouraging more vigorous boiling. The
nanoparticles may serve as nucleation sites for boiling translating to improved heat transfer in the
system.
Such improvements to refrigerant heat transfer can be beneficial for drop-in replacements as well
as in new system designs. Furthermore, as more advanced nanoparticles are developed, they
could be substituted for existing nanoparticles by simply flushing the system and replacing the
refrigerant. Due to the improved energy efficiency, new system designs might allow downsizing
of heat exchangers, with the associated cost benefits. Of course, this has to be balanced against
the efficiency impacts of smaller heat exchangers.
The long-term health effects of nanomaterials are not yet fully understood. Addressing potential
health issues and assuring the safety of nanomaterials is essential if they are to be widely used.
5.6 Advanced Lighting
Lighting efficiency improvements lower energy use in two ways--1) direct reduction of lighting
electricity use; and 2) indirect reduction of refrigeration-system energy use due to less heat
generation in refrigerated cabinets .
Light-Emitting Diodes (LEDs)
Light-Emitting Diodes (LED) provide an opportunity for increasing the efficiency of
refrigeration lighting systems. Although current LEDs not as luminescent as fluorescent fixtures,
they are rapidly closing the gap. Laboratory demonstrations show that white LEDs have already
surpassed efficiencies of fluorescent bulbs. In some applications, the directional nature of LED-
generated light provides additional benefits, providing comparable illumination with lower
lumen output. For refrigeration application this is advantageous because the use of directional
light can better illuminate merchandize in the display case. In research conducted by the Lighting
Research Center (Raghavan 2002), subjects rated lighting display cases using LEDs to be more
desirable than conventionally lit cases. Another benefit for using LEDs load reduction on the
display case due to reduced heating. LEDs do not heat up as much as conventional fluorescent
lights do.
LEDs are predicted to steadily increase in efficiency and decrease in cost as technology improves
and production volumes grow. Although LED’s have started to penetrate the commercial
refrigeration market, more research could reduce the price premium and foster development of
application-specific lighting system designs that leverage the benefits of LEDs.

164
Solid-State Plasma Lighting
Plasma bulbs emit light when their contents (gas and metal halide) are vaporized to a plasma
state. Conventional high-intensity discharge (HID) lamps, including Metal Halide (MH) lamps,
generate plasmas using electrodes that penetrate the bulb casing. Solid-state plasma lighting
eliminates these electrodes, using instead a focused electric field to heat the gas and metal halide
mixture without penetrating the lamp. A focused radio frequency signal generated by a solid-
state power amplifier produces the electric field. At 140 lumens/watt, plasma bulbs have
demonstrated efficaciousness substantially higher than LEDs and they last just as long. In
addition, plasma bulbs can handle high power inputs, allowing them to emit up to 30,000
lumens. Plasma bulbs are currently being marketed for use in street lamps, but a decrease in
costs could make them attractive for a wide range of other applications, including refrigeration
(LIFI 2009).
Fiber-Optic Lighting
Fiber-optic lighting systems use fiber-optic cables to distribute light from a remote source to the
lighted area. A fiber-optic cable is made of glass or plastic, and uses the principal of internal
reflection to guide light along its length. For refrigeration applications, fiber-optic lighting
systems could save energy in two ways:
The fiber-optic cables can direct light from a single source to multiple areas, reducing the
overall number of lights needed for a given application
The light source can be remote from the refrigerated space, significantly reducing the
heat load placed on the refrigeration system.
In a pilot program by Southern California Edison, researchers retrofitted vertical reach-in
freezers of a commissary with fiber-optic lighting (SCE 2006). Compared to the fluorescent
system it replaced, the fiber-optic system reduced lighting energy consumption by 50% and
compressor energy consumption by 17%. The combined energy savings reduced energy
consumption by 25% for the entire system. The fiber-optic lighting delivered 60% less
luminescence compared to a fluorescent system; however, researchers reported no perceptible
difference in the lighting of the product.
The installed cost for the fiber-optic system was $30,000, with a payback period of 13.3 years.
While this is significantly more expensive than either fluorescent or LED lighting systems, with
economies of scale, price reductions can be expected. Test results reported by the Southern
California Edison’s Refrigeration Thermal Test Center (RTTC) , show that, in a 3-door low-
temperature display case, LED and fiber-optic systems drew, respectively, 25% and 64% less
power than fluorescent lighting. For LEDs, the measured cooling-load reduction on the display
case was small (125 Btu/hr), but significantly greater for fiber optics (574 Btu/hr) (SCE 2009).
Materials research to make fiber-optic cables cheaper could make fiber-optic systems cost
competitive.

165
5.7 Fan Blades
Whale Fins
Mimicking the tubercles found on humpback whale fins, scientists have developed fan blades
lined with similar bumps. Although they are being developed primarily for use on wind turbines,
whale-fin fan blades show a 20-percent increase in efficiency for industrial-sized ceiling fans
(Hamilton 2008). This technology is expected to be commercially available for industrial use in
less than a year. We found no evidence of ongoing research to adapt this technology for use in
commercial refrigeration applications, but it appears theoretically plausible.
5.8 Modeling, Monitoring and Tools
A survey of commercial refrigeration industry stakeholders, including researchers,
manufacturers, and store owners, revealed a strong interest in increasing the quality and
availability of information related to the design, operation and improvement of commercial
refrigeration equipment.
Modeling and Design
New and improved design tools/modeling methods would be beneficial to the commercial
refrigeration industry. Performance and energy-efficiency enhancement of refrigeration-cycle
components and systems are limited unless cutting-edge design tools, based on updated, more
accurate models, are introduced. An arsenal of reliable, widely used design tools based on up-to-
date science will also contribute to continuity, preventing knowledge loss as engineers and
technicians retire.
In essence, design tools help turn energy savings potential into realized energy savings. Design
tools are an effective way of packaging complex models. Usually based on higher order
scientific principles, these models would be difficult for the lay person to apply. In the form of a
design tool, however, these models become streamlined and user friendly. Design tools are also
highly customizable. They can be made to optimize the design of a single component or an
entire system. As a result, commercial refrigeration component and system designs become
more informed. This improves the effectiveness and efficiency of the design process.
Improvements to the design process make opportunities for increased energy efficiency more
readily available and attainable.
Monitoring
By integrating a network of sensors and data-collecting mechanisms, users of commercial
refrigeration equipment could gain access to real-time information detailing the energy use and
performance of their equipment. Monitoring systems facilitate and improve equipment owners’
ability to operate and maintain large arrays of refrigeration equipment more efficiently.
Conventionally, equipment operators rely on whole-facility monthly energy bills to monitor
performance and consumption. Anomalies in this information are hard to translate because so
many systems outside of refrigeration also contribute to the monthly bill. With real-time data
from a monitoring system, equipment operators would be able to recognize, pinpoint and
diagnose unexpected fluctuations in performance or usage very quickly. .

166
Because performance and usage issues can be detected and diagnosed in a timely manner,
monitoring systems provide significant energy savings potential. Monitoring systems have
already been implemented on a small scale. In a popular American supermarket a leakage
detection and energy usage monitoring system reduced electricity use by 23
million kWh per year, while avoiding emissions due to electricity generation of nearly 17,500
tons of CO2, as well as 71 tons of SO2 and 24 tons of NOx (Shaws 2002). The supermarket also
used the monitoring system data to develop long-term energy saving strategies and test the
claims of energy efficient equipment manufacturers.
Complex monitoring systems have considerable up-front costs and potentially disruptive
installations, and effective use may require operator retraining. In addition, because the concept
is still developing, commercial availability of industry-specific systems is limited. These factors
prevent widespread implementation. Further development, reduced initial costs and proven
return on investment should lead to market adoption..
Best-Practice and Design Guides
Quality, readily accessible information on industry best practices and promising new
technologies would be a helpful tool in the commercial refrigeration industry. In an evolving
industry, where stringent energy-efficiency standards are becoming the norm, equipment
manufacturers and operators would benefit from one-stop sources of trustworthy information:
comprehensive best practices guides and unbiased reviews of emerging technologies.
With exhaustive guides on best practices and design options, equipment manufacturers and
operators would be better informed of energy-saving opportunities. Exposure to this information
would make the industry more aware of and likely to adopt energy-saving strategies and designs.
Owners and operators would be better able to find operating strategies that lower energy
consumption, manufacturers would be better able to compare design options to identify the most
cost-effective technologies, and designers would be aware of industry innovations.
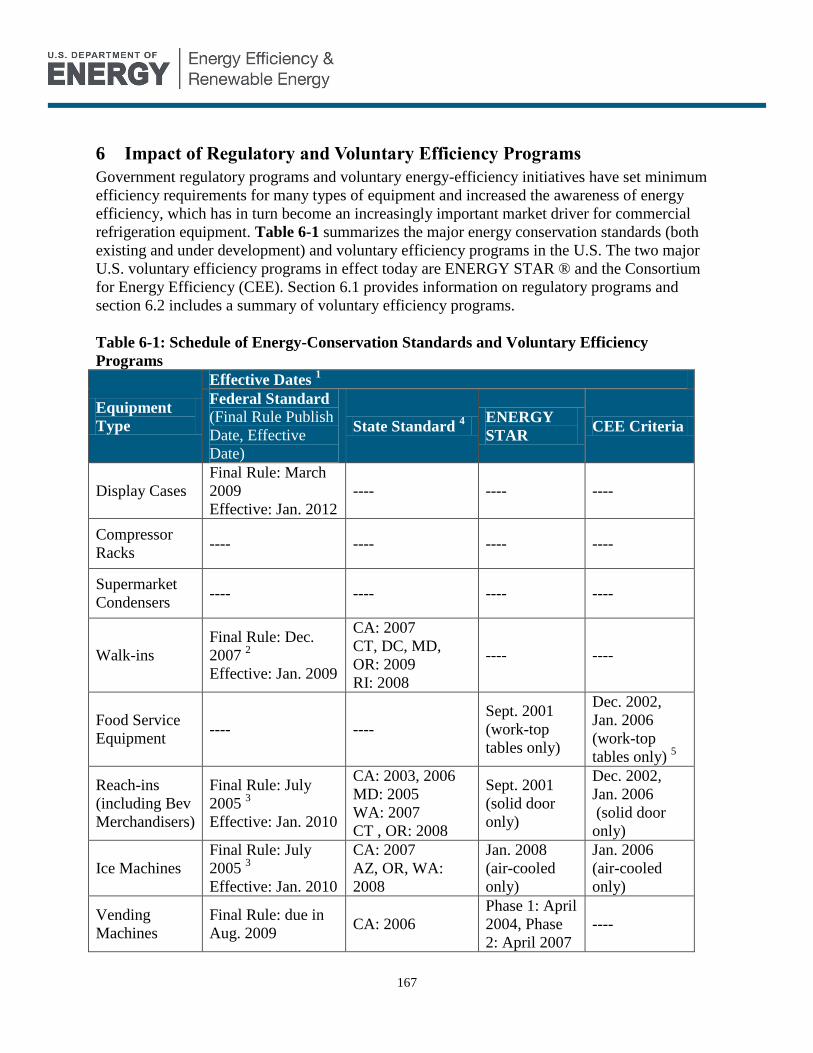
167
6 Impact of Regulatory and Voluntary Efficiency Programs
Government regulatory programs and voluntary energy-efficiency initiatives have set minimum
efficiency requirements for many types of equipment and increased the awareness of energy
efficiency, which has in turn become an increasingly important market driver for commercial
refrigeration equipment. Table 6-1 summarizes the major energy conservation standards (both
existing and under development) and voluntary efficiency programs in the U.S. The two major
U.S. voluntary efficiency programs in effect today are ENERGY STAR ® and the Consortium
for Energy Efficiency (CEE). Section 6.1 provides information on regulatory programs and
section 6.2 includes a summary of voluntary efficiency programs.
Table 6-1: Schedule of Energy-Conservation Standards and Voluntary Efficiency
Programs
Equipment
Type
Effective Dates 1
Federal Standard
(Final Rule Publish
Date, Effective
Date)
State Standard 4
ENERGY
STAR CEE Criteria
Display Cases
Final Rule: March
2009
Effective: Jan. 2012
---- ---- ----
Compressor
Racks ---- ---- ---- ----
Supermarket
Condensers ---- ---- ---- ----
Walk-ins
Final Rule: Dec.
2007 2
Effective: Jan. 2009
CA: 2007
CT, DC, MD,
OR: 2009
RI: 2008
---- ----
Food Service
Equipment ---- ----
Sept. 2001
(work-top
tables only)
Dec. 2002,
Jan. 2006
(work-top
tables only) 5
Reach-ins
(including Bev
Merchandisers)
Final Rule: July
2005 3
Effective: Jan. 2010
CA: 2003, 2006
MD: 2005
WA: 2007
CT , OR: 2008
Sept. 2001
(solid door
only)
Dec. 2002,
Jan. 2006
(solid door
only)
Ice Machines
Final Rule: July
2005 3
Effective: Jan. 2010
CA: 2007
AZ, OR, WA:
2008
Jan. 2008
(air-cooled
only)
Jan. 2006
(air-cooled
only)
Vending
Machines
Final Rule: due in
Aug. 2009 CA: 2006
Phase 1: April
2004, Phase
2: April 2007
----

168
Sources: EPACT 2005, EISA 2007, and DOE 2009b for federal standards; ASAP 2009 for
state standards; ENERGY STAR 2001 and 2008 for ENERGY STAR criteria; CEE 2006a
and 2006b for CEE criteria 1 The symbol, “----“, means no program in place
2 Passed as part of the Energy Independence and Security Act of 2007 (EISA)
3 Passed as part of the Energy Policy Act of 2005 (EPACT)
4 State standards are superseded by federal standards if/when they are put in place and
become effective. 5 The worktop surface may not add to the total energy consumption of the unit.
6.1 Regulatory Programs
The federal government (through DOE) and certain states have established energy-conservation
standards for selected CRE. In most cases, standards are performance-based, meaning they place
an explicit limit on energy consumption, based on prescribed test procedures. In the case of
walk-ins, DOE has established prescriptive standards that regulate the physical characteristics of
the unit to increase energy efficiency (i.e., R values for insulation). Federal and state regulatory
programs are described further below.
6.1.1 Federal Energy Conservation Standards
Energy Policy Act of 2005
The Energy Policy Act of 2005 (EPACT), which was signed into law on August 8th, 2005,
directed DOE to prescribe specific energy conservation standards for several residential and
commercial products. The commercial equipment included solid-door reach-in refrigerators,
freezers, and refrigerator-freezers, glass-door refrigerators and freezers, and automatic
commercial ice machines manufactured on or after January 1, 2010. 16
Table 6-2 and Table 6-3
provide EPACT 2005 current standards for reach-ins and ice machines, respectively. The
maximum energy use for solid-door reach-ins according to the standard, as well as the CEE Tier
2 energy use criteria (described below), are shown as a function of cabinet volume in Figure 6-1.
DOE expects to issue a revised standard for ice machines in 2010, which would become effective
in 2015.
In addition, EPACT 2005 directs the U.S. Department of Energy to prescribe energy
conservation standards (without specifying the standard) for beverage vending machines no later
than August 8, 2009, and states that any such standards shall apply to beverage vending
machines manufactured three years after the date of publication of the final rule that establishes
those standards. The energy use of this equipment has never before been regulated at the Federal
level.
16
Ice machines covered under EPACT 2005 are limited to machines that produce cube type ice in capacities of 50 to
2500 pounds per 24-hour period.
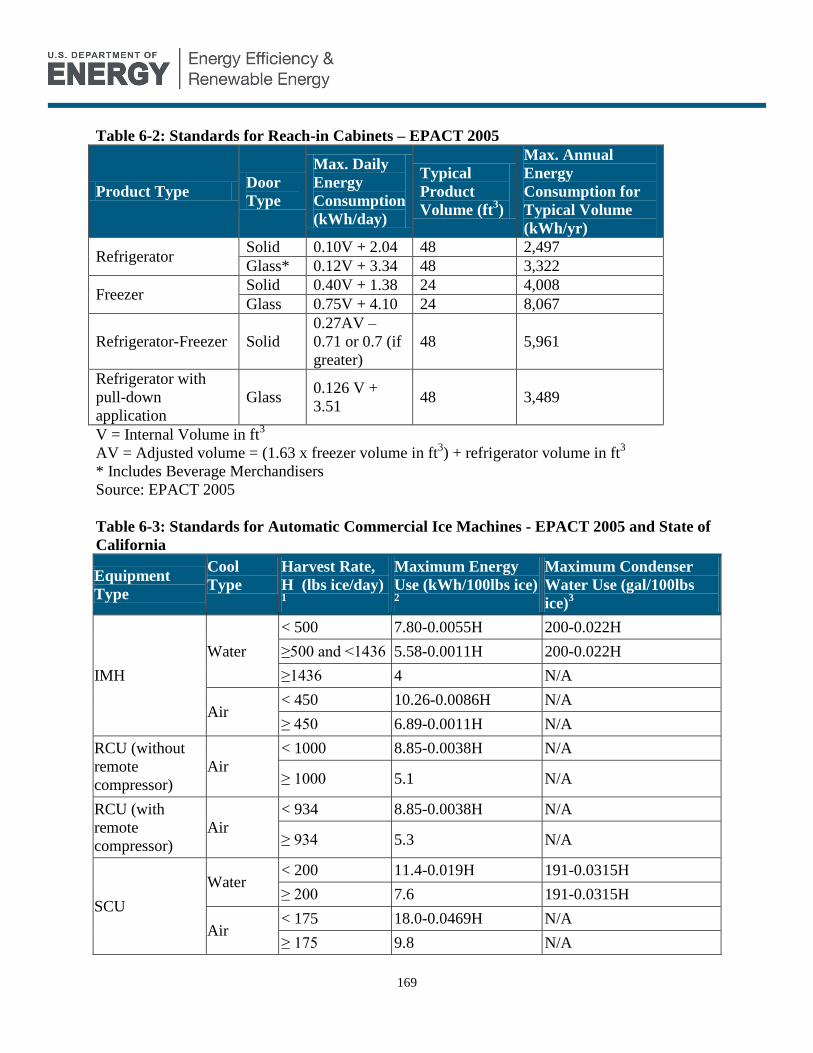
169
Table 6-2: Standards for Reach-in Cabinets – EPACT 2005
Product Type Door
Type
Max. Daily
Energy
Consumption
(kWh/day)
Typical
Product
Volume (ft3)
Max. Annual
Energy
Consumption for
Typical Volume
(kWh/yr)
Refrigerator Solid 0.10V + 2.04 48 2,497
Glass* 0.12V + 3.34 48 3,322
Freezer Solid 0.40V + 1.38 24 4,008
Glass 0.75V + 4.10 24 8,067
Refrigerator-Freezer Solid
0.27AV –
0.71 or 0.7 (if
greater)
48 5,961
Refrigerator with
pull-down
application
Glass 0.126 V +
3.51 48 3,489
V = Internal Volume in ft3
AV = Adjusted volume = (1.63 x freezer volume in ft3) + refrigerator volume in ft
3
* Includes Beverage Merchandisers
Source: EPACT 2005
Table 6-3: Standards for Automatic Commercial Ice Machines - EPACT 2005 and State of
California
Equipment
Type
Cool
Type
Harvest Rate,
H (lbs ice/day) 1
Maximum Energy
Use (kWh/100lbs ice) 2
Maximum Condenser
Water Use (gal/100lbs
ice)3
IMH
Water
< 500 7.80-0.0055H 200-0.022H
≥500 and <1436 5.58-0.0011H 200-0.022H
≥1436 4 N/A
Air < 450 10.26-0.0086H N/A
≥ 450 6.89-0.0011H N/A
RCU (without
remote
compressor)
Air
< 1000 8.85-0.0038H N/A
≥ 1000 5.1 N/A
RCU (with
remote
compressor)
Air
< 934 8.85-0.0038H N/A
≥ 934 5.3 N/A
SCU
Water < 200 11.4-0.019H 191-0.0315H
≥ 200 7.6 191-0.0315H
Air < 175 18.0-0.0469H N/A
≥ 175 9.8 N/A

170
Source: EPACT 2005, CEC 2007 1
Harvest rate is calculated using ARI Test Method 810-2008. Ambient temperature 90°F; water
inlet temperature 70°F; water inlet pressure .30 ± 3 psig 2 H = Harvest Rate
1 Condenser water use is applicable to water-cooled ice machine
Figure 6-1: Efficiency Standards for Solid Door Reach-Ins
The Energy Independence and Security Act of 2007(EISA) includes prescriptive standards for
walk-in coolers and freezers manufactured on or after January 1, 2009. The list below includes
the requirements for walk-in coolers and freezers:
Automatic door closers that firmly close all walk-in doors that have been closed to within
1 inch of full closure, except for doors wider than 3 feet 9 inches or taller than 7 feet.
Strip doors, spring hinged doors, or other method of minimizing infiltration when doors
are open.
Wall, ceiling, and door insulation of at least R-25 for coolers and R-32 for freezers,
except for glazed portions of doors and structural members.
Floor insulation of at least R-28 for freezers.
Evaporator fan motors under 1 hp and less than 460 volts must use electronically
commutated motors or 3-phase motors
Condenser fan motors under 1 hp must use electronically commutated motors, permanent
split capacitor-type motors, or 3-phase motors.
Interior lights that use light sources with an efficacy of 40 lumens per watt or more,
including ballast losses if any. For light sources with an efficacy of 40 lumens per watt
or less, a timer or device can be used that turns off the lights within 15 minutes of when
the walk-in cooler or walk-in freezer is not occupied by people.
Transparent reach-in doors for walk-in freezers and windows in walk-in freezer doors
shall be of triple pane glass with either heat-reflective treated glass or gas fill.
Efficiency Standards for Solid Door Reach-Ins
0
2000
4000
6000
8000
10000
12000
0 10 20 30 40 50 60 70
Cabinet Volume (ft^3)
Max
An
nu
al E
ner
gy
Use
(k
Wh
/yea
r) Refrigerator - CEE Tier 2
Freezer - CEE Tier 2
Refrigerator - 2010 Standard/Energy Star
Freezer - 2010 Standard/Energy Star
3-Door
1-Door
2-Door
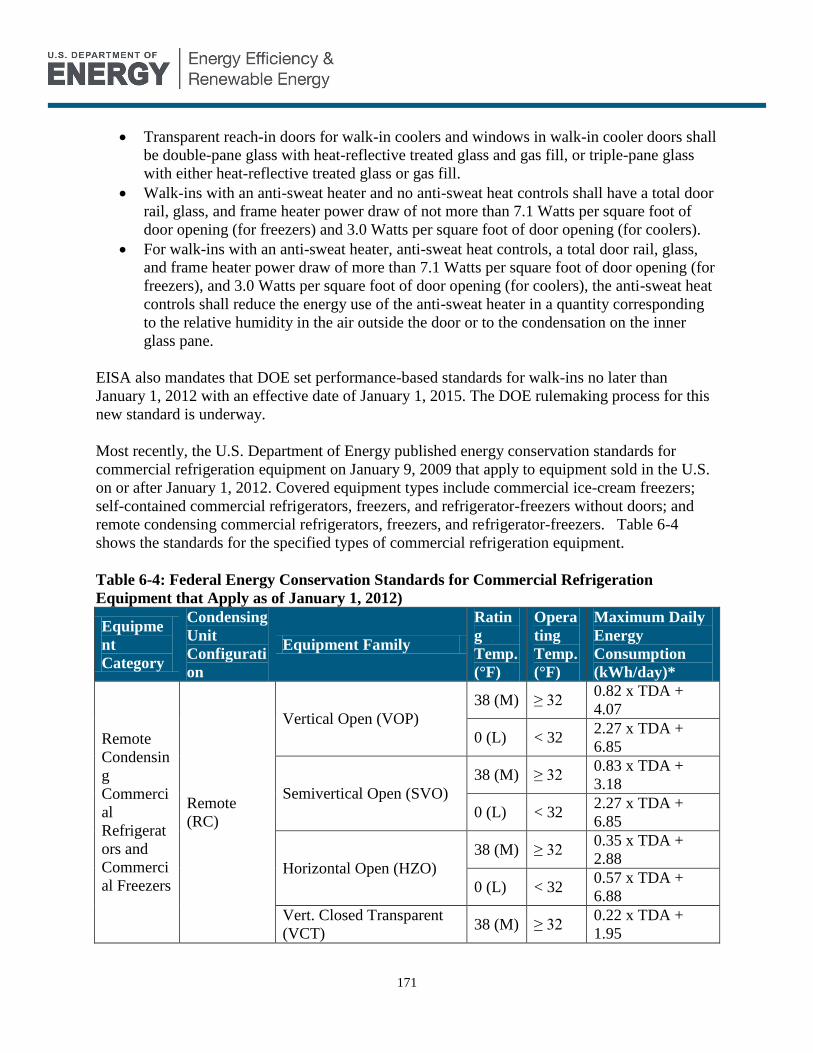
171
Transparent reach-in doors for walk-in coolers and windows in walk-in cooler doors shall
be double-pane glass with heat-reflective treated glass and gas fill, or triple-pane glass
with either heat-reflective treated glass or gas fill.
Walk-ins with an anti-sweat heater and no anti-sweat heat controls shall have a total door
rail, glass, and frame heater power draw of not more than 7.1 Watts per square foot of
door opening (for freezers) and 3.0 Watts per square foot of door opening (for coolers).
For walk-ins with an anti-sweat heater, anti-sweat heat controls, a total door rail, glass,
and frame heater power draw of more than 7.1 Watts per square foot of door opening (for
freezers), and 3.0 Watts per square foot of door opening (for coolers), the anti-sweat heat
controls shall reduce the energy use of the anti-sweat heater in a quantity corresponding
to the relative humidity in the air outside the door or to the condensation on the inner
glass pane.
EISA also mandates that DOE set performance-based standards for walk-ins no later than
January 1, 2012 with an effective date of January 1, 2015. The DOE rulemaking process for this
new standard is underway.
Most recently, the U.S. Department of Energy published energy conservation standards for
commercial refrigeration equipment on January 9, 2009 that apply to equipment sold in the U.S.
on or after January 1, 2012. Covered equipment types include commercial ice-cream freezers;
self-contained commercial refrigerators, freezers, and refrigerator-freezers without doors; and
remote condensing commercial refrigerators, freezers, and refrigerator-freezers. Table 6-4
shows the standards for the specified types of commercial refrigeration equipment.
Table 6-4: Federal Energy Conservation Standards for Commercial Refrigeration
Equipment that Apply as of January 1, 2012)
Equipme
nt
Category
Condensing
Unit
Configurati
on
Equipment Family
Ratin
g
Temp.
(°F)
Opera
ting
Temp.
(°F)
Maximum Daily
Energy
Consumption
(kWh/day)*
Remote
Condensin
g
Commerci
al
Refrigerat
ors and
Commerci
al Freezers
Remote
(RC)
Vertical Open (VOP)
38 (M) ≥ 32 0.82 x TDA +
4.07
0 (L) < 32 2.27 x TDA +
6.85
Semivertical Open (SVO)
38 (M) ≥ 32 0.83 x TDA +
3.18
0 (L) < 32 2.27 x TDA +
6.85
Horizontal Open (HZO)
38 (M) ≥ 32 0.35 x TDA +
2.88
0 (L) < 32 0.57 x TDA +
6.88
Vert. Closed Transparent
(VCT) 38 (M) ≥ 32
0.22 x TDA +
1.95
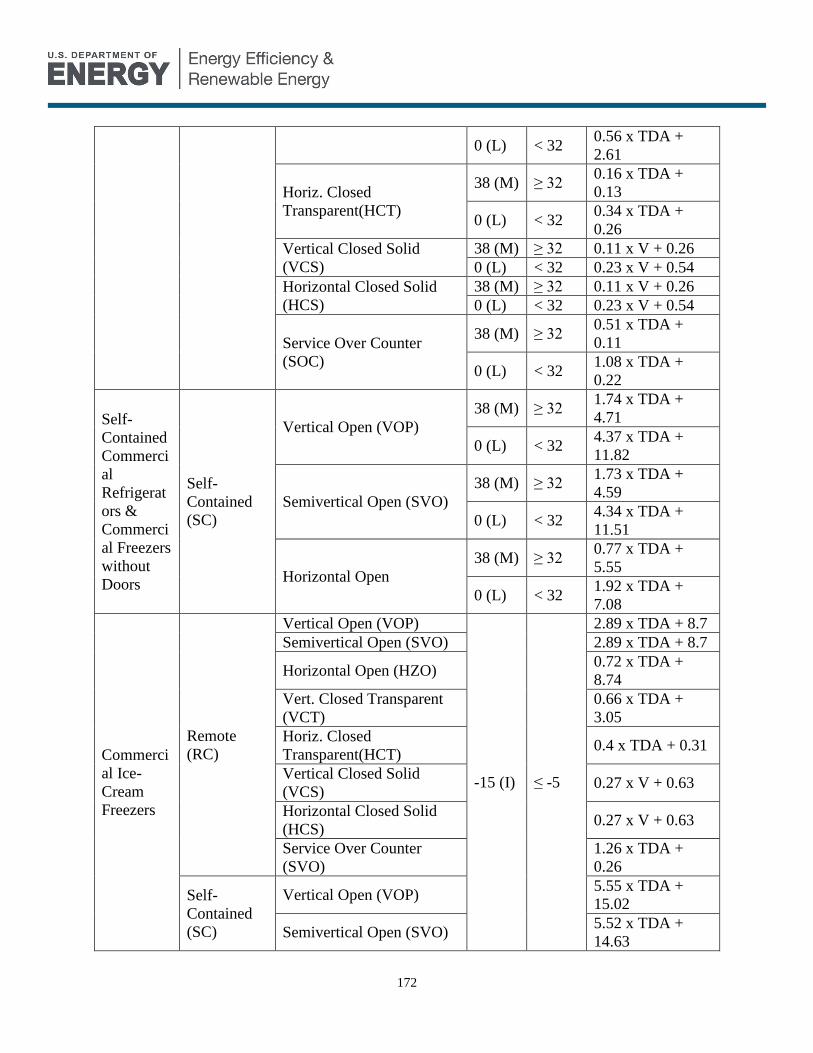
172
0 (L) < 32 0.56 x TDA +
2.61
Horiz. Closed
Transparent(HCT)
38 (M) ≥ 32 0.16 x TDA +
0.13
0 (L) < 32 0.34 x TDA +
0.26
Vertical Closed Solid
(VCS)
38 (M) ≥ 32 0.11 x V + 0.26
0 (L) < 32 0.23 x V + 0.54
Horizontal Closed Solid
(HCS)
38 (M) ≥ 32 0.11 x V + 0.26
0 (L) < 32 0.23 x V + 0.54
Service Over Counter
(SOC)
38 (M) ≥ 32 0.51 x TDA +
0.11
0 (L) < 32 1.08 x TDA +
0.22
Self-
Contained
Commerci
al
Refrigerat
ors &
Commerci
al Freezers
without
Doors
Self-
Contained
(SC)
Vertical Open (VOP)
38 (M) ≥ 32 1.74 x TDA +
4.71
0 (L) < 32 4.37 x TDA +
11.82
Semivertical Open (SVO)
38 (M) ≥ 32 1.73 x TDA +
4.59
0 (L) < 32 4.34 x TDA +
11.51
Horizontal Open
38 (M) ≥ 32 0.77 x TDA +
5.55
0 (L) < 32 1.92 x TDA +
7.08
Commerci
al Ice-
Cream
Freezers
Remote
(RC)
Vertical Open (VOP)
-15 (I) ≤ -5
2.89 x TDA + 8.7
Semivertical Open (SVO) 2.89 x TDA + 8.7
Horizontal Open (HZO) 0.72 x TDA +
8.74
Vert. Closed Transparent
(VCT)
0.66 x TDA +
3.05
Horiz. Closed
Transparent(HCT) 0.4 x TDA + 0.31
Vertical Closed Solid
(VCS) 0.27 x V + 0.63
Horizontal Closed Solid
(HCS) 0.27 x V + 0.63
Service Over Counter
(SVO)
1.26 x TDA +
0.26
Self-
Contained
(SC)
Vertical Open (VOP) 5.55 x TDA +
15.02
Semivertical Open (SVO) 5.52 x TDA +
14.63

173
Horizontal Open (HZO) 2.44 x TDA + 9.
Vert. Closed Transparent
(VCT)
0.67 x TDA +
3.29
Horiz. Closed
Transparent(HCT)
0.56 x TDA +
0.43
Vertical Closed Solid
(VCS) 0.38 x V + 0.88
Horizontal Closed Solid
(HCS) 0.38 x V + 0.88
Service Over Counter
(SVO)
1.76 x TDA +
0.36
* k kWh = kilowatt-hours; TDA = total display area of the case; V = refrigerated volume of
the case.
Source: DOE 2009b
6.1.2 State Energy Conservation Standards
Nine states have adopted energy conservation standards for commercial refrigerators and
freezers (see Table 6-5). Five of those states adopted standards that are already in effect. All
existing state standards are equal to, and will be preempted by, the federal standards once they
become effective on January 1, 2012.
Table 6-5: State Energy Conservation Standards for Commercial Refrigerators and
Freezers
State Effective Date of Standard(s)
Arizona 2010
California 2003, 2006
Connecticut July 2007
Maryland September 2005
New Jersey 2010
New York 2010
Oregon 2008
Rhode Island 2010
Washington 2007
Source: ASAP 2009
Five states and one district (California, Connecticut, District of Columbia, Maryland, Oregon and
Rhode Island) have adopted state energy standards for walk-in coolers and freezers. These
include a variety of prescriptive standards such as insulation levels, motor types, automatic door
closers, etc. (Nadel 2006). California was the first state to institute standards, which became
effective in January 2006. However, the federal standards that became effective on January 1,
2009, superseded all current state standards for walk-ins.

174
The States of Maryland, Washington, California, and Connecticut recently established standards,
consistent with EPACT 2005, for commercial refrigeration energy use. However, California
specifically excludes preparation tables from its proposed standards for commercial refrigeration.
The states of Maryland, Washington and Connecticut define commercial refrigeration equipment
very generally, leaving the question of which products are covered open to interpretation.
The States of Arizona, California, Oregon, and Washington currently regulate the energy and
water use of automatic commercial ice machines manufactured on or after January 1, 2008, using
the same standards as required by EPACT 2005 at the federal level (see Table 6-3. The Federal
standard will preempt these state standards when it takes effect in January 2010. Rhode Island
and New York have also adopted standards, but they will be preempted by the Federal standard,
since they do not become effective until 2010.
The States of California, Connecticut, Maryland, Oregon, and Washington have set standards to
regulate the energy use of solid- and glass-door refrigerators, freezers, and refrigerator-freezers.
California was the first state to impose standards on reach-in units, which became effective in
2003. The Federal standard will supersede all current state standards when it takes effect in
January 2010.
California Energy Commission
The California Energy Commission (CEC) is responsible for setting the California state
regulations on energy consumption for products which are not regulated by the DOE. In addition
to the standards mentioned above, California requires that all packaged beverage vending
machines manufactured after January 1, 2006 meet energy efficiency standards. Table 6-6
shows the California energy efficiency standards for beverage vending machines.
Table 6-6 California Energy Conservation Standards for Packaged Beverage Vending
Machines
Appliance Maximum Daily Energy Consumption (kWh)
Refrigerated canned and bottled
beverage vending machines 0.55(8.66 + (0.009 × C))
Source: CEC 2007
C = rated capacity (number of 12 ounce cans)
6.2 Voluntary Programs
Several voluntary programs exist to raise awareness about energy efficiency and promote
adoption of high-efficiency products on the market. This section describes the criteria for the:
ENERGY STAR program
Consortium for Energy Efficiency Commercial Kitchens Initiative (CEE)
Federal Energy Management Program (FEMP).

175
6.2.1 ENERGY STAR
ENERGY STAR is a joint labeling program of the U.S. Environmental Protection Agency and
the U.S. Department of Energy designed to identify and promote energy- and water-efficient
products to reduce greenhouse gas emissions. ENERGY STAR has become a widely
recognizable symbol for energy efficiency. ENERGY STAR seeks to recognize products and
equipment that fall in the top 25% of energy efficiency among competing products/equipment
while meeting consumer needs for life, reliability, and functionality.
The ENERGY STAR criteria for the energy use of solid-door commercial refrigerators and
freezers (i.e., reach-ins) have been in effect since September 1, 2001. ENERGY STAR is in the
process of revising its criteria in anticipation of the new DOE standards coming into effect in
2010, which will be equal to the current ENERGY STAR criteria. Table 6-7 presents the reach-
in criteria for the ENERGY STAR program and Federal Energy Management Program (FEMP).
See section 6.2.3 for more information on FEMP.
Some food service equipment may qualify under the reach-in criteria, specifically work-top
tables that have unrefrigerated work-top surfaces. Prep tables and buffet tables are not included.
Table 6-7: ENERGY STAR and FEMP Efficiency Criteria for Reach-ins1
Product Type
Efficiency
Recommendation
(kWh/day) 2
Typical
Product
Volume (ft3)
Max. Annual
Energy
Consumption
for Typical
Volume
(kWh/yr)
Refrigerator ≤ 0.10V + 2.04 48 2497
Refrigerator-Freezer ≤ 0.27AV - 0.71 48 4471
Freezer ≤ 0.40V + 1.38 24 4008
Ice Cream Freezer ≤ 0.39V + 0.82 24 3716
Source: ENERGY STAR 2001, FEMP 2002 1
Federal Energy Management Program (FEMP); See section 6.2.3. 2 V = cabinet volume, AV = adjusted cabinet volume as defined in the Code of Federal
Regulations DOE Energy Test Procedure section (10 CFR 430). Adjusted volume takes
into account the larger impact of freezer volume as compared to refrigerator volume in
refrigerator-freezers.
The ENERGY STAR criteria for the energy and water use of commercial ice machines have
been effective since January 1, 2008. These criteria only cover air-cooled ice cube machines.
Table 6-8 shows the criteria by equipment type. ENERGY STAR plans to revisit the ice machine
criteria once the revision processes for the industry test procedures by the Air-conditioning,
Heating, and Refrigeration Institute (ARI 810-2007: Performance Rating of Automatic
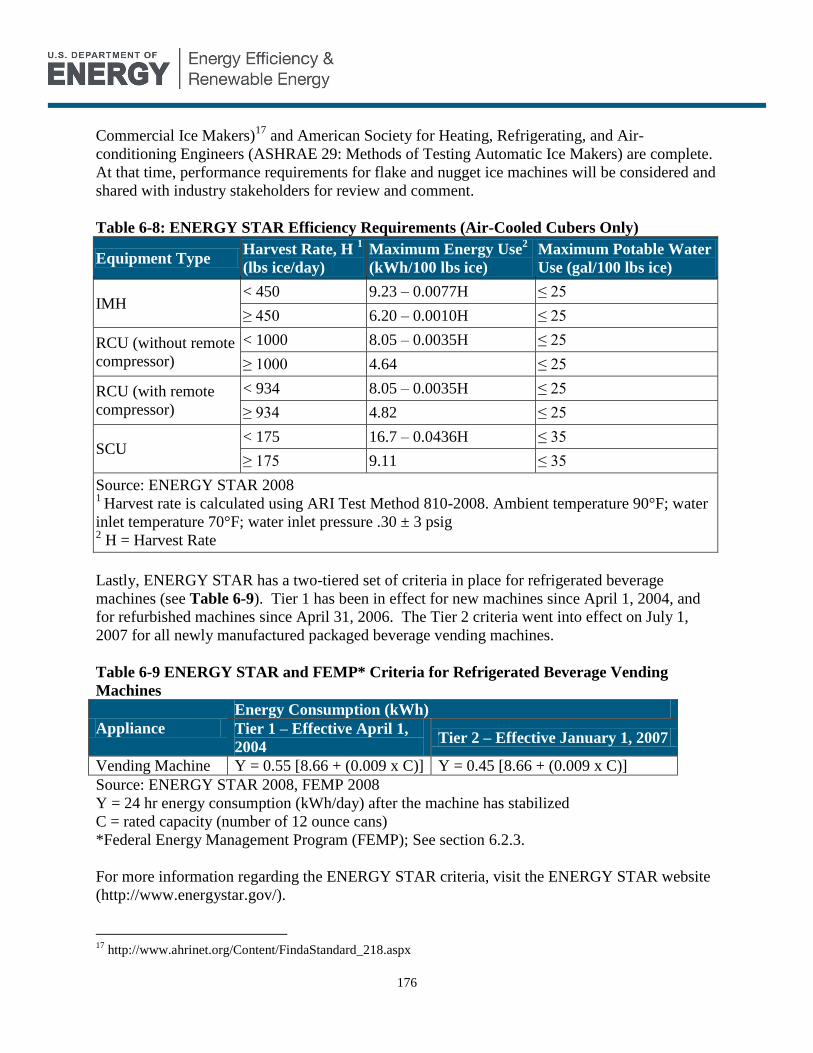
176
Commercial Ice Makers)17
and American Society for Heating, Refrigerating, and Air-
conditioning Engineers (ASHRAE 29: Methods of Testing Automatic Ice Makers) are complete.
At that time, performance requirements for flake and nugget ice machines will be considered and
shared with industry stakeholders for review and comment.
Table 6-8: ENERGY STAR Efficiency Requirements (Air-Cooled Cubers Only)
Equipment Type Harvest Rate, H
1
(lbs ice/day)
Maximum Energy Use2
(kWh/100 lbs ice)
Maximum Potable Water
Use (gal/100 lbs ice)
IMH < 450 9.23 – 0.0077H ≤ 25
≥ 450 6.20 – 0.0010H ≤ 25
RCU (without remote
compressor)
< 1000 8.05 – 0.0035H ≤ 25
≥ 1000 4.64 ≤ 25
RCU (with remote
compressor)
< 934 8.05 – 0.0035H ≤ 25
≥ 934 4.82 ≤ 25
SCU < 175 16.7 – 0.0436H ≤ 35
≥ 175 9.11 ≤ 35
Source: ENERGY STAR 2008 1
Harvest rate is calculated using ARI Test Method 810-2008. Ambient temperature 90°F; water
inlet temperature 70°F; water inlet pressure .30 ± 3 psig 2 H = Harvest Rate
Lastly, ENERGY STAR has a two-tiered set of criteria in place for refrigerated beverage
machines (see Table 6-9). Tier 1 has been in effect for new machines since April 1, 2004, and
for refurbished machines since April 31, 2006. The Tier 2 criteria went into effect on July 1,
2007 for all newly manufactured packaged beverage vending machines.
Table 6-9 ENERGY STAR and FEMP* Criteria for Refrigerated Beverage Vending
Machines
Appliance
Energy Consumption (kWh)
Tier 1 – Effective April 1,
2004 Tier 2 – Effective January 1, 2007
Vending Machine Y = 0.55 [8.66 + (0.009 x C)] Y = 0.45 [8.66 + (0.009 x C)]
Source: ENERGY STAR 2008, FEMP 2008
Y = 24 hr energy consumption (kWh/day) after the machine has stabilized
C = rated capacity (number of 12 ounce cans)
*Federal Energy Management Program (FEMP); See section 6.2.3.
For more information regarding the ENERGY STAR criteria, visit the ENERGY STAR website
(http://www.energystar.gov/).
17
http://www.ahrinet.org/Content/FindaStandard_218.aspx
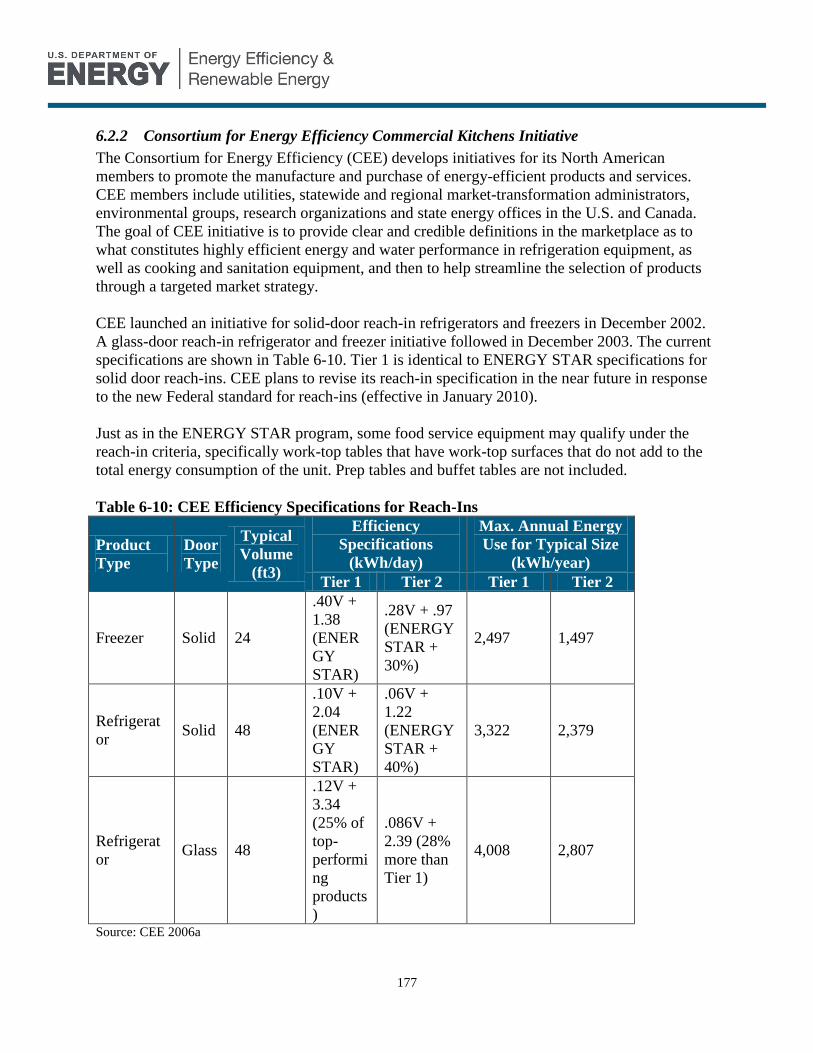
177
6.2.2 Consortium for Energy Efficiency Commercial Kitchens Initiative
The Consortium for Energy Efficiency (CEE) develops initiatives for its North American
members to promote the manufacture and purchase of energy-efficient products and services.
CEE members include utilities, statewide and regional market-transformation administrators,
environmental groups, research organizations and state energy offices in the U.S. and Canada.
The goal of CEE initiative is to provide clear and credible definitions in the marketplace as to
what constitutes highly efficient energy and water performance in refrigeration equipment, as
well as cooking and sanitation equipment, and then to help streamline the selection of products
through a targeted market strategy.
CEE launched an initiative for solid-door reach-in refrigerators and freezers in December 2002.
A glass-door reach-in refrigerator and freezer initiative followed in December 2003. The current
specifications are shown in Table 6-10. Tier 1 is identical to ENERGY STAR specifications for
solid door reach-ins. CEE plans to revise its reach-in specification in the near future in response
to the new Federal standard for reach-ins (effective in January 2010).
Just as in the ENERGY STAR program, some food service equipment may qualify under the
reach-in criteria, specifically work-top tables that have work-top surfaces that do not add to the
total energy consumption of the unit. Prep tables and buffet tables are not included.
Table 6-10: CEE Efficiency Specifications for Reach-Ins
Product
Type
Door
Type
Typical
Volume
(ft3)
Efficiency
Specifications
(kWh/day)
Max. Annual Energy
Use for Typical Size
(kWh/year)
Tier 1 Tier 2 Tier 1 Tier 2
Freezer Solid 24
.40V +
1.38
(ENER
GY
STAR)
.28V + .97
(ENERGY
STAR +
30%)
2,497 1,497
Refrigerat
or Solid 48
.10V +
2.04
(ENER
GY
STAR)
.06V +
1.22
(ENERGY
STAR +
40%)
3,322 2,379
Refrigerat
or Glass 48
.12V +
3.34
(25% of
top-
performi
ng
products
)
.086V +
2.39 (28%
more than
Tier 1)
4,008 2,807
Source: CEE 2006a
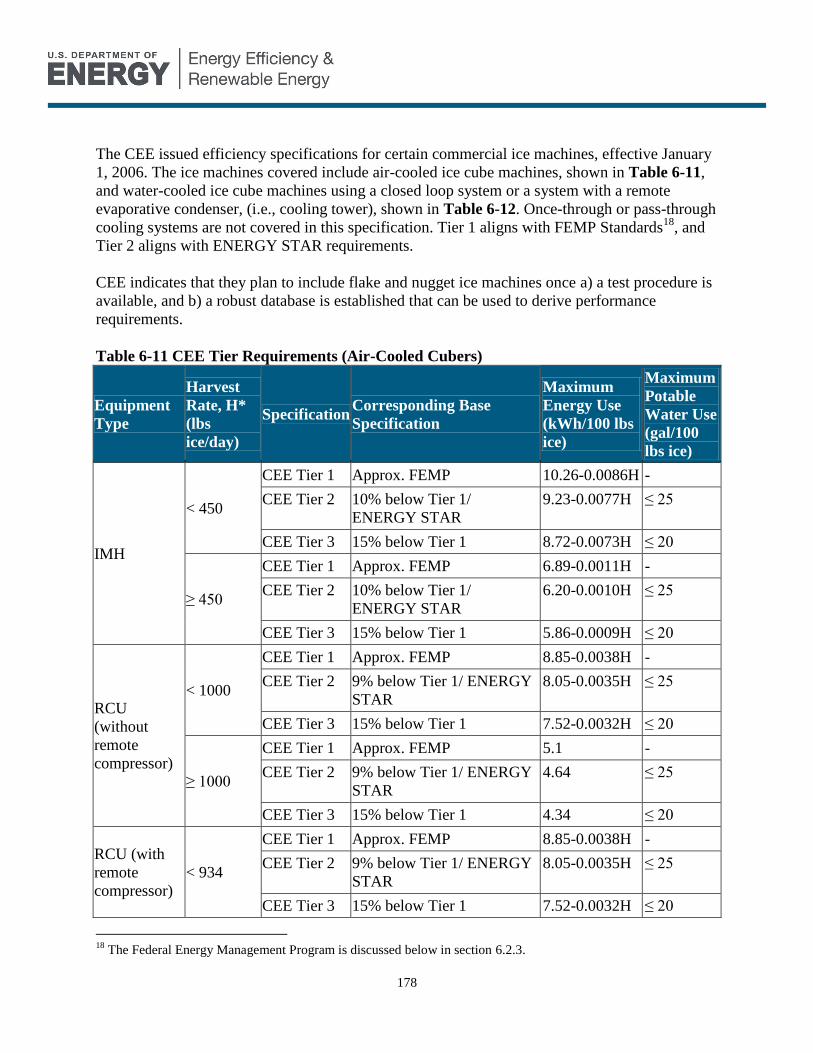
178
The CEE issued efficiency specifications for certain commercial ice machines, effective January
1, 2006. The ice machines covered include air-cooled ice cube machines, shown in Table 6-11,
and water-cooled ice cube machines using a closed loop system or a system with a remote
evaporative condenser, (i.e., cooling tower), shown in Table 6-12. Once-through or pass-through
cooling systems are not covered in this specification. Tier 1 aligns with FEMP Standards18
, and
Tier 2 aligns with ENERGY STAR requirements.
CEE indicates that they plan to include flake and nugget ice machines once a) a test procedure is
available, and b) a robust database is established that can be used to derive performance
requirements.
Table 6-11 CEE Tier Requirements (Air-Cooled Cubers)
Equipment
Type
Harvest
Rate, H*
(lbs
ice/day)
Specification Corresponding Base
Specification
Maximum
Energy Use
(kWh/100 lbs
ice)
Maximum
Potable
Water Use
(gal/100
lbs ice)
IMH
< 450
CEE Tier 1 Approx. FEMP 10.26-0.0086H -
CEE Tier 2 10% below Tier 1/
ENERGY STAR
9.23-0.0077H ≤ 25
CEE Tier 3 15% below Tier 1 8.72-0.0073H ≤ 20
≥ 450
CEE Tier 1 Approx. FEMP 6.89-0.0011H -
CEE Tier 2 10% below Tier 1/
ENERGY STAR
6.20-0.0010H ≤ 25
CEE Tier 3 15% below Tier 1 5.86-0.0009H ≤ 20
RCU
(without
remote
compressor)
< 1000
CEE Tier 1 Approx. FEMP 8.85-0.0038H -
CEE Tier 2 9% below Tier 1/ ENERGY
STAR
8.05-0.0035H ≤ 25
CEE Tier 3 15% below Tier 1 7.52-0.0032H ≤ 20
≥ 1000
CEE Tier 1 Approx. FEMP 5.1 -
CEE Tier 2 9% below Tier 1/ ENERGY
STAR
4.64 ≤ 25
CEE Tier 3 15% below Tier 1 4.34 ≤ 20
RCU (with
remote
compressor)
< 934
CEE Tier 1 Approx. FEMP 8.85-0.0038H -
CEE Tier 2 9% below Tier 1/ ENERGY
STAR
8.05-0.0035H ≤ 25
CEE Tier 3 15% below Tier 1 7.52-0.0032H ≤ 20
18
The Federal Energy Management Program is discussed below in section 6.2.3.
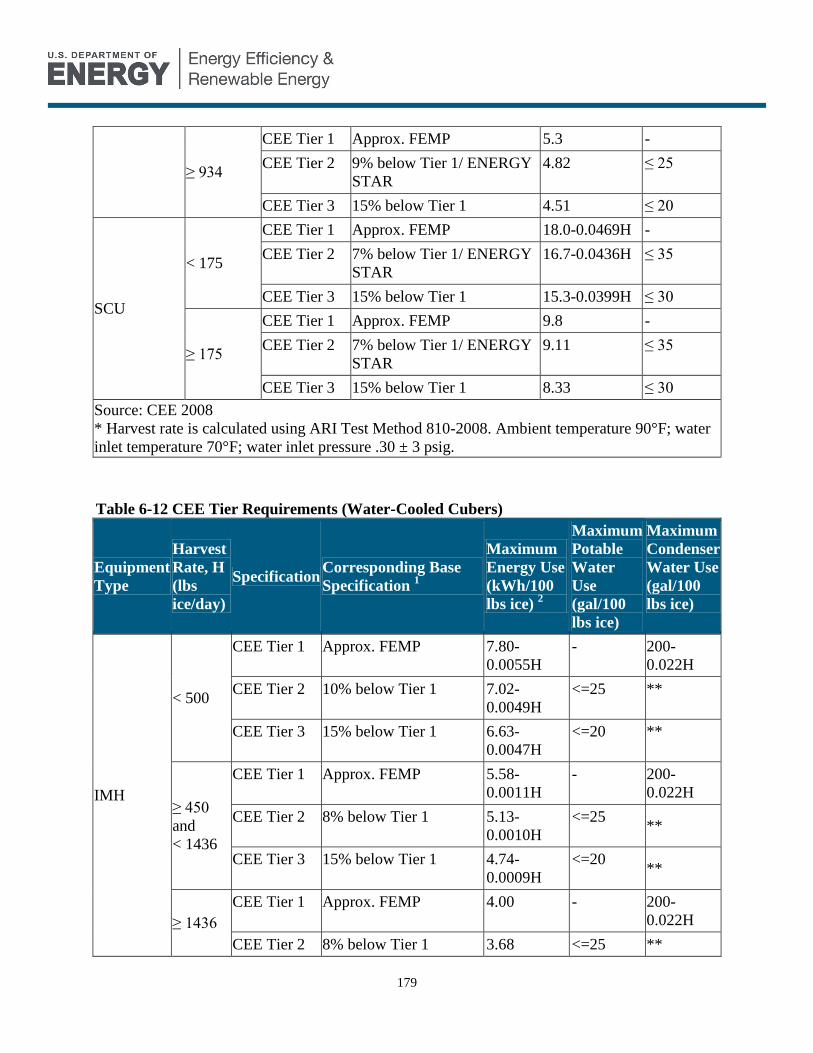
179
≥ 934
CEE Tier 1 Approx. FEMP 5.3 -
CEE Tier 2 9% below Tier 1/ ENERGY
STAR
4.82 ≤ 25
CEE Tier 3 15% below Tier 1 4.51 ≤ 20
SCU
< 175
CEE Tier 1 Approx. FEMP 18.0-0.0469H -
CEE Tier 2 7% below Tier 1/ ENERGY
STAR
16.7-0.0436H ≤ 35
CEE Tier 3 15% below Tier 1 15.3-0.0399H ≤ 30
≥ 175
CEE Tier 1 Approx. FEMP 9.8 -
CEE Tier 2 7% below Tier 1/ ENERGY
STAR
9.11 ≤ 35
CEE Tier 3 15% below Tier 1 8.33 ≤ 30
Source: CEE 2008
* Harvest rate is calculated using ARI Test Method 810-2008. Ambient temperature 90°F; water
inlet temperature 70°F; water inlet pressure .30 ± 3 psig.
Table 6-12 CEE Tier Requirements (Water-Cooled Cubers)
Equipment
Type
Harvest
Rate, H
(lbs
ice/day)
Specification Corresponding Base
Specification 1
Maximum
Energy Use
(kWh/100
lbs ice) 2
Maximum
Potable
Water
Use
(gal/100
lbs ice)
Maximum
Condenser
Water Use
(gal/100
lbs ice)
IMH
< 500
CEE Tier 1 Approx. FEMP 7.80-
0.0055H
- 200-
0.022H
CEE Tier 2 10% below Tier 1 7.02-
0.0049H
<=25 **
CEE Tier 3 15% below Tier 1 6.63-
0.0047H
<=20 **
≥ 450
and
< 1436
CEE Tier 1 Approx. FEMP 5.58-
0.0011H
- 200-
0.022H
CEE Tier 2 8% below Tier 1 5.13-
0.0010H
<=25 **
CEE Tier 3 15% below Tier 1 4.74-
0.0009H
<=20 **
≥ 1436
CEE Tier 1 Approx. FEMP 4.00 - 200-
0.022H
CEE Tier 2 8% below Tier 1 3.68 <=25 **
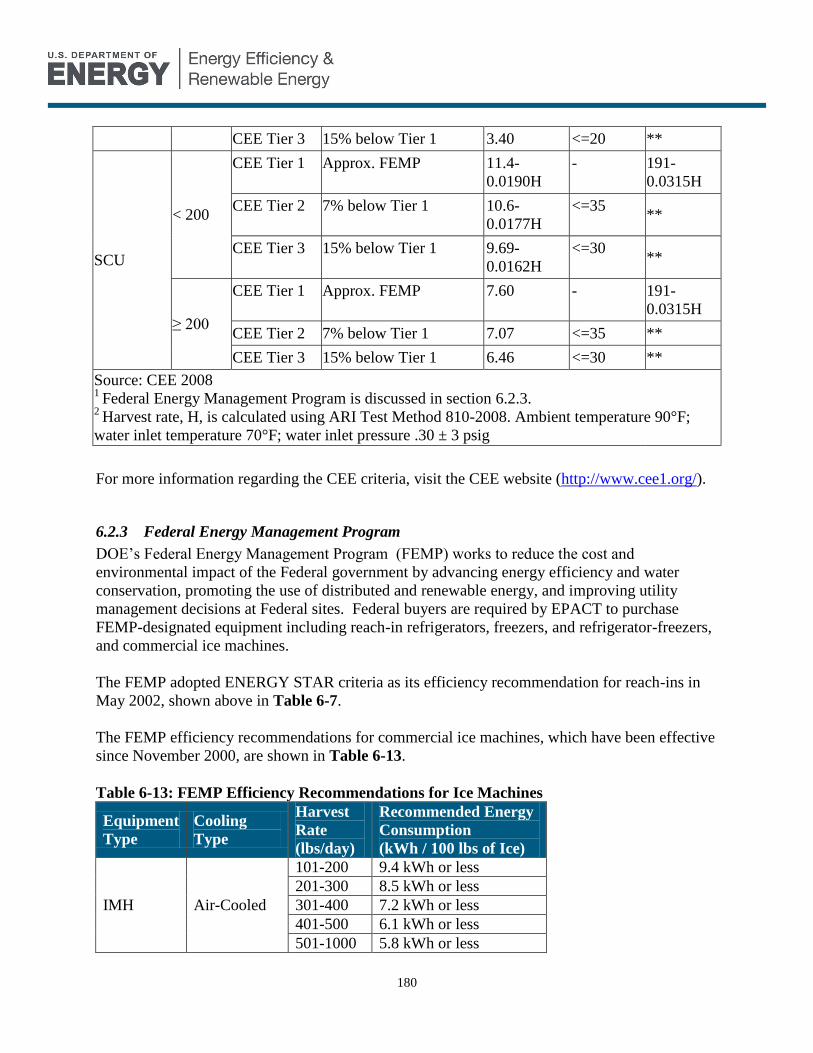
180
CEE Tier 3 15% below Tier 1 3.40 <=20 **
SCU
< 200
CEE Tier 1 Approx. FEMP 11.4-
0.0190H
- 191-
0.0315H
CEE Tier 2 7% below Tier 1 10.6-
0.0177H
<=35 **
CEE Tier 3 15% below Tier 1 9.69-
0.0162H
<=30 **
≥ 200
CEE Tier 1 Approx. FEMP 7.60 - 191-
0.0315H
CEE Tier 2 7% below Tier 1 7.07 <=35 **
CEE Tier 3 15% below Tier 1 6.46 <=30 **
Source: CEE 2008 1
Federal Energy Management Program is discussed in section 6.2.3. 2
Harvest rate, H, is calculated using ARI Test Method 810-2008. Ambient temperature 90°F;
water inlet temperature 70°F; water inlet pressure .30 ± 3 psig
For more information regarding the CEE criteria, visit the CEE website (http://www.cee1.org/).
6.2.3 Federal Energy Management Program
DOE’s Federal Energy Management Program (FEMP) works to reduce the cost and
environmental impact of the Federal government by advancing energy efficiency and water
conservation, promoting the use of distributed and renewable energy, and improving utility
management decisions at Federal sites. Federal buyers are required by EPACT to purchase
FEMP-designated equipment including reach-in refrigerators, freezers, and refrigerator-freezers,
and commercial ice machines.
The FEMP adopted ENERGY STAR criteria as its efficiency recommendation for reach-ins in
May 2002, shown above in Table 6-7.
The FEMP efficiency recommendations for commercial ice machines, which have been effective
since November 2000, are shown in Table 6-13.
Table 6-13: FEMP Efficiency Recommendations for Ice Machines
Equipment
Type
Cooling
Type
Harvest
Rate
(lbs/day)
Recommended Energy
Consumption
(kWh / 100 lbs of Ice)
IMH Air-Cooled
101-200 9.4 kWh or less
201-300 8.5 kWh or less
301-400 7.2 kWh or less
401-500 6.1 kWh or less
501-1000 5.8 kWh or less

181
1001-1500 5.5 kWh or less
Water-
Cooled
201-300 6.7 kWh or less
301-500 5.5 kWh or less
501-1000 4.6 kWh or less
1001-1500 4.3 kWh or less
> 1500 4.0 kWh or less
SCU
Air-Cooled 101-200 10.7 kWh or less
Water-
Cooled 101-200 9.5 kWh or less
RCU Air-Cooled
201-300 7.6 kWh or less
301-400 8.1 kWh or less
401-500 7.0 kWh or less
501-1000 6.2 kWh or less
1001-1500 5.1 kWh or less
> 1500 5.3 kWh or less
Source: FEMP 2000
FEMP adopted ENERGY STAR criteria as its efficiency recommendation for vending machines
in December 2008, shown above in Table 6-9.
For more information regarding FEMP, visit the FEMP website
(http://www1.eere.energy.gov/femp/).

182
7 Recommendations
Implementation of currently available high efficiency technologies could generate substantial
energy savings for users of commercial refrigeration equipment. Our analysis suggests that
energy savings of nearly 35% relative to typical new equipment are possible. Research,
development and demonstration (RD&D) leading to commercialization of advanced technologies
that are not yet in use could produce additional savings. DOE can accelerate the adoption of
existing energy saving technologies in several ways and can also support research and
development of advanced technologies to facilitate commercialization. Approaches to facilitate
market adoption of energy efficient technologies may be categorized as follows:
1) Mandatory Efficiency Standards: Mandatory minimum efficiency standards for many
appliances and equipment including commercial refrigeration systems are developed by the
DOE and are applicable nationwide. For products not covered by federal standards, some
states, most notably California through Title 20 regulations, develop standards that are only
applicable within their states
2) Voluntary Efficiency Programs: These include programs such as the Energy Star program
managed by DOE and EPA, as well as programs run by energy efficiency advocacy
organizations such as the Consortium for Energy Efficiency (CEE).
3) Demonstration Programs: These programs demonstrate the benefits, risks, and costs of
emerging technologies, usually in a field setting where real world conditions can be used to
rigorously evaluate the technology. The DOE supports such activities through its
Technology Validation and Market Introduction (TVMI) Program and can also facilitate
large volume group purchases to reduce the purchase price of low volume products. Utilities
also support demonstrations of emerging technologies.
4) Education, Outreach, and Training: Examples include programs to train installation
contractors to ensure quality installations, or educating engineers about the benefits of
emerging technologies. DOE has supported such activities directly and through industry
organizations and trade associations, as have other energy efficiency advocacy groups and
utilities.
5) Research and Development: The DOE has historically played a leading role in sponsoring
R&D of new energy efficient technologies for many types of building equipment, including
commercial refrigeration systems. DOE funding ensures support for high risk, long term
R&D which is unlikely to be funded by the private sector. The DOE can also support R&D
that can help overcome institutional barriers to new technologies. For example, the DOE
played a leading role in funding pre-competitive research on alternatives to CFC and HCFC
refrigerants and could also support research on next generation non-fluorocarbon
refrigerants.
7.1 Mandatory Minimum Efficiency Standards
DOE should develop energy test procedures and energy efficiency standards for those types of
commercial refrigeration equipment that are not currently covered, including compressor racks,

183
supermarket condensers, and food service equipment. Additionally, for all established standards,
DOE should continually reassess their suitability in light of technological advancements which
may significantly affect the cost-effectiveness of higher efficiency standards.
Test procedures should also be examined and updated to ensure that they do not inhibit the
application of energy saving technologies by not crediting the energy savings attributable to
those technologies. For example, test procedures for vending machines and beverage
merchandisers are steady state tests which do not account for savings that could be achieved
using energy management systems that reduce lighting and compressor energy consumption
during periods of low activity. Consequently, the test procedure and standards discourage
adoption of these technologies, which can be highly cost effective and substantially reduce
energy consumption. Manufacturers may instead choose design options which may be less
efficient and less cost-effective in order to meet the energy efficiency standards. Similarly,
because energy consumption tests for self-contained refrigerators such as reach-ins are single
rating point tests, they discourage adoption of technologies such as variable speed compressors
which save energy over a wide operating range but may not be more efficient at the rating point.
This issue is addressed in residential unitary air conditioners by rating equipment based on
performance at multiple conditions (defined by the Seasonal Energy Efficiency Ratio or SEER)
rather than a single rating point. A similar approach could be used for refrigeration.
7.2 Voluntary Programs
There are a number of currently available technologies, discussed in section 4, that are used in
some commercial refrigeration equipment today or could be implemented with modest effort.
However, they still face significant barriers to widespread adoption. Awareness programs,
technology validation, analysis and design tools, and utility incentives can significantly enhance
the adoption of these high-efficiency technologies.
7.2.1 Expand ENERGY STAR Program
The DOE/EPA ENERGY STAR program has proven to be very effective in raising awareness of
energy efficiency for covered products and is a widely recognized brand among consumers. This
brand recognition can be leveraged by manufacturers to credibly demonstrate the benefits of
energy efficient products to customers who may be unaware of energy efficient options. DOE
should consider expanding this program to cover supermarket refrigeration systems, walk-ins,
and refrigerated food service equipment.
7.2.2 Expand Consortium for Energy Efficiency (CEE) Programs
CEE, a public benefits corporation, develops initiatives for its utility members to promote the
purchase of energy efficient equipment. CEE specifications are used by many utilities as the

184
basis for their incentive programs. CEE initiatives cover some commercial refrigeration
equipment such as ice machines and self-contained refrigerators and freezers. Expanding the
program to cover supermarket refrigeration systems and walk-in coolers and freezers would help
spur adoption of high efficiency options for these products. The DOE could work with CEE to
support establishment of such programs.
7.2.3 Leverage Technology Validation and Market Introduction and Retailer Energy
Alliance Programs
The DOE Building Technologies TVMI program can help increase the acceptance of energy
efficient commercial refrigeration technologies through field demonstrations to document costs
and benefits of energy efficient equipment. Customers are often skeptical of energy savings
claims made by manufacturers. Rigorous, independent field evaluations sponsored by the DOE
can help allay concerns about the objectivity and validity of energy savings claims. Such field
evaluations can also serve as a basis for utility incentive programs to promote energy efficient
technologies. Case studies also educate customers and build awareness of energy efficient
options. The Retailer Energy Alliance (REA) can also facilitate large volume group purchases to
reduce the purchase price of such options. Table 7-1 shows some technology options that could
benefit from further technology validation or group purchases.
Table 7-1: Key Technology Options for Technology Validation and Market Introduction
Improvement Targeted Applications Technology Options
Improved Case
Lighting Efficiency Supermarket display
cases
High-efficiency fluorescent
or LED lighting
Placement of lamps and
ballasts outside of
refrigerated cabinet
Energy
Management
Systems
Beverage
merchandisers
Refrigerated vending
machines
Proximity sensors and
energy management systems
Reduced Cabinet
Thermal Losses Supermarket display
cases
Beverage
merchandisers
Refrigerated vending
machines
Reach-ins
Walk-ins
Reducing thermal short
circuits
Glass doors with double or
triple glazing using inert gas
fill
Improved insulation
Reduced Cabinet
Heat Generation Supermarket display
cases
Beverage
merchandisers
Hot-gas defrost
Hot-gas anti-sweat heaters
On-demand defrost
On-demand anti-sweat

185
Refrigerated vending
machines
Reach-ins
Walk-ins
heaters
High-efficiency evaporator
fan motors
Advanced
compressors Supermarket
Refrigeration
Systems
Walk-ins
Reach-ins
Vending Machines
Modulating compressors
Vapor injection economizer
Improved System
Control s Supermarket
refrigeration systems
Electronic expansion valves
and case controllers
7.2.4 Modeling & Design Tools for Manufacturers
More accurate modeling tools are needed for manufacturers to optimize designs and maximize
the benefits of high efficiency technologies both in self-contained equipment and in large split-
systems. DOE could sponsor development of more advanced software for refrigeration system
design. There is also a need for published literature on the up-to-date best practices for
refrigeration system design and field implementation that could be used by manufacturers,
system designers, and operators.
7.3 Support Research and Development of Advanced Technologies
Continued R&D support by DOE is essential to ensuring that advanced energy efficient
technologies and new innovations are developed and implemented in future commercial
refrigeration systems. Chapter 5 describes selected energy savings technologies currently under
development. The technologies span the range of development status from small scale
technology demonstrations to full scale prototypes and products. They cover a range of solutions,
including several alternatives to conventional air-to-air vapor-compression refrigeration cycles.
Other technologies such as fiber optic lighting and vacuum insulated panels aim to address
potential energy savings from components such as lighting and compressors, and cabinets.
In Figure 7-1, we depict the technology and market maturity as well as the technical savings
potential for each of the presented technologies. The precise position of each technology is
uncertain and not critical to our overall recommendations. We recommend focusing attention
and funding on technologies with high technology potential (on the right side of the graph).
Technologies whose vertical position is in the central or lower region of the graph may be most
worthy of DOE R&D support. For these technologies, significant technical barriers still exist,
and further research is needed to overcome them. Those technologies in the upper region may be
more suitable for demonstration and validation. For those more mature technologies, the
technical barriers are lower but other obstacles such as high prices, low reliability, and some
technical uncertainties need to be overcome.
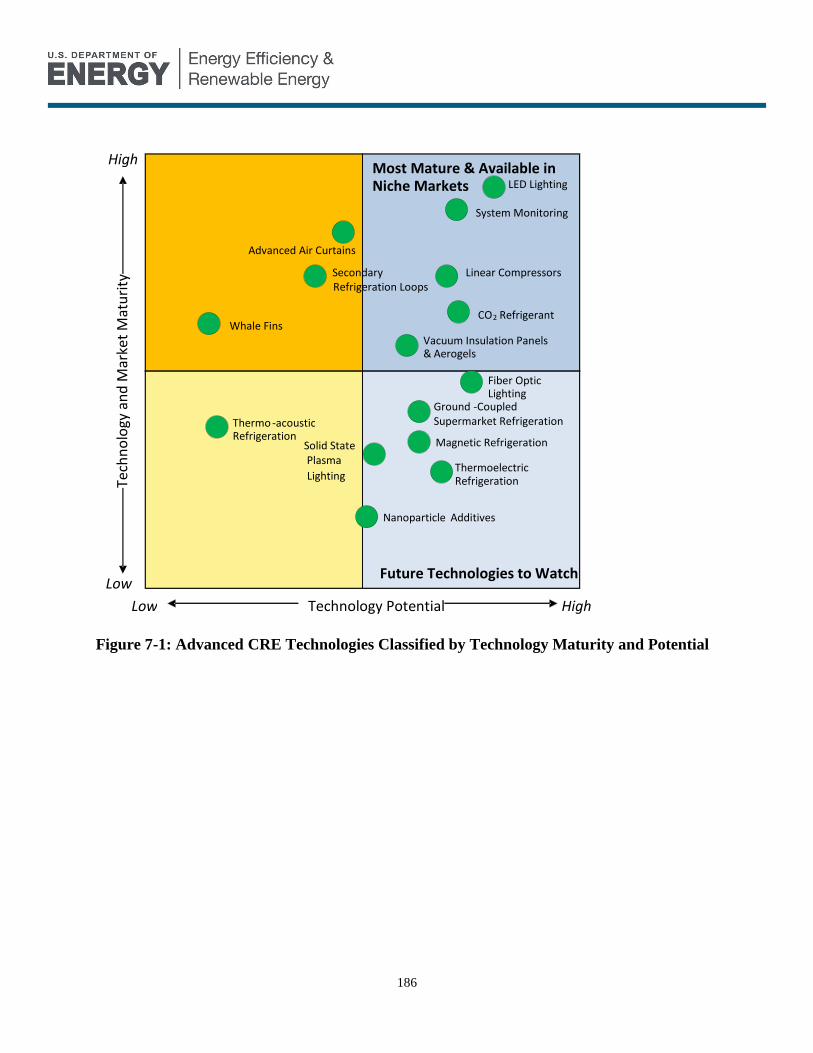
186
Figure 7-1: Advanced CRE Technologies Classified by Technology Maturity and Potential
Technology Potential Low High
Low
High
Advanced Air Curtains
Vacuum Insulation Panels & Aerogels
System Monitoring
CO 2 Refrigerant Whale Fins
Magnetic Refrigeration
Nanoparticle Additives
Ground -Coupled Supermarket Refrigeration Thermo - acoustic
Refrigeration
Thermoelectric Refrigeration
Solid State Plasma Lighting
Fiber Optic Lighting
Most Mature & Available in Niche Markets
Future Technologies to Watch
LED Lighting
Tech
no
logy
an
d M
arke
t M
atu
rity
Secondary Refrigeration Loops
Linear Compressors

187
References
ACR News 2008. “Nanotechnology Could Boost Chiller Efficiency”, ACR News, September
2008.
ADL 1996. “Energy Potential Report for Commercial Refrigeration Equipment”, Final Report,
prepared by Arthur D. Little, Inc. for U.S. Department of Energy, Office of Building
Technologies, June 1996.
Al-Dadah, 1992. R. K. Al-Dadah, T. G. Karayiannis, R. W. James and P. H. G. Allen, “EHD
enhanced heat transfer: effect on the performance of a refrigeration system”, Inst. Chem. Engrs
Symp, Series 2, 1229-1236 (1992).
Appliance Magazine 2005. The Share-of-Market Picture for 2004, Appliance Magazine,
September 2005. (Refrigerated display cases)
Appliance Magazine 2007. 54th
Annual Report: Statistical Review 1998-2006, Appliance
Magazine, May 2007. (Ice machines)
Appliance Magazine 2008. 55th
Annual Report: Statistical Review 1998-2007, Appliance
Magazine, May 2008. (Reach-ins)
AHRI 2007. ARI 810-2007: Performance Rating of Automatic Commercial Ice Makers, Air-
Conditioning, Heating, and Refrigeration Institute, 2007.
http://www.ahrinet.org/ARI/util/showdoc.aspx?doc=455
AHRI 2008. Directory of Certified Product Performance, Air-Conditioning, Heating, and
Refrigeration Institute, 2008. http://www.ahridirectory.org/ahridirectory/pages/home.aspx
Antonijevic 2008. D.L Antonijevic. “Carbon Dioxide as the Replacement for Synthetic
Refrigerants in Mobile Air Conditioning”, Thermal Science, 12, 55-65 (2008).
ASAP 2009. Energy Efficiency Standards Adopted and Pending by State. Appliance Standards
Awareness Project and Northeast Energy Efficiency Partnerships, January 2009.
http://www.standardsasap.org/documents/StatestandardsstatusgridJanuary2009update.pdf
ASHRAE 2007. “Magnetic Refrigeration”, Dieckmann, John, Dr. Roth, Kurt, and Brodrick,
James, ASHRAE Journal. August, 2007.
Automatic Merchandiser 2007. Automatic Merchandiser Magazine, August 2007.
http://www.amonline.com/
Bally 2008. Personal communication with Guy Senter, Bally Refrigerated Boxes, April 14, 2008.
188
Bell 2008. Lon E. Bell et al. “Cooling, Heating, Generating Power, and Recovering Waste Heat
with Thermoelectric Systems”. Science, 321, 1457 (2008).
Beverage-Air 2008a. Personal communication with Jeff Hogston, Beverage-Air, July 2008.
Beverage-Air 2008b. Catalog, Beverage-Air Corporation, 2008. http://www.beverage-
air.com/foodservice.html
Bohn 2007. Air-Cooled Condensers Technical Guide for MonarchTM
and AmbassadorTM
Series
(page 17). Heatcraft Refrigeration Products, LLC. February 2007.
Brown 2002. J.S. Brown, Y. Kim, and P.A. Domanski. “Evaluation of Carbon Dioxide as R-22
Substitute for Residential Air-Conditioning”, ASHRAE Transactions, Vol. 108, No. 2, 954-964
(2002).
Bruk 2003. “Magnetic Refrigeration at Room-Temperature”, Bruk, E., Encyclopedia of
Materials: Science and Technology, Published by Elsevier Science Ltd, 2003.
Caroll Coolers 2008. Personal Communication with David Teske, Caroll Coolers, April 25,
2008.
CBECS 2003. Commercial Buildings Energy Consumption Survey 2003, Energy Information
Administration, released September 2008. http://www.eia.doe.gov/emeu/cbecs/contents.html
Chen 2003. Chen, G., Dresselhaus, M. S., Dresselhaus, G., Fleurial, J. P. & Caillat, T. “Recent
developments in thermoelectric materials”. Int. Mater. Rev. 48, 45–66 (2003).
CEC 2004. “Investigation of Secondary Refrigeration Loop Supermarket Refrigeration
Systems”, California Energy Commission, March 2004.
CEC 2008, 2009. Appliances Database, California Energy Commission, March 2008 (Food
Service Equipment, Ice Machines), May 2008 (Reach-ins), May 2009 (Refrigerated Vending
Machines). http://www.energy.ca.gov/appliances/database/
CEC 2007. 2007 Appliance Efficiency Regulations, California Energy Commission, December
2007. http://www.energy.ca.gov/appliances/index.html
CEE 2006a. High Efficiency Specifications for Solid Door Refrigerators and Freezers and Glass
Door Refrigerators, Consortium for Energy Efficiency, January 2006.
http://www.cee1.org/com/com-kit/files/RefrigerationSpecificationFINAL20080617.pdf
CEE 2006b. High Efficiency Specifications for Ice Machines, Consortium for Energy Efficiency,
January 2006. http://www.cee1.org/com/com-
kit/files/Ice%20MakersSpecificationFINAL20080620.pdf
189
CSG 2008. Personal communication with Joe Bina of Chain Store Guide (CSGIS), May 16,
2008.
Craig Industries 2008. Personal communication with Ellis Craig, Craig Industries, May 16, 2008.
CrownTonka 2008. Personal communication with Mike Kahler, CrownTonka, April 28, 2008.
Dieckmann 2007. Dieckmann, John, Dr. Roth, Kurt, and Brodrick, James. “Magnetic
Refrigeration”. ASHRAE Journal. August, 2007.
DoC 2007. Current Industrial Report, U.S. Department of Commerce, July 2007.
DOE 2000. “Electrocaloric Refrigeration for Room Temperature Refrigeration”, EERE:
Inventions and Innovation, Department of Energy, November 2000.
DOE 2006. 2004 Commercial Energy End-Use Splits, Buildings Energy Data Book, Office of
Energy Efficiency and Renewable Energy, U.S. Department of Energy, September 2006.
http://buildingsdatabook.eere.energy.gov/ChapterView.aspx?chap=3#1
DOE 2008a. 2006 Commercial Energy End-Use Splits, Buildings Energy Data Book, Office of
Energy Efficiency and Renewable Energy, U.S. Department of Energy, September 2008.
http://buildingsdatabook.eere.energy.gov/ChapterView.aspx?chap=3#1
DOE 2008b. Energy Conservation Standards for Beverage Vending Machines: ANOPR
Technical Support Document, U.S. Department of Energy, June 2008.
http://www1.eere.energy.gov/buildings/appliance_standards/commercial/beverage_machines_an
opr_spreadsheets.html
DOE 2009a. Energy Conservation Standards for Commercial Refrigeration Equipment:
Technical Support Document, U.S. Department of Energy, January 2009,
http://www1.eere.energy.gov/buildings/appliance_standards/commercial/refrig_equip_final_rule.
html
DOE 2009b. Energy Conservation Standards for Commercial and Industrial Equipment:
Commercial Refrigeration Equipment, 10 CFR Part 431, Department of Energy, January 2009.
http://www1.eere.energy.gov/buildings/appliance_standards/commercial/refrig_equip_final_rule.
html
DOE 1997. Technical Support Document for Energy Conservation Standards for Room Air
Conditioners, U.S. Department of Energy, September 1997.
Dresselhaus 2007. Dresselhaus, M. S. et al. “New directions for low-dimensional thermoelectric
materials”. Adv. Mater.19, 1043–1053 (2007).
190
Eames 1997. Eames, I. W., and Sabir, H. M. Potential benefits of electrohydrodynamic
enhancement of two-phase heat transfer in the design of refrigeration systems”. Applied Thermal
Engineering. 17, 79-92 (1997).
EIA 2008. “Technology Forecast Updates – Residential and Commercial Building Technologies
‐ Reference Case”, Energy Information Administration, September 2008.
EIA 2009. “Average Retail Price of Electricity to Ultimate Customers by End-Use Sector, by
State, Year-to-Date through December 2008”, Table 5.6.B, Electric Power Monthly, March 2009
http://www.eia.doe.gov/cneaf/electricity/epm/epm_sum.html.
Elstat 2008. Personal communication with Crystal Burdette, Elstat Electronics, Ltd., June 12,
2009. http://www.elstatgroup.com/company/energy.aspx.
Emerson 2009. Personal communication with Hung Pham, Emerson Climate Technologies,
Emerson Electric Company, May-June 2009.
ENERGY STAR 2001. ENERGY STAR Program Requirements for Commercial Solid Door
Refrigerators and Freezers, Environmental Protection Agency & Department of Energy,
September 2001.
http://www.energystar.gov/index.cfm?fuseaction=products_for_partners.showRefrigComm
ENERGY STAR 2008. ENERGY STAR Program Requirements for Commercial Ice Machines,
Environmental Protection Agency & Dept of Energy, January 2008.
http://www.energystar.gov/index.cfm?fuseaction=products_for_partners.showIceMachinesCom
m
ENERGY STAR 2009. Commercial Ice Machines Qualified Model List, Environmental
Protection Agency & Dept of Energy, March 2009.
http://www.energystar.gov/index.cfm?c=comm_ice_machines.pr_comm_ice_machines
EPA 2007. Supermarket Energy Use Profile, Environmental Protection Agency, 2007.
EPACT 2005. Energy Policy Act of 2005, Section 136(c), July 2005.
FEMP 2000. How to Buy an Energy-Efficient Commercial Ice-Cube Machine, Federal Energy
Management Program, November 2000.
http://www1.eere.energy.gov/femp/procurement/eep_ice_makers.html#efficiency
FEMP 2002. How to Buy Energy-Efficient Commercial Refrigerators and Freezers, Federal
Energy Management Program, May 2002.
http://www1.eere.energy.gov/femp/procurement/eep_crf.html

191
FEMP 2008. How to Buy Energy-Efficient Refrigerated Beverage Vending Machines, Federal
Energy Management Program, December 2008.
http://www1.eere.energy.gov/femp/procurement/eep_beverage_vending_machine.html
Fisher-Nickel 2003. Zabrowski, D., and Cowen, D., “Refrigerated Prep Table Performance
Testing”. Food Service Technology Center, Fisher-Nickel, Inc., 2003.
FMI 2007. Facts and Figures: Top Food Retailers, Food Marketing Institute, April 2007.
http://www.fmi.org/docs/facts_figs/top_retailers.pdf
FMI 2008a. Marketing Costs, Food Marketing Institute, August 2008.
http://www.fmi.org/docs/facts_figs/MarketingCosts.pdf
FMI 2008b. Industry Overview 2008, Food Marketing Institute, accessed May 2009.
http://www.fmi.org/facts_figs/?fuseaction=superfact
Foster Miller 1990. “Guide for the Selection of Supermarket Refrigeration Systems”, Walker, D.,
Tsaros, T., and Deming, G., Foster-Miller, Inc. for EPRI, March 1990.
Freedonia 2004. Energy Savings in Refrigerated Walk-in Boxes, DOE/EE-0170, 2004.
FRPERC 2003. James, Stephen J. "Developments in domestic refrigeration and consumer
attitudes," Food Refrigeration and Process Engineering Research Centre (FRPERC), 2003.
University of Bristol, UK. Bulletin of the IIR - No 2003-5. http://www.iifiir.org/en/doc/1051.pdf
Glacier Bay 2009a. Barrier Ultra-Rtm High-Performance Insulation, Glacier Bay, Inc, accessed
January 2009. http://www.glacierbay.com/ultra-r.asp
Glacier Bay 2009b. “Vacuum Insulation Panels (VIPs) Principles, Performance and Lifespan”.
Glacier Bay, Inc., accessed January 2009. http://www.glacierbay.com/vacpanelinfo.asp
Gschneidner 2005. K.A. Gschneidner Jr., V.K. Pecharsky, and A.O. Tsokol “Recent
developments in magnetocaloric materials”, Rep. Prog. Phys. 68 (2005) 1479–1539.
Gschneidner 2008. K.A. Gschneidner, Jr.*, V.K. Pecharsky. “Thirty years of near room
temperature magnetic cooling: Where we are today and future prospects.” International Journal
of Refrigeration. September, 2008.
GSET Research Journal 2006. “Thermoacoustic Refrigeration”, Newman, J., Cariste, B.,
Queiruga, A., GSET Research Journal, 2006
Hamilton 2008. Hamilton, T. “Whale of an Idea Has Lots of Fans”, Toronto Star, March 3, 2008.
http://www.thestar.com/Business/CleanBreak/article/308728
192
Heinecke 2006. “Single-phase Electric Motors”, Heinecke, K. LEESON Electric Corporation,
November 2006. http://www.iprocessmart.com/leeson/leeson_singlephase_article.htm
Hirano 2003. Hirano, N. 2003 Paper No K7.002, Am. Phys. Soc. Meeting, March 4, 2003,Austin,
TX.
ICOPT 1997. “Tests of Supermarket Display Cases when Operating with Secondary
Refrigerants”, International Conference on Ozone Protection Technologies, Baltimore MD,
November 1997.
IEA 2003. IEA Annex 26: Advanced Supermarket Refrigeration/Heat Recovery Systems, Final
Report Volume 1 – Executive Summary. Compiled by Van D. Baxter, Oak Ridge National
Laboratory, April 2003.
International Journal of Refrigeration 2008a. “Thirty Years of Near Room Temperature
Magnetic Cooling: Where we are today and future prospects”, Gschneidner, Jr, K.A., Pecharsky,
V.K., International Journal of Refrigeration, September, 2008.
International Journal of Refrigeration 2008b. “Experimental and Numerical Study on
Microchannel and Round-Tube Condensers in a R410A Residential Air-Conditioning System”,
International Journal of Refrigeration, August 2008.
Kedzierski 2007. M.A. Kedzierski and M. Gong, “Effect of CuO Nanolubricant on R134a Pool
Boiling Heat Transfer with Extensive Measurement and Analysis Details”, NISTIR 7454,
September 2007.
Krack 2009. 2009 Commercial Price List. Krack Corporation, Ingersoll Rand Climate Control
Technologies. 2009.
Kyoto Protocol 1997. The Kyoto Protocol to the United Nations Framework Convention on
Climate Change, 1997.
Lazzarin 2008. Lazzarin, R., Nardotto, D., and Noro, M. “Energy savings and economic benefits
of using electronic expansion valves in supermarket display cabinets”. International Journal of
Low Carbon Technologies, Volume 3, Number 3, July 2008.
LIFI 2009. ”Frequently Asked Questions for General Lighting”, Luxim Corporation, accessed
January 2009. http://www.lifi.com/dynamic/display.php/31
Nadel, S. 2002. “Packaged commercial refrigeration equipment: A briefing report for program
planners and implementers”, Report Number A022, American Council for an Energy-Efficient
Economy, Washington, D.C.

193
Nadel 2004. “Increasing Appliance Energy Savings by Looking Beyond the Current Energy
Star”, American Council for an Energy-Efficient Economy, Energy Star Appliance Partner
Meeting, 2004.
Nadel, S. 2006. “Leading the Way: Continued Opportunities for New State Appliance and
Equipment Efficiency Standards”, Nadel, S., deLaski, A., Eldrige, M., Kleish, J., ASAP-
6/ACEEE-A062, March 2006. http://www.standardsasap.org/documents/a062.pdf
Neese 2008. Bret Neese, Baojin Chu, Sheng-Guo Lu, Yong Wang, E. Furman, and Q. M. Zhang,
“Large Electrocaloric Effect in Ferroelectric Polymers Near Room Temperature”, Science.
August 2008.
Nekså . P. Nekså, J. Pettersen, and G. Skaugen. “CO2 Refrigeration, Air Conditioning and Heat
Pump Technology”.
Newman 2006. Newman, J., Cariste, R., Queiruga, A. “Thermoacoustic Refrigeration”. GSET
Research Journal. 2006.
ORNL 1997. “Energy and Global Warming Impacts of HFC Refrigerants and Emerging
Technologies”, Oak Ridge National Laboratory, sponsored by Alternative Fluorocarbons
Environmental Acceptability Study (AFEAS), U.S. Department of Energy, 1997.
ORNL 2008. D. H. Walker, R. T. Faramarzi, H. Navaz, and D. Dabiri “Air Curtain Stability and
Effectiveness in Open Vertical Refrigerated Display Cases: Project Final Report”, December
2008, US Department of Energy.
PepsiCo 2008. Personal Communication with PepsiCo, May 2008.
Patel-Predd 2008. Prachi Patel-Predd. “A Plastic that Chills”, Technology Review, August 2008
Pearson . S. Forbes Pearson. “Refrigerants Past, Present and Future”, International Institute of
Refrigeration.
PG&E 2004. “Analysis of Standards Options for Walk-in Coolers (Refrigerators) and Freezers”,
Codes and Standards Enhancement Initiative For PY2004: Title 20 Standards Development,
prepared for Pacific Gas and Electric Company, Davis Energy Group, May 2004.
PNL 2008. Heat Exchanger Development, Pacific Northwest National Laboratory, December
2002. http://www.pnl.gov/microcats/aboutus/capabilities/heatexchdev.html
Progressive Grocer 2008. Annual Report of the Grocery Industry, Progressive Grocer, April
2008.
Provenzano 2004. V. Provenzano, A. J. Shapiro, and R.D. Shull. “Reduction of hysteresis losses
in the magnetic refrigerant Gd5Ge2Si2 by the addition of iron”, Nature, 429, 853 (2004).
194
PSU 2009. “Frequently Asked Questions about Thermoacoustics”, Penn State University
Thermoacoustics Department, January 2009.
http://www.acs.psu.edu/thermoacoustics/refrigeration/faqs.htm#2
Raghavan 2002. Ramesh Raghavan and Nadarajah Narendran, “Refrigerated Display Case
Lighting with LEDs”, Lighting Research Center (2002)
Rossing 2007. “Springer Handbook of Acoustics”, Thomass D. Rossing, Springer 2007
RPI 2002. “Refrigerated Display Case Lighting with LEDs”, Raghavan, R. and Narendran, N.,
Lighting Research Center, Rensselaer Polytechnic Institute, 2002.
SCE 2006. Scott Mitchell, Henry Lau, and Ramin Faramarzi, “Fiber Optic Lighting in Low
Temperature Refrigerated Display Cases”, Southern California Edison, 2006.
SCE 2009. “T-8s, LED and Fiber Optic Lighting Compared”, Refrigeration & Thermal Test
Center, Southern California Edison, accessed February 2009. http://www.sce.com/b-sb/design-
services/RTTC/ResearchProjects/supermarket/t8_led_fiberoptic.htm
Science 2008. “Large Electrocaloric Effect in Ferroelectric Polymers Near Room Temperature”,
Neese, B., Chu, B., Lu, S., Wang, Y., Furman, E., and Zhang, Q., Science, August 2008.
Scotsman 2008. Personal Conversation with Scotsman, April 2008.
Shaws 2002. “Shaw’s Supermarkets: A Comprehensive Environmental Commitment”, Clean
Air-Cool Planet, June 2002.
Snyder 2008. G.J. Snyder, and E.S. Toberer, “Complex Thermoelectric Materials”, Nature
Materials, 7, 105 (2008).
Sunpower 1999. Unger, R. “Development and Testing of a Linear Compressor Sized for the
European Market,” Proceedings of the International Appliance Technology Conference, May,
1999. Sunpower, Inc., Athens, OH.
http://www.sunpower.com/lib/sitefiles/pdf/publications/Doc0074.pdf
Sustainable Business 2008. “GE Submits Hydrocarbon Refrigerant for EPA Approval”,
SustainableBusiness.com, October 2008.
Technology Review 2008. “A Plastic that Chills”, Patel-Predd P., Technology Review, August
2008.
Tecumseh 2008. Compressor Data, Tecumseh Compressor Company, accessed May 2008.
http://202.56.127.90/nacg/pro_comp.html

195
TIAX 2005. Zogg, R., and Roth, K. “Assessment of Combined Heat and Power in Supermarket
Applications”, Final Report, prepared by TIAX, LLC for U.S. Department of Energy, Distributed
Energy Program, November 2005.
Topping 2004. Dick Topping, “Carbon Dioxide Refrigerant Makes a Comeback”, Refrigerant
Magazine, September 2004.
True Manufacturing 2008. Product Literature, Accessed May 2008.
http://www.truemfg.com/catalog/servlet/com.apsiva.servlet.HomeServlet
U.S. Census 2008. “Estimates of the Resident Population by Selected Age Groups for the United
States”, U.S. Census, July 1, 2008. http://www.census.gov/popest/states/asrh/SC-EST2008-
01.html
Vending Times 2007. Census of the Industry, Vending Times, 2007.
Vending Times 2008a. Census of the Industry, Vending Times, 2008.
Vending Times 2008b. Personal communication between Matthew Millard of NCI and Vending
Times on April 22, 2008.
WSJ 2008. “Chew This Over: Munchable Ice Sells Like Hotcakes”, Brat, I., Wall Street Journal,
January 30, 2008.
Zimm 1998. Zimm C, Jastrab A, Sternberg A, Pecharsky V K, Gschneidner K Jr, Osborne M and
Anderson I, Adv. Cryog. Eng, 43 (1998), 1759.
Zimm 2003. Zimm, C. 2003 Paper No K7.003, Am. Phys. Soc. Meeting, March 4, 2003, Austin,
TX.

196
Image References
AWRCO 2008. http://www.awrco.com/
Beverage-Air 2008. http://www.beverage-air.com/
Delfield 2008.
http://www.delfield.com/?xhtml=xhtml/del/us/en/general/productcatalog.html&xsl=productcatal
og.xsl&category=0151
Dixie-Narco 2008. http://www.dixienarco.com/comSite/
Electrolux 2008.
http://tools.professional.electrolux.com/Mirror/Doc/MAD/ELECTROLUX/English/FAC010.pdf
Food Service Warehouse 2008.
http://www.foodservicewarehouse.com/img/cat/qg_iceNugget.jpg
Hoshizaki America 2008. http://www.hoshizakiamerica.com/flaker.asp
Hussman 2008. http://www.hussmann.com/Supermarkets/Pages/Supermarket.aspx
Ice-O-Matic 2008.
http://www.iceomatic.com/nafemproducts.asp?poc=ice&category=0142&article=ICE_1405_Mo
dular_Cube_ICE_Maker.xml
McCall 2008. McCall Refrigeration,
http://www.4mccall.com/Store/OnlineCatalog.asp#ss_photos
Nor-Lake 2008. http://www.norlake.com/
Sanden Vendo 2008. http://www.vendoco.com/index.php
Traulsen 2008. http://www.traulsen.com/products/refrigeration/refrigeration_refrigerators-
freezers/refrigerators-freezers_dual-temps
Tyler 2008. http://www.tylerrefrigeration.com/
Zero Zone 2009. http://www.zero-zone.com/default.asp (from Emerson Climate Technologies
PowerPoint called, “High Efficiency Scroll for Walk-in Refrigeration”)

197
Appendix A Explanation of Markups and Inflation Factors
In this analysis, we report on various costs associated with CRE including the total installed cost
for the baseline equipment and the end-user cost premium for the high efficiency technology
options. This appendix discusses the markups and inflation rates we assumed when calculating
such prices.
Markups
We assumed three markups throughout the report, based on the information in the DOE CRE
Rulemaking Final Rule (DOE 2009a). Figure A-1 shows the relationships between the various
cost types and the markups used in this report.
Source: DOE 2009a
Figure A-0-1: Markup Relationships
The manufacturer markup of 1.32 is used to convert manufacturer production cost (MPC) to
manufacturer selling price (MSP).
The dealer markup includes both the markup applied by the dealer and a weighted average sales
tax multiplier to convert MSP to purchase price. The dealer markup differs for remote-
condensing (RC) and self-contained (SC) equipment because of the differing breakdowns by
distribution channel as shown in Figure A-2. In the first distribution channel, the manufacturer
sells the equipment directly to the customer through a national account. In the second and third
distribution channel, the manufacturer sells the equipment to a wholesaler, who in turn may sell
it directly to the customer or through a mechanical contractor. The wholesaler in this case can be
a refrigeration wholesaler focusing on refrigeration equipment, or a grocery warehouser (supply
chain distributor) who sells food and store equipment to the retailer.
Manufacturer
Productio
Manufacturer Selling
Price
Purchase Price
List Price
Manufacturer Markup
x x 1.672 (SC)
x List
Price
Dealer Markup

198
Source: DOE 2009a
Figure A-0-2: Distribution Channels for Refrigerated Display Cases
Table A-1 gives the distribution channel shares (in percentage of total sales) through each of the
three distribution channels for remote-condensing and self-contained equipment. The distribution
channel shares are based on estimates provided by a major manufacturer to DOE during the DOE
energy conservation standards rulemaking for commercial refrigeration equipment.
Table A-0-1: Distribution Channel Shares for New and Replacement Construction
National Account Distributor Contractor
Remote Condensing
Equipment 70% 15% 15%
Self-Contained Equipment 30% 35% 35%
Source: DOE 2009a
The list price is typically greater than the purchase price. We assumed a list price markup of 2
between the MSP and the list price in cases where we used list prices to estimate purchase prices
in chapter 3.
Inflation
All cost data in this report is updated to 2008 dollars, either by direct reference to a 2008 source
or by adaptation of an older source using an assumed inflation rate. To bring older cost data up to
2008 dollars, we used the producer price index (PPI) for the industry segment titled “commercial
refrigerators and related equipment” (NAICS code 3334153). The PPI gives an indication of how
prices have changed over time for specific sectors of the economy. The raw data from the PPI is
shown in table A-2. The rightmost column is an adjusted version of the raw data to show
inflation relative to 1996, the year in which the previous Arthur D. Little report on CRE energy
savings potential (ADL 1996) was published. When necessary, we updated costs from that report
using a multiplier of 1.254 as indicated in the table.
National Account
Manufacturer
Customer Customer
Wholesaler or Wholesaler Distribution
Mechanical Contractor
(New Construction or Replacement)
Customer

199
Table A-0-2: Producer Price Index for CRE
Year Inflation relative to
1982
Inflation relative to
1996 (calculated)
1996 1.505 1.000
1997 1.514 1.006
1998 1.546 1.027
1999 1.584 1.052
2000 1.608 1.068
2001 1.636 1.087
2002 1.626 1.080
2003 1.633 1.085
2004 1.659 1.102
2005 1.713 1.138
2006 1.744 1.159
2007 1.822 1.211
2008 1.887 1.254
Source: PPI 2009

200
Appendix B Electricity Rate Data
The operating cost data used to calculate payback periods for each of the energy-saving
technologies is based on the electricity data presented in this appendix. For an explanation of
how the three scenarios were calculated refer to section 4.
State 1
Price 2008
($/kWh)
Population
2008
Cumulative
Population
% Total
Population
High Rate States
HI 0.2972 1,288,198 1,288,198 0.4%
NY 0.1645 19,490,297 20,778,495 6.8%
MA 0.1605 6,497,967 27,276,462 9.0%
CT 0.1593 3,501,252 30,777,714 10.1%
RI 0.1549 1,050,788 31,828,502 10.5%
NJ 0.1472 8,682,661 40,511,163 13.3%
NH 0.1428 1,315,809 41,826,972 13.8%
DC 0.1364 591,833 42,418,805 14.0%
AK 0.1333 686,293 43,105,098 14.2%
CA 0.1305 36,756,666 79,861,764 26.3%
Medium Rate
States
ME 0.1295 1,316,456 81,178,220 26.7%
MD 0.1282 5,633,597 86,811,817 28.6%
VT 0.1251 621,270 87,433,087 28.8%
DE 0.1204 873,092 88,306,179 29.0%
TX 0.1065 24,326,974 112,633,153 37.0%
FL 0.102 18,328,340 130,961,493 43.1%
NV 0.1015 2,600,167 133,561,660 43.9%
LA 0.101 4,410,796 137,972,456 45.4%
MS 0.0998 2,938,618 140,911,074 46.3%
AL 0.0985 4,661,900 145,572,974 47.9%
MI 0.0943 10,003,422 155,576,396 51.2%
PA 0.0942 12,448,279 168,024,675 55.3%
WI 0.0928 5,627,967 173,652,642 57.1%
OH 0.0926 11,485,910 185,138,552 60.9%
GA 0.0919 9,685,744 194,824,296 64.1%
TN 0.0902 6,214,888 201,039,184 66.1%
AZ 0.0886 2,855,390 203,894,574 67.1%
NM 0.0856 1,984,356 205,878,930 67.7%
CO 0.0856 4,939,456 210,818,386 69.3%
MT 0.0854 967,440 211,785,826 69.7%
IL 0.0853 12,901,563 224,687,389 73.9%
SC 0.0853 4,479,800 229,167,189 75.4%
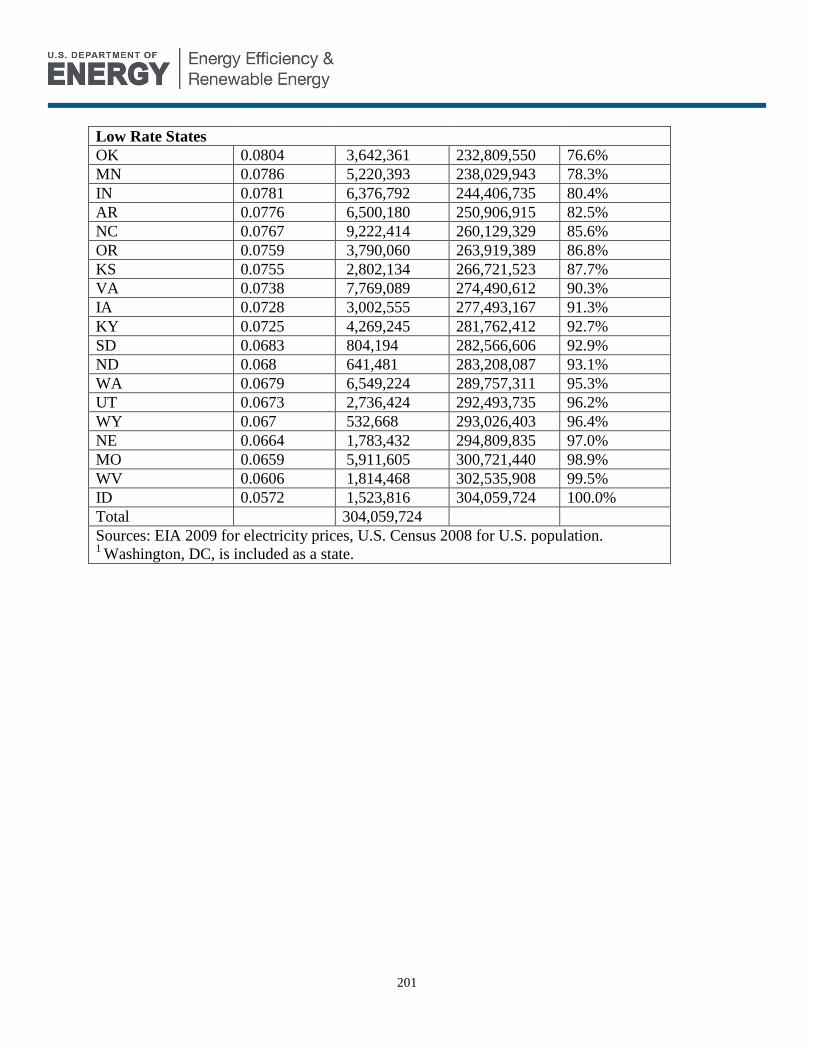
201
Low Rate States
OK 0.0804 3,642,361 232,809,550 76.6%
MN 0.0786 5,220,393 238,029,943 78.3%
IN 0.0781 6,376,792 244,406,735 80.4%
AR 0.0776 6,500,180 250,906,915 82.5%
NC 0.0767 9,222,414 260,129,329 85.6%
OR 0.0759 3,790,060 263,919,389 86.8%
KS 0.0755 2,802,134 266,721,523 87.7%
VA 0.0738 7,769,089 274,490,612 90.3%
IA 0.0728 3,002,555 277,493,167 91.3%
KY 0.0725 4,269,245 281,762,412 92.7%
SD 0.0683 804,194 282,566,606 92.9%
ND 0.068 641,481 283,208,087 93.1%
WA 0.0679 6,549,224 289,757,311 95.3%
UT 0.0673 2,736,424 292,493,735 96.2%
WY 0.067 532,668 293,026,403 96.4%
NE 0.0664 1,783,432 294,809,835 97.0%
MO 0.0659 5,911,605 300,721,440 98.9%
WV 0.0606 1,814,468 302,535,908 99.5%
ID 0.0572 1,523,816 304,059,724 100.0%
Total 304,059,724
Sources: EIA 2009 for electricity prices, U.S. Census 2008 for U.S. population. 1 Washington, DC, is included as a state.

BUILDING TECHNOLOGIES OFFICE
DOE/EE-0847 • September 2009 Printed with a renewable-source ink on paper containing at least 50% wastepaper, including 10% post-consumer waste.