energy scenarios for germany: simulations with the model panta rhei
TRANSCRIPT

ENERGY SCENARIOS FOR GERMANY:
SIMULATIONS WITH THE MODEL PANTA
RHEI
CHRISTIAN LUTZ1
Abstract The German government decided in 2009 to develop a new energy concept on the basis of model scenarios. The model PANTA RHEI has been applied to evaluate economic impacts of a long-term shift towards a low-carbon economy until 2050. According to this a deep cut of national greenhouse gas emissions of more than 80% against 1990 levels until 2050 is economically feasible. Lower energy imports and higher energy efficiency are major drivers for even positive effects on GDP and employment in the long term. Depending on assumptions for additional security costs longer lifetimes of nuclear power plants will have some positive economic impacts in the medium term. The German government adopted a long term energy concept in late 2010 with a focus on renewable energy. However, it withdrew the decision of longer lifetimes of nuclear power plants in the light of the disaster in Japan in summer 2011. JEL classification: C54, C67, Q43 Keywords: Macroeconomic modelling, energy policy, economic impacts, Germany
1 Gesellschaft für Wirtschaftliche Strukturforschung mbH, Osnabrück, Germany. Corresponding author. Tel: +4954140933120, Fax: +4954140933110, E-mail: [email protected]

2
1. INTRODUCTION
Energy policy has been in the focus of the political agenda in Germany since the first oil price crisis in the 1970s. The fierce debate about nuclear power plants in the second half of that decade was a main reason for the foundation of the green party, which entered German parliament in 1983 for the first time. The nuclear disaster in Chernobyl in the former Soviet Union in 1986 brought the expansion of nuclear power to an end. In the 1990s Germany started to foster renewable energy sources. With the debate about global warming, and the Kyoto protocol, negotiated by Angela Merkel, minister of the environment at that time, the government decided to cut greenhouse gas emissions substantially against 1990 levels. When the green party joined the government in 1998, nuclear phase out until 2022 has been negotiated with the utility companies owning the nuclear power plants in 2002. Beginning in 2000 the introduction of the feed-in-tariff started to increase the share of renewable energy sources from around 5% to about 20% in electricity production in 2011. The European Union (EU) energy and climate package from 2008, to cut emissions by 20% until 1990 and increase the share of renewable energy to 20% in 2020, brought back the discussion about nuclear as a low carbon technology. At the eve of the Copenhagen climate summit in December 2009 (COP15) the German government decided to fundamentally change the energy system towards renewable and low carbon energy sources. The role of nuclear power as a bridging technology was to be evaluated in policy scenarios.
As policy evaluation is complex, three different models have been applied for the analysis. An EU electricity market optimisation model has been used for the electricity sector (Nagl et al. 2011). The European perspective is necessary due to the European Union Emissions Trading System (EU-ETS) and the planned further integration of EU electricity markets. A significant change in German CO2 emissions will for example have impacts on EU-ETS carbon prices and therefore influence all EU economies. For final energy consumption a set of bottom-up technology models have been applied. PANTA RHEI (an econometric model for calculation of the GDP and employment effects of a given policy,) has been soft linked to these models. Results from the models as differences in electricity prices and volumes, investments in new installations and net electricity exports as well as
3
savings in final energy demand and related investment differences have been used as inputs in PANTA RHEI. These primary impulses induce so-called second round impacts on economic variables. Main results are presented for Gross Domestic Product (GDP) and employment.
This paper starts with a description of the model PANTA RHEI which has been used for the macroeconomic evaluation as part of the scenario work in section 2. Section 3 presents the scenarios. The main economic impacts are described in section 4. Some conclusions and a brief discussion of the consequences of the nuclear disaster in Japan in March 2011 for German energy policy conclude the paper in section 5.
2. MODEL PANTA RHEI
PANTA RHEI is an environmentally extended version (Lehr et al. 2008, Meyer et al. 2007a, 2012, Lutz et al. 2007, 2005) of the macro-econometric simulation and forecasting model INFORGE of the German economy. It is based on official statistics. INFORGE consistently describes the annual inter-industry flows between the 59 sectors, their contributions to personal consumption, government, equipment investment, construction, inventory investment, exports as well as prices, wages, output, imports, employment, labour compensation, profits, taxes, etc. for each sector, as well as for the macro economy (Meyer et al. 2007b, Ahlert et al. 2009, Maier et al. 2012).
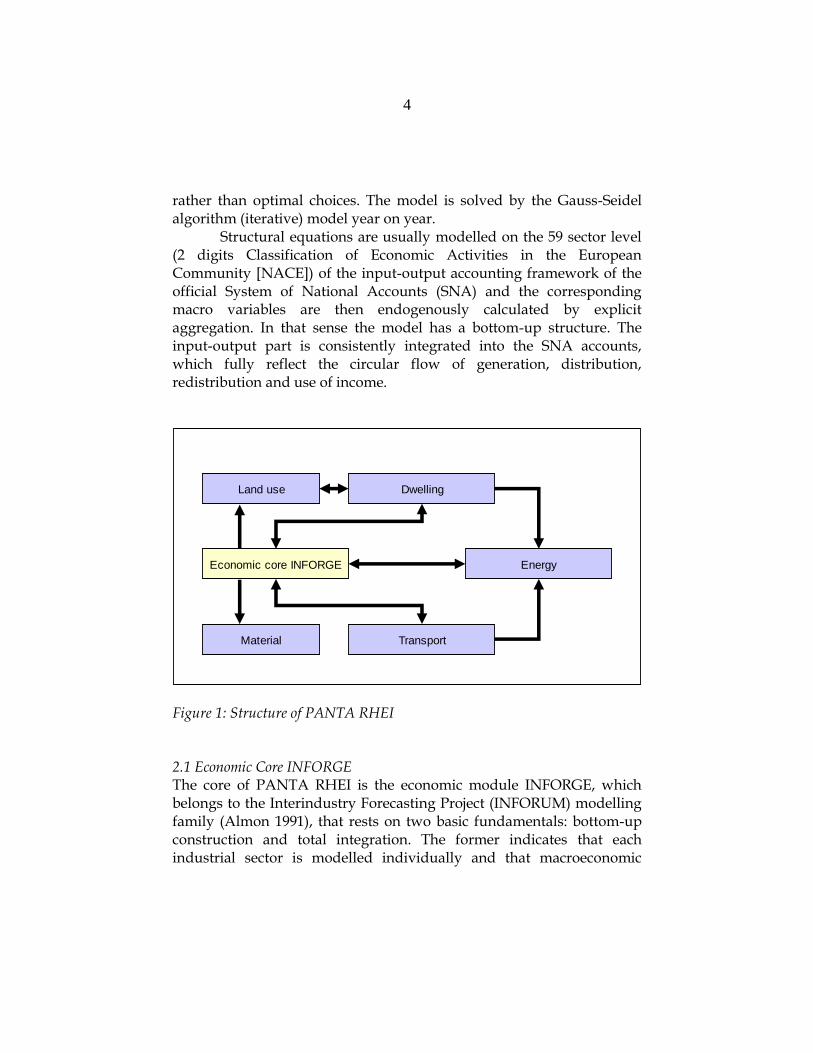
An overview of the model structure can be seen in Figure 1. Besides the comprehensive economic modelling energy and related air emissions, transport, dwelling, material and land use are depicted in detail. All parts are consistently linked via volumes and prices. The transport module for example delivers the gasoline (petrol and diesel) consumption in liter, which - multiplied with the gasoline price - is part of the intermediate demand of industries and the final demand of households in monetary terms. Changes in tax rates or international oil prices will induce various economic impacts on tax revenues, gasoline consumption and related economic behaviour.
The behavioural equations reflect bounded rationality rather than optimising behaviour of agents. All parameters are estimated econometrically from time series data (1991 – 2008). Producer prices are the result of mark-up calculations of firms. Output decisions follow observable historic developments, including observed inefficiencies
4
rather than optimal choices. The model is solved by the Gauss-Seidel algorithm (iterative) model year on year.
Structural equations are usually modelled on the 59 sector level (2 digits Classification of Economic Activities in the European Community [NACE]) of the input-output accounting framework of the official System of National Accounts (SNA) and the corresponding macro variables are then endogenously calculated by explicit aggregation. In that sense the model has a bottom-up structure. The input-output part is consistently integrated into the SNA accounts, which fully reflect the circular flow of generation, distribution, redistribution and use of income.
Dwelling
Energy
Transport
Economic core INFORGE
Material
Land use
Figure 1: Structure of PANTA RHEI 2.1 Economic Core INFORGE The core of PANTA RHEI is the economic module INFORGE, which belongs to the Interindustry Forecasting Project (INFORUM) modelling family (Almon 1991), that rests on two basic fundamentals: bottom-up construction and total integration. The former indicates that each industrial sector is modelled individually and that macroeconomic
5
variables are calculated through explicit aggregation. This approach ensures that each individual sector is embedded within the economic context and that intersectoral dependencies are explicitly incorporated and used to explain economic interaction. The latter describes a complex and simultaneous solution which takes into consideration inter-industrial dependence as well as the distribution of income, the redistribution effects of the state and the usage of income for goods. Thus, the input-output tables are fully implemented in the system of national accounts (Ahlert et al. 2009). Both datasets are specified for improving the identification of gross fixed capital formation, private consumption, public consumption and foreign trade. Labour market specifics are consistently embedded in the macroeconomic context through output and unit costs. Macroeconomic indicators are determined by aggregation of 59 industries. For a detailed description of the economic part see Maier et al. (2012).
An integral element of input-output modelling is the determination of intermediate demand between industries. Input coefficients represent the relation of intermediate demand to total production. In INFORGE technological change is identified by applying variable input coefficients. They are endogenously determined with relative prices and time trend. The Leontief-inverse (I-A)-1 – with A as input coefficient matrix and I as identity matrix – multiplied with final demand fd gives gross production y by 59 industries. In the following equations the notations are as follows: lower case letters are vectors, upper case letters are either time series or matrices. The dimension of vectors and matrices are indicated with subscripts. The subscript t indicates time dependency.
ttt fdAIy 1
[1]
In many macroeconomic models, private consumption is based on the almost ideal demand system (AIDS) approach (e.g. Kratena & Wüger 2006), which allows the estimation of consumption structures according to utility maximisation behaviour and consequently does build upon the assumption of a representative individual (Deaton & Muelbauer 1980). Different to this approach, INFORGE estimates consumption patterns by 41 purposes of use c as a function of real disposable income Y/P and
6
relative prices p/P. For some consumption purposes, trends t as proxy for long-term change in consumption behaviour or the number of private households HH is used as explanatory variable.
t
t
tl
t
ttitl HHt
P
p
P
Ycc ,,,
,
,, [2] 41,...,1l
INFORGE differentiates between ten classifications of the
functions of governments for modelling public expenditures g. 80% of them are related to four government functions: (i) public administration, (ii) education, (iii) health and (iv) social welfare. Driving forces for state consumption are disposable income of the government YG, employment E as well as demographic change B.
ttttktk BEYGgg ,,,, [3] 10,...,1k
Gross fixed capital formation is separately modelled for
equipment and construction investment. Equipment investments by 59 industries are determined by estimating capital stock k which again is a function of production y of the previous year, costs of production factor labour l, autonomic technological change t and real interest rates IR.
ttitititi IRtlykk ,,, ,1,,,
[4] 59,...,1i
Export demand in PANTA RHEI can be linked to the Global Inter-industry Forecasting System (GINFORS) (Lutz et al. 2010). But in this application, exports are kept constant in current prices, as similar energy and climate policy developments are assumed for the main competitors.
Prices are estimated econometrically. Basic prices p, which is decisive for entrepreneurs, are the result of unit costs uc and mark-up pricing. The extent to which mark-up pricing can be realised depends on the market form prevailing in specific industrial sectors. In industries with monopolistic structures, mark-up pricing is easier to realise than in competitive industrial structures. Industries will also consider import prices pim, if they are exposed to foreign competitors as well.

7
titititi pimucpp ,,,, ,
[5] 59,...,1i The labour demand functions depend on the number of hours
employees work (volume of work). This approach builds on two important observations: first, a volume-based approach to labour demand considers the growing importance of part-time employees; second, labour policy instruments such as short-time work, for example, can be explicitly addressed. Working hours h are determined by sector-specific production y. In some industries real wages ae/p are also influential.
ti
ti
ti
titi yp
aehh ,
,
,
,, , [6] 59,...,1i
Average earnings are determined by using a Phillips curve approach (a graphic description of the inverse relationship between wages and unemployment levels). Accordingly, average earnings by industry ae depend on the one hand on tariff wages AE (e.g. in machinery) and on the other hand on sector-specific productivity y/h.
t
ti
ttitih
yAEaeae
,
,, ,
[7] 59,...,1i
The number of employees e is derived by definition, dividing the number of working hours h by working time per year and head hy. The latter is preset exogenously.
1000,
,
, ti
ti
tihy
he
[8] 59,...,1i
2.2 Energy module The energy module describes the interrelations between economic developments, energy consumption and related emissions. The relations are interdependent. Economic activity such as gross production of industries or final consumer demand influence respective energy

8
demand. Vice versa, the expenditure for energy consumption has a direct influence on economic variables.
The energy module contains the full energy balance with primary energy input, transformation and final energy consumption for 20 energy consumption sectors, 27 fossil energy carriers and the satellite balance for renewable energy (AGEB 2011). All together, the energy balances divide energy consumption into 30 energy carriers. Prices, also in Euro per energy unit, are modelled for different energy users such as industry, services and private households for all energy carriers. CO2 emissions are related to energy consumption via emission factors of the Federal Environmental Agency (UBA 2011). The energy module is fully integrated into the economic part of the model.
Final energy consumption of industries fe is explained by sector output y, the relation of the aggregate energy price pe – an average of the different carrier prices weighted with their shares in the energy consumption of that sector – and the sector price p and time trends, which mirror exogenous technological progress.
t
p
peyfefe
ti
ti
tititi ,,,
,
,,,
[9] 59,...,1i
For services, the number of employees turned out to be a better proxy for economic activity than gross output. Average temperatures also play a role for the energy consumption of the service sector. For private households, consumption by purpose as heating or fuels is already calculated in the economic model INFORGE in monetary terms. Additional information can be taken from stock models for transport and heating from the specific modules, as only new investments in cars or houses, or expensive insulation measures will gradually change average technical parameters over time.
Final demand fed of energy carrier k for industries can be calculated by definition, multiplying the share of the carrier sfe with overall final energy demand of the sector. For the shares, the influence of relative prices, the price of energy carrier k in relation to the weighted price of all energy inputs of the sector, and of time trends are econometrically tested.

9
t
p
pesfesfe
tk
tk
tktk ,,
,
,,
[10] 59,...,1i
tktktk fesfefed ,,,
[11] 30,...,1k
Energy carrier prices pe depend on exogenous world market
prices pw for coal, oil and gas and specific other price components such as tax rates tr and margins mr. For electricity different cost components such as the apportionment of the feed-in-tariff for electricity are explicitly modelled.
tktkttktk mrtrpwpepe ,,,,, ,,
[12] 30,...,1k
For services, households and transport specific prices are calculated, as for example tax rates partly differ between end users.
For energy-related carbon emissions ce, fix carbon emission factors cef from the German reporting (UBA 2011) to the United Nations Framework Convention on Climate Change (UNFCCC) are applied. Multiplication with final energy demand fe gives sector and energy carrier specific emissions.
tkitkitki fecefce ,,,,,,
[13] 30,...,1;59,...,1 ki
All detailed information in the energy balance for 30 energy
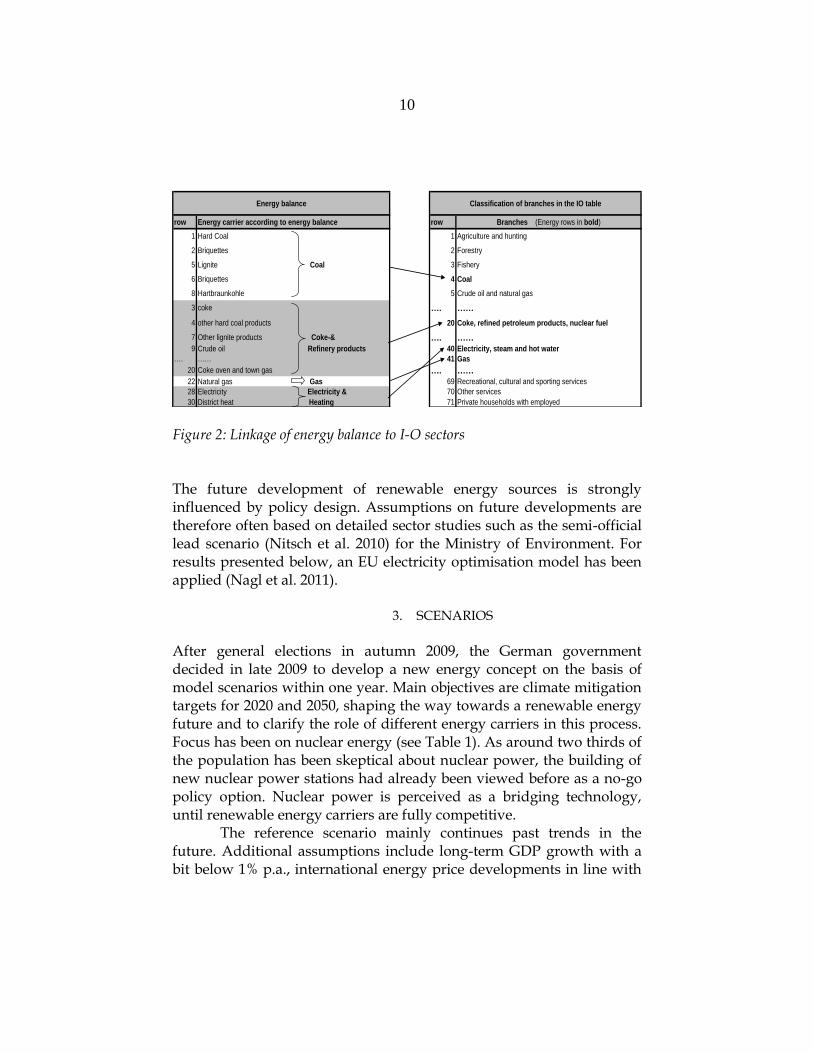
carriers is consistently aggregated and linked to the corresponding four industries of the I-O table (Figure 2). For renewable energy sources additional cost structure detail is used (see Lehr et al. 2008, 2012). This ensures that changes of international energy prices or tax rate changes and associated changes in energy volumes are fully accounted for in the economic part of the model.
10
Energy balance Classification of branches in the IO table
row Energy carrier according to energy balance row Branches (Energy rows in bold)
1 Hard Coal 1 Agriculture and hunting
2 Briquettes 2 Forestry
5 Lignite Coal 3 Fishery
6 Briquettes 4 Coal
8 Hartbraunkohle 5 Crude oil and natural gas
3 coke …. ……
4 other hard coal products 20 Coke, refined petroleum products, nuclear fuel
7 Other lignite products Coke-& …. ……9 Crude oil Refinery products 40 Electricity, steam and hot water
…. …… 41 Gas
20 Coke oven and town gas …. ……22 Natural gas Gas 69 Recreational, cultural and sporting services
28 Electricity Electricity & 70 Other services
30 District heat Heating 71 Private households with employed Figure 2: Linkage of energy balance to I-O sectors The future development of renewable energy sources is strongly influenced by policy design. Assumptions on future developments are therefore often based on detailed sector studies such as the semi-official lead scenario (Nitsch et al. 2010) for the Ministry of Environment. For results presented below, an EU electricity optimisation model has been applied (Nagl et al. 2011).
3. SCENARIOS
After general elections in autumn 2009, the German government decided in late 2009 to develop a new energy concept on the basis of model scenarios within one year. Main objectives are climate mitigation targets for 2020 and 2050, shaping the way towards a renewable energy future and to clarify the role of different energy carriers in this process. Focus has been on nuclear energy (see Table 1). As around two thirds of the population has been skeptical about nuclear power, the building of new nuclear power stations had already been viewed before as a no-go policy option. Nuclear power is perceived as a bridging technology, until renewable energy carriers are fully competitive.
The reference scenario mainly continues past trends in the future. Additional assumptions include long-term GDP growth with a bit below 1% p.a., international energy price developments in line with

11
IEA (2009) assumptions, an international climate agreement that will come in force no later than 2020, CO2 prices in the EU-ETS to reach the 30% EU reduction target and a carbon tax for the non-ETS sectors of the economy, which will reach the EU-ETS price in 2020. For the necessary investment in security measures to prolong the lifetime of nuclear power plants, two different sets of assumptions have been used, the A scenarios describing lower security standards and costs, whereas the B scenarios imply much higher security standards.
Table 1: Central milestones of the scenarios
I II III IV Reference
Green House Gases emission reduction against 1990 until (year)
- 40 % ( 2020) - 85 % ( 2050)
- 40 % ( 2020) - 85 % ( 2050)
- 40 % ( 2020) - 85 % ( 2050)
- 40 % ( 2020) - 85 % ( 2050)
Proposal of consultants
Additional lifetime of nuclear power plants in years
4
12
20
28
0
Increase of energy efficiency p.a. in %
Endo-genous
2.3 – 2.5
2.3 – 2.5
Endo-genous
Business as usual
(1.7 – 1.9)
Renewable energy
share of gross final energy demand in 2020
Share of primary energy supply in 2050
≥ 18 %
≥ 50 %
≥ 18 %
≥ 50 %
≥ 18 %
≥ 50 %
≥ 18 %
≥ 50 %
≥ 16 %
Proposal of consultants
Source: Prognos, EWI, GWS 2010

12
4. RESULTS
The nine scenarios have been implemented in bottom-up models for the electricity sector in an EU electricity market optimisation model (Nagl et al. 2011) and for final energy demand in sector specific models (Prognos, EWI, GWS 2010). They calculated energy volumes and prices and related cost respectively, and investment differences between the scenarios and the reference on a microeconomic basis (Lindenberger et al. 2010). For final energy demand, additional investment needs reach around 15 billion Euro p.a., about half of it used for housing insulation. Electricity prices are up to 1 Cent/kWh lower due to longer lifetime of nuclear power plants. At the same time net electricity imports decrease in the scenarios in comparison to the reference (see Nagl et al. 2011 for a detailed description of effects on the electricity markets). These primary impulses are introduced into PANTA RHEI, in which they induce different second-round effects and reactions.
In the reference annual GDP growth will be slightly below 1% p.a. until 2050. This might be perceived to be low. But due to an expected decrease of the population GDP per capita is supposed to grow with rates of the last two decades. Scenario results show positive impacts of the German energy program with only two exceptions in 2030, for scenarios with 4 years extension of nuclear power plants lifetime. In 2050, GDP will be between 0.46 % and 0.72 % higher in the scenarios than in the reference. The main reason for this positive effect is the reduced use of energy and therefore need of energy imports without additional costs of electricity production and energy demand in the long term. This result has to be related to the scenario assumptions. After all, the analysis assumes the implementation of a cost-optimised energy concept in a favourable international climate policy regime without competitiveness problems for German companies and the danger of carbon leakage. Barriers for economically feasible energy savings (International Energy Agency [IEA] 2010) as the landlord-tenant problem will be reduced by the government. The development of the European electricity grid will be much faster than in the past.
Comparison of the scenarios shows differences which are mainly caused by different lifetimes of nuclear power plants. In the A scenarios with lower security standards for nuclear power, especially scenarios III and IV with additional 20 to 28 years for nuclear power plants, higher

13
GDP is achieved than in scenario I with only 4 years lifetime expansion. The main reason is lower electricity prices, particularly for electricity intensive users such as metal industries. In the B scenarios with higher retrofit costs, the picture does not give a clear order of the scenarios.
For the components of GDP, the scenarios deliver a quite heterogeneous picture, as can be seen in the comparison of scenario A I with the reference in Table 2. Investment in equipment and construction are higher than in the reference, whereas private consumption is lower throughout the simulation period. This is partly due to the statistical classification of expenditures for building insulation as investment of a specific industry, even if private households simply perceive it as another form of consumption. The increase in construction and the decrease in private consumption are partly due to this rededication of private spending. Foreign trade changes are small, as terms of trade do not change significantly. German exports could even increase in relation to the reference, if other countries will follow similar concepts and rely on German goods. Import costs are reduced due to lower energy imports.
-0,3
-0,2
-0,1
0,0
0,1
0,2
0,3
0,4
0,5
0,6
0,7
0,8
Sc. I
A
Sc. I
I A
Sc. I
II A
Sc. I
V A
Sc. I
B
Sc. I
I B
Sc. I
II B
Sc. I
V B
Sc. I
A
Sc. I
I A
Sc. I
II A
Sc. I
V A
Sc. I
B
Sc. I
I B
Sc. I
II B
Sc. I
V B
Sc. I
A
Sc. I
I A
Sc. I
II A
Sc. I
V A
Sc. I
B
Sc. I
I B
Sc. I
II B
Sc. I
V B
Sc. I
A
Sc. I
I A
Sc. I
II A
Sc. I
V A
Sc. I
B
Sc. I
I B
Sc. I
II B
Sc. I
V B
2020 2030 2040 2050
%
Figure 3: GDP in constant prices – percentage deviations from the reference

14
Impacts on GDP components are linked to changes in price relations. The reduction of expensive energy imports reduces domestic price increases, which are induced by higher investment for energy savings. Consumer and producer prices are therefore higher in scenario I A in 2020 and 2030 compared to the reference. After 2030, lower fossil energy imports dampen the price increase. Table 2: Macroeconomic impacts of scenario I A: absolute and percentage deviations against the reference from 2020 to 2050 Scenario I A in comparison to reference
2020 2030 2040 2050 2020 2030 2040 2050
Components of GDP in constant prices
GDP 1.4 -2.5 10.4 19.5 0.1 -0.1 0.4 0.6
Private consumption -7.3 -13.4 -8.3 -3.8 -0.6 -1.0 -0.6 -0.3
Public consumption -0.4 -0.7 -0.4 -0.4 -0.1 -0.1 -0.1 -0.1
Equipment investment 3.3 -0.4 4.9 3.8 1.3 -0.1 1.5 0.9
Construction 9.2 9.7 9.8 9.0 4.7 5.7 5.9 5.4
Exports -0.2 -1.2 1.0 3.0 0.0 -0.1 0.0 0.1
Imports 3.1 -3.6 -2.9 -7.2 0.3 -0.3 -0.2 -0.3
Price indices
Private consumption 0.2 0.6 -0.1 -0.8 0.2 0.4 -0.1 -0.5
Output 0.2 0.5 0.0 -0.2 0.1 0.4 0.0 -0.1
Imports -0.2 -0.7 -1.7 -2.4 -0.2 -0.6 -1.4 -2.0
absolute values deviations in %
deviations in bill. Euro
dev. in percentage points
The investment ratio, i.e. the relation of investments to GDP, will not reach more than 19 %, (the 2008 value). In all scenarios the ratio is only slightly above the reference. Crowding out and problems of financing the additional investment are not to be expected.

15
17,0
17,5
18,0
18,5
19,0
19,5R
ef
Re
f
Sc. I
A
Sc. I
I A
Sc. I
II A
Sc. I
V A
Sc. I
B
Sc. I
I B
Sc. I
II B
Sc. I
V B
Re
f
Sc. I
A
Sc. I
I A
Sc. I
II A
Sc. I
V A
Sc. I
B
Sc. I
I B
Sc. I
II B
Sc. I
V B
Re
f
Sc. I
A
Sc. I
I A
Sc. I
II A
Sc. I
V A
Sc. I
B
Sc. I
I B
Sc. I
II B
Sc. I
V B
Re
f
Sc. I
A
Sc. I
I A
Sc. I
II A
Sc. I
V A
Sc. I
B
Sc. I
I B
Sc. I
II B
Sc. I
V B
2010 2020 2030 2040 2050
%
Figure 4: Investment ratio in the scenarios in per cent On the labour market, effects are low in most scenarios until 2030. Scenarios A I and B I, however, show substantial job losses of 63 000 to 76 000 people for 2030. In 2040 all scenarios give slightly positive employment impacts. In 2050, the number of additional jobs is around 100 000.

16
-100
-50
0
50
100
150
Sc. I
A
Sc. I
I A
Sc. I
II A
Sc. I
V A
Sc. I
B
Sc. I
I B
Sc. I
II B
Sc. I
V B
Sc. I
A
Sc. I
I A
Sc. I
II A
Sc. I
V A
Sc. I
B
Sc. I
I B
Sc. I
II B
Sc. I
V B
Sc. I
A
Sc. I
I A
Sc. I
II A
Sc. I
V A
Sc. I
B
Sc. I
I B
Sc. I
II B
Sc. I
V B
Sc. I
A
Sc. I
I A
Sc. I
II A
Sc. I
V A
Sc. I
B
Sc. I
I B
Sc. I
II B
Sc. I
V B
2020 2030 2040 2050
1000
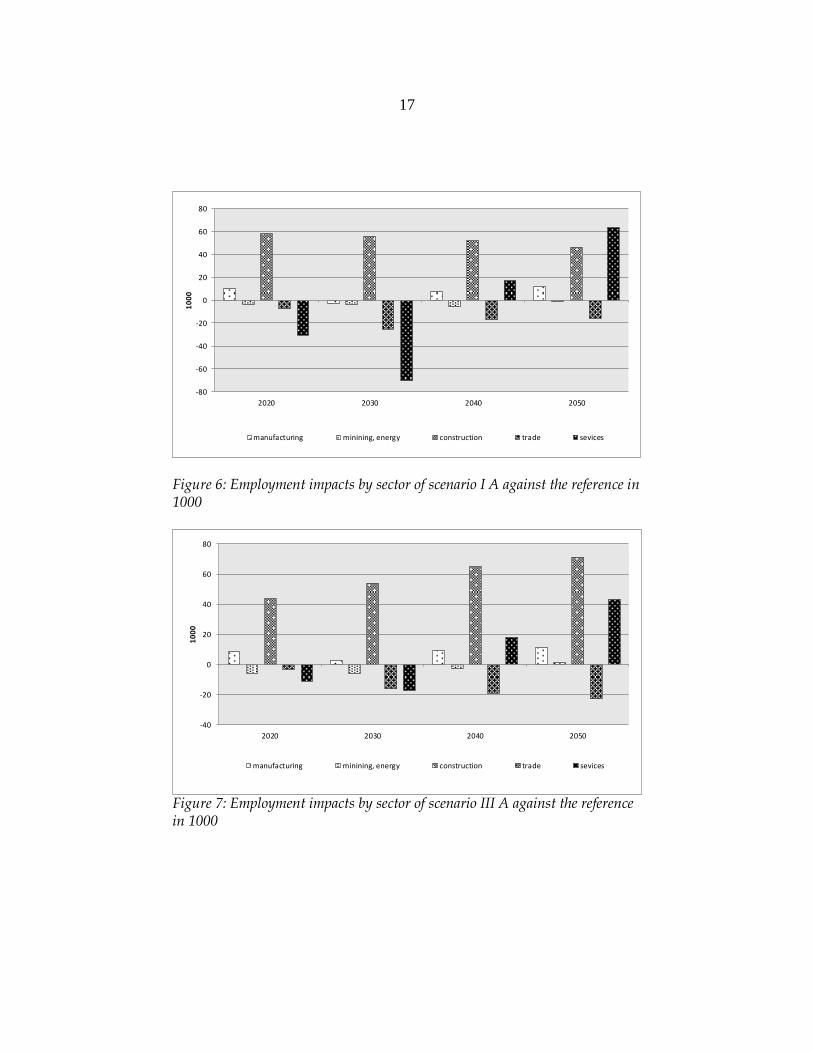
Figure 5: Employment impacts of the scenarios against the reference in 1000 The largest job impacts for scenario I A are reported for construction due to higher investment in housing insulation throughout the simulation period. Changes in manufacturing and trade are low. For mining and energy changes between providers of renewable energy and of fossil fuel and nuclear will be much higher than the low numbers suggest. Intra-industry changes are expected to be substantial. Larger employment impacts for services in absolute numbers have to be related to their overall importance. The total impacts are more positive for scenario III A.
17
-80
-60
-40
-20
0
20
40
60
80
2020 2030 2040 2050
1000
manufacturing minining, energy construction trade sevices
Figure 6: Employment impacts by sector of scenario I A against the reference in 1000
-40
-20
0
20
40
60
80
2020 2030 2040 2050
1000
manufacturing minining, energy construction trade sevices
Figure 7: Employment impacts by sector of scenario III A against the reference in 1000
18
Labour market effects in the scenarios compared to the reference are a bit lower than GDP effects. This is caused by a structural shift of employment towards sectors with higher labour productivity and higher compensation per employee.
5. CONCLUSIONS
The macroeconomic results have to be related to the scenario assumptions and the bottom-up models that delivered the primary impulses. Three main conclusions can be drawn:
International developments can influence the national results substantially, but are difficult to foresee and largely independent of German policy action. If a global climate agreement will be reached and maintained until 2020, it will offer German industries additional possibilities to increase exports and to further improve the economic impacts without endangering energy intensive production on global markets. This also holds for the development of low carbon emission technologies. Even without an international agreement, strong market development in countries like China or India can bring down costs of these new technologies to or below costs of fossil fuel-based technologies within the next decade.
GDP is a measure for economic activity in a certain time span. Recent activities like the Stiglitz commission report (Stiglitz, Sen, Fitoussi 2009) for the French president and green growth Organisation for Economic Co-operation and Development (OECD [2011]) or green economy United Nations Environment Programme (UNEP [2011]) initiatives go beyond GDP to measure welfare and human well being. However, GDP and employment are still regarded to be the best available indicators for policy evaluation and currently without alternative. But interpretation should take external costs and benefits into account that are not (yet) monetarised. The long term problem (and costs) of nuclear waste and the benefit of avoided damages of global warming due to reduced green house gases (GHG) emissions, are not part of GDP. The long term welfare gains in the scenarios will be even higher, if these externalities are taken into account.
A considerable cut in national GHG emissions of more than 80% against 1990 levels until 2050, which is in line with reaching the global warming target of 2° Celsius, is economically viable. Depending on

19
assumptions for additional security costs, longer lifetimes of nuclear power plants will have positive economic impacts in the medium term.
The German government decided in autumn 2010 on its new energy concept (BMU, BMWi 2010). Key components have been 8 to 14 years lifetime expansion for nuclear power plants and the need for further measures to foster renewable energy and energy efficiency. On the demand side, insulation of buildings is the most important of a number of measures. For the electricity sector, the continued expansion of partly fluctuating renewable energy sources, such as wind and photovoltaic generation, calls for new market design. Feed-in-tariffs for renewable energy sources will remain at least until 2020, but have to be adjusted to enforce the market entry of renewables.
The central targets of the new energy concept are to reduce greenhouse gas emissions by 40% by 2020, 55% by 2030, 70% by 2040 and 80-95% by 2050 (compared with 1990 levels). By 2020, the share of renewables in final energy consumption is to reach 18%, and then gradually increase further to 30% by 2030 and 60% by 2050. The share in electricity production is to reach 80% by 2050. Concerning energy efficiency, the new energy concept aims to reduce primary energy consumption by 20% by 2020 and 50% by 2050 compared to 2008. The building renovation rate is to be doubled from currently 1% to 2%. It is planned to cut energy consumption in the transport sector by around 10% by 2020 and around 40% by 2050 (BMU 2010).
In the light of the nuclear disaster in Japan in March 2011, the German government defined higher security standards for nuclear power plants. As eight older reactors could not be retrofitted to meet these higher standards, they have been shut down in the spring of 2011. The remaining nine reactors will be closed step by step until 2022. The time schedule is quite close to the plans before 2010, which means in reverse of the presented results in section 4, that economic impacts of the new German energy concept will be less favourable in the medium term than reported above. Additional measures for renewable generation and energy efficiency will have to fill the gap.
But the changes made in 2011 are marginal in the long-term and overall economic perspective of the new German energy concept. The major decisions have been made in 2010. Germany is heading for the
20
age of renewable energy and model results indicate that this decision will pay off.
REFERENCES
AHLERT, G., DISTELKAMP, M., LUTZ, C., MEYER, B., MÖNNIG, A., WOLTER, M.I. (2009): Das IAB/INFORGE-Modell, in: Schnur, P., Zika, G. (Eds.), Das IAB/INFORGE-Modell. Ein sektorales makroökonometrisches Projektions- und Simulationsmodell zur Vorausschätzung des längerfristigen Arbeitskräftebedarfs. IAB-Bibliothek 318, Nürnberg, 15-175. ALMON, C. (1991): The INFORUM Approach to Interindustry Modelling. In: Economic Systems Research 3, 1-7. AGEB (2011): Energy balances for Germany, Arbeitsgemeinschaft Energiebilanzen e.V., Berlin. BMU, BMWi (2010): Federal Ministry for the Environment, Nature Conservation and Nuclear Safety (BMU), Federal Ministry of Economics and Technology (BMWi). Energy Concept, Berlin. BMU (2010): Energy concept 2050. Milestones and assessments. http://www.bmu.de/english/energy_efficiency/doc/46721.php Deaton, A., Muelbauer, J. (1980): An almost ideal demand system. American Economic Review. 70 (3), 312-326. IEA (2009): International Energy Agency. World Energy Outlook 2009, Paris. IEA (2010): International Energy Agency. Energy Efficiency Governance, Paris. KRATENA, K., WÜGER, M. (2006): PROMETEUS: Ein multisektorales makroökonomisches Modell der österreichischen Wirtschaft, WIFO-Monatsbericht 3/2006, 187-205. KREWITT, W., TESKE, S., PREGGER, T., NAEGLER, T., SIMON, S., GRAUS, W., BLOMEN, E. et al. (2008): “Energy (R)evolution – a Sustainable World Energy Outlook.” Study commissioned by Greenpeace Int. and the European Renewable Energy Council (EREC), Stuttgart, Utrecht, 2nd edition 2008. LEHR, U., LUTZ, C., EDLER, D. (2012): Green jobs? Economic impacts of renewable energy in Germany. Energy Policy 40, forthcoming.

21
LEHR, U., NITSCH, J., KRATZAT, M., LUTZ, C., EDLER, D. (2008): Renewable Energy and Employment in Germany. Energy Policy 36, 108-117. LINDENBERGER, D., LUTZ, C., SCHLESINGER, M. (2010): Szenarien für ein Energiekonzept der Bundesregierung. Energiewirtschaftliche Tagesfragen, 60, 32-35. LUTZ, C., MEYER, B., WOLTER, M.I. (2010): The Global Multisector/Multicountry 3E-Model GINFORS. A Description of the Model and a Baseline Forecast for Global Energy Demand and CO2 Emissions. International Journal of Global Environmental Issues, 10(1-2), 25-45. LUTZ, C., MEYER, B., NATHANI, C., SCHLEICH, J. (2005): Endogenous technological change and emissions: The case of the German steel industry. Energy Policy 33, 1143-1154. LUTZ, C., MEYER, B., NATHANI, C., SCHLEICH, J. (2007): Endogenous innovation, economy and environment: impacts of a technology based modelling approach for energy-intensive industries in Germany. Energy Studies Review 15(1), 2-18. MAIER, T., MÖNNIG, A., ZIKA, G. (2012): Labour Demand by Industrial Sector, Occupational Field and Qualification until 2025 – Model Calculations using the IAB/INFORGE Model. Economic Systems Research, forthcoming. MEYER, B., LUTZ, C., SCHNUR, P., ZIKA, G. (2007): Economic Policy Simulations with Global Interdependencies: A sensitivity analysis for Germany. Economic Systems Research 19, 37-55. MEYER, B., MEYER, M., DISTELKAMP, M. (2012): Modelling Green Growth and Resource Efficiency: New Results, Mineral Economics, forthcoming. NAGL, S., FÜRSCH, M., PAULUS, M., RICHTER, J., TRÜBY, J., LINDENBERGER, D. (2011): Energy Policy Scenarios to Reach Challenging Climate Protection Targets in the German Electricity Sector until 2050. Utilities Policy 19, 185-192. NITSCH, J., PREGGER, T., SCHOLZ, Y., NAEGLER, T., STERNER, M., VON OEHSEN, A., PAPE, C., SAINT-DRENAN, Y., WENZEL, B. (2010): Langfristszenarien und Strategien für den Ausbau der erneuerbaren Energien in Deutschland bei Berücksichtigung der Entwicklung in Europa und global. Federal Ministry for the Environment, Nature Conservation and Nuclear Safety, Stuttgart, Berlin.
22
OECD (2011): Towards Green Growth, Paris. http://dx.doi.org/10.1787/9789264111318-en PROGNOS, EWI, GWS (2010): Energieszenarien für ein Energiekonzept der Bundesregierung. Study commissioned by the Federal Ministry of Economics and Technology (BMWi), Basel, Köln, Osnabrück. STIGLITZ, J.E., SEN, A., FITOUSSI, J.-P. (2009): Report by the Commission on the Measurement of Economic Performance and Social Progress, Paris. UMWELTBUNDESAMT [UBA] (2011): National Inventory Report for the German Greenhouse Gas Inventory 1990 – 2009, Dessau. UNEP (2011): Towards a Green Economy. Pathways to Sustainable Development and Poverty Eradication. www.unep.org/greeneconomy